Embed Size (px)
Citation preview

Model projections of Century-
scale change in Extreme Sea-
Level for UKCP09 and UKCP18
SL SpaceWatch workshop 2016 03 22
Tom Howard, Matt Palmer,
Jon Tinker, Jason Lowe, ….
Contents
• Overview of UKCP18 Marine Projections
• 21st century change in storm surge:
– UKCP09
– UKCP18
Overview of UKCP18 Marine Projections
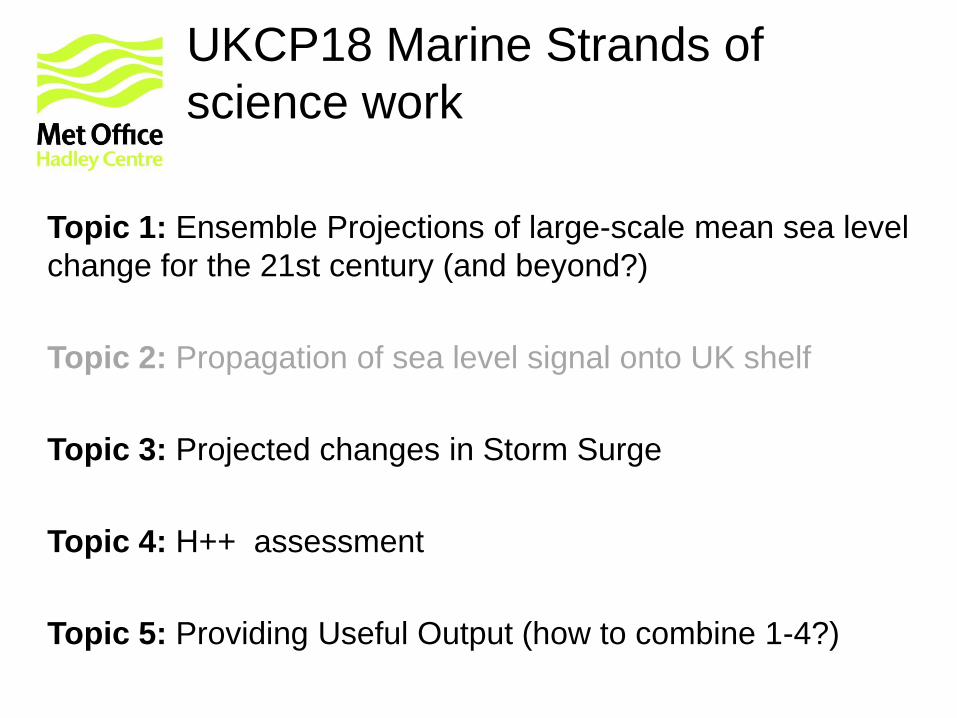
UKCP18 Marine Strands of
science work
Topic 1: Ensemble Projections of large-scale mean sea level
change for the 21st century (and beyond?)
Topic 2: Propagation of sea level signal onto UK shelf
Topic 3: Projected changes in Storm Surge
Topic 4: H++ assessment
Topic 5: Providing Useful Output (how to combine 1-4?)
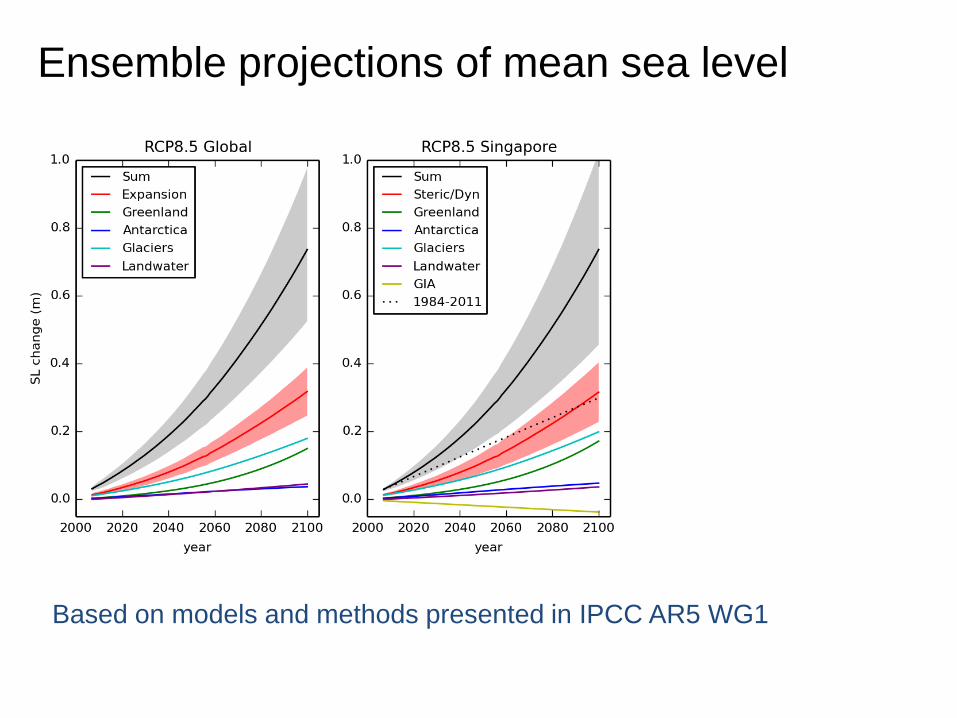
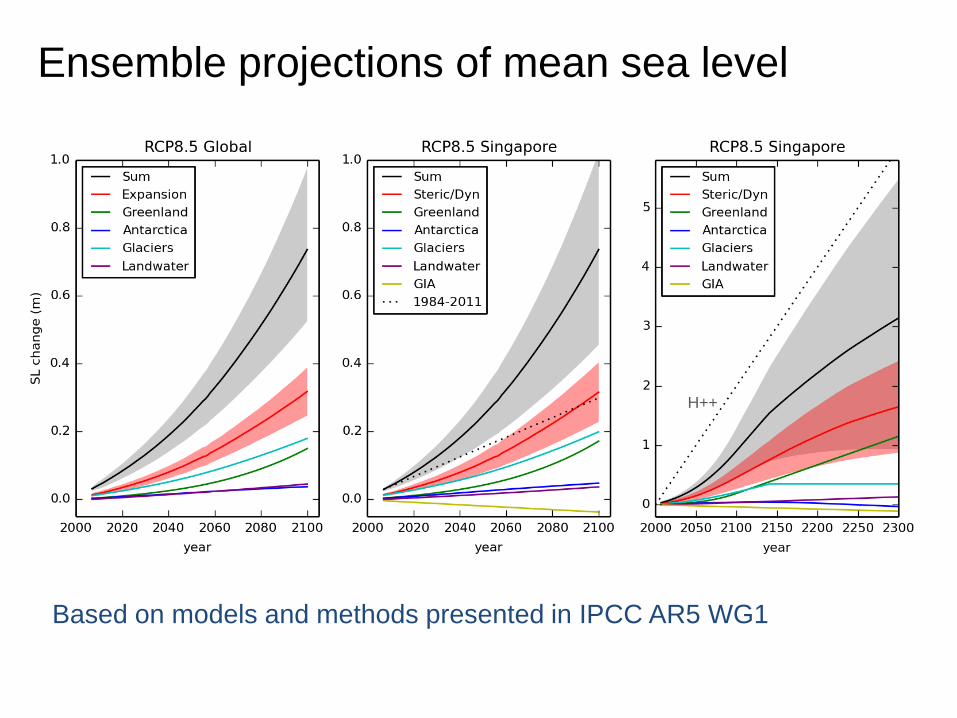
Ensemble projections of mean sea level
Based on models and methods presented in IPCC AR5 WG1
H++
Ensemble projections of mean sea level
Based on models and methods presented in IPCC AR5 WG1
H++
Ensemble projections of mean sea level:
what’s new?
• “Pattern scaling” approach to oceanographic sea level
• Multiple estimates of gravitation fingerprints → uncertainty
• Estimate of regional variability (tide gauges + models)
• Consideration of changes beyond 2100..
H++ UKCP09 Je ne regrette rien
• Rohling et al. (2008) High rates of SLR
during the last interglacial period
• Pfeffer et al. (2008) Kinematic constraints on
glacial contribution to 21st-century SLR
H++ UKCP09 Je ne regrette rien
• Rohling et al. (2008) High rates of SLR
during the last interglacial period
• Pfeffer et al. (2008) Kinematic constraints on
glacial contribution to 21st-century SLR
21st century sea level rise Evidence types Comment
Up to 1m Process based models, palaeo studies of
last interglacial, semi-empirical methods,
kinematic constraints, expert narratives,
amount of land ice available
Up to 1.5m A limited number of process based
models, palaeo studies of last interglacial,
semi-empirical methods, kinematic
constraints, expert narratives, amount of
land ice available
Katsman et al. (2008)
expert narratives in this
range.
Up to 2m Some process based models estimates
from perturbed parameter type
experiments, palaeo studies of the last
interglacial, a minority of the semi-
empirical methods, kinematic constraints,
expert narratives.
Pfeffer et al. (2008);
Bamber and Aspinal
(2013); and Jevrejeva et
al (2014) reach this
range.
Up to 2.5m Upper estimate of last interglacial palaeo
estimates, a small minority of very extreme
semi-empirical methods.
Above 3m Simple calculation of amount of land ice.
Evidence from palaeo but for periods that
are a poor analogue to present day
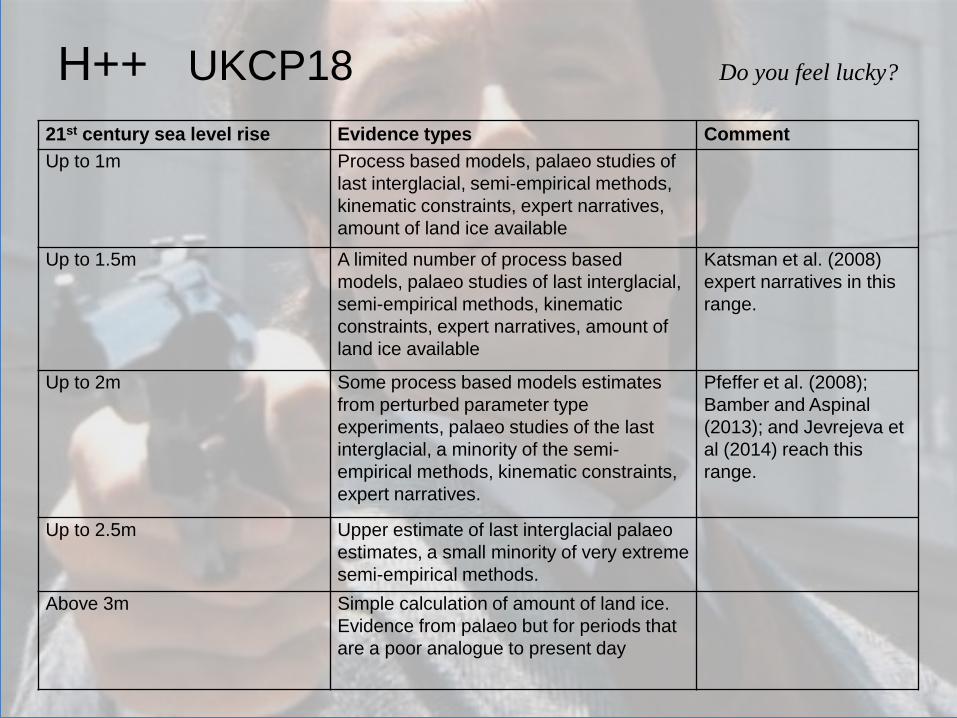
H++ UKCP18 Do you feel lucky?
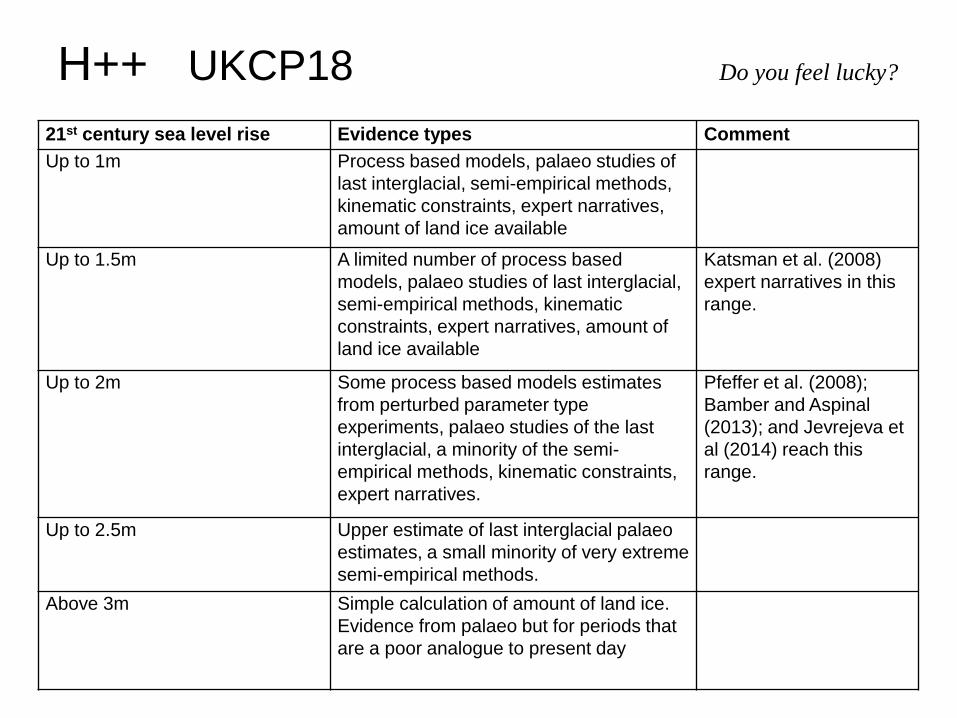
21st century sea level rise Evidence types Comment
Up to 1m Process based models, palaeo studies of
last interglacial, semi-empirical methods,
kinematic constraints, expert narratives,
amount of land ice available
Up to 1.5m A limited number of process based
models, palaeo studies of last interglacial,
semi-empirical methods, kinematic
constraints, expert narratives, amount of
land ice available
Katsman et al. (2008)
expert narratives in this
range.
Up to 2m Some process based models estimates
from perturbed parameter type
experiments, palaeo studies of the last
interglacial, a minority of the semi-
empirical methods, kinematic constraints,
expert narratives.
Pfeffer et al. (2008);
Bamber and Aspinal
(2013); and Jevrejeva et
al (2014) reach this
range.
Up to 2.5m Upper estimate of last interglacial palaeo
estimates, a small minority of very extreme
semi-empirical methods.
Above 3m Simple calculation of amount of land ice.
Evidence from palaeo but for periods that
are a poor analogue to present day
H++ UKCP18 Do you feel lucky?
UKCP09: change in storm surge
© Crown copyright Met Office
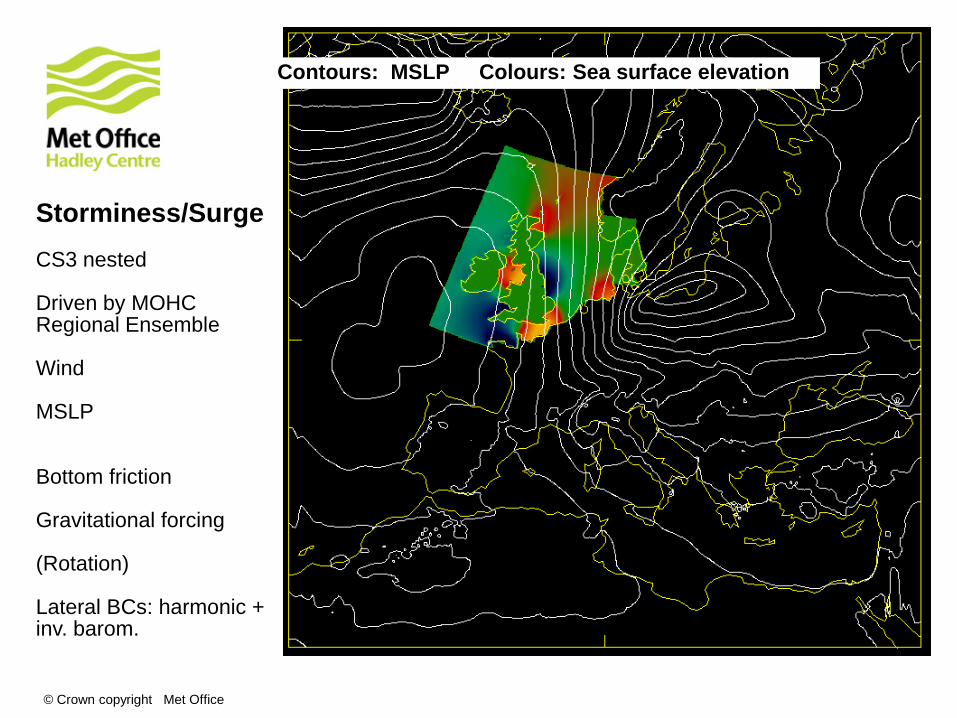
Storminess/Surge CS3 nested Driven by MOHC Regional Ensemble Wind MSLP Bottom friction Gravitational forcing (Rotation) Lateral BCs: harmonic + inv. barom.
Contours: MSLP Colours: Sea surface elevation
© Crown copyright Met Office
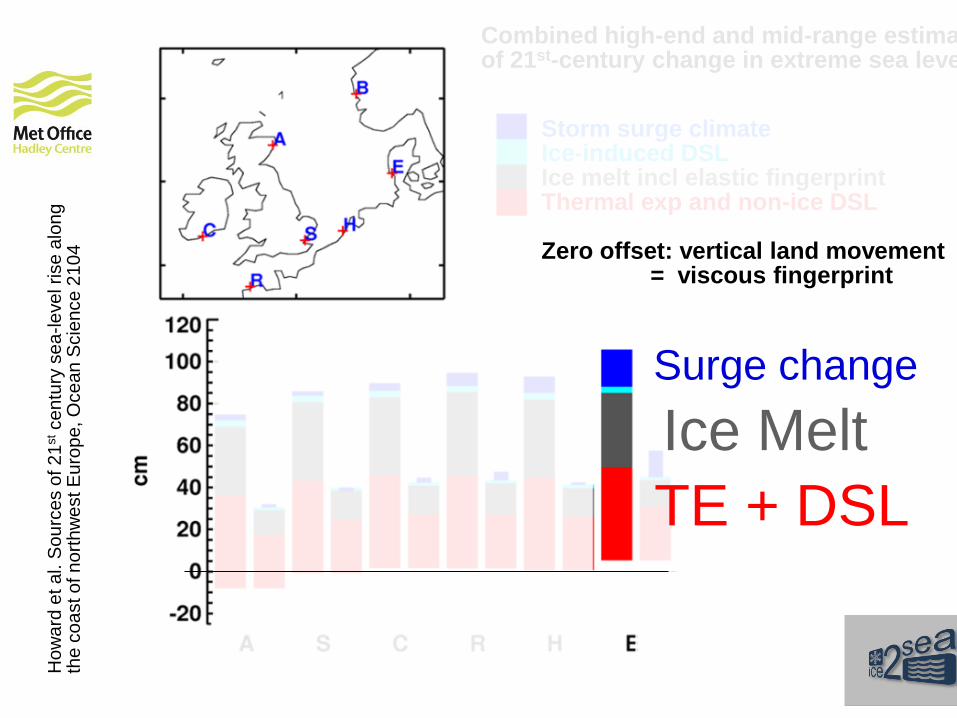
Storm surge climate Ice-induced DSL Ice melt incl elastic fingerprint Thermal exp and non-ice DSL Zero offset: vertical land movement = viscous fingerprint
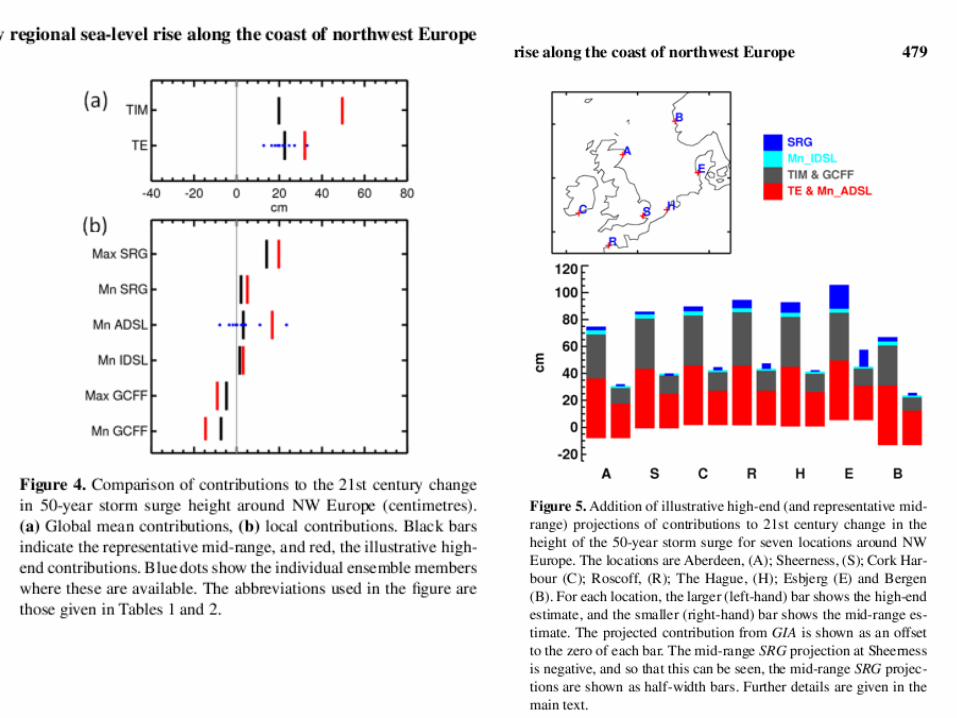
Combined high-end and mid-range estimates of 21st-century change in extreme sea level.
• Storm surge climate
• Ice-induced ocean
dynamics
• Ice melt
• Thermal exp + non-ice
ocean dynamics
• Vertical land movement
Combined high-end estimates for 2100 changes
in extreme 50-year storm height
Ho
wa
rd e
t a
l. S
ou
rce
s o
f 2
1st c
en
tury
se
a-le
ve
l rise
alo
ng
th
e c
oa
st o
f n
ort
hw
est E
uro
pe
, O
ce
an
Scie
nce
21
04
Ice Melt
Surge change
TE + DSL
© Crown copyright Met Office
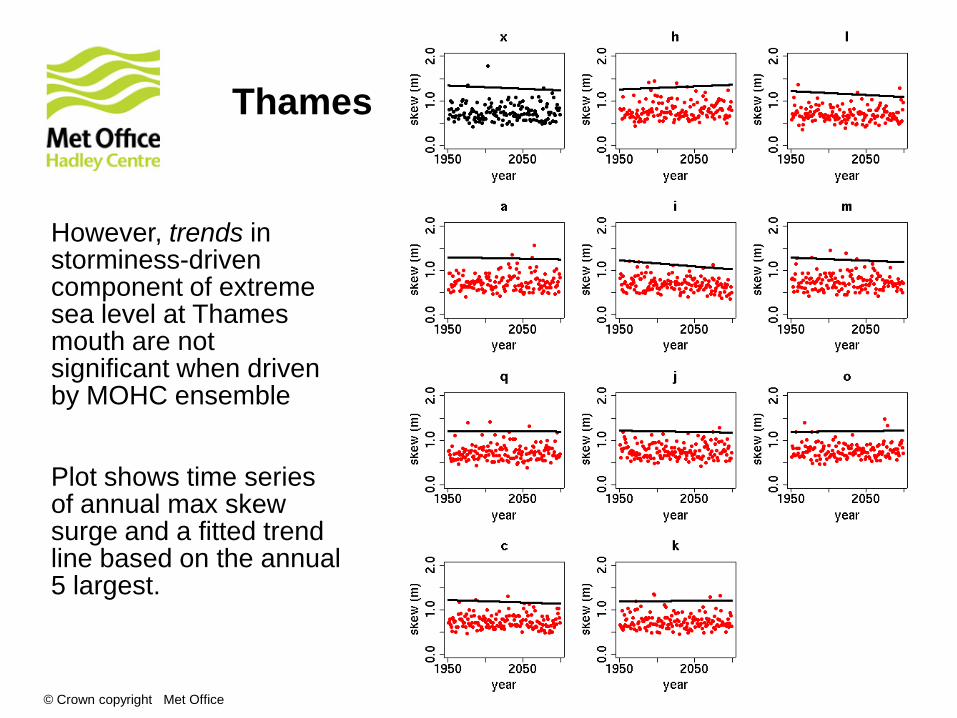
However, trends in storminess-driven component of extreme sea level at Thames mouth are not significant when driven by MOHC ensemble Plot shows time series of annual max skew surge and a fitted trend line based on the annual 5 largest.
Thames

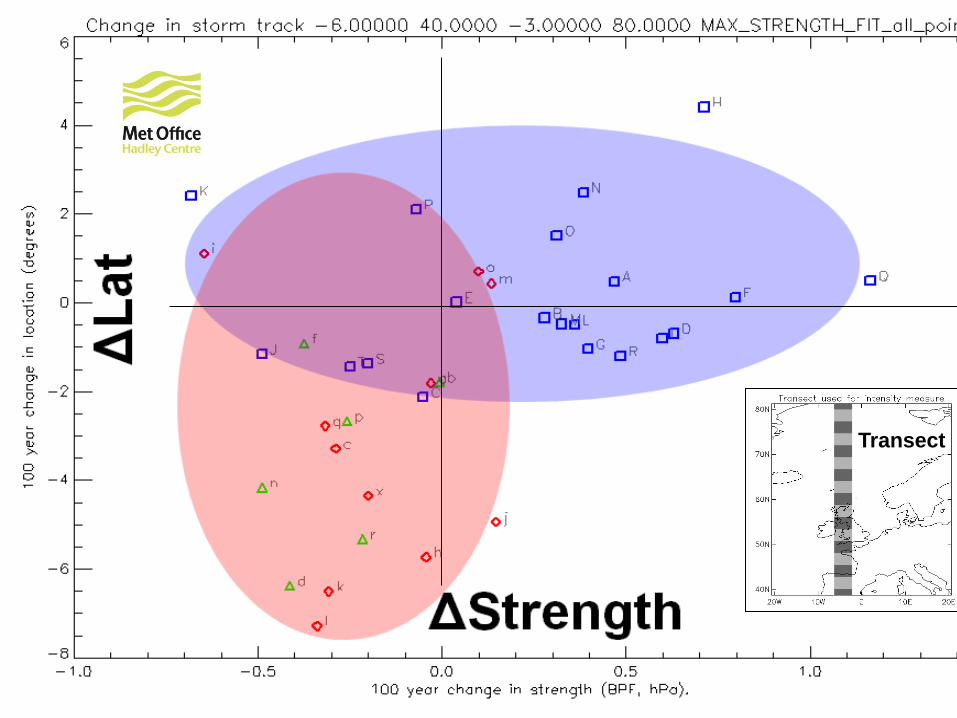
UKCP18: change in storm surge
© Crown copyright Met Office
Transect
UKCP18 changes in storm surges
Simulations with CS3 using Euro-CORDEX data:
•
•Select small number of models that span storm track
response

Providing useful output
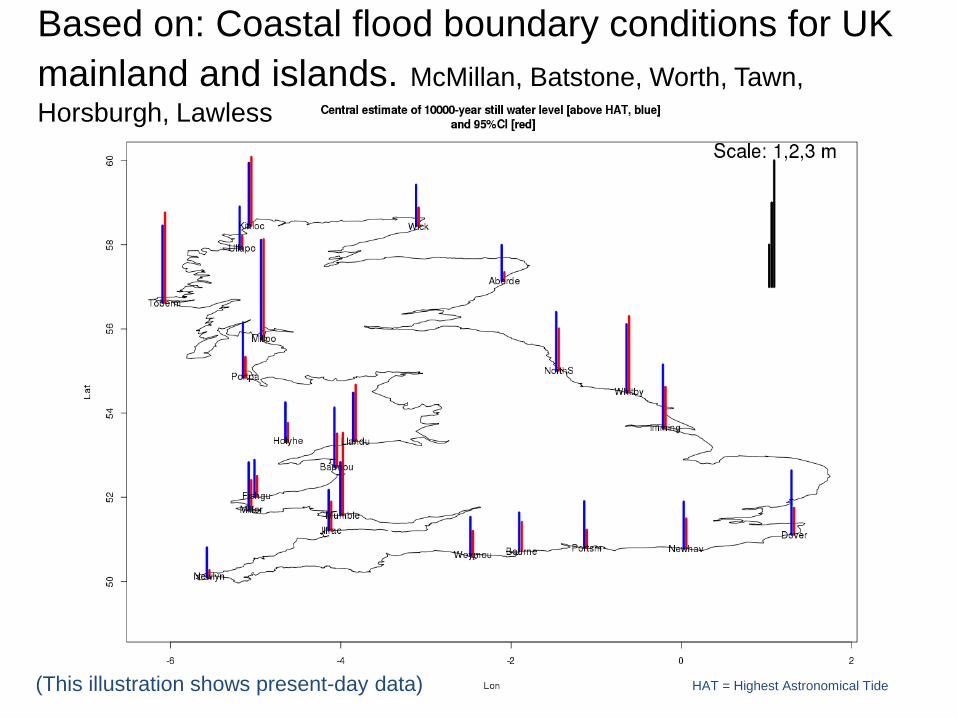
(This illustration shows present-day data)
Based on: Coastal flood boundary conditions for UK
mainland and islands. McMillan, Batstone, Worth, Tawn,
Horsburgh, Lawless
HAT = Highest Astronomical Tide
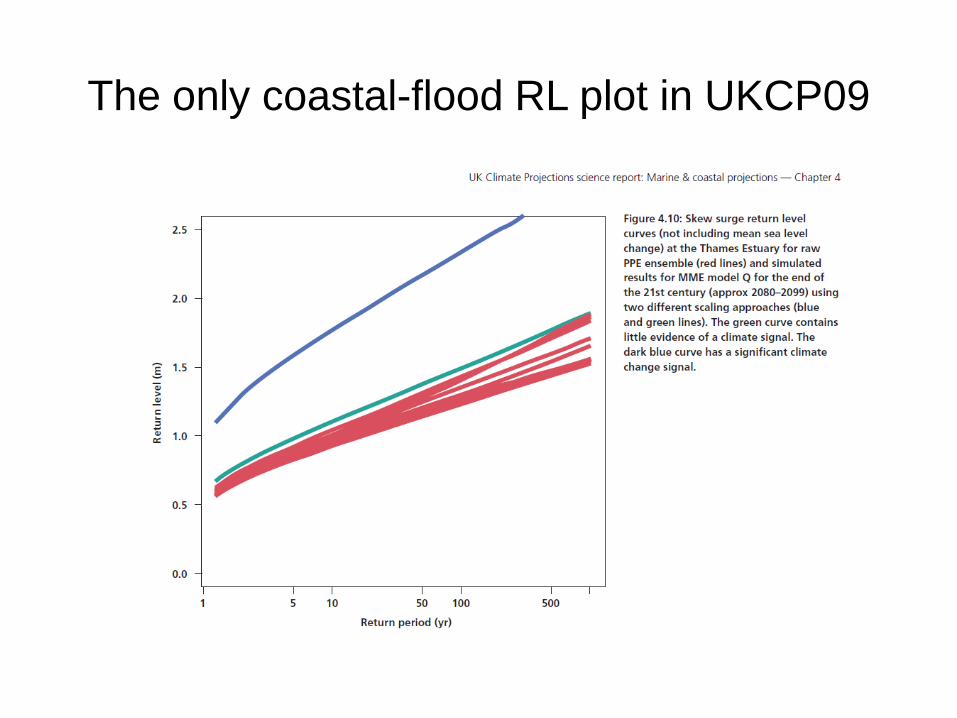
The only coastal-flood RL plot in UKCP09
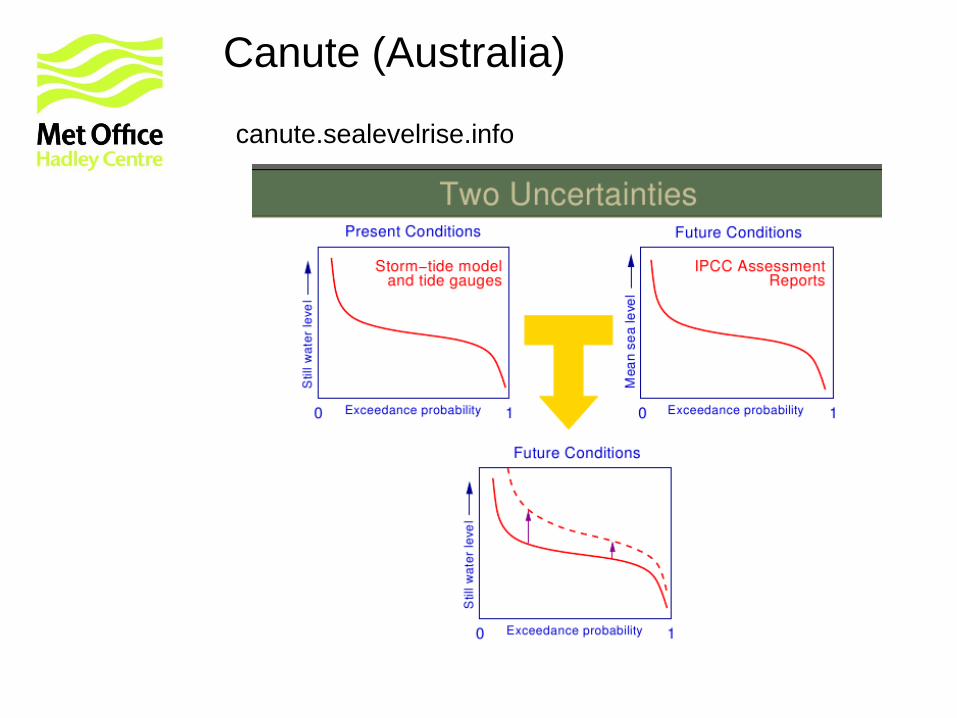
. canute.sealevelrise.info
Canute (Australia)

Questions/comments...

Additional Slides...
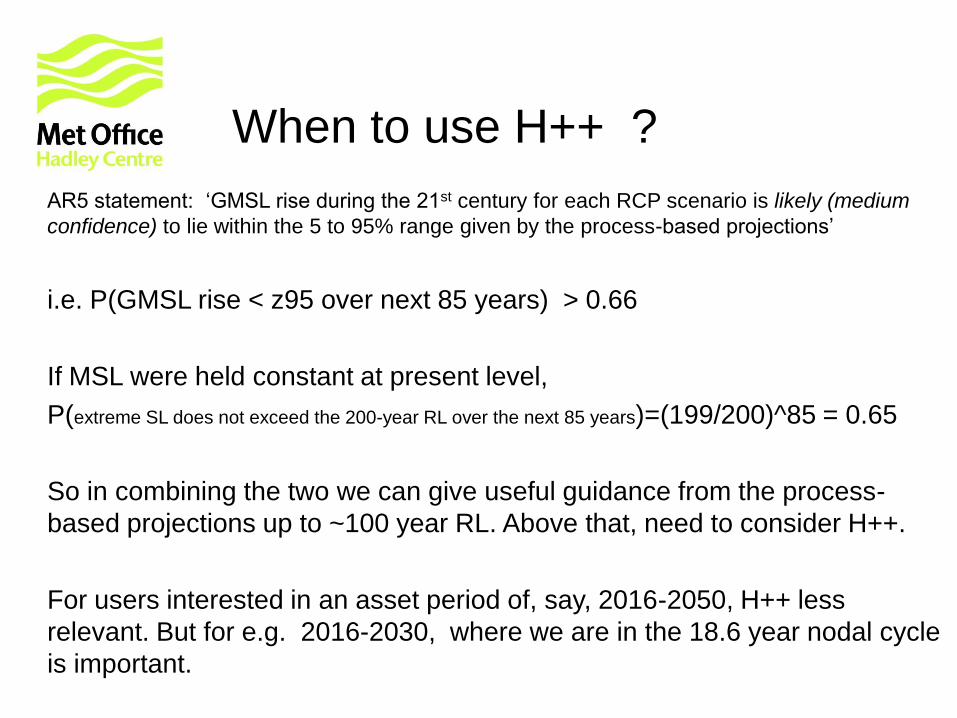
When to use H++ ?
AR5 statement: ‘GMSL rise during the 21st century for each RCP scenario is likely (medium
confidence) to lie within the 5 to 95% range given by the process-based projections’
i.e. P(GMSL rise < z95 over next 85 years) > 0.66
If MSL were held constant at present level,
P(extreme SL does not exceed the 200-year RL over the next 85 years)=(199/200)^85 = 0.65
So in combining the two we can give useful guidance from the process-
based projections up to ~100 year RL. Above that, need to consider H++.
For users interested in an asset period of, say, 2016-2050, H++ less
relevant. But for e.g. 2016-2030, where we are in the 18.6 year nodal cycle
is important.
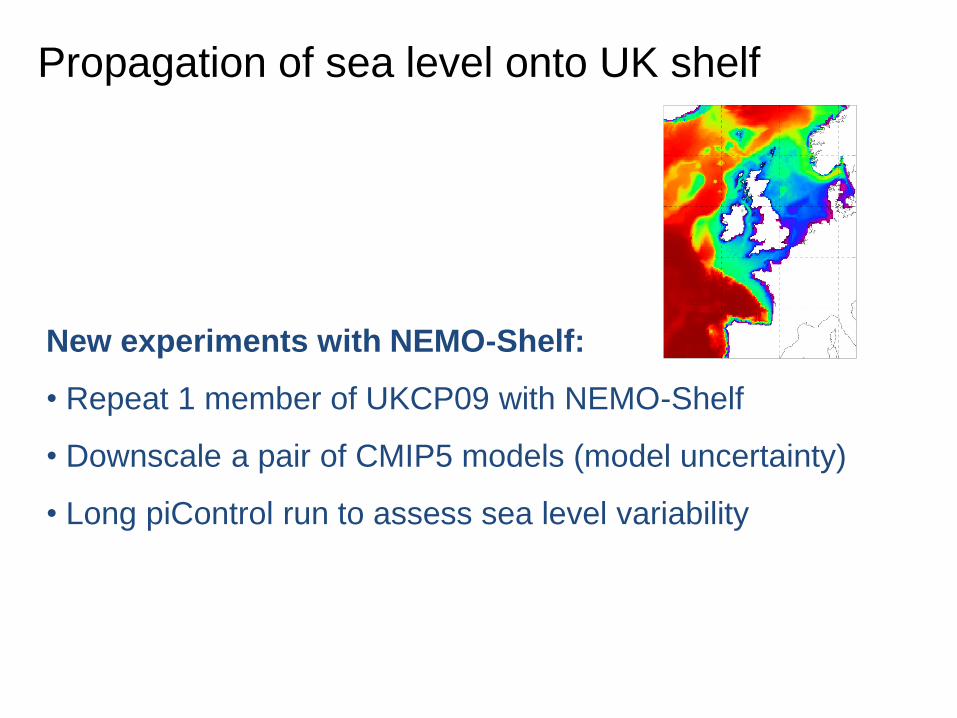
Propagation of sea level onto UK shelf
New experiments with NEMO-Shelf:
• Repeat 1 member of UKCP09 with NEMO-Shelf
• Downscale a pair of CMIP5 models (model uncertainty)
• Long piControl run to assess sea level variability
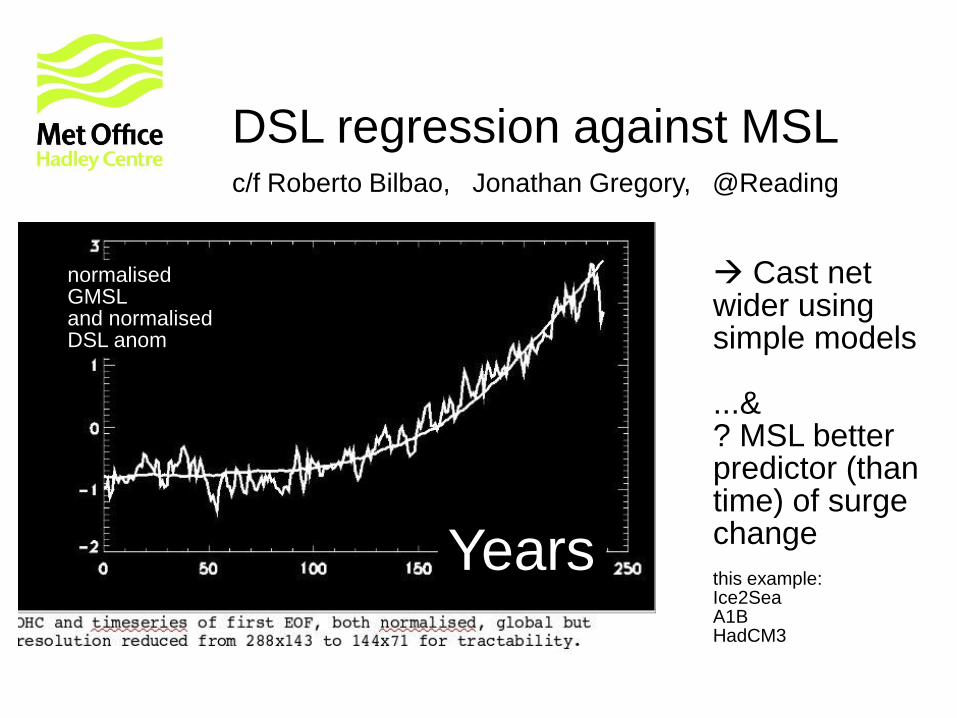
DSL regression against MSL c/f Roberto Bilbao, Jonathan Gregory, @Reading
Cast net wider using simple models ...& ? MSL better predictor (than time) of surge change this example: Ice2Sea A1B HadCM3
Years
normalised GMSL and normalised DSL anom