Embed Size (px)
Citation preview
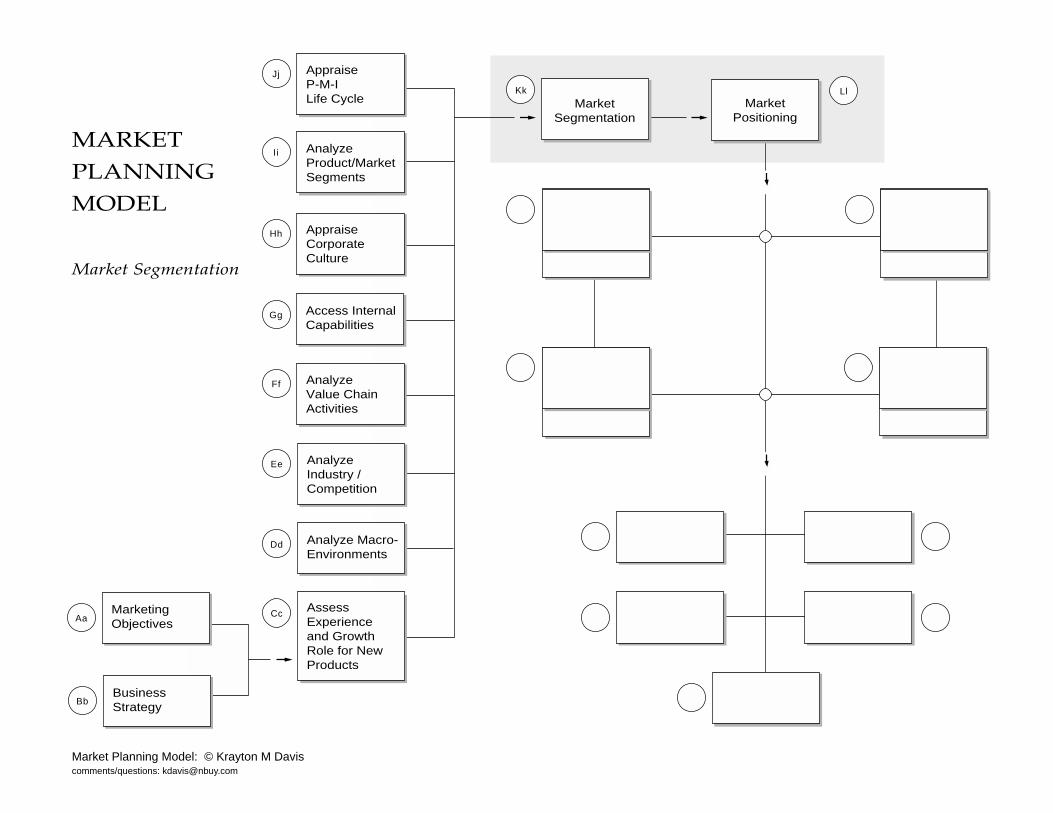
Market Planning Model: © Krayton M Daviscomments/questions: [email protected]
Aa
Bb
Dd
Cc
Ee
MarketingObjectives
BusinessStrategy
AssessExperienceand GrowthRole for NewProducts
Analyze Macro-Environments
AnalyzeIndustry /Competition
Gg Access InternalCapabilities
Ff AnalyzeValue ChainActivities
Hh AppraiseCorporateCulture
Jj AppraiseP-M-ILife Cycle
Ii AnalyzeProduct/MarketSegments
MarketSegmentation
Kk LlMarket
Positioning
MARKETPLANNINGMODEL
Market Segmentation
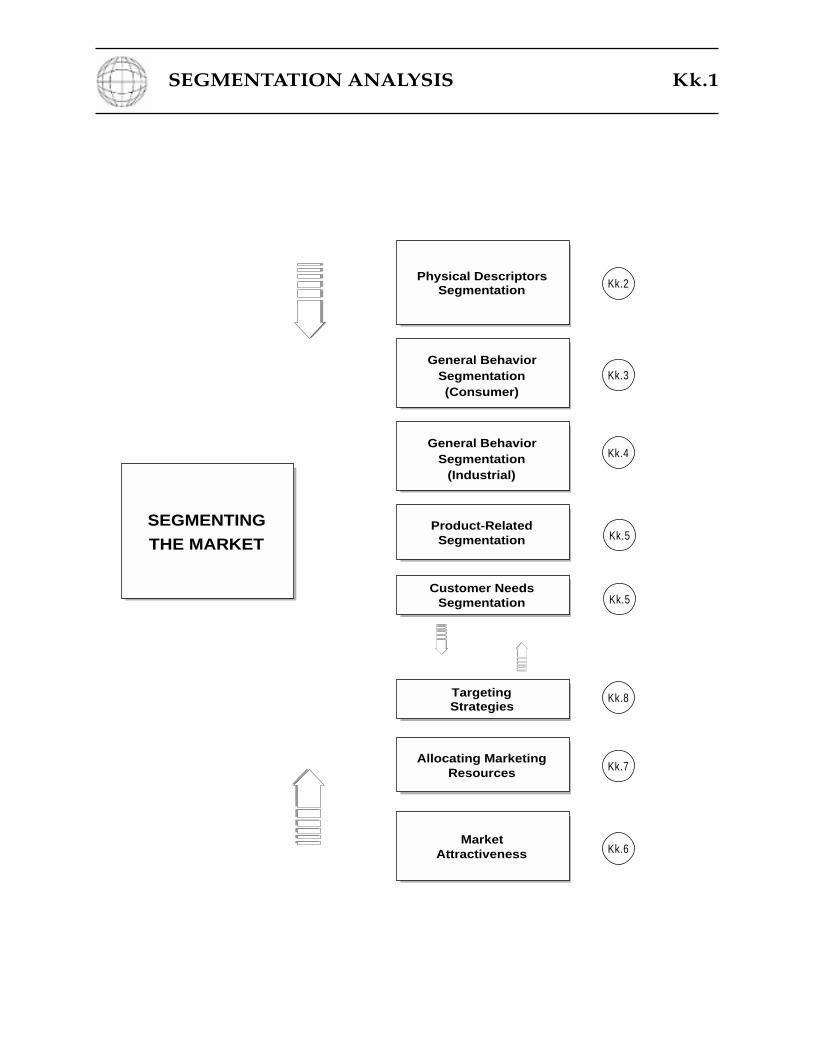
SEGMENTATION ANALYSIS Kk.1
SEGMENTING
THE MARKET
Customer NeedsSegmentation
TargetingStrategies
Allocating MarketingResources
MarketAttractiveness
Product-RelatedSegmentation
General BehaviorSegmentation(Consumer)
Physical DescriptorsSegmentation Kk.2
Kk.3
Kk.5
Kk.5
Kk.4
Kk.8
Kk.7
Kk.6
General BehaviorSegmentation
(Industrial)
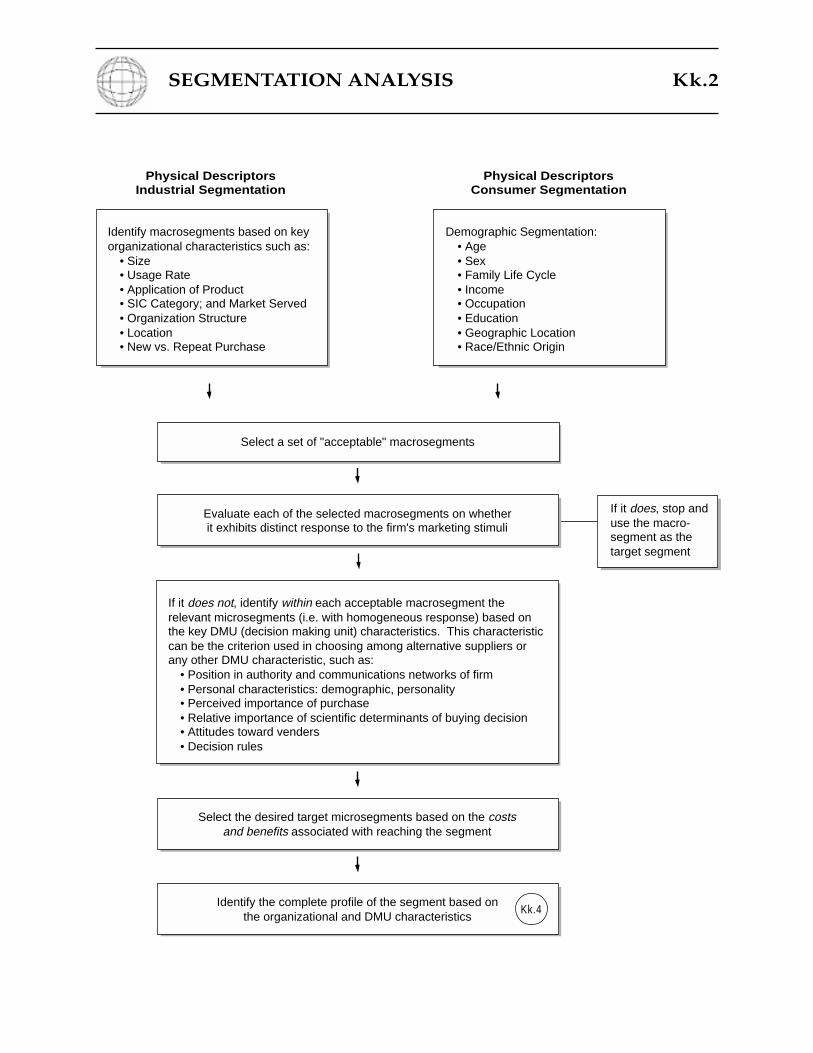
SEGMENTATION ANALYSIS Kk.2
If it does, stop anduse the macro-segment as thetarget segment
Identify macrosegments based on keyorganizational characteristics such as:
• Size• Usage Rate• Application of Product• SIC Category; and Market Served• Organization Structure• Location• New vs. Repeat Purchase
If it does not, identify within each acceptable macrosegment therelevant microsegments (i.e. with homogeneous response) based onthe key DMU (decision making unit) characteristics. This characteristiccan be the criterion used in choosing among alternative suppliers orany other DMU characteristic, such as:
• Position in authority and communications networks of firm• Personal characteristics: demographic, personality• Perceived importance of purchase• Relative importance of scientific determinants of buying decision• Attitudes toward venders• Decision rules
Evaluate each of the selected macrosegments on whetherit exhibits distinct response to the firm's marketing stimuli
Select the desired target microsegments based on the costsand benefits associated with reaching the segment
Identify the complete profile of the segment based onthe organizational and DMU characteristics
Demographic Segmentation:• Age• Sex• Family Life Cycle• Income• Occupation• Education• Geographic Location• Race/Ethnic Origin
Physical DescriptorsIndustrial Segmentation
Physical DescriptorsConsumer Segmentation
Select a set of "acceptable" macrosegments
Kk.4
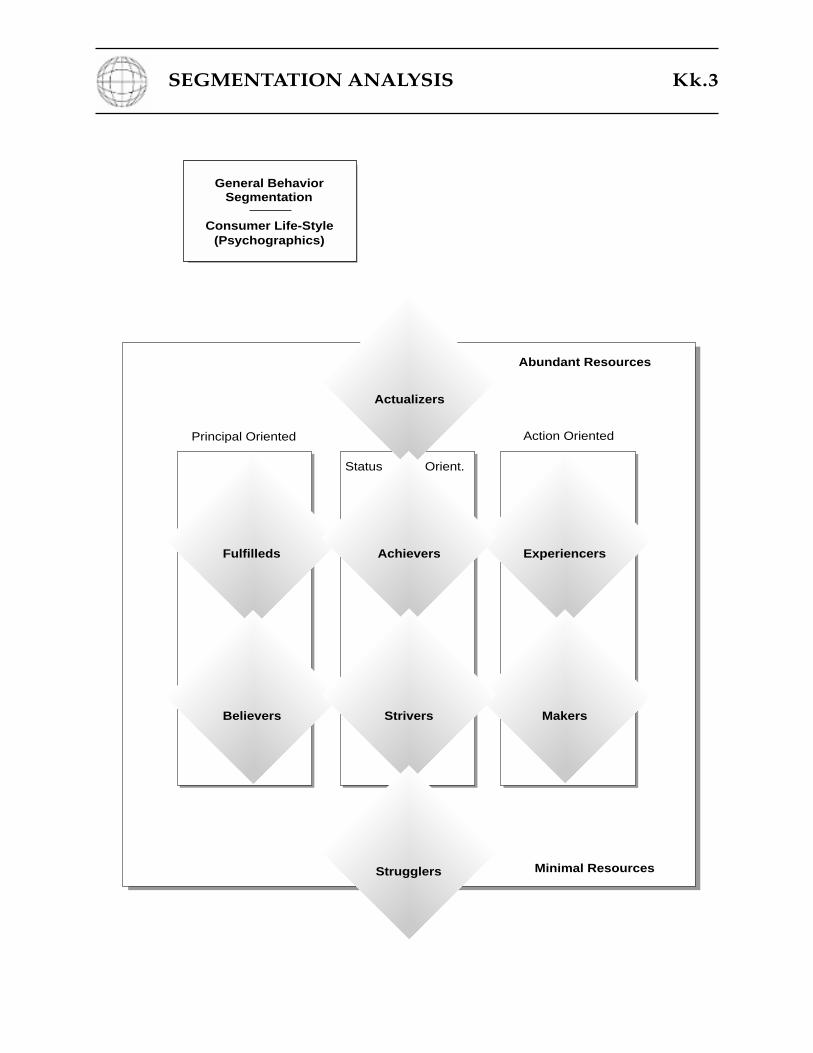
SEGMENTATION ANALYSIS Kk.3
Actualizers
Abundant Resources
Minimal Resources
Action OrientedPrincipal Oriented
Status Orient.
AchieversFulfilleds Experiencers
StriversBelievers Makers
Strugglers
General BehaviorSegmentation
Consumer Life-Style(Psychographics)
SEGMENTATION ANALYSIS Kk.4
Salespersons
Exhibitions andTrade Shows
Direct Mail
Press Releases
JournalAdvertising
Professionaland TechnicalConferences
Trade News
Word-of-Mouth
Others
SpecializedEducation
RoleOrigination
LifeStyle
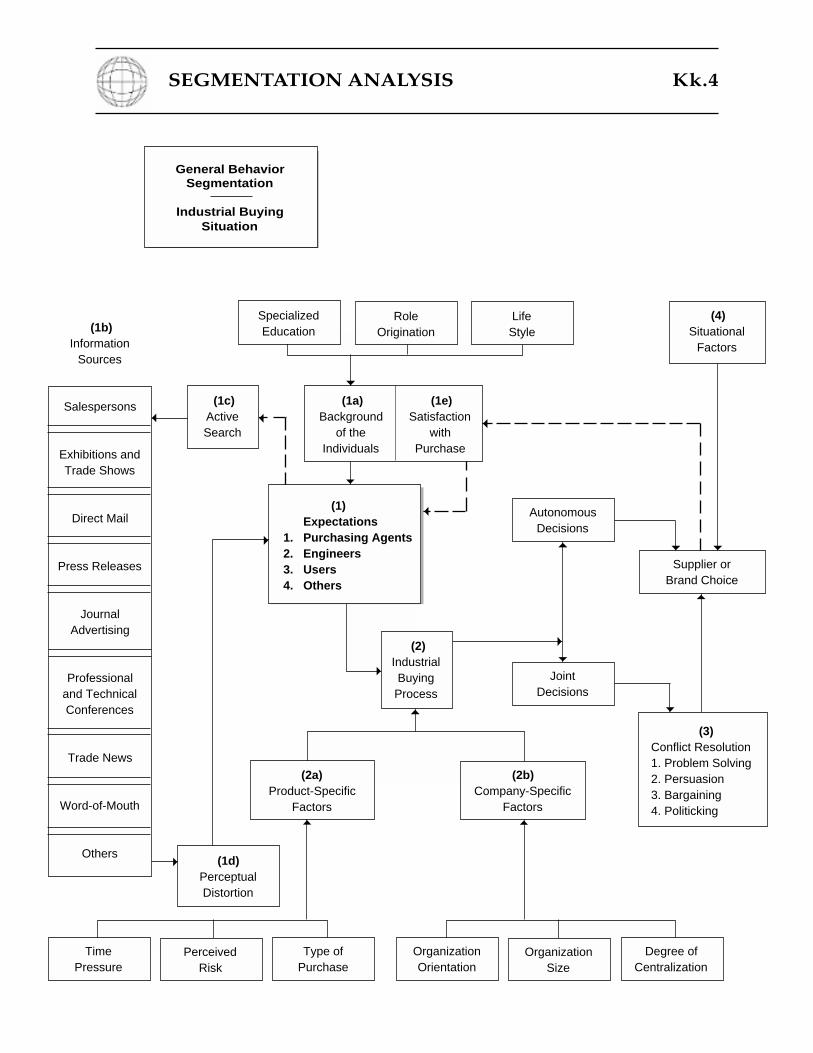
(1a)Background
of theIndividuals
(1e)Satisfaction
withPurchase
(1c)ActiveSearch
(1) Expectations1. Purchasing Agents2. Engineers3. Users4. Others
TimePressure
PerceivedRisk
Type ofPurchase
OrganizationOrientation
OrganizationSize
Degree ofCentralization
(1d)PerceptualDistortion
(2b)Company-Specific
Factors
AutonomousDecisions
Supplier orBrand Choice
(4)Situational
Factors
(3)Conflict Resolution1. Problem Solving2. Persuasion3. Bargaining4. Politicking
JointDecisions
(2a)Product-Specific
Factors
(2)IndustrialBuyingProcess
(1b)Information
Sources
General BehaviorSegmentation
Industrial BuyingSituation
SEGMENTATION ANALYSIS Kk.5
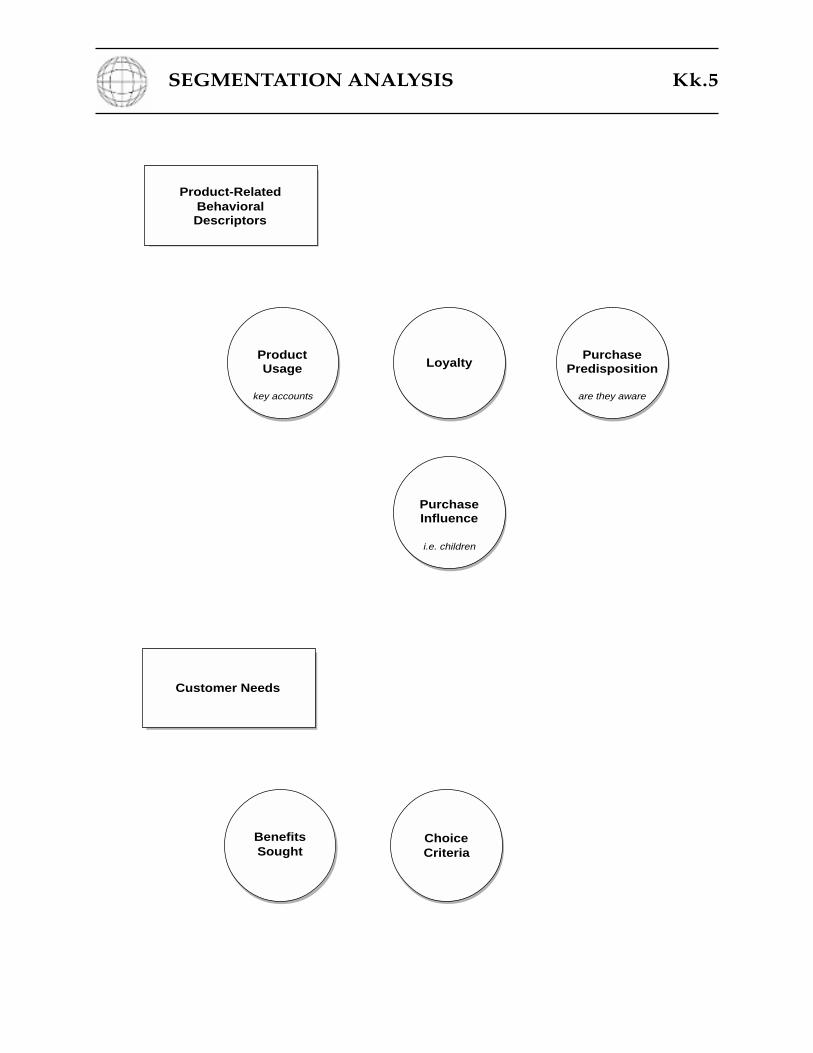
Product-RelatedBehavioralDescriptors
ProductUsage
key accounts
LoyaltyPurchase
Predisposition
are they aware
PurchaseInfluence
i.e. children
BenefitsSought
Customer Needs
ChoiceCriteria
SEGMENTATION ANALYSIS Kk.6
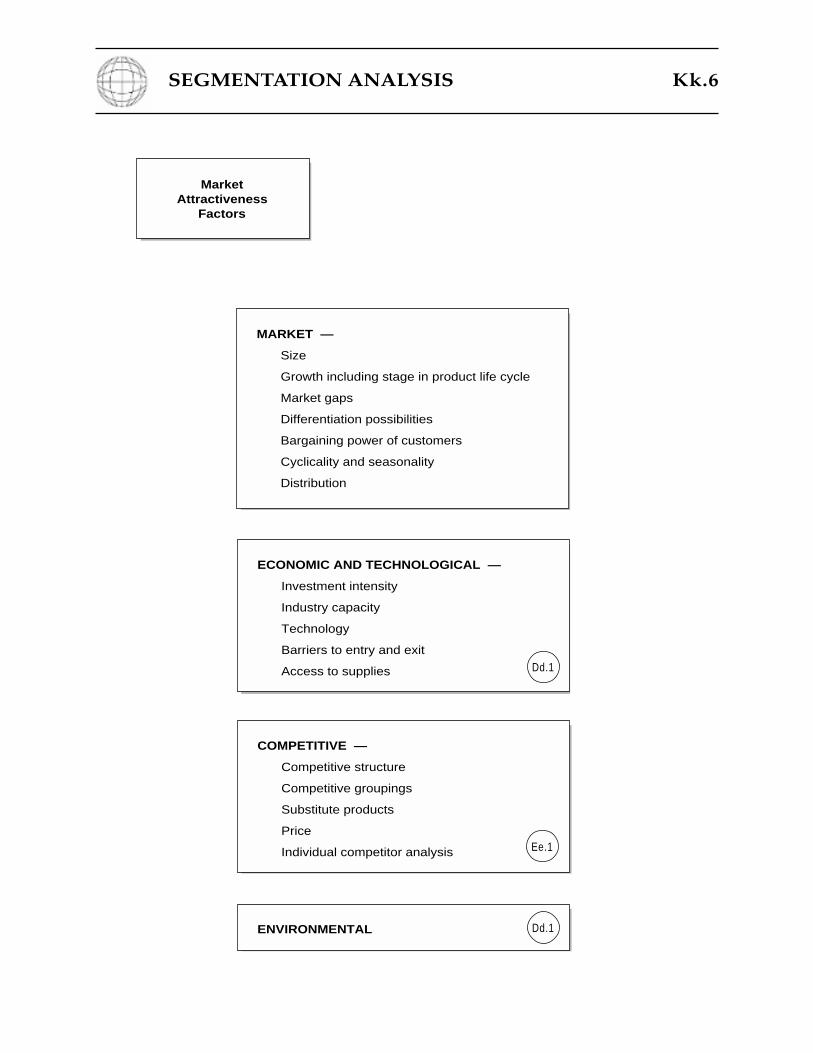
MarketAttractiveness
Factors
MARKET —
Size
Growth including stage in product life cycle
Market gaps
Differentiation possibilities
Bargaining power of customers
Cyclicality and seasonality
Distribution
ECONOMIC AND TECHNOLOGICAL —
Investment intensity
Industry capacity
Technology
Barriers to entry and exit
Access to supplies
COMPETITIVE —
Competitive structure
Competitive groupings
Substitute products
Price
Individual competitor analysis
ENVIRONMENTAL
Dd.1
Ee.1
Dd.1
SEGMENTATION ANALYSIS Kk.7
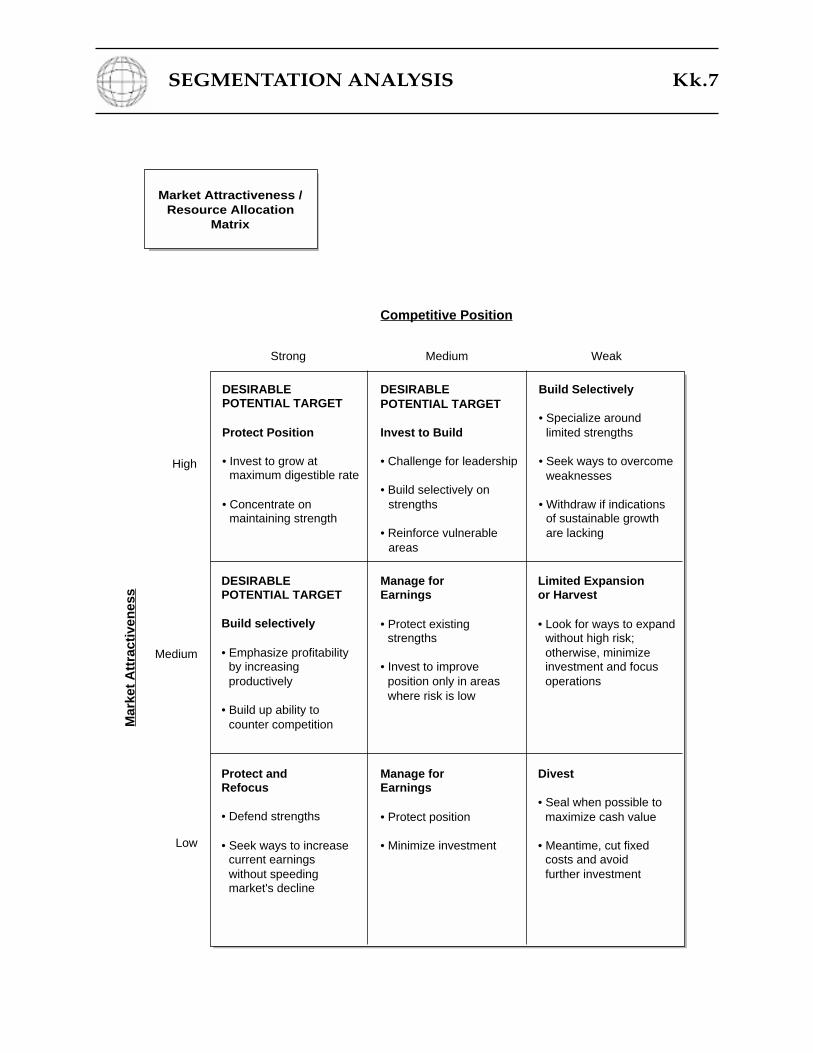
Medium
Market Attractiveness /Resource Allocation
Matrix
DESIRABLEPOTENTIAL TARGET
Protect Position
• Invest to grow at• maximum digestible rate
• Concentrate on• maintaining strength
DESIRABLEPOTENTIAL TARGET
Invest to Build
• Challenge for leadership
• Build selectively on• strengths
• Reinforce vulnerable• areas
Build Selectively
• Specialize around• limited strengths
• Seek ways to overcome• weaknesses
• Withdraw if indications• of sustainable growth• are lacking
DESIRABLEPOTENTIAL TARGET
Build selectively
• Emphasize profitability• by increasing• productively
• Build up ability to• counter competition
Manage forEarnings
• Protect existing• strengths
• Invest to improve• position only in areas• where risk is low
Limited Expansionor Harvest
• Look for ways to expand• without high risk;• otherwise, minimize• investment and focus• operations
Protect andRefocus
• Defend strengths
• Seek ways to increase• current earnings• without speeding• market's decline
Manage forEarnings
• Protect position
• Minimize investment
Divest
• Seal when possible to• maximize cash value
• Meantime, cut fixed• costs and avoid• further investment
Competitive Position
Mar
ket
Att
ract
iven
ess
Strong Medium Weak
High
Low
SEGMENTATION ANALYSIS Kk.8
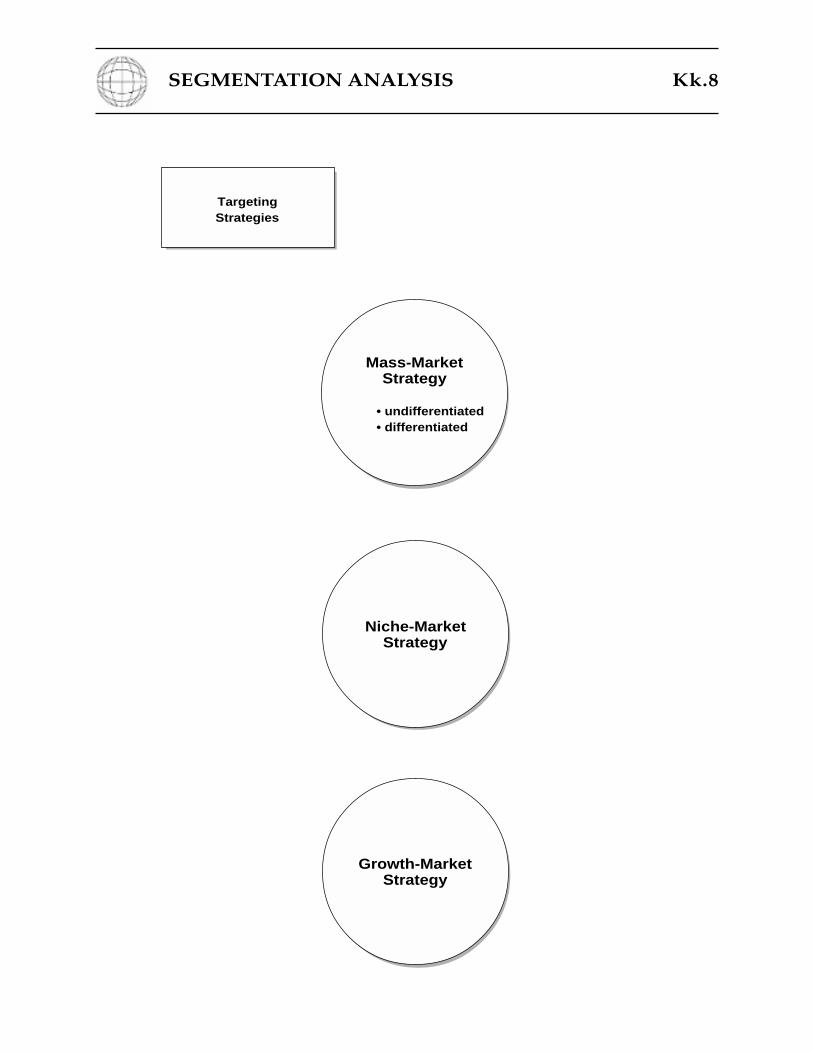
TargetingStrategies
Mass-MarketStrategy
• undifferentiated• differentiated
Growth-MarketStrategy
Niche-MarketStrategy
SEGMENTATION ANALYSIS Kk.9
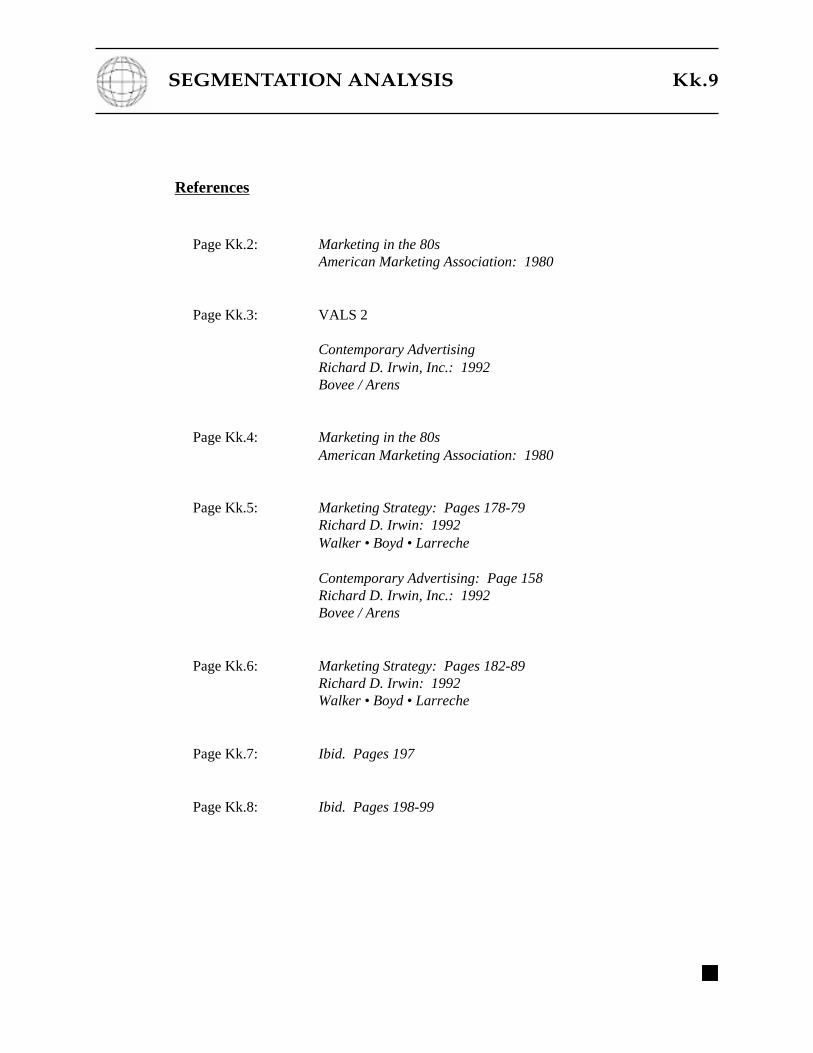
References
Page Kk.2: Marketing in the 80sAmerican Marketing Association: 1980
Page Kk.3: VALS 2
Contemporary AdvertisingRichard D. Irwin, Inc.: 1992Bovee / Arens
Page Kk.4: Marketing in the 80sAmerican Marketing Association: 1980
Page Kk.5: Marketing Strategy: Pages 178-79Richard D. Irwin: 1992Walker • Boyd • Larreche
Contemporary Advertising: Page 158Richard D. Irwin, Inc.: 1992Bovee / Arens
Page Kk.6: Marketing Strategy: Pages 182-89Richard D. Irwin: 1992Walker • Boyd • Larreche
Page Kk.7: Ibid. Pages 197
Page Kk.8: Ibid. Pages 198-99
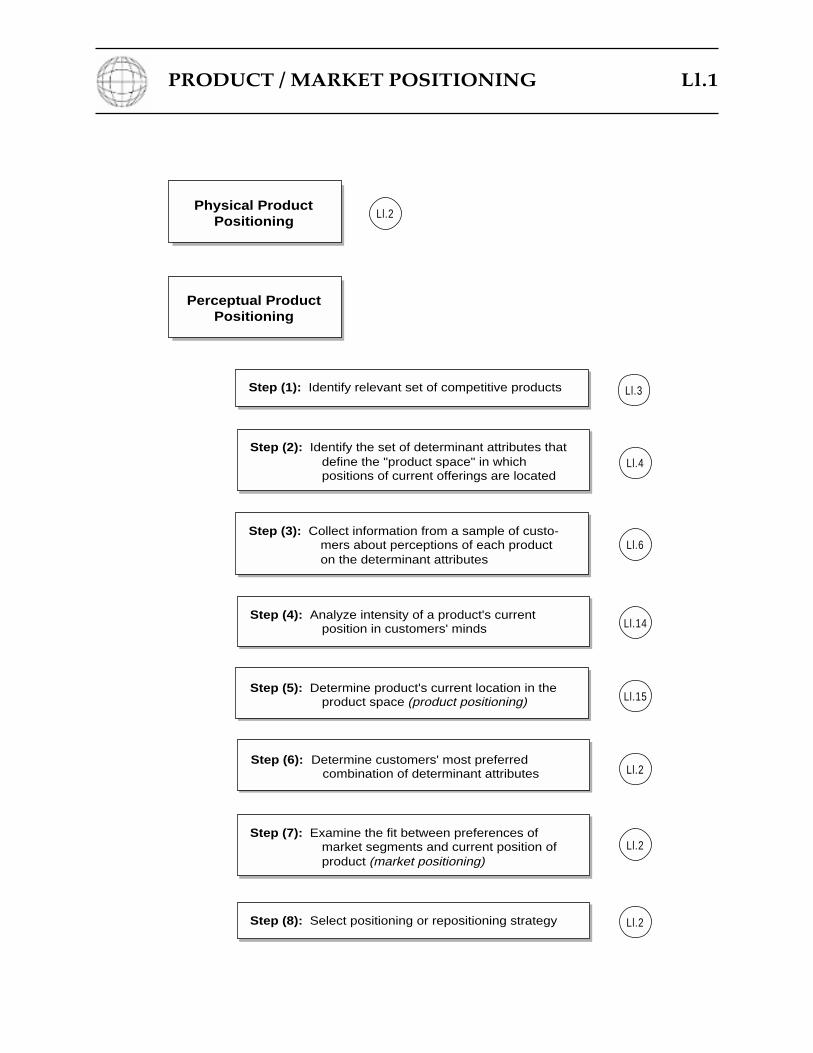
PRODUCT / MARKET POSITIONING Ll.1
Physical ProductPositioning
Perceptual ProductPositioning
Step (2): Identify the set of determinant attributes thatdefine the "product space" in whichpositions of current offerings are located
Step (3): Collect information from a sample of custo-mers about perceptions of each producton the determinant attributes
Step (1): Identify relevant set of competitive products
Step (4): Analyze intensity of a product's currentposition in customers' minds
Step (5): Determine product's current location in theproduct space (product positioning)
Step (6): Determine customers' most preferredcombination of determinant attributes
Step (7): Examine the fit between preferences ofmarket segments and current position ofproduct (market positioning)
Step (8): Select positioning or repositioning strategy
Ll.2
Ll.3
Ll.4
Ll.6
Ll.14
Ll.15
Ll.2
Ll.2
Ll.2
PRODUCT / MARKET POSITIONING Ll.2
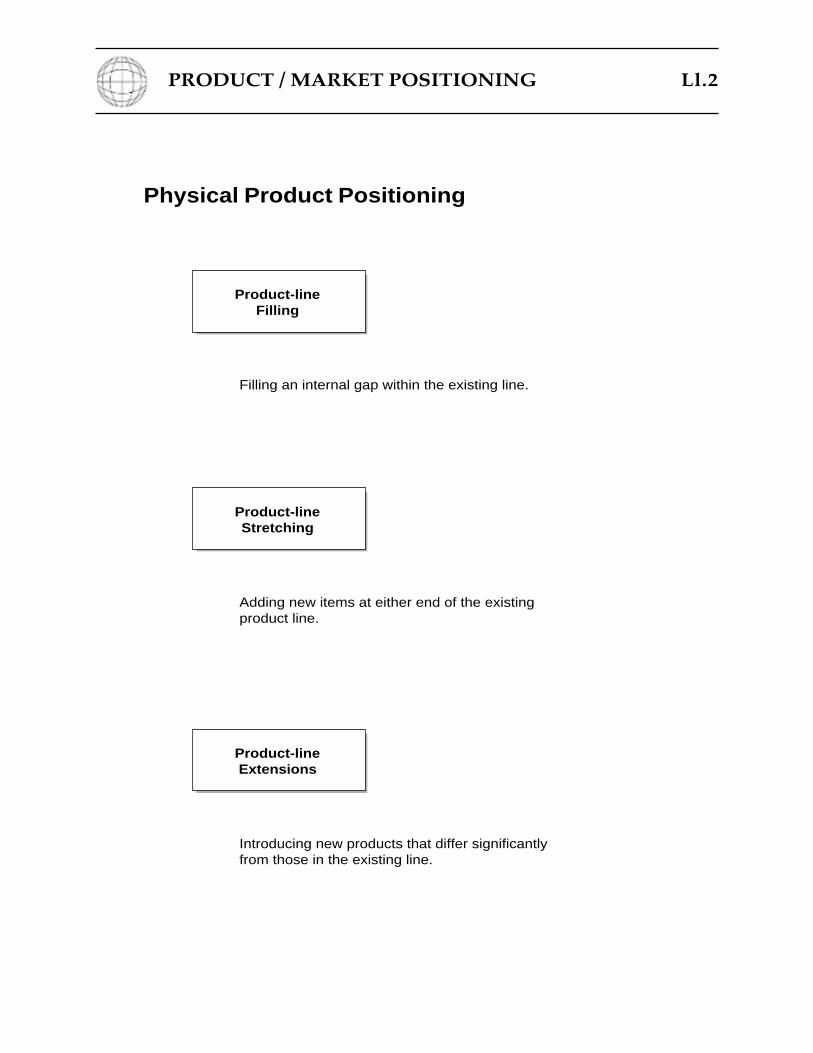
Product-lineFilling
Filling an internal gap within the existing line.
Product-lineStretching
Adding new items at either end of the existingproduct line.
Product-lineExtensions
Introducing new products that differ significantlyfrom those in the existing line.
Physical Product Positioning
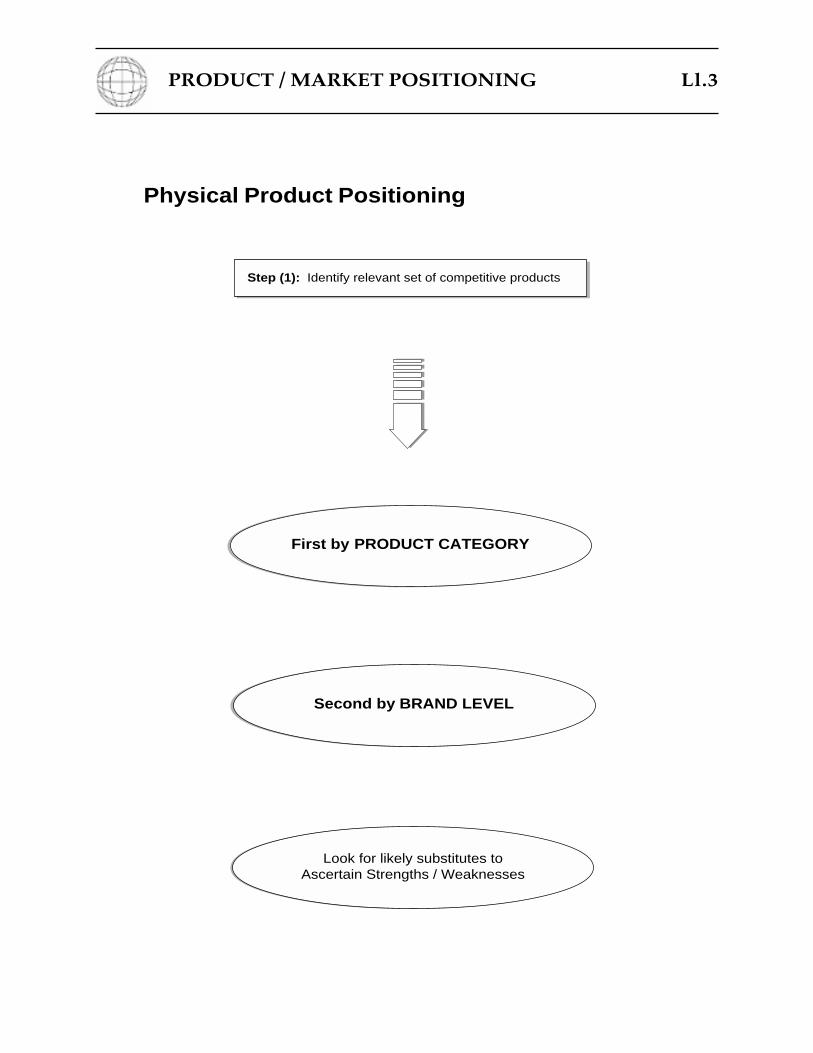
PRODUCT / MARKET POSITIONING Ll.3
Step (1): Identify relevant set of competitive products
First by PRODUCT CATEGORY
Second by BRAND LEVEL
Look for likely substitutes toAscertain Strengths / Weaknesses
Physical Product Positioning
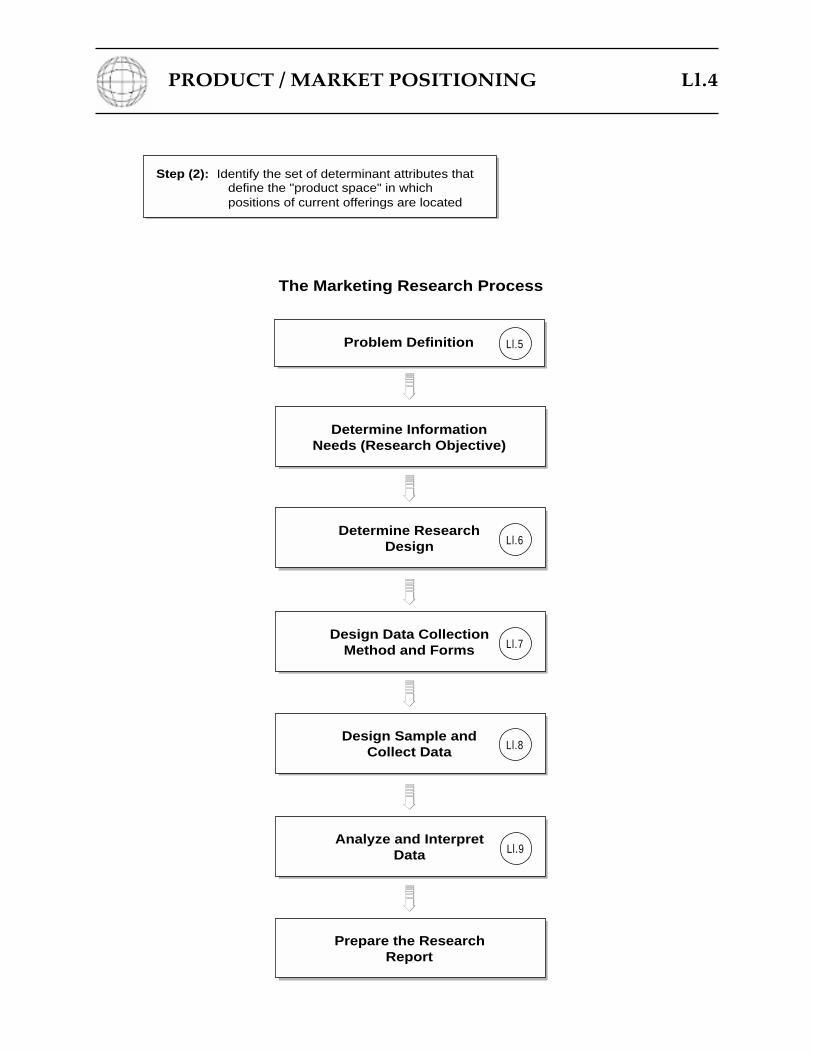
PRODUCT / MARKET POSITIONING Ll.4
Step (2): Identify the set of determinant attributes thatdefine the "product space" in whichpositions of current offerings are located
Problem Definition
Determine InformationNeeds (Research Objective)
Determine ResearchDesign
Design Data CollectionMethod and Forms
Design Sample andCollect Data
Analyze and InterpretData
Prepare the ResearchReport
The Marketing Research Process
Ll.5
Ll.7
Ll.9
Ll.6
Ll.8
PRODUCT / MARKET POSITIONING Ll.5
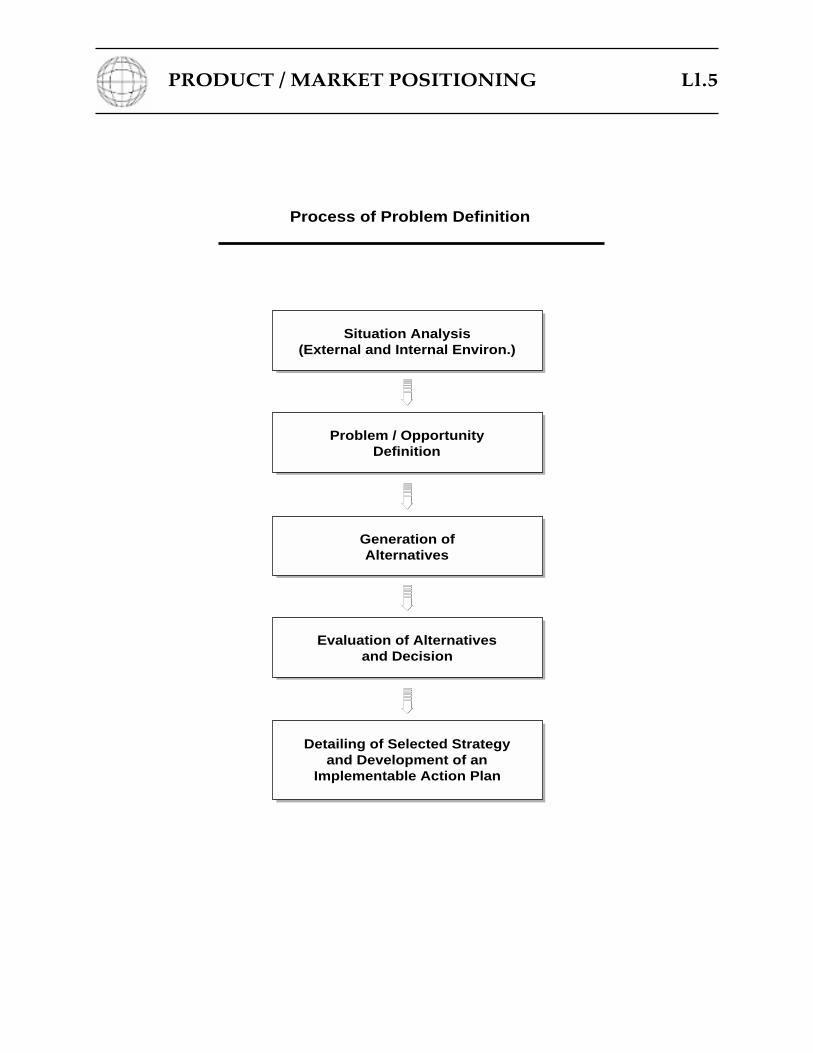
Situation Analysis(External and Internal Environ.)
Problem / OpportunityDefinition
Generation ofAlternatives
Evaluation of Alternativesand Decision
Detailing of Selected Strategyand Development of an
Implementable Action Plan
Process of Problem Definition
PRODUCT / MARKET POSITIONING Ll.6
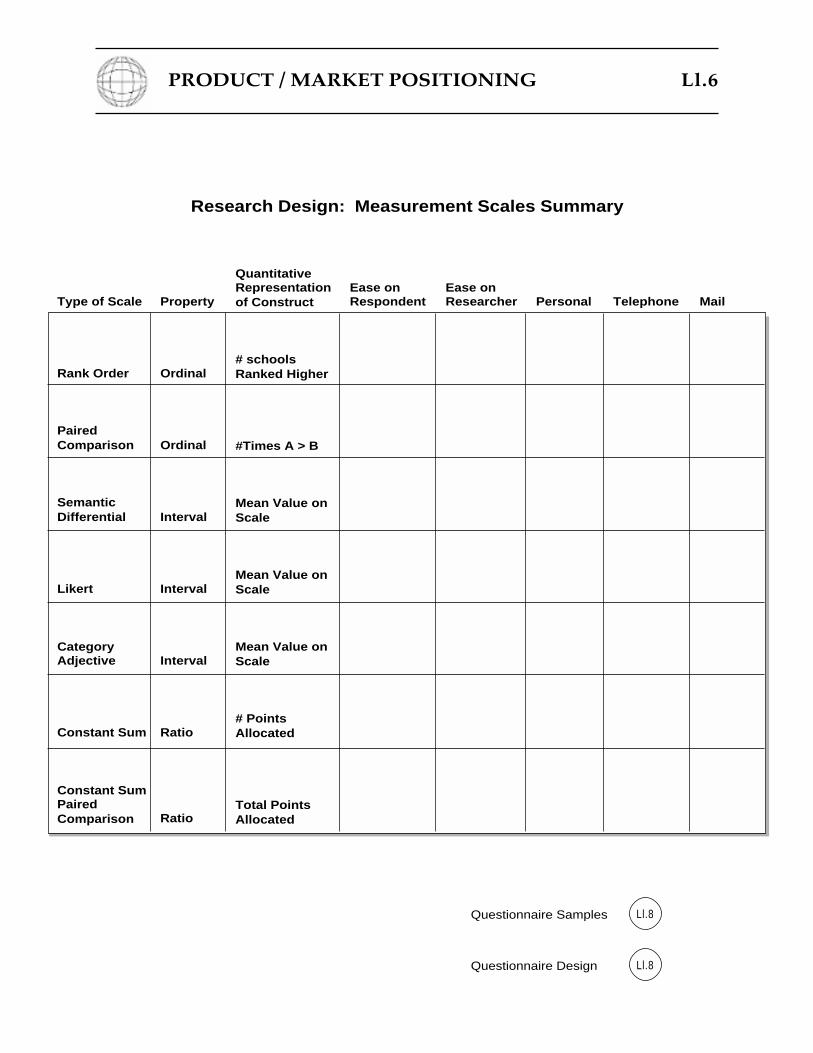
Type of Scale
Rank Order
PairedComparison
SemanticDifferential
Likert
CategoryAdjective
Constant Sum
Constant SumPairedComparison
Property
Ordinal
Ordinal
Interval
Interval
Interval
Ratio
Ratio
Ease onRespondent
Ease onResearcher Personal Telephone Mail
QuantitativeRepresentationof Construct
# schoolsRanked Higher
#Times A > B
Mean Value onScale
Mean Value onScale
Mean Value onScale
# PointsAllocated
Total PointsAllocated
Research Design: Measurement Scales Summary
Questionnaire Samples Ll.8
Questionnaire Design Ll.8
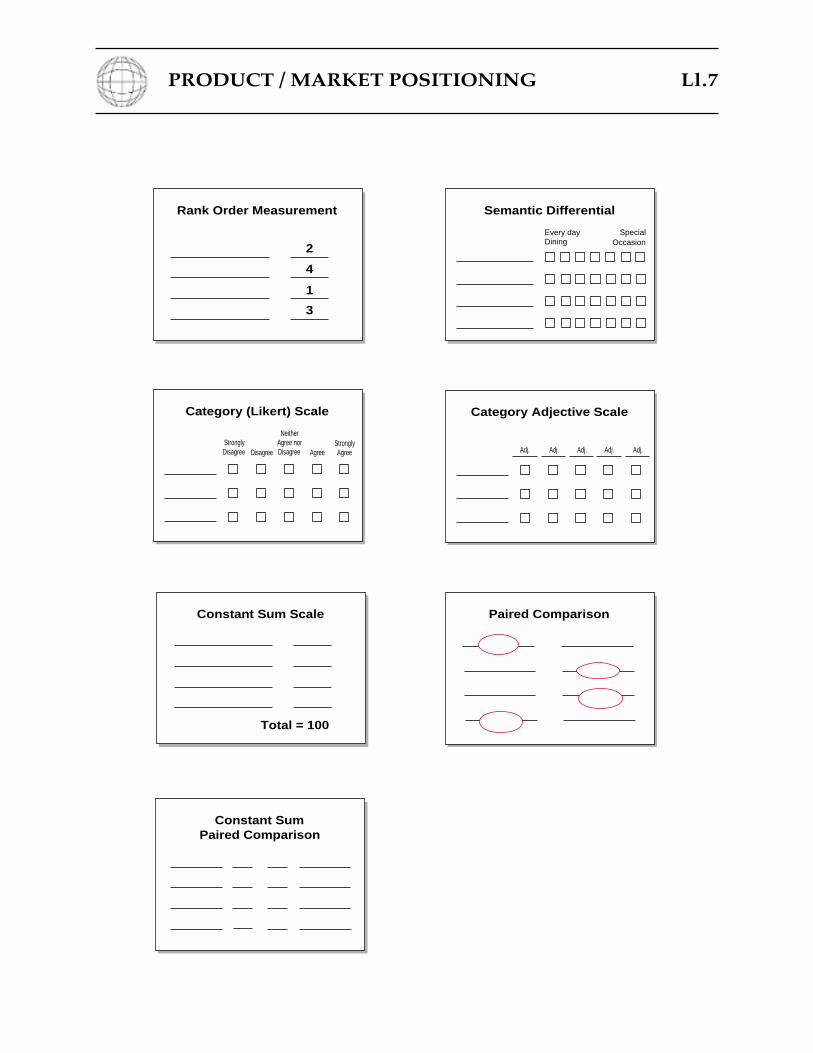
PRODUCT / MARKET POSITIONING Ll.7
Rank Order Measurement
2
4
1
3
Semantic Differential
Every dayDining
SpecialOccasion
Category (Likert) Scale
StronglyDisagree
StronglyAgreeAgreeDisagree
NeitherAgree norDisagree
Category Adjective Scale
Adj. Adj. Adj. Adj. Adj.
Constant Sum Scale
Total = 100
Paired Comparison
Constant SumPaired Comparison
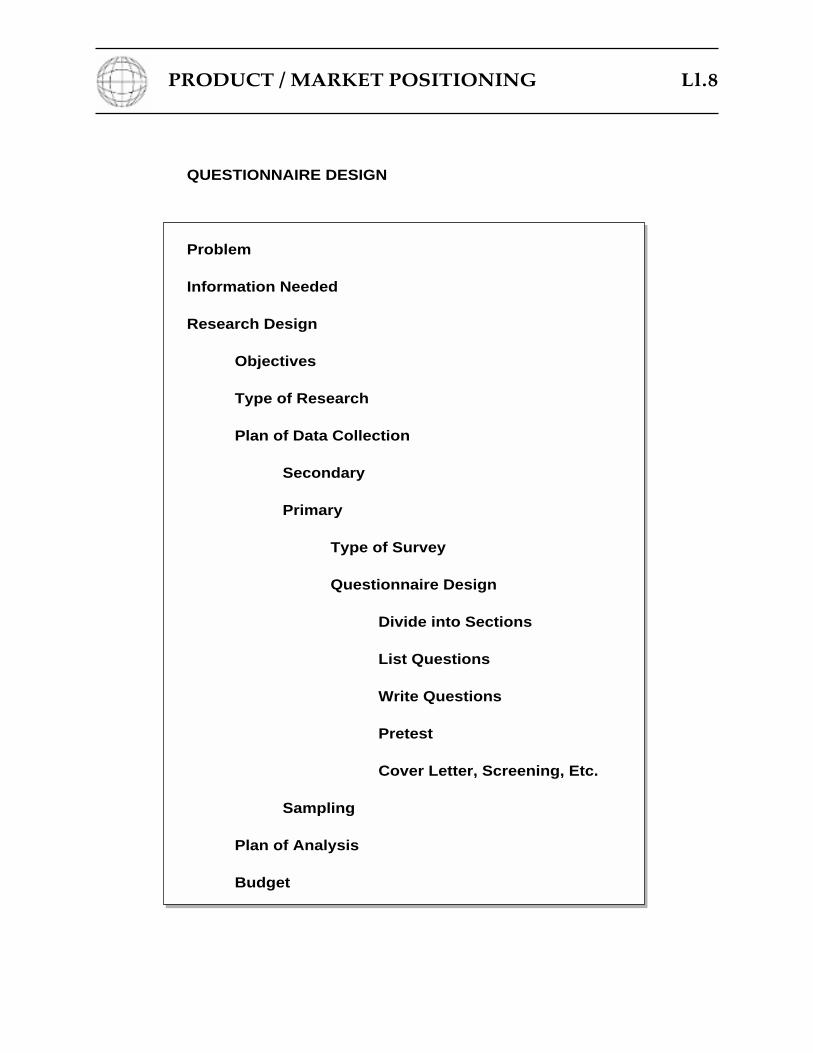
PRODUCT / MARKET POSITIONING Ll.8
QUESTIONNAIRE DESIGN
Problem
Information Needed
Research Design
Objectives
Type of Research
Plan of Data Collection
Secondary
Primary
Type of Survey
Questionnaire Design
Divide into Sections
List Questions
Write Questions
Pretest
Cover Letter, Screening, Etc.
Sampling
Plan of Analysis
Budget
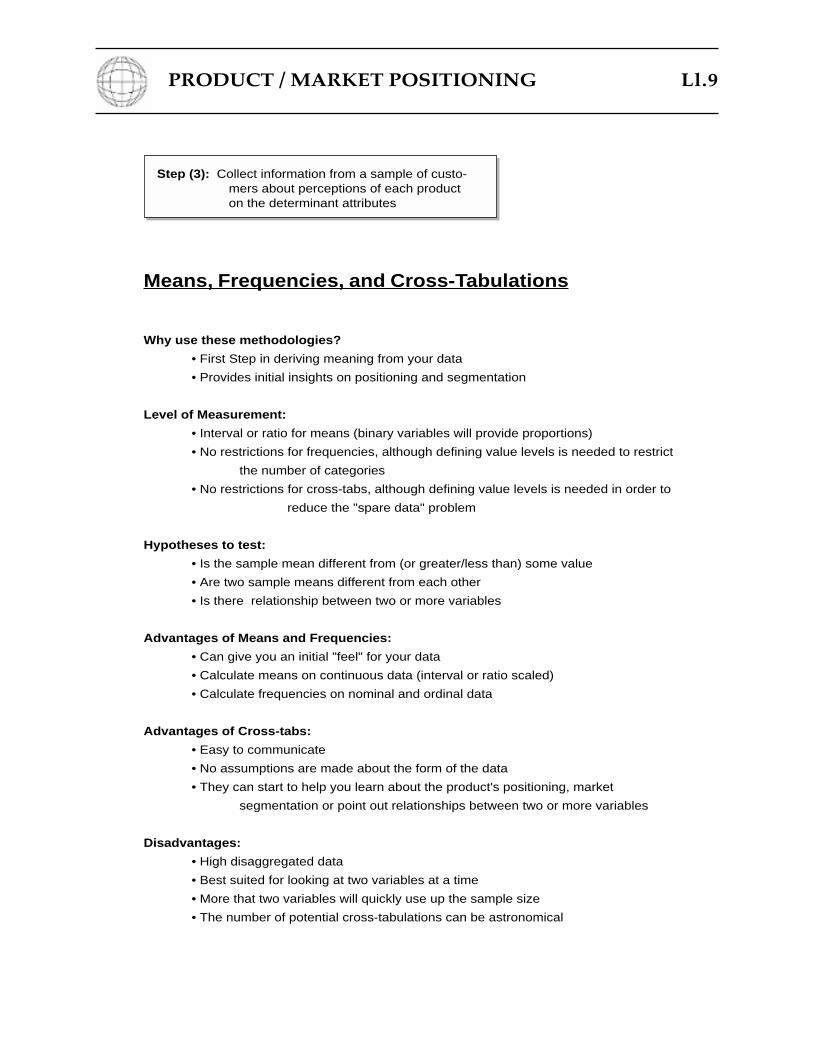
PRODUCT / MARKET POSITIONING Ll.9
Step (3): Collect information from a sample of custo-mers about perceptions of each producton the determinant attributes
Means, Frequencies, and Cross-Tabulations
Why use these methodologies?
• First Step in deriving meaning from your data
• Provides initial insights on positioning and segmentation
Level of Measurement:
• Interval or ratio for means (binary variables will provide proportions)
• No restrictions for frequencies, although defining value levels is needed to restrict
the number of categories
• No restrictions for cross-tabs, although defining value levels is needed in order to
reduce the "spare data" problem
Hypotheses to test:
• Is the sample mean different from (or greater/less than) some value
• Are two sample means different from each other
• Is there relationship between two or more variables
Advantages of Means and Frequencies:
• Can give you an initial "feel" for your data
• Calculate means on continuous data (interval or ratio scaled)
• Calculate frequencies on nominal and ordinal data
Advantages of Cross-tabs:
• Easy to communicate
• No assumptions are made about the form of the data
• They can start to help you learn about the product's positioning, market
segmentation or point out relationships between two or more variables
Disadvantages:
• High disaggregated data
• Best suited for looking at two variables at a time
• More that two variables will quickly use up the sample size
• The number of potential cross-tabulations can be astronomical
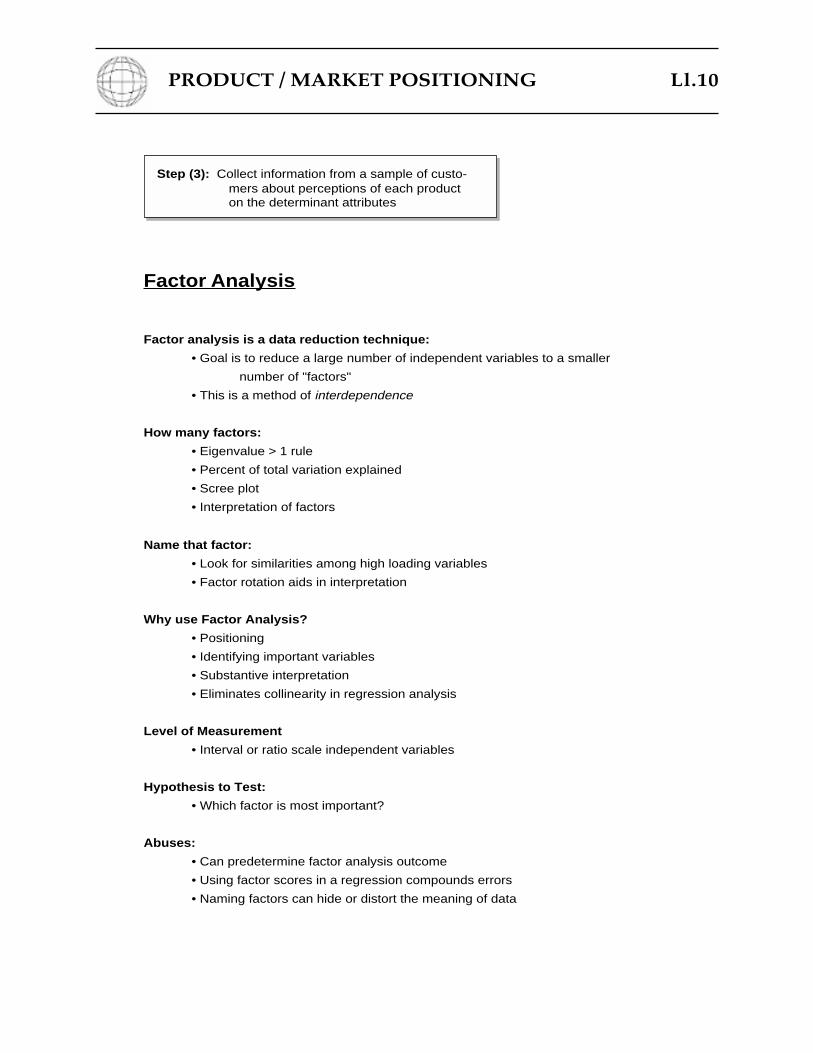
PRODUCT / MARKET POSITIONING Ll.10
Step (3): Collect information from a sample of custo-mers about perceptions of each producton the determinant attributes
Factor Analysis
Factor analysis is a data reduction technique:
• Goal is to reduce a large number of independent variables to a smaller
number of "factors"
• This is a method of interdependence
How many factors:
• Eigenvalue > 1 rule
• Percent of total variation explained
• Scree plot
• Interpretation of factors
Name that factor:
• Look for similarities among high loading variables
• Factor rotation aids in interpretation
Why use Factor Analysis?
• Positioning
• Identifying important variables
• Substantive interpretation
• Eliminates collinearity in regression analysis
Level of Measurement
• Interval or ratio scale independent variables
Hypothesis to Test:
• Which factor is most important?
Abuses:
• Can predetermine factor analysis outcome
• Using factor scores in a regression compounds errors
• Naming factors can hide or distort the meaning of data
PRODUCT / MARKET POSITIONING Ll.11
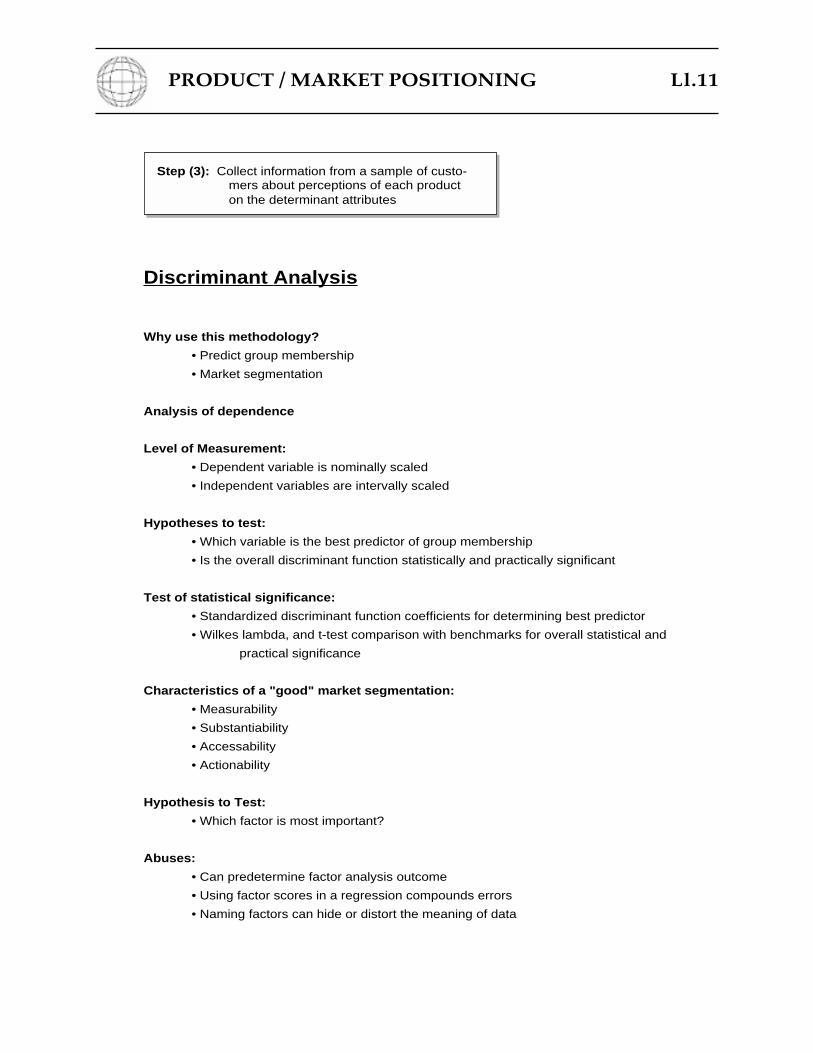
Step (3): Collect information from a sample of custo-mers about perceptions of each producton the determinant attributes
Discriminant Analysis
Why use this methodology?
• Predict group membership
• Market segmentation
Analysis of dependence
Level of Measurement:
• Dependent variable is nominally scaled
• Independent variables are intervally scaled
Hypotheses to test:
• Which variable is the best predictor of group membership
• Is the overall discriminant function statistically and practically significant
Test of statistical significance:
• Standardized discriminant function coefficients for determining best predictor
• Wilkes lambda, and t-test comparison with benchmarks for overall statistical and
practical significance
Characteristics of a "good" market segmentation:
• Measurability
• Substantiability
• Accessability
• Actionability
Hypothesis to Test:
• Which factor is most important?
Abuses:
• Can predetermine factor analysis outcome
• Using factor scores in a regression compounds errors
• Naming factors can hide or distort the meaning of data
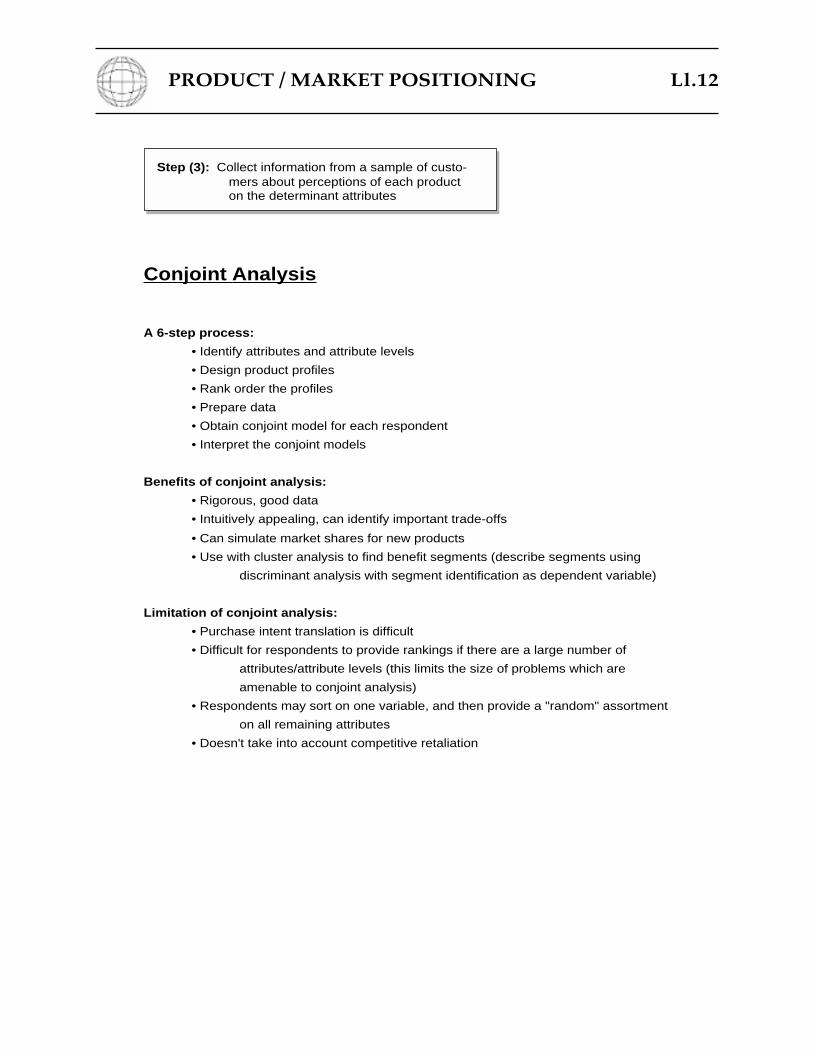
PRODUCT / MARKET POSITIONING Ll.12
Step (3): Collect information from a sample of custo-mers about perceptions of each producton the determinant attributes
Conjoint Analysis
A 6-step process:
• Identify attributes and attribute levels
• Design product profiles
• Rank order the profiles
• Prepare data
• Obtain conjoint model for each respondent
• Interpret the conjoint models
Benefits of conjoint analysis:
• Rigorous, good data
• Intuitively appealing, can identify important trade-offs
• Can simulate market shares for new products
• Use with cluster analysis to find benefit segments (describe segments using
discriminant analysis with segment identification as dependent variable)
Limitation of conjoint analysis:
• Purchase intent translation is difficult
• Difficult for respondents to provide rankings if there are a large number of
attributes/attribute levels (this limits the size of problems which are
amenable to conjoint analysis)
• Respondents may sort on one variable, and then provide a "random" assortment
on all remaining attributes
• Doesn't take into account competitive retaliation
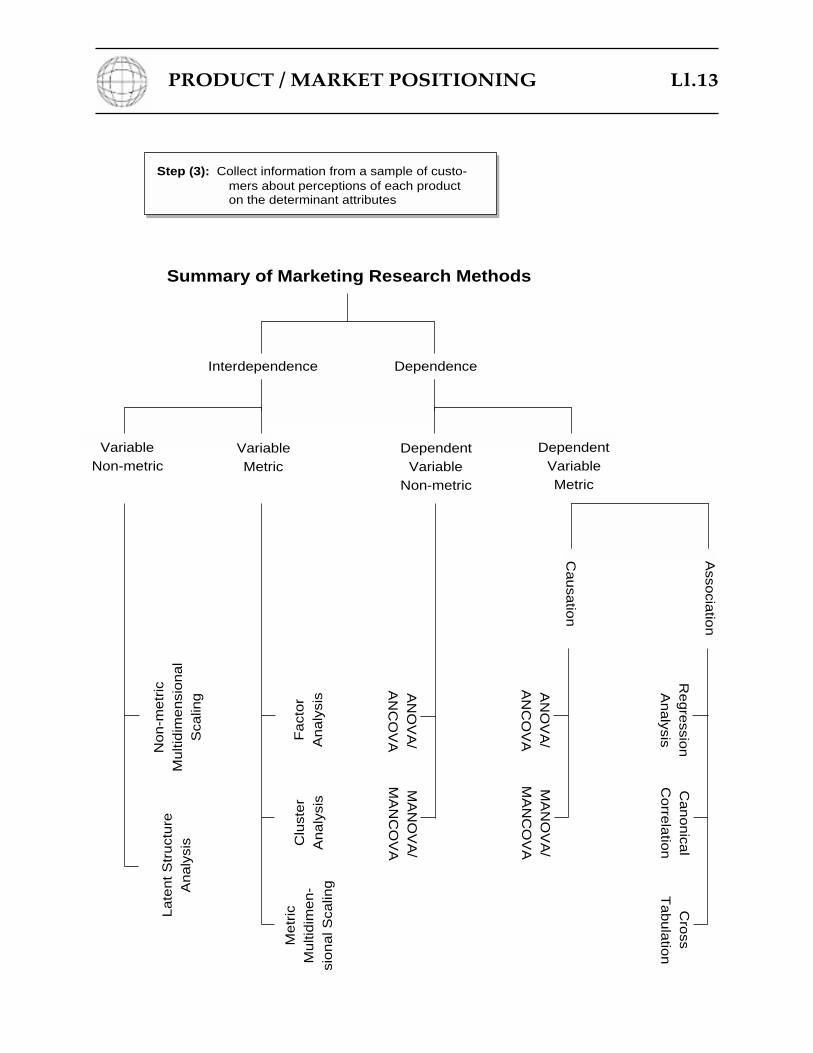
PRODUCT / MARKET POSITIONING Ll.13
Step (3): Collect information from a sample of custo-mers about perceptions of each producton the determinant attributes
Summary of Marketing Research Methods
DependenceInterdependence
DependentVariable
Non-metric
VariableMetric
DependentVariableMetric
Asso
ciatio
n
Regre
ssion
Analysis
Canonica
lC
orre
latio
nC
ross
Tabula
tion
Causa
tion
AN
OV
A/
AN
CO
VA
MA
NO
VA
/M
AN
CO
VA
AN
OV
A/
AN
CO
VA
MA
NO
VA
/M
AN
CO
VA
Fact
or
Analy
sis
Clu
ste
rA
naly
sis
Me
tric
Multi
dim
en-
sional S
calin
g
Late
nt S
truct
ure
Analy
sis
Non-m
etr
icM
ulti
dim
ensi
onal
Sca
ling
VariableNon-metric
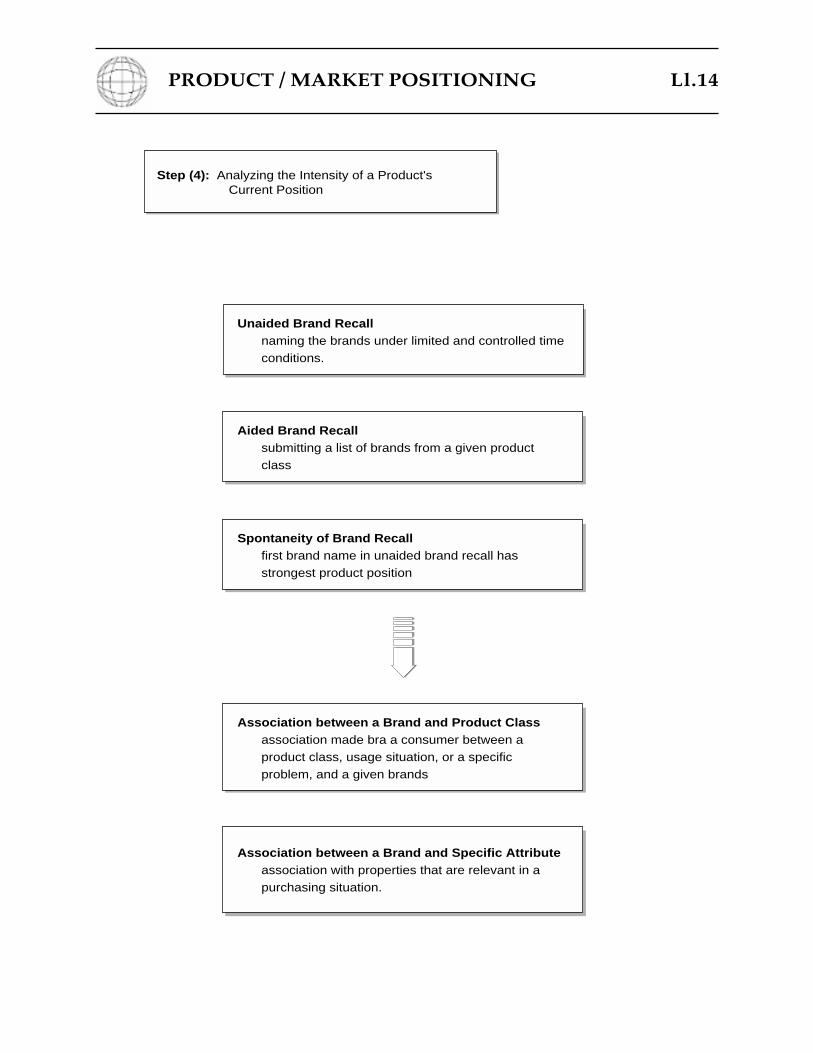
PRODUCT / MARKET POSITIONING Ll.14
Step (4): Analyzing the Intensity of a Product'sCurrent Position
Unaided Brand Recallnaming the brands under limited and controlled timeconditions.
Aided Brand Recallsubmitting a list of brands from a given productclass
Spontaneity of Brand Recallfirst brand name in unaided brand recall hasstrongest product position
Association between a Brand and Specific Attributeassociation with properties that are relevant in apurchasing situation.
Association between a Brand and Product Classassociation made bra a consumer between aproduct class, usage situation, or a specificproblem, and a given brands
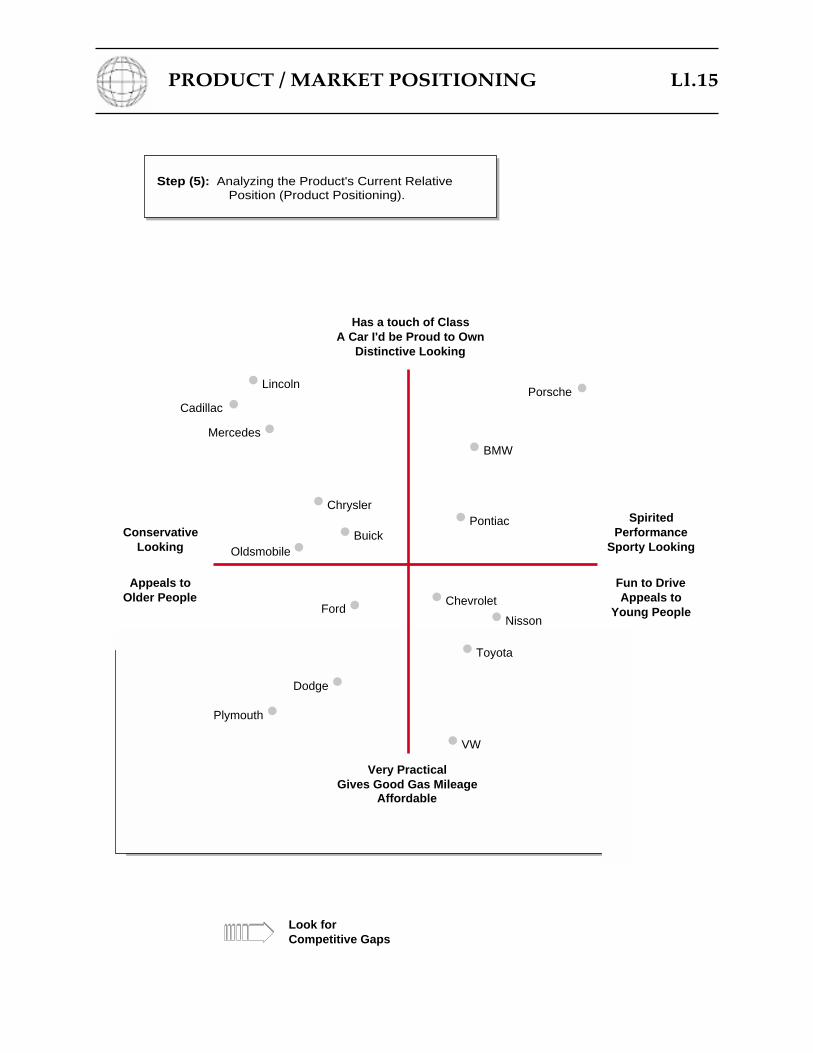
PRODUCT / MARKET POSITIONING Ll.15
Step (5): Analyzing the Product's Current RelativePosition (Product Positioning).
Plymouth
Dodge
Nisson
Toyota
VW
Very PracticalGives Good Gas Mileage
Affordable
PorscheCadillac
Mercedes
Oldsmobile
Ford
BMW
Pontiac
Chevrolet
Buick
Chrysler
Lincoln
SpiritedPerformance
Sporty Looking
Fun to DriveAppeals to
Young People
Appeals toOlder People
ConservativeLooking
Has a touch of ClassA Car I'd be Proud to Own
Distinctive Looking
Look forCompetitive Gaps
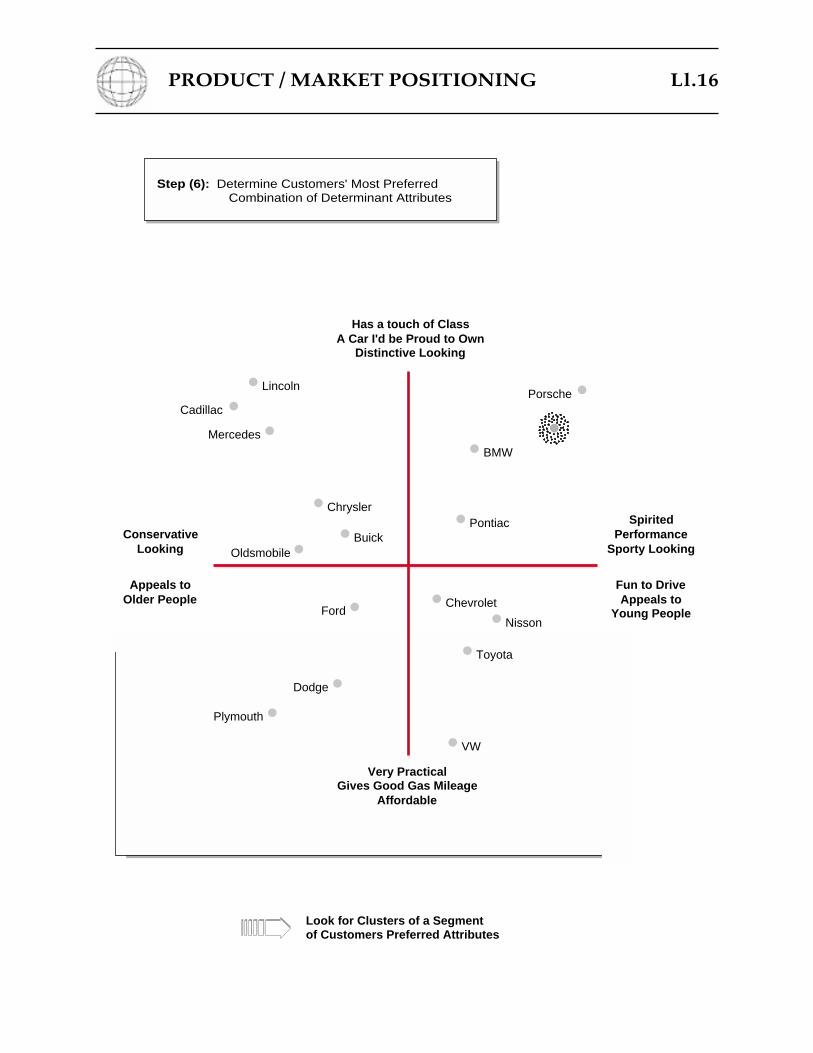
PRODUCT / MARKET POSITIONING Ll.16
Step (6): Determine Customers' Most PreferredCombination of Determinant Attributes
Plymouth
Dodge
Nisson
Toyota
VW
Very PracticalGives Good Gas Mileage
Affordable
PorscheCadillac
Mercedes
Oldsmobile
Ford
BMW
Pontiac
Chevrolet
Buick
Chrysler
Lincoln
SpiritedPerformance
Sporty Looking
Fun to DriveAppeals to
Young People
Appeals toOlder People
ConservativeLooking
Has a touch of ClassA Car I'd be Proud to Own
Distinctive Looking
Look for Clusters of a Segmentof Customers Preferred Attributes
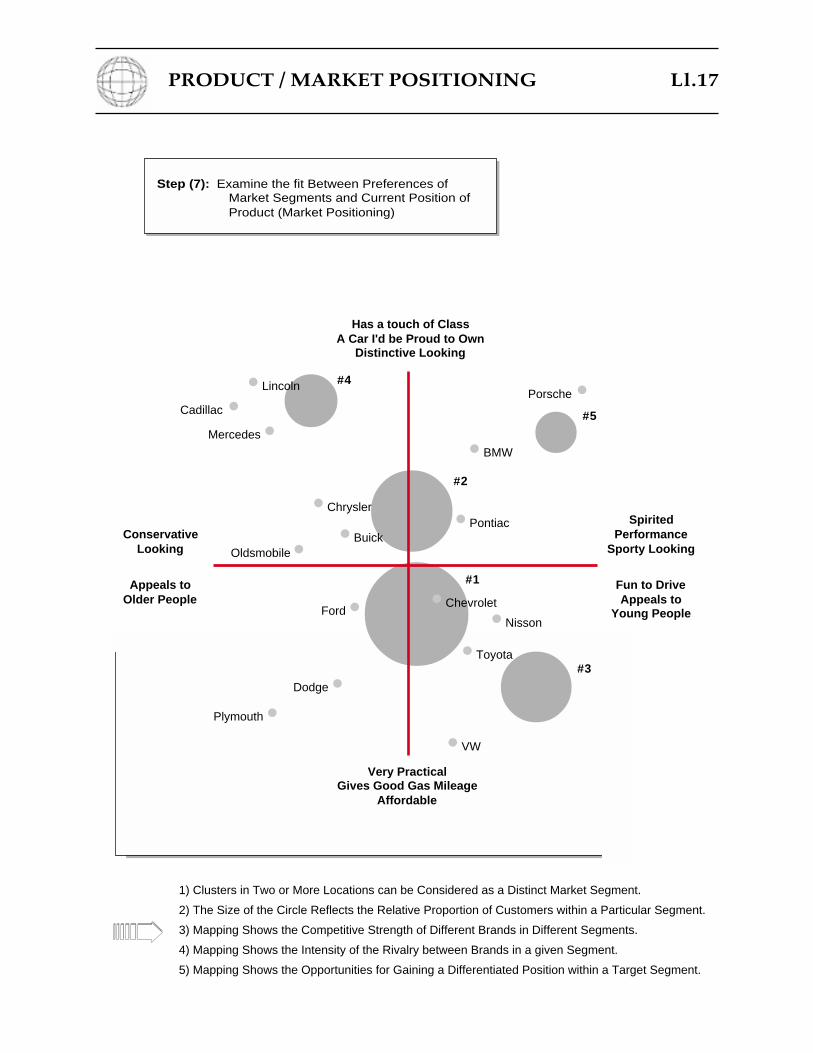
PRODUCT / MARKET POSITIONING Ll.17
Step (7): Examine the fit Between Preferences ofMarket Segments and Current Position ofProduct (Market Positioning)
Plymouth
Dodge
Nisson
Toyota
VW
Very PracticalGives Good Gas Mileage
Affordable
PorscheCadillac
Mercedes
Oldsmobile
Ford
BMW
Pontiac
Chevrolet
Buick
Chrysler
Lincoln
SpiritedPerformance
Sporty Looking
Fun to DriveAppeals to
Young People
Appeals toOlder People
ConservativeLooking
Has a touch of ClassA Car I'd be Proud to Own
Distinctive Looking
#5
#4
#2
#1
#3
1) Clusters in Two or More Locations can be Considered as a Distinct Market Segment.
2) The Size of the Circle Reflects the Relative Proportion of Customers within a Particular Segment.
3) Mapping Shows the Competitive Strength of Different Brands in Different Segments.
4) Mapping Shows the Intensity of the Rivalry between Brands in a given Segment.
5) Mapping Shows the Opportunities for Gaining a Differentiated Position within a Target Segment.
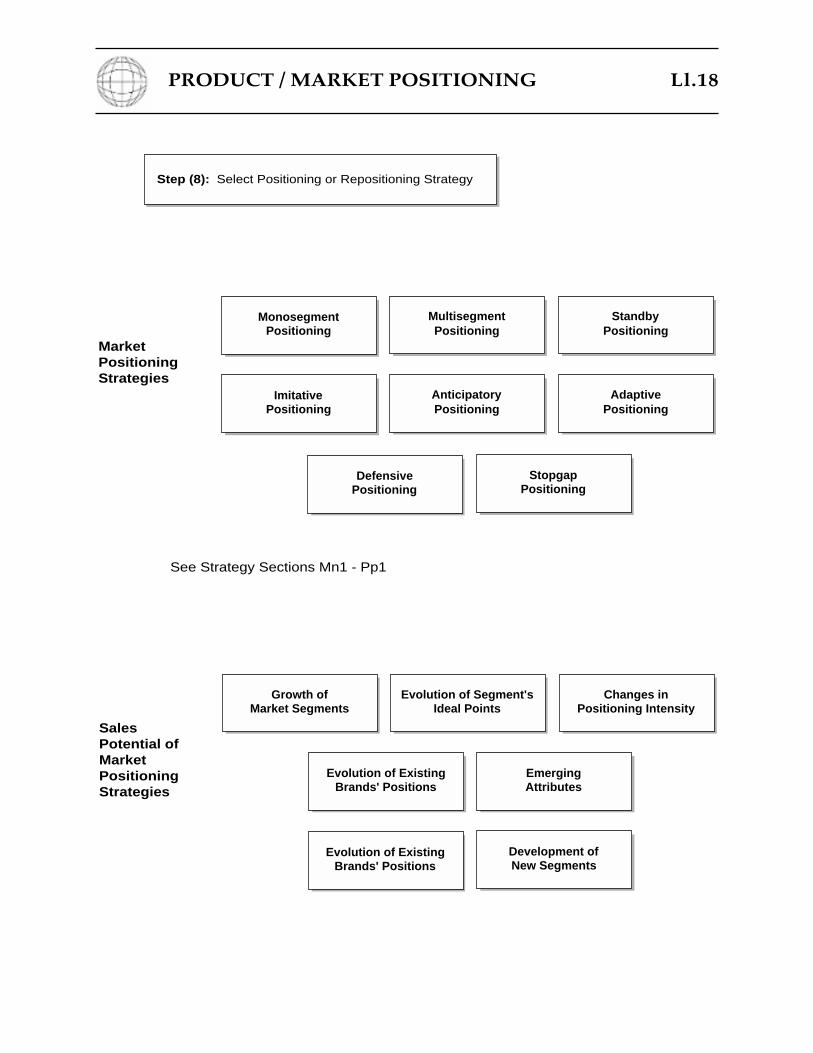
PRODUCT / MARKET POSITIONING Ll.18
Step (8): Select Positioning or Repositioning Strategy
Changes inPositioning Intensity
Evolution of Segment'sIdeal Points
Growth ofMarket Segments
StandbyPositioning
MultisegmentPositioning
MonosegmentPositioning
AdaptivePositioning
AnticipatoryPositioning
ImitativePositioning
EmergingAttributes
Evolution of ExistingBrands' Positions
Evolution of ExistingBrands' Positions
Development ofNew Segments
DefensivePositioning
StopgapPositioning
SalesPotential ofMarketPositioningStrategies
MarketPositioningStrategies
See Strategy Sections Mn1 - Pp1
PRODUCT / MARKET POSITIONING Ll.19
References
Page Ll.2: Marketing Strategy: Pages 208Richard D. Irwin: 1992Walker • Boyd • Larreche
Page Ll.2: Ibid. Pages 203-205Page Ll.3: Ibid. Pages 209-210Page Ll.4: Ibid. Pages 210-211
Author's Marketing Research Notes
Page Ll.5-12: Author's Marketing Research Notes
Page Ll.13: Marketing Strategy: Pages 212Richard D. Irwin: 1992Walker • Boyd • LarrecheMarketing Research Notes
Page Ll.14: Ibid. Pages 212-215Page Ll.15: Ibid. Pages 215-218Page Ll.16: Ibid. Page 218Page Ll.17: Ibid. Page 218-221Page Ll.18: Ibid. Page 221-226


![Decomposition-Based Optimal Market-Based Planning for ...proceedings.mlr.press/v15/hong11a/hong11a.pdf · problems of planning under uncertainty (e.g., [20]). Most market-based planning](https://img.pdfslide.us/doc/110x75/5f673487de10d676ce27d456/decomposition-based-optimal-market-based-planning-for-problems-of-planning-under.jpg)


![Strategic Market Planning [Compatibility Mode]](https://img.pdfslide.us/doc/110x75/577cd4941a28ab9e7898c598/strategic-market-planning-compatibility-mode.jpg)