Embed Size (px)
Citation preview
Chalmers University of Technology University of Gothenburg
Department of Computer Science and Engineering
Göteborg, Sweden, June 2011
Model of Agile Software Measurement: A Case Study
Master of Science Thesis in the Programme Software engineering and
Technology
JOHAN GUSTAFSSON
The Author grants to Chalmers University of Technology and University of Gothenburg
the non-exclusive right to publish the Work electronically and in a non-commercial
purpose make it accessible on the Internet.
The Author warrants that he/she is the author to the Work, and warrants that the Work
does not contain text, pictures or other material that violates copyright law.
The Author shall, when transferring the rights of the Work to a third party (for example a
publisher or a company), acknowledge the third party about this agreement. If the Author
has signed a copyright agreement with a third party regarding the Work, the Author
warrants hereby that he/she has obtained any necessary permission from this third party to
let Chalmers University of Technology and University of Gothenburg store the Work
electronically and make it accessible on the Internet.
Model of Agile Software Measurement: A Case Study
JOHAN GUSTAFSSON
© JOHAN GUSTAFSSON, June 2011.
Supervisor: ROBERT FELDT
Chalmers University of Technology
University of Gothenburg
Department of Computer Science and Engineering
SE-412 96 Göteborg
Sweden
Telephone + 46 (0)31-772 1000
Department of Computer Science and Engineering
Göteborg,Sweden
1
Abstract— This master thesis examines what type of
measurement should be conducted in agile software development.
The paradigm shift that agile methodology offers is in conflict
with traditional measurement approaches and there is a need to
clarify if and how measurement can benefit the agile practice. In
this paper we develop a model that addresses both performance
and process optimization measurement in agile processes. The
model is evaluated at bwin Games AB, a web game software
company based in Sweden. As a part of the evaluation, an agile
inspired measurement framework for implementation of cost-
efficient and flexible metrics is successfully tested. The study
shows that measurement can be beneficial for the agile practice,
but that careful consideration to dysfunctional behavior is
necessary.
Index Terms— Measurement, KPI, Metrics, Agile software
development, Lean software development, Process improvement
I. INTRODUCTION
UANTIFIABLE measurement has been described as the
major weakness of agile software development, while others
claim that measurement is an integral part of the agile practice
[1]. In today’s software development, traditional life cycle
processes such as the V model, are still predominant.
However, the adaption rate of the agile methodology is
increasing rapidly [2]. In any case, many organizations are looking for ways to let Key Performance Indicators (KPIs)
measure the performance of the agile software development
[3].
Traditional measurement does not account for the agile
culture, and it often leads to undesirable effects [4]. Resulting
in a need for a measurement approach that affirms and
reinforces the principles that agile is based upon.
Besides performance measurement, there is a demand for
measurement in the continuous improvement process [3, 5].
These types of metrics have a different character than the
KPIs. They diagnose specific problems and are intended for
occasional use.
What companies need is a quick, flexible and cost efficient
way to measure.
The Adaptable Measurement Framework
(AMF) particularly focuses on these aspects and is tested in
this research project [6]. The framework brings the principles
of agile into the measurement practice, providing a way to
develop flexible metrics to a low cost and just-in-time.
Combining the agile processes with the lean methodology is becoming increasingly popular in attempts to enhance the
agile methods [7]. In the past it has primarily been done by
removing waste. More recently the focus has changed to
optimizing the flow of the value chain. Particularly, the trend
in agile development applied in a large scale, is to adopt lean
software development’s end-to-end perspective [8]. In order to
account for this trend, it is important to consider the lean
principles in the recommendations about agile software
measurement.
To study the introduction of a measurement system in agile
software development, a case study is conducted at bwin Games. bwin Games is a poker network operator in a market
leading position. The company also has its own development
where their next generation of poker products is currently
developed using agile methods. bwin Games is a part of the
bwin.party group and has recently received its own profit-and-
loss responsibility.
To facilitate this transformation, they want to introduce
agile software measurement. Some KPIs are already
implemented. However, bwin Games are not sure if the KPIs
perform its function and measure the right things, nor are there
any measurements in the improvement efforts.
The purpose of this thesis is to reveal the best practices of agile software measurement and apply parts of it at bwin
Games. The goal is to understand how performance
measurement should be conducted in agile software
development and how measurement can facilitate the process
improvement effort.
Model of Agile Software Measurement:
A Case Study
Johan Gustafsson
Computer Science and Engineering. Chalmers University of Technology
Gothenburg, Sweden
Q
2
The intended audience of this paper can be divided into
three categories. The first category is managers and decision
makers in agile software development. The second category is
those who have an interest in process improvement. The last
category is those involved in the coordination of the set of
measurements performed in an organization, known as measurement systems.
The main research question is:
What type of performance and process optimization
measurement should be performed in agile software
development?
The report is structured as follows: Section II is a summary
of relevant theories. In Section III the research methodology is
described. Section IV presents the results and Section V
discusses the result’s validity. Finally, Section VI presents the
conclusions.
II. BACKGROUND
This section contains a brief description of relevant theories
and practices associated with agile measurement. To get a
common understanding of key concepts, some definitions are
first given.
A. Definitions
Hartmann and Dymond [3] propose a division between
long-term organizational performance measurement and
measurement that diagnose locally to achieve process
improvement.
Definition: Metric
“A measure or a combination of measures for quantitatively
assessing, controlling or improving a process, a product, a
team”[9]
Definition: Key Performance Indicator
“Quantifiable metrics which reflect the performance of an
organization in achieving its goals and objectives”[10]
Definition: Diagnostic
“A metric used to diagnose and improve the processes that
produce business value. What it measures might not have a
direct value to the customer.” [11]
The general term metric covers all types of measurement statistics, including both KPIs and diagnostics. KPIs are used
in the long-term performance measurement and measure the
value produced.
Diagnostics are used in the improvement efforts and
diagnose the resources that produce the value. Local
information needs can be met by the diagnostics and they are
intended for occasional use.
KPIs and diagnostics are complementary. The
organization’s performance is revealed by the KPIs. The
diagnostics can find improvement potential in attempts to
improve the KPI’s value. The effectiveness of the diagnostics
can then be judged by the effect they have on the KPIs. [3]
In order facilitate correct understanding of different types
of measurement the measurement practice should:
Communicate the definition of the different types of
metrics.
Communicate the difference between performance and
process optimization measurement.
Understand how the KPIs and diagnostics complement
each other. Table 1 Best practice checklist for facilitating the correct understanding of
different types of measurement. Based on the sources in this section.
B. Industrial Context
bwin Games is in a transition phase and the whole bwin group has merged with another large online gaming company.
The merge has introduced changes and uncertainty in the
organization. In addition, the technology department
performed a major reorganization with new management.
These factors made the thesis’ decision process slow and
ambiguous.
The thesis’ theoretical validation and strategic
recommendations are mainly done in collaboration with the
technology department’s process manager. The empirical
work is conducted at the unit that develops the poker client.
The unit follows the Scrum methodology and has three scrum teams composed of programmers, quality analysts and two
scrum masters.
C. Agile Software Development
Agile software development has emerged from the recent
years’ changes in the nature of software development [12].
The current software market is very volatile and requires flexible development methods. Traditional pre-defined and
plan-driven methods such as the waterfall model [13], often
fail to meet today’s dynamic market needs. Agile software
development recognizes that it is difficult for the customer to
know all the requirements upfront and instead takes an
empirical approach.
The methods included in the agile software development
such as Scrum [14] and Extreme Programming [15], have a
common basis in the Agile Manifesto and its principles[16].
The Agile Manifesto states [16]:
―We are uncovering better ways of developing software by
doing it and helping others do it. Through this work we have come to value:
Individuals and interactions over processes and tools
Working software over comprehensive documentation
Customer collaboration over contract negotiation
Responding to change over following a plan
That is, while there is value in the items on the right, we
value the items on the left more.‖
The principles behind the Agile Manifesto are [16]:
Our highest priority is to satisfy the customer
through early and continuous delivery of valuable software.
3
Welcome changing requirements, even late in
development. Agile processes harness change for
the customer's competitive advantage.
Deliver working software frequently, from a
couple of weeks to a couple of months, with a
preference to the shorter timescale.
Business people and developers must work
together daily throughout the project.
Build projects around motivated individuals.
Give them the environment and support they need,
and trust them to get the job done.
The most efficient and effective method of
conveying information to and within a development
team is face-to-face conversation.
Working software is the primary measure of progress.
Agile processes promote sustainable development.
The sponsors, developers, and users should be able to maintain a constant pace indefinitely.
Continuous attention to technical excellence
and good design enhances agility.
Simplicity the art of maximizing the amount
of work not done is essential.
The best architectures, requirements, and designs
emerge from self-organizing teams.
At regular intervals, the team reflects on how
to become more effective, then tunes and adjusts
its behavior accordingly.
The agile methods emphasize rapid feedback and use of
short iterations. The requirements evolve during the project in
collaboration with the customer and facilitated change
procedures. The teams should be self-organized and consist of
a cross-functional mix. The focus is on delivering customer
value, rather than compliance with a plan.
D. Scrum
Scrum is a management framework for the agile software
development and is used at bwin Games. The method is a
lightweight process and requires only a few sets of rules [17].
The intention is to be highly customizable, allowing it to be
combined with other methods such as Extreme Programming.
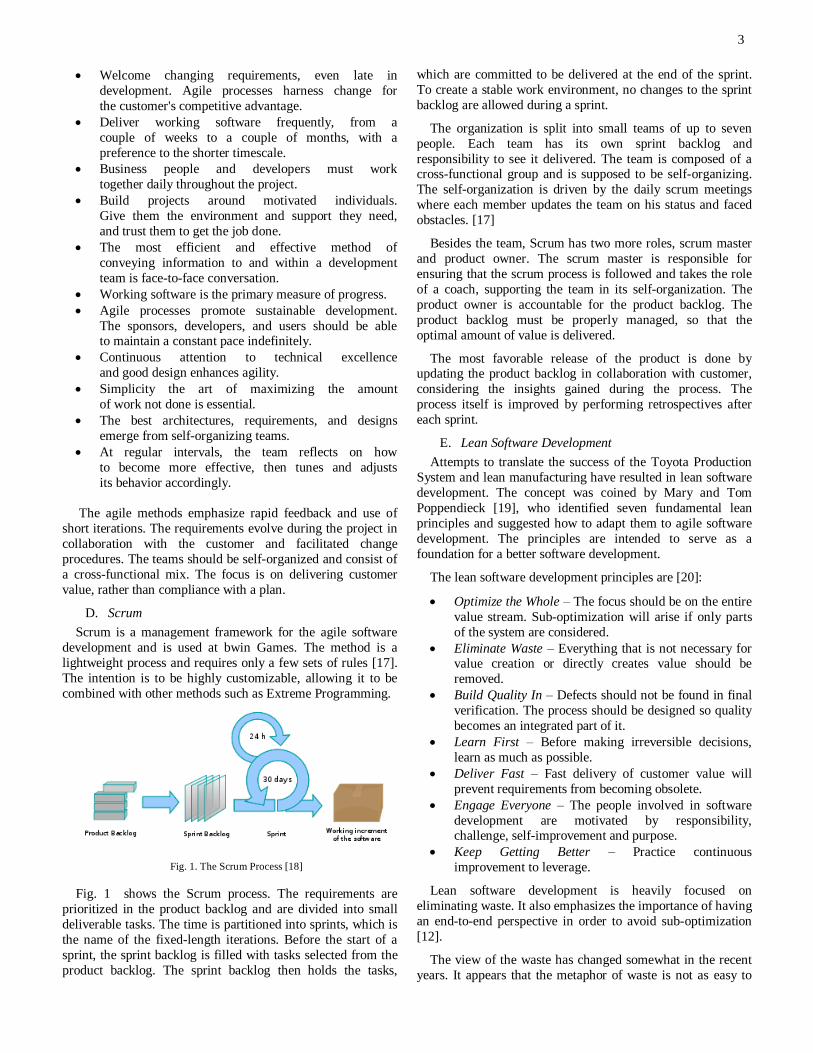
Fig. 1. The Scrum Process [18]
Fig. 1 shows the Scrum process. The requirements are
prioritized in the product backlog and are divided into small
deliverable tasks. The time is partitioned into sprints, which is
the name of the fixed-length iterations. Before the start of a
sprint, the sprint backlog is filled with tasks selected from the
product backlog. The sprint backlog then holds the tasks,
which are committed to be delivered at the end of the sprint.
To create a stable work environment, no changes to the sprint
backlog are allowed during a sprint.
The organization is split into small teams of up to seven
people. Each team has its own sprint backlog and
responsibility to see it delivered. The team is composed of a cross-functional group and is supposed to be self-organizing.
The self-organization is driven by the daily scrum meetings
where each member updates the team on his status and faced
obstacles. [17]
Besides the team, Scrum has two more roles, scrum master
and product owner. The scrum master is responsible for
ensuring that the scrum process is followed and takes the role
of a coach, supporting the team in its self-organization. The
product owner is accountable for the product backlog. The
product backlog must be properly managed, so that the
optimal amount of value is delivered.
The most favorable release of the product is done by updating the product backlog in collaboration with customer,
considering the insights gained during the process. The
process itself is improved by performing retrospectives after
each sprint.
E. Lean Software Development
Attempts to translate the success of the Toyota Production
System and lean manufacturing have resulted in lean software
development. The concept was coined by Mary and Tom
Poppendieck [19], who identified seven fundamental lean
principles and suggested how to adapt them to agile software
development. The principles are intended to serve as a
foundation for a better software development.
The lean software development principles are [20]:
Optimize the Whole – The focus should be on the entire
value stream. Sub-optimization will arise if only parts
of the system are considered.
Eliminate Waste – Everything that is not necessary for value creation or directly creates value should be
removed.
Build Quality In – Defects should not be found in final
verification. The process should be designed so quality
becomes an integrated part of it.
Learn First – Before making irreversible decisions,
learn as much as possible.
Deliver Fast – Fast delivery of customer value will
prevent requirements from becoming obsolete.
Engage Everyone – The people involved in software
development are motivated by responsibility, challenge, self-improvement and purpose.
Keep Getting Better – Practice continuous
improvement to leverage.
Lean software development is heavily focused on
eliminating waste. It also emphasizes the importance of having
an end-to-end perspective in order to avoid sub-optimization
[12].
The view of the waste has changed somewhat in the recent
years. It appears that the metaphor of waste is not as easy to
4
adapt to knowledge work [21]. Not everything that does not
have an immediate value to the customer can be removed as it
may be necessary for the implementation of value adding
activities. Instead, it has been proposed to interpret the waste
as cost and divide it into sub categories [11]. By using the
language of economy allows lean to be portrayed as more mature and makes it possible to assess whether the removal of
the waste is beneficial.
1) The importance of flow
The elimination of waste is still an important principle, but
the lean software development has changed to be more
focused on the end-to-end flow [22]. The flow of software
development is about how the requirements move through the
value chain. The flow is directly related to the overall goal of
the software development, i.e. making financial profit. The
profit is improved by increasing the throughput, requiring
shorter lead times.
The flow concept is strongly influenced by the general management philosophy Theory of Constraints (TOC). TOC is
about creating flow by identifying and elevating constraints in
the value chain. It emphasizes that the bottlenecks in the value
chain dictate the overall performance and that resources must
be focused on the constraint.
Alistair Cockburn explains how the requirement’s value
decay over time [23]. The requirements are based on business
decisions that on a volatile market easily can become invalid.
Therefore, it is important with short lead times. The inventory
management contributed to the success of lean manufacturing
[22]. In software the inventory is intangible information in the form of requirements, making it easier to neglect the
management of them. However, every line of code written in
an obsolete requirement is waste. The inventory piles up
quickly and creates queues. If the inventory is left unattended,
the flow will be disturbed and the risk that the requirements
become obsolete increases.
Reinertsen explains how today’s product development
orthodoxy in many ways interferes with the flow [22]. For
example, attempts to remove waste by maximizing the
capacity utilization has a serious risk to lead to a lower overall
throughput. He proposes the following possible solutions on
how to improve the flow of the product development:
Improve economic decisions. Quantified economy
allows the correct decisions in the development, see
Section II.F.
Manage queues. Unmanaged queues results in
increased lead time and prevent effective flow. The
queues should be controlled and measured, see Section
II.M.1).
Reduce batch size. Relates to management of queues.
Reduced batch size is proposed to be the most cost
effective way to reduce the queues.
Apply Work in Process (WIP) constraints. In the relative high variability that characterizes software
development WIP constraints is one way to control the
lead times, see Section II.E.3).
Accelerate feedback. Early transfer of information can
create significantly economic advantages. By using
leading indicators, proactive actions can be taken, see
Section II.F.
Manage flows in the presence of variability. Variability
should be judged on economic payoff functions and not
always be tried reduced.
Decentralize control. In product development problems and opportunities arise quickly, requiring short
response times. With a decentralized control they can
be addressed rapidly.
2) Comparison of Lean and Agile
Kai Petersen's carefully compares of lean and agile software
development and concludes that both paradigms agree on the
goals they want to achieve, i.e. the rapid delivery of customer
value [12]. The underlying principles are also shared to a large
extent.
The main difference is that lean has more focus on end-to-
end flow. As lean software development has been developed with agile in mind it has adopted many agile practices and
added a few of its own, mainly practices regarding the flow.
Generally, they are highly overlapping and are able to
complete each other. Petersen notes in particular that there is
potential for the benefit of the industry to adopt the end-to-end
perspective.
Because of their complementary nature and common goals,
this thesis does not distinguish between agile and lean, in
terms of recommendations on measurement.
3) Kanban
Kanban is a lean software development method [21]. It
prescribes a small set of rules, which primarily concerns the maintenance of the flow [17]. The original Kanban system
comes from the manufacturing sector and is a pull system
where work is drawn from preceding links in the value chain.
The Kanban method applied to software development is built
around limiting the WIP in various stages of the process. For
example, the testers signal the developers when their WIP
allows more work. In addition, the workflow should be
visualized and the primary metric of success is the lead time.
F. The Purpose of Measurement and the Importance of
Economics
The fundamental purpose of a measurement system is to provide feedback. Parameters are measured with the ambition
to increase the chances of achieving a given goal. However,
one of the main goals of the measurement system can to
influence the economy [22].
In order to influence the economy, the important parameters
to measure are those affecting the economy the most.
However, parameters with a less economic influence cannot
be left unattended, because if they deviate too much they will
have an economic impact.
For the measurement system to influence the overall
economy, proxy variables such as quality can be measured.
Proxy variables indicate no direct financial outcome but have a strong relation to it. With the aid of economic transfer
functions, proxy variables can be converted to a common
value of economic profit.
5
The transformation to a single unit of measurement is
important because the proxy variables interact with each other.
If the proxy variables do not have transfer functions, the risk is
that the measurements will lead to sub-optimization. The
transfer functions seek to ensure that there is a global
optimization taking place and that proper tradeoffs can be made.
The proxy variables should be selected on their economic
influence, but also by how effectively they can be controlled.
For example, the unit price can have a major impact on the
economy. However, if the market price is regulated there is no
effective way to affect the variable.
The metrics of a measurement system are in most cases
proxy variables [22]. In the selection of the metrics, the
economic influence and control efficiency should be taken
into account. In addition, Reinertsen further provides criteria.
The metrics should ideally be simple and leading indicators.
Simple metrics are preferable because they are easy to understand and generate. Leading metrics that predict trends
are more valuable for managers than lagging metrics, which
only communicate what has already happened.
Anderson also stresses the importance of economy in his
work with throughput accounting [11], see Section II.K. He
notes that not too much effort should be made to calculate the
exact figures, which often leads to failure and waste. It is
better to be content with imprecision. The information is
usually good enough anyway. Furthermore, he believes that
the software development gains from speaking the economic
language by being able to communicate better with senior management and gain credibility.
In order to keep an economic perspective the measurement
practice should: Measure the parameters that influence the economy the
most.
Not leave less economically relevant parameters
unattained.
Use economic transfer functions for proxy variables.
Use simple, actionable and leading metrics. Table 2 Best practice checklist for keeping an economic perspective in
measurement. Based on the sources in this section.
G. Dysfunction in Measurement Systems
As explained in Section II.F, the idea of a measurement
system is to measure a parameter in the hopes of improving a
goal. Dysfunction is when the value of a parameter improves,
but the value of a goal declines. Austin [24] separates the
measurement by its intent and makes a distinction between motivating and informative measurement. The motivational
measurement intends to provoke an organizational beneficial
behavior among those being measured. In contrast,
informational measurement is only used to gain insights.
Austin believes that motivational measurement has a high
risk to lead to dysfunction, particularly if applied to
knowledge work in the software industry where it is difficult
to measure all relevant aspects of the work. The main cause of
dysfunction is that the employee knows he is measured and
will find ways to "game" the numbers. He begins to focus on
what is measured, resulting in descending effort to the work
with intangible unmeasureable values. The mix of activities
between the separate tasks becomes strayed away from what is
optimal for the customer's value.
Pure informative measurement should in theory not lead to dysfunction. However, informational measurement often
suffers dysfunction because the workers are cynical and
expect to be judged by the metrics.
To avoid dysfunction, Austin suggests applying primarily
informational measurement used in conjunction with a high
level of trust in the organization and ―hard-to-game‖ metrics.
Poppendieck observe that setting targets for the
measurements face the same risk as motivational measurement
[25]. Setting targets has for long been taught at business
schools as a way to motivate the employees. However, if the
goals are unattainable the employees will still be motivated to
achieve them and dysfunctional behavior emerges to reach the target.
In order to avoid dysfunction the measurement practice
should: Be informational rather than motivational.
Use ―hard-to-game‖-metrics
Be conducted in an organization with a high level of trust.
Involve employees in the design of the measurement
system.
Avoid setting targets or at least use them carefully.
Table 3 Best practice checklist to avoid dysfunction. Based on the sources
in this section.
H. Developers resistance to metrics
The problem with dysfunction in measurement systems has
created a great resistance to metrics among developers. Medha
Umarji has studied this phenomenon and states that one major
factor to the high failure rate of measurement systems is social and organizational issues [26].
To facilitate the acceptance of metrics in the organization, it
is vital to use the metrics in the decision making and show an
improved organizational performance [27]. In order to get the
metrics as a part of the decision making, it is important to
carry out the data collection and analysis systematically.
Using metrics for comparison between projects and teams is
being promoted as the major cause of gaming of the metrics
[28]. Employees start reporting falsely adjusted metrics
because they feel threatened by the comparison. Another
reason for gaming is the threat employees feel that the metrics will be used against them [29]. The resistance will decrease
dramatically when they are assured that this is not the case.
The resistance decreases further if the employees are
involved in the development of the measurement system and
feel in control of the metrics [30]. The participants in the data
collection must believe that the data is accurate, represent the
reality and is not altered for managerial purposes. Because of
the employee’s evasive attitude toward metrics and low
6
motivation, many studies sees the benefit of automating the
data collection [30].
Exactly how to gain acceptance and prevent gaming is
organization specific [26]. The solutions must be tailored for
each corporate context.
I. Agile Measurement Principles
Poppendieck [19] mentions Austin’s work when writing
about performance measurement. With dysfunction and lean's
fear of sub-optimization in mind, they propose the concept of
Measure-Up. The concept is not to measure the performance
lower than at the team level. Measurements at lower levels
increase the risk of dysfunction and conflict with the lean principle to optimize across the whole.
A related concept to Measure-Up is Value-Up [31]. It gives
a good insight into how to measure and why not traditional
effort based metrics work. The agile metrics should support
the agile paradigm shift. This change the focus from a ―work-
down‖-attitude related to task completion and conformance, to
a ―value-up‖- attitude that concentrates on customer value.
The concept is that only deliverables of customer value are
counted. The flow of the value chain is to be measured and
intermediate metrics treated skeptically.
Appleton notes that Measure-Up and Value-Up provide high level general theoretical advice, but lack detailed
implementation criteria [32]. Hartmann propose some more
specific heuristics for a good agile metric [3]:
Affirms and reinforces lean and agile principles
Measures outcome, not output
Follows trends, not numbers
Answer a particular question for a real person
Belongs to a small set of KPIs and diagnostics
Is easy to collect
Reveals, rather than conceals, its context and
significant variables
Provides fuel for meaningful conversation
Provides feedback on a frequent and regular basis
May measure Value or Process
Encourages ‖good-enough‖ quality
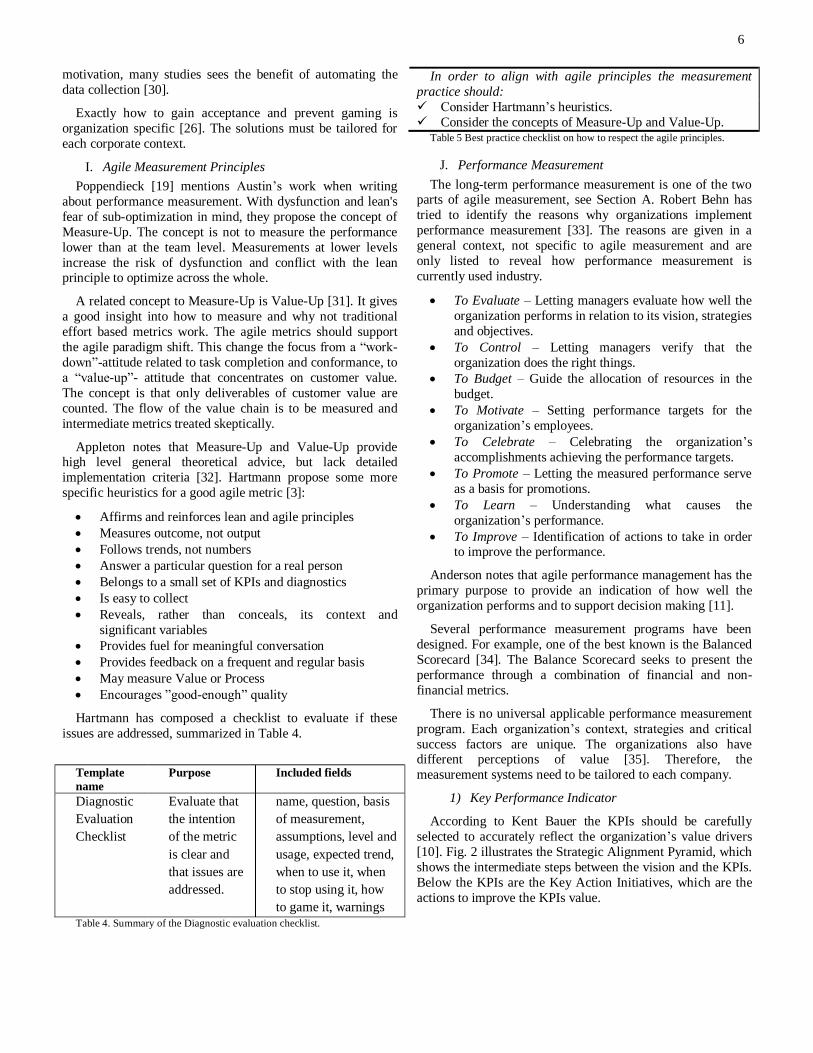
Hartmann has composed a checklist to evaluate if these
issues are addressed, summarized in Table 4.
Template
name
Purpose Included fields
Diagnostic
Evaluation
Checklist
Evaluate that
the intention
of the metric
is clear and
that issues are
addressed.
name, question, basis
of measurement,
assumptions, level and
usage, expected trend,
when to use it, when
to stop using it, how
to game it, warnings
Table 4. Summary of the Diagnostic evaluation checklist.
In order to align with agile principles the measurement
practice should:
Consider Hartmann’s heuristics.
Consider the concepts of Measure-Up and Value-Up. Table 5 Best practice checklist on how to respect the agile principles.
J. Performance Measurement
The long-term performance measurement is one of the two parts of agile measurement, see Section A. Robert Behn has
tried to identify the reasons why organizations implement
performance measurement [33]. The reasons are given in a
general context, not specific to agile measurement and are
only listed to reveal how performance measurement is
currently used industry.
To Evaluate – Letting managers evaluate how well the
organization performs in relation to its vision, strategies
and objectives.
To Control – Letting managers verify that the
organization does the right things.
To Budget – Guide the allocation of resources in the
budget.
To Motivate – Setting performance targets for the
organization’s employees.
To Celebrate – Celebrating the organization’s
accomplishments achieving the performance targets.
To Promote – Letting the measured performance serve
as a basis for promotions.
To Learn – Understanding what causes the
organization’s performance.
To Improve – Identification of actions to take in order to improve the performance.
Anderson notes that agile performance management has the
primary purpose to provide an indication of how well the
organization performs and to support decision making [11].
Several performance measurement programs have been
designed. For example, one of the best known is the Balanced
Scorecard [34]. The Balance Scorecard seeks to present the
performance through a combination of financial and non-
financial metrics.
There is no universal applicable performance measurement
program. Each organization’s context, strategies and critical
success factors are unique. The organizations also have different perceptions of value [35]. Therefore, the
measurement systems need to be tailored to each company.
1) Key Performance Indicator
According to Kent Bauer the KPIs should be carefully
selected to accurately reflect the organization’s value drivers
[10]. Fig. 2 illustrates the Strategic Alignment Pyramid, which
shows the intermediate steps between the vision and the KPIs.
Below the KPIs are the Key Action Initiatives, which are the
actions to improve the KPIs value.
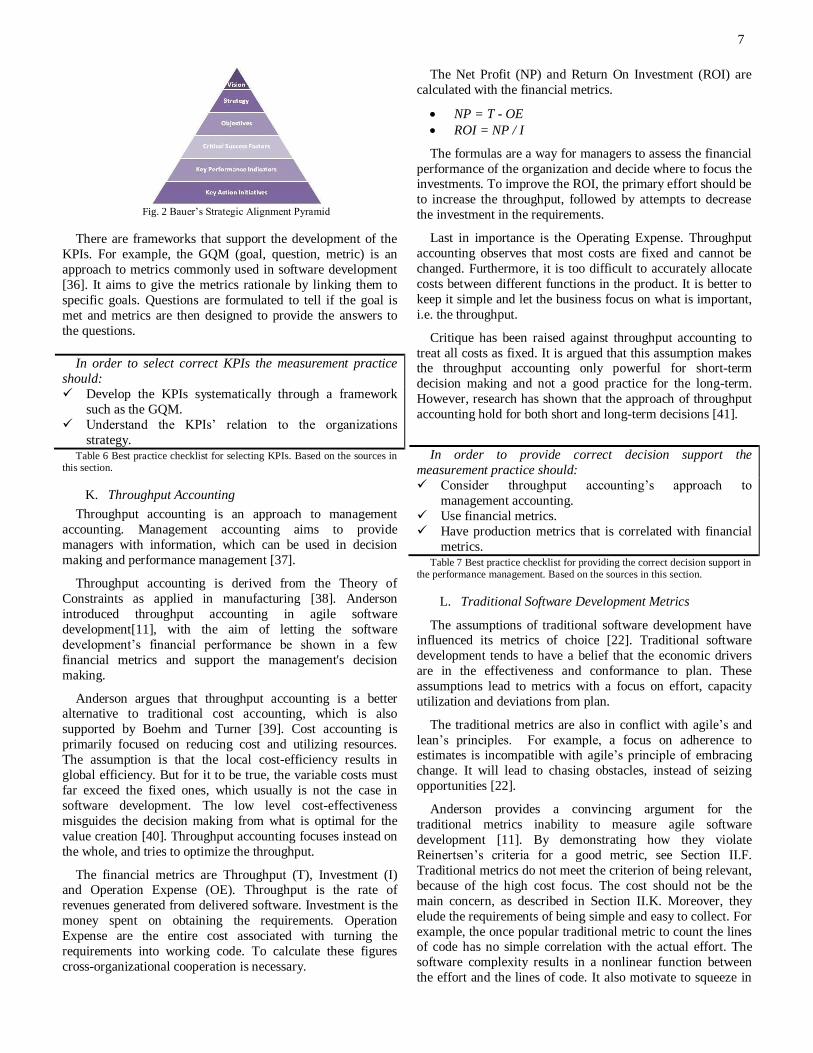
7
Fig. 2 Bauer’s Strategic Alignment Pyramid
There are frameworks that support the development of the
KPIs. For example, the GQM (goal, question, metric) is an
approach to metrics commonly used in software development
[36]. It aims to give the metrics rationale by linking them to
specific goals. Questions are formulated to tell if the goal is
met and metrics are then designed to provide the answers to
the questions.
In order to select correct KPIs the measurement practice
should:
Develop the KPIs systematically through a framework
such as the GQM.
Understand the KPIs’ relation to the organizations
strategy. Table 6 Best practice checklist for selecting KPIs. Based on the sources in
this section.
K. Throughput Accounting
Throughput accounting is an approach to management
accounting. Management accounting aims to provide
managers with information, which can be used in decision
making and performance management [37].
Throughput accounting is derived from the Theory of
Constraints as applied in manufacturing [38]. Anderson
introduced throughput accounting in agile software
development[11], with the aim of letting the software
development’s financial performance be shown in a few
financial metrics and support the management's decision
making.
Anderson argues that throughput accounting is a better alternative to traditional cost accounting, which is also
supported by Boehm and Turner [39]. Cost accounting is
primarily focused on reducing cost and utilizing resources.
The assumption is that the local cost-efficiency results in
global efficiency. But for it to be true, the variable costs must
far exceed the fixed ones, which usually is not the case in
software development. The low level cost-effectiveness
misguides the decision making from what is optimal for the
value creation [40]. Throughput accounting focuses instead on
the whole, and tries to optimize the throughput.
The financial metrics are Throughput (T), Investment (I) and Operation Expense (OE). Throughput is the rate of
revenues generated from delivered software. Investment is the
money spent on obtaining the requirements. Operation
Expense are the entire cost associated with turning the
requirements into working code. To calculate these figures
cross-organizational cooperation is necessary.
The Net Profit (NP) and Return On Investment (ROI) are
calculated with the financial metrics.
NP = T - OE
ROI = NP / I
The formulas are a way for managers to assess the financial
performance of the organization and decide where to focus the investments. To improve the ROI, the primary effort should be
to increase the throughput, followed by attempts to decrease
the investment in the requirements.
Last in importance is the Operating Expense. Throughput
accounting observes that most costs are fixed and cannot be
changed. Furthermore, it is too difficult to accurately allocate
costs between different functions in the product. It is better to
keep it simple and let the business focus on what is important,
i.e. the throughput.
Critique has been raised against throughput accounting to
treat all costs as fixed. It is argued that this assumption makes the throughput accounting only powerful for short-term
decision making and not a good practice for the long-term.
However, research has shown that the approach of throughput
accounting hold for both short and long-term decisions [41].
In order to provide correct decision support the
measurement practice should:
Consider throughput accounting’s approach to
management accounting.
Use financial metrics.
Have production metrics that is correlated with financial
metrics. Table 7 Best practice checklist for providing the correct decision support in
the performance management. Based on the sources in this section.
L. Traditional Software Development Metrics
The assumptions of traditional software development have influenced its metrics of choice [22]. Traditional software
development tends to have a belief that the economic drivers
are in the effectiveness and conformance to plan. These
assumptions lead to metrics with a focus on effort, capacity
utilization and deviations from plan.
The traditional metrics are also in conflict with agile’s and
lean’s principles. For example, a focus on adherence to estimates is incompatible with agile’s principle of embracing
change. It will lead to chasing obstacles, instead of seizing
opportunities [22].
Anderson provides a convincing argument for the
traditional metrics inability to measure agile software
development [11]. By demonstrating how they violate
Reinertsen’s criteria for a good metric, see Section II.F.
Traditional metrics do not meet the criterion of being relevant,
because of the high cost focus. The cost should not be the
main concern, as described in Section II.K. Moreover, they
elude the requirements of being simple and easy to collect. For
example, the once popular traditional metric to count the lines of code has no simple correlation with the actual effort. The
software complexity results in a nonlinear function between
the effort and the lines of code. It also motivate to squeeze in

8
as much code as possible, which is far from optimal for the
system [25].
Since the traditional metrics are developed for a paradigm
that agile software development is a response to, new ways of
measuring are needed.
M. Agile and Lean Software Development Production Metrics
In order to run the business side of the development,
Anderson argues that the metrics needed are the financial ones
found in throughput accounting, see Section II.K [11]. When
measuring the production side of the development it is
important to select metrics that support and reflect the financial counterparts [40]. Table 8 holds the most commonly
recommended agile production metrics, which are described in
the following sections.
Category Metric
Quality Defect Count
Technical Debt
Faults-Slip-Through
Predictability Velocity
Running Automated Tests
Value Customer Satisfaction Survey
Business Value Delivered
Lean Lead Time
Work In Progress
Queues
Cost Average Cost Per Functions Table 8 Commonly recommended agile production metrics.
1) Lean Metrics
The selection of production metrics must carefully consider
what has been advised in the previous sections. Inventory
based metrics possess all these characteristics and give the
advantage of addressing the importance of flow, see Section
II.E.1). The most significant inventory based metrics are summarized below [11, 22].
Lead time – Relates to the financial metric Throughput.
The lead time should be as short and stable as possible.
It reduces the risk that the requirements become
outdated and provides predictability. The metric is
supported by Poppendieck, who states that the most
important to measure is the ―concept-to-cash‖-time
together with financial metrics [42]
Queues – In software development queue time is a
large part of the lead time. In contrast to the lead time,
queue metrics are leading indicators. Large queues
indicate that the future lead time will be long, which enables preventive actions. By calculating the cost of
delay of the items in the queues, precedence can be
given to the most urgent ones.
Work in Progress – Constraining the WIP in different
phases is one of the best ways to prevent large queues.
If used in combination with queue metrics, WIP
constraints prevent dysfunctional behavior such as
simply renaming the objects in queues to work in
progress. The metric is also an indicator of how well
the team collaborates [43]. A low WIP shows that the
team works together on the same tasks. In addition, the
Kanban method, which is built around the idea of
constraining the WIP promises that it will result in an
overall better software development, see Section
II.E.3).
These metrics can be visualized in a cumulative flow
diagram, see Section II.N. By tracking the investment’s way
along the value chain towards becoming throughput, the
inventory based metrics correlates well with the financial
metric Investment.
2) Cost Metrics
Anderson argues the only cost metric needed is Average
Cost Per Function (ACPF) and should only be used to estimate
future operation expenses [11].
3) Business Value Metrics
Agile software development puts the focus on the delivery
of business value. Methods such as Scrum prioritize the work by value, making it sensible to measure the business value. It
has also been observed that the trend in the industry is to
measure value [35].
Hartmann notes that agile methods encourage the
development to be responsible for delivering value rapidly and
that the core metric should oversee this accountability. The
quick delivery of value means that the investment is converted
into value producing software as soon as possible.
Leading metrics of business value includes estimations and
is not an exact science. Mike Cohn offers a possible solution
to measure the business value [44], which involves dividing the business case’s value between the tasks. The delivery of
value can be displayed in a Business Value Burnup Chart, see
Section II.N.
One way to verify the delivery of business value, is to ask
the customer if the features are actually used [43]. It has
proved useful to survey the customer over the time of a release
and is much in line with the agile principle of customer
cooperation.
4) Quality Metrics
Lean metrics can indicate the products’ quality and provide
predictability. For example, large queues in the
implementation phase indicate poor quality and a stable lead time contributes to predictability. However, it might be
necessary to supplement and balance them with more specific
metrics.
A quality metric recommended by the agile community is
Technical Debt [4]. Technical debt is a metaphor referring to
the consequences of taking shortcuts in the software
development. For example, code written in haste that is in
need of refactoring. The debt can be represented in financial
figures, which makes the metric suitable to communicate to
upper management [45].
The counting of defects can be used as a quality metric. The defect count may occur in various stages of the development.
9
Counting defects in individual iterations can have a fairly
large variation and may paint a misleading picture [35].
Another aspect of defects is where they have been
introduced. The fault-slips-through metric measures the test
efficiency by where the defects should have been found and
where it actually was [46]. It monitors how well the test process works and addresses the cost savings of finding
defects early. In case studies on implementation of lean
metrics, the faults-slip-through has been recommended as the
quality metric of choice [47].
5) Predictability Metrics
What many organizations hope to gain from the
measurement is predictability [8, 43]. In several of the agile
methods the velocity of delivered requirements is used to
achieve predictability and estimate the delivery capacity. The
average velocity can serve as a good predictability metric, but
can easily be gamed if used for other purposes. For example,
velocity used to measure productivity can degrade the quality.
Running Automated Tests measures the productivity by the
size of the product [48]. It counts test points defined as each
step in every running automated test. The belief is that the
number of tests written is better in proportion to the
requirement’s size, than the traditional lines-of-code metric.
The metric addresses the risk of neglected testing, which is
usually associated with productivity metrics. It motivates to
write tests and to design smaller, more adaptive tests.
Moreover, it has proven to be a good indicator of the
complexity and to some extent on the quality [43].
For measuring release predictability, Dean Leffingwell proposes to measure the projected value of each feature
relative to the actual [8]. However, the goal should not be to
achieve total adherence. Instead, the objective should be to
stay within a range of compliance to plan, which allows for
both predictability and capturing of opportunities.
N. Visualization
To get the full value of agile measurement, the metrics need
to be acted upon. The visualization of the metrics helps to
ensure that actions are taken and achieves transparency in the
organization [49]. The company’s strategies become
communicated and the coordination increases.
In Kanban the visualization of the workflow is an important activity and facilitates self-organizational behavior [21]. For
example, when a bottleneck is shown the employees tend to
work together to elevate the bottleneck.
Both Kanban and Scrum use card walls to visualize the
work flow where each card represents a task and its current
location in the value chain. The inventory based metrics can
then be collected using the card walls.
A very effective way to visualize the inventory based
metrics is cumulative flow diagrams [21-22, 50]. The
cumulative flow diagram is an area graph, which shows the
workflow on a daily basis. A single diagram can contain information about lead time, WIP, queues and bottlenecks.
In Scrum, the Burndown Chart is a standard artifact. It
allows the teams to monitor its progress and trends. The
Burndown Chart tracks completed stories and the estimated
remaining work. There are also variations of the Burndown
Chart [44]. For example, the Burnup Chart contains
information about scope changes. For even better predictability, story points may be used. The stories are
assigned points by the estimated effort to implement them.
To communicate the KPIs, many organizations use
Balanced Scorecards or Dashboards [49]. Balanced Scorecard
is briefly described in Section II.J. Dashboards are used to
effectively monitor, analyze and manage the organization’s
performance [49]. The level of detail of the dashboards varies,
ranging from graphical high-level KPIs to low-level data for
root cause analysis.
In order to communicate and facilitate that metrics are
acted upon the measurement practice should:
Visualize the metrics to achieve transparency.
Be careful to not create dysfunctional behavior with the
visualization. Table 9 Best practice checklist for visualization. Based on the sources in
this section.
O. Continuous Improvement
Kaizen is the Japanese word for continuous improvement
and is a part of the lean software development [51]. It is also
found in agile software development. For example, Scrum has
retrospectives after each sprint where improvements are
identified.
The retrospectives have similarities to Deming’s Plan-Do-
Check-Act (PDCA) [52]. The PDCA is a cycle of four phases,
which should drive the continuous improvement. What is
notable is that the PDCA prescribe measurement to verify that
improvements are achieved.
Petri Heiramo observes that the retrospectives lack measurements and argues that it can lead to undesirable results
[5]. Without any metrics, it will be difficult to determine
whether any targets have been met. This in turn can be
demoralizing for the commitment to the improvement efforts.
Heiramo, suggest that these three questions should be added to
the retrospective:
What benefit or outcome do we expect out of this
improvement/change?
How do we measure it?
Who is responsible for measuring it?
This thesis proposes that diagnostics can be used to obtain
these measurements, see Section IV.F.8).
In order for the diagnostics to achieve process improvement
the measurement practice should:
Be an integrated part of a process improvement
framework. Table 10 Best practice checklist for achieving process improvement with
the diagnostics. Based on the sources in this section.
10
P. Adaptable Measurement Framework
The entry point of this thesis was the Adaptable
Measurement Framework, developed in Marculesco’s master
thesis [6]. AMF is a framework that supports the measurement
for mainly local information needs in the software
development. It is designed to be as flexible as possible. The
aim is to develop diagnostics at low cost, good enough and
just-in-time. It attempts to translate agile's principles to the
world of measurement. The AMF comes with a set of existing
principles, which are inspired by agile.
The measurement’s owner is the decision maker – The
owner is the client that the measurement must satisfy. It is his information need that determines how long to
measure. As more information becomes available, he
might want to adjust the diagnostics to better fit the
new situation.
The measurement is not fixed – The diagnostics may be
changed as often as possible to better fit the current
information needs.
Do not ignore less conventional information sources –
As the agile approach favors individuals and
interactions over process and tools. It makes sense to
use individuals as data sources. They can many times provide timely good-enough information.
Focus on building competence for collecting
measurement within the company - Involving
employees in the design and collection of the
diagnostics ensure that the development process will be
an ongoing process and fits the company’s needs.
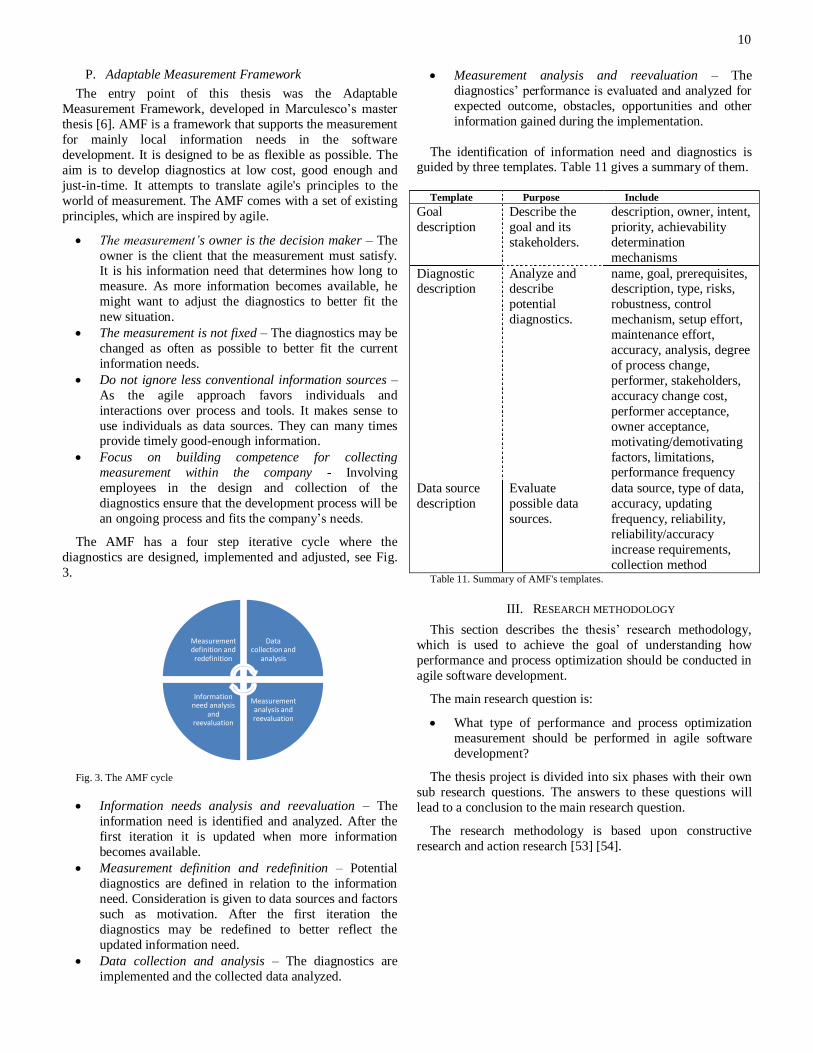
The AMF has a four step iterative cycle where the
diagnostics are designed, implemented and adjusted, see Fig.
3.
Fig. 3. The AMF cycle
Information needs analysis and reevaluation – The
information need is identified and analyzed. After the
first iteration it is updated when more information
becomes available.
Measurement definition and redefinition – Potential
diagnostics are defined in relation to the information
need. Consideration is given to data sources and factors
such as motivation. After the first iteration the
diagnostics may be redefined to better reflect the
updated information need.
Data collection and analysis – The diagnostics are
implemented and the collected data analyzed.
Measurement analysis and reevaluation – The
diagnostics’ performance is evaluated and analyzed for
expected outcome, obstacles, opportunities and other
information gained during the implementation.
The identification of information need and diagnostics is guided by three templates. Table 11 gives a summary of them.
Template Purpose Include
Goal
description
Describe the
goal and its
stakeholders.
description, owner, intent,
priority, achievability
determination
mechanisms
Diagnostic description
Analyze and describe
potential
diagnostics.
name, goal, prerequisites, description, type, risks,
robustness, control
mechanism, setup effort,
maintenance effort,
accuracy, analysis, degree
of process change,
performer, stakeholders,
accuracy change cost,
performer acceptance,
owner acceptance,
motivating/demotivating
factors, limitations, performance frequency
Data source
description
Evaluate
possible data
sources.
data source, type of data,
accuracy, updating
frequency, reliability,
reliability/accuracy
increase requirements,
collection method Table 11. Summary of AMF's templates.
III. RESEARCH METHODOLOGY
This section describes the thesis’ research methodology,
which is used to achieve the goal of understanding how
performance and process optimization should be conducted in
agile software development.
The main research question is:
What type of performance and process optimization
measurement should be performed in agile software
development?
The thesis project is divided into six phases with their own
sub research questions. The answers to these questions will
lead to a conclusion to the main research question.
The research methodology is based upon constructive
research and action research [53] [54].
Measurement definition and redefinition
Data collection and
analysis
Measurement analysis and reevaluation
Information need analysis
and reevaluation
11
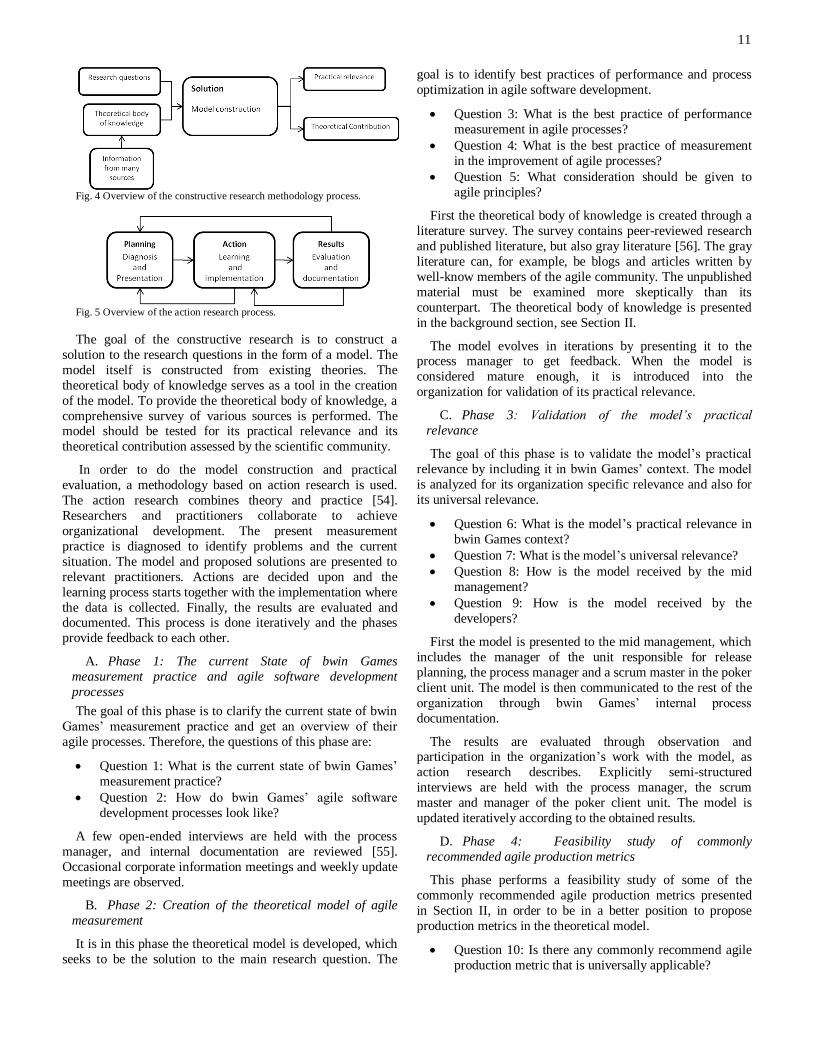
Fig. 4 Overview of the constructive research methodology process.
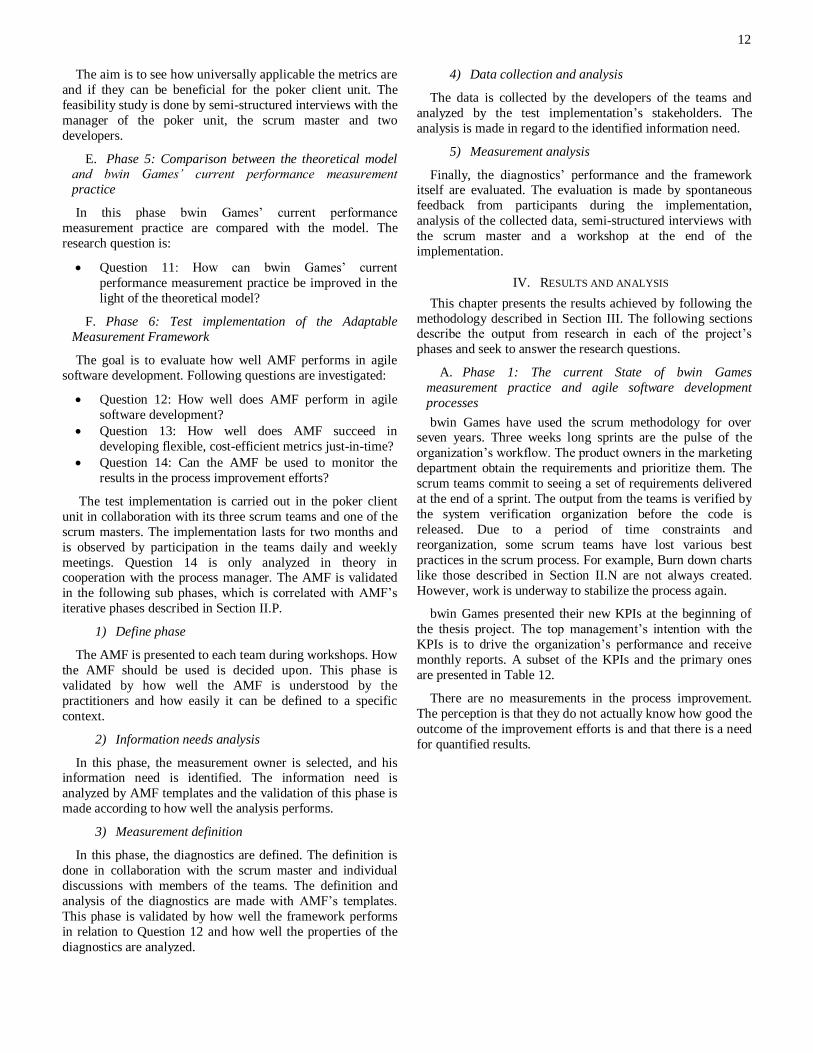
Fig. 5 Overview of the action research process.
The goal of the constructive research is to construct a
solution to the research questions in the form of a model. The
model itself is constructed from existing theories. The
theoretical body of knowledge serves as a tool in the creation
of the model. To provide the theoretical body of knowledge, a
comprehensive survey of various sources is performed. The model should be tested for its practical relevance and its
theoretical contribution assessed by the scientific community.
In order to do the model construction and practical
evaluation, a methodology based on action research is used.
The action research combines theory and practice [54].
Researchers and practitioners collaborate to achieve
organizational development. The present measurement
practice is diagnosed to identify problems and the current
situation. The model and proposed solutions are presented to
relevant practitioners. Actions are decided upon and the
learning process starts together with the implementation where
the data is collected. Finally, the results are evaluated and documented. This process is done iteratively and the phases
provide feedback to each other.
A. Phase 1: The current State of bwin Games
measurement practice and agile software development
processes
The goal of this phase is to clarify the current state of bwin
Games’ measurement practice and get an overview of their
agile processes. Therefore, the questions of this phase are:
Question 1: What is the current state of bwin Games’
measurement practice?
Question 2: How do bwin Games’ agile software
development processes look like?
A few open-ended interviews are held with the process
manager, and internal documentation are reviewed [55].
Occasional corporate information meetings and weekly update
meetings are observed.
B. Phase 2: Creation of the theoretical model of agile
measurement
It is in this phase the theoretical model is developed, which
seeks to be the solution to the main research question. The
goal is to identify best practices of performance and process
optimization in agile software development.
Question 3: What is the best practice of performance
measurement in agile processes?
Question 4: What is the best practice of measurement
in the improvement of agile processes?
Question 5: What consideration should be given to
agile principles?
First the theoretical body of knowledge is created through a
literature survey. The survey contains peer-reviewed research
and published literature, but also gray literature [56]. The gray
literature can, for example, be blogs and articles written by
well-know members of the agile community. The unpublished
material must be examined more skeptically than its
counterpart. The theoretical body of knowledge is presented
in the background section, see Section II.
The model evolves in iterations by presenting it to the process manager to get feedback. When the model is
considered mature enough, it is introduced into the
organization for validation of its practical relevance.
C. Phase 3: Validation of the model’s practical
relevance
The goal of this phase is to validate the model’s practical
relevance by including it in bwin Games’ context. The model
is analyzed for its organization specific relevance and also for
its universal relevance.
Question 6: What is the model’s practical relevance in
bwin Games context?
Question 7: What is the model’s universal relevance?
Question 8: How is the model received by the mid
management?
Question 9: How is the model received by the
developers?
First the model is presented to the mid management, which
includes the manager of the unit responsible for release
planning, the process manager and a scrum master in the poker
client unit. The model is then communicated to the rest of the
organization through bwin Games’ internal process
documentation.
The results are evaluated through observation and participation in the organization’s work with the model, as
action research describes. Explicitly semi-structured
interviews are held with the process manager, the scrum
master and manager of the poker client unit. The model is
updated iteratively according to the obtained results.
D. Phase 4: Feasibility study of commonly
recommended agile production metrics
This phase performs a feasibility study of some of the
commonly recommended agile production metrics presented
in Section II, in order to be in a better position to propose
production metrics in the theoretical model.
Question 10: Is there any commonly recommend agile
production metric that is universally applicable?
12
The aim is to see how universally applicable the metrics are
and if they can be beneficial for the poker client unit. The
feasibility study is done by semi-structured interviews with the
manager of the poker unit, the scrum master and two
developers.
E. Phase 5: Comparison between the theoretical model and bwin Games’ current performance measurement
practice
In this phase bwin Games’ current performance
measurement practice are compared with the model. The
research question is:
Question 11: How can bwin Games’ current
performance measurement practice be improved in the
light of the theoretical model?
F. Phase 6: Test implementation of the Adaptable
Measurement Framework
The goal is to evaluate how well AMF performs in agile
software development. Following questions are investigated:
Question 12: How well does AMF perform in agile
software development?
Question 13: How well does AMF succeed in
developing flexible, cost-efficient metrics just-in-time?
Question 14: Can the AMF be used to monitor the
results in the process improvement efforts?
The test implementation is carried out in the poker client
unit in collaboration with its three scrum teams and one of the
scrum masters. The implementation lasts for two months and
is observed by participation in the teams daily and weekly
meetings. Question 14 is only analyzed in theory in cooperation with the process manager. The AMF is validated
in the following sub phases, which is correlated with AMF’s
iterative phases described in Section II.P.
1) Define phase
The AMF is presented to each team during workshops. How
the AMF should be used is decided upon. This phase is
validated by how well the AMF is understood by the
practitioners and how easily it can be defined to a specific
context.
2) Information needs analysis
In this phase, the measurement owner is selected, and his information need is identified. The information need is
analyzed by AMF templates and the validation of this phase is
made according to how well the analysis performs.
3) Measurement definition
In this phase, the diagnostics are defined. The definition is
done in collaboration with the scrum master and individual
discussions with members of the teams. The definition and
analysis of the diagnostics are made with AMF’s templates.
This phase is validated by how well the framework performs
in relation to Question 12 and how well the properties of the
diagnostics are analyzed.
4) Data collection and analysis
The data is collected by the developers of the teams and
analyzed by the test implementation’s stakeholders. The
analysis is made in regard to the identified information need.
5) Measurement analysis
Finally, the diagnostics’ performance and the framework itself are evaluated. The evaluation is made by spontaneous
feedback from participants during the implementation,
analysis of the collected data, semi-structured interviews with
the scrum master and a workshop at the end of the
implementation.
IV. RESULTS AND ANALYSIS
This chapter presents the results achieved by following the
methodology described in Section III. The following sections describe the output from research in each of the project’s
phases and seek to answer the research questions.
A. Phase 1: The current State of bwin Games
measurement practice and agile software development
processes
bwin Games have used the scrum methodology for over seven years. Three weeks long sprints are the pulse of the
organization’s workflow. The product owners in the marketing
department obtain the requirements and prioritize them. The
scrum teams commit to seeing a set of requirements delivered
at the end of a sprint. The output from the teams is verified by
the system verification organization before the code is
released. Due to a period of time constraints and
reorganization, some scrum teams have lost various best
practices in the scrum process. For example, Burn down charts
like those described in Section II.N are not always created.
However, work is underway to stabilize the process again.
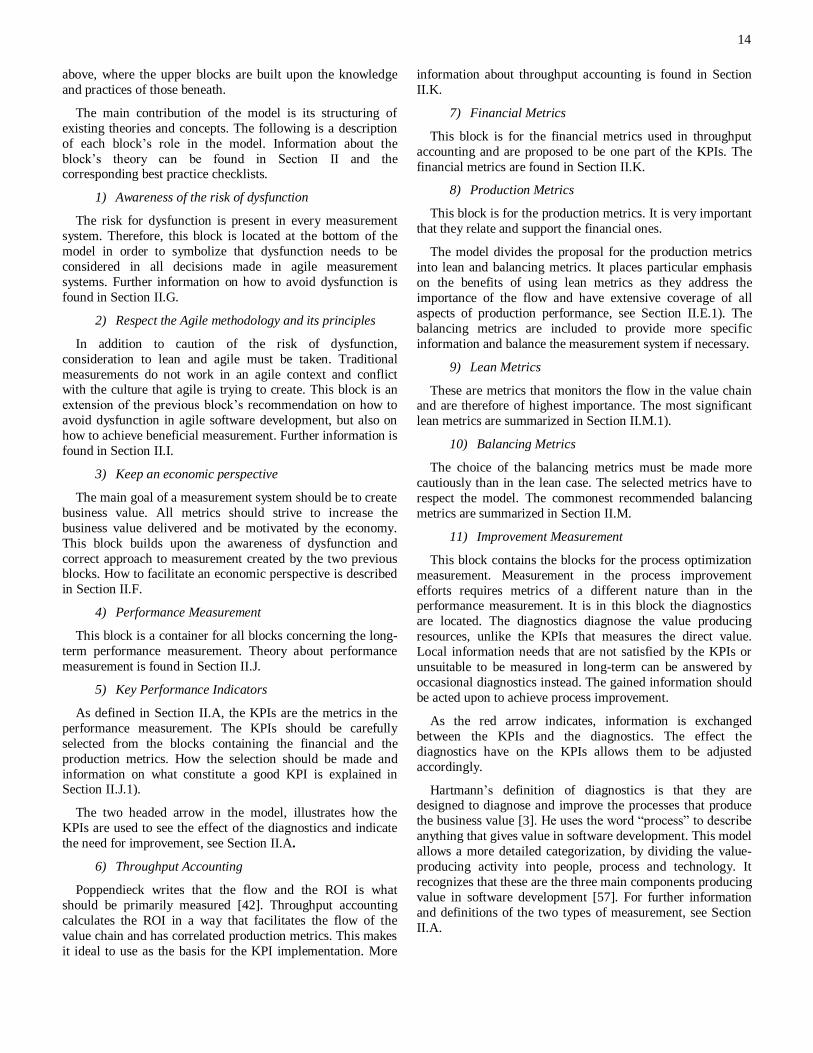
bwin Games presented their new KPIs at the beginning of
the thesis project. The top management’s intention with the
KPIs is to drive the organization’s performance and receive
monthly reports. A subset of the KPIs and the primary ones
are presented in Table 12.
There are no measurements in the process improvement.
The perception is that they do not actually know how good the
outcome of the improvement efforts is and that there is a need
for quantified results.
13
KPI Area KPI Definition
Quality Bug trend Accumulated bug time trend per severity grade and product are
Quality Number of P1-4 Average value over the last month
Quality Number of
incidents caused
by releases
Product
delivery
Lead time
precision
Ability to deliver what has been committed in detail in a multisprint plan. Measured in
average days of delay of delivery of full scope as defined at the start of the first sprint
Innovation Number of ideas
in different
phases
Idea, Prototype, Pilot, Production
Cost Off-shoring
savings
Measured as delivery of business case
Cost OPEX for
platform
operations
DC related cost incl. bandwidth and footprint + 3rd party software licenses
Service level
Incident resolution
As per SLAs
Planning Detailed
planning horizon
Time in future when less than 80% of people are covered by detailed committed plan
Planning Backlog horizon
(months)
Sum of resource estimates for backlog items divided by monthly Technology capacity.
Table 12 Copy of the technology department's KPIs
B. Phase 2: Creation of the theoretical model of agile measurement
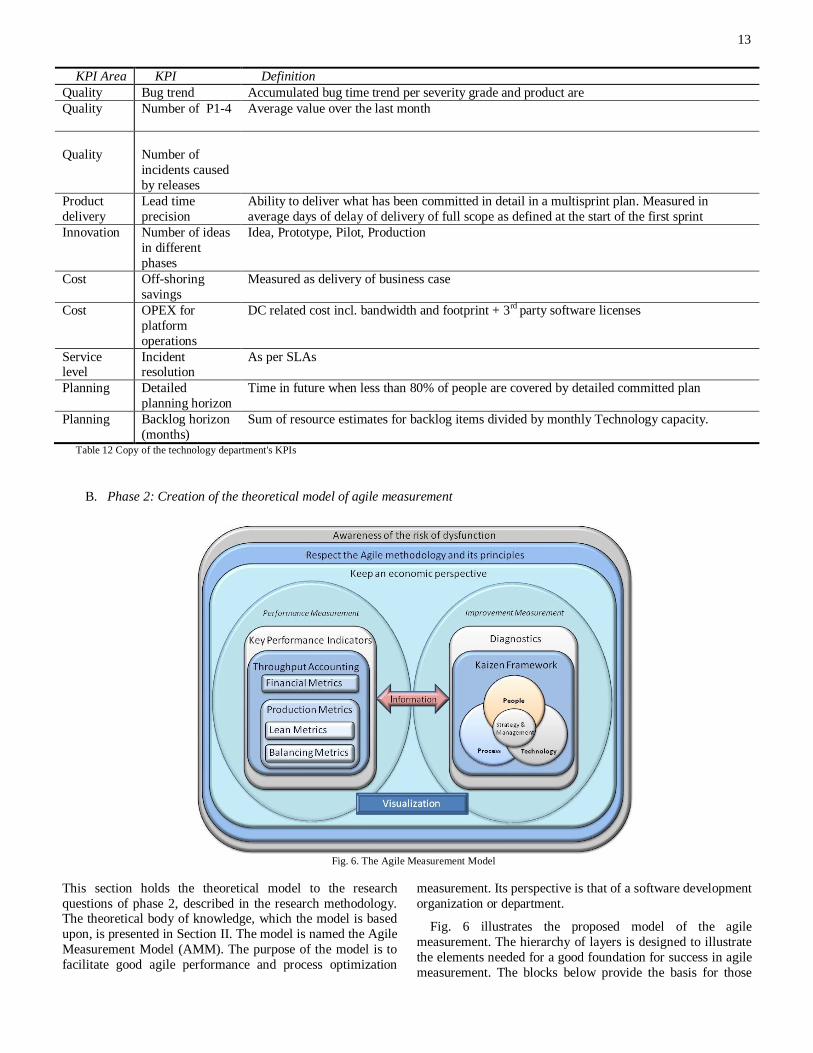
Fig. 6. The Agile Measurement Model
This section holds the theoretical model to the research
questions of phase 2, described in the research methodology. The theoretical body of knowledge, which the model is based
upon, is presented in Section II. The model is named the Agile
Measurement Model (AMM). The purpose of the model is to
facilitate good agile performance and process optimization
measurement. Its perspective is that of a software development
organization or department.
Fig. 6 illustrates the proposed model of the agile
measurement. The hierarchy of layers is designed to illustrate
the elements needed for a good foundation for success in agile
measurement. The blocks below provide the basis for those
14
above, where the upper blocks are built upon the knowledge
and practices of those beneath.
The main contribution of the model is its structuring of
existing theories and concepts. The following is a description
of each block’s role in the model. Information about the
block’s theory can be found in Section II and the corresponding best practice checklists.
1) Awareness of the risk of dysfunction
The risk for dysfunction is present in every measurement
system. Therefore, this block is located at the bottom of the
model in order to symbolize that dysfunction needs to be
considered in all decisions made in agile measurement
systems. Further information on how to avoid dysfunction is
found in Section II.G.
2) Respect the Agile methodology and its principles
In addition to caution of the risk of dysfunction,
consideration to lean and agile must be taken. Traditional
measurements do not work in an agile context and conflict with the culture that agile is trying to create. This block is an
extension of the previous block’s recommendation on how to
avoid dysfunction in agile software development, but also on
how to achieve beneficial measurement. Further information is
found in Section II.I.
3) Keep an economic perspective
The main goal of a measurement system should be to create
business value. All metrics should strive to increase the
business value delivered and be motivated by the economy.
This block builds upon the awareness of dysfunction and
correct approach to measurement created by the two previous blocks. How to facilitate an economic perspective is described
in Section II.F.
4) Performance Measurement
This block is a container for all blocks concerning the long-
term performance measurement. Theory about performance
measurement is found in Section II.J.
5) Key Performance Indicators
As defined in Section II.A, the KPIs are the metrics in the
performance measurement. The KPIs should be carefully
selected from the blocks containing the financial and the
production metrics. How the selection should be made and
information on what constitute a good KPI is explained in Section II.J.1).
The two headed arrow in the model, illustrates how the
KPIs are used to see the effect of the diagnostics and indicate
the need for improvement, see Section II.A.
6) Throughput Accounting
Poppendieck writes that the flow and the ROI is what
should be primarily measured [42]. Throughput accounting
calculates the ROI in a way that facilitates the flow of the
value chain and has correlated production metrics. This makes
it ideal to use as the basis for the KPI implementation. More
information about throughput accounting is found in Section
II.K.
7) Financial Metrics
This block is for the financial metrics used in throughput
accounting and are proposed to be one part of the KPIs. The
financial metrics are found in Section II.K.
8) Production Metrics
This block is for the production metrics. It is very important
that they relate and support the financial ones.
The model divides the proposal for the production metrics
into lean and balancing metrics. It places particular emphasis
on the benefits of using lean metrics as they address the
importance of the flow and have extensive coverage of all
aspects of production performance, see Section II.E.1). The
balancing metrics are included to provide more specific
information and balance the measurement system if necessary.
9) Lean Metrics
These are metrics that monitors the flow in the value chain and are therefore of highest importance. The most significant
lean metrics are summarized in Section II.M.1).
10) Balancing Metrics
The choice of the balancing metrics must be made more
cautiously than in the lean case. The selected metrics have to
respect the model. The commonest recommended balancing
metrics are summarized in Section II.M.
11) Improvement Measurement
This block contains the blocks for the process optimization
measurement. Measurement in the process improvement
efforts requires metrics of a different nature than in the performance measurement. It is in this block the diagnostics
are located. The diagnostics diagnose the value producing
resources, unlike the KPIs that measures the direct value.
Local information needs that are not satisfied by the KPIs or
unsuitable to be measured in long-term can be answered by
occasional diagnostics instead. The gained information should
be acted upon to achieve process improvement.
As the red arrow indicates, information is exchanged
between the KPIs and the diagnostics. The effect the
diagnostics have on the KPIs allows them to be adjusted
accordingly.
Hartmann’s definition of diagnostics is that they are designed to diagnose and improve the processes that produce
the business value [3]. He uses the word ―process‖ to describe
anything that gives value in software development. This model
allows a more detailed categorization, by dividing the value-
producing activity into people, process and technology. It
recognizes that these are the three main components producing
value in software development [57]. For further information
and definitions of the two types of measurement, see Section
II.A.
15
12) Diagnostics
The model proposes diagnostics to support the continuous
improvement, see Section II.A. The diagnostics are used for
satisfying local information needs or for monitoring the results
of improvement efforts.
13) Kaizen Framework
This block represents and promotes the use of a continuous
improvement framework such as the PDCA. The diagnostics
can supplement the frameworks with quantifiable results of
their achievements. More information about the continuous
improvement frameworks and how they can benefit from
measurement is found in Section II.O.
14) Process
This block represents the measurement and improvement of
the processes in the development. The process is defined as
the set of actions, tasks and procedures involved in the
software development [57].
15) People
This block represents the measurement and improvement of
the people in the development. For example, it may address
culture, attitude and knowledge. It is important to note that
individual performance measures are not recommended.
16) Technology
This block represents the measurement and improvement of
the technology in the development. For example, it may
address infrastructure, standards and tools.
17) Strategy & Management
This block represents the measurement and improvement of
the strategy and management of the processes, people and technology.
18) Visualization
Visualization provides transparency and facilitates that the
metrics are acted upon. The most significant visualization
techniques are found in Section II.N.
C. Phase 3: Validation of the model’s practical
relevance
This section presents the result from the validation of the
model’s practical relevance. The result is divided by the
management’s and the developer’s perspective of the
validation of the model. The model is then analyzed for its
organization specific and universal relevance.
1) The management perspective of the validation of the
AMM
The initial intent with the thesis was to develop and support
the company in their introduction of a performance
measurement system. Because of new management and time
constraints, the KPIs described in Section IV.E were already
developed at the start of the thesis.
The top management had little time to discuss the
measurement practice, resulting in low priority to the
measurement project. The development of the AMM is instead
carried out in collaboration with the mid management, who
has an inclination for lean and agile software development.
The process manager of the technology department sees
great potential in the model and made the AMM a part of the
technology department’s process framework. He especially emphasizes measurement for local information and monitoring
of improvements. How the diagnostics are intended to be used
in conjunction with bwin Games’ work with the PDCA is
described in Section IV.F.8).
The mid management recognizes the need for awareness of
dysfunction, which is currently missing in the organization’s
mindset. The existing set of KPIs is improving, and it is not
certain how the final set will look like.
Although the organization’s awareness of agile principles
is much larger than for dysfunction, the mid management
explains that there is a lack of a common vision. There are no
directives on how agile should be integrated at all levels of the organization. An IT strategy would be needed to spread the
message. This belief is very compatible with AMM’s end-to-
end perspective. The current measurement system can also
take advantage of the model’s account of the agile culture.
There is now a risk that the adherence-to-plan KPIs results in
missed opportunities.
The model’s economic perspective is also well received. It
must be clearer what the return is on the projects. Quantified
data is needed to justify the projects and to monitor the results.
There are currently efforts to assign business value and to
motivate projects in a venture process. However, the mid management still sees the need for a role of an IT controller,
which can monitor the financial figures.
To improve the company’s financial situation, the top
management promotes resource planning supervised by KPIs.
The KPIs measures the planning horizon and percentage of
resources allocated. The mid management fears that it will
lead to sub optimization and welcomes the throughput
accounting’s view and credited it to capture the correct
decision support. However, traditional cost accounting is
required by law, which can make it difficult to replace. The
problem lies more in that cost accounting is rooted in many
managers’ mindset.
Controlling the development through trends is regarded
very important and production metrics are viewed as an
enabler. Implementing lean metrics through digitalized
Kanban boards is in the pipeline. If it can be done with an end-
to-end perspective, queues could be managed throughout the
value chain. Especially queue management is considered as
very important.
In order to achieve decentralized control each unit in the
organization is today rather independent. The mid
management sees the benefits of decentralized control, but
argues that it must be guided by global directives and a shared vision. This is supported by Reinertsen who states that an
organization should strive for an optimal balance between
decentralized and centralized control [22]. Leading production
16
metrics are one way to facilitate this and support local
decisions.
Another aspect of decentralized control is the
standardization issue. If a solution is found useful in one unit,
it may serve other units as well. This advantage can be lost if
there is no procedure for standardization. In such standardization procedure diagnostics might be used to back
up the solution. The whole point of diagnostics is very well
received and is further described in Section IV.F.8).
2) The developer perspective of the validation of the
AMM
The management feared that the reception of the AMM
would be chilly among the developers. It became very
apparent that it is a barrier between the developers and the
managers. The developers believe that their estimates have
been misused in the past, which led to distrust towards
management activities such as measurement systems.
The model proved useful in communicating the whole picture of agile measurement and overcome the initial
resistance. By first explaining the model’s consideration of
dysfunction and the agile culture assured the developers that
their concerns were noted. The model was praised for having
an organization wide perspective that the developers believed
missing in the current agile practice.
As explained in Section II.H, the resistance will decrease
when the employees are assured that the metrics will not be
used against them or for project comparison. The model was
very useful in delivering this message. The reception
improved even more when the developers participated in the design of the diagnostics, see Section IV.F. Because the test
implementation was conducted with a somewhat forced and
abstract information need statement, the full potential of
developer involvement was not met. In a normal case, the
team’s information need is the starting point for the
diagnostics and the developers preferably design the
diagnostics themselves.
It was noticeable that the developers were very concerned
about the accuracy of the data, and that it would not be a
wasteful activity. When discussing the lean based metrics, a
senior developer argued that it is difficult to measure the
effects of a good architecture, reuse and refactoring. Measuring the lead time as an indication of productivity would
be too narrow in time. He feared that the future benefits of
putting some extra time on quality would not be recognized in
the performance metrics. Anderson states that the optimal
scenario is to get the architecture right the first time [11]. If
refactoring is necessary, it is important that the true cost is
revealed by analyzing the impact on the throughput.
Management can then assess whether it is a good business
decision. The benefits of good architecture, reuse and
refactoring will be shown in the financial metrics and a shorter
lead time.
3) Analyze of the validation of the AMM and future
recommendations
The company’s situation is similar to the example provided
by Hartmann where senior traditional oriented management
comes in contact with agile and applies old ways of
monitoring [3]. Senior management is typically much more risk averse than early adopters of the agile methodology. To
deal with this collision they often rely on plan driven metrics.
It is clear that the awareness of dysfunctional behavior is
not high enough, nor the understanding of how traditional
measurement conflicts with the agile methodology. The AMM
was observed to be a good way to increase this awareness and
to communicate the various types of measurement.
The positive reception from the mid management is not
surprising, since they have a passion for agile. Furthermore,
the AMM has, to some extent, a mid management perspective.
They are probably the ones best placed to promote the AMM
within the organization. The disadvantage with this is that they do not have the authority of top management. Top
management support is one of the most important success
factors in measurement systems [11]. The advantage is that the
mid management is in a better position to facilitate the
introduction of the measurements.
The AMM decreased the resistance among the developers
and provided an opening. The difference between motivational
behavior provoking measurement and informational
measurement for gaining insights was well communicated.
However, the developers are still not completely convinced
that measurement is beneficial for them. What prevents full acceptance of the informational measurement are concerns
regarding benefit, overhead and data accuracy.
To ease these concerns, the benefit must be proven over
long-term and in relation to the overhead. The mid
management must stress that accuracy may not always be the
top priority. More accurate diagnostics can evolve over time if
needed. They should emphasize that manual data collection
can be justified to obtain initial information. If the diagnostic
is thought useful, the ability to automate can then be
examined. This reduces the risk regarding the setup cost of
automation. The developers must be convinced that
diagnostics are a lightweight way to provide information that is good enough.
Promoting the AMM upwards in the organization is also
necessary, to address the issues in Section IV.E. The AMM
presented together with some examples of experienced
dysfunction, would hopefully provoke some attention.
The model’s universal relevance must be judged in terms of
how organization specific bwin Games context is. bwin
Games have a very similar agile software development to
today’s most common industrial agile practice, as described by
Leffingwell [8]. Furthermore, the model itself is also
constructed with a universal perspective in mind. Then one can expect that the organization specific validation also has
some universal relevance.
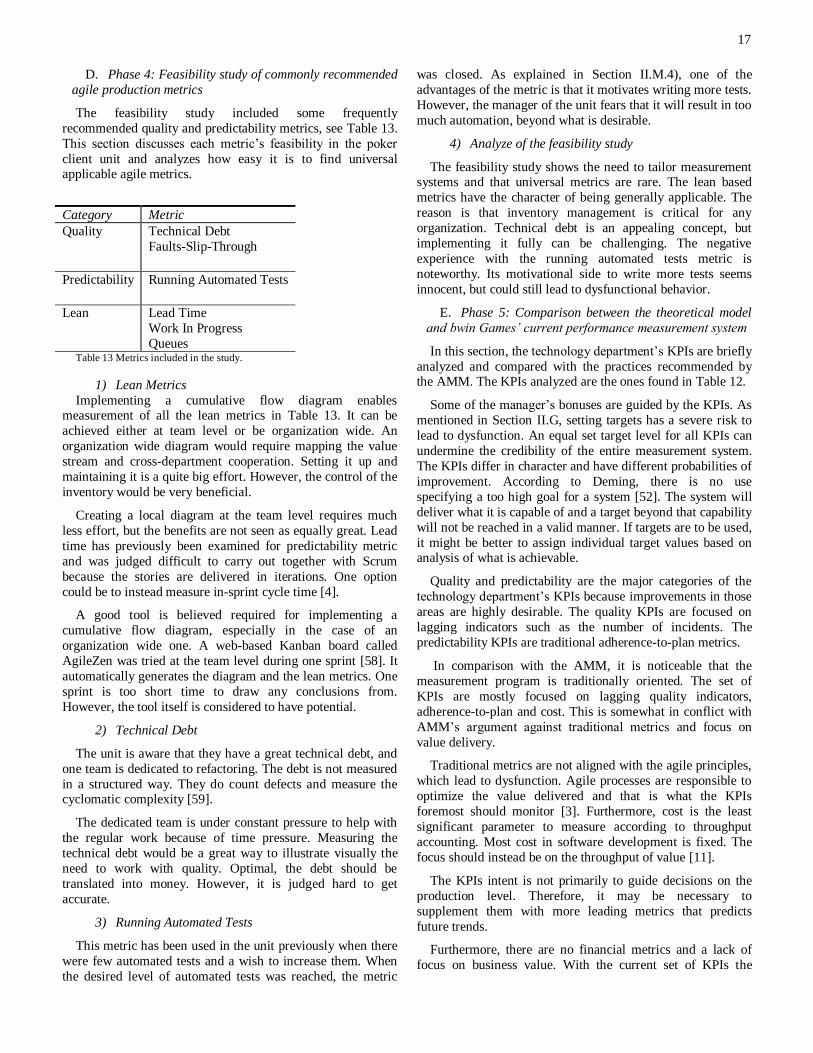
17
D. Phase 4: Feasibility study of commonly recommended
agile production metrics
The feasibility study included some frequently
recommended quality and predictability metrics, see Table 13.
This section discusses each metric’s feasibility in the poker
client unit and analyzes how easy it is to find universal applicable agile metrics.
Category Metric
Quality Technical Debt
Faults-Slip-Through
Predictability Running Automated Tests
Lean Lead Time
Work In Progress
Queues Table 13 Metrics included in the study.
1) Lean Metrics
Implementing a cumulative flow diagram enables measurement of all the lean metrics in Table 13. It can be
achieved either at team level or be organization wide. An
organization wide diagram would require mapping the value
stream and cross-department cooperation. Setting it up and
maintaining it is a quite big effort. However, the control of the
inventory would be very beneficial.
Creating a local diagram at the team level requires much
less effort, but the benefits are not seen as equally great. Lead
time has previously been examined for predictability metric
and was judged difficult to carry out together with Scrum
because the stories are delivered in iterations. One option
could be to instead measure in-sprint cycle time [4].
A good tool is believed required for implementing a
cumulative flow diagram, especially in the case of an
organization wide one. A web-based Kanban board called
AgileZen was tried at the team level during one sprint [58]. It
automatically generates the diagram and the lean metrics. One
sprint is too short time to draw any conclusions from.
However, the tool itself is considered to have potential.
2) Technical Debt
The unit is aware that they have a great technical debt, and
one team is dedicated to refactoring. The debt is not measured
in a structured way. They do count defects and measure the cyclomatic complexity [59].
The dedicated team is under constant pressure to help with
the regular work because of time pressure. Measuring the
technical debt would be a great way to illustrate visually the
need to work with quality. Optimal, the debt should be
translated into money. However, it is judged hard to get
accurate.
3) Running Automated Tests
This metric has been used in the unit previously when there
were few automated tests and a wish to increase them. When
the desired level of automated tests was reached, the metric
was closed. As explained in Section II.M.4), one of the
advantages of the metric is that it motivates writing more tests.
However, the manager of the unit fears that it will result in too
much automation, beyond what is desirable.
4) Analyze of the feasibility study
The feasibility study shows the need to tailor measurement systems and that universal metrics are rare. The lean based
metrics have the character of being generally applicable. The
reason is that inventory management is critical for any
organization. Technical debt is an appealing concept, but
implementing it fully can be challenging. The negative
experience with the running automated tests metric is
noteworthy. Its motivational side to write more tests seems
innocent, but could still lead to dysfunctional behavior.
E. Phase 5: Comparison between the theoretical model
and bwin Games’ current performance measurement system
In this section, the technology department’s KPIs are briefly
analyzed and compared with the practices recommended by the AMM. The KPIs analyzed are the ones found in Table 12.
Some of the manager’s bonuses are guided by the KPIs. As
mentioned in Section II.G, setting targets has a severe risk to
lead to dysfunction. An equal set target level for all KPIs can
undermine the credibility of the entire measurement system.
The KPIs differ in character and have different probabilities of
improvement. According to Deming, there is no use
specifying a too high goal for a system [52]. The system will
deliver what it is capable of and a target beyond that capability
will not be reached in a valid manner. If targets are to be used,
it might be better to assign individual target values based on analysis of what is achievable.
Quality and predictability are the major categories of the
technology department’s KPIs because improvements in those
areas are highly desirable. The quality KPIs are focused on
lagging indicators such as the number of incidents. The
predictability KPIs are traditional adherence-to-plan metrics.
In comparison with the AMM, it is noticeable that the
measurement program is traditionally oriented. The set of
KPIs are mostly focused on lagging quality indicators,
adherence-to-plan and cost. This is somewhat in conflict with
AMM’s argument against traditional metrics and focus on
value delivery.
Traditional metrics are not aligned with the agile principles,
which lead to dysfunction. Agile processes are responsible to
optimize the value delivered and that is what the KPIs
foremost should monitor [3]. Furthermore, cost is the least
significant parameter to measure according to throughput
accounting. Most cost in software development is fixed. The
focus should instead be on the throughput of value [11].
The KPIs intent is not primarily to guide decisions on the
production level. Therefore, it may be necessary to
supplement them with more leading metrics that predicts
future trends.
Furthermore, there are no financial metrics and a lack of
focus on business value. With the current set of KPIs the
18
technology department’s ROI can be negative while the KPIs
are still positive.
Discussions between managers indicate dysfunctional
behavior. One of the managers challenged a decision only
based on the belief that it would be detrimental to the KPI that
guided his bonus. This shows the necessity of economic transfer functions described in Section II.F. Economic transfer
functions would transform the KPIs values to a common unit
of business value, which would enable tradeoffs between the
KPIs.
Linking the manager’s bonus to the KPIs creates a very
strong motivational measurement. As explained in Section
II.G, motivational measurement is where the metrics seeks to
provoke a certain behavior. Motivational measurement has a
severe risk to lead to dysfunction where the employee’s work
effort begins to focus on the KPIs instead of what is optimal
for the business.
The major risk with the current measurement system is dysfunction. The measurement system is motivational with a
lack of full coverage of performance aspects. This may in
itself be enough to review the measurement practice. The fact
that dysfunctional behavior has already occurred justifies a
revision even more. Because the fact remains, a dysfunctional
measurement system is not likely to have a positive return
[24].
Acceptance of the AMM’s lower three blocks of awareness
of dysfunction, respect to agile principles and keeping an
economic perspective is vital to the success in agile
measurement. Once achieved, the very selection of the KPIs themselves can be initiated and throughput accounting may be
investigated for financial KPIs. Throughput accounting does
not have to be fully implemented because its ideas can
constitute a first step towards proper calculation of the ROI.
Its ideas relate to the importance of flow, which in turn refers
to the lean based metrics. The lean based metrics is much
emphasized in the current best practice literature and deserves
attention, see Section II.E.
In the balancing metric block the AMM allows for other
production metrics than the lean based ones, in order to
provide the possibility to create balance in the measurement
system. In this category some of the present KPIs such as the Bug trend might be included. A review should examine
necessary balancing KPIs and let them be developed through a
framework such as the GQM, see Section II.J.1).
More detailed recommendations are not possible to give
without understanding of the organization’s value drivers and
top management collaboration, which has not been achieved in
this research project. A measurement system should be
tailored for each organization and, several steps must be taken
to get there. The suggestions above can be viewed as a starting
point and the AMM as a guiding reference in this procedure.
F. Phase 6: Test Implementation of the Adaptable Measurement Framework
This section presents the test implementation of the AMF
performed at the poker client unit. First are changes done to
the AMF explained and then are the sub phases’, described in
the research methodology, result presented.
1) Changes to AMF
The AMF derives many of its ideas from the GQM
approach [6]. The main difference between the two concepts is
the order they are executed. Since the AMF strives to optimize the flexibility, it starts to define the diagnostics directly after
setting the goal. The problem with GQM’s top-down
approach, in which the questions are formulated before the
diagnostics, is that it may be difficult to identify feasible
diagnostics and the process of formulating question must be
repeated.
In AMF the diagnostics are investigated directly after the
goal. This solves the problem with the top-down approach and
saves one layer of complexity. However, this implementation
of AMF adds the practice of formulating questions, but after
the diagnostics have been obtained. The reason is that they can
be used to assess the diagnostics in the selection process and communicate the diagnostics once selected. If the additional
level of complexity is difficult to justify, only questions to the
selected diagnostics can be formulated in order to provide the
rationale.
2) The define phase
The poker client unit had suffered a period of severe time
pressure with weakening quality as the result. Due to the
experienced quality problems and that the upcoming sprints
were focused on bugs, it was decided to let the AMF aid in the
quality improvement efforts.
Since the AMF was created to be adaptable to any context, it was no problem to adopt it. However, it provides no
guidance on how this definition should be conducted. Some
guidelines would also have helped inform the framework’s
purposes.
3) Information need analysis
The scrum master was appointed as the measurement
owner. The fundamental information need is to understand the
reason behind the quality problems. Monolithic architecture
and time constraints are often cited as the major reasons.
These two main issues need to be confirmed and other minor
causes revealed. Therefore, the goal was to identify the major
causes of the quality problems.
The framework’s template proved to be sufficient in
analyzing and understanding the information need.
4) Measurement definition
As according to AMF’s workflow, potential diagnostics are
analyzed directly after stating the goal. Three diagnostics were
identified as possible candidates and two of them approved for
inclusion. The rejected diagnostic intended to collect data
from post-sprint bug reports in a defect tracking system. This
is first-order information and is therefore evaluated first. The
idea is to plot bugs and story points over time to look for
correlation between them. A correlation would reveal error prone code areas. However, the information proved
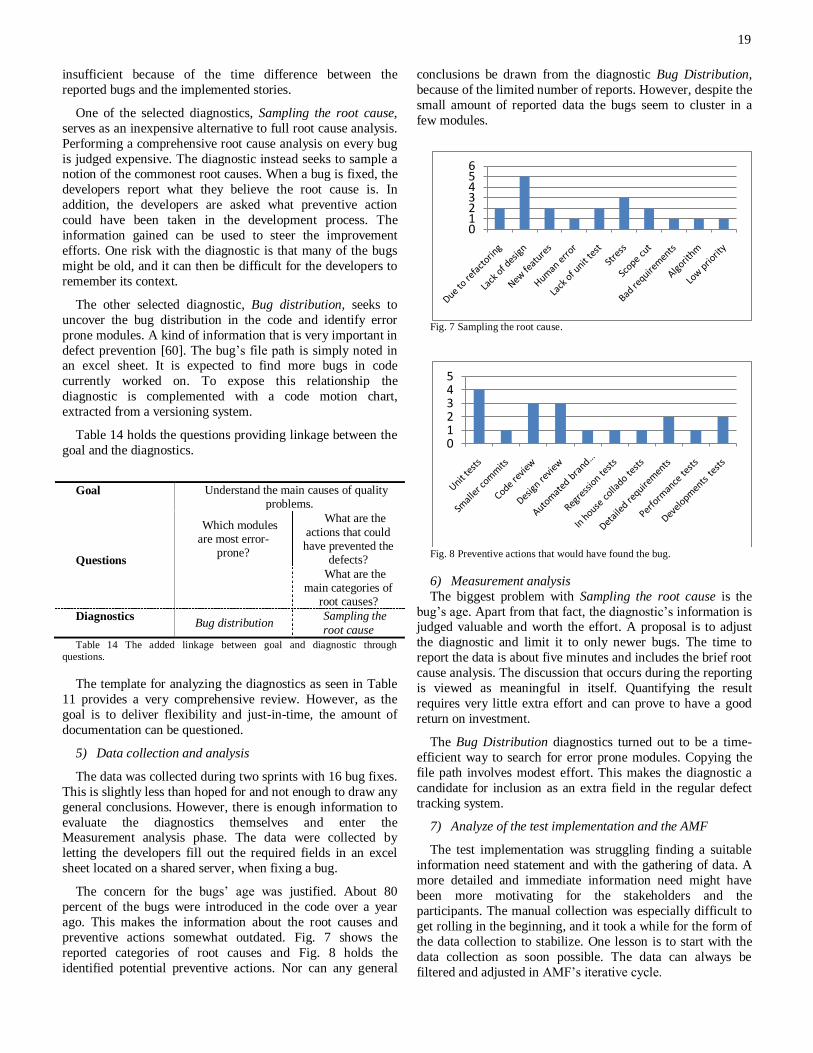
19
insufficient because of the time difference between the
reported bugs and the implemented stories.
One of the selected diagnostics, Sampling the root cause,
serves as an inexpensive alternative to full root cause analysis.
Performing a comprehensive root cause analysis on every bug
is judged expensive. The diagnostic instead seeks to sample a notion of the commonest root causes. When a bug is fixed, the
developers report what they believe the root cause is. In
addition, the developers are asked what preventive action
could have been taken in the development process. The
information gained can be used to steer the improvement
efforts. One risk with the diagnostic is that many of the bugs
might be old, and it can then be difficult for the developers to
remember its context.
The other selected diagnostic, Bug distribution, seeks to
uncover the bug distribution in the code and identify error
prone modules. A kind of information that is very important in
defect prevention [60]. The bug’s file path is simply noted in an excel sheet. It is expected to find more bugs in code
currently worked on. To expose this relationship the
diagnostic is complemented with a code motion chart,
extracted from a versioning system.
Table 14 holds the questions providing linkage between the
goal and the diagnostics.
Goal Understand the main causes of quality problems.
Questions
Which modules are most error-
prone?
What are the
actions that could have prevented the
defects?
What are the main categories of
root causes?
Diagnostics Bug distribution
Sampling the
root cause
Table 14 The added linkage between goal and diagnostic through questions.
The template for analyzing the diagnostics as seen in Table
11 provides a very comprehensive review. However, as the
goal is to deliver flexibility and just-in-time, the amount of
documentation can be questioned.
5) Data collection and analysis
The data was collected during two sprints with 16 bug fixes.
This is slightly less than hoped for and not enough to draw any
general conclusions. However, there is enough information to
evaluate the diagnostics themselves and enter the Measurement analysis phase. The data were collected by
letting the developers fill out the required fields in an excel
sheet located on a shared server, when fixing a bug.
The concern for the bugs’ age was justified. About 80
percent of the bugs were introduced in the code over a year
ago. This makes the information about the root causes and
preventive actions somewhat outdated. Fig. 7 shows the
reported categories of root causes and Fig. 8 holds the
identified potential preventive actions. Nor can any general
conclusions be drawn from the diagnostic Bug Distribution,
because of the limited number of reports. However, despite the
small amount of reported data the bugs seem to cluster in a
few modules.
Fig. 7 Sampling the root cause.
Fig. 8 Preventive actions that would have found the bug.
6) Measurement analysis
The biggest problem with Sampling the root cause is the
bug’s age. Apart from that fact, the diagnostic’s information is judged valuable and worth the effort. A proposal is to adjust
the diagnostic and limit it to only newer bugs. The time to
report the data is about five minutes and includes the brief root
cause analysis. The discussion that occurs during the reporting
is viewed as meaningful in itself. Quantifying the result
requires very little extra effort and can prove to have a good
return on investment.
The Bug Distribution diagnostics turned out to be a time-
efficient way to search for error prone modules. Copying the
file path involves modest effort. This makes the diagnostic a
candidate for inclusion as an extra field in the regular defect
tracking system.
7) Analyze of the test implementation and the AMF
The test implementation was struggling finding a suitable
information need statement and with the gathering of data. A
more detailed and immediate information need might have
been more motivating for the stakeholders and the
participants. The manual collection was especially difficult to
get rolling in the beginning, and it took a while for the form of
the data collection to stabilize. One lesson is to start with the
data collection as soon possible. The data can always be
filtered and adjusted in AMF’s iterative cycle.
0123456
012345
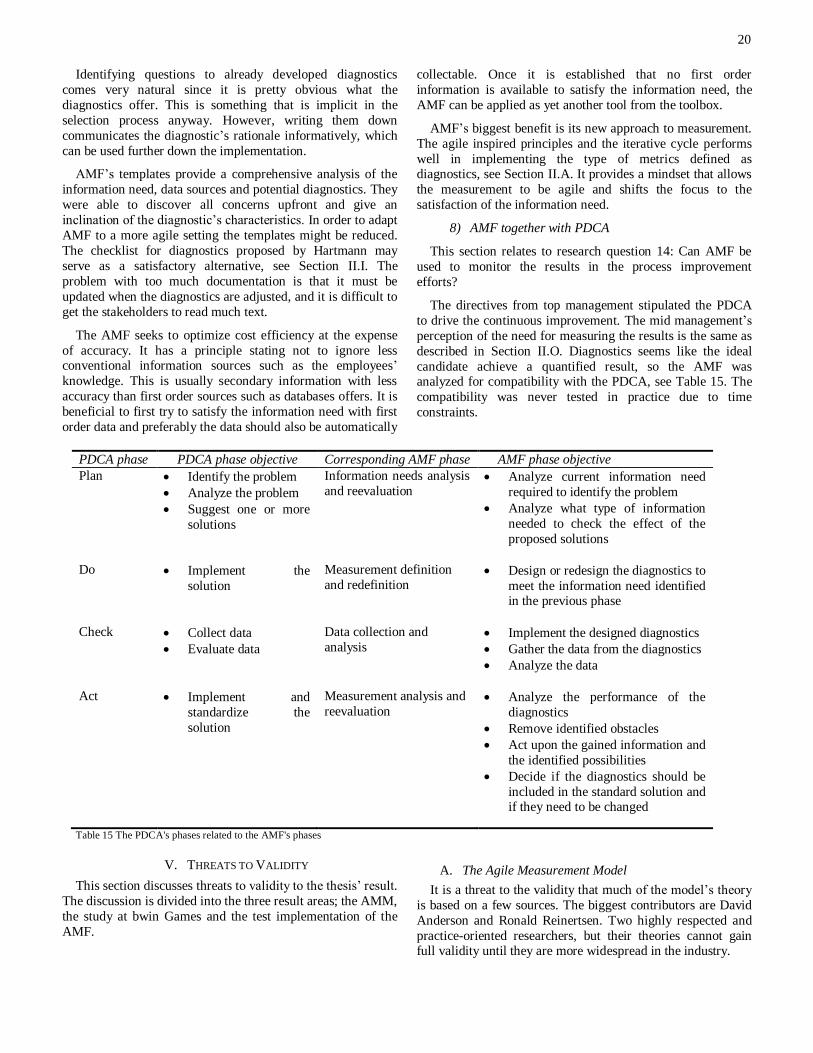
20
Identifying questions to already developed diagnostics
comes very natural since it is pretty obvious what the
diagnostics offer. This is something that is implicit in the
selection process anyway. However, writing them down
communicates the diagnostic’s rationale informatively, which
can be used further down the implementation.
AMF’s templates provide a comprehensive analysis of the
information need, data sources and potential diagnostics. They
were able to discover all concerns upfront and give an
inclination of the diagnostic’s characteristics. In order to adapt
AMF to a more agile setting the templates might be reduced.
The checklist for diagnostics proposed by Hartmann may
serve as a satisfactory alternative, see Section II.I. The
problem with too much documentation is that it must be
updated when the diagnostics are adjusted, and it is difficult to
get the stakeholders to read much text.
The AMF seeks to optimize cost efficiency at the expense
of accuracy. It has a principle stating not to ignore less conventional information sources such as the employees’
knowledge. This is usually secondary information with less
accuracy than first order sources such as databases offers. It is
beneficial to first try to satisfy the information need with first
order data and preferably the data should also be automatically
collectable. Once it is established that no first order
information is available to satisfy the information need, the
AMF can be applied as yet another tool from the toolbox.
AMF’s biggest benefit is its new approach to measurement.
The agile inspired principles and the iterative cycle performs
well in implementing the type of metrics defined as diagnostics, see Section II.A. It provides a mindset that allows
the measurement to be agile and shifts the focus to the
satisfaction of the information need.
8) AMF together with PDCA
This section relates to research question 14: Can AMF be
used to monitor the results in the process improvement
efforts?
The directives from top management stipulated the PDCA
to drive the continuous improvement. The mid management’s
perception of the need for measuring the results is the same as
described in Section II.O. Diagnostics seems like the ideal
candidate achieve a quantified result, so the AMF was analyzed for compatibility with the PDCA, see Table 15. The
compatibility was never tested in practice due to time
constraints.
PDCA phase PDCA phase objective Corresponding AMF phase AMF phase objective
Plan Identify the problem
Analyze the problem
Suggest one or more
solutions
Information needs analysis
and reevaluation Analyze current information need
required to identify the problem
Analyze what type of information
needed to check the effect of the
proposed solutions
Do Implement the
solution
Measurement definition
and redefinition Design or redesign the diagnostics to
meet the information need identified in the previous phase
Check Collect data
Evaluate data
Data collection and
analysis Implement the designed diagnostics
Gather the data from the diagnostics
Analyze the data
Act Implement and
standardize the
solution
Measurement analysis and
reevaluation Analyze the performance of the
diagnostics
Remove identified obstacles
Act upon the gained information and
the identified possibilities
Decide if the diagnostics should be
included in the standard solution and if they need to be changed
Table 15 The PDCA's phases related to the AMF's phases
V. THREATS TO VALIDITY
This section discusses threats to validity to the thesis’ result.
The discussion is divided into the three result areas; the AMM,
the study at bwin Games and the test implementation of the
AMF.
A. The Agile Measurement Model
It is a threat to the validity that much of the model’s theory
is based on a few sources. The biggest contributors are David
Anderson and Ronald Reinertsen. Two highly respected and
practice-oriented researchers, but their theories cannot gain full validity until they are more widespread in the industry.
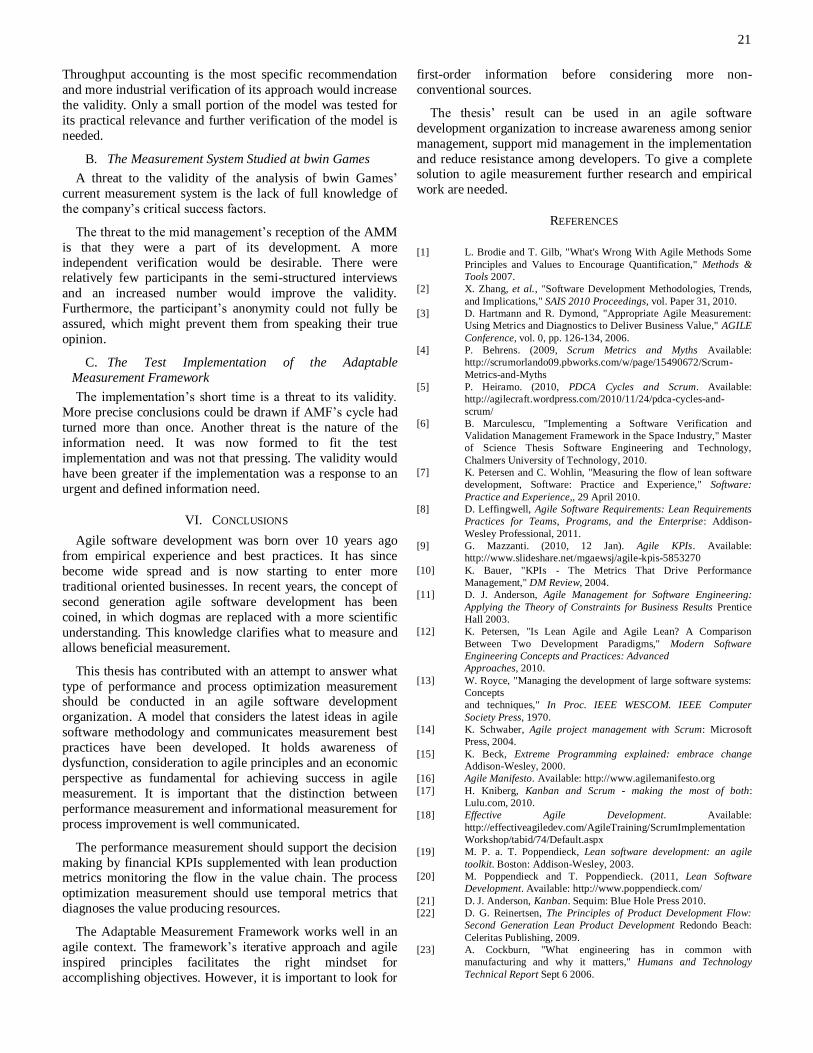
21
Throughput accounting is the most specific recommendation
and more industrial verification of its approach would increase
the validity. Only a small portion of the model was tested for
its practical relevance and further verification of the model is
needed.
B. The Measurement System Studied at bwin Games
A threat to the validity of the analysis of bwin Games’
current measurement system is the lack of full knowledge of
the company’s critical success factors.
The threat to the mid management’s reception of the AMM
is that they were a part of its development. A more
independent verification would be desirable. There were relatively few participants in the semi-structured interviews
and an increased number would improve the validity.
Furthermore, the participant’s anonymity could not fully be
assured, which might prevent them from speaking their true
opinion.
C. The Test Implementation of the Adaptable
Measurement Framework
The implementation’s short time is a threat to its validity.
More precise conclusions could be drawn if AMF’s cycle had
turned more than once. Another threat is the nature of the
information need. It was now formed to fit the test
implementation and was not that pressing. The validity would
have been greater if the implementation was a response to an
urgent and defined information need.
VI. CONCLUSIONS
Agile software development was born over 10 years ago
from empirical experience and best practices. It has since
become wide spread and is now starting to enter more
traditional oriented businesses. In recent years, the concept of
second generation agile software development has been
coined, in which dogmas are replaced with a more scientific
understanding. This knowledge clarifies what to measure and
allows beneficial measurement.
This thesis has contributed with an attempt to answer what
type of performance and process optimization measurement should be conducted in an agile software development
organization. A model that considers the latest ideas in agile
software methodology and communicates measurement best
practices have been developed. It holds awareness of
dysfunction, consideration to agile principles and an economic
perspective as fundamental for achieving success in agile
measurement. It is important that the distinction between
performance measurement and informational measurement for
process improvement is well communicated.
The performance measurement should support the decision
making by financial KPIs supplemented with lean production metrics monitoring the flow in the value chain. The process
optimization measurement should use temporal metrics that
diagnoses the value producing resources.
The Adaptable Measurement Framework works well in an
agile context. The framework’s iterative approach and agile
inspired principles facilitates the right mindset for
accomplishing objectives. However, it is important to look for
first-order information before considering more non-
conventional sources.
The thesis’ result can be used in an agile software
development organization to increase awareness among senior
management, support mid management in the implementation
and reduce resistance among developers. To give a complete solution to agile measurement further research and empirical
work are needed.
REFERENCES
[1] L. Brodie and T. Gilb, "What's Wrong With Agile Methods Some
Principles and Values to Encourage Quantification," Methods &
Tools 2007.
[2] X. Zhang, et al., "Software Development Methodologies, Trends,
and Implications," SAIS 2010 Proceedings, vol. Paper 31, 2010.
[3] D. Hartmann and R. Dymond, "Appropriate Agile Measurement:
Using Metrics and Diagnostics to Deliver Business Value," AGILE
Conference, vol. 0, pp. 126-134, 2006.
[4] P. Behrens. (2009, Scrum Metrics and Myths Available:
http://scrumorlando09.pbworks.com/w/page/15490672/Scrum-
Metrics-and-Myths
[5] P. Heiramo. (2010, PDCA Cycles and Scrum. Available:
http://agilecraft.wordpress.com/2010/11/24/pdca-cycles-and-
scrum/
[6] B. Marculescu, "Implementing a Software Verification and
Validation Management Framework in the Space Industry," Master
of Science Thesis Software Engineering and Technology,
Chalmers University of Technology, 2010.
[7] K. Petersen and C. Wohlin, "Measuring the flow of lean software
development, Software: Practice and Experience," Software:
Practice and Experience,, 29 April 2010.
[8] D. Leffingwell, Agile Software Requirements: Lean Requirements
Practices for Teams, Programs, and the Enterprise: Addison-
Wesley Professional, 2011.
[9] G. Mazzanti. (2010, 12 Jan). Agile KPIs. Available:
http://www.slideshare.net/mgaewsj/agile-kpis-5853270
[10] K. Bauer, "KPIs - The Metrics That Drive Performance
Management," DM Review, 2004.
[11] D. J. Anderson, Agile Management for Software Engineering:
Applying the Theory of Constraints for Business Results Prentice
Hall 2003.
[12] K. Petersen, "Is Lean Agile and Agile Lean? A Comparison
Between Two Development Paradigms," Modern Software
Engineering Concepts and Practices: Advanced
Approaches, 2010.
[13] W. Royce, "Managing the development of large software systems:
Concepts
and techniques," In Proc. IEEE WESCOM. IEEE Computer
Society Press, 1970.
[14] K. Schwaber, Agile project management with Scrum: Microsoft
Press, 2004.
[15] K. Beck, Extreme Programming explained: embrace change
Addison-Wesley, 2000.
[16] Agile Manifesto. Available: http://www.agilemanifesto.org
[17] H. Kniberg, Kanban and Scrum - making the most of both:
Lulu.com, 2010.
[18] Effective Agile Development. Available:
http://effectiveagiledev.com/AgileTraining/ScrumImplementation
Workshop/tabid/74/Default.aspx
[19] M. P. a. T. Poppendieck, Lean software development: an agile
toolkit. Boston: Addison-Wesley, 2003.
[20] M. Poppendieck and T. Poppendieck. (2011, Lean Software
Development. Available: http://www.poppendieck.com/
[21] D. J. Anderson, Kanban. Sequim: Blue Hole Press 2010.
[22] D. G. Reinertsen, The Principles of Product Development Flow:
Second Generation Lean Product Development Redondo Beach:
Celeritas Publishing, 2009.
[23] A. Cockburn, "What engineering has in common with
manufacturing and why it matters," Humans and Technology
Technical Report Sept 6 2006.
22
[24] R. D. Austin, Measuring and Managing Performance In
Organizations: Dorset House Publishing 1996.
[25] M. Poppendieck and T. Poppendieck, Leading Lean Software
Development: Results Are not the Point: Addison-Wesley
Professional, 2009.
[26] M. Umarji and C. Seaman, "Why do programmers avoid metrics?,"
presented at the Proceedings of the Second ACM-IEEE
international symposium on Empirical software engineering and
measurement, Kaiserslautern, Germany, 2008.
[27] A. Gopal, et al., "Measurement Programs in Software
Development: Determinants of Success," IEEE Trans. Softw. Eng.,
vol. 28, pp. 863-875, 2002.
[28] J. D. Herbsleb and R. E. Grinter, "Conceptual simplicity meets
organizational complexity: case study of a corporate metrics
program," presented at the Proceedings of the 20th international
conference on Software engineering, Kyoto, Japan, 1998.
[29] C. Dekkers, "The secrects of highly successful measurement
programs," Cutter IT Journal, 1999.
[30] S. L. Pfleeger, "Lessons Learned in Building a Corporate Metrics
Program," IEEE Softw., vol. 10, pp. 67-74, 1993.
[31] S. Guckenheimer, "Software Engineering with Microsoft Visual
Studio Team System ", ed: Addison-Wesley Professional, 2006.
[32] R. C. Brad Appleton, Steve Berczuk (2007, Lean-based Metrics
for Agile CM Environments. Available:
http://www.cmcrossroads.com/agile-scm/7820-lean-based-metrics-
for-agile-cm-environments
[33] R. Behn, "Why measure Performance? Different Purposes Require
Different Measures.," Public Administration Review, vol. 63, pp.
586-606, 2003.
[34] R. Kaplan and D. Norton, "Putting the balanced scorecard to
work," Harvard Business Review, 1993.
[35] G. S. d. A. Junior and S. R. d. L. Meira, "Towards Effective
Productivity Measurement in Software Projects," Software
Engineering Advances, 2009. ICSEA '09., pp. 241-249, 2009.
[36] V. Basili, et al., "The goal question metric approach "
Encyclopedia of Software Engineering, 1994.
[37] management accounting Available:
http://www.businessdictionary.com/definition/management-
accounting.html
[38] E. Goldratt, Theory of Constraints: North River Press, 1990.
[39] B. Boehm and R. Turner, "Management challenges to
implementing agile processes in
traditional development organizations," IEEE software, pp. 30-39,
2005.
[40] B. Boehm and K. Sullivan, "Software economics: a roadmap,"
presented at the Proceedings of the Conference on The Future of
Software Engineering, Limerick, Ireland, 2000.
[41] P. Pretorius, "Long term decision making using throughput
accounting," in AFRICON, 2004. 7th AFRICON Conference in
Africa, 2004, pp. 861-866 Vol.2.
[42] M. Poppendieck and T. Poppendieck, Implementing Lean Software
Development: From Concept to Cash Addison-Wesley
Professional 2006.
[43] P. Behrens. (2009, Measuring Agility: Top 5 Metrics And Myths.
Available: http://www.slideshare.net/petebehrens/measuring-
agility-top-5-metrics-and-myths
[44] M. Cohn, Agile Estimating and Planning: Prentice Hall 2005.
[45] I. Gat, The Concise Executive Guide to Agile IEEE Computer
Society Press 2010.
[46] L.-O. Damm, et al., "Faults-slip-through—a concept for measuring
the efficiency of the test process," Software Process: Improvement
and Practice, vol. 11, pp. 47-59, 2006.
[47] K. Petersen and C. Wohlin, "Software process improvement
through the Lean Measurement (SPI-LEAM) method," Journal of
Systems and Software, vol. 83, pp. 1275-1287, 2010.
[48] Y. Dubinsky, et al., "Agile metrics at the Israeli Air Force," in
Agile Conference, 2005. Proceedings, 2005, pp. 12-19.
[49] W. Eckerson, Performance Dashboards: Measuring, Monitoring,
and Managing Your Business Wiley, 2005.
[50] D. Reinertsen and P. Smith, Developing Products in Half the Time:
New Rules, New Tools: Wiley, 1997.
[51] C. Hibbs, et al., The Art of Lean Software Development: O'Reilly
Media, 2009.
[52] E. Deming, Out of the Crisis The MIT Press, 2000.
[53] 2011-02-23). Constructive research. Available:
http://en.wikipedia.org/wiki/Constructive_research
[54] D. E. Avison, et al., "Action research," Commun. ACM, vol. 42,
pp. 94-97, 1999.
[55] T. J. Rapley, "The art (fulness) of open-ended interviewing: some
considerations on analysing interviews," Qualitative Research,
2001.
[56] 2011). Gray literature. Available:
http://en.wikipedia.org/wiki/Gray_literature
[57] A. Khodabandeh and P. Palazzi, "Software Development: People,
Process, Technology," CERN School of Computing, 1994.
[58] AgileZen Project management gets lean. Available:
http://agilezen.com/
[59] T. J. McCabe, "A complexity measure," presented at the
Proceedings of the 2nd international conference on Software
engineering, San Francisco, California, United States, 1976.
[60] B. Hambling, SOFTWARE TESTING An ISTQB-ISEB Foundation
Guide Second Edition. Swindon: British Informatics Society, 2010.