Embed Size (px)
Citation preview
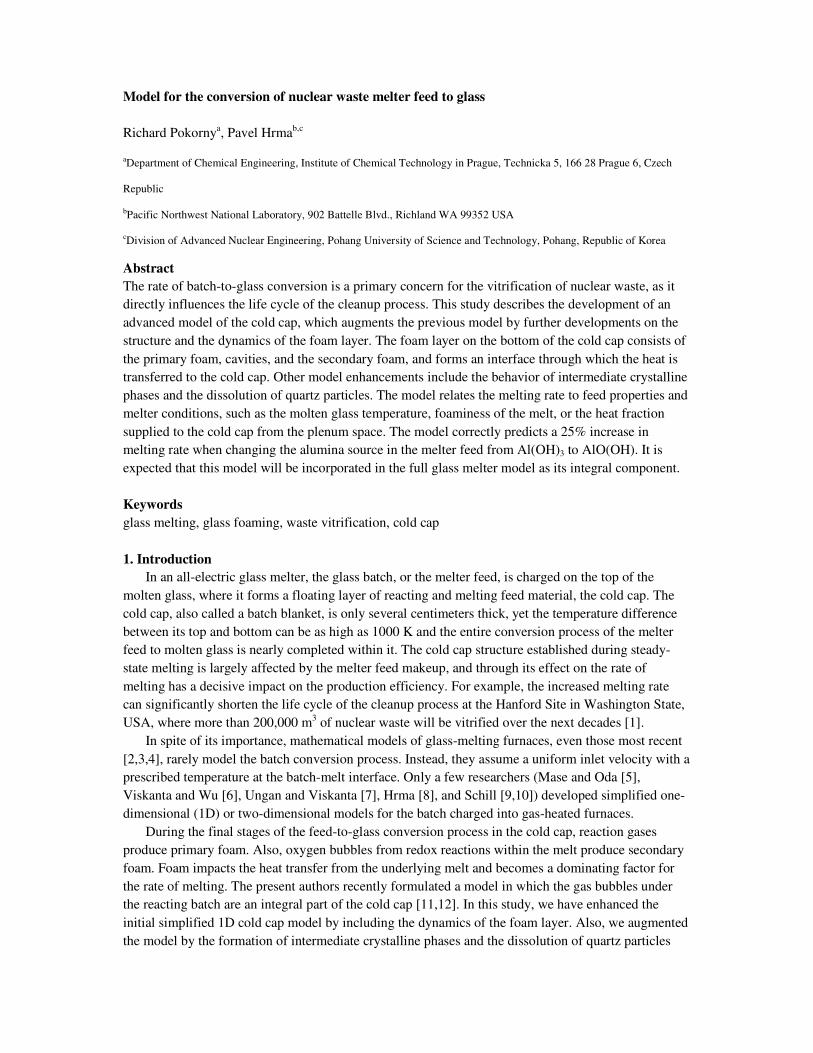
Model for the conversion of nuclear waste melter feed to glass
Richard Pokornya, Pavel Hrmab,c
aDepartment of Chemical Engineering, Institute of Chemical Technology in Prague, Technicka 5, 166 28 Prague 6, Czech
Republic
bPacific Northwest National Laboratory, 902 Battelle Blvd., Richland WA 99352 USA
cDivision of Advanced Nuclear Engineering, Pohang University of Science and Technology, Pohang, Republic of Korea
Abstract
The rate of batch-to-glass conversion is a primary concern for the vitrification of nuclear waste, as it
directly influences the life cycle of the cleanup process. This study describes the development of an
advanced model of the cold cap, which augments the previous model by further developments on the
structure and the dynamics of the foam layer. The foam layer on the bottom of the cold cap consists of
the primary foam, cavities, and the secondary foam, and forms an interface through which the heat is
transferred to the cold cap. Other model enhancements include the behavior of intermediate crystalline
phases and the dissolution of quartz particles. The model relates the melting rate to feed properties and
melter conditions, such as the molten glass temperature, foaminess of the melt, or the heat fraction
supplied to the cold cap from the plenum space. The model correctly predicts a 25% increase in
melting rate when changing the alumina source in the melter feed from Al(OH)3 to AlO(OH). It is
expected that this model will be incorporated in the full glass melter model as its integral component.
Keywords
glass melting, glass foaming, waste vitrification, cold cap
1. Introduction
In an all-electric glass melter, the glass batch, or the melter feed, is charged on the top of the
molten glass, where it forms a floating layer of reacting and melting feed material, the cold cap. The
cold cap, also called a batch blanket, is only several centimeters thick, yet the temperature difference
between its top and bottom can be as high as 1000 K and the entire conversion process of the melter
feed to molten glass is nearly completed within it. The cold cap structure established during steady-
state melting is largely affected by the melter feed makeup, and through its effect on the rate of
melting has a decisive impact on the production efficiency. For example, the increased melting rate
can significantly shorten the life cycle of the cleanup process at the Hanford Site in Washington State,
USA, where more than 200,000 m3 of nuclear waste will be vitrified over the next decades [1].
In spite of its importance, mathematical models of glass-melting furnaces, even those most recent
[2,3,4], rarely model the batch conversion process. Instead, they assume a uniform inlet velocity with a
prescribed temperature at the batch-melt interface. Only a few researchers (Mase and Oda [5],
Viskanta and Wu [6], Ungan and Viskanta [7], Hrma [8], and Schill [9,10]) developed simplified one-
dimensional (1D) or two-dimensional models for the batch charged into gas-heated furnaces.
During the final stages of the feed-to-glass conversion process in the cold cap, reaction gases
produce primary foam. Also, oxygen bubbles from redox reactions within the melt produce secondary
foam. Foam impacts the heat transfer from the underlying melt and becomes a dominating factor for
the rate of melting. The present authors recently formulated a model in which the gas bubbles under
the reacting batch are an integral part of the cold cap [11,12]. In this study, we have enhanced the
initial simplified 1D cold cap model by including the dynamics of the foam layer. Also, we augmented
the model by the formation of intermediate crystalline phases and the dissolution of quartz particles
[13]. Furthermore, we employed recent experimental studies of the properties of melting feed, such as
heat capacity [14] and heat conductivity [15].
Our ultimate goal is to incorporate the cold cap model into the full waste-glass melter model. This
will allow the melting rate to be estimated as a function of the feed formulation and melter operating
conditions, thus helping to save the time and cost of the empirical development.
The particular melter feed chosen for this study has been formulated to vitrify one of the nuclear
wastes considered for the Waste Treatment and Immobilization Plant, currently under construction at
the Hanford Site. However, the paper is more focused on the model development than on a particular
waste stream. Therefore, the methodology can be applied in any situation where a steady cold cap
occurs.
The structure of the cold cap is described in Section 2, where the heat transfer through the foam
layer and its impact on the rate of melting are described in detail. Section 3 summarizes the
experimental data used in this work. The results are given in Section 4. Section 5 then addresses,
among other topics, the route for the future implementation of the cold cap model into the model of
the glass melter.
2. Theory
The cold cap model presented in this work rests on two simplifying assumptions. First, it is
assumed that all feed components and evolving gases move, and that the heat flows, in the vertical
direction. Thus, horizontal mass and heat flows are omitted. This assumption allows us to treat the
feed-to-glass conversion within the cold cap as a 1D problem. Therefore, situations where some feed
components move horizontally are not covered by the model. Second, we assume that all solids and
liquids (molten salts and glass-forming melt) move with the same velocity. This allows us to treat the
solid and liquid phases as a single condensed phase. Phenomena such as the reflux of volatiles or
drainage of low-viscosity melt are not represented.
2.1 Cold cap structure
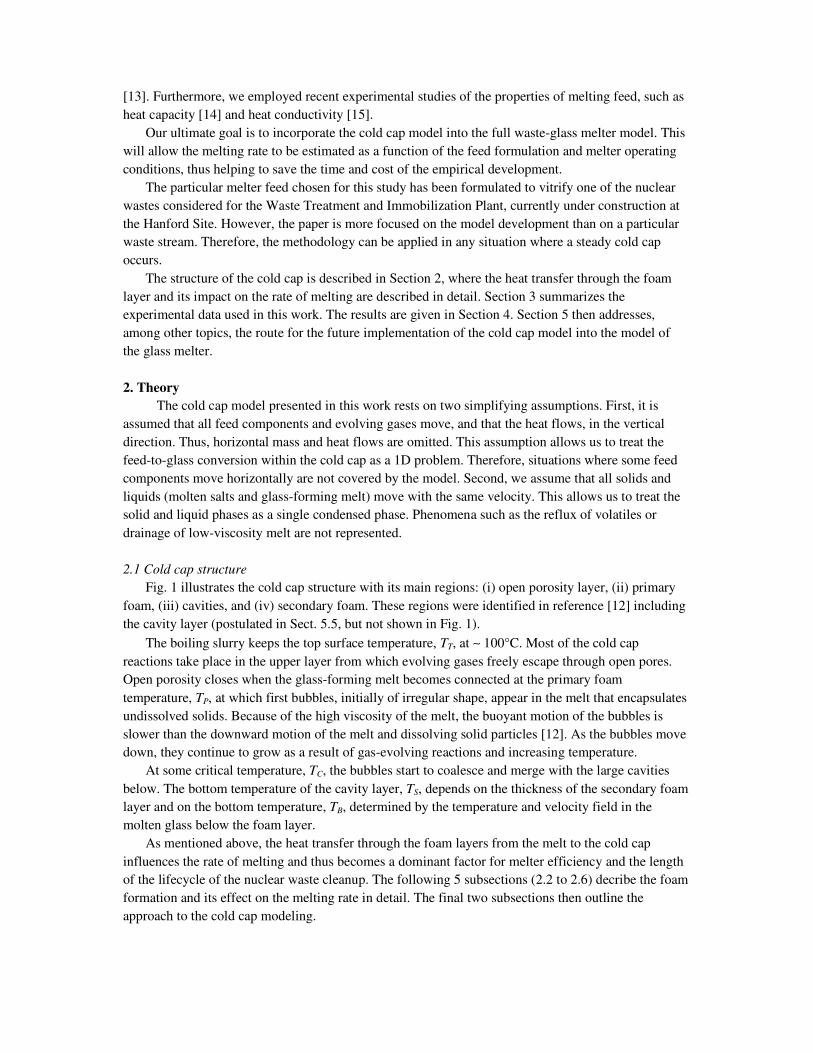
Fig. 1 illustrates the cold cap structure with its main regions: (i) open porosity layer, (ii) primary
foam, (iii) cavities, and (iv) secondary foam. These regions were identified in reference [12] including
the cavity layer (postulated in Sect. 5.5, but not shown in Fig. 1).
The boiling slurry keeps the top surface temperature, TT, at ∼ 100°C. Most of the cold cap
reactions take place in the upper layer from which evolving gases freely escape through open pores.
Open porosity closes when the glass-forming melt becomes connected at the primary foam
temperature, TP, at which first bubbles, initially of irregular shape, appear in the melt that encapsulates
undissolved solids. Because of the high viscosity of the melt, the buoyant motion of the bubbles is
slower than the downward motion of the melt and dissolving solid particles [12]. As the bubbles move
down, they continue to grow as a result of gas-evolving reactions and increasing temperature.
At some critical temperature, TC, the bubbles start to coalesce and merge with the large cavities
below. The bottom temperature of the cavity layer, TS, depends on the thickness of the secondary foam
layer and on the bottom temperature, TB, determined by the temperature and velocity field in the
molten glass below the foam layer.
As mentioned above, the heat transfer through the foam layers from the melt to the cold cap
influences the rate of melting and thus becomes a dominant factor for melter efficiency and the length
of the lifecycle of the nuclear waste cleanup. The following 5 subsections (2.2 to 2.6) decribe the foam
formation and its effect on the melting rate in detail. The final two subsections then outline the
approach to the cold cap modeling.
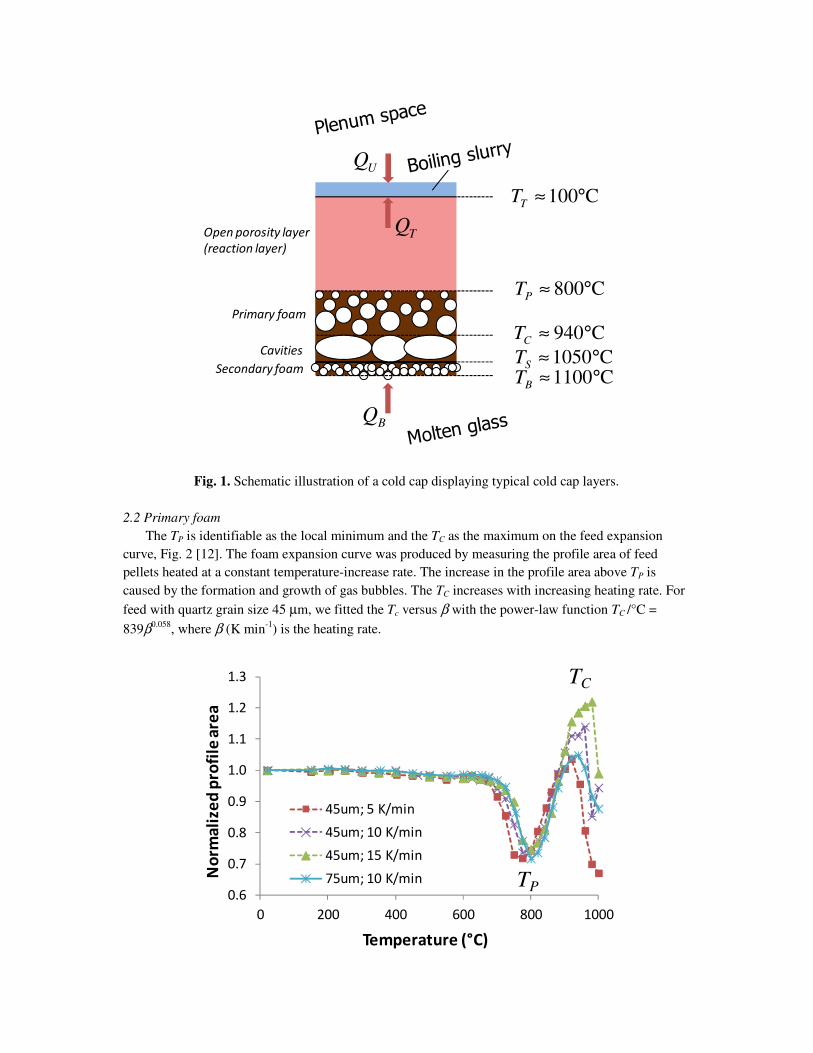
Fig. 1. Schematic illustration of a cold cap displaying typical cold cap layers.
2.2 Primary foam
The TP is identifiable as the local minimum and the TC as the maximum on the feed expansion
curve, Fig. 2 [12]. The foam expansion curve was produced by measuring the profile area of feed
pellets heated at a constant temperature-increase rate. The increase in the profile area above TP is
caused by the formation and growth of gas bubbles. The TC increases with increasing heating rate. For
feed with quartz grain size 45 µm, we fitted the Tc versus β with the power-law function TC /°C =
839β0.058, where β (K min
-1) is the heating rate.
C100°≈TT
C1050°≈ST
BQ
TQ
C940°≈CT
UQ
Primary foam
Secondary foam
C800°≈PT
Cavities
C1100°≈BT
Open porosity layer
(reaction layer)
0.6
0.7
0.8
0.9
1.0
1.1
1.2
1.3
0 200 400 600 800 1000
No
rma
lize
d p
rofi
le a
rea
Temperature (°C)
45um; 5 K/min
45um; 10 K/min
45um; 15 K/min
75um; 10 K/min
TC
TP
Fig. 2. Normalized melter-feed-pellet profile area versus temperature measured for various heating
rates and quartz grain sizes.
2.3 Cavities
The shape of a gas-filled cavity trapped in a quiescent liquid under a horizontal downward-facing
solid surface is determined by capillary forces [16]. Under the cold cap, the cavities are sandwiched
between two foam layers. Bubbles from the foam layers burst into the upper and lower surfaces of the
cavities. Though such cavities can hardly be described as bodies of gas in quiescent liquid under a
solid surface, their thickness is determined at their edges which interface with molten glass. Unless
obstructed horizontally, cavities are flat discs. In a typical molten glass, their thickness is ∼7 mm [12].
Generally, thin cavities do not possess sufficient buoyancy to force the accumulated gas vertically
through the cold cap. Instead, the gas cavities, or the gas in stagnant cavities, move sideways to the
edges of the cold cap and to vent holes (openings in the cold cap), where the gas is released to the
plenum space. The vent holes appear as local disturbances in the cold cap or are created by big bubbles
from bubblers submerged in the molten glass. When obstructed horizontally, cavities can grow
vertically without limits. This happens when the cold cap touches the melter wall, an event that
normally does not occur and cannot be captured in the 1D model. Also, the 1D model does not portray
the horizontal motion of cavities, which are treated as sinks of the gas liberated from the foam layers.
Assuming that the cavities have a shape of flat circular discs arranged in a hexagonal matrix, they
ideally cover ~90% of the cold cap area (the coverage ratio being p = ½π/√3), leaving ~10% of the
cold cap area for molten glass to flow down in the columns ten times faster than melt flows in the
absence of the gas phase. These columns plunge through secondary foam, which, unless disturbed by
bubblers (see Sect. 5.4), is solid-like and relatively still.
2.4 Secondary foam
Secondary foam is formed by bubbles from redox reactions in the molten glass. The thickness of
the secondary foam, hs, is governed by fluid mechanics as discussed in [17]. The foam height is
hs = Φjsg (1)
where jsg is the volumetric gas-phase flux entering the secondary foam from the melt and Φ is a
constant called the foaminess; as follows from this equation, foaminess is a measure of the extent of
foaming response of the liquid to the superficial gas flow [18]. The jsg is related to the condensed
phase flux (the rate of melting, jM) as
Msg kjj = (2)
For melt with a single multivalent oxide, such as Fe2O3, the oxide becomes increasingly reduced as the
melt temperature grows while it circulates in the melter. Then
k = PM
RTfg r
0
0 ν (3)
where g0 is the oxide mass fraction, fr is the oxide reduced fraction, M0 is the oxide molecular mass, ν
is the stoichiometric coefficient, R is the universal gas constant, and P is the pressure. Note that k has a
dimension m3 kg-1, because jsg is in m s-1, whereas jM is in kg m-2 s-1.
A combination of Eqs. (1) and (2) gives a linear relationship between the melting rate and
secondary foam thickness:
hs = kΦjM (4)
Thus, at a higher melting rate, more bubbles are created in molten glass (Eq. (2)). A higher flux of
ascending bubbles produces a thicker secondary foam layer (Eq. (4)), resulting in a lower TS (as
described in section 2.5).
In our study, the source of secondary foam gas is Fe2O3 (see Section 3.1):
2Fe2O3 → 4FeO + O2 (5)
For a small reduced fraction (0.04 is a typical value), we can write, fr ≈ Fe(II)/Fe(III). The redox ratio
is related to temperature as [19]
ln(fr) = A – B/T (6)
where A = 5.05 and B = 1.21 × 10⁴ K. For T = 1150°C, fr = 0.032. Since Mo = 208 g mol-1, ν = 2, R =
8.31 J mol-1 K-1, P = 1.01 × 10⁵ Pa, and g0 = 0.059 (see section 3.1). Thus, we have, by Eq. (3), k =
5.26 × 10⁻⁴
m3 kg
-1.
2.5 Heat transfer through foam layer
The heat flux, q, transferred through the foam layer determines the melting rate. According to
Fourier’s law, q = λiEff∆Ti/hi, where λEff is the effective heat conductivity, ∆T is the temperature
difference across the layer, h is the layer thickness, and subscript i represents primary (i ≡ p) or
secondary (i ≡ s) foam layer. The heat is transferred across the cavity layer by both conduction, qc,cond
= λc(TS − TC)/hc, and radiation, qc,rad = σ(TS4 − TC
4)/(2/ε − 1), where λc is the heat conductivity of the
melting feed in the cavity, hc is the cavity layer thickness, ε is the emissivity, and σ = 5.670373 × 10⁻⁸
Wm-2
K-4
is the Stefan-Boltzmann constant. For simulations, we used ε = 0.88, reported for molten
glass by Viskanta and Wu [6]. Neglecting the contribution of the conductive heat transfer in the gas
phase, we have q = pqc,cond + (1 − p)qc,rad. The surface coverage ratio is set to p = 0.15 in our
simulations.
Because the thicknesses of foam layers are controlled by liquid film stability and the thickness of
the cavity layer is given by capillarity, smaller ∆Tis are not automatically compensated by smaller his.
According to Fourier’s law, q = λs(TS − TB)/hs, and by Eq. (4), the higher melting rate (and
corresponding higher heat flux) results in a decreased TS. Thus, a higher melting rate causes a
simultaneous increase of TC and decrease of TS, reducing the temperature difference (TS − TC) across
the cavity layer and decreasing the heat flux to the cold cap, hence decreasing the melting rate.
Accordingly, a melting rate exists at which the steady-state temperature gradient across the cavity
layer, (TS − TC)/hc, corresponds to the constant rate of melting. If the feed is charged to the melter
faster, not enough heat will be supplied across the foam layer and the cold cap will spread to the
melter walls. If the feeding rate is slower, the cold cap will shrink.
2.6 The algorithm for estimation of melting rate
Neglecting the heat consumed in the foam layer, the heat q transferred across foam layers is
constant, thus
q = qi for i ≡ p, c, s (7)
which gives us a set of three linearly dependent equations, from which we can choose two
independent, for example,
λp(TP − TC)/hp = pqc,cond + (1 − p)qc,rad = (1 − p)λcavity(TS − TC)/hc + pσ(TS4 − TC
4)/(2/ε − 1)
λp(TP − TC)/hp = λs(TS − TB)/hs (8)
Because hc is determined by capillary forces and hs by Eq. (4), the TS, hp, and q can be obtained
from the solution of Eq. (8).
The condensed-phase mass flux, jT, at the cold cap top is related to the heat flux q as
( )slurryplenummelt
THfH
qj
−+=
1
(9)
where Hmelt = ∫B
T
T
T
Eff
b dTc is the heat necessary to raise the dry feed temperature from 100°C to
1100°C, Hslurry is the heat to turn the slurry fed to the melter into dry feed at 100°C, fplenum is the
fraction of this heat supplied to the cold cap from the plenum space, and Eff
bc is the effective heat
capacity. Thus, the larger is the fraction of water evaporated from slurry by the heat supplied from
above, the higher is the melting rate at a constant heat flux across the foam layer.
2.7 Cold cap energy balance
The energy balance of the cold cap can be written in the following form [12]:
( )2
2
dx
Td
dx
dTcjcj
dt
dTc Eff
gg
Eff
bbbb λρ −−=
(10)
where ρ is the spatial density, c is the effective heat capacity, t is the time, j is the mass flux, x is the
spatial coordinate (vertical position), and the subscripts b and g denote the condensed phase and the
gas phase, respectively. The effective heat capacity of the condensed phase, cbEff, includes the heat
from melting reactions (such as evaporation of bonded water, etc.); see Section 3.3. The effective heat
conductivity is assumed to involve both conductive and radiative modes of heat transfer in the feed
(see Section 3.5).
The condensed-phase mass flux within the cold cap is calculated as jb = αbjT, where αb is the mass
fraction of condensed phase (see Section 3.2) and jT is the mass flux of dry feed entering the cold cap.
The total amount of evolved gas is ∆jb = jT – jM, where jM is the condensed-phase mass flux leaving the
cold cap (melting rate). Thus, the gas-phase mass flux can be calculated as jg = (αb − αM)jT, where αM
is the mass fraction of condensed phase at the cold cap bottom.
The energy balance equation was processed by finite volume method [15], using 150 finite
volumes. Considering the average cold cap thickness ∼3 cm, the discretization step was ∼0.2 mm. The
algorithm was coded in Mathworks® MATLAB 7.
2.8 Model iteration
The procedure for the incorporation of the foam layer model into the model of the cold cap is as
follows:
i) The initial melting rate and foam layer temperatures (TC, TS) are chosen.
ii) The thickness of the cold cap is calculated by the model based on the chosen melting rate and
foam layer temperatures (TC, TS).
iii) The average heating rate of the feed is calculated from the obtained time-temperature history of
the feed in the cold cap.
iv) Based on the average heating rate, the foam layer model updates the amount of heat transferred
through the foam layer together with the layer temperatures (TC, TS).
v) The new melting rate for the cold cap model is calculated from the heat transferred through foam.
vi) The temperatures of the foam layer in the cold cap model (TC, TS) are updated from the foam layer
model.
vii) The process is repeated from step ii) until the difference between the amount of heat transferred
through the foam layer and the heat necessary for melting is small, indicating that a steady-state
melting rate was reached.
3. Experimental
3.1 Melter feed
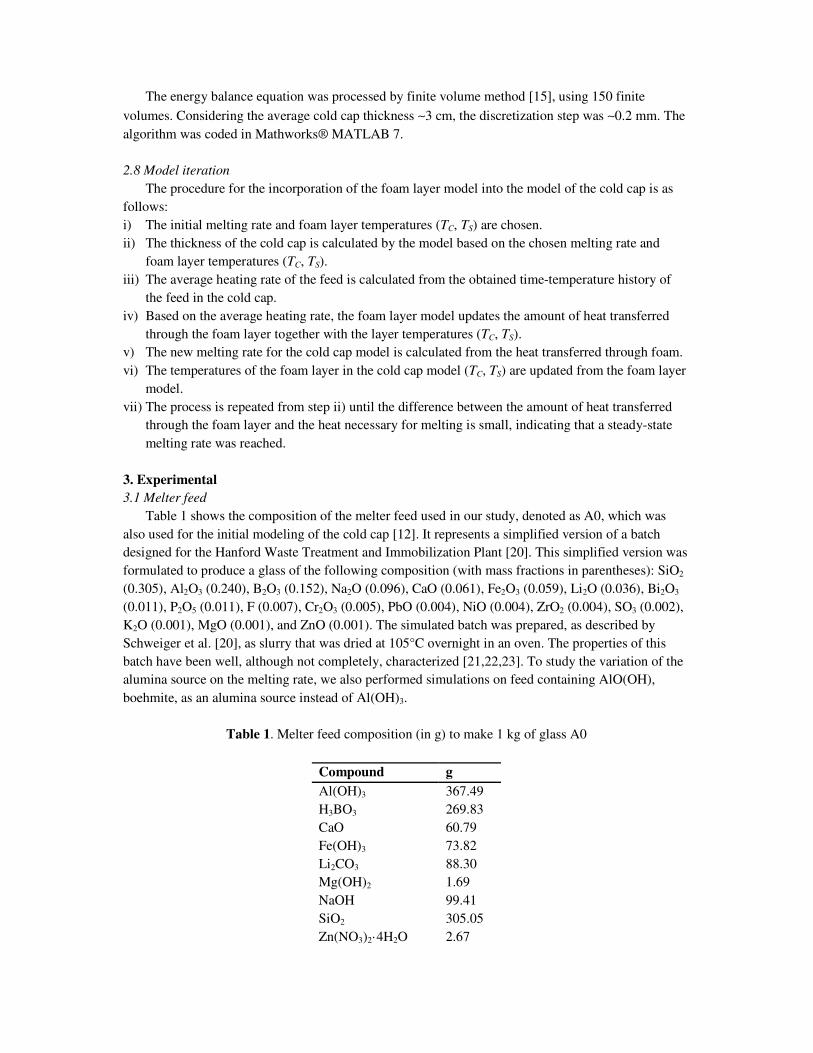
Table 1 shows the composition of the melter feed used in our study, denoted as A0, which was
also used for the initial modeling of the cold cap [12]. It represents a simplified version of a batch
designed for the Hanford Waste Treatment and Immobilization Plant [20]. This simplified version was
formulated to produce a glass of the following composition (with mass fractions in parentheses): SiO2
(0.305), Al2O3 (0.240), B2O3 (0.152), Na2O (0.096), CaO (0.061), Fe2O3 (0.059), Li2O (0.036), Bi2O3
(0.011), P2O5 (0.011), F (0.007), Cr2O3 (0.005), PbO (0.004), NiO (0.004), ZrO2 (0.004), SO3 (0.002),
K2O (0.001), MgO (0.001), and ZnO (0.001). The simulated batch was prepared, as described by
Schweiger et al. [20], as slurry that was dried at 105°C overnight in an oven. The properties of this
batch have been well, although not completely, characterized [21,22,23]. To study the variation of the
alumina source on the melting rate, we also performed simulations on feed containing AlO(OH),
boehmite, as an alumina source instead of Al(OH)3.
Table 1. Melter feed composition (in g) to make 1 kg of glass A0
Compound g
Al(OH)3 367.49
H3BO3 269.83
CaO 60.79
Fe(OH)3 73.82
Li2CO3 88.30
Mg(OH)2 1.69
NaOH 99.41
SiO2 305.05
Zn(NO3)2·4H2O 2.67
Zr(OH)4·0.65H2O 5.49
Na2SO4 3.55
Bi(OH)3 12.80
Na2CrO4 11.13
KNO3 3.04
NiCO3 6.36
Pb(NO3)2 6.08
Fe(H2PO2)3 12.42
NaF 14.78
NaNO2 3.37
Na2C2O4 1.26
Total 1349.32
3.2 Mass fraction of condensed phase
The kinetics of batch reactions that result in a change in the condensed-phase content was
addressed in [24]. As in our previous paper [15], we disregarded the effect of the changing heating rate
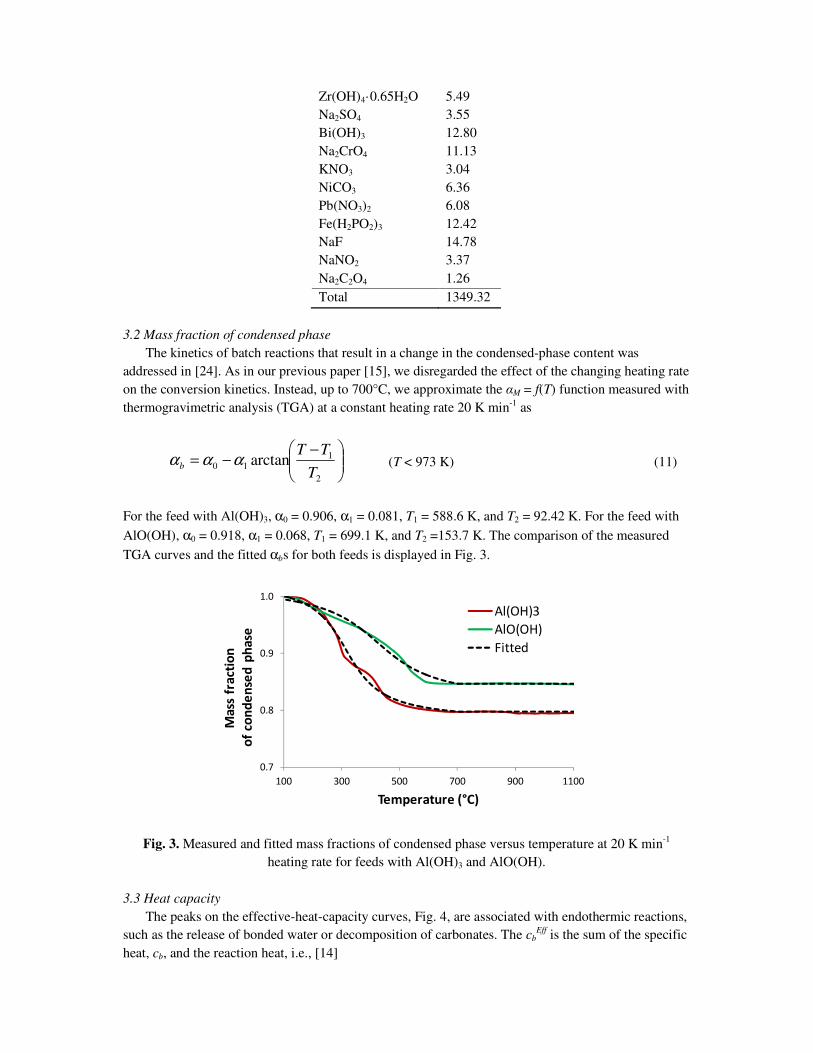
on the conversion kinetics. Instead, up to 700°C, we approximate the αM = f(T) function measured with
thermogravimetric analysis (TGA) at a constant heating rate 20 K min-1 as
−−=
2
110 arctan
T
TTb ααα (T < 973 K) (11)
For the feed with Al(OH)3, α0 = 0.906, α1 = 0.081, T1 = 588.6 K, and T2 = 92.42 K. For the feed with
AlO(OH), α0 = 0.918, α1 = 0.068, T1 = 699.1 K, and T2 =153.7 K. The comparison of the measured
TGA curves and the fitted αbs for both feeds is displayed in Fig. 3.
Fig. 3. Measured and fitted mass fractions of condensed phase versus temperature at 20 K min-1
heating rate for feeds with Al(OH)3 and AlO(OH).
3.3 Heat capacity
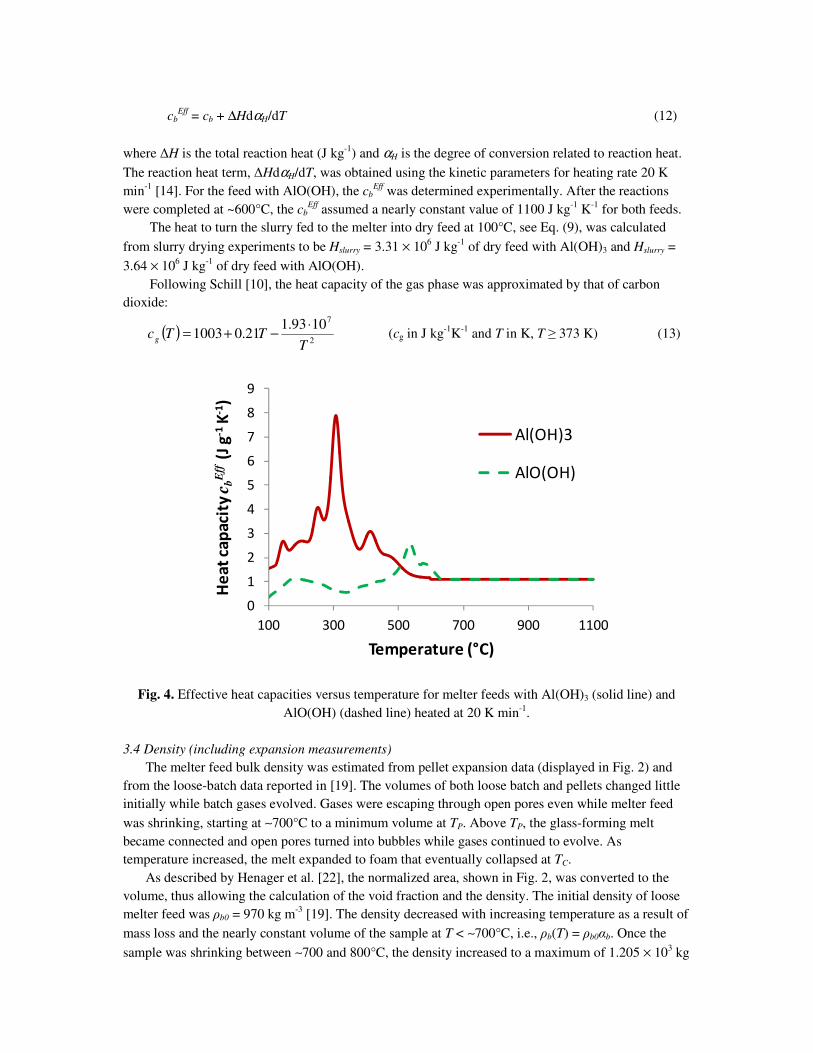
The peaks on the effective-heat-capacity curves, Fig. 4, are associated with endothermic reactions,
such as the release of bonded water or decomposition of carbonates. The cbEff is the sum of the specific
heat, cb, and the reaction heat, i.e., [14]
0.7
0.8
0.9
1.0
100 300 500 700 900 1100
Ma
ss f
ract
ion
of
con
de
nse
d p
ha
se
Temperature (°C)
Al(OH)3
AlO(OH)
Fitted
cbEff
= cb + ∆HdαH/dT (12)
where ∆H is the total reaction heat (J kg-1
) and αH is the degree of conversion related to reaction heat.
The reaction heat term, ∆HdαH/dT, was obtained using the kinetic parameters for heating rate 20 K
min-1
[14]. For the feed with AlO(OH), the cbEff
was determined experimentally. After the reactions
were completed at ~600°C, the cbEff
assumed a nearly constant value of 1100 J kg-1
K-1
for both feeds.
The heat to turn the slurry fed to the melter into dry feed at 100°C, see Eq. (9), was calculated
from slurry drying experiments to be Hslurry = 3.31 × 10⁶ J kg
-1 of dry feed with Al(OH)3 and Hslurry =
3.64 × 10⁶ J kg
-1 of dry feed with AlO(OH).
Following Schill [10], the heat capacity of the gas phase was approximated by that of carbon
dioxide:
( )2
71093.121.01003
TTTcg
⋅−+= (cg in J kg
-1K
-1 and T in K, T ≥ 373 K) (13)
Fig. 4. Effective heat capacities versus temperature for melter feeds with Al(OH)3 (solid line) and
AlO(OH) (dashed line) heated at 20 K min-1.
3.4 Density (including expansion measurements)
The melter feed bulk density was estimated from pellet expansion data (displayed in Fig. 2) and
from the loose-batch data reported in [19]. The volumes of both loose batch and pellets changed little
initially while batch gases evolved. Gases were escaping through open pores even while melter feed
was shrinking, starting at ∼700°C to a minimum volume at TP. Above TP, the glass-forming melt
became connected and open pores turned into bubbles while gases continued to evolve. As
temperature increased, the melt expanded to foam that eventually collapsed at TC.
As described by Henager et al. [22], the normalized area, shown in Fig. 2, was converted to the
volume, thus allowing the calculation of the void fraction and the density. The initial density of loose
melter feed was ρb0 = 970 kg m-3
[19]. The density decreased with increasing temperature as a result of
mass loss and the nearly constant volume of the sample at T < ∼700°C, i.e., ρb(T) = ρb0αb. Once the
sample was shrinking between ∼700 and 800°C, the density increased to a maximum of 1.205 × 10³ kg
0
1
2
3
4
5
6
7
8
9
100 300 500 700 900 1100
He
at
cap
aci
tyc b
Eff
(J
g-1
K-1
)
Temperature (°C)
Al(OH)3
AlO(OH)
m-3
. It can be assumed that the bulk density and porosity were not affected by the initial compression
of pellets at and above the minimum-volume temperature, TP. Then, above TP, the density decreased as
the bubbly melt turned to foam, reaching a minimum. For a heating rate of 15 K min-1, the minimum
density of 541 kg m-3
was reached at ~960°C when the void fraction increased to an unsustainable
value of 0.79.
The spatial density of the cavity layer, ρC, can be calculated as ρC = pρM, where p is the coverage
ratio defined in Section 2.5 and ρM = 2.5 × 10³ kg m
-3 is the molten glass density. Thus, with p = 0.15,
ρC = 375 kg m-3. Whereas the feed density has a crucial impact on the condensed-phase velocity and
heating rate, thus affecting the TC as explained in Section 2.2, the values of ρC and the spatial density
of secondary foam, ρS, do not significantly affect the simulation results. This is because the average
heating rate the feed is experiencing in the cavity and secondary foam regions do not affect the
behavior of layers above. For simplicity, we assumed that ρS and ρC have the same value.
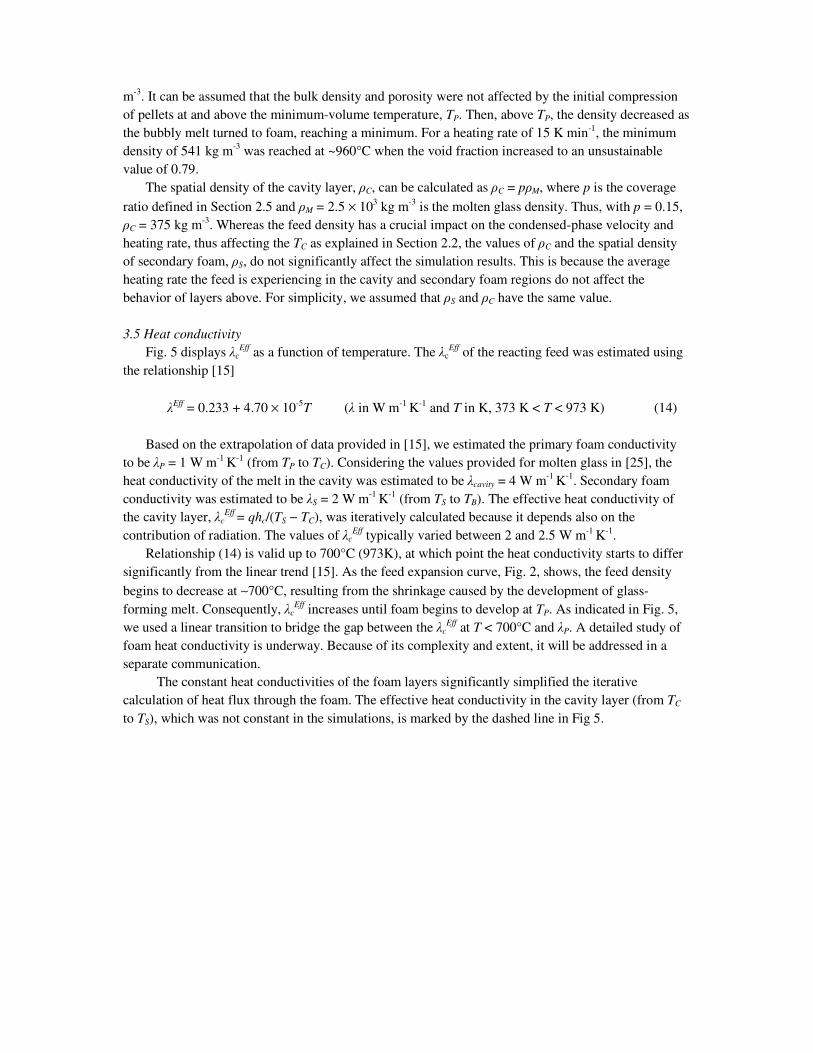
3.5 Heat conductivity
Fig. 5 displays λcEff as a function of temperature. The λc
Eff of the reacting feed was estimated using
the relationship [15]
λEff = 0.233 + 4.70 × 10⁻⁵T (λ in W m-1 K-1 and T in K, 373 K < T < 973 K) (14)
Based on the extrapolation of data provided in [15], we estimated the primary foam conductivity
to be λP = 1 W m-1 K-1 (from TP to TC). Considering the values provided for molten glass in [25], the
heat conductivity of the melt in the cavity was estimated to be λcavity = 4 W m-1
K-1
. Secondary foam
conductivity was estimated to be λS = 2 W m-1
K-1
(from TS to TB). The effective heat conductivity of
the cavity layer, λcEff
= qhc/(TS − TC), was iteratively calculated because it depends also on the
contribution of radiation. The values of λcEff typically varied between 2 and 2.5 W m-1 K-1.
Relationship (14) is valid up to 700°C (973K), at which point the heat conductivity starts to differ
significantly from the linear trend [15]. As the feed expansion curve, Fig. 2, shows, the feed density
begins to decrease at ∼700°C, resulting from the shrinkage caused by the development of glass-
forming melt. Consequently, λcEff
increases until foam begins to develop at TP. As indicated in Fig. 5,
we used a linear transition to bridge the gap between the λcEff at T < 700°C and λP. A detailed study of
foam heat conductivity is underway. Because of its complexity and extent, it will be addressed in a
separate communication.
The constant heat conductivities of the foam layers significantly simplified the iterative
calculation of heat flux through the foam. The effective heat conductivity in the cavity layer (from TC
to TS), which was not constant in the simulations, is marked by the dashed line in Fig 5.
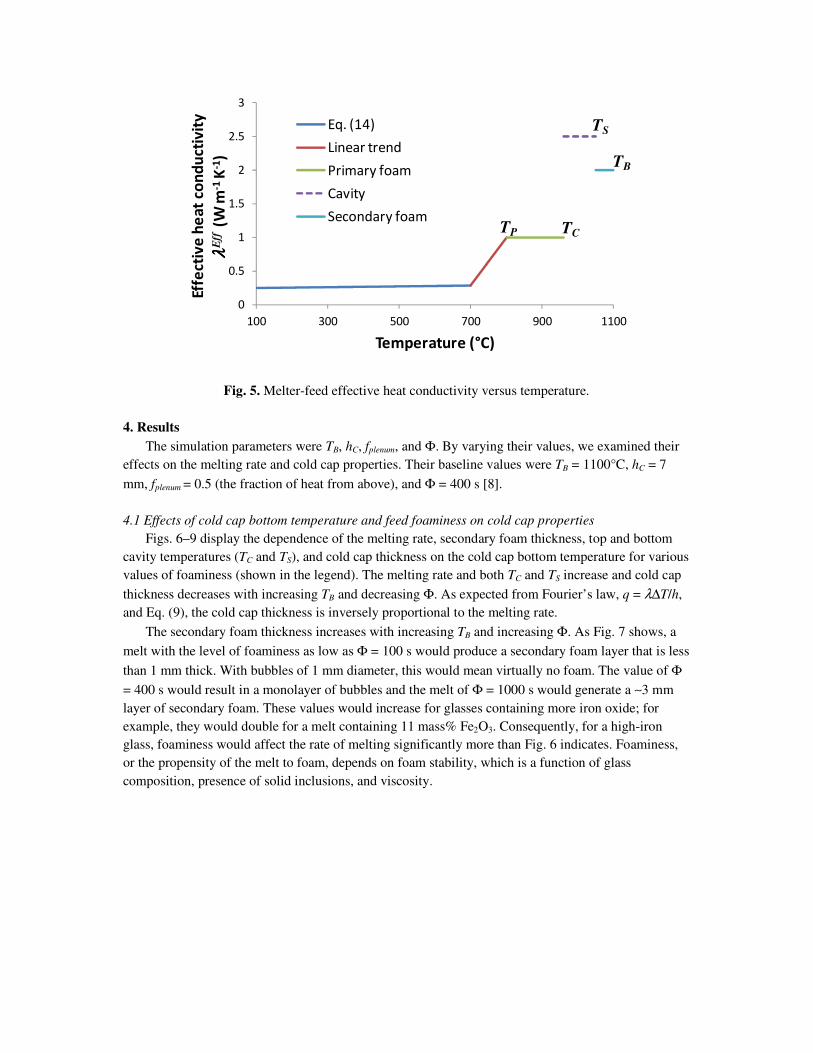
Fig. 5. Melter-feed effective heat conductivity versus temperature.
4. Results
The simulation parameters were TB, hC, fplenum, and Φ. By varying their values, we examined their
effects on the melting rate and cold cap properties. Their baseline values were TB = 1100°C, hC = 7
mm, fplenum = 0.5 (the fraction of heat from above), and Φ = 400 s [8].
4.1 Effects of cold cap bottom temperature and feed foaminess on cold cap properties
Figs. 6–9 display the dependence of the melting rate, secondary foam thickness, top and bottom
cavity temperatures (TC and TS), and cold cap thickness on the cold cap bottom temperature for various
values of foaminess (shown in the legend). The melting rate and both TC and TS increase and cold cap
thickness decreases with increasing TB and decreasing Φ. As expected from Fourier’s law, q = λ∆T/h,
and Eq. (9), the cold cap thickness is inversely proportional to the melting rate.
The secondary foam thickness increases with increasing TB and increasing Φ. As Fig. 7 shows, a
melt with the level of foaminess as low as Φ = 100 s would produce a secondary foam layer that is less
than 1 mm thick. With bubbles of 1 mm diameter, this would mean virtually no foam. The value of Φ
= 400 s would result in a monolayer of bubbles and the melt of Φ = 1000 s would generate a ∼3 mm
layer of secondary foam. These values would increase for glasses containing more iron oxide; for
example, they would double for a melt containing 11 mass% Fe2O3. Consequently, for a high-iron
glass, foaminess would affect the rate of melting significantly more than Fig. 6 indicates. Foaminess,
or the propensity of the melt to foam, depends on foam stability, which is a function of glass
composition, presence of solid inclusions, and viscosity.
0
0.5
1
1.5
2
2.5
3
100 300 500 700 900 1100
Effe
ctiv
e h
ea
t co
nd
uct
ivit
y
λλ λλE
ff (W
m-1
K-1
)
Temperature (°C)
Eq. (14)
Linear trend
Primary foam
Cavity
Secondary foamTP TC
TS
TB
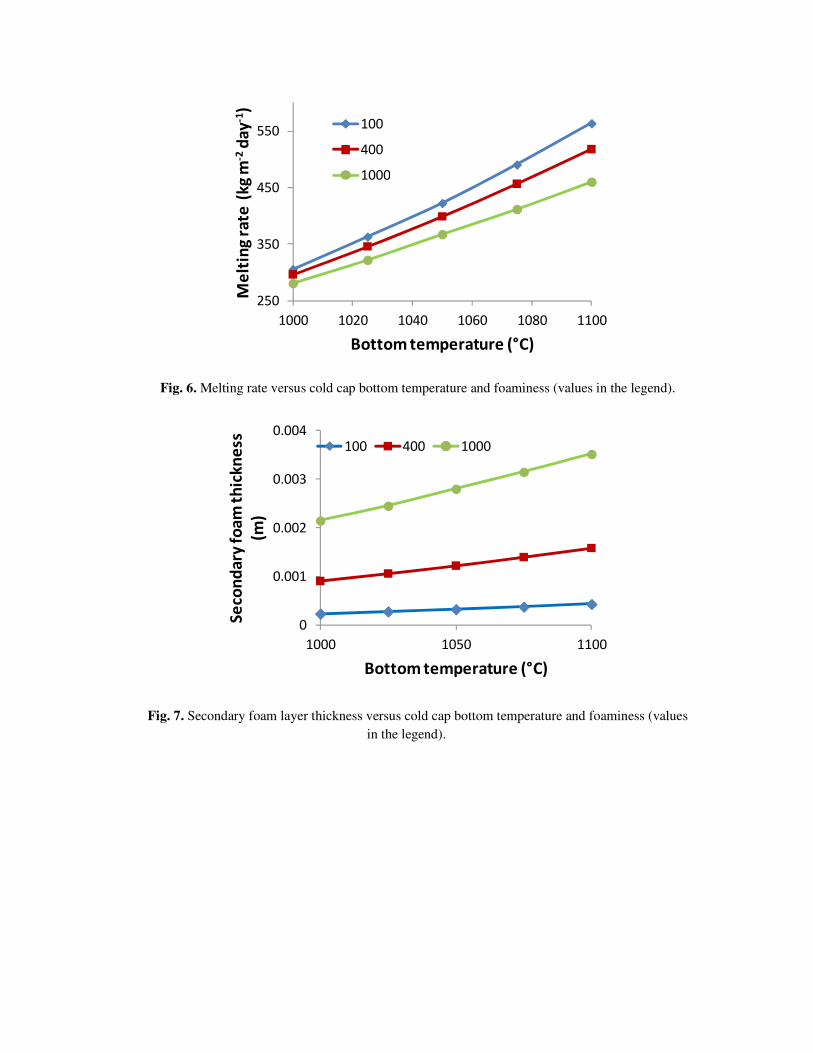
Fig. 6. Melting rate versus cold cap bottom temperature and foaminess (values in the legend).
Fig. 7. Secondary foam layer thickness versus cold cap bottom temperature and foaminess (values
in the legend).
250
350
450
550
1000 1020 1040 1060 1080 1100
Me
ltin
g r
ate
(k
g m
-2d
ay
-1)
Bottom temperature (°C)
100
400
1000
0
0.001
0.002
0.003
0.004
1000 1050 1100
Se
con
da
ryfo
am
th
ick
ne
ss
(m)
Bottom temperature (°C)
100 400 1000
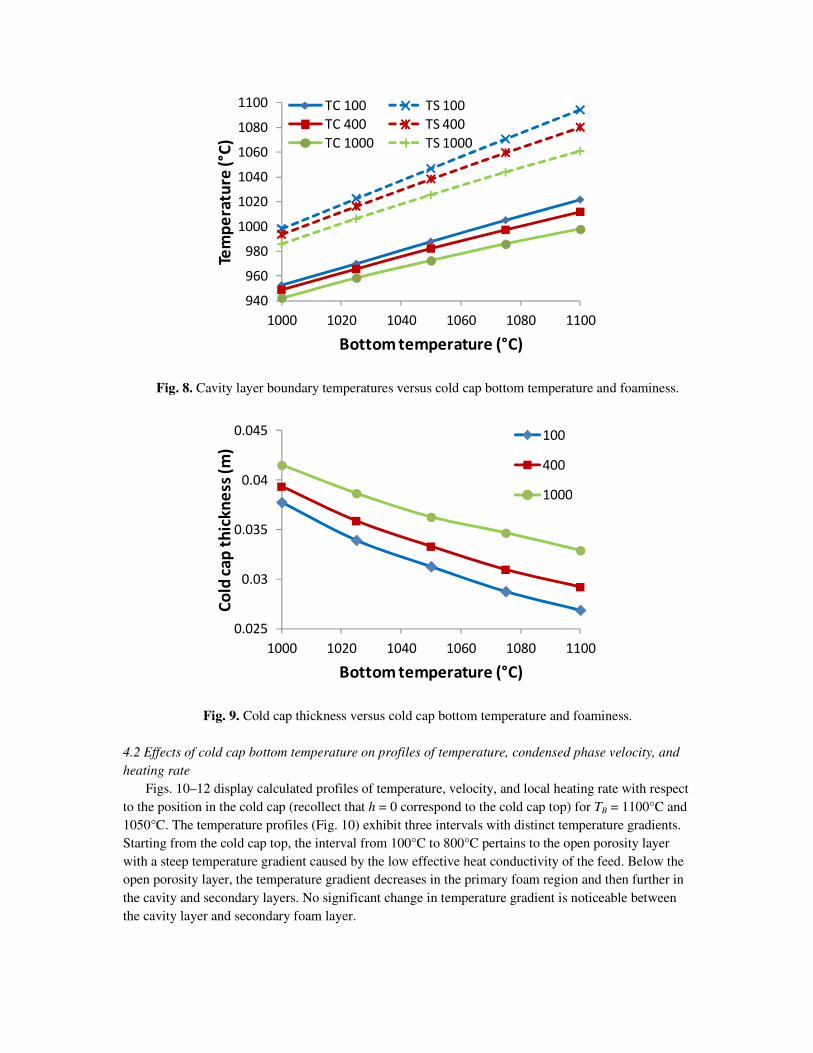
Fig. 8. Cavity layer boundary temperatures versus cold cap bottom temperature and foaminess.
Fig. 9. Cold cap thickness versus cold cap bottom temperature and foaminess.
4.2 Effects of cold cap bottom temperature on profiles of temperature, condensed phase velocity, and
heating rate
Figs. 10–12 display calculated profiles of temperature, velocity, and local heating rate with respect
to the position in the cold cap (recollect that h = 0 correspond to the cold cap top) for TB = 1100°C and
1050°C. The temperature profiles (Fig. 10) exhibit three intervals with distinct temperature gradients.
Starting from the cold cap top, the interval from 100°C to 800°C pertains to the open porosity layer
with a steep temperature gradient caused by the low effective heat conductivity of the feed. Below the
open porosity layer, the temperature gradient decreases in the primary foam region and then further in
the cavity and secondary layers. No significant change in temperature gradient is noticeable between
the cavity layer and secondary foam layer.
940
960
980
1000
1020
1040
1060
1080
1100
1000 1020 1040 1060 1080 1100
Tem
pe
ratu
re (
°C)
Bottom temperature (°C)
TC 100 TS 100
TC 400 TS 400
TC 1000 TS 1000
0.025
0.03
0.035
0.04
0.045
1000 1020 1040 1060 1080 1100
Co
ld c
ap
th
ick
ne
ss (
m)
Bottom temperature (°C)
100
400
1000
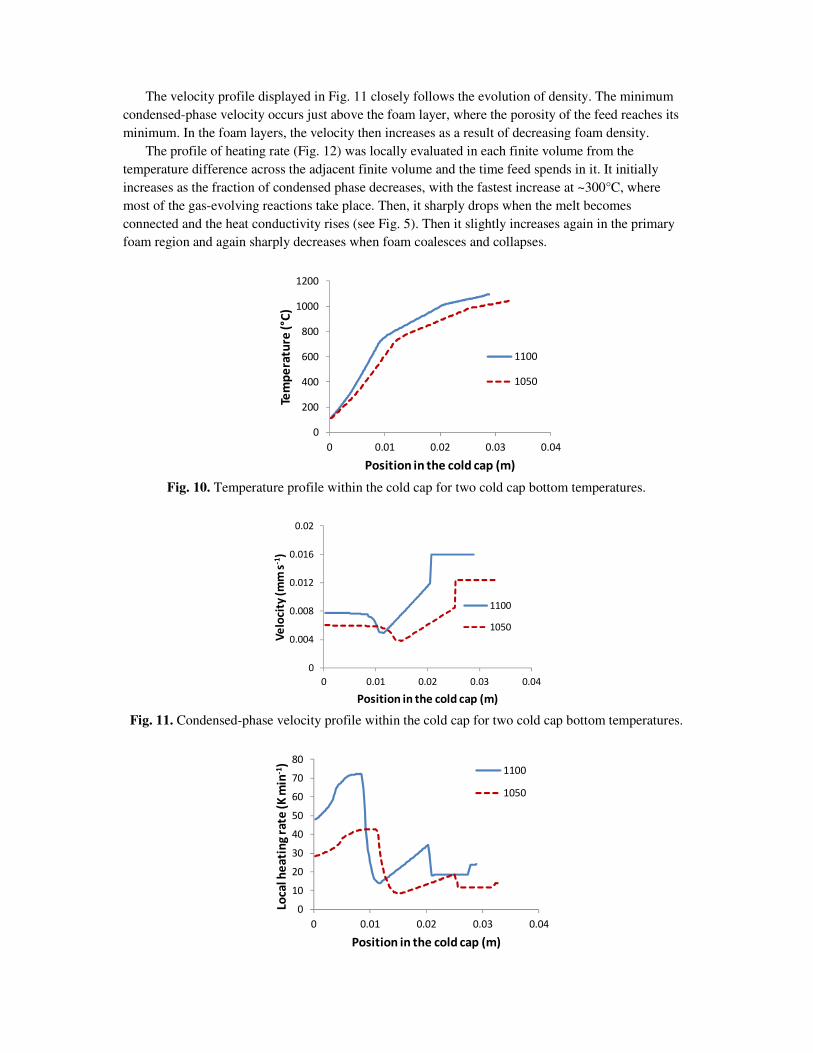
The velocity profile displayed in Fig. 11 closely follows the evolution of density. The minimum
condensed-phase velocity occurs just above the foam layer, where the porosity of the feed reaches its
minimum. In the foam layers, the velocity then increases as a result of decreasing foam density.
The profile of heating rate (Fig. 12) was locally evaluated in each finite volume from the
temperature difference across the adjacent finite volume and the time feed spends in it. It initially
increases as the fraction of condensed phase decreases, with the fastest increase at ~300°C, where
most of the gas-evolving reactions take place. Then, it sharply drops when the melt becomes
connected and the heat conductivity rises (see Fig. 5). Then it slightly increases again in the primary
foam region and again sharply decreases when foam coalesces and collapses.
Fig. 10. Temperature profile within the cold cap for two cold cap bottom temperatures.
Fig. 11. Condensed-phase velocity profile within the cold cap for two cold cap bottom temperatures.
0
200
400
600
800
1000
1200
0 0.01 0.02 0.03 0.04
Tem
pe
ratu
re (
°C)
Position in the cold cap (m)
1100
1050
0
0.004
0.008
0.012
0.016
0.02
0 0.01 0.02 0.03 0.04
Ve
loci
ty (
mm
s-1)
Position in the cold cap (m)
1100
1050
0
10
20
30
40
50
60
70
80
0 0.01 0.02 0.03 0.04
Loca
l he
ati
ng
ra
te (
K m
in-1
)
Position in the cold cap (m)
1100
1050
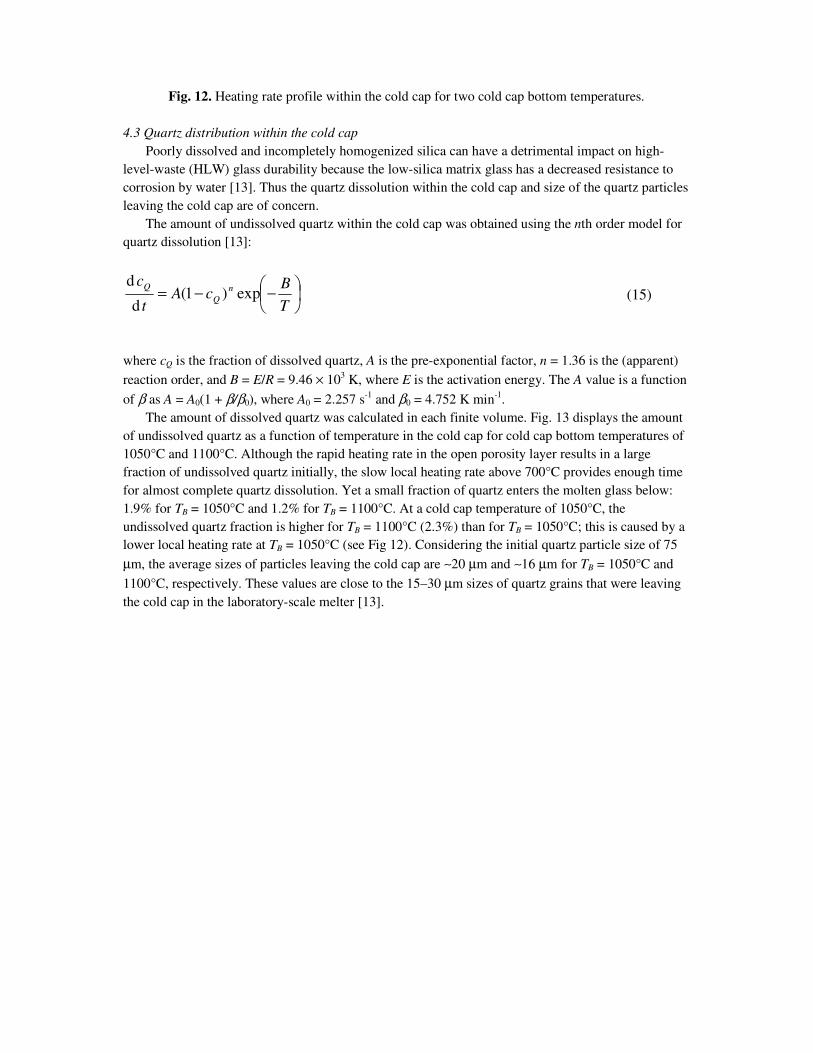
Fig. 12. Heating rate profile within the cold cap for two cold cap bottom temperatures.
4.3 Quartz distribution within the cold cap
Poorly dissolved and incompletely homogenized silica can have a detrimental impact on high-
level-waste (HLW) glass durability because the low-silica matrix glass has a decreased resistance to
corrosion by water [13]. Thus the quartz dissolution within the cold cap and size of the quartz particles
leaving the cold cap are of concern.
The amount of undissolved quartz within the cold cap was obtained using the nth order model for
quartz dissolution [13]:
−−=T
BcA
t
cn
Q
Qexp)1(
d
d (15)
where cQ is the fraction of dissolved quartz, A is the pre-exponential factor, n = 1.36 is the (apparent)
reaction order, and B = E/R = 9.46 × 10³ K, where E is the activation energy. The A value is a function
of β as A = A0(1 + β/β0), where A0 = 2.257 s-1
and β0 = 4.752 K min-1
.
The amount of dissolved quartz was calculated in each finite volume. Fig. 13 displays the amount
of undissolved quartz as a function of temperature in the cold cap for cold cap bottom temperatures of
1050°C and 1100°C. Although the rapid heating rate in the open porosity layer results in a large
fraction of undissolved quartz initially, the slow local heating rate above 700°C provides enough time
for almost complete quartz dissolution. Yet a small fraction of quartz enters the molten glass below:
1.9% for TB = 1050°C and 1.2% for TB = 1100°C. At a cold cap temperature of 1050°C, the
undissolved quartz fraction is higher for TB = 1100°C (2.3%) than for TB = 1050°C; this is caused by a
lower local heating rate at TB = 1050°C (see Fig 12). Considering the initial quartz particle size of 75
µm, the average sizes of particles leaving the cold cap are ∼20 µm and ∼16 µm for TB = 1050°C and
1100°C, respectively. These values are close to the 15–30 µm sizes of quartz grains that were leaving
the cold cap in the laboratory-scale melter [13].
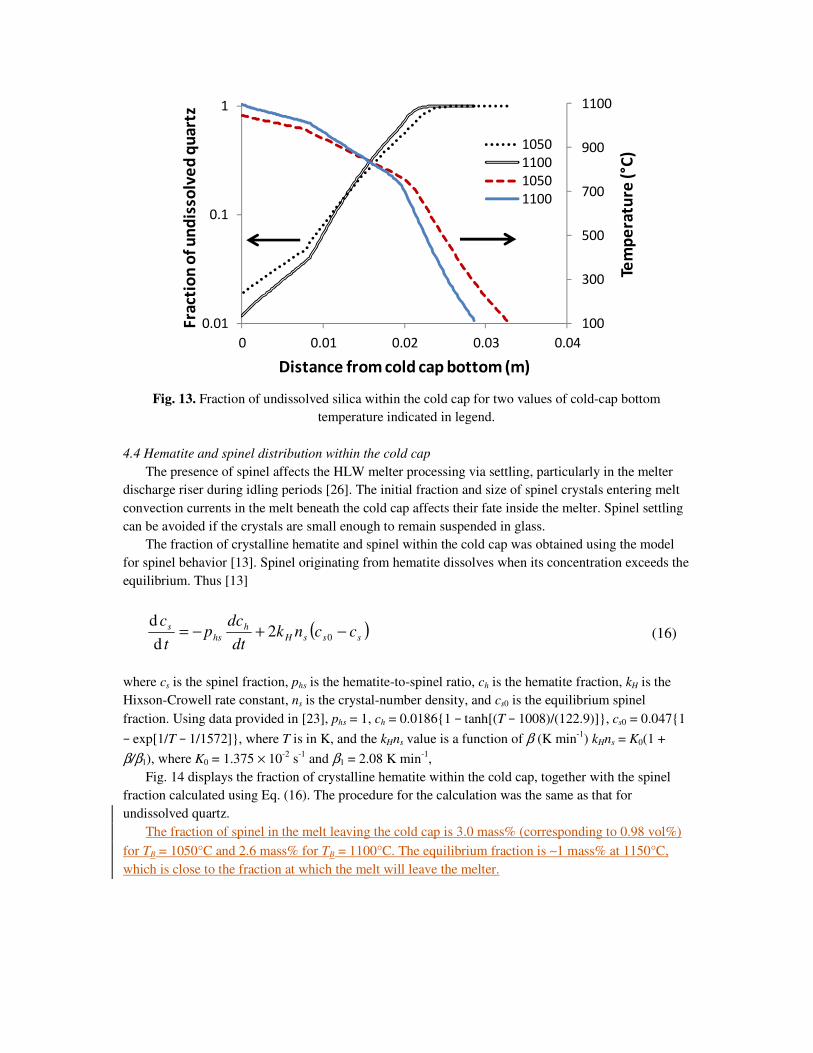
Fig. 13. Fraction of undissolved silica within the cold cap for two values of cold-cap bottom
temperature indicated in legend.
4.4 Hematite and spinel distribution within the cold cap
The presence of spinel affects the HLW melter processing via settling, particularly in the melter
discharge riser during idling periods [26]. The initial fraction and size of spinel crystals entering melt
convection currents in the melt beneath the cold cap affects their fate inside the melter. Spinel settling
can be avoided if the crystals are small enough to remain suspended in glass.
The fraction of crystalline hematite and spinel within the cold cap was obtained using the model
for spinel behavior [13]. Spinel originating from hematite dissolves when its concentration exceeds the
equilibrium. Thus [13]
( )sssH
h
hs
s ccnkdt
dcp
t
c−+−= 02
d
d (16)
where cs is the spinel fraction, phs is the hematite-to-spinel ratio, ch is the hematite fraction, kH is the
Hixson-Crowell rate constant, ns is the crystal-number density, and cs0 is the equilibrium spinel
fraction. Using data provided in [23], phs = 1, ch = 0.0186{1 − tanh[(T − 1008)/(122.9)]}, cs0 = 0.047{1
− exp[1/T − 1/1572]}, where T is in K, and the kHns value is a function of β (K min-1
) kHns = K0(1 +
β/β1), where K0 = 1.375 × 10⁻²
s-1
and β1 = 2.08 K min-1
,
Fig. 14 displays the fraction of crystalline hematite within the cold cap, together with the spinel
fraction calculated using Eq. (16). The procedure for the calculation was the same as that for
undissolved quartz.
The fraction of spinel in the melt leaving the cold cap is 3.0 mass% (corresponding to 0.98 vol%)
for TB = 1050°C and 2.6 mass% for TB = 1100°C. The equilibrium fraction is ∼1 mass% at 1150°C,
which is close to the fraction at which the melt will leave the melter.
100
300
500
700
900
1100
0.01
0.1
1
0 0.01 0.02 0.03 0.04
Tem
pe
ratu
re (
°C)
Fra
ctio
n o
f u
nd
isso
lve
d q
ua
rtz
Distance from cold cap bottom (m)
1050
1100
1050
1100
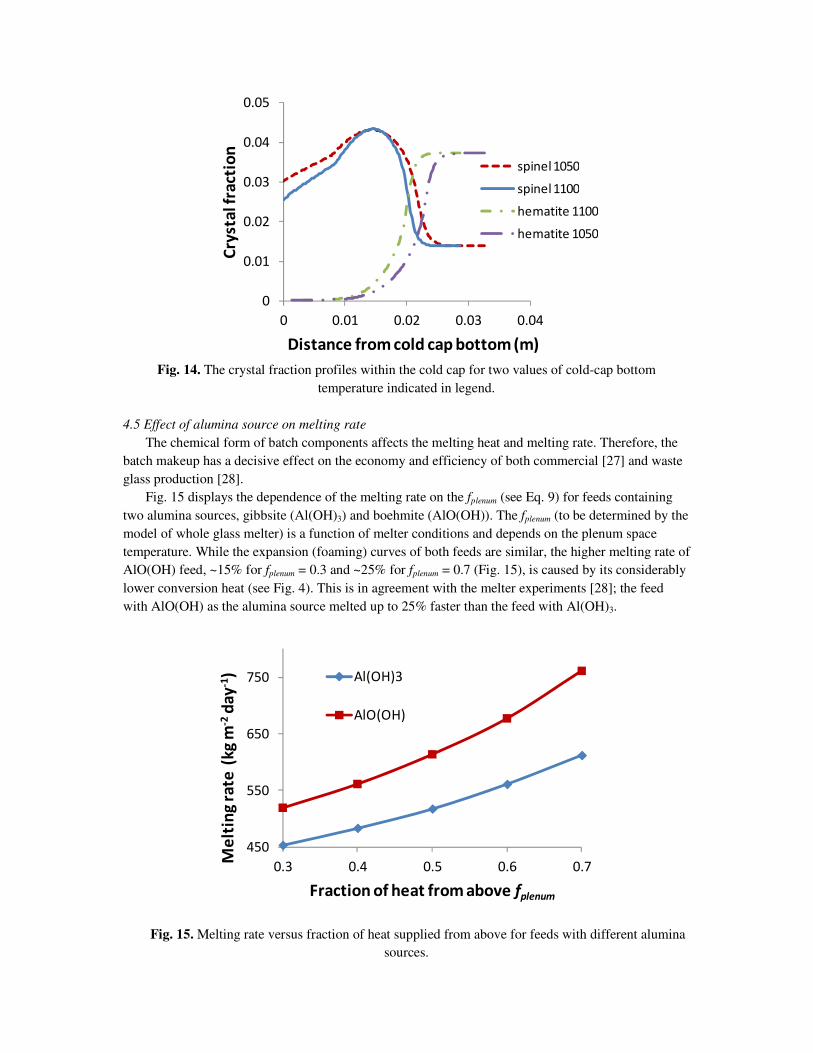
Fig. 14. The crystal fraction profiles within the cold cap for two values of cold-cap bottom
temperature indicated in legend.
4.5 Effect of alumina source on melting rate
The chemical form of batch components affects the melting heat and melting rate. Therefore, the
batch makeup has a decisive effect on the economy and efficiency of both commercial [27] and waste
glass production [28].
Fig. 15 displays the dependence of the melting rate on the fplenum (see Eq. 9) for feeds containing
two alumina sources, gibbsite (Al(OH)3) and boehmite (AlO(OH)). The fplenum (to be determined by the
model of whole glass melter) is a function of melter conditions and depends on the plenum space
temperature. While the expansion (foaming) curves of both feeds are similar, the higher melting rate of
AlO(OH) feed, ~15% for fplenum = 0.3 and ~25% for fplenum = 0.7 (Fig. 15), is caused by its considerably
lower conversion heat (see Fig. 4). This is in agreement with the melter experiments [28]; the feed
with AlO(OH) as the alumina source melted up to 25% faster than the feed with Al(OH)3.
Fig. 15. Melting rate versus fraction of heat supplied from above for feeds with different alumina
sources.
0
0.01
0.02
0.03
0.04
0.05
0 0.01 0.02 0.03 0.04
Cry
sta
lfra
ctio
n
Distance from cold cap bottom (m)
spinel 1050
spinel 1100
hematite 1100
hematite 1050
450
550
650
750
0.3 0.4 0.5 0.6 0.7
Me
ltin
g r
ate
(k
g m
-2d
ay
-1)
Fraction of heat from above fplenum
Al(OH)3
AlO(OH)
5. Discussion
The ultimate objective of this work is to develop a model for the cold cap that will account for
important factors affecting its behavior. Such a model will, once incorporated in the model of the glass
melter, be able to estimate the melting rate as a function of feed properties and melter operating
conditions. In this study, we have developed an advanced version of such a model, which includes the
behavior of the foam layer. Limitations of this model are discussed below together with the key factors
to be accounted for in the glass melter model. Also included are recommendations for the future
development of the cold cap model.
5.1 Cavity layer
While experimental data of cavity thickness, size, shape, coverage ratio, and motion are still
incomplete, various observations evidence that the cavity layer is a part of the cold cap structure.
Bursting of large bubbles is being observed at the cold cap edges and in the vent holes [29]. In the
absence of cavities, cold cap edges and vent holes would contain copious amounts of foam, which is
not the case. Also, the fast collapse of foam (see Fig. 2), after the foaming curve reaches maximum,
supports the idea of a rapid coalescence of foam bubbles into cavities, as discussed in Section 2.
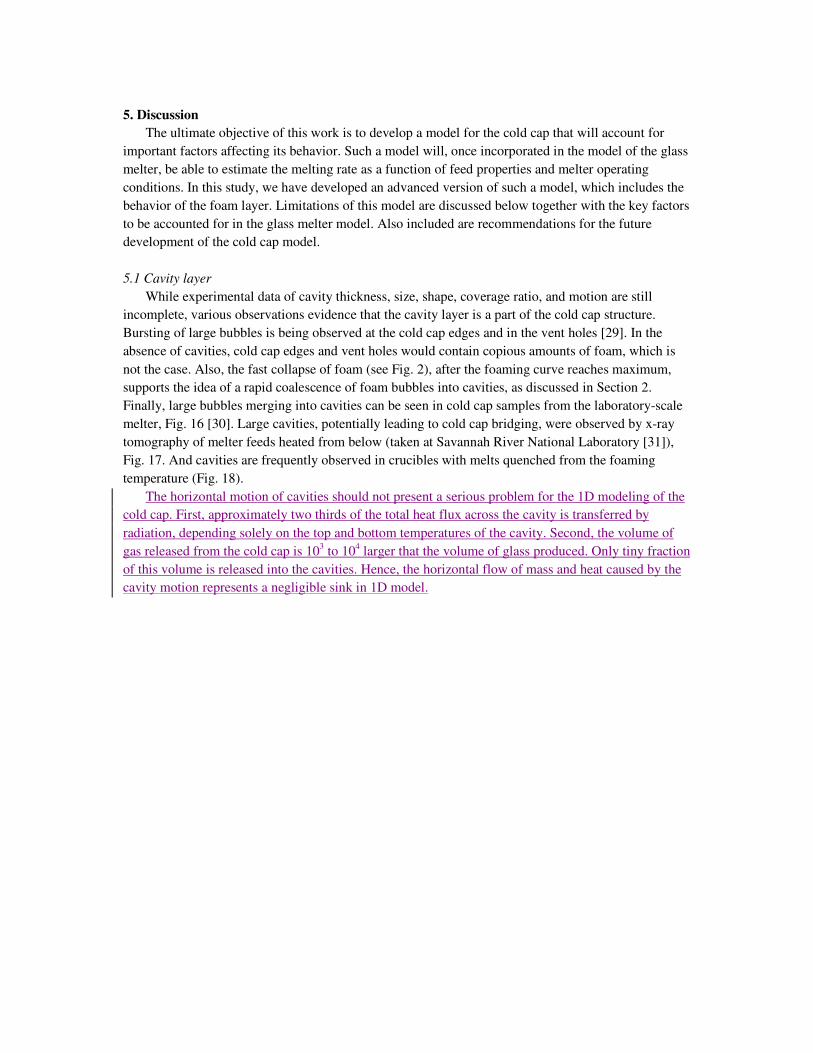
Finally, large bubbles merging into cavities can be seen in cold cap samples from the laboratory-scale
melter, Fig. 16 [30]. Large cavities, potentially leading to cold cap bridging, were observed by x-ray
tomography of melter feeds heated from below (taken at Savannah River National Laboratory [31]),
Fig. 17. And cavities are frequently observed in crucibles with melts quenched from the foaming
temperature (Fig. 18).
The horizontal motion of cavities should not present a serious problem for the 1D modeling of the
cold cap. First, approximately two thirds of the total heat flux across the cavity is transferred by
radiation, depending solely on the top and bottom temperatures of the cavity. Second, the volume of
gas released from the cold cap is 103 to 10
4 larger that the volume of glass produced. Only tiny fraction
of this volume is released into the cavities. Hence, the horizontal flow of mass and heat caused by the
cavity motion represents a negligible sink in 1D model.
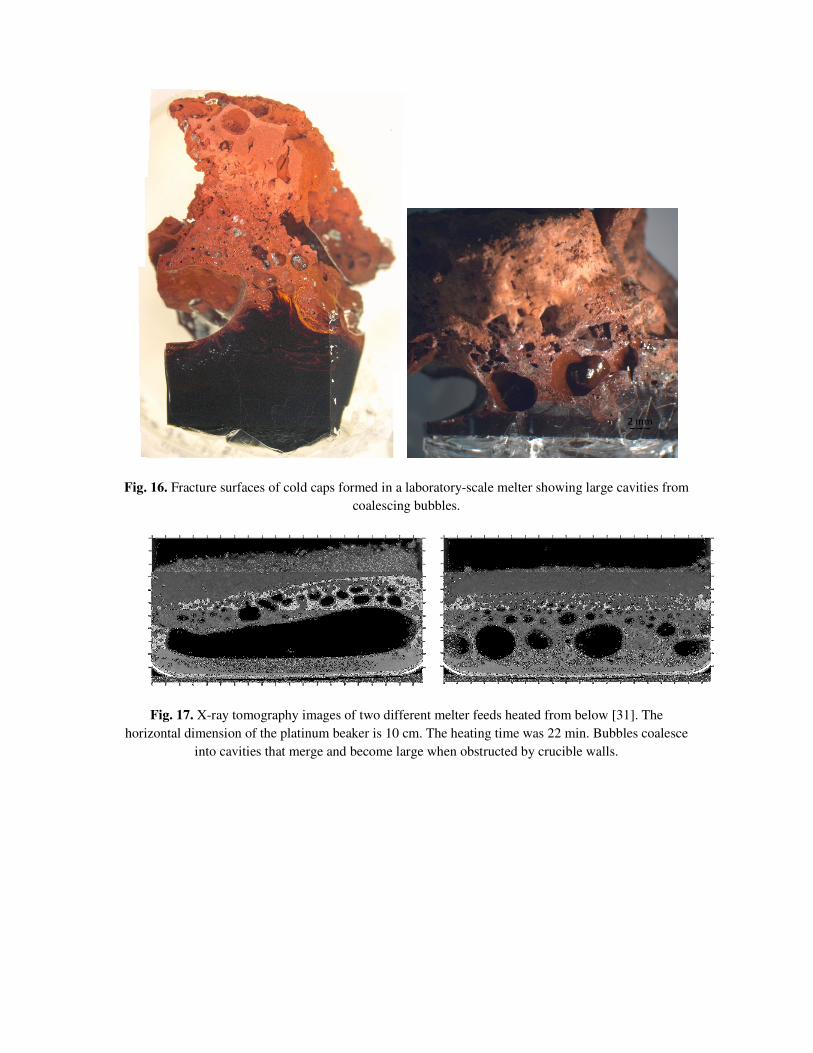
Fig. 16. Fracture surfaces of cold caps formed in a laboratory-scale melter showing large cavities from
coalescing bubbles.
Fig. 17. X-ray tomography images of two different melter feeds heated from below [31]. The
horizontal dimension of the platinum beaker is 10 cm. The heating time was 22 min. Bubbles coalesce
into cavities that merge and become large when obstructed by crucible walls.
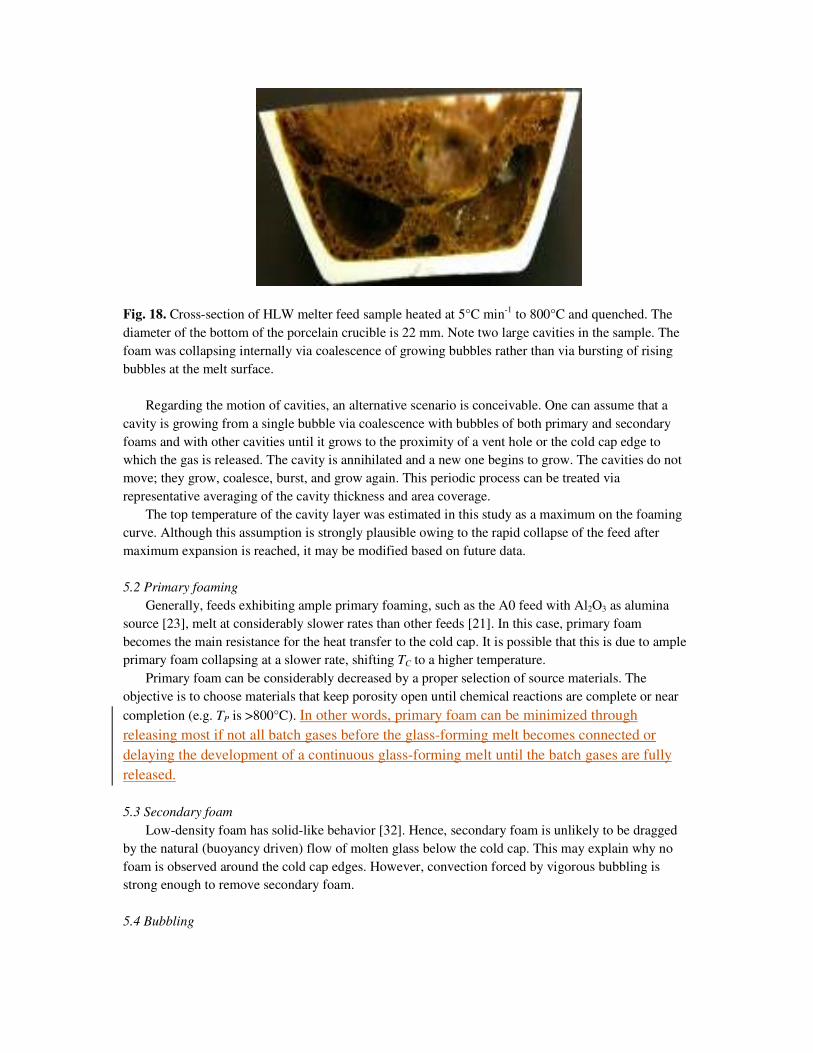
Fig. 18. Cross-section of HLW melter feed sample heated at 5°C min-1 to 800°C and quenched. The
diameter of the bottom of the porcelain crucible is 22 mm. Note two large cavities in the sample. The
foam was collapsing internally via coalescence of growing bubbles rather than via bursting of rising
bubbles at the melt surface.
Regarding the motion of cavities, an alternative scenario is conceivable. One can assume that a
cavity is growing from a single bubble via coalescence with bubbles of both primary and secondary
foams and with other cavities until it grows to the proximity of a vent hole or the cold cap edge to
which the gas is released. The cavity is annihilated and a new one begins to grow. The cavities do not
move; they grow, coalesce, burst, and grow again. This periodic process can be treated via
representative averaging of the cavity thickness and area coverage.
The top temperature of the cavity layer was estimated in this study as a maximum on the foaming
curve. Although this assumption is strongly plausible owing to the rapid collapse of the feed after
maximum expansion is reached, it may be modified based on future data.
5.2 Primary foaming
Generally, feeds exhibiting ample primary foaming, such as the A0 feed with Al2O3 as alumina
source [23], melt at considerably slower rates than other feeds [21]. In this case, primary foam
becomes the main resistance for the heat transfer to the cold cap. It is possible that this is due to ample
primary foam collapsing at a slower rate, shifting TC to a higher temperature.
Primary foam can be considerably decreased by a proper selection of source materials. The
objective is to choose materials that keep porosity open until chemical reactions are complete or near
completion (e.g. TP is >800°C). In other words, primary foam can be minimized through
releasing most if not all batch gases before the glass-forming melt becomes connected or
delaying the development of a continuous glass-forming melt until the batch gases are fully
released.
5.3 Secondary foam
Low-density foam has solid-like behavior [32]. Hence, secondary foam is unlikely to be dragged
by the natural (buoyancy driven) flow of molten glass below the cold cap. This may explain why no
foam is observed around the cold cap edges. However, convection forced by vigorous bubbling is
strong enough to remove secondary foam.
5.4 Bubbling
As evident from experimental studies [33], bubbling has a tremendous effect on the melting rate.
According to the recent report, the rate of melting was as high as 1400 kg m-2 day-1. Such a high
performance can be attributed to the following factors:
1) Bubbling generates forced convection in the molten glass that greatly exceeds natural
convection driven by buoyancy. As a result, velocity gradients under the secondary foam layer
become steeper, the thermal boundary layer is suppressed, and the TB rises. However, as Fig. 6
shows, TB increase alone cannot account for the increase of the rate of melting demonstrated in
[33].
2) It is likely that large bubbles from bubblers sweep the secondary foam from beneath the cold
cap and thus increase the transferred heat. The complete removal of secondary foam would be
equivalent to zero foaminess.
3) Not only the large bubbles from bubblers sweep secondary foam from beneath the cold cap,
they also bring the hot glass directly to the primary foam bottom. The increased temperature
transfers more heat to the cold cap. This assumption is supported by the fact that distributed
bubbling further increases the melting rate [33].
4) As bubblers bring hot gas to the plenum space, the temperature increases to ∼600°C, thus
increasing the fraction of heat flux to the cold cap from above.
5) Feed can be stirred into the melt by the vigorous flow of gas from the bubblers which form
vent holes directly above bubblers, exposing a fraction of the feed to high temperatures at
which batch reactions are rapid and gases are quickly released if the viscosity is low enough.
5.5 Incorporation of the cold cap model into the model of whole glass melter
The incorporation of the cold cap model into the model of the whole waste glass melter, such as
that developed by Schill [34], is straightforward. The coupled boundary conditions are the top and
bottom temperatures of the cold cap and the heat fluxes to the cold cap from below and from above.
The coupled model will iteratively merge both models until a steady state is reached.
6. Conclusions
An advanced 1D model for the cold cap in a slurry-fed waste glass melter has been developed. The
model solves simplified balances of mass and energy using the finite volume method and incorporates
the structure and dynamics of three-layered foam that separates the reacting batch from molten glass.
The existence of the three-layered structure appears to be supported by experimental data.
The model estimates the melting rate of glass batches as a function of batch properties and melter
operating conditions, such as the conversion enthalpy of the feed, the temperature at the bottom of the
cold cap, the fraction of heat flux to the cold cap from above, and the foaminess of the feed.
Additional model outcomes include the distributions of temperature, velocity, and local heating rate,
together with profiles of fractions of undissolved quartz particles and spinel crystals within the cold
cap.
The model is suitable for situations where no or limited bubbling is introduced to the melter from
bubblers. In the case of strong bubbling, the model would underestimate its effect on the melting rate.
As strong bubbling is becoming a norm in a waste glass melting technology, future model
improvements should focus on the incorporation of the effect of bubbling on the cold cap and foam
behavior. Finally, the cold cap model will be incorporated in the model of the glass melter as its
integral component.
Acknowledgements
This work was supported by the Department of Energy’s Waste Treatment and Immobilization Plant
Federal Project Office under the direction of Dr. Albert A. Kruger and by the WCU (World Class
University) program through the National Research Foundation of Korea funded by the Ministry of
Education, Science and Technology (R31 - 30005). Richard Pokorny acknowledges financial support
from the specific university research (MSMT No 20/2013). The authors are grateful to Jaehun Chun
and Dong-Sang Kim for insightful discussions, David A. Pierce for TGA and differential scanning
calorimetry measurements, and Derek R. Dixon for providing cold cap images. Pacific Northwest
National Laboratory is operated for the U.S. Department of Energy by Battelle under Contract DE-
AC05-76RL01830.
References
1. R.A. Kirkbride, G.K. Allen, R.M. Orme, R.S. Wittman, J.H. Baldwin, T.W. Crawford, J. Jo, L.J.
Fergestrom, T.M. Hohl, D.L. Penwell, Tank waste remediation system operation and utilization
plan, Vol. I, HNF-SD-WM-SP-012, Numatec Hanford Corporation, Richland,Washington (1999).
2. Z. Feng, D. Li, G. Qin, S. Liu, J. Am. Ceram. Soc. 91 (2008) 3229–3234.
3. A. Abbassi, Kh. Khoshmanesh, Appl. Therm. Eng. 28 (2008) 450–459.
4. C.C. Yen, W.S. Hwang, Mater. Trans. 49 (2008) 766–773.
5. H. Mase, K. Oda, J. Non-Cryst. Solids 38–39 (1980) 807–812.
6. R. Viskanta, X. Wu, J. Am. Ceram. Soc. 67 (1984) 376–380.
7. A. Ungan, R. Viskanta, AIChE Sym. S., No. 236, Vol. 80 (1984) 446–451.
8. P. Hrma, Glastech. Ber. 55 (1982) 138–150.
9. P. Schill, Ceram.-Silik. 26 (1982) 155–163.
10. P. Schill, Ceram.-Silik. 26 (1982) 209–222.
11. P. Hrma, A.A. Kruger, R. Pokorny, J. Non-Cryst. Solids 358 (2012) 3559–3562.
12. R. Pokorny, P. Hrma, J. Nucl. Mater. 429 (2012) 245–256.
13. R. Pokorny, J.A. Rice, J.V. Crum, M.J. Schweiger, P. Hrma, J. Nucl. Mater., 443 (2013) 230–235.
14. J. Chun, D.A. Pierce, R. Pokorný, P. Hrma, Thermochim. Acta 559 (2013) 32–39.
15. R. Pokorny, J.A. Rice, M.J. Schweiger, P. Hrma, J. Am. Ceram. Soc. 96 (2013) 1891–1898.
16. M. Iguchi, J.O. Ilegbusi, Modeling multiphase materials processes: Gas-liquid systems, Springer,
New York, (2010).
17. P. Hrma, J. Colloid Interf. Sci. 134 (1990) 161–168.
18. J. J. Bikerman, Physical Surfaces, Academic Press, New York/London, 1970, p. 150; see also
Trans. Faraday Soc. 34 (1948) 634-638.
19. P. Hrma, M.J. Schweiger, C.J. Humrickhouse, J.A. Moody, R.M. Tate, T.T. Rainsdon,
N.E. TeGrotenhuis, B.M. Arrigoni, J. Marcial, C.P. Rodriguez, B.H. Tincher, Ceram.-Silik. 54
(2010) 193–211.
20. M.J. Schweiger, P. Hrma, C.J. Humrickhouse, J. Marcial, B.J. Riley, N.E. TeGrotenhuis, J. Non-
Cryst. Solids 356 (2010) 1359–1367.
21. K.S. Matlack, W. Kot, W. Gong and I.L. Pegg, Small scale melter testing of HLW algorithm
glasses: matrix 1 tests, VSL-07R1220-1, Vitreous State Laboratory of the Catholic University of
America, 2007.
22. S.H. Henager, P. Hrma, K.J. Swearingen, M.J. Schweiger, J. Marcial, N.E. TeGrotenhuis, J. Non-
Cryst. Solids 357 (2011) 829–835.
23. D.A. Pierce, P. Hrma, J. Marcial, B.J. Riley, M.J. Schweiger, Int. J. Appl. Glass Sci. 3 (2012) 59–
68.
24. R. Pokorny, D.A. Pierce and P. Hrma, Thermochim. Acta 541 (2012) 8–14.
25. P. Schill, Modeling the behavior of noble metals during HLW vitrification, in: W. Lutze,
Modeling the behavior of noble metals during HLW vitrification in the DM1200 melter, VSL-
05R5740-1, Vitreous State Laboratory, Washington DC (2005).
26. J. Matyas, J. D. Vienna, A. Kimura, M. J. Schaible, R. M. Tate, Chapter 5 in: K. Fox, E. Hoffman,
N. Manjooran, G. Pickrell (Eds.), Development of Crystal-Tolerant Waste Glasses, Advances in
Materials Science for Environmental and Nuclear Technology: Ceramic Transactions, 222, John
Wiley & Sons, Inc., Hoboken, NJ, 2010, pp. 41–51.
27. R. Conradt: The industrial glass melting process. In: The SGTE casebook – Thermodynamics at
work, K. Hack, (Ed.), CRC Press, Boca Raton 2008, Chapter II.24, 282–303.
28. K.S. Matlack, H. Gan, M. Chaudhuri, W. Kot, W. Gong, T. Bardakci, I.L. Pegg, J. Innocent,
DM100 and DM1200 melter testing with high waste loading glass formulations for Hanford high-
aluminum HLW streams, VSL-10R1690-1, Vitreous State Laboratory, The Catholic University of
America, Washington, DC (2010).
29. D.S. Kim, M.J. Schweiger, W.C. Buchmiller, J. Matyas, Laboratory-scale melter for determination
of melting rate of waste glass feeds. PNNL-21005; EMSP-RPT-012, Pacific Northwest National
Laboratory, Richland, Washington, (2012).
30. D.R. Dixon, M.J. Schweiger, P. Hrma, Effect of feeding rate on the cold cap configuration in a
laboratory-scale melter, WM2013 Conference, February 24–28, 2013, Phoenix, Arizona USA.
31. A.S. Choi, D.H. Miller, D.M. Immel, Determination of HLW glass melt rate using X-ray
computed tomography (CT), SRNL-STI-2010-00767, Rev. 0, Savannah River National
Laboratory, Aiken, South Carolina (2010).
32. N.D. Denkov, S.S. Tcholakova, R. Höhler, S. Cohen-Addad, Foam Rheology, in: Foam
Engineering: Fundamentals and Applications, P. Stevenson (Ed.), John Wiley & Sons, Ltd,
Chichester, UK, 2012, 91–120, Chapter 6.
33. K.S. Matlack, W.K. Kot, R.A. Callow, J. Innocent, I.L. Pegg, Testing of optimized bubbler
configuration for HLW Melter, VSL-13R2950-1, Vitreous State Laboratory, The Catholic
University of America, Washington, DC (2013).
34. P. Schill, W. Lutze, W. Gong, I.L. Pegg, Glass Technol.-Part A 48 (2007) 276–289.