Embed Size (px)
Citation preview

MODEL FOR GMO IMPURITY QUANTIFICATION IN SOY
BEANS SEED PRODUCTION
Lidia Esteve-Agelet
25th April, 2005

THE GMO IMPURITY CONCERN
The adventitious presence of genetically
engineered material Where do impurities
come from?
Natural sources Cross pollination Segregation Residual seeds
Human handling factors
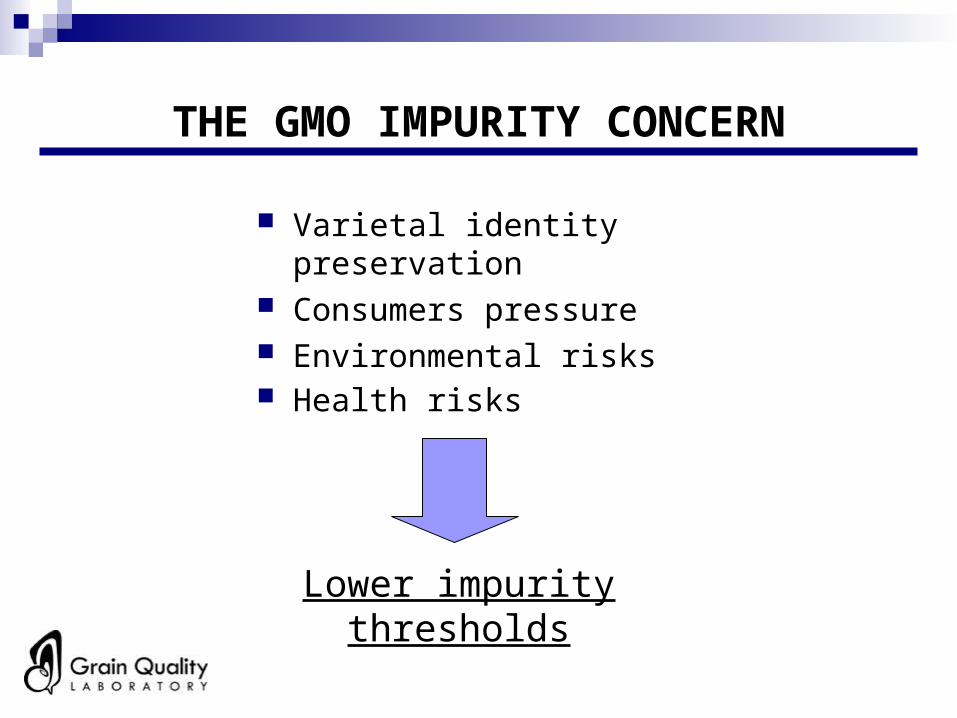
THE GMO IMPURITY CONCERN
Varietal identity preservation
Consumers pressure Environmental risks Health risks
Lower impurity thresholds
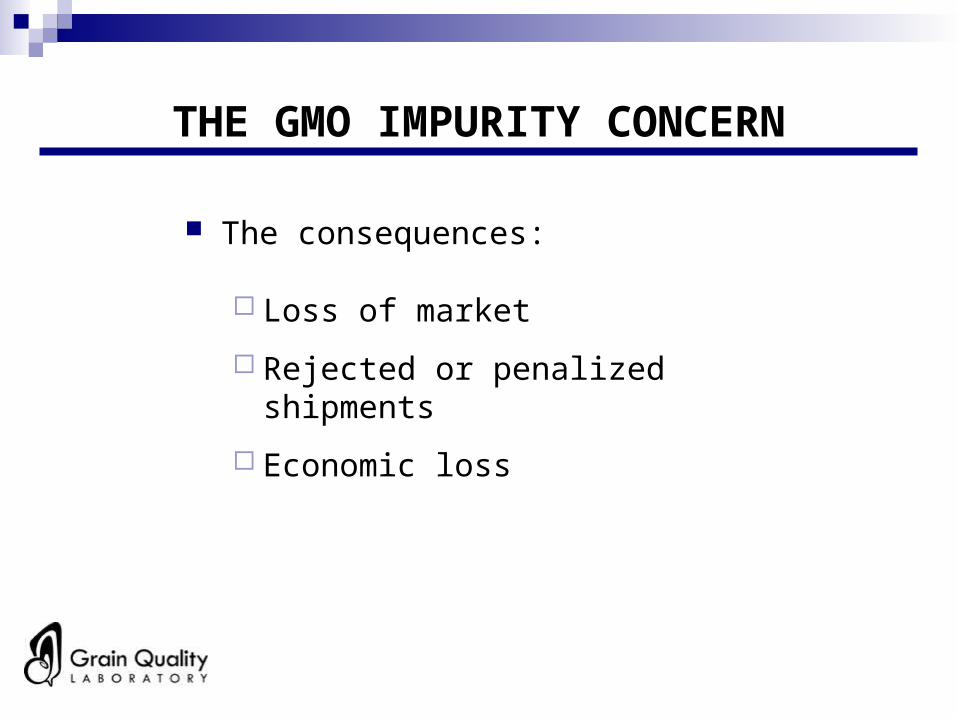
THE GMO IMPURITY CONCERN
The consequences:
Loss of market
Rejected or penalized shipments
Economic loss
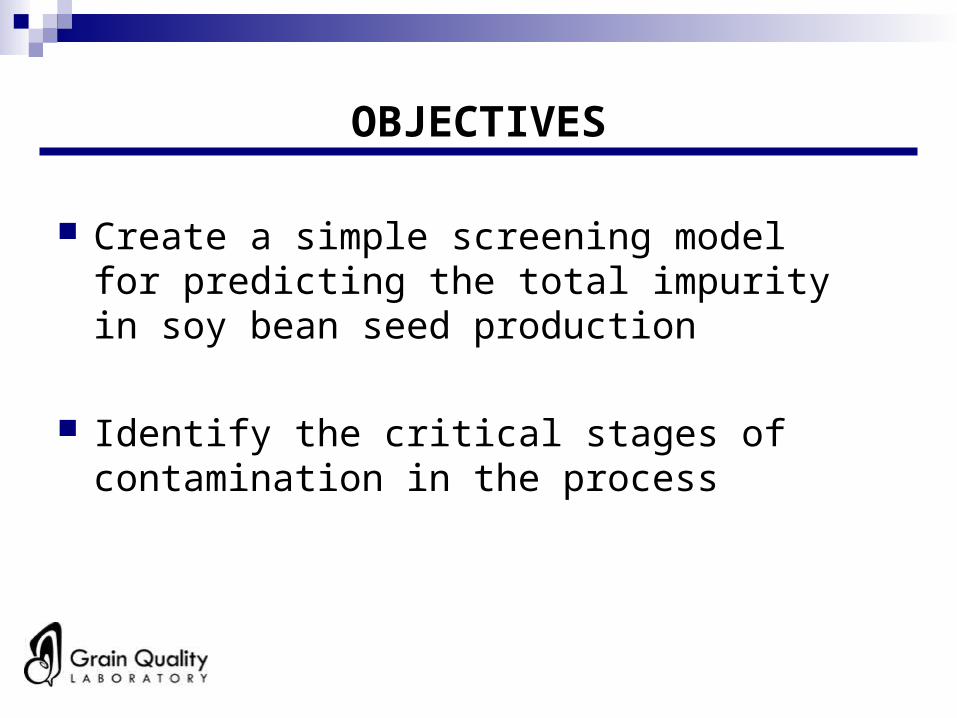
OBJECTIVES
Create a simple screening model for predicting the total impurity in soy bean seed production
Identify the critical stages of contamination in the process
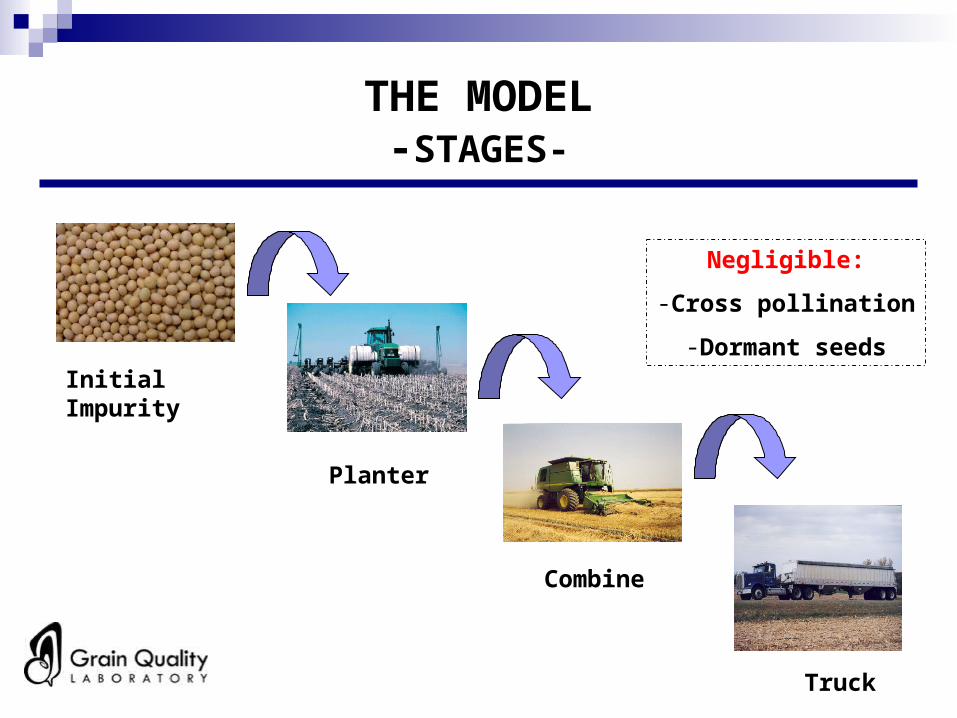
THE MODEL-STAGES-
Initial Impurity
Planter
Combine
Truck
Negligible:
-Cross pollination
-Dormant seeds
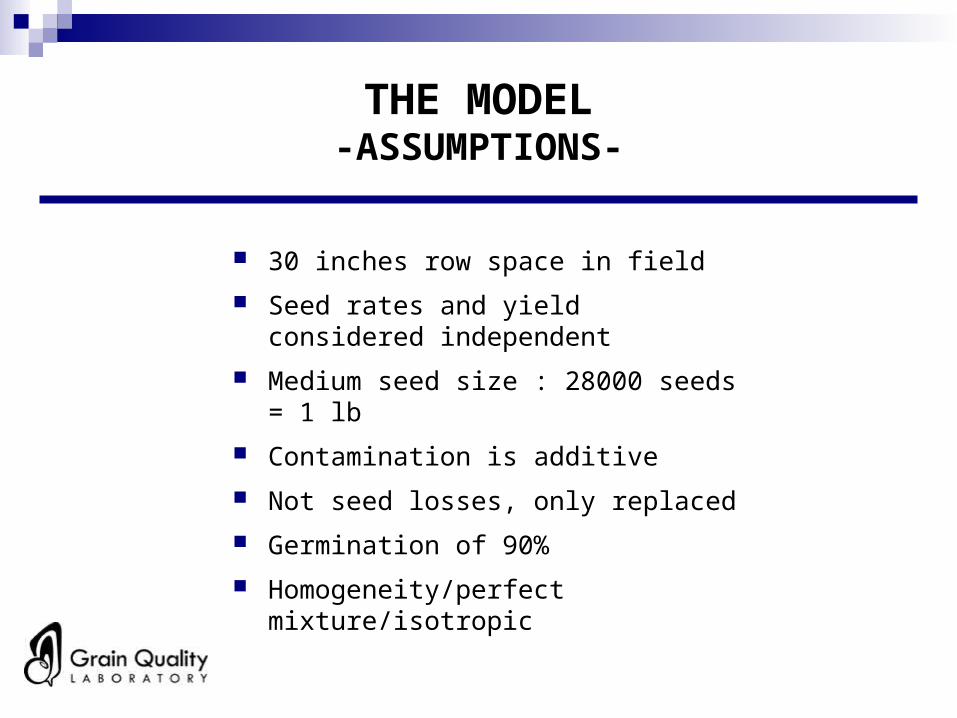
THE MODEL-ASSUMPTIONS-
30 inches row space in field
Seed rates and yield considered independent
Medium seed size : 28000 seeds = 1 lb
Contamination is additive
Not seed losses, only replaced
Germination of 90%
Homogeneity/perfect mixture/isotropic
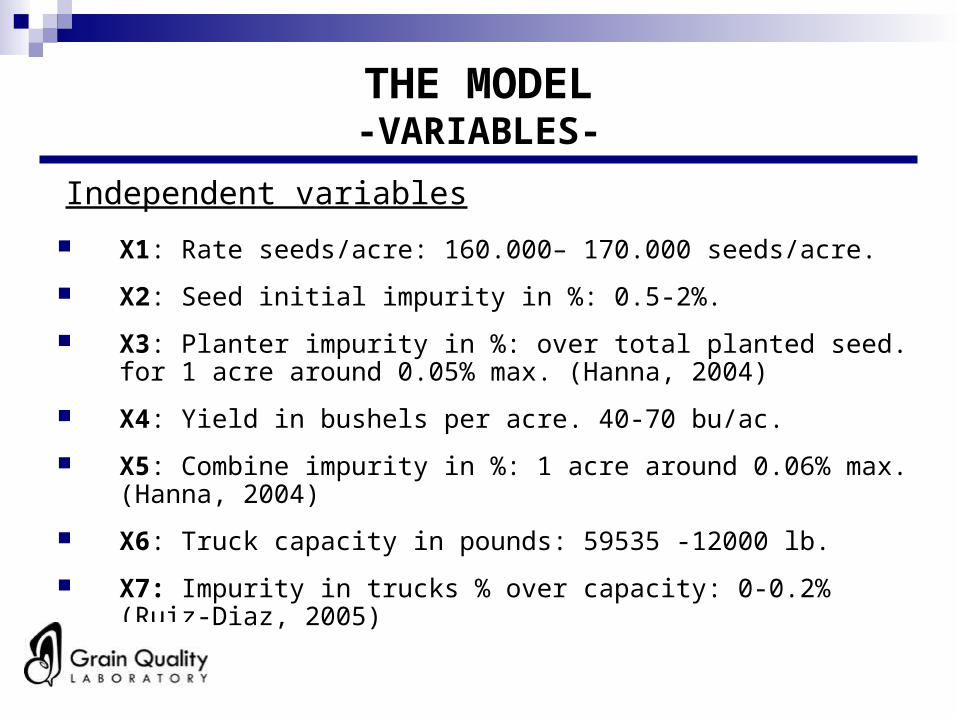
THE MODEL-VARIABLES-
X1: Rate seeds/acre: 160.000– 170.000 seeds/acre.
X2: Seed initial impurity in %: 0.5-2%.
X3: Planter impurity in %: over total planted seed. for 1 acre around 0.05% max. (Hanna, 2004)
X4: Yield in bushels per acre. 40-70 bu/ac.
X5: Combine impurity in %: 1 acre around 0.06% max. (Hanna, 2004)
X6: Truck capacity in pounds: 59535 -12000 lb.
X7: Impurity in trucks % over capacity: 0-0.2% (Ruiz-Diaz, 2005)
Independent variables
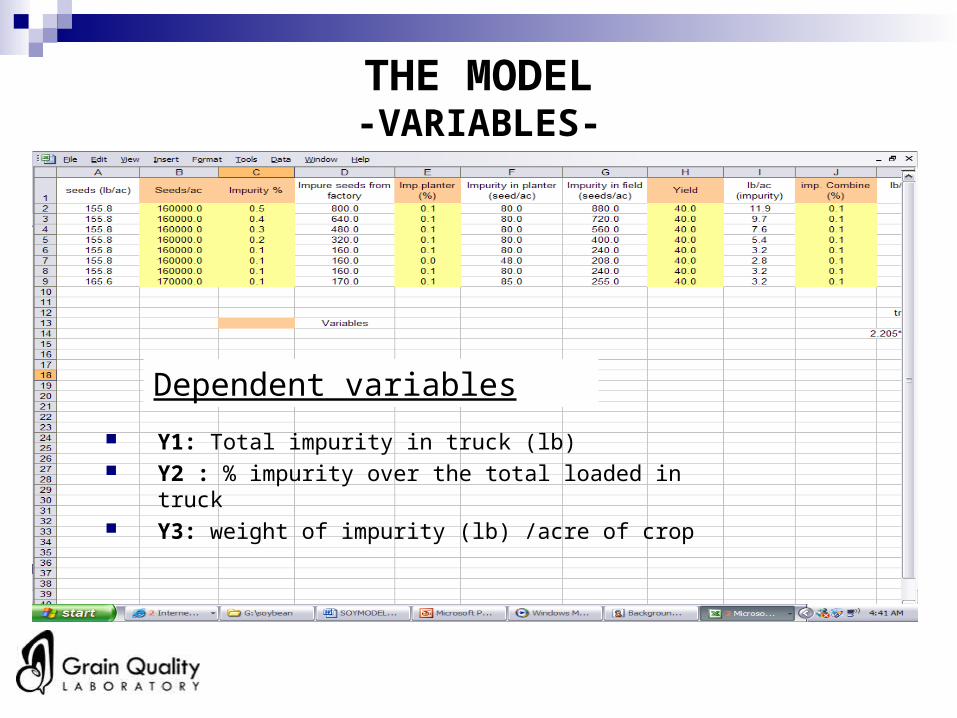
THE MODEL-VARIABLES-
Dependent variables
Y1: Total impurity in truck (lb) Y2 : % impurity over the total loaded in truck Y3: weight of impurity (lb) /acre of crop

THE MODEL-MAIN EQUATIONS-
Y1 =(((((X2 / 100) * X1 + (X3 /100)*X1)*0.9*X4*(60 / X1)) + + ((X5 / 100) * (X4 / 2800) * 60)) * (X7 / (X4 * 60))) + + ((X6 / 100) * X7)
Y2 = (Y1 / X7) * 100
Y3 = Y1 / (X7 / (X4 * 60))

Excel
Program of the model
(Visual Basic macro)
CONCLUSIONS
The variables required for the model have to be taken from the given ranges in order to get consequent results
Results in accordance with several reports
GMO impurity about 0.1-1% (Quisel, 2004)
0.2-0.6% impurity in oilseeds (Genetic Engineering Newsletter – Special Issue 11/12 , 2003)
The impurity from trucks and initial impurity in seeds are the most relevant pollution sources in the model. Impurity from combine seems to be almost negligible.

ACKNOWLEDGEMENTS
Dr. Thomas J. Brumm for his advises and assessment about the topic
Dr. H. Mark Hanna for the clean out information Dorivar Ruiz-Diaz for the collaboration in programming
and agronomic assessments
Thanks;