Embed Size (px)
Citation preview
Model for biomass-based renewable hydrogen supplychainIrfan Ahmad Gondal*,† and Mukhtar Hussain Sahir
University of Engineering and Technology, Taxila, Pakistan
SUMMARY
Pakistan though a developing country has a strong agrarian economy which in turn leads to a strong resource of biomass.Further, the effects of climate change scenario discourage the use of biomass as a combustion fuel. An integrated renewablehydrogen model has been developed based on biomass feed stocks as the input material for hydrogen production. It hasbeen found that hydrogen can be produced at rates comparable with steam methane reforming, which is one of the mosteconomical methods of generating hydrogen. However, the model must have a strong statistical base and an up-to-dategeographical information system to present accurate and logical results for effective energy planning. Copyright © 2012John Wiley & Sons, Ltd.
KEY WORDS
renewable energy; hydrogen energy; biomass; integrated
Correspondence
*Irfan Ahmad Gondal, University of Engineering and Technology, Taxila, Pakistan.†E-mail: [email protected]
Received 20 January 2012; Accepted 24 August 2012
1. INTRODUCTION
Energy supply chains and modes of transport are very muchinterconnected with one another. Although efficiencieshave greatly increased over the last century, the energydemand is continuously rising because of the continuousclimb in population figures in sync with the demand. Itmay also be noted that the energy supply chain is heavilyreliant on the modes used for the transport of feed stocksas well as the finished products (i.e. energy carriers suchas hydrogen and/or fuels).
Renewable sources being widely dispersed requiregreater dependence on the transportation modes withsignificant effects on delivery infrastructure in urban andrural regions. Thermal treatment of biomass is one of therenewable technologies that have been the focus ofresearchers for the generation of hydrogen fuel. Severalstudies have estimated the cost of biomass-based hydrogenthrough the gasification process as being economicallycompetitive. Notable amongst these studies are thosecarried out by Simbeck (2002) and Larson(2005). Whilethe economy of scale is the major element in such biomassgasifiers that ultimately decide the cost of the hydrogenfuel, it has been shown that lower costs are obtained withfacilities that have a capacity exceeding 100 tonnes ofhydrogen output per day (ORNL, 2005).
This study is focused on designing a system forrenewable production of hydrogen and its delivery throughthe three modes, relevant to the scope of this paper, i.e.:
a. Hydrogen in gas pipeline network.b. Hydrogen as a liquid in tankers.c. Hydrogen as compressed gas in containers.
In all these cases, the cost of hydrogen is primarily basedon two factors, i.e. the cost of the input raw materials andthe mode/facility of production. Transport is a major factorcontributing to the cost of hydrogen fuel. Problems ofestablishing production facility are also part of designingthe network and associated logistical analysis.
The decision for placement of a plant can be addressedin a variety of ways. The cost of transportation between theproduction facility and the end user is one of the significantinput data to the placement model. In the present work, theprocess of transporting H2 fuel through various modes isstudied along with the placement as the same are closelylinked with the consumer centres.
Developing a supply chain model is in-deterministicwith respect to the consumer requirements, provision andthe technique. Various techniques have been employed tothe modeling problem such as [1–3]. In the current work,deterministic approach has been applied with minorchange in the stochastic models.
INTERNATIONAL JOURNAL OF ENERGY RESEARCHInt. J. Energy Res. 2013; 37:1151–1159
Published online 18 October 2012 in Wiley Online Library (wileyonlinelibrary.com). DOI: 10.1002/er.2970
Copyright © 2012 John Wiley & Sons, Ltd. 1151
2. MODEL BUILD-UP
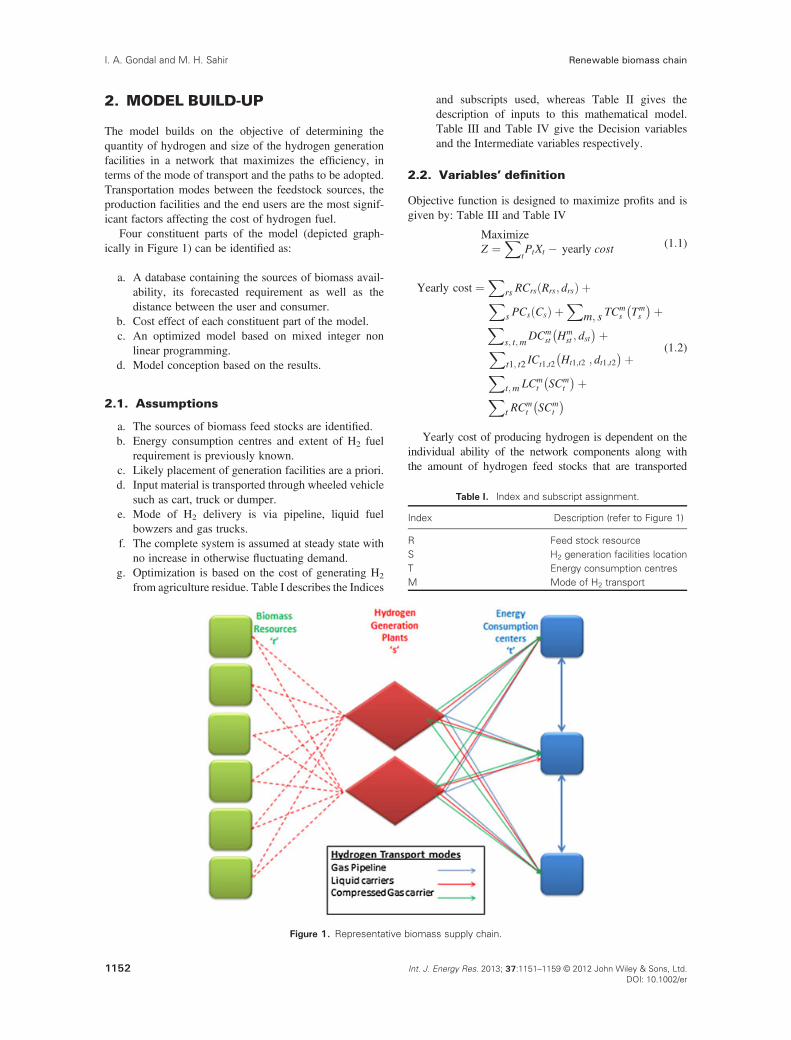
The model builds on the objective of determining thequantity of hydrogen and size of the hydrogen generationfacilities in a network that maximizes the efficiency, interms of the mode of transport and the paths to be adopted.Transportation modes between the feedstock sources, theproduction facilities and the end users are the most signif-icant factors affecting the cost of hydrogen fuel.
Four constituent parts of the model (depicted graph-ically in Figure 1) can be identified as:
a. A database containing the sources of biomass avail-ability, its forecasted requirement as well as thedistance between the user and consumer.
b. Cost effect of each constituent part of the model.c. An optimized model based on mixed integer non
linear programming.d. Model conception based on the results.
2.1. Assumptions
a. The sources of biomass feed stocks are identified.b. Energy consumption centres and extent of H2 fuel
requirement is previously known.c. Likely placement of generation facilities are a priori.d. Input material is transported through wheeled vehicle
such as cart, truck or dumper.e. Mode of H2 delivery is via pipeline, liquid fuel
bowzers and gas trucks.f. The complete system is assumed at steady state with
no increase in otherwise fluctuating demand.g. Optimization is based on the cost of generating H2
from agriculture residue. Table I describes the Indices
and subscripts used, whereas Table II gives thedescription of inputs to this mathematical model.Table III and Table IV give the Decision variablesand the Intermediate variables respectively.
2.2. Variables’ definition
Objective function is designed to maximize profits and isgiven by: Table III and Table IV
MaximizeZ ¼
XtPtXt � yearly cost (1:1)
Yearly cost ¼X
rs RCrs Rrs; drsð Þ þX
s PCs Csð Þ þX
m; s TCms Tm
s
� �þX
s; t;mDCm
st Hmst ; dst
� �þX
t1; t2 ICt1;t2 Ht1;t2 ; dt1;t2� �þ
Xt;m LCm
t SCmt
� �þX
t RCmt SCm
t
� �
(1:2)
Yearly cost of producing hydrogen is dependent on theindividual ability of the network components along withthe amount of hydrogen feed stocks that are transported
Table I. Index and subscript assignment.
Index Description (refer to Figure 1)
R Feed stock resourceS H2 generation facilities locationT Energy consumption centresM Mode of H2 transport
Figure 1. Representative biomass supply chain.
Renewable biomass chainI. A. Gondal and M. H. Sahir
1152 Int. J. Energy Res. 2013; 37:1151–1159 © 2012 John Wiley & Sons, Ltd.DOI: 10.1002/er
and converted to hydrogen at each of the plants and deliveredto various energy consumption centres. As already men-tioned, the quantities produced at each node and deliveredthere from are assumed to be constant. CF indicates a propor-tion of the production capacity that is utilized.
Cost of biomass resource includes the harvesting, storingand stacking per unit weight, i.e. tons
Production cost:
It includes the cost of installing the production facilityas well as the cost of operation and other overheads. CRFstands for capital recovery factor is the amount of interestthat may be paid on yearly basis depending on the costof installation of production facility.
At the site of production, another cost added to theH2 fuel is its preparation for onward delivery whichis referred here as the terminal cost TCm
s
� �. This cost
PCs Csð Þ ¼ capital recovery factor þ overheadsþ maintð Þ � capital cost:Ca
s þX
qvariable cost q:Cs:CF
(1:4)
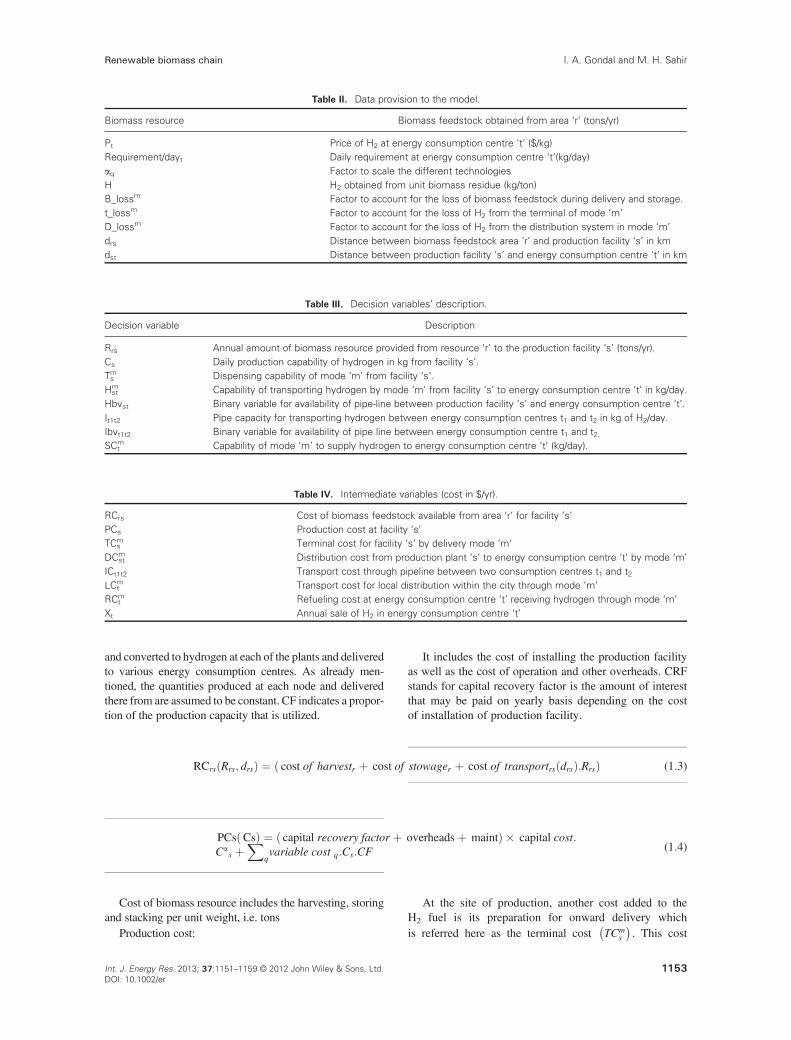
Table II. Data provision to the model.
Biomass resource Biomass feedstock obtained from area ‘r’ (tons/yr)
Pt Price of H2 at energy consumption centre ‘t’ ($/kg)Requirement/dayt Daily requirement at energy consumption centre ‘t’(kg/day)aq Factor to scale the different technologiesH H2 obtained from unit biomass residue (kg/ton)B_lossm Factor to account for the loss of biomass feedstock during delivery and storage.t_lossm Factor to account for the loss of H2 from the terminal of mode ‘m’
D_lossm Factor to account for the loss of H2 from the distribution system in mode ‘m’
drs Distance between biomass feedstock area ‘r’ and production facility ‘s’ in kmdst Distance between production facility ‘s’ and energy consumption centre ‘t’ in km
Table III. Decision variables’ description.
Decision variable Description
Rrs Annual amount of biomass resource provided from resource ‘r’ to the production facility ‘s’ (tons/yr).Cs Daily production capability of hydrogen in kg from facility ‘s’.Tms Dispensing capability of mode ‘m’ from facility ‘s’.Hmst Capability of transporting hydrogen by mode ‘m’ from facility ‘s’ to energy consumption centre ‘t’ in kg/day.
Hbvst Binary variable for availability of pipe-line between production facility ‘s’ and energy consumption centre ‘t’.It1t2 Pipe capacity for transporting hydrogen between energy consumption centres t1 and t2 in kg of H2/day.Ibvt1t2 Binary variable for availability of pipe line between energy consumption centre t1 and t2.SCm
t Capability of mode ‘m’ to supply hydrogen to energy consumption centre ‘t’ (kg/day).
Table IV. Intermediate variables (cost in $/yr).
RCrs Cost of biomass feedstock available from area ‘r’ for facility ’s’PCs Production cost at facility ‘s’TCm
s Terminal cost for facility ‘s’ by delivery mode ‘m’
DCmst Distribution cost from production plant ’s’ to energy consumption centre ‘t’ by mode ‘m’
ICt1t2 Transport cost through pipeline between two consumption centres t1 and t2LCm
t Transport cost for local distribution within the city through mode ‘m’
RCmt Refueling cost at energy consumption centre ‘t’ receiving hydrogen through mode ‘m’
Xt Annual sale of H2 in energy consumption centre ‘t’
RCrs Rrs; drsð Þ ¼ cost of harvestr þ cost of stowager þ cost of transportrs drsð Þ:Rrsð Þ (1:3)
Renewable biomass chain I. A. Gondal and M. H. Sahir
1153Int. J. Energy Res. 2013; 37:1151–1159 © 2012 John Wiley & Sons, Ltd.DOI: 10.1002/er
basically represents the costs of establishing and operatingthe terminal machinery.
The cost of delivering H2 can be broken down into thecosts incurred for delivery by pipe line and secondly thecosts for transportation by truck mode.
Transporting through network of pipes includes the costof running the machinery and those involved in maintainingit. Compressors used in pipe line networks are included inthe cost already calculated for the terminals.
DCstm¼pipe ¼ Hbvst; dstð Þ
¼ CRFþ overheadþ maintð Þ� capital cost � Hbvst:dst
(1:7)
Transportation of hydrogen gas between two energyconsumtion centres is also treated with binary variable,Ibvt1t2; it is given by:
ICt1t2 Ibt1t2; dt1t2ð Þ ¼ CRFþ overheadþ maintð Þ� capital cost � Ibt1t2:dt1t2
(1:8)
Each delivery mode has some additional charges incurredto replenish the fueling stations
2.3. Constraints
For real-life modeling of the scenario, certain constraintsneed to be applied to the objective function. If there areno limitations in the form of constraints, the modelingscenario would aim to generate and sale unlimited amountsof H2, which would ultimately lead to unlimited profits.
Constraint on yieldThe crop harvested for input to any production facility
‘s’ from any agricultural field ‘r’ has to be within theharvest yield.
XsRrs≤Biomass resourcrer (1:10)
The annual production capability of any facility hasto be more than the biomass resource being made
available to the production plant. B_loss make up forthe loss of feed stock in transport and stowage.
XsB loss:Rrs:H≤365:CF:Cs (1:11)
H accounts for the amount of hydrogen that is obtainedfrom a given quantity of biomass resource.
The terminals at the production facility must be able tohandle the generation capacity of the facility
XmTs
m ¼ Cs (1:12)
Similarly, the capability of a terminal at ‘m’ should belarger as compared to output of the hydrogen productioncapacity at that mode.
XtHm
st≤t lossm:Tms (1:13)
The distribution network of an energy consumption
centre must be able to handle the amount of hydrogencoming into the area ‘t’
Xsd lossgas;liquidTst
gas;liquid≤Stgas;liquid (1:14)
Correspondingly, the gas network within the localenergy consumption centre must be able to handle theamount of hydrogen coming in the area ‘t’ through the pipesupplying the area
Xsd losspipe:Hst
pipe þX
t2It2 t �
Xt2Itt2≤SCt
pipe (1:15)
Distribution network of an energy consumptioncentre should have a higher capacity than the quantity
TCms Tm
s
� � ¼X
qCRF q þ overheadsþ maint� �
:capital cost q Tms
� �aqþX
qvariable cost q:Ts
m:CF(1:5)
DCm¼ gas;liquid Hmst ; dst
� � ¼ CRFtrl þ overheadsþ mainttrlð Þ:capital costtrl# trl Hm
st
� �þ op pay # trl Hmst
� �� �þ per kmm:dst� (1:6)
RCmt SCm
tð Þ ¼X
qCRFq þ overheadsþ maint� �
:capital costq SCmt
� �aqþX
qvariable cost q:SCt
m:CF(1:9)
Renewable biomass chainI. A. Gondal and M. H. Sahir
1154 Int. J. Energy Res. 2013; 37:1151–1159 © 2012 John Wiley & Sons, Ltd.DOI: 10.1002/er
of H2 being sold at any energy consumption centregiven by
Xt≤X
m365:CF:Smt (1:16)
The sale of H2 at any energy centre ‘t’ cannot begreater than the requirement of H2 at the same energyconsumption centre.
Xt≤ daily demandt:365 (1:17)
Limitations in terms of constraints also apply to theproduction facility. The quantity of H2 obtainable from agiven biomass resource must be the same as that obtainedas output in the form of H2 from the production plant. Inthis regard, the presence or else in case of a pipeline isrepresented by the binary variable.
X
r
Bloss:Rrs:H ¼X
t
Hgasst t lossgas þ
X
t
Hliquidst t lossliquid
þX
t
Hbvst:Hpipest t losspipe
(1:18)
In the energy consumption centre, the presence of a localpipeline within area ‘t’ is defined by the binary variable‘Ibvt1t2’
X
s
d lossgas:Hgasst þ
X
s
d lossliquid:Hliquidst þ
X
s
d lossgas:Hgasst :Hbvst
þX
t2
Ibvt2t:It2t �X
t2
Ibvtt2:Itt2 ¼ Xt
(1:19)
The capacities of all areas, production facility as well astransport modes are non-zero entities.
Xt≥0Rrs≥0Cs≥0T m
s ≥0H m
st≥0I t1t2 ≥0S m
t ≥0
3. DATABASE
Throughout the course of this work, it was found thatstatistical base is either non-existent or minimally addressedin most of the government departments (in Pakistan). Inorder to present a real-life model as developed above –accurate data is required for presentable results andconclusions.
Nevertheless, no worthwhile data on land-use, quantityand type of biomass/crops is available. Similarly, nostatistics are available for the energy consumption city-wise,district-wise or any other category. Neither the vehiclesplying in any area nor the number of fuel (CNG, petrol,diesel) stations in any given region are documented.
Similarly, for any model to be developed especiallywhen placement of production facilities is being consid-ered, modeling region has to be carefully mapped. Also,the pipeline network, availability of trucks/trailers and theircharges are neither documented, nor can be quoted for anyconcrete research output.
Moreover, energy consumption centres are to be basedon urban/rural consumption data, whereby clusters aregenerated to designate a sizable energy demand centre.Identification of energy consumption centres than has todefine its centre for the purpose of calculating the distances.
Biomass feed-stocks from agriculture residue are animportant statistical figure in the choice of potentialplacement of hydrogen production facilities. This is essen-tial not only to minimize the transportation costs ofbiomass feed stocks but also the terminal costs, therebyminimizing the overall cost and optimization of the entirerenewable hydrogen supply chain.
Thus, the complete exercise remained academic in theabsence of real-life data. Instead, data available from theinternet for statistically advanced countries was used topresent the viability of an otherwise practical model. Forthe purpose of this study the energy requirement wascalculated on the basis of per capita energy requirement@ 48.4 KW [4].
4. COST FOR ELEMENTS OFHYDROGEN SUPPLY CHAIN
All the components of this biomass based renewablehydrogen chain, i.e. biomass feed stocks, transportation,stowage, cost of conversion, the delivery network and thedispenser facilities, have to have a price-based function.In the complete absence of relevant data, cost data had tobe derived from external sources. During the course ofliterature survey, following reports were analysed for useof relevant data:
a. Gasification-based fuels and electricity productionfrom biomass by Eric. D. Larson [5].
b. H2A delivery components, published by the UnitedStates Department of Energy, for costs pertaining tothe delivery of H2 to energy consumption centres [6].
Cost of biomass residue has been reported in variousbiomass studies with different connotations. For thepurpose of this study, these costs have been replicated froma study by Jenkins et al. [7] titled, ‘Equipment Performance,Costs, and Constraints in the Commercial Harvesting ofRice Straw for Industrial Applications’. The study takesinto account various methods for harvesting and includesall fuel costs involved in this process. Summary is given inTable V.
The model can be evaluated with a no of problems asregards the availability of biomass feed-stocks and thelevel of hydrogen demand. This results in a matrix of case
Renewable biomass chain I. A. Gondal and M. H. Sahir
1155Int. J. Energy Res. 2013; 37:1151–1159 © 2012 John Wiley & Sons, Ltd.DOI: 10.1002/er
studies that can be evaluated for conclusions, as shown inTable VI.
For the purpose of evaluation, the energy demand wasselected corresponding to that of Faisalabad. The city
was selected owing to the extraordinary agricultural outputand consequent anticipated biomass availability in the areaand its surroundings. Faisalabad’s major crops includemaize, rice, sugarcane, millet, wheat, barley, gram andfodder. Moreover, improved varieties of seeds, fertilizersand pesticides have greatly increased per-acre yield.Annual demand of hydrogen is set at 4,031,072 kg/day,equivalent to 4.031 kilo tonnes that have been generatedkeeping in view the energy consumption per capita andpopulation of the area. However, since a lot of data isbased on assumptions, only results for 10% demand ofhydrogen are presented here to demonstrate the applicabilityof this model. Results are presented in Tables VII–IX.
Table VIII provides the costs incurred at the terminalfor various modes of Hydrogen transportation, i.e. pipe-line, liquid H2 carriers and compressed gas trucks. It isevident from the figures that pipeline costs have notbeen indicated because of the low demand volume andconsequent low production. Similarly, costs for liquefiedhydrogen terminal have also not been shown for feed-stockavailability of less than 75%.
The following table indicates the costs for distributionof hydrogen in the energy consumption centres via thegas/liquid hydrogen carriers and through the hydrogenpipeline. Corresponding to Table VIII, this table alsoindicates a proposition for distribution of hydrogen throughcompressed hydrogen carriers at lower availability of feed
Table V. Cost effect of Harvesting methods.
MethodsBasic cost($/wet ton)
Fuel charges($/wet ton)
Rake method 1.40 0.85Swath method 5.16 2.71Bale formation 4.96 1.43Roadside Transfer 3.68 +1.05*r 0.75+0.30*rTotal 11.45+1.05*r 3.73+0.30*r
r denotes the radius of the agriculture resource area
Table VI. Matrix of Case studies.
Hydrogendemand
Biomass feed-stock availability
5% 10% 25% 30% 40% 50% 75%1%10%25%50%
28 different case studies have been exhibited in Table VI, and thesame can be enhanced for detailed evaluation.
Table VII. Production plant and allied costs.
Hydrogen demand 10% 10% 10% 10%Biomass feed aval 75% 50% 25% 5%Hydrogen production facilityProduction rate(kg/day) 291,979 193,602 93,000 19,843Initial investment $ 398,809,300 286,318,511 177,517,800 56,439,176Cost of feed-stock/annum 62,758,688 43,897,224 20,826,513 4,541,621Overhead and maint costs/yr 23,289,902 16,179,316 9,852,692 3,112,960
Table VIII. Terminal Costs.
Costs incurred at terminal of various categories
Hydrogen demand 10% 10% 10% 10%Biomass feed aval 75% 50% 25% 5%Compressed H2
Volume handled(kg/day) 235,756 120,681 25,195Initial investment($) 119,341,511 73,479,894 23,501,858Overhead and maint/annum 14,420,761 8,827,365 2,829,901Liquefied H2
Volume handled(kg/day) 362,369Initial investment($) 428,860,311Overhead and maint/annum 17,225,470H2 pipelineVolume handled(kg/day)Initial investment($)Overhead and maint/annum
Renewable biomass chainI. A. Gondal and M. H. Sahir
1156 Int. J. Energy Res. 2013; 37:1151–1159 © 2012 John Wiley & Sons, Ltd.DOI: 10.1002/er
stock. At 75% availability, liquid trucks are employed,while pipe-line may be non-existent owing to the lack ofhydrogen demand.
5. DISCUSSION
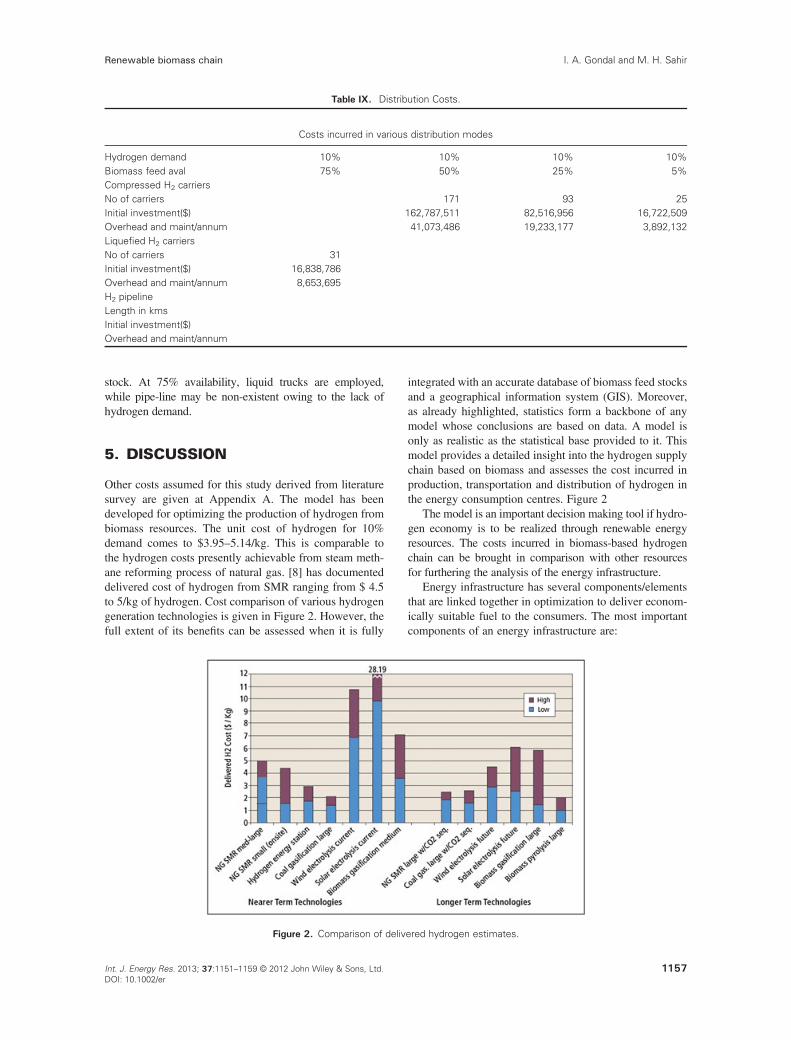
Other costs assumed for this study derived from literaturesurvey are given at Appendix A. The model has beendeveloped for optimizing the production of hydrogen frombiomass resources. The unit cost of hydrogen for 10%demand comes to $3.95–5.14/kg. This is comparable tothe hydrogen costs presently achievable from steam meth-ane reforming process of natural gas. [8] has documenteddelivered cost of hydrogen from SMR ranging from $ 4.5to 5/kg of hydrogen. Cost comparison of various hydrogengeneration technologies is given in Figure 2. However, thefull extent of its benefits can be assessed when it is fully
integrated with an accurate database of biomass feed stocksand a geographical information system (GIS). Moreover,as already highlighted, statistics form a backbone of anymodel whose conclusions are based on data. A model isonly as realistic as the statistical base provided to it. Thismodel provides a detailed insight into the hydrogen supplychain based on biomass and assesses the cost incurred inproduction, transportation and distribution of hydrogen inthe energy consumption centres. Figure 2
The model is an important decision making tool if hydro-gen economy is to be realized through renewable energyresources. The costs incurred in biomass-based hydrogenchain can be brought in comparison with other resourcesfor furthering the analysis of the energy infrastructure.
Energy infrastructure has several components/elementsthat are linked together in optimization to deliver econom-ically suitable fuel to the consumers. The most importantcomponents of an energy infrastructure are:
Table IX. Distribution Costs.
Costs incurred in various distribution modes
Hydrogen demand 10% 10% 10% 10%Biomass feed aval 75% 50% 25% 5%Compressed H2 carriersNo of carriers 171 93 25Initial investment($) 162,787,511 82,516,956 16,722,509Overhead and maint/annum 41,073,486 19,233,177 3,892,132Liquefied H2 carriersNo of carriers 31Initial investment($) 16,838,786Overhead and maint/annum 8,653,695H2 pipelineLength in kmsInitial investment($)Overhead and maint/annum
Figure 2. Comparison of delivered hydrogen estimates.
Renewable biomass chain I. A. Gondal and M. H. Sahir
1157Int. J. Energy Res. 2013; 37:1151–1159 © 2012 John Wiley & Sons, Ltd.DOI: 10.1002/er
1. Production/Generation2. Transportation
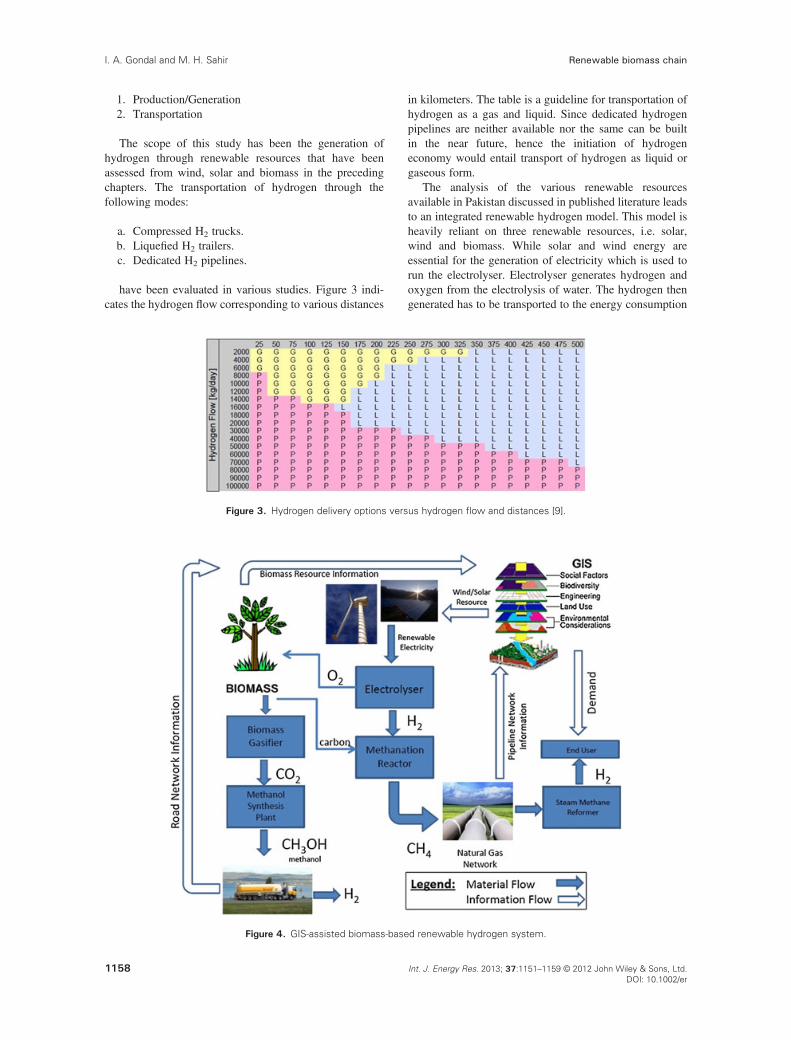
The scope of this study has been the generation ofhydrogen through renewable resources that have beenassessed from wind, solar and biomass in the precedingchapters. The transportation of hydrogen through thefollowing modes:
a. Compressed H2 trucks.b. Liquefied H2 trailers.c. Dedicated H2 pipelines.
have been evaluated in various studies. Figure 3 indi-cates the hydrogen flow corresponding to various distances
in kilometers. The table is a guideline for transportation ofhydrogen as a gas and liquid. Since dedicated hydrogenpipelines are neither available nor the same can be builtin the near future, hence the initiation of hydrogeneconomy would entail transport of hydrogen as liquid orgaseous form.
The analysis of the various renewable resourcesavailable in Pakistan discussed in published literature leadsto an integrated renewable hydrogen model. This model isheavily reliant on three renewable resources, i.e. solar,wind and biomass. While solar and wind energy areessential for the generation of electricity which is used torun the electrolyser. Electrolyser generates hydrogen andoxygen from the electrolysis of water. The hydrogen thengenerated has to be transported to the energy consumption
Figure 3. Hydrogen delivery options versus hydrogen flow and distances [9].
Figure 4. GIS-assisted biomass-based renewable hydrogen system.
Renewable biomass chainI. A. Gondal and M. H. Sahir
1158 Int. J. Energy Res. 2013; 37:1151–1159 © 2012 John Wiley & Sons, Ltd.DOI: 10.1002/er
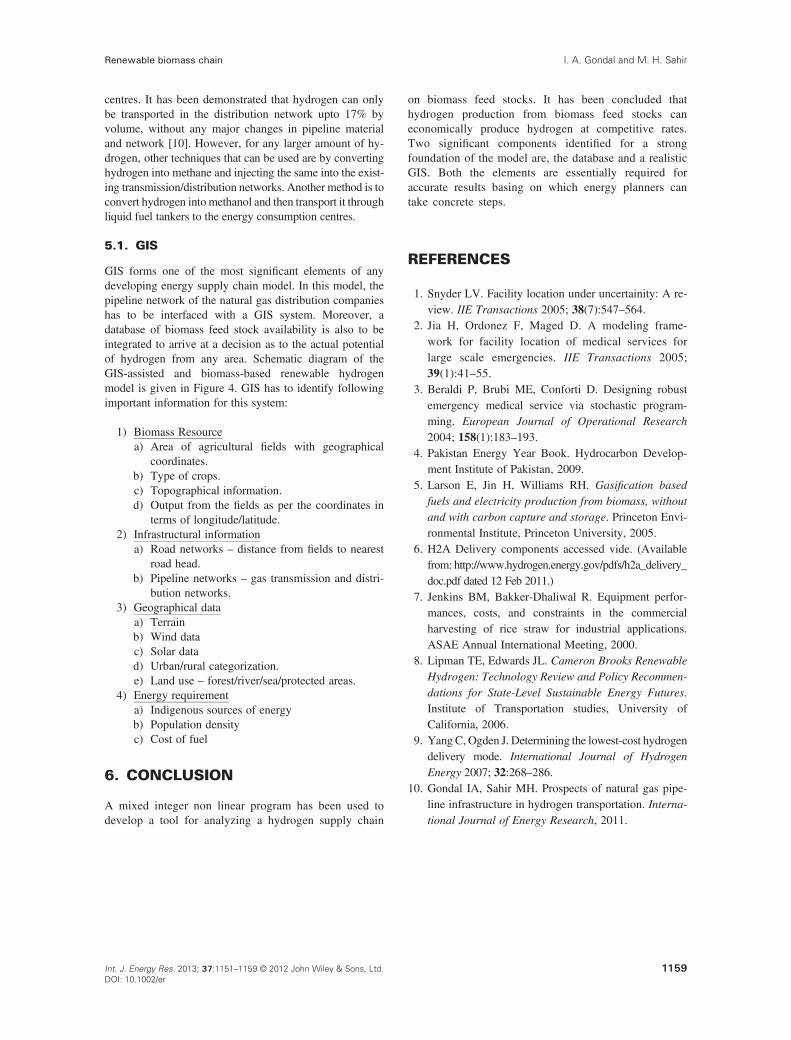
centres. It has been demonstrated that hydrogen can onlybe transported in the distribution network upto 17% byvolume, without any major changes in pipeline materialand network [10]. However, for any larger amount of hy-drogen, other techniques that can be used are by convertinghydrogen into methane and injecting the same into the exist-ing transmission/distribution networks. Another method is toconvert hydrogen into methanol and then transport it throughliquid fuel tankers to the energy consumption centres.
5.1. GIS
GIS forms one of the most significant elements of anydeveloping energy supply chain model. In this model, thepipeline network of the natural gas distribution companieshas to be interfaced with a GIS system. Moreover, adatabase of biomass feed stock availability is also to beintegrated to arrive at a decision as to the actual potentialof hydrogen from any area. Schematic diagram of theGIS-assisted and biomass-based renewable hydrogenmodel is given in Figure 4. GIS has to identify followingimportant information for this system:
1) Biomass Resourcea) Area of agricultural fields with geographical
coordinates.b) Type of crops.c) Topographical information.d) Output from the fields as per the coordinates in
terms of longitude/latitude.2) Infrastructural information
a) Road networks – distance from fields to nearestroad head.
b) Pipeline networks – gas transmission and distri-bution networks.
3) Geographical dataa) Terrainb) Wind datac) Solar datad) Urban/rural categorization.e) Land use – forest/river/sea/protected areas.
4) Energy requirementa) Indigenous sources of energyb) Population densityc) Cost of fuel
6. CONCLUSION
A mixed integer non linear program has been used todevelop a tool for analyzing a hydrogen supply chain
on biomass feed stocks. It has been concluded thathydrogen production from biomass feed stocks caneconomically produce hydrogen at competitive rates.Two significant components identified for a strongfoundation of the model are, the database and a realisticGIS. Both the elements are essentially required foraccurate results basing on which energy planners cantake concrete steps.
REFERENCES
1. Snyder LV. Facility location under uncertainity: A re-view. IIE Transactions 2005; 38(7):547–564.
2. Jia H, Ordonez F, Maged D. A modeling frame-work for facility location of medical services forlarge scale emergencies. IIE Transactions 2005;39(1):41–55.
3. Beraldi P, Brubi ME, Conforti D. Designing robustemergency medical service via stochastic program-ming. European Journal of Operational Research2004; 158(1):183–193.
4. Pakistan Energy Year Book. Hydrocarbon Develop-ment Institute of Pakistan, 2009.
5. Larson E, Jin H, Williams RH. Gasification basedfuels and electricity production from biomass, withoutand with carbon capture and storage. Princeton Envi-ronmental Institute, Princeton University, 2005.
6. H2A Delivery components accessed vide. (Availablefrom: http://www.hydrogen.energy.gov/pdfs/h2a_delivery_doc.pdf dated 12 Feb 2011.)
7. Jenkins BM, Bakker-Dhaliwal R. Equipment perfor-mances, costs, and constraints in the commercialharvesting of rice straw for industrial applications.ASAE Annual International Meeting, 2000.
8. Lipman TE, Edwards JL. Cameron Brooks RenewableHydrogen: Technology Review and Policy Recommen-dations for State-Level Sustainable Energy Futures.Institute of Transportation studies, University ofCalifornia, 2006.
9. Yang C,Ogden J. Determining the lowest-cost hydrogendelivery mode. International Journal of HydrogenEnergy 2007; 32:268–286.
10. Gondal IA, Sahir MH. Prospects of natural gas pipe-line infrastructure in hydrogen transportation. Interna-tional Journal of Energy Research, 2011.
Renewable biomass chain I. A. Gondal and M. H. Sahir
1159Int. J. Energy Res. 2013; 37:1151–1159 © 2012 John Wiley & Sons, Ltd.DOI: 10.1002/er