Embed Size (px)
Citation preview

User’sManual
TM
TMModel FLXA202 / FLXA212-Wire Analyzer
IM 12A01A02-01E
IM 12A01A02-01E9th Edition
i
IM 12A01A02-01E 9th Edition : Mar. 23, 2018-00
u IntroductionThank you for purchasing the FLXATM202/FLXATM21 2-Wire Analyzer.Please read the following respective documents before installing and using the FLXA202/FLXA21.When the FLXA21 with the output of FOUNDATION Fieldbus or PROFIBUS PA Communication is used, please refer to the User’s Manual, IM 12A01A02-71E or IM 12A01A02-72E, too.
The related documents are as follows.
General SpecificationsContents Document number Note
FLXA202 2-wire Analyzer GS 12A01A03-01EN
These are included In attached CD-ROM
FLXA21 2-wire Analyzer GS 12A01A02-01EFLXA21 2-wire AnalyzerFOUNDATION Fieldbus Communication GS 12A01A02-71E
FLXA21 2-wire AnalyzerPROFIBUS PA Communication GS 12A01A02-72E
* the “E” or “EN” in the document number is the language code.
User’s ManualContents Document number Note
FLXA202/FLXA21Start-up Manual IM 12A01A02-12E Attached to the product
FLXA202/FLXA21Safety Precautions IM 12A01A02-20E Attached to the product
NoteFLXA202/FLXA21User’s Manual IM 12A01A02-01E This manual
This is included In attached CD-ROMFLXA21FOUNDATION Fieldbus Communication IM 12A01A02-71E
These are included In attached CD-ROMFLXA21PROFIBUS PA Communication IM 12A01A02-72E
* the “E” in the document number is the language code.Note: Please read the Safety Precautions (IM 12A01A02-20E) before using the product. TheSafetyPrecautionsincludesControlDrawingsofintrinsicsafety,nonincendiveandTypenthatdescribesspecificcondition
forusingFLXA202/FLXA21inhazardous/classifiedlocation.
AnexclusiveUser’sManualmightbeattachedtotheproductswhosesuffixcodesoroptioncodescontainthecode“Z”(madetocustomers’specifications).Pleasereaditalongwiththismanual.
n Notes on Handling User’s Manuals• Please hand over the user’s manuals to your end users so that they can keep the user’s
manuals on hand for convenient reference.• Please read the information thoroughly before using the product.• The purpose of these user’s manuals is not to warrant that the product is well suited to any
particular purpose but rather to describe the functional details of the product.• No part of the user’s manuals may be transferred or reproduced without prior written
consent from YOKOGAWA.• YOKOGAWA reserves the right to make improvements in the user’s manuals and product at
any time, without notice or obligation.• Ifyouhaveanyquestions,oryoufindmistakesoromissionsintheuser’smanuals,please
contact our sales representative or your local distributor.
Media No. IM 12A01A02-01E 9th Edition : Mar. 2018 (YK)All Rights Reserved Copyright © 2010, Yokogawa Electric Corporation
ii
IM 12A01A02-01E 9th Edition : Mar. 23, 2018-00
n Drawing ConventionsSomedrawingsmaybepartiallyemphasized,simplified,oromitted,fortheconvenienceofdescription.Somescreenimagesdepictedintheuser’smanualmayhavedifferentdisplaypositionsorcharacter types (e.g., the upper / lower case). Also note that some of the images contained in this user’s manual are display examples.
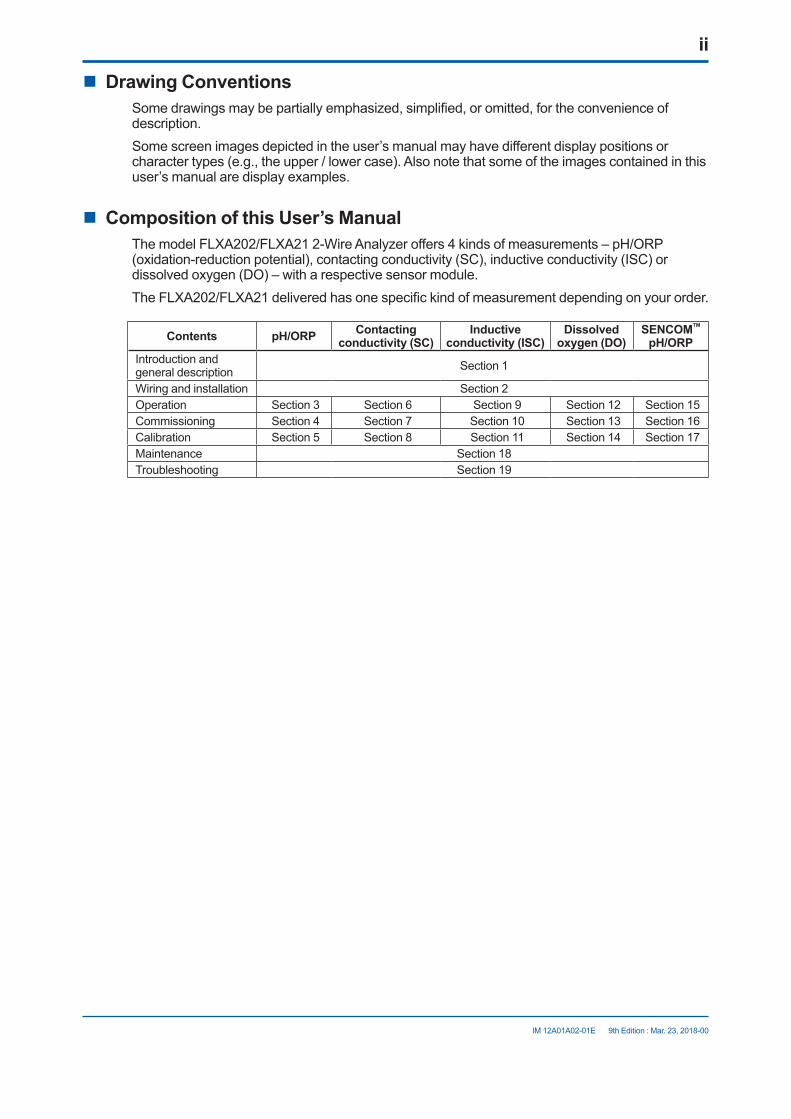
n Composition of this User’s ManualThemodelFLXA202/FLXA212-WireAnalyzeroffers4kindsofmeasurements–pH/ORP(oxidation-reduction potential), contacting conductivity (SC), inductive conductivity (ISC) or dissolvedoxygen(DO)–witharespectivesensormodule.TheFLXA202/FLXA21deliveredhasonespecifickindofmeasurementdependingonyourorder.
Contents pH/ORP Contacting conductivity (SC)
Inductive conductivity (ISC)
Dissolved oxygen (DO)
SENCOMTM pH/ORP
Introduction and general description Section 1
Wiring and installation Section 2Operation Section 3 Section 6 Section 9 Section 12 Section 15Commissioning Section4 Section 7 Section 10 Section 13 Section 16Calibration Section 5 Section 8 Section 11 Section14 Section 17Maintenance Section 18Troubleshooting Section 19
iii
IM 12A01A02-01E 9th Edition : Mar. 23, 2018-00
u Safety Precautionsn Safety, Protection, and Modification of the Product
• In order to protect the system controlled by the product and the product itself and ensure safe operation, observe the safety precautions described in this user’s manual. We assume no liability for safety if users fail to observe these instructions when operating the product.
• Ifthisinstrumentisusedinamannernotspecifiedinthisuser’smanual,theprotectionprovided by this instrument may be impaired.
• If any protection or safety circuit is required for the system controlled by the product or for the product itself, prepare it separately.
• Be sure to use the spare parts approved by Yokogawa Electric Corporation (hereafter simply referred to as YOKOGAWA) when replacing parts or consumables.
• Modificationoftheproductisstrictlyprohibited.• The following safety symbols are used on the product as well as in this manual.
WARNINGThis symbol indicates that an operator must follow the instructions laid out in this manual in order to avoid the risks, for the human body, of injury, electric shock, or fatalities. The manual describes what special care the operator must take to avoid such risks.
CAUTIONThis symbol indicates that the operator must refer to the instructions in this manual in order to prevent the instrument (hardware) or software from being damaged, or a system failure from occurring.
CAUTIONThis symbol gives information essential for understanding the operations and functions.
NOTEThis symbol indicates information that complements the present topic.
This symbol indicates Protective Ground Terminal.
This symbol indicates Function Ground Terminal. Do not use this terminal as the protective ground terminal.
n Warning and DisclaimerThe product is provided on an “as is” basis. YOKOGAWA shall have neither liability nor responsibility to any person or entity with respect to any direct or indirect loss or damage arising from using the product or any defect of the product that YOKOGAWA can not predict in advance.

iv
IM 12A01A02-01E 9th Edition : Mar. 23, 2018-00
n FLXA202/FLXA21• The FLXA202/FLXA21 should only be used with equipment that meets the relevant IEC,
American, Canadian, and Japanese standards. Yokogawa accepts no responsibility for the misuse of this unit.
• Don’t install “general purpose type” instruments in the hazardous area.• The Instrument is packed carefully with shock absorbing materials, nevertheless, the
instrument may be damaged or broken if subjected to strong shock, such as if the instrumentisdropped.Handlewithcare.
CAUTIONElectrostatic dischargeThe FLXA202/FLXA21 contains devices that can be damaged by electrostatic discharge.When servicing this equipment, please observe proper procedures to prevent such damage.Replacement components should be shipped in conductive packaging. Repair work should be done at grounded workstations using grounded soldering irons and wrist straps to avoid electrostatic discharge.
CAUTION• Do not use an abrasive or organic solvent in cleaning the instrument.• Substitution of components may impair suitability for Division 2.
Do not remove or replace while circuit is live unless area is known to be non hazardous. ExplosionHazard–Donotdisconnectequipmentunlessareaisknowntobenonhazardous. Do not reset circuit breaker unless power has been removed from the equipment or the area is known to be non hazardous.
CAUTION• This instrument is a EN61326-1 Class A product, and it is designed for use in the industrial
environment. Please use this instrument in the industrial environment only.• TheHARTcommunicationmaybeinfluencedbystrongelectromagneticfield.
InthiscaseanothertrialoftheHARTcommunicationand/oroperationwithFLXA202/FLXA21 touch screen can be carried out.
CAUTIONWhen you open the front panel, make sure the screws are completely out of the screw holes, and then open the front panel slowly in order not to damage the threaded parts on the housing. If the threaded parts are damaged and the screws cannot be tightened, the waterproof performance will deteriorate.
CAUTIONBe careful to touch the concentrated sulfuric acid.
v
IM 12A01A02-01E 9th Edition : Mar. 23, 2018-00
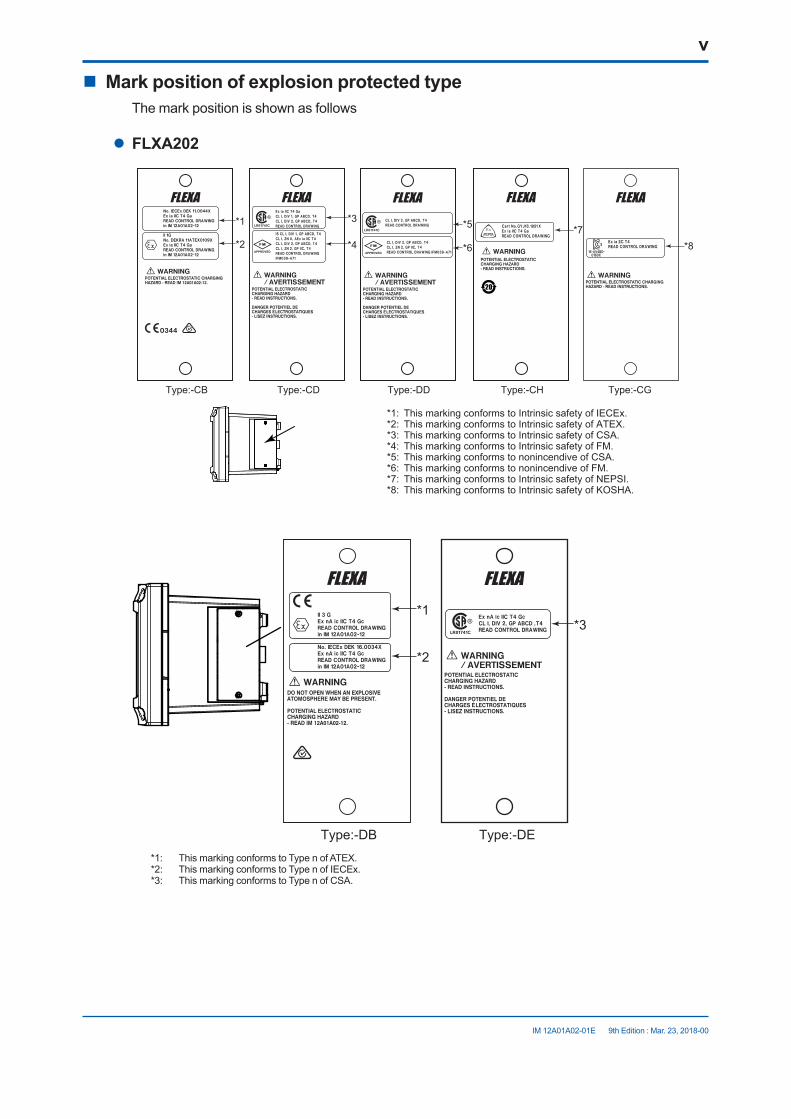
n Mark position of explosion protected typeThe mark position is shown as follows
l FLXA202
Type:-CB
*1: This marking conforms to Intrinsic safety of IECEx.*2: This marking conforms to Intrinsic safety of ATEX.*3: This marking conforms to Intrinsic safety of CSA.*4: This marking conforms to Intrinsic safety of FM.*5: This marking conforms to nonincendive of CSA.*6: This marking conforms to nonincendive of FM.*7: This marking conforms to Intrinsic safety of NEPSI.*8: This marking conforms to Intrinsic safety of KOSHA.
Type:-CD Type:-DD Type:-CH Type:-CG
*1
*2 *4
*3
*6
*5 *7*8
Type:-DB Type:-DE
*1
*2
*3
*1: This marking conforms to Type n of ATEX.*2: This marking conforms to Type n of IECEx.*3: This marking conforms to Type n of CSA.
vi
IM 12A01A02-01E 9th Edition : Mar. 23, 2018-00
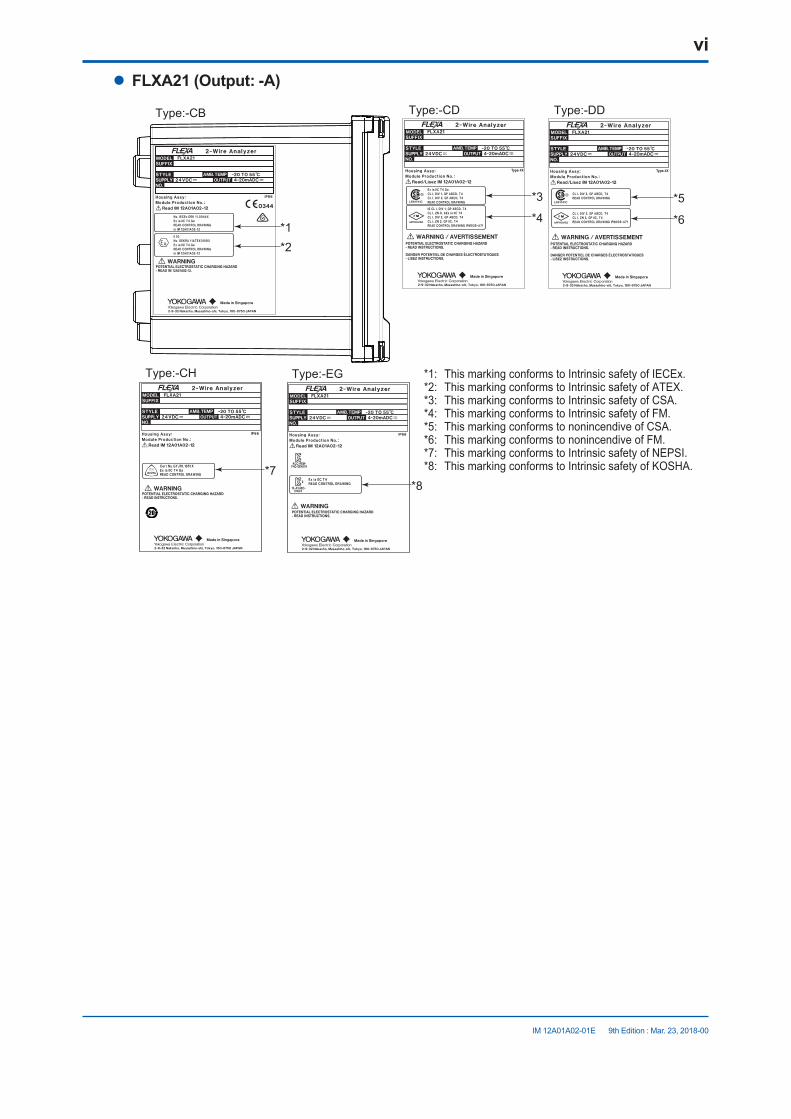
l FLXA21 (Output: -A)
*4
*3
*6
*5
*7
*2*1
*8
Type:-CB Type:-CD Type:-DD
Type:-CH Type:-EG *1: This marking conforms to Intrinsic safety of IECEx.*2: This marking conforms to Intrinsic safety of ATEX.*3: This marking conforms to Intrinsic safety of CSA.*4: This marking conforms to Intrinsic safety of FM.*5: This marking conforms to nonincendive of CSA.*6: This marking conforms to nonincendive of FM.*7: This marking conforms to Intrinsic safety of NEPSI.*8: This marking conforms to Intrinsic safety of KOSHA.

vii
IM 12A01A02-01E 9th Edition : Mar. 23, 2018-00
n Product Disposal:The instrument should be disposed of in accordance with local and national legislation/regulations.
n Warranty and serviceYokogawa products and parts are guaranteed free from defects in workmanship and material under normal use and service for a period of (typically) 12 months from the date of shipment from the manufacturer.Individual sales organisations can deviate from the typical warranty period, and the conditions of sale relating to the original purchase order should be consulted. Damage caused by wear and tear,inadequatemaintenance,corrosion,orbytheeffectsofchemicalprocessesareexcludedfrom this warranty coverage.In the event of warranty claim, the defective goods should be sent (freight paid) to the service department of the relevant sales organisation for repair or replacement (at Yokogawa discretion). The following information must be included in the letter accompanying the returned goods:
• Part number, model code and serial number• Original purchase order and date• Length of time in service and a description of the process• Description of the fault, and the circumstances of failure• Process/environmental conditions that may be related to the failure of the device.• A statement whether warranty or nonwarranty service is requested• Complete shipping and billing instructions for return of material, plus the name and phone
number of a contact person who can be reached for further information.Returnedgoodsthathavebeenincontactwithprocessfluidsmustbedecontaminated/disinfectedbeforeshipment.Goodsshouldcarryacertificatetothiseffect,forthehealthandsafety of our employees.Material safety data sheets should also be included for all components of the processes to which the equipment has been exposed.

viii
IM 12A01A02-01E 9th Edition : Mar. 23, 2018-00
n Copyright and Trademark NoticesThe copyrights of online manual contained in the CD-ROM are reserved.TheonlinemanualisprotectedbythePDFsecurityfrommodification,however,itcanbeoutputvia a printer. Printing out the online manual is only allowed for the purpose of using the product. When using the printed information of the online manual, check if the version is the most recent one by referring to the CD-ROM’s version.No part of the online manual may be transferred, sold, distributed (including delivery via a commercial PC network or the like), or registered or recorded on video tapes.
FLEXA, FLXA, SENCOM and FieldMate are trademarks or registered trademarks of Yokogawa Electric Corporation.Adobe, Acrobat and Acrobat Reader are either registered trademarks or trademarks of Adobe Systems Incorporated in the United States and/or other countries.All other company and product names mentioned in this user’s manual are trademarks or registered trademarks of their respective companies.We do not use TM or ® mark to indicate those trademarks or registered trademarks in this user’s manual.
l FLXA202/FLXA21’s fonts(c) Copyright 2000-2001 /efont/ The Electronic Font Open Laboratory. All rights reserved.Redistributionanduseinsourceandbinaryforms,withorwithoutmodification,arepermittedprovided that the following conditions are met:
1. Redistributions of source code must retain the above copyright notice, this list of conditions and the following disclaimer.
2. Redistributions in binary form must reproduce the above copyright notice, this list of conditions and the following disclaimer in the documentation and/or other materials provided with the distribution.
3. Neither the name of the team nor the names of its contributors may be used to endorse or promoteproductsderivedfromthisfontwithoutspecificpriorwrittenpermission.
THISFONTISPROVIDEDBYTHETEAMANDCONTRIBUTORS“ASIS”ANDANYEXPRESSORIMPLIEDWARRANTIES,INCLUDING,BUTNOTLIMITEDTO,THEIMPLIEDWARRANTIESOFMERCHANTABILITYANDFITNESSFORAPARTICULARPURPOSEAREDISCLAIMED.INNOEVENTSHALLTHETEAMORCONTRIBUTORSBELIABLEFORANY DIRECT, INDIRECT, INCIDENTAL, SPECIAL, EXEMPLARY, OR CONSEQUENTIAL DAMAGES (INCLUDING, BUT NOT LIMITED TO, PROCUREMENT OF SUBSTITUTE GOODS ORSERVICES;LOSSOFUSE,DATA,ORPROFITS;ORBUSINESSINTERRUPTION)HOWEVERCAUSEDANDONANYTHEORYOFLIABILITY,WHETHERINCONTRACT,STRICTLIABILITY,ORTORT(INCLUDINGNEGLIGENCEOROTHERWISE)ARISINGINANYWAYOUTOFTHEUSEOFTHISFONT,EVENIFADVISEDOFTHEPOSSIBILITYOFSUCHDAMAGE.
ix
IM 12A01A02-01E 9th Edition : Mar. 23, 2018-00
u CE marking productsn Authorised Representative in EEA
TheAuthorisedRepresentativeforthisproductinEEAisYokogawaEuropeB.V.(Euroweg2,3825HDAmersfoort,TheNetherlands).
n Identification TagThismanualandtheidentificationtagattachedonapackingboxareessentialpartsoftheproduct.Keep them together in a safe place for future reference.
n UsersThis product is designed to be used by a person with specialized knowledge.
n How to dispose the batteries:This is an explanation about the EU Battery Directive. This directive is only valid in the EU.Batteries are included in this product. Batteries incorporated into this product cannot be removed by yourself. Dispose them together with this product.WhenyoudisposethisproductintheEU,contactyourlocalYokogawaEuropeB.V.office.Donotdispose them as domestic household waste.Battery type: Manganese dioxide lithium battery
Notice:
The symbol (see above) means they shall be sorted out and collected as ordained in the EU Battery Directive.
n Information of the WEEE DirectiveThisproductispurposelydesignedtobeusedinalargescalefixedinstallationsonlyand,therefore, is out of scope of the WEEE Directive. The WEEE Directive does not apply. This product should be disposed in accordance with local and national legislation/regulations.The WEEE Directive is only valid in the EU.

Blank Page
Toc-1
IM 12A01A02-01E 9th Edition : Mar. 23, 2018-00
Model FLXA202 / FLXA212-Wire Analyzer
CONTENTS
IM 12A01A02-01E 9th Edition
u Introduction ....................................................................................................iu Safety Precautions ......................................................................................iiiu CE marking products ..................................................................................ix1. INTRODUCTION AND GENERAL DESCRIPTION .................................. 1-1
1.1 Instrument check ..............................................................................................1-31.2 Screen operation ...............................................................................................1-61.3 Passwords ....................................................................................................... 1-111.4 Regulatory Compliance .................................................................................. 1-111.5 Model & Suffix Codes .....................................................................................1-16
2. WIRING AND INSTALLATION .................................................................. 2-12.1 Installation site ..................................................................................................2-32.2 Removing the wiring cover .............................................................................. 2-42.3 Installing the cable glands ...............................................................................2-52.4 Wiring the power supply ..................................................................................2-7
2.4.1 Grounding ..........................................................................................2-82.4.2 Connectionofthepowersupply ........................................................ 2-82.4.3 Wiringcover .......................................................................................2-9
2.5 Sensor wiring ..................................................................................................2-102.5.1 WiringthepH/ORPsensor ..............................................................2-142.5.2 Wiring the conductivity (SC) sensor .................................................2-172.5.3 Wiring the inductive conductivity (ISC) sensor ................................2-172.5.4 Wiringthedissolvedoxygen(DO)sensor .......................................2-182.5.5 WiringtheSENCOMpH/ORPsensor .............................................2-18
2.6 Mounting methods ..........................................................................................2-192.7 Operation .........................................................................................................2-20
3. OPERATION OF pH/ORP ......................................................................... 3-13.1 Change language ..............................................................................................3-23.2 Quick setup ........................................................................................................3-23.3 Home display, Main display and Monitor display .......................................... 3-43.4 Zooming in on details .......................................................................................3-53.5 Trend graphics ................................................................................................3-103.6 Instrument status screen ............................................................................... 3-113.7 Calibration and Commissioning ...................................................................3-12
4. COMMISSIONING OF pH/ORP ................................................................ 4-1
Toc-2
IM 12A01A02-01E 9th Edition : Mar. 23, 2018-00
4.1 Sensor setup .....................................................................................................4-34.2 Measurement setup ..........................................................................................4-3
4.2.1 Measurement .....................................................................................4-34.2.2 Temperaturesettings .........................................................................4-44.2.3 Temperaturecompensation ...............................................................4-44.2.4 Calibrationsettings ............................................................................4-54.2.5 Impedancesettings ............................................................................4-84.2.6 Concentration .....................................................................................4-84.2.7 Sensordiagnosticsettings .................................................................4-9
4.3 Output setup ......................................................................................................4-94.4 Error configuration ......................................................................................... 4-114.5 Logbook configuration ...................................................................................4-134.6 Advanced setup ..............................................................................................4-13
4.6.1 Settings ............................................................................................4-134.6.2 Tag....................................................................................................4-144.6.3 Passwords .......................................................................................4-144.6.4 Date/Time .........................................................................................4-144.6.5 Communication ................................................................................4-144.6.6 Factorysetup ...................................................................................4-17
4.7 Display setup ...................................................................................................4-174.7.1 Maindisplay(Dualdisplay,Individualdisplay).................................4-184.7.2 Trend ................................................................................................4-194.7.3 AutoReturn ......................................................................................4-194.7.4 Adjustcontrast .................................................................................4-194.7.5 MONITORdisplay ............................................................................4-19
4.8 Calculated data setup .....................................................................................4-20
5. CALIBRATION OF pH/ORP ...................................................................... 5-15.1 pH calibration ....................................................................................................5-2
5.1.1 Manual calibration .............................................................................. 5-25.1.2 Automatic calibration..........................................................................5-35.1.3 Sample calibration .............................................................................5-5
5.2 Temperature calibration ...................................................................................5-55.3 ORP calibration (rH calibration) ...................................................................... 5-55.4 HOLD ..................................................................................................................5-65.5 Temporary output .............................................................................................5-6
6. OPERATION OF SC (Conductivity) ......................................................... 6-16.1 Change language ..............................................................................................6-16.2 Quick setup ........................................................................................................6-26.3 Home display, Main display and Monitor display .......................................... 6-46.4 Zooming in on details .......................................................................................6-66.5 Trend graphics ................................................................................................6-106.6 Instrument status screen ............................................................................... 6-116.7 Calibration and Commissioning ................................................................... 6-11

Toc-3
IM 12A01A02-01E 9th Edition : Mar. 23, 2018-00
7. COMMISSIONING OF SC (Conductivity) ............................................... 7-17.1 Measurement setup ..........................................................................................7-3
7.1.1 Measurement .....................................................................................7-37.1.2 Configuresensor................................................................................7-37.1.3 Temperature settings ......................................................................... 7-37.1.4 Temperaturecompensation ...............................................................7-47.1.5 Calibration settings ............................................................................ 7-57.1.6 Concentration ..................................................................................... 7-57.1.7 Sensor diagnostic settings ................................................................. 7-6
7.2 Output setup ......................................................................................................7-67.3 Error configuration ...........................................................................................7-97.4 Logbook configuration ...................................................................................7-107.5 Advanced setup .............................................................................................. 7-11
7.5.1 Settings ............................................................................................ 7-117.5.2 Tag.................................................................................................... 7-117.5.3 Passwords .......................................................................................7-127.5.4 Date/Time .........................................................................................7-127.5.5 Communication ................................................................................7-127.5.6 Factory setup ...................................................................................7-13
7.6 Display setup ...................................................................................................7-137.6.1 Main display (Dual display, Individual display).................................7-137.6.2 Trend ................................................................................................7-147.6.3 Auto Return ......................................................................................7-157.6.4 Adjustcontrast .................................................................................7-157.6.5 MONITOR display ............................................................................7-15
7.7 Calculated data setup .....................................................................................7-15
8. CALIBRATION OF SC (Conductivity) ..................................................... 8-18.1 Cell constant (manual) .....................................................................................8-28.2 Cell constant (automatic) ................................................................................. 8-28.3 Air calibration ....................................................................................................8-28.4 Sample ...............................................................................................................8-28.5 Temperature coefficient ................................................................................... 8-38.6 Temperature calibration ...................................................................................8-38.7 HOLD ..................................................................................................................8-38.8 Temporary output .............................................................................................8-4
9. OPERATION OF ISC (Induvtive Conductivity)....................................... 9-19.1 Change language ..............................................................................................9-29.2 Quick setup ........................................................................................................9-29.3 Main display and Monitor display ...................................................................9-49.4 Zooming in on details .......................................................................................9-59.5 Trend graphics ..................................................................................................9-99.6 Instrument status screen ............................................................................... 9-119.7 Calibration and Commissioning ................................................................... 9-11

Toc-4
IM 12A01A02-01E 9th Edition : Mar. 23, 2018-00
10. COMMISSIONING OF ISC (Inductive Conductivity) ........................... 10-110.1 Measurement setup ........................................................................................10-2
10.1.1 Measurement ...................................................................................10-310.1.2 Configuresensor..............................................................................10-310.1.3 Temperature settings .......................................................................10-310.1.4 Temperaturecompensation .............................................................10-310.1.5 Calibration settings ..........................................................................10-410.1.6 Concentration ...................................................................................10-510.1.7 Sensor diagnostic settings ...............................................................10-6
10.2 Output setup ....................................................................................................10-610.3 Error configuration .........................................................................................10-710.4 Logbook configuration ...................................................................................10-810.5 Advanced setup ..............................................................................................10-9
10.5.1 Settings ............................................................................................10-910.5.2 Tag....................................................................................................10-910.5.3 Passwords .....................................................................................10-1010.5.4 Date/Time .......................................................................................10-1010.5.5 Communication ..............................................................................10-1010.5.6 Factory setup ................................................................................. 10-11
10.6 Display setup ................................................................................................. 10-1110.6.1 Main display ................................................................................... 10-1110.6.2 Trend .............................................................................................. 10-1110.6.3 Auto Return ....................................................................................10-1210.6.4 Adjustcontrast ...............................................................................10-1210.6.5 MONITOR display ..........................................................................10-12
11. CALIBRATION OF ISC (Inductive Conductivity) ................................. 11-111.1 Cell constant (manual) ................................................................................... 11-311.2 Cell constant (automatic) ............................................................................... 11-311.3 Air calibration .................................................................................................. 11-311.4 Sample ............................................................................................................. 11-411.5 Temperature coefficient ................................................................................. 11-411.6 Temperature calibration ................................................................................. 11-511.7 HOLD ................................................................................................................ 11-5
12. OPERATION OF DO (Dissolved Oxygen) ..................................................... 12-112.1 Change language ............................................................................................12-212.2 Quick setup ......................................................................................................12-212.3 Home display, Main display and Monitor display ........................................12-412.4 Zooming in on details .....................................................................................12-512.5 Trend graphics ................................................................................................12-912.6 Instrument status screen .............................................................................12-1012.7 Calibration and Commissioning .................................................................12-10
13. COMMISSIONING OF DO (Dissolved Oxygen) ................................... 13-113.1 Sensor setup ...................................................................................................13-2

Toc-5
IM 12A01A02-01E 9th Edition : Mar. 23, 2018-00
13.2 Measurement setup ........................................................................................13-313.2.1 Sensor setup ....................................................................................13-313.2.2 Temperature settings .......................................................................13-313.2.3 Temperature compensation .............................................................13-313.2.4 Salinitycompensation ......................................................................13-313.2.5 Pressure comp. (Measure) ..............................................................13-313.2.6 Calibration settings ..........................................................................13-413.2.7 Sensor diag. settings .......................................................................13-5
13.3 Output setup ....................................................................................................13-513.4 Error configuration .........................................................................................13-713.5 Logbook configuration ...................................................................................13-813.6 Advanced setup ..............................................................................................13-9
13.6.1 Settings ............................................................................................13-913.6.2 Tag....................................................................................................13-913.6.3 Passwords .....................................................................................13-1013.6.4 Date/Time .......................................................................................13-1013.6.5 Communication ..............................................................................13-1013.6.6 Factory setup .................................................................................13-12
13.7 Display setup .................................................................................................13-1213.7.1 Main display (Dual display, Individual display)...............................13-1213.7.2 Trend ..............................................................................................13-1313.7.3 Auto Return ....................................................................................13-1413.7.4 Adjustcontrast ...............................................................................13-1413.7.5 MONITOR display ..........................................................................13-14
13.8 Calculated data setup ...................................................................................13-14
14. CALIBRATION OF DO (Dissolved Oxygen) ........................................................14-114.1 Air calibration ..................................................................................................14-214.2 Water calibration .............................................................................................14-214.3 Manual slope calibration ................................................................................14-314.4 Temperature calibration .................................................................................14-314.5 HOLD ................................................................................................................14-414.6 Temporary output ...........................................................................................14-4
15. OPERATION OF SENCOM pH/ORP ...................................................... 15-115.1 Change language ............................................................................................15-215.2 Quick setup ......................................................................................................15-215.3 Main display and Monitor display .................................................................15-415.4 Zooming in on details .....................................................................................15-515.5 Trend graphics ..............................................................................................15-1215.6 Instrument status screen .............................................................................15-1315.7 Calibration and Commissioning .................................................................15-13
16. COMMISSIONING OF SENCOM pH/ORP ..................................................... 16-116.1 Sensor setup ...................................................................................................16-316.2 Measurement setup ........................................................................................16-4

Toc-6
IM 12A01A02-01E 9th Edition : Mar. 23, 2018-00
16.2.1 Measurement ...................................................................................16-416.2.2 Temperature settings .......................................................................16-416.2.3 Temperature compensation .............................................................16-416.2.4 Calibrationsettings ..........................................................................16-616.2.5 Impedance settings ..........................................................................16-916.2.6 Concentration ...................................................................................16-916.2.7 Sensor diagnostic settings ...............................................................16-9
16.3 Output setup ..................................................................................................16-1016.4 Error configuration ....................................................................................... 16-1116.5 Logbook configuration .................................................................................16-1216.6 Advanced setup ............................................................................................16-13
16.6.1 Settings ..........................................................................................16-1316.6.2 Tag..................................................................................................16-1416.6.3 Passwords .....................................................................................16-1416.6.4 Date/Time .......................................................................................16-1416.6.5 Communication ..............................................................................16-1416.6.6 Factory setup .................................................................................16-17
16.7 Display setup .................................................................................................16-1716.7.1 Main display ...................................................................................16-1716.7.2 Trend ..............................................................................................16-1816.7.3 Auto Return ....................................................................................16-1816.7.4 Adjustcontrast ...............................................................................16-1816.7.5 MONITOR display ..........................................................................16-18
17. CALIBRATION OF SENCOM pH/ORP ................................................... 17-117.1 pH calibration ..................................................................................................17-2
17.1.1 Manual calibration ............................................................................17-217.1.2 Automatic calibration........................................................................17-317.1.3 Sample calibration ...........................................................................17-5
17.2 Temperature calibration .................................................................................17-517.3 ORP calibration (rH calibration) ....................................................................17-517.4 HOLD ................................................................................................................17-6
18. MAINTENANCE ....................................................................................... 18-119. TROUBLESHOOTING ............................................................................ 19-1Appendix 1 For pH/ORP .........................................................................App.1-1Appendix 2 For SC (Conductivity) ........................................................App.2-1Appendix 3 For ISC (Inductive Conductivity) ..............................................App.3-1Appendix 4 For DO (Dissolved Oxygen) ..............................................App.4-1Appendix 5 Control Drawings ...............................................................App.5-1
App. 5.1 ATEX and IECEx FLXA202/FLXA21: Intrinsic safety “ia” .................................................App.5-1
App. 5.2 CSA FLXA202/FLXA21: Intrinsic safety, Nonincendive, FLXA202: Type of protection ‘n’ ............................................................App.5-3

Toc-7
IM 12A01A02-01E 9th Edition : Mar. 23, 2018-00
App. 5.3 FM FLXA202/FLXA21: Intrinsic safety, Nonincendive...............................App.5-7
App. 5.4 ATEX (Type n) FLXA202: Type of protection ‘n’ ..........................................................App.5-10
App. 5.5 IECEx (Type n) FLXA202: Type of protection ‘n’ ..........................................................App.5-12
App. 5.6 NEPSI and KOSHA FLXA202/FLXA21: Intrinsic safety “ia” ...............................................App.5-14
Customer Maintenance Parts List ......................................CMPL 12A01A02-01ECustomer Maintenance Parts List ...................................CMPL 12A01A03-01ENRevision Record .......................................................................................................i

Blank Page
<1. INTRODUCTION AND GENERAL DESCRIPTION> 1-1
IM 12A01A02-01E 9th Edition : Mar. 23, 2018-00
1. INTRODUCTION AND GENERAL DESCRIPTION
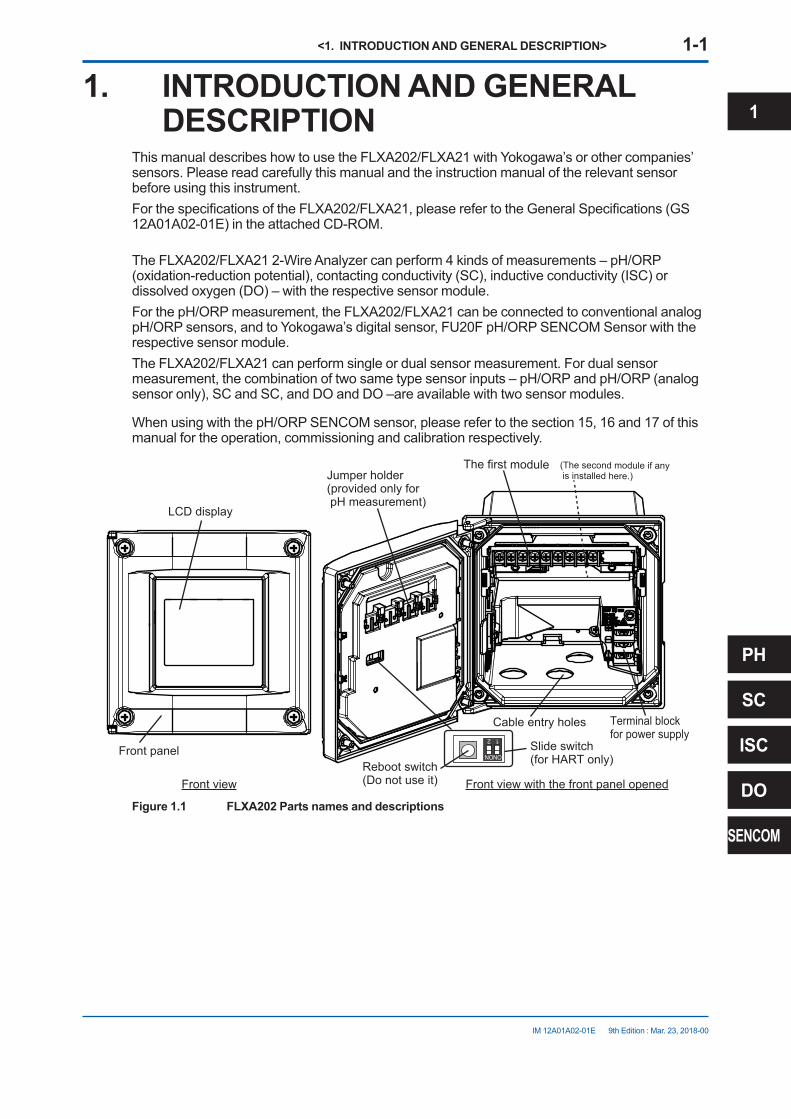
This manual describes how to use the FLXA202/FLXA21 with Yokogawa’s or other companies’ sensors. Please read carefully this manual and the instruction manual of the relevant sensor before using this instrument.ForthespecificationsoftheFLXA202/FLXA21,pleaserefertotheGeneralSpecifications(GS12A01A02-01E) in the attached CD-ROM.
TheFLXA202/FLXA212-WireAnalyzercanperform4kindsofmeasurements–pH/ORP(oxidation-reduction potential), contacting conductivity (SC), inductive conductivity (ISC) or dissolvedoxygen(DO)–withtherespectivesensormodule.ForthepH/ORPmeasurement,theFLXA202/FLXA21canbeconnectedtoconventionalanalogpH/ORPsensors,andtoYokogawa’sdigitalsensor,FU20FpH/ORPSENCOMSensorwiththerespective sensor module. The FLXA202/FLXA21 can perform single or dual sensor measurement. For dual sensor measurement,thecombinationoftwosametypesensorinputs–pH/ORPandpH/ORP(analogsensoronly),SCandSC,andDOandDO–areavailablewithtwosensormodules.
WhenusingwiththepH/ORPSENCOMsensor,pleaserefertothesection15,16and17ofthismanual for the operation, commissioning and calibration respectively.
1
ON
2
ON
Cable entry holes
Jumper holder (provided only for pH measurement)
Front view Front view with the front panel openedReboot switch(Do not use it)
Terminal block for power supply
LCD display
Slide switch(for HART only)
Front panel
The first module (The second module if any is installed here.)
Figure 1.1 FLXA202 Parts names and descriptions
1
PH
SC
ISC
DO
SENCOM

<1. INTRODUCTION AND GENERAL DESCRIPTION> 1-2
IM 12A01A02-01E 9th Edition : Mar. 23, 2018-00
1
ON
2
ON
Cable entry holes
Wiring cover 1 (for the first module)
Jumper holder (provided only for pH measurement)
Front view Front view with the front panel opened
Front view with all wiring covers removed
Reboot switch(Do not use it)
Terminal block for power supply
LCD display
Slide switch(for HART only)
Wiring cover 2 (for the second module)
Front panel
The first module
(The second module if any is installed here.)
Nameplate
(Wiring cover 3 for power supply and grounding is under the wiring cover 2.)
Figure 1.2 FLXA21 Parts names and descriptions

<1. INTRODUCTION AND GENERAL DESCRIPTION> 1-3
IM 12A01A02-01E 9th Edition : Mar. 23, 2018-00
1.1 Instrument checkUpon delivery, unpack the instrument carefully and inspect it to ensure that it was not damaged during shipment. If damage is found, retain the original packing materials (including the outer box)andthenimmediatelynotifythecarrierandtherelevantYokogawasalesoffice.
n Checking the model and suffix code
l FLXA202Makesurethemodelandsuffixcodeonthenameplateaffixedtotheleftsideofthehousing.Refer to Section 1.5.
NOTEBe sure to apply correct power to the unit , as detailed on the nameplate.
-D-B-D-AB-P1-P1-A-N-LA-N-N/U/H6
Figure 1.3 Example of nameplate (FLXA202)
l FLXA21Loosen four front panel screws of the FLXA21, open the panel to the left, and make sure the modelandsuffixcodeonthenameplateaffixedtotheleftsideorinsideofthehousingagreeswith your order. Refer to Section 1.5.
CAUTIONWhen you open the front panel, make sure the screws are completely out of the screw holes, and then open the front panel slowly in order not to damage the threaded parts on the housing. If the threaded parts are damaged and the screws cannot be tightened, the waterproof performance will deteriorate.
NOTEBe careful not to lose the four front panel screws.
1
PH
SC
ISC
DO
SENCOM

<1. INTRODUCTION AND GENERAL DESCRIPTION> 1-4
IM 12A01A02-01E 9th Edition : Mar. 23, 2018-00
-D-P-D-CB-P1-NN-A-N-LA-N-NN/UM/SCTS3.02
2016.01C2RA12345
S3.022016.01C2RA12345
-D-P-D-AA-P1-NN-A-N-LA-N-NN/UM/SCT/H6
Figure 1.4 Example of nameplate (FLXA21)
<1. INTRODUCTION AND GENERAL DESCRIPTION> 1-5
IM 12A01A02-01E 9th Edition : Mar. 23, 2018-00
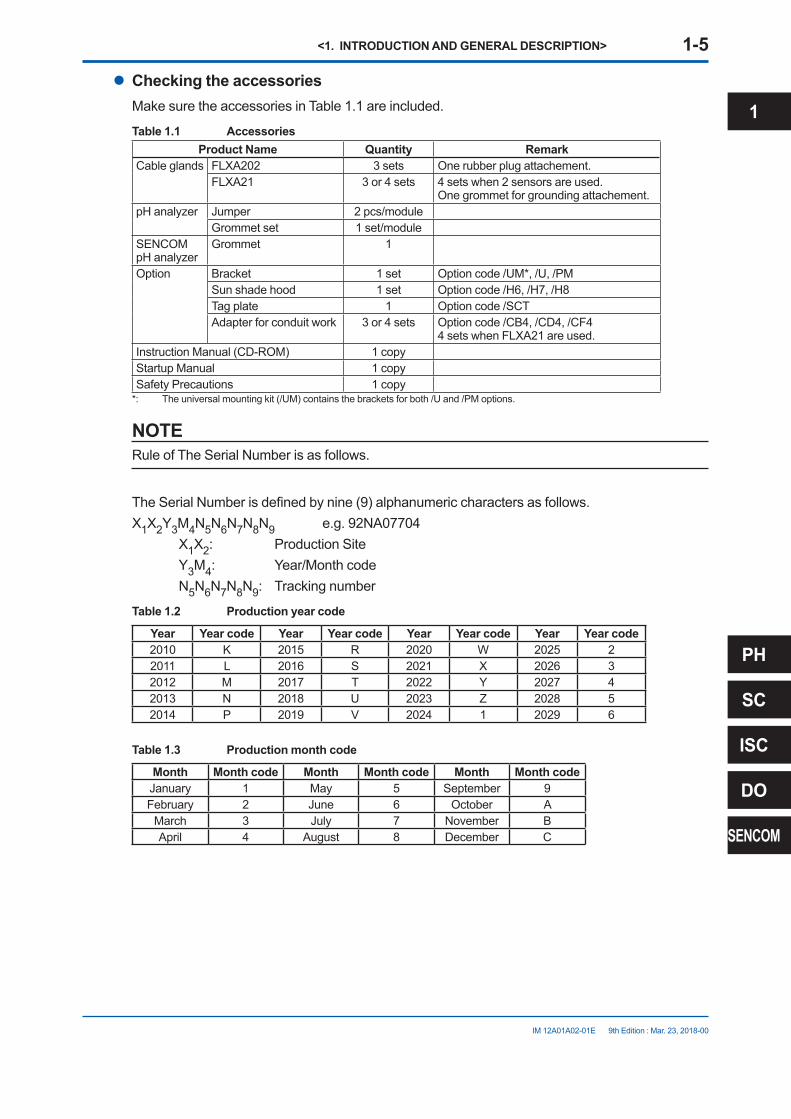
l Checking the accessoriesMake sure the accessories in Table 1.1 are included.
Table 1.1 AccessoriesProduct Name Quantity Remark
Cable glands FLXA202 3 sets One rubber plug attachement.FLXA21 3or4sets 4setswhen2sensorsareused.
One grommet for grounding attachement.pHanalyzer Jumper 2 pcs/module
Grommet set 1 set/moduleSENCOM pHanalyzer
Grommet 1
Option Bracket 1 set Option code /UM*, /U, /PMSun shade hood 1 set Optioncode/H6,/H7,/H8Tag plate 1 Option code /SCTAdapter for conduit work 3or4sets Optioncode/CB4,/CD4,/CF4
4setswhenFLXA21areused.Instruction Manual (CD-ROM) 1 copyStartup Manual 1 copySafety Precautions 1 copy
*: The universal mounting kit (/UM) contains the brackets for both /U and /PM options.
NOTERule of The Serial Number is as follows.
TheSerialNumberisdefinedbynine(9)alphanumericcharactersasfollows.X1X2Y3M4N5N6N7N8N9 e.g.92NA07704 X1X2: Production Site Y3M4: Year/Month code N5N6N7N8N9: Tracking number
Table 1.2 Production year code
Year Year code Year Year code Year Year code Year Year code2010 K 2015 R 2020 W 2025 22011 L 2016 S 2021 X 2026 32012 M 2017 T 2022 Y 2027 42013 N 2018 U 2023 Z 2028 52014 P 2019 V 2024 1 2029 6
Table 1.3 Production month code
Month Month code Month Month code Month Month codeJanuary 1 May 5 September 9February 2 June 6 October A
March 3 July 7 November BApril 4 August 8 December C
1
PH
SC
ISC
DO
SENCOM
<1. INTRODUCTION AND GENERAL DESCRIPTION> 1-6
IM 12A01A02-01E 9th Edition : Mar. 23, 2018-00
1.2 Screen operationCAUTIONPress the touch screen only with your finger. Do not use a tool with a sharp tip (ex. pencil, ballpoint pen), a thin stick, a tool with a hard tip etc. to avoid scratches on the touch screen.Press the center of the icon or character to avoid wrong operation.
The main screen operations are as follows.When you press any of the following icons on the screen, the screen changes to the respective display or executes the respective function. → →
Returns to the main display (or home display).
Returns to the previous display.
Moves the cursor for selecting the menu item. Pressing the icon moves the cursor down to the next item. When the cursor is on the item at the very bottom, the cursor jumps back to the item at the top.
Confirmstheinput;forexample,theselectedmenuitemorsettingvalue.
NOTEWhen no operation is performed for 10 minutes or 60 minutes (depending on the setting of “Auto Return”), the display except Trend display automatically changes to the Monitor display (or to the MaindisplayortheHomedisplaywhentheMONITORdisplayisdisabled).
ThefiguresinthissectionshowthepHmeasurementforexample.Eachdisplayisdifferentindetailsduetosettings.Eachdisplayisonlyanexampleforsomesettings.
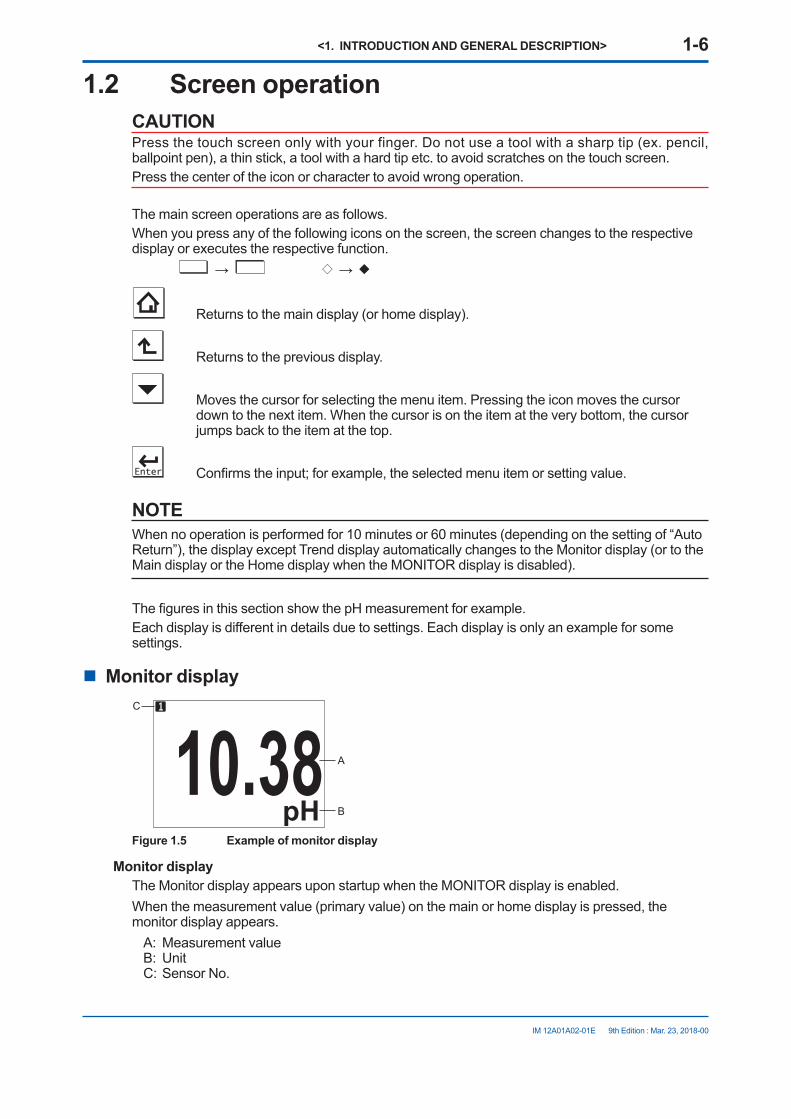
n Monitor display
10.38pH
C
A
B
Figure 1.5 Example of monitor display
Monitor displayThe Monitor display appears upon startup when the MONITOR display is enabled.When the measurement value (primary value) on the main or home display is pressed, the monitor display appears.
A: Measurement valueB: UnitC: Sensor No.
<1. INTRODUCTION AND GENERAL DESCRIPTION> 1-7
IM 12A01A02-01E 9th Edition : Mar. 23, 2018-00
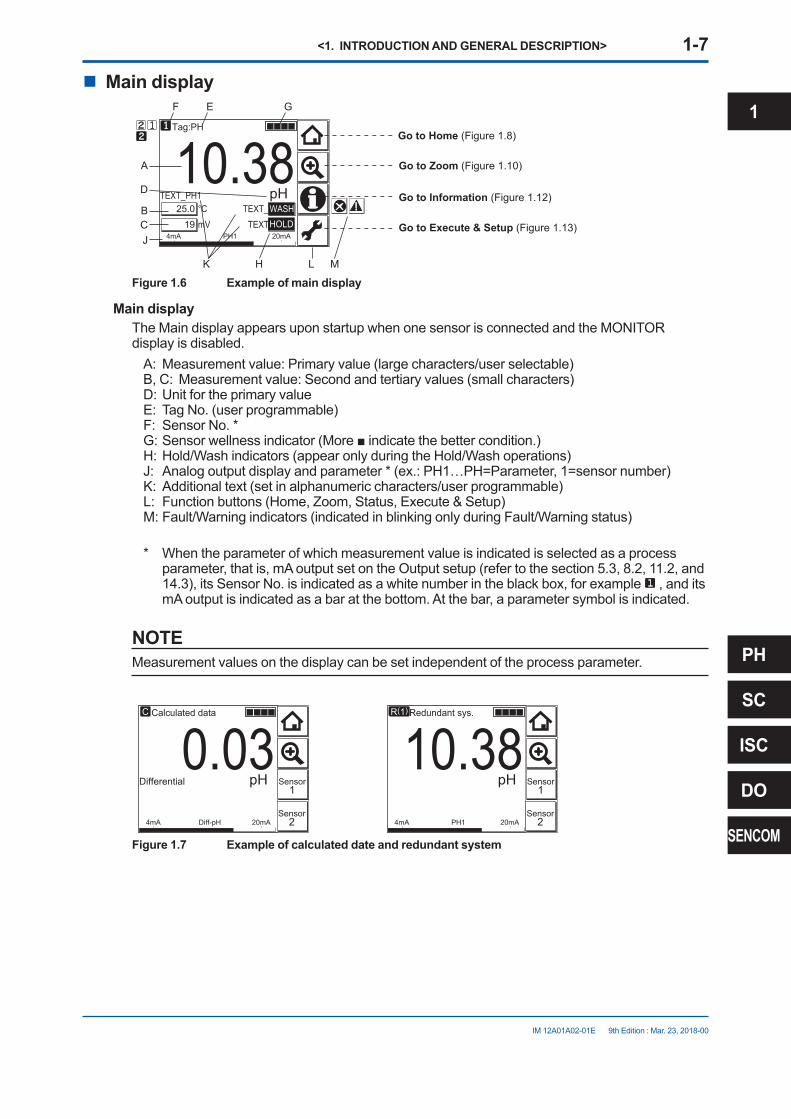
n Main display
10.38Tag:PH
TEXT_PH1
TEXT_ORP1TEXT_TEMP1
1925.0
mV4mA 20mAPH1
°CpH
HOLDWASH
Go to Home (Figure 1.8)
Go to Zoom (Figure 1.10)
Go to Information (Figure 1.12)
Go to Execute & Setup (Figure 1.13)BC
A
D
J
GEF
K H ML
Figure 1.6 Example of main display
Main displayThe Main display appears upon startup when one sensor is connected and the MONITOR display is disabled.
A: Measurement value: Primary value (large characters/user selectable)B, C: Measurement value: Second and tertiary values (small characters)D: Unit for the primary valueE: Tag No. (user programmable)F: Sensor No. *G:Sensorwellnessindicator(Moreindicatethebettercondition.)H:Hold/Washindicators(appearonlyduringtheHold/Washoperations)J: Analog output display and parameter*(ex.:PH1…PH=Parameter,1=sensornumber)K: Additional text (set in alphanumeric characters/user programmable)L: Functionbuttons(Home,Zoom,Status,Execute&Setup)M: Fault/Warning indicators (indicated in blinking only during Fault/Warning status)
* When the parameter of which measurement value is indicated is selected as a process parameter, that is, mA output set on the Output setup (refer to the section 5.3, 8.2, 11.2, and 14.3),itsSensorNo.isindicatedasawhitenumberintheblackbox,forexample , and its mA output is indicated as a bar at the bottom. At the bar, a parameter symbol is indicated.
NOTEMeasurement values on the display can be set independent of the process parameter.
0.034mA 20mADiff-pH
pH
C
Sensor2
Sensor1
Calculated data
Differential10.38
4mA 20mAPH1
pH
Sensor2
Sensor1
R(1) Redundant sys.
Figure 1.7 Example of calculated date and redundant system
1
PH
SC
ISC
DO
SENCOM

<1. INTRODUCTION AND GENERAL DESCRIPTION> 1-8
IM 12A01A02-01E 9th Edition : Mar. 23, 2018-00
n Home display (when two sensors are connected)
6.35Tag:PH
24.9
4mA 20mAPH1
°C24 mV
pH
Tag:PH25.0 °C19 mV
pH
10.38 ABC
F
K
H
ED
G
J
Figure 1.8 Example of home display
Home displayTheHomedisplayappearsuponstartupwhentwosensorsareconnectedandtheMONITORdisplay is disabled.(Homedisplayisnotavailablewhenonlyonesensorisconnected)
A: Measurement value: Primary value (large characters/user selectable)B, C: Measurement value: Secondary and tertiary values (small characters)D: Unit for the primary valueE: Tag No. (user programmable)F: Sensor No.G:Sensorwellnessindicator(Moreindicatethebettercondition.)H:Hold/Washindicators(appearonlyduringtheHold/Washoperations)J: Analog output display and parameter(ex.:PH1…PH=Parameter,1=sensornumber)K: Fault/Warning indicators (indicated in blinking only during Fault/Warning status)
4mA 20mADiff-pH
pH
0.03C
6.3524.9 °C24 mV
pHTag:PH
Calculated data
4mA 20mAPH1
pH
10.38R(1)
25.0 °C19 mV
pH
10.38Tag:PH
Redundant system
Figure 1.9 Example of home display of calculated data and redundant system
n Zoom display
Next
20
12
4
mA
15.00
HOLD
FAIL
WASH
Next
Figure 1.10 Example zoom display
The zoom display appears when the Zoom button on the main display is pressed.The Zoom display shows an easy-to-read graphical display of the output status. Pressing Next displaysthecontactstateifcommunicationissettoPH201Gdistributor.PressingNextagaindisplays the status information of the instrument.
<1. INTRODUCTION AND GENERAL DESCRIPTION> 1-9
IM 12A01A02-01E 9th Edition : Mar. 23, 2018-00
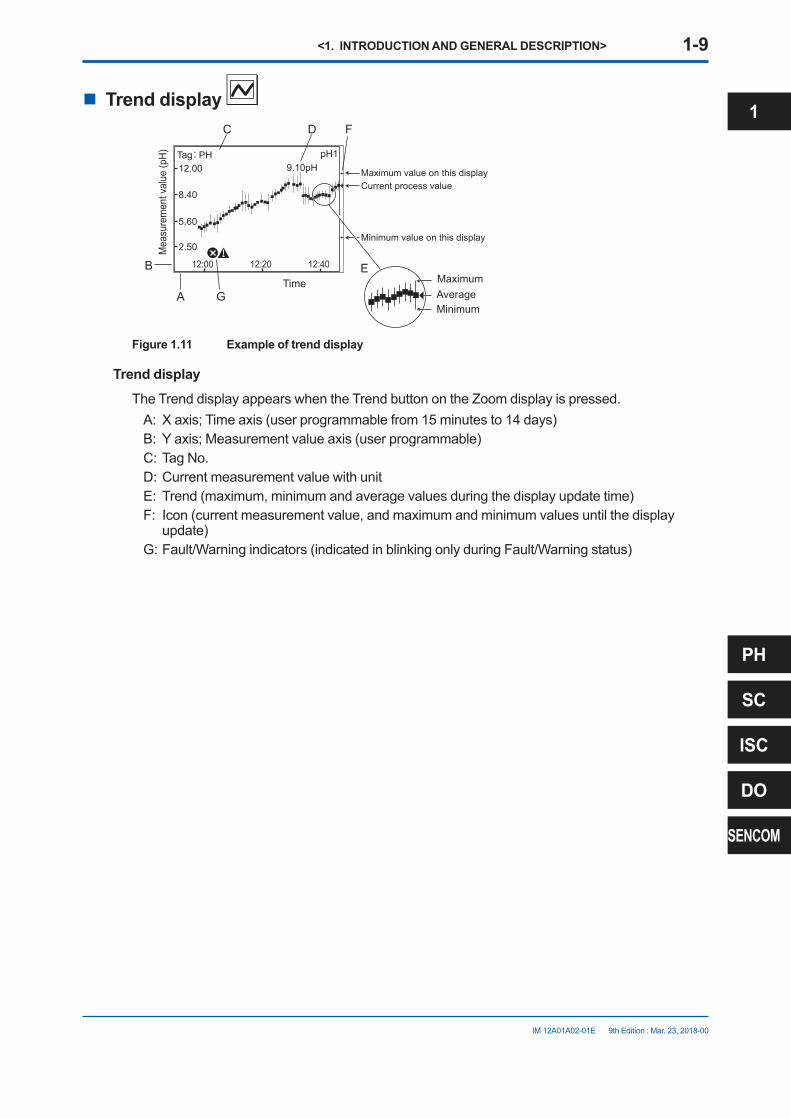
n Trend display
12.00
8.40
5.60
2.50
12:00 12:20 12:40
9.10pH
Minimum
MaximumAverage
Current process value
Time
Tag:M
easu
rem
ent v
alue
(pH)
Maximum value on this display
Minimum value on this display
PH pH1
A
D
B
G
E
FC
Figure 1.11 Example of trend display
Trend displayThe Trend display appears when the Trend button on the Zoom display is pressed.A:Xaxis;Timeaxis(userprogrammablefrom15minutesto14days)B: Yaxis;Measurementvalueaxis(userprogrammable)C: Tag No.D: Current measurement value with unitE: Trend (maximum, minimum and average values during the display update time)F: Icon (current measurement value, and maximum and minimum values until the display
update)G: Fault/Warning indicators (indicated in blinking only during Fault/Warning status)
1
PH
SC
ISC
DO
SENCOM

<1. INTRODUCTION AND GENERAL DESCRIPTION> 1-10
IM 12A01A02-01E 9th Edition : Mar. 23, 2018-00
n Information button Diagnosis information on converters and sensors appears.
No malfunction detected.
WarningWhen a warning icon appears, maintenance is required. Pressing this icon displays an error message, and pressing the message displays the troubleshooting guidelines.
FaultThis icon indicates a malfunction. Pressing this icon displays an error message, and pressing the message displays the troubleshooting guidelines.
For some errors concerned with setting, a message on the remedy can jump to the relevant setting directly.
Problem with mA and Processparameter. RemedySelect a correct ‘Process parameter’ for mA in: Commissioning >> Output setup
Fault: mA configuration error
Figure 1.12 Example of jumping from remedy to setting
If neither a fault is detected nor warning is indicated, “Working properly” is displayed.If a fault is detected or warning is indicated, up to 3 messages appear.
n Execute & Setup Allowsyoutocalibrateandconfiguretheinstrument.Theseoperationscanbeprotectedwithapassword.
Execute: Calibration HOLD Temporary output
Setup: Commissioning Change language Start Quick Setup
Execute & Setup
Figure 1.13 Example of Execute & Setup display

<1. INTRODUCTION AND GENERAL DESCRIPTION> 1-11
IM 12A01A02-01E 9th Edition : Mar. 23, 2018-00
1.3 PasswordsPasswords can protect the FLXA202/FLXA21 from other persons’ access except a right operator’s.
Execute: Calibration/Wash HOLD Temporary output
Setup: Comissioning Change language Start Quick Setup
Execute &Setup Sensor setup Measurement setup Output setup Error configuration Logbook configuration Advanced setup Display setup Calculated data setup
Commissioning Settings Tag Passwords Date/Time Communication Factory setup
Advanced setupExecute:
Commissioning:
Entering an empty passwordresults in disabling thepassword check.
Passwords
Figure 1.14 Example of passwords setting
Execute operation and Commissioning operation can be separately protected by each password. WhentheExecutepasswordisset,executionofCalibration(/Wash),HOLDorTemporaryoutputneeds to enter the password to start each execution. When the Commissioning password is set, Commissioning and Start Quick Setup needs to enter the password to start the setting-up.
Refertothesection4.6.3,7.5.3,10.5.3,13.6.3or16.6.3fordetailsofsettingpasswords.
1.4 Regulatory Compliancel Safety, EMC and RoHS Compliance (FLXA202/FLXA21)
Safety: UL 61010-1 UL 61010-2-030 CAN/CSA-C22.2 No.61010-1 CAN/CSA-C22.2 No.61010-2-030 EN61010-1 EN61010-2-030EMC: EN61326-1 Class A, Table 2 (For use in industrial locations) Influenceofimmunityenvironment(CriteriaA):Outputshiftisspecifiedwithin±25%ofF.S. EN61326-2-3 RCM: EN61326-1 Class A, Table 2 Korea Electromagnetic Conformity Standard Class A 한국 전자파적합성 기준
A급 기기 (업무용 방송통신기자재) 이 기기는 업무용(A급) 전자파적합기기로서 판매자 또는 사용자는 이 점을 주의하시기 바라며, 가정외의 지역에서 사용하는 것을 목적으로 합니다.
Russian: TR CU 020/2011RoHS: EN50581:2012(FLXA202;Style1.02ornewer,FLXA21;Style3.03ornewer)Installation altitude: 2000 m or lessCategory based on IEC 61010: I (Note 1)Pollution degree based on IEC 61010: 2 (Note 2)Note1: Installationcategory,calledover-voltagecategory,specifiesimpulsewithstandvoltage. Equipment with “Category I” (ex. two-wire transmitter) is used for connection to circuits in which measures are taken
to limit transient over-voltages to an appropriately low level.Note 2: Pollution degree indicates the degree of existence of solid, liquid, gas or other inclusions which may reduce
dielectric strength. Degree 2 is the normal indoor environment.
1
PH
SC
ISC
DO
SENCOM
<1. INTRODUCTION AND GENERAL DESCRIPTION> 1-12
IM 12A01A02-01E 9th Edition : Mar. 23, 2018-00
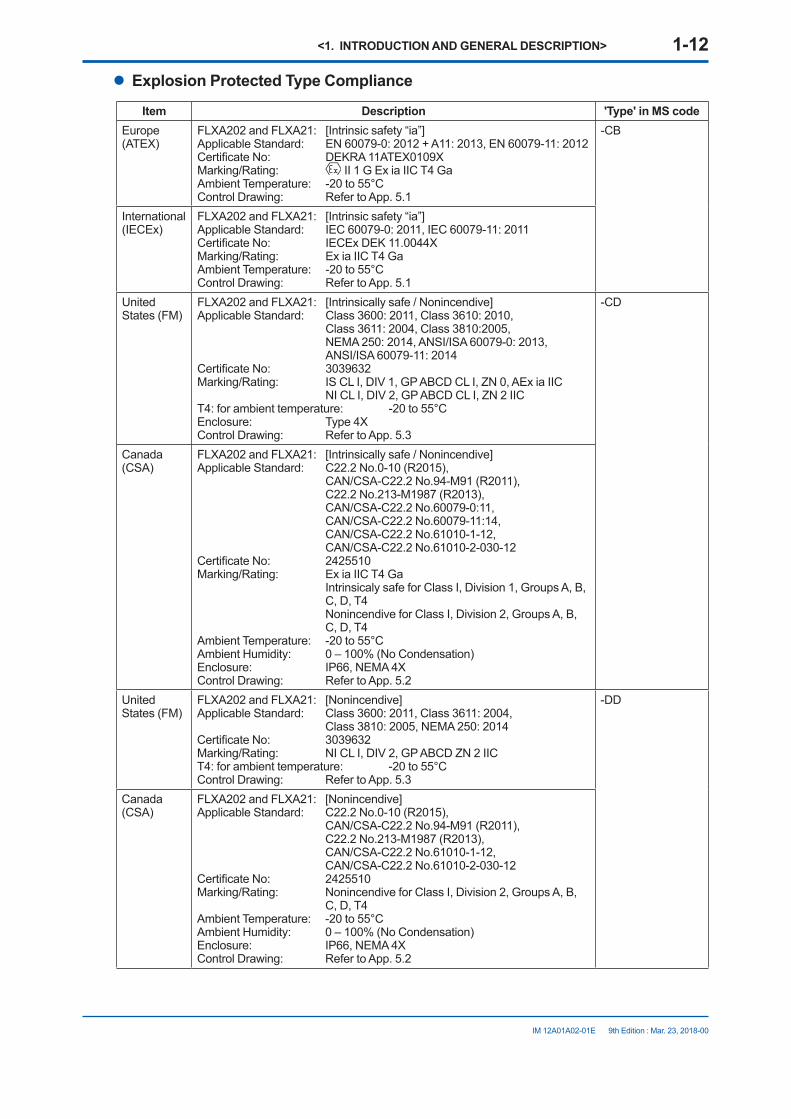
l Explosion Protected Type Compliance
Item Description 'Type' in MS codeEurope (ATEX)
FLXA202 and FLXA21: [Intrinsic safety “ia”]Applicable Standard: EN 60079-0: 2012 + A11: 2013, EN 60079-11: 2012CertificateNo: DEKRA11ATEX0109XMarking/Rating: II1GExiaIICT4GaAmbient Temperature: -20 to 55°CControl Drawing: Refer to App. 5.1
-CB
International (IECEx)
FLXA202 and FLXA21: [Intrinsic safety “ia”]Applicable Standard: IEC 60079-0: 2011, IEC 60079-11: 2011CertificateNo: IECExDEK11.0044XMarking/Rating: ExiaIICT4GaAmbient Temperature: -20 to 55°CControl Drawing: Refer to App. 5.1
United States (FM)
FLXA202 and FLXA21: [Intrinsically safe / Nonincendive]Applicable Standard: Class 3600: 2011, Class 3610: 2010,
Class3611:2004,Class3810:2005, NEMA250:2014,ANSI/ISA60079-0:2013, ANSI/ISA60079-11:2014
CertificateNo: 3039632Marking/Rating: ISCLI,DIV1,GPABCDCLI,ZN0,AExiaIIC
NICLI,DIV2,GPABCDCLI,ZN2IICT4:forambienttemperature: -20to55°CEnclosure: Type4X Control Drawing: Refer to App. 5.3
-CD
Canada (CSA)
FLXA202 and FLXA21: [Intrinsically safe / Nonincendive]Applicable Standard: C22.2 No.0-10 (R2015),
CAN/CSA-C22.2No.94-M91(R2011), C22.2 No.213-M1987 (R2013), CAN/CSA-C22.2 No.60079-0:11, CAN/CSA-C22.2No.60079-11:14, CAN/CSA-C22.2 No.61010-1-12, CAN/CSA-C22.2 No.61010-2-030-12
CertificateNo: 2425510Marking/Rating: ExiaIICT4Ga
Intrinsicaly safe for Class I, Division 1, Groups A, B, C,D,T4 Nonincendive for Class I, Division 2, Groups A, B, C,D,T4
Ambient Temperature: -20 to 55°CAmbientHumidity: 0–100%(NoCondensation)Enclosure: IP66,NEMA4XControl Drawing: Refer to App. 5.2
United States (FM)
FLXA202 and FLXA21: [Nonincendive]ApplicableStandard: Class3600:2011,Class3611:2004,
Class3810:2005,NEMA250:2014CertificateNo: 3039632 Marking/Rating: NICLI,DIV2,GPABCDZN2IIC T4:forambienttemperature: -20to55°C Control Drawing: Refer to App. 5.3
-DD
Canada (CSA)
FLXA202 and FLXA21: [Nonincendive] Applicable Standard: C22.2 No.0-10 (R2015),
CAN/CSA-C22.2No.94-M91(R2011), C22.2 No.213-M1987 (R2013), CAN/CSA-C22.2 No.61010-1-12, CAN/CSA-C22.2 No.61010-2-030-12
CertificateNo: 2425510Marking/Rating: Nonincendive for Class I, Division 2, Groups A, B,
C,D,T4Ambient Temperature: -20 to 55°CAmbientHumidity: 0–100%(NoCondensation) Enclosure: IP66,NEMA4X Control Drawing: Refer to App. 5.2

<1. INTRODUCTION AND GENERAL DESCRIPTION> 1-13
IM 12A01A02-01E 9th Edition : Mar. 23, 2018-00
Item Description 'Type' in MS codeCanada (CSA)
FLXA202: [Type of protection 'n' / Nonincendive]Applicable Standard: C22.2 No.0-10 (R2015),
CAN/CSA-C22.2No.94-M91(R2011), C22.2 No.213-M1987 (R2013), CAN/CSA-C22.2 No.60079-0:11, CAN/CSA-C22.2No.60079-11:14, CAN/CSA-C22.2 No.60079-15:12, CAN/CSA-C22.2 No.61010-1-12, CAN/CSA-C22.2 No.61010-2-030-12
CertificateNo: 2425510Marking/Rating: ExnAicIICT4Gc
Nonincendive for Class I, Division 2, Groups A, B, C,D,T4
Ambient Temperature: -20 to 55°CAmbientHumidity: 0–100%(NoCondensation)Enclosure: IP66,NEMA4XControl Drawing: Refer to App. 5.2
-DE
Europe (ATEX)
FLXA202: [Type of protection 'n']Certificate: NotApplicableasperAnnexVIIItoATEX2014/34/EUApplicable Standard: EN 60079-0: 2012 + A11:2013, EN 60079-11: 2012,
EN 60079-15: 2010, EN 60529: 1991+A2:2013Marking/Rating: II3GExnAicIICT4GcAmbient Temperature: -20 to 55°CEnclosure: IP66ControlDrawing: RefertoApp.5.4
-DB
International (IECEx)
FLXA202: [Type of protection 'n']Applicable Standard: IEC 60079-0: 2011, IEC 60079-11:2011,
IEC 60079-15: 2010CertificateNo: IECExDEK16.0034XMarking/Rating: ExnAicIICT4GcAmbient Temperature: -20 to 55°CEnclosure: IP66Control Drawing: Refer to App. 5.5
China (NEPSI)
FLXA202 and FLXA21: [Intrinsic safety “ia”]ApplicableStandard: GB3836.1-2010,GB3836.4-2010,
GB 3836.20-2010CertificateNo: GYJ18.1051XMarking/Rating: ExiaIICT4GaAmbient Temperature: -20 to 55°CControl Drawing: Refer to App. 5.6
-CH
Korea (KOSHA)
FLXA202: [Intrinsic safety “ia” ]ApplicableStandard: NoticeofMinistryofLaborNo.2016-54CertificateNo: 15-AV4BO-0160XMarking/Rating: ExiaIICT4GaAmbient Temperature: -20 to 55°CControl Drawing: Refer to App. 5.6
-CG
FLXA21: [Intrinsic safety “ia”]ApplicableStandard: NoticeofMinistryofLaborNo.2016-54CertificateNo: 15-AV4BO-0160XMarking/Rating: ExiaIICT4Ambient Temperature: -20 to 55°CControl Drawing: Refer to App. 5.6
-EG
1
PH
SC
ISC
DO
SENCOM
<1. INTRODUCTION AND GENERAL DESCRIPTION> 1-14
IM 12A01A02-01E 9th Edition : Mar. 23, 2018-00
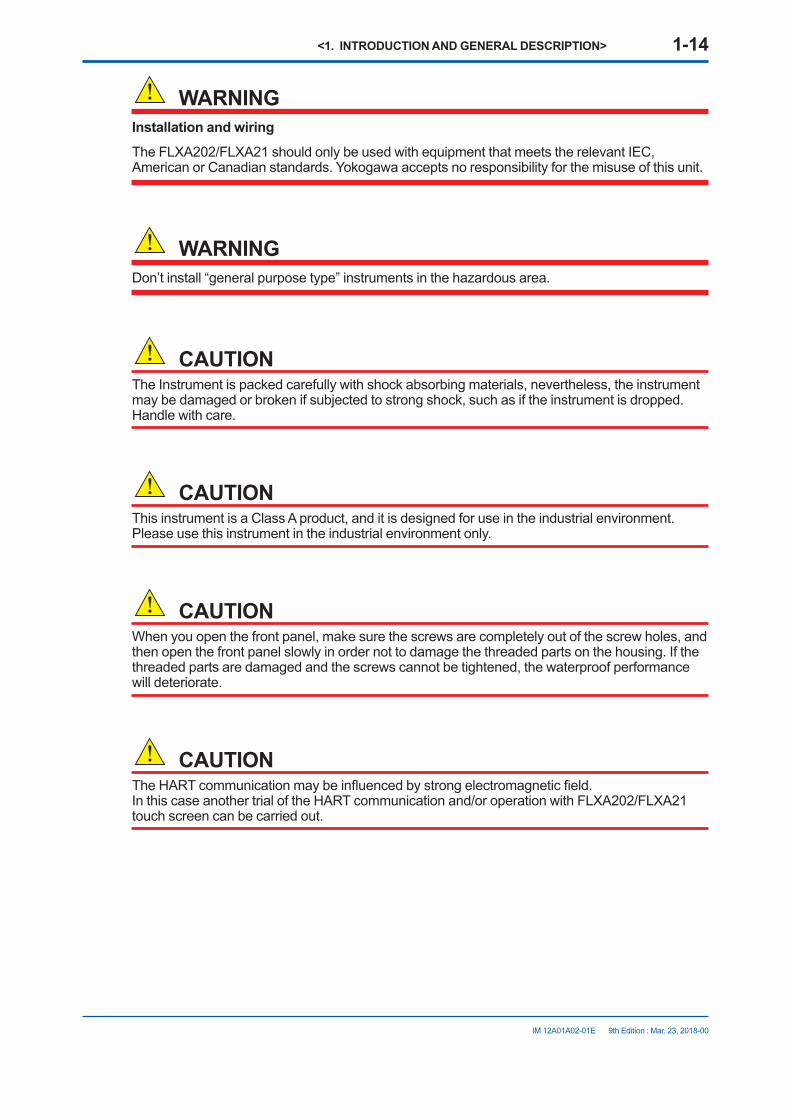
WARNINGInstallation and wiringThe FLXA202/FLXA21 should only be used with equipment that meets the relevant IEC, American or Canadian standards. Yokogawa accepts no responsibility for the misuse of this unit.
WARNINGDon’t install “general purpose type” instruments in the hazardous area.
CAUTIONThe Instrument is packed carefully with shock absorbing materials, nevertheless, the instrument may be damaged or broken if subjected to strong shock, such as if the instrument is dropped. Handlewithcare.
CAUTIONThis instrument is a Class A product, and it is designed for use in the industrial environment. Please use this instrument in the industrial environment only.
CAUTIONWhen you open the front panel, make sure the screws are completely out of the screw holes, and then open the front panel slowly in order not to damage the threaded parts on the housing. If the threaded parts are damaged and the screws cannot be tightened, the waterproof performance will deteriorate.
CAUTIONTheHARTcommunicationmaybeinfluencedbystrongelectromagneticfield. InthiscaseanothertrialoftheHARTcommunicationand/oroperationwithFLXA202/FLXA21touch screen can be carried out.
<1. INTRODUCTION AND GENERAL DESCRIPTION> 1-15
IM 12A01A02-01E 9th Edition : Mar. 23, 2018-00
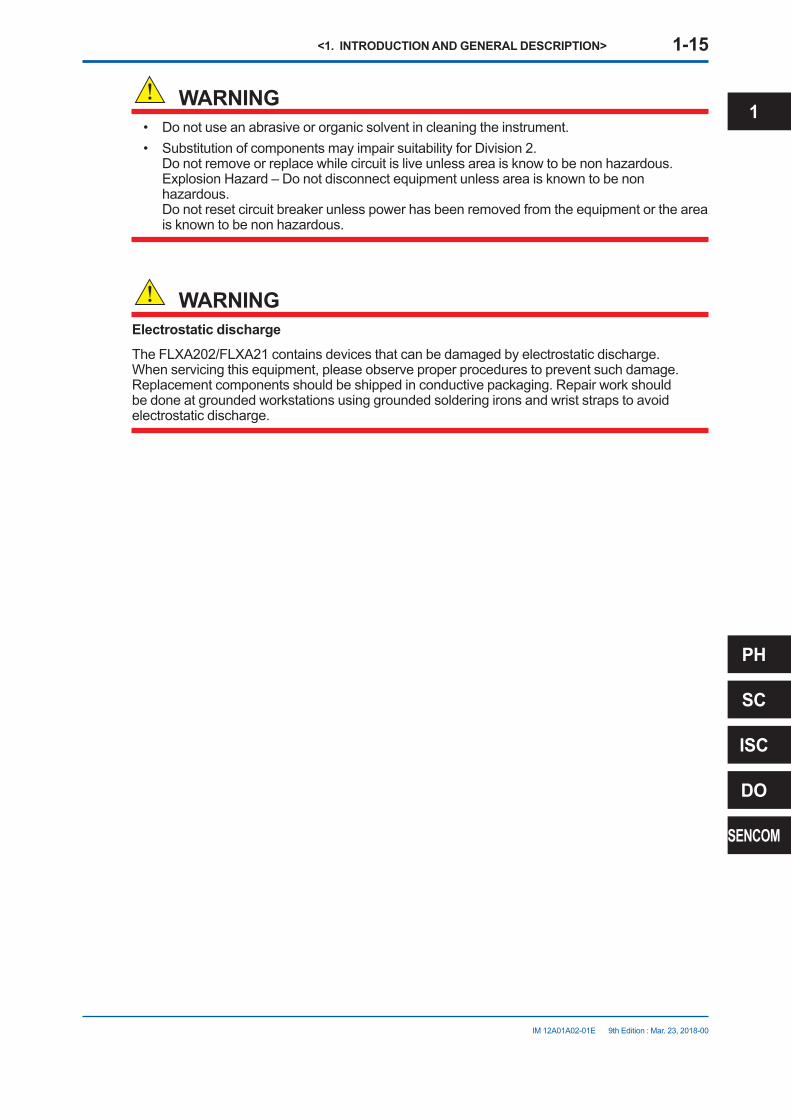
WARNING• Do not use an abrasive or organic solvent in cleaning the instrument.• Substitution of components may impair suitability for Division 2.
Do not remove or replace while circuit is live unless area is know to be non hazardous. ExplosionHazard–Donotdisconnectequipmentunlessareaisknowntobenonhazardous. Do not reset circuit breaker unless power has been removed from the equipment or the area is known to be non hazardous.
WARNINGElectrostatic dischargeThe FLXA202/FLXA21 contains devices that can be damaged by electrostatic discharge. When servicing this equipment, please observe proper procedures to prevent such damage. Replacement components should be shipped in conductive packaging. Repair work should be done at grounded workstations using grounded soldering irons and wrist straps to avoid electrostatic discharge.
1
PH
SC
ISC
DO
SENCOM

<1. INTRODUCTION AND GENERAL DESCRIPTION> 1-16
IM 12A01A02-01E 9th Edition : Mar. 23, 2018-00
1.5 Model & Suffix Codesl FLXA202
Model Suffix code Option code DescriptionFLXA202 ······················································· ··············· 2-Wire Analyzer
Power supply -D ··············· Always -DHousing(Note 12)
-B-C-D
·············································
Aluminum alloy cast + urethane coatingAluminum alloy cast + epoxy coatingAluminum alloy cast + high anti-corrosion coating
Display (Note 13) -D ··············· Anti-glare LCDType (Note 1) -AB
-AD-AG-AQ-AR-CB-CD-CF-CG-CH-CQ-CR-DB-DD-DE
·································································································································································································································
General purpose for CE, RCMGeneral purpose for CSAGeneral purpose for KCGeneral purpose for EAC with PAGeneral purpose for EACISforATEX,IECEx(Note14)IS for FM, CSA (Note 2)IS for TIIS (Note 15)ISforKOSHA(Note3)IS for NEPSIIS for EAC with PAIS for EAC Type n for ATEX, IECExNI for FM, CSAType n for CSA
1st input -P1-C1-C5-D1-S1
···········································································
pH/ORP(Note4)Conductivity (SC)Inductive conductivity (ISC)Dissolved oxygen (DO)pH/ORP(SENCOMsensor)(Note5)
2nd input (Note 6) -NN-P1-C1-D1
····························································
Without inputpH/ORP(Note4)Conductivity (SC)Dissolved oxygen (DO)
Output -A ··············· 4-20mA+HART— -N ··············· Always -N
Language set (Note 7) -LA ··············· English and 11 languagesCountry (Note 8) -N
-J······························
Global except JapanJapan
— -NN ··············· Always -NNOption Mounting hardware
Hood
Tag plateConduit adapter (Note 10)
Measurement law
/UM/U/PM/H6/H7/H8/SCT/CB4/CD4/CF4/CB5/CD5/CF5/K
Universal mounting kit (Note 9)Pipe and wall mounting hardwarePanel mounting hardwareHood,stainlesssteelHood,stainlesssteel+urethanecoatingHood,stainlesssteel+epoxycoatingStainless steel tag plateG1/2 x 3 pcs1/2NPT x 3 pcsM20 x 1.5 x 3 pcsG1/2 x 3 pcs for Type n1/2NPT x 3 pcs for Type nM20 x 1.5 x 3 pcs for Type nWithMeasurementLawcertificate(Note11)
Notes:1: Type “-C * ” is intrinsic safety (IS), Type “-DB” is type n of ATEX and IECEx, Type “-DD” is nonincendive (NI) of FM and CSA Type
“-DE” is type n of CSA.2: Type “-CD ” is intrinsic safety, but is available as nonincendive.3: Korean IM is attached to FLXA202 instead of English IM.4: ThisinputistobecomefromananalogpH/ORPsensor.
<1. INTRODUCTION AND GENERAL DESCRIPTION> 1-17
IM 12A01A02-01E 9th Edition : Mar. 23, 2018-00
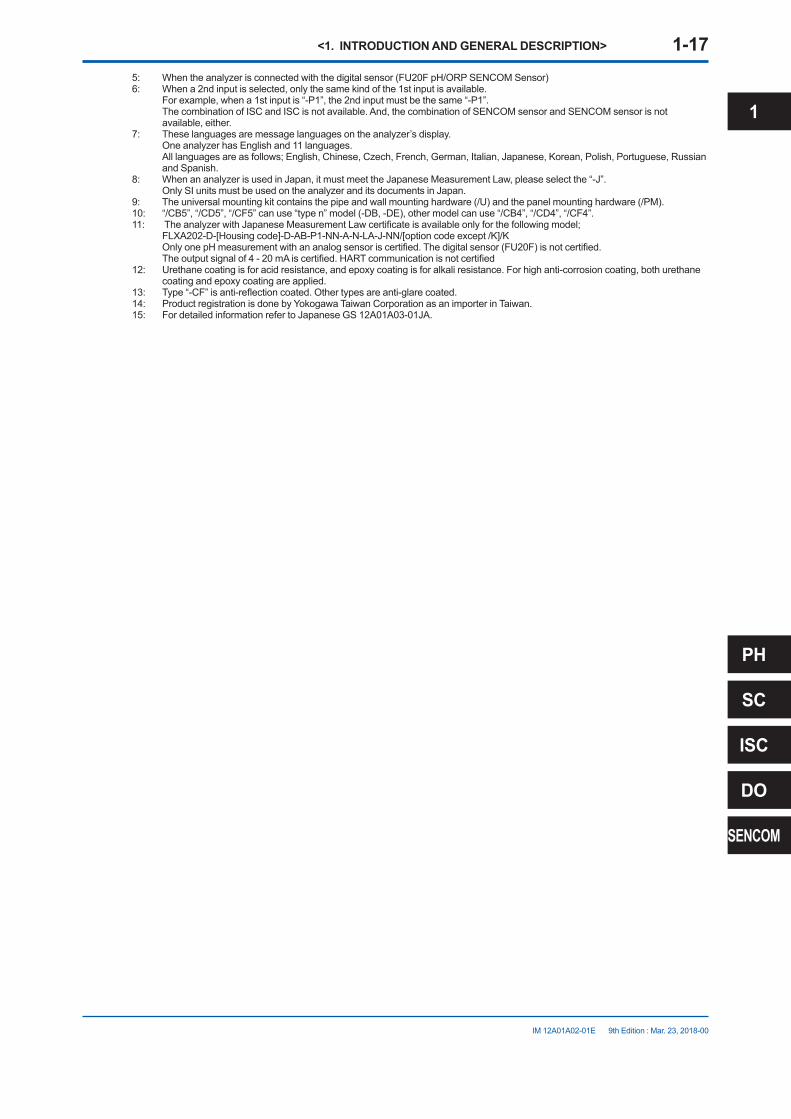
5: Whentheanalyzerisconnectedwiththedigitalsensor(FU20FpH/ORPSENCOMSensor)6: When a 2nd input is selected, only the same kind of the 1st input is available. For example, when a 1st input is “-P1”, the 2nd input must be the same “-P1”. The combination of ISC and ISC is not available. And, the combination of SENCOM sensor and SENCOM sensor is not
available, either.7: These languages are message languages on the analyzer’s display. One analyzer has English and 11 languages. Alllanguagesareasfollows;English,Chinese,Czech,French,German,Italian,Japanese,Korean,Polish,Portuguese,Russian
and Spanish.8: When an analyzer is used in Japan, it must meet the Japanese Measurement Law, please select the “-J”. Only SI units must be used on the analyzer and its documents in Japan.9: The universal mounting kit contains the pipe and wall mounting hardware (/U) and the panel mounting hardware (/PM).10: “/CB5”,“/CD5”,“/CF5”canuse“typen”model(-DB,-DE),othermodelcanuse“/CB4”,“/CD4”,“/CF4”.11: TheanalyzerwithJapaneseMeasurementLawcertificateisavailableonlyforthefollowingmodel; FLXA202-D-[Housingcode]-D-AB-P1-NN-A-N-LA-J-NN/[optioncodeexcept/K]/K OnlyonepHmeasurementwithananalogsensoriscertified.Thedigitalsensor(FU20F)isnotcertified. Theoutputsignalof4-20mAiscertified.HARTcommunicationisnotcertified12: Urethane coating is for acid resistance, and epoxy coating is for alkali resistance. For high anti-corrosion coating, both urethane
coating and epoxy coating are applied.13: Type“-CF”isanti-reflectioncoated.Othertypesareanti-glarecoated.14: ProductregistrationisdonebyYokogawaTaiwanCorporationasanimporterinTaiwan.15: For detailed information refer to Japanese GS 12A01A03-01JA.
1
PH
SC
ISC
DO
SENCOM

<1. INTRODUCTION AND GENERAL DESCRIPTION> 1-18
IM 12A01A02-01E 9th Edition : Mar. 23, 2018-00
l FLXA21
Model Suffix code Option code DescriptionFLXA21 ······················································· ··············· 2-Wire Analyzer
Power supply -D ··············· Always -DHousing -P ··············· PlasticDisplay -D ··············· Anti-glare LCDType -AB
-AD-AG-AQ-AR-CB-CD-CH-EG-EQ-ER-DD
····················································································································································································
General purpose for CE, RCMGeneral purpose for CSAGeneral purpose for KCGeneral purpose for EAC with PA (Note 11)General purpose for EAC (Note 12)IS for ATEX, IEC Ex (Note 9)IS for FM, CSA (Note 5)IS for NEPSI (Note 15)ISforKOSHA (Note 10)IS for EACEx with PA (Note 13)ISforEACEx(Note14)NI for FM, CSA (Note 16)
1st input -P1-C1-C5-D1-S1
···········································································
pH/ORP(Note6)Conductivity (SC)Inductive conductivity (ISC)Dissolved oxygen (DO)pH/ORP(SENCOMsensor)(Note7)
2nd input (Note 1) -NN-P1-C1-D1
····························································
Without inputpH/ORP(Note6)Conductivity (SC)Dissolved oxygen (DO)
Output (Note 8) -A ··············· 4-20mA+HART— -N ··············· Always -NLanguage set (Note 2) -LA ··············· English and 11 languagesCountry (Note 3) -N
-J······························
Global except JapanJapan
— -NN ··············· Always -NNOption Mounting hardware
Hood
Tag plateConduit adapter
/UM/U/PM/H6/H7/H8/SCT/CB4/CD4/CF4
Universalmountingkit(Note4)Pipe and wall mounting hardwarePanel mounting hardwareHood,stainlesssteelHood,stainlesssteel+urethanecoatingHood,stainlesssteel+epoxycoatingStainless steel tag plateConduitadapter(G1/2x4pcs)Conduitadapter(1/2NPTx4pcs)Conduitadapter(M20x1.5x4pcs)
Notes:1: When a 2nd input is selected, only the same kind of the 1st input is available. For example, when a 1st input is “-P1”, the 2nd input must be the same “-P1”. The combination of ISC and ISC is not available. And, the combination of SENCOM sensor and SENCOM sensor is not
available, either.2: These languages are message languages on the analyzer’s display. One analyzer has English and 11 languages. Alllanguagesareasfollows;English,Chinese,Czech,French,German,Italian,Japanese,Korean,Polish, Portuguese, Russian
and Spanish.3: When an analyzer is used in Japan, it must meet the Japanese Measurement Law. Only SI units must be used on the analyzer and its documents in Japan.4: Theuniversalmountingkitcontainsthepipeandwallmountinghardware(/U)andthepanelmountinghardware(/PM).5: Thetype“-CD”isintrinsicsafetyofFMandCSA,andnon-incendiveofFMandCSA.TemperatureclassesareT4.6: ThisinputistobecomefromananalogpH/ORPsensor.7: Whentheanalyzerisconnectedwiththedigitalsensor,FU20FpH/ORPSENCOMSensor,onlythefollowingmodelisavailable; 2nd input: Without input (-NN)8: TheFLXA21hasotheroutputtypesof“FOUNDATIONFieldbus”communication(suffixcode:-F)and“PROFIBUSPA”
communication(suffixcode:-P).RefertoIM12A01A02-71EandIM12A01A02-72E.9: Thetype“-CB”intrinsicsafetytypeofATEXandIECExcanbeusedwithSENCOMsensor.TemperatureclassisT4. Product registration is done by Yokogawa Taiwan Corporation as an importer in Taiwan.10: Thetype“-EG”intrinsicsafetytypeofKOSHAforKorea.TemperatureclassisT4.

<1. INTRODUCTION AND GENERAL DESCRIPTION> 1-19
IM 12A01A02-01E 9th Edition : Mar. 23, 2018-00
11: The type “-AQ” is General purpose type of EAC with Pattern Approval for Russia.12: The type “-AR” is General purpose type of EAC for Kazakhstan and Belarus.13: Thetype“-EQ”intrinsicsafetytypeofEACwithPatternApprovalforRussia.TemperatureclassisT4.14: Thetype“-ER”intrinsicsafetytypeofEACforKazakhstanandBelarus.TemperatureclassisT4.15: Thetype“-CH”intrinsicsafetytypeforNEPSI.TemperatureclassisT4.16: Thetype“-DD”nonincendivetypeforFM.TemperatureclassisT4.
1
PH
SC
ISC
DO
SENCOM

Blank Page

<2. WIRING AND INSTALLATION> 2-1
IM 12A01A02-01E 9th Edition : Mar. 23, 2018-00
2. WIRING AND INSTALLATIONInstall the cable glands into the FLXA202/FLXA21 before installing it (see section 2.3.) Upon delivery, the cable glands are not installed.
*2
*4
*5
*6
*6
n n n n n n n n n
n n n n n n n n n
+–
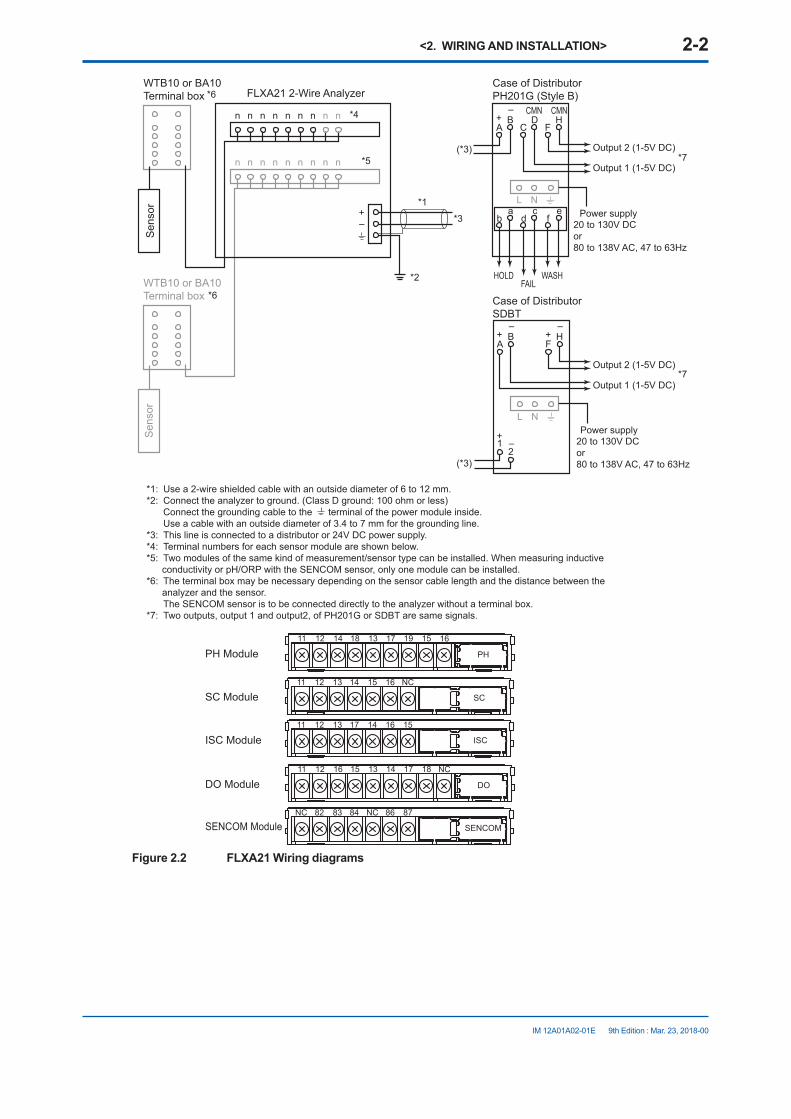
*1: Use a 2-wire shielded cable with an outside diameter of 6 to 12 mm.*2: Connect the analyzer to ground. (Class D ground: 100 ohm or less)*3: This line is connected to a distributor or 24V DC power supply.*4: Terminal numbers for each sensor module are shown below.*5: Two modules of the same kind of measurement/sensor type can be installed. When measuring inductive
conductivity or pH/ORP with the SENCOM sensor, only one module can be installed.*6: The terminal box may be necessary depending on the sensor cable length and the distance between the
analyzer and the sensor. The SENCOM sensor is to be connected directly to the analyzer without a terminal box.*7: Two outputs, output 1 and output2, of PH201G or SDBT are same signals.
*1
WTB10 or BA10Terminal box FLXA202 2-Wire Analyzer
Sen
sor
WTB10 or BA10Terminal box
Sen
sor
PH Module
SC Module
ISC Module
DO Module
SENCOM Module
161519171318141211
PH
NC1817141315161211
DO
15161417131211
ISC
NC161514131211
SC
8786NC848382NC
SENCOM
Power supply
Output 1 (1-5V DC)
20 to 130V DCor80 to 138V AC, 47 to 63Hz
Power supply20 to 130V DCor80 to 138V AC, 47 to 63Hz
HOLD WASHFAIL
Output 2 (1-5V DC)
Output 1 (1-5V DC)
Output 2 (1-5V DC)
Case of DistributorPH201G (Style B)
Case of DistributorSDBT
(*3)
*3
*7
*7
(*3)
A+
– CMN CMNB
CD
FH
L N
A+
–+
–B
1+
–2
FH
L N
ba
dc
fe
Figure 2.1 FLXA202 Wiring diagrams
PH
SC
ISC
DO
SENCOM
2
<2. WIRING AND INSTALLATION> 2-2
IM 12A01A02-01E 9th Edition : Mar. 23, 2018-00
*2
*4
*5
*6
*6
n n n n n n n n n
n n n n n n n n n
+–
*1: Use a 2-wire shielded cable with an outside diameter of 6 to 12 mm.*2: Connect the analyzer to ground. (Class D ground: 100 ohm or less) Connect the grounding cable to the terminal of the power module inside. Use a cable with an outside diameter of 3.4 to 7 mm for the grounding line.*3: This line is connected to a distributor or 24V DC power supply.*4: Terminal numbers for each sensor module are shown below.*5: Two modules of the same kind of measurement/sensor type can be installed. When measuring inductive
conductivity or pH/ORP with the SENCOM sensor, only one module can be installed.*6: The terminal box may be necessary depending on the sensor cable length and the distance between the
analyzer and the sensor. The SENCOM sensor is to be connected directly to the analyzer without a terminal box.*7: Two outputs, output 1 and output2, of PH201G or SDBT are same signals.
*1
WTB10 or BA10Terminal box FLXA21 2-Wire Analyzer
Sen
sor
WTB10 or BA10Terminal box
Sen
sor
PH Module
SC Module
ISC Module
DO Module
SENCOM Module
161519171318141211
PH
NC1817141315161211
DO
15161417131211
ISC
NC161514131211
SC
8786NC848382NC
SENCOM
Power supply
Output 1 (1-5V DC)
20 to 130V DCor80 to 138V AC, 47 to 63Hz
Power supply20 to 130V DCor80 to 138V AC, 47 to 63Hz
HOLD WASHFAIL
Output 2 (1-5V DC)
Output 1 (1-5V DC)
Output 2 (1-5V DC)
Case of DistributorPH201G (Style B)
Case of DistributorSDBT
(*3)
*3
*7
*7
(*3)
A+
– CMN CMNB
CD
FH
L N
A+
–+
–B
1+
–2
FH
L N
ba
dc
fe
Figure 2.2 FLXA21 Wiring diagrams
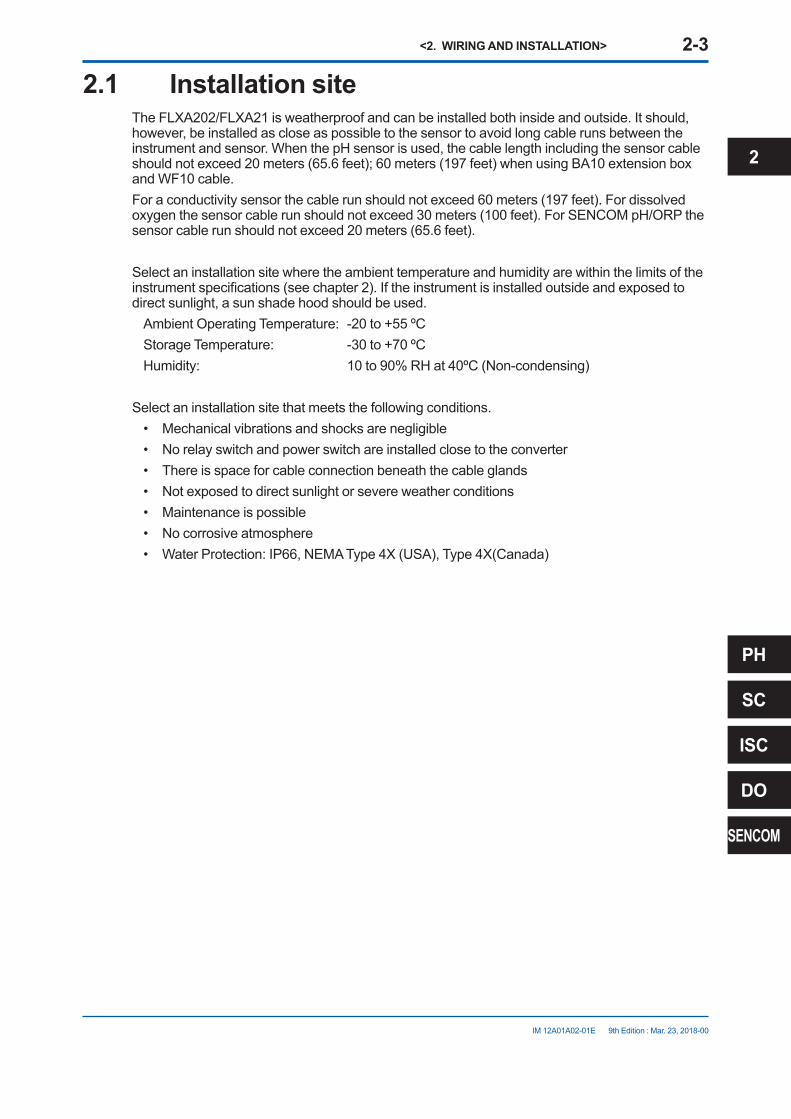
<2. WIRING AND INSTALLATION> 2-3
IM 12A01A02-01E 9th Edition : Mar. 23, 2018-00
2.1 Installation siteThe FLXA202/FLXA21 is weatherproof and can be installed both inside and outside. It should, however, be installed as close as possible to the sensor to avoid long cable runs between the instrumentandsensor.WhenthepHsensorisused,thecablelengthincludingthesensorcableshouldnotexceed20meters(65.6feet);60meters(197feet)whenusingBA10extensionboxand WF10 cable.For a conductivity sensor the cable run should not exceed 60 meters (197 feet). For dissolved oxygenthesensorcablerunshouldnotexceed30meters(100feet).ForSENCOMpH/ORPthesensor cable run should not exceed 20 meters (65.6 feet).
Select an installation site where the ambient temperature and humidity are within the limits of the instrumentspecifications(seechapter2).Iftheinstrumentisinstalledoutsideandexposedtodirect sunlight, a sun shade hood should be used.
Ambient Operating Temperature: -20 to +55 ºCStorage Temperature: -30 to +70 ºCHumidity: 10to90%RHat40ºC(Non-condensing)
Select an installation site that meets the following conditions.• Mechanical vibrations and shocks are negligible• No relay switch and power switch are installed close to the converter• There is space for cable connection beneath the cable glands• Not exposed to direct sunlight or severe weather conditions• Maintenance is possible• No corrosive atmosphere• WaterProtection:IP66,NEMAType4X(USA),Type4X(Canada)
PH
SC
ISC
DO
SENCOM
2

<2. WIRING AND INSTALLATION> 2-4
IM 12A01A02-01E 9th Edition : Mar. 23, 2018-00
2.2 Removing the wiring coverBefore installing this instrument, open the front panel and remove the wiring covers, and then install the cable glands.
NOTEWiring covers are required intrinsic safety and Type n (Type is -C*, -DB, -DE). In the case of other types, the cover is not attached to the FLXA202.
l FLXA202Remove wiring covers 1 and 2 by raising the circled area in Figure 2.3.
NOTEWiring covers are required intrinsic safety (Type is -C*). In the case of other types, the cover is not attached to the FLXA202.
Wiring cover 1Wiring cover 2(when using the second module)
Figure 2.3 FLXA202 Wiring cover
l FLXA21Removeallthewiringcovers.Theyarefixedattheplacesmarkedwith(circle)andΔ(triangle)inFigure2.4.Becarefulnottodamagethepawlswhenremovingthecovers.
NOTEBe careful not to lose the wiring cover screws.

<2. WIRING AND INSTALLATION> 2-5
IM 12A01A02-01E 9th Edition : Mar. 23, 2018-00
Wiring cover 1 (for the first module)
Wiring cover 2 (for the second module)
Wiring cover 3 (for the power supply and grounding)
Figure 2.4 FLXA21 Wiring cover
2.3 Installing the cable glands
WARNINGFor Type n model (-DB, -DE),
- When the accompanying cable glands are used, external clamping is required additionally.- When the optional conduit adaptors(/CB5, /CD5, /CF5) are used with accompanying cable
glands,clamping;e.g)sealingfittingisrequired.- If external clamping is not able to be prepared, Ex d, Ex e, or Ex n cable gland which
providessufficientclampingshallbeusedinsteadoftheaccompanyingcablegland.- Unused cable gland shall be sealed with the accompanying metal plug.
Thesuppliedcableglandsareforcableswithanoutsidediameterof6to12mm(0.24to0.47inches). Unused cable entry holes must be sealed with cable glands including the supplied close up plugs.
(A hole is drilled, if specified.)
FLXA21FLXA202
(For sensor 2 cable)For sensor 1 cableFor sensor 1 cable
(For sensor 2 cable)
For power supplyFor power supply
For grounding cable
Figure 2.5 Cable gland diagram
CAUTIONBe careful not to be injured by the sharp hole edges on the housing.
Install the supplied cable gland as shown in Figure 2.6. When using an adapter for conduit work, see Figure 2.7.
PH
SC
ISC
DO
SENCOM
2
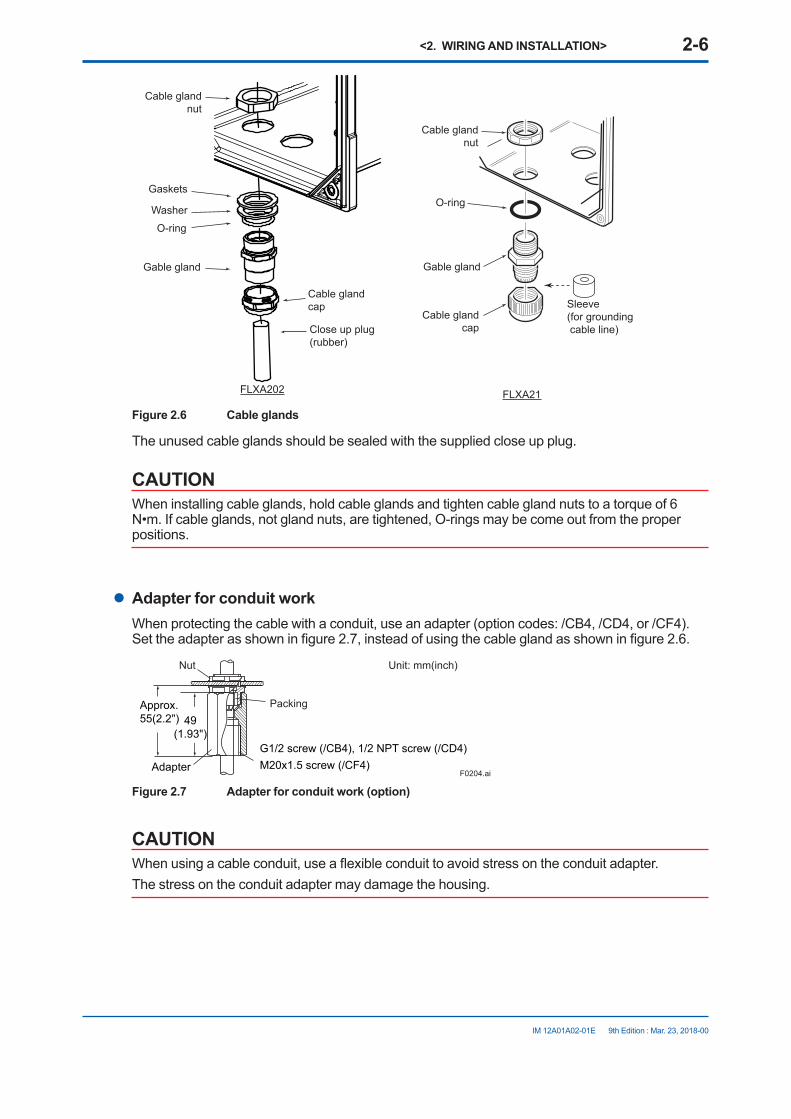
<2. WIRING AND INSTALLATION> 2-6
IM 12A01A02-01E 9th Edition : Mar. 23, 2018-00
FLXA21FLXA202
Cable gland nut
O-ring
Gable gland
O-ring
Gable gland
Sleeve(for grounding cable line)
Cable gland cap
Cable gland nut
Gaskets
Washer
Cable gland cap
Close up plug(rubber)
Figure 2.6 Cable glands
The unused cable glands should be sealed with the supplied close up plug.
CAUTIONWhen installing cable glands, hold cable glands and tighten cable gland nuts to a torque of 6 N•m. If cable glands, not gland nuts, are tightened, O-rings may be come out from the proper positions.
l Adapter for conduit workWhenprotectingthecablewithaconduit,useanadapter(optioncodes:/CB4,/CD4,or/CF4).Settheadapterasshowninfigure2.7,insteadofusingthecableglandasshowninfigure2.6.
Adapter
49(1.93")
G1/2 screw (/CB4), 1/2 NPT screw (/CD4)M20x1.5 screw (/CF4)
Approx.55(2.2")
Packing
Unit: mm(inch)Nut
F0204.ai
Figure 2.7 Adapter for conduit work (option)
CAUTIONWhenusingacableconduit,useaflexibleconduittoavoidstressontheconduitadapter.The stress on the conduit adapter may damage the housing.
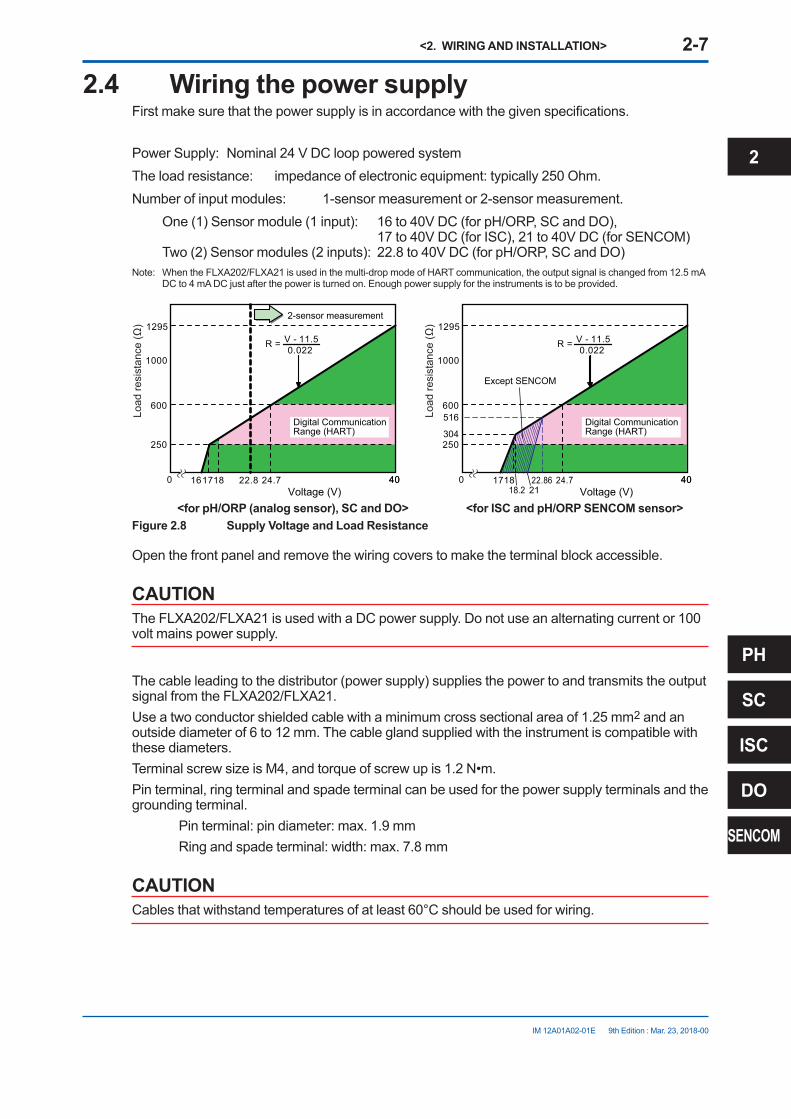
<2. WIRING AND INSTALLATION> 2-7
IM 12A01A02-01E 9th Edition : Mar. 23, 2018-00
2.4 Wiring the power supplyFirstmakesurethatthepowersupplyisinaccordancewiththegivenspecifications.
PowerSupply: Nominal24VDClooppoweredsystemThe load resistance: impedance of electronic equipment: typically 250 Ohm.Number of input modules: 1-sensor measurement or 2-sensor measurement. One(1)Sensormodule(1input): 16to40VDC(forpH/ORP,SCandDO), 17to40VDC(forISC),21to40VDC(forSENCOM) Two(2)Sensormodules(2inputs): 22.8to40VDC(forpH/ORP,SCandDO)Note: WhentheFLXA202/FLXA21isusedinthemulti-dropmodeofHARTcommunication,theoutputsignalischangedfrom12.5mA
DCto4mADCjustafterthepoweristurnedon.Enoughpowersupplyfortheinstrumentsistobeprovided.
250
600
1000
0 24.718
V - 11.50.022
R =
1295
1617 22.8 4040Voltage (V)
2-sensor measurement
Load
resi
stan
ce (Ω
)
Digital Communication Range (HART)
250304
600516
1000
0 24.718
V - 11.50.022
R =
1295
17 4022.86 40
Except SENCOM
Voltage (V)
Load
resi
stan
ce (Ω
)Digital Communication Range (HART)
18.2 21
<for pH/ORP (analog sensor), SC and DO> <for ISC and pH/ORP SENCOM sensor>Figure 2.8 Supply Voltage and Load Resistance
Open the front panel and remove the wiring covers to make the terminal block accessible.
CAUTIONThe FLXA202/FLXA21 is used with a DC power supply. Do not use an alternating current or 100 volt mains power supply.
The cable leading to the distributor (power supply) supplies the power to and transmits the output signal from the FLXA202/FLXA21.Use a two conductor shielded cable with a minimum cross sectional area of 1.25 mm2 and an outside diameter of 6 to 12 mm. The cable gland supplied with the instrument is compatible with these diameters.TerminalscrewsizeisM4,andtorqueofscrewupis1.2N•m.Pin terminal, ring terminal and spade terminal can be used for the power supply terminals and the grounding terminal. Pin terminal: pin diameter: max. 1.9 mm Ring and spade terminal: width: max. 7.8 mm
CAUTIONCables that withstand temperatures of at least 60°C should be used for wiring.
PH
SC
ISC
DO
SENCOM
2
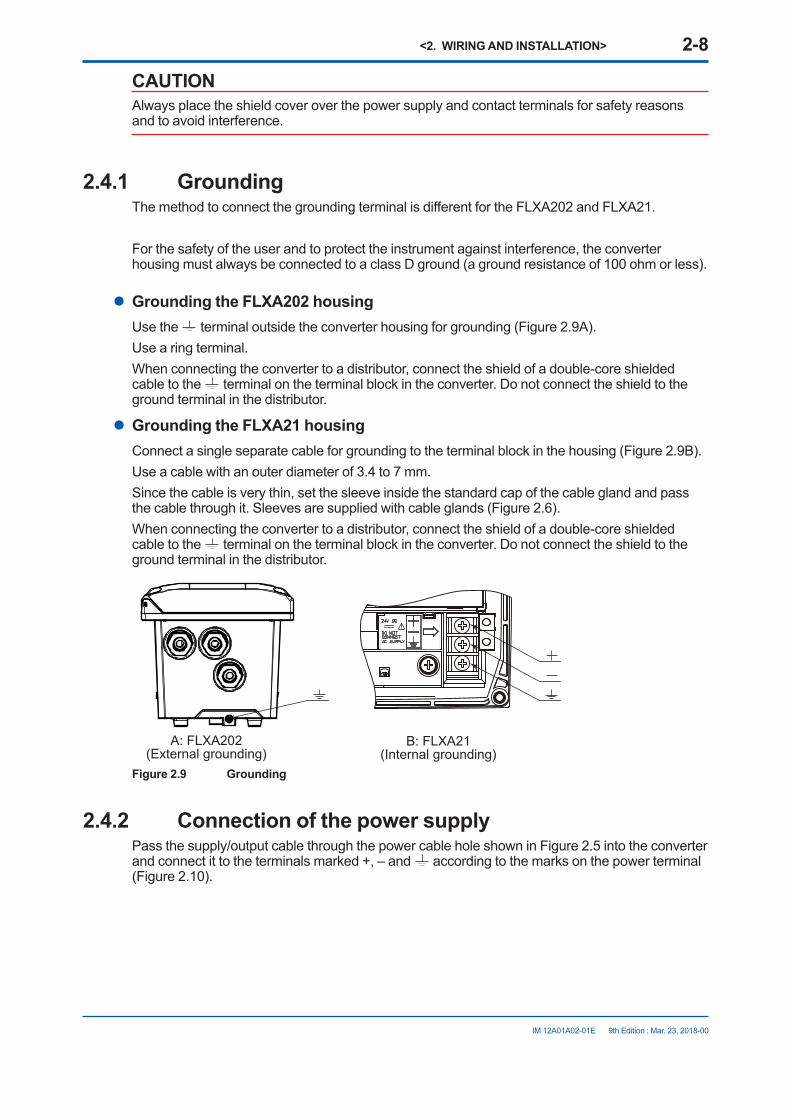
<2. WIRING AND INSTALLATION> 2-8
IM 12A01A02-01E 9th Edition : Mar. 23, 2018-00
CAUTIONAlways place the shield cover over the power supply and contact terminals for safety reasons and to avoid interference.
2.4.1 GroundingThemethodtoconnectthegroundingterminalisdifferentfortheFLXA202andFLXA21.
For the safety of the user and to protect the instrument against interference, the converter housing must always be connected to a class D ground (a ground resistance of 100 ohm or less).
l Grounding the FLXA202 housingUse the terminal outside the converter housing for grounding (Figure 2.9A).Use a ring terminal.When connecting the converter to a distributor, connect the shield of a double-core shielded cable to the terminal on the terminal block in the converter. Do not connect the shield to the ground terminal in the distributor.
l Grounding the FLXA21 housingConnect a single separate cable for grounding to the terminal block in the housing (Figure 2.9B).Useacablewithanouterdiameterof3.4to7mm.Since the cable is very thin, set the sleeve inside the standard cap of the cable gland and pass the cable through it. Sleeves are supplied with cable glands (Figure 2.6).When connecting the converter to a distributor, connect the shield of a double-core shielded cable to the terminal on the terminal block in the converter. Do not connect the shield to the ground terminal in the distributor.
B: FLXA21(Internal grounding)
A: FLXA202(External grounding)
Figure 2.9 Grounding
2.4.2 Connection of the power supplyPass the supply/output cable through the power cable hole shown in Figure 2.5 into the converter andconnectittotheterminalsmarked+,–and according to the marks on the power terminal (Figure 2.10).

<2. WIRING AND INSTALLATION> 2-9
IM 12A01A02-01E 9th Edition : Mar. 23, 2018-00
FLXA21FLXA202Figure 2.10 Power terminal
2.4.3 Wiring cover
NOTEWiring covers are required intrinsic safety and Type n (Type is -C*, -DB, -DE). In the case of other types, the cover is not attached to the FLXA202.
l FLXA202When grounding and power supply wiring are complete, double-check the wiring and the like, and attach wiring cover 1 (Figure 2.11).Whenattachingthewiringcover,aligntheprotrudingpartsmarkedwithsquaresinthefiguretothe grooves.Ifonlythefirstmoduleistobeused,wirethedetectortothefirstmodule.If the second module is to be used, wire the detector to the second module and attach wiring cover2beforewiringthefirstmodule.Then,wirethedetectortothefirstmodule.Detector wiring is indicated in section 2.5.
Wiring cover 1Housing
Wiring cover 2(when using the second module)
The first moduleThe second module
Figure 2.11 FLXA202 Wiring cover
NOTEWiring covers are required intrinsic safety (Type is -C*). In the case of other types, the cover is not attached to the FLXA202.
PH
SC
ISC
DO
SENCOM
2
<2. WIRING AND INSTALLATION> 2-10
IM 12A01A02-01E 9th Edition : Mar. 23, 2018-00
l FLXA21After grounding and connecting the power supply, check the wiring and then close the wiring cover3(Figure2.4).Whenclosingthecover,engagethepositionsmarkedwithinFigure2.4andfastenthecoverwiththescrewatthepositionmarkedwith∆.
CAUTIONThescrewintheareamarkedwith∆shouldbetightenedtoatorqueof0.35to0.45N•m.
If a second module is used, wire the sensor for the second module and attach the wiring cover (refertofigure2.12).Then,wirethesensorforthefirstmoduleandattachthewiringcover(refertofigure2.11).Thesensorwiringisshowninsection2.4.
NOTEBe careful not to lose the wiring cover screws.
2.5 Sensor wiringThe FLXA202/FLXA21 can be used with a wide range of commercially available sensor types, both from Yokogawa and other manufacturers.TerminalscrewsizeisM4,andtorqueofscrewupis1.2N•m.Pin terminal, ring terminal and spade terminal can be used. Pin terminal: pin diameter: max. 1.9 mm Ring and spade terminal: width: max. 7.8 mmFor details on the sensors, refer to the respective instruction manuals of the sensors.
NOTEWhen input 2 is used, the upper-level module is for input 1. Be careful not to make a mistake when wiring the modules.
l FLXA202When wiring covers are available:
Attach wiring cover 1. If the second input is available, wire the second module in the lower level, and attach wiring cover 2.
Finally,wirethefirstmodule. Ifthesecondinputisnotavailable,attachwiringcover1,andthenwirethefirstinput. Note that if the second input is not available, wiring cover 2 is not included.
When wiring covers are not available: Ifthesecondinputisavailable,wirethesecondmoduleinthelowerlevelfirst. Then,wirethefirstmodule. Ifthesecondinputisnotavailable,wireonlythefirstinput.

<2. WIRING AND INSTALLATION> 2-11
IM 12A01A02-01E 9th Edition : Mar. 23, 2018-00
NOTEWiring covers are required intrinsic safety (Type is -C*). In the case of other types, the cover is not attached to the FLXA202.
When all the detector wiring is complete, close the FLXA202 front cover, and turn the power on. Check that the screen displays normally.
CAUTIONDo not tighten up four front panel screws one by one.Eachfrontpanelscrewshouldbetightenedupintwotimesofscrewing.And,firstlythescrewatthe upper left should be screwed a bit, the next is at the lower right, third is at the upper right, and fourth is at the lower left. The second round is the same sequence again to tighten up four screws.Do not use an electric screwdriver with high revolutions. If an electric screwdriver is used for thesefrontpanelscrews,therevolutionsoftheelectricscrewdrivershouldbelessthan400rpm.Fourscrewsshouldbetightenedtothefollowingtorque;0.8to0.9N•m
l FLXA21Wheninput2isused,firstwireinput2whichisonthelowersecondmodule,andattachthewiring cover.Evenwheninput2isnotused,firstattachthepowersupply/groundingwiringcoverandthenthewiringcoverforthesecondmodule,andfinallywireinput1.
NOTEWhenthewiringofsensorsisfinished,besuretoattachthewiringcovers.Furthermore,makesure the module is locked with the mechanisms on the left and right of the module.
CAUTIONConfirmthatalllocking-tabs(includingforBLANKslots)arein“Lock”positionbeforeyouclosethe front panel. If the locking-tabs are in “Unlock” position, the front panel may be interfered with locking-tabs.
Lock Unlock
Figure 2.12 Locking the module
When all sensor wiring is completed, close the front panel of the FLXA21, and turn on the power. Make sure that the display is normal.
PH
SC
ISC
DO
SENCOM
2
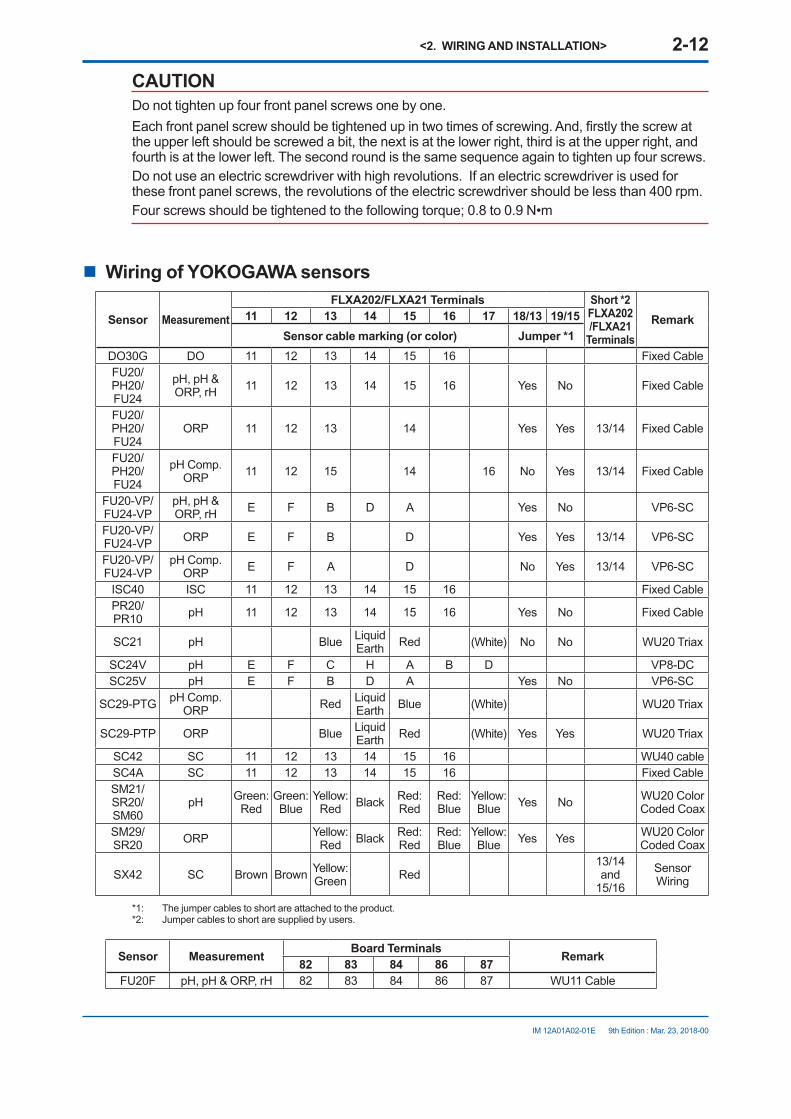
<2. WIRING AND INSTALLATION> 2-12
IM 12A01A02-01E 9th Edition : Mar. 23, 2018-00
CAUTIONDo not tighten up four front panel screws one by one.Eachfrontpanelscrewshouldbetightenedupintwotimesofscrewing.And,firstlythescrewatthe upper left should be screwed a bit, the next is at the lower right, third is at the upper right, and fourth is at the lower left. The second round is the same sequence again to tighten up four screws.Do not use an electric screwdriver with high revolutions. If an electric screwdriver is used for thesefrontpanelscrews,therevolutionsoftheelectricscrewdrivershouldbelessthan400rpm.Fourscrewsshouldbetightenedtothefollowingtorque;0.8to0.9N•m
n Wiring of YOKOGAWA sensors
Sensor MeasurementFLXA202/FLXA21 Terminals Short *2
FLXA202 /FLXA21
TerminalsRemark11 12 13 14 15 16 17 18/13 19/15
Sensor cable marking (or color) Jumper *1DO30G DO 11 12 13 14 15 16 Fixed CableFU20/PH20/FU24
pH,pH&ORP,rH 11 12 13 14 15 16 Yes No Fixed Cable
FU20/PH20/FU24
ORP 11 12 13 14 Yes Yes 13/14 Fixed Cable
FU20/PH20/FU24
pHComp.ORP 11 12 15 14 16 No Yes 13/14 Fixed Cable
FU20-VP/FU24-VP
pH,pH&ORP,rH E F B D A Yes No VP6-SC
FU20-VP/FU24-VP ORP E F B D Yes Yes 13/14 VP6-SC
FU20-VP/FU24-VP
pHComp.ORP E F A D No Yes 13/14 VP6-SC
ISC40 ISC 11 12 13 14 15 16 Fixed CablePR20/PR10 pH 11 12 13 14 15 16 Yes No Fixed Cable
SC21 pH Blue Liquid Earth Red (White) No No WU20 Triax
SC24V pH E F C H A B D VP8-DCSC25V pH E F B D A Yes No VP6-SC
SC29-PTG pHComp.ORP Red Liquid
Earth Blue (White) WU20 Triax
SC29-PTP ORP Blue Liquid Earth Red (White) Yes Yes WU20 Triax
SC42 SC 11 12 13 14 15 16 WU40cableSC4A SC 11 12 13 14 15 16 Fixed CableSM21/SR20/SM60
pH Green: Red
Green: Blue
Yellow: Red Black Red:
RedRed: Blue
Yellow: Blue Yes No WU20 Color
Coded Coax
SM29/SR20 ORP Yellow:
Red Black Red: Red
Red: Blue
Yellow: Blue Yes Yes WU20 Color
Coded Coax
SX42 SC Brown Brown Yellow: Green Red
13/14and
15/16Sensor Wiring
*1: The jumper cables to short are attached to the product.*2: Jumper cables to short are supplied by users.
Sensor Measurement Board Terminals Remark82 83 84 86 87FU20F pH,pH&ORP,rH 82 83 84 86 87 WU11 Cable

<2. WIRING AND INSTALLATION> 2-13
IM 12A01A02-01E 9th Edition : Mar. 23, 2018-00
n Wiring of HAMILTON sensors
Sensor Measure-ment
FLXA202/FLXA21 Terminals Short *2FLXA202 /FLXA21
TerminalsRemark11 12 13 14 15 16 17 18 18/13 19/15
Sensor cable marking (or color) Jumper *1
CHEMTRODE pH Blue Red (White) Yes No 13/14 WU20D Cable
CHEMTRODE-ORP ORP Yes Yes 13/14
CHEMTRODE-VP pH E F B A Yes No 13/14 VP6-SC
CLARITRODE pH Blue Red (White) Yes No 13/14 WU20D Cable
CLARITRODE-VP pH E F B A Yes No VP6-SC
CONDCUELL SC White/Grey Blue Green Pink Brown Yellow Fixed
CableCONDCUELL-
VP SC Blue Yellow Black Black Shield Grey Grey
ShieldHamiltonVPCable
EASYFERM pH Blue Red (White) Yes No 13/14 WU20D Cable
EASYFERM-VP pH E F B A Yes No 13/14 VP6-SC
INCHTRODE pH E F B D A Yes No VP6-SC
MECOTRODE pH Blue Red (White) Yes No 13/14 WU20D Cable
MECOTRODE-VP pH E F B A Yes No VP8-DC
OXYFERM-VP/
OXYGOLDDO White Green Green/
Yellow Black Red HamiltonVPCable
OXYSENS DO Yellow Blue Black Clear Brown Fixed Cable
pHEASY pH E F B D A B Yes No
POLILYTE pH Blue Red (White) Yes No WU20D Cable
POLILYTE-VP pH White Green Red Blue Black/
Clear Yes No HamiltonVPCable
POLILYTE PLUS-VP pH White Green Red Blue Black/
Clear Yes No HamiltonVPCable
*1: The jumper cables to short are attached to the product.*2: Jumper cables to short are supplied by users.
ColorcodingofVariopincablesCable PIN A B C D E F G H
Hamilton VP6-SC Black/Clear Red Grey Blue White Green
Hamilton VP8-DC Black/Clear
Black Shield
Red/Clear
Red Shield White Green Yellow Brown
WU20-V-S VP6-SC Clear Brown Black Yellow Red Blue
WU20-V-D VP8-DC Brown Core
Brown Shield
White Cored
White Shield Red Blue Yellow
PH
SC
ISC
DO
SENCOM
2
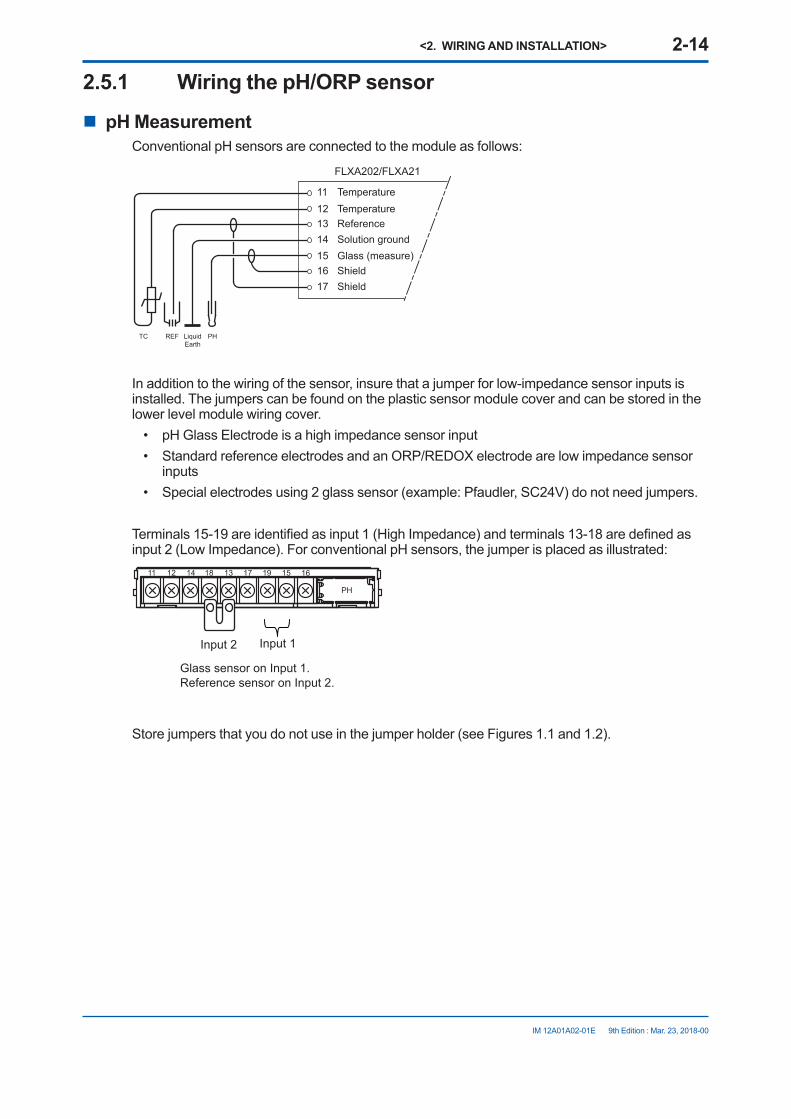
<2. WIRING AND INSTALLATION> 2-14
IM 12A01A02-01E 9th Edition : Mar. 23, 2018-00
2.5.1 Wiring the pH/ORP sensor
n pH MeasurementConventionalpHsensorsareconnectedtothemoduleasfollows:
11 Temperature12 Temperature13 Reference14 Solution ground15 Glass (measure)16 Shield17 Shield
FLXA202/FLXA21
REFTC PHLiquidEarth
In addition to the wiring of the sensor, insure that a jumper for low-impedance sensor inputs is installed. The jumpers can be found on the plastic sensor module cover and can be stored in the lower level module wiring cover.• pHGlassElectrodeisahighimpedancesensorinput• Standard reference electrodes and an ORP/REDOX electrode are low impedance sensor
inputs• Specialelectrodesusing2glasssensor(example:Pfaudler,SC24V)donotneedjumpers.
Terminals15-19areidentifiedasinput1(HighImpedance)andterminals13-18aredefinedasinput2(LowImpedance).ForconventionalpHsensors,thejumperisplacedasillustrated:
161519171318141211
PH
Input 1Input 2
Glass sensor on Input 1.Reference sensor on Input 2.
Store jumpers that you do not use in the jumper holder (see Figures 1.1 and 1.2).

<2. WIRING AND INSTALLATION> 2-15
IM 12A01A02-01E 9th Edition : Mar. 23, 2018-00
n ORP MeasurementTheORPmeasurementusesthesamesensorinputmoduleasthepHmeasurement.ItisnotuncommontomeasureORPasprocessvariableandapHGlasselectrodeasreference.ThisisthecasewithrHmeasurementandwithpHcompensatedORPmeasurement.
Conventional ORP sensors are connected to the module as follows:
11 Temperature
12 Temperature
13 Reference
14 Solution ground
15 Metal (measure)
16 Shield
17 Shield
FLXA202/FLXA21
REFTC LiquidEarth
ORP
For conventional ORP sensors, the jumpers are placed as illustrated:161519171318141211
PH
Input 1Input 2
Metal sensor on Input 1.Normal reference on Input 2.
pHCompensatedORPsensorsareconnectedtothemoduleasfollows:
11 Temperature
12 Temperature
13 Glass
14 Solution ground
15 Metal
16 Shield
17 Shield
FLXA202/FLXA21
PHTC ORPLiquidEarth
ForpHCompensatedORPsensors,thejumperisplacedasillustrated:161519171318141211
PH
Input 1Input 2
Metal sensor on Input 1.pH glass (as reference) on Input 2.
PH
SC
ISC
DO
SENCOM
2
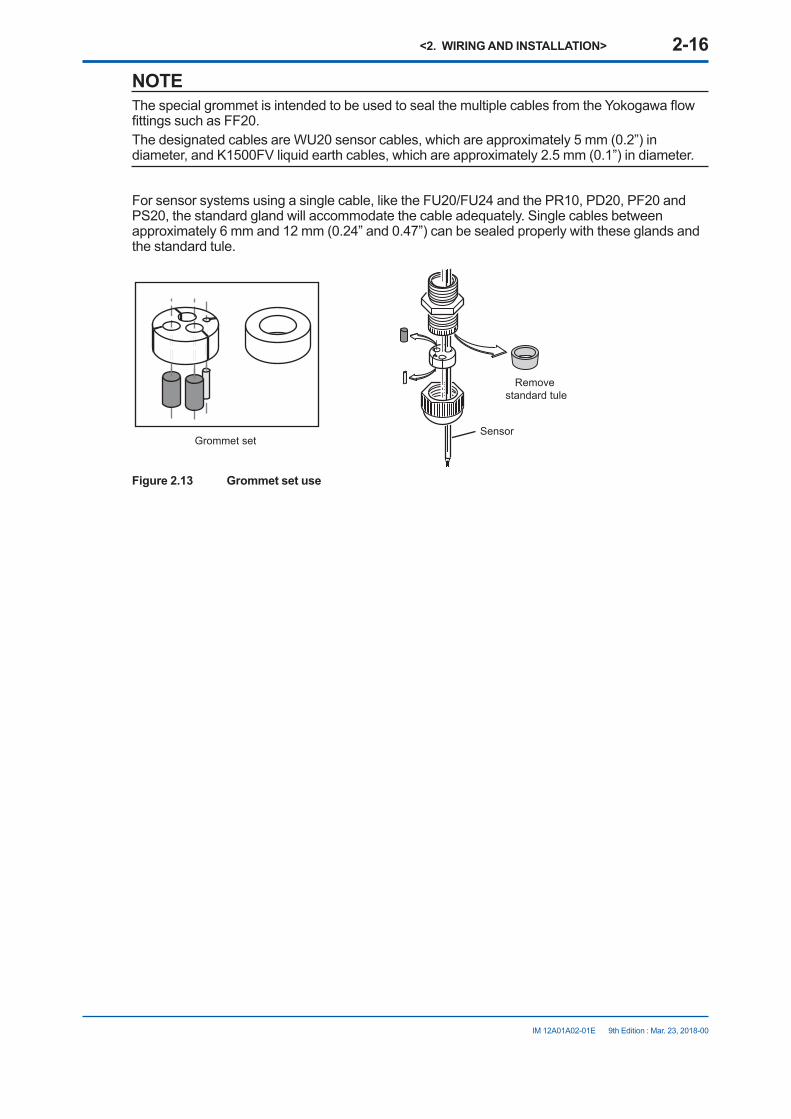
<2. WIRING AND INSTALLATION> 2-16
IM 12A01A02-01E 9th Edition : Mar. 23, 2018-00
NOTEThespecialgrommetisintendedtobeusedtosealthemultiplecablesfromtheYokogawaflowfittingssuchasFF20.The designated cables are WU20 sensor cables, which are approximately 5 mm (0.2”) in diameter,andK1500FVliquidearthcables,whichareapproximately2.5mm(0.1”)indiameter.
Forsensorsystemsusingasinglecable,liketheFU20/FU24andthePR10,PD20,PF20andPS20, the standard gland will accommodate the cable adequately. Single cables between approximately6mmand12mm(0.24”and0.47”)canbesealedproperlywiththeseglandsandthe standard tule.
Remove standard tule
SensorGrommet set
Figure 2.13 Grommet set use

<2. WIRING AND INSTALLATION> 2-17
IM 12A01A02-01E 9th Edition : Mar. 23, 2018-00
2.5.2 Wiring the conductivity (SC) sensorContacting Conductivity, SC, sensors are connected to the module as follows:
11 +
-
V-
i-
Temp
V+
i+
12
13
14
15
16
FLXA202/FLXA21
Theabovediagramshowswiringfor4-electrodeconductivitysensors,suchasSC42-SP34largeboreseries.For2-electrodeconductivitysensors,suchasSC42-SP36smallboreseries,jumpersmustbeinstalledbetweenterminals13-14andbetweenterminals15-16,asshowninthe diagram below.
11 +
-
V-
i-
Temp
V+
i+
12
13
14
15
16
FLXA202/FLXA21
2.5.3 Wiring the inductive conductivity (ISC) sensorISC40sensorsareconnectedtothemoduleasfollows:
11 +
-
Temp
Receive coil
Drive coil
12
13
17
15
16
14
shield
Sensor shield(internal)
shield
FLXA202/FLXA21
The sensors are supplied with integral cables and each individual wire is marked with the corresponding terminal numbers.
PH
SC
ISC
DO
SENCOM
2

<2. WIRING AND INSTALLATION> 2-18
IM 12A01A02-01E 9th Edition : Mar. 23, 2018-00
2.5.4 Wiring the dissolved oxygen (DO) sensorTheinputmoduleforDOmeasurementissuitablefordifferenttypesofDOsensors:
i. Galvanic sensors like model DO30Gii. PolarographicsensorslikeHAMILTON’SOxyfermandOxygold
The connection is as follows:
11 TC +TC -
+ anode galvanic- cathode galvanic+ anode polarographicshield- cathode polarographic
12
16
13181417
15
FLXA202/FLXA21
The DO30G sensor comes with integral cable and the wires are labeled with the corresponding terminal numbers.
2.5.5 Wiring the SENCOM pH/ORP sensorFU20F sensors are connected to the module as follows:
Shield 82
Input M9 Connector
4
1
2
5
6
Data+ 83
Data- 84
Supply Gnd 86
Supply 87
Connect the WU11 SENCOM cable terminal to the SENCOM module.Since the WU11 cable is thin, attach the included grommet in place of the cable gland standard packing before wiring.
Remove the standard packing.
Detector
Grommet
Figure 2.14

<2. WIRING AND INSTALLATION> 2-19
IM 12A01A02-01E 9th Edition : Mar. 23, 2018-00
2.6 Mounting methodsSee Figure 2.15. The FLXA202/FLXA21 has various mounting possibilities.
• Panel mounting using optional mounting hardware (/PM or /UM)• Wall mounting using optional mounting hardware (/U or /UM)• Pipe mounting using optional mounting hardware (/U or /UM) on a horizontal or vertical
pipes (Nominal size: 50A)The universal mounting kit (/UM) contains the pipe and wall mounting hardware (/U) and the panel mounting hardware (/PM). Some can be left unused.
195
0+1138
0+113
8
185
Unit: mmPanel mounting
Wall mounting
Pipe mounting
Note: The attached hardware is the same as that for the pipe mounting.
Only the bracket is used for the wall mounting.
Note: The wall on which the analyzer is mounted should be strong enough to bear the weight of more than 8kg.
Note: Horizontal pipe mounting is possible by turning the bracket 90 degrees.
M8 bolt (not supplied)Prepare bolts of the same length as the mounting hole.
Note: For a sun shade hood (option), use the upper two bracket mounting screws to fix it.
Bracket
Wall mounting holes (x3)
Wall
Bracket mounting screws*
Bracket mounting screws*
Fixing screws (x2)
Panel
Spacing panel cutout
Nuts (x2)Washers (x2)
Stanchion (50A pipe)
Bracket mounting screws*
Bracket
Bracket
Bracket for piping
U-bolt
* Tighten the four screws to a torque of 2 N·m.
* Tighten the four screws to a torque of 2 N·m.
* Tighten the four screws to a torque of 2 N·m.
Figure 2.15 Three types of mounting with the optional mounting hardware
SeeGeneralSpecifications(GS12A01A02-01E)forthedimensionsoftheFLXA202/FLXA21and mounting hardware.
PH
SC
ISC
DO
SENCOM
2
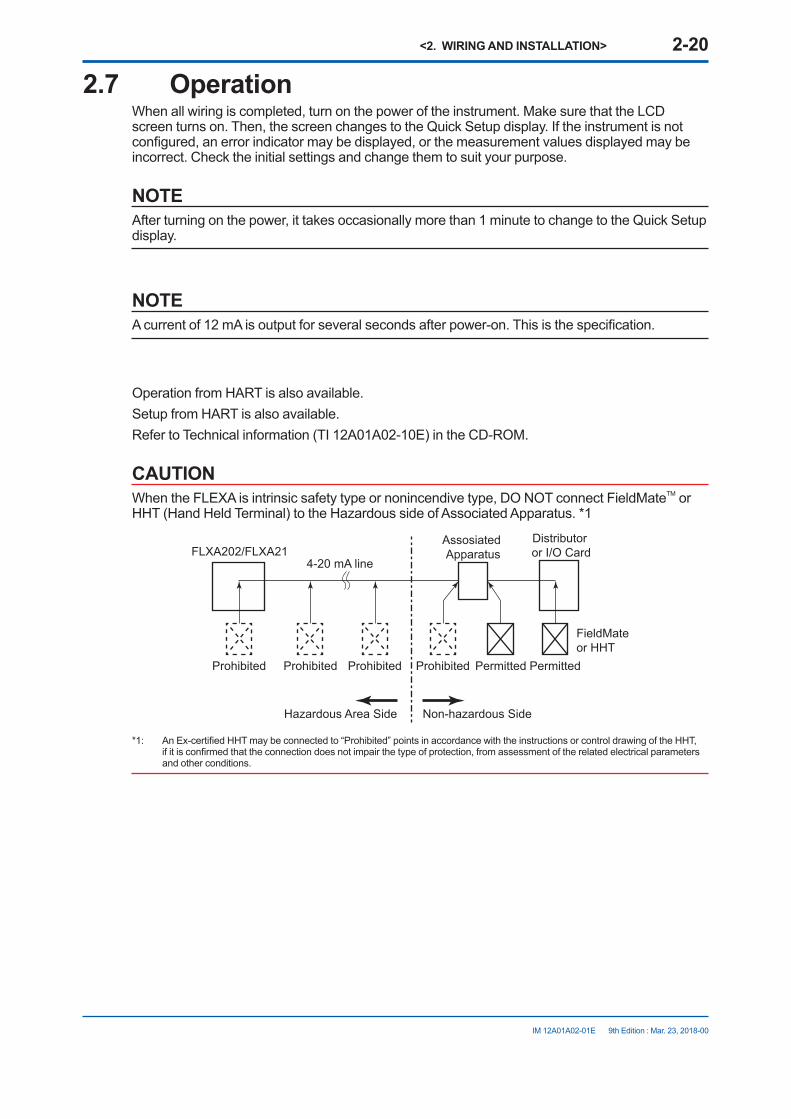
<2. WIRING AND INSTALLATION> 2-20
IM 12A01A02-01E 9th Edition : Mar. 23, 2018-00
2.7 OperationWhen all wiring is completed, turn on the power of the instrument. Make sure that the LCD screen turns on. Then, the screen changes to the Quick Setup display. If the instrument is not configured,anerrorindicatormaybedisplayed,orthemeasurementvaluesdisplayedmaybeincorrect. Check the initial settings and change them to suit your purpose.
NOTEAfter turning on the power, it takes occasionally more than 1 minute to change to the Quick Setup display.
NOTEAcurrentof12mAisoutputforseveralsecondsafterpower-on.Thisisthespecification.
OperationfromHARTisalsoavailable.SetupfromHARTisalsoavailable.Refer to Technical information (TI 12A01A02-10E) in the CD-ROM.
CAUTIONWhen the FLEXA is intrinsic safety type or nonincendive type, DO NOT connect FieldMateTM or HHT(HandHeldTerminal)totheHazardoussideofAssociatedApparatus.*1
Distributor or I/O CardFLXA202/FLXA21
Assosiated Apparatus
FieldMate or HHT
Prohibited ProhibitedProhibitedProhibited PermittedPermitted
4-20 mA line
Non-hazardous SideHazardous Area Side
*1: AnEx-certifiedHHTmaybeconnectedto“Prohibited”pointsinaccordancewiththeinstructionsorcontroldrawingoftheHHT,ifitisconfirmedthattheconnectiondoesnotimpairthetypeofprotection,fromassessmentoftherelatedelectricalparametersand other conditions.

<2. WIRING AND INSTALLATION> 2-21
IM 12A01A02-01E 9th Edition : Mar. 23, 2018-00
l Change languageWhen the power is turned on, the Quick setup display appears.Upon delivery, the display language is set to English. If you want to use a language other than English, select your desired language.
ChineseCzechEnglishFrenchGermanItalianJapaneseKoreanPortugueseRussianSpanish
Change language
The instrument will restart
Are you sure? Yes
WarningStart quick setup?
Yes No
Change language
Quick setupChineseCzechEnglishFrenchGermanItalianJapaneseKoreanPolishPortugueseRussianSpanish
(2) (3)(1)
Figure 2.16 Changing the language
(1) Select♦Changelanguage.(2) Select a desired language (click the to scroll the language options.)(3) Click YES.Changing languages automatically reboots the FLXA202/FLXA21.
Checkthattheparametersmatchyourspecificationsandmodifythemifnecessarybeforeusingthe instrument.A sheet for user settings is contained in the CD-ROM. Please take a memo of your settings on it whenyouconfiguretheFLXA202/FLXA21andkeepthesheetjustincase.
PH
SC
ISC
DO
SENCOM
2

Blank Page
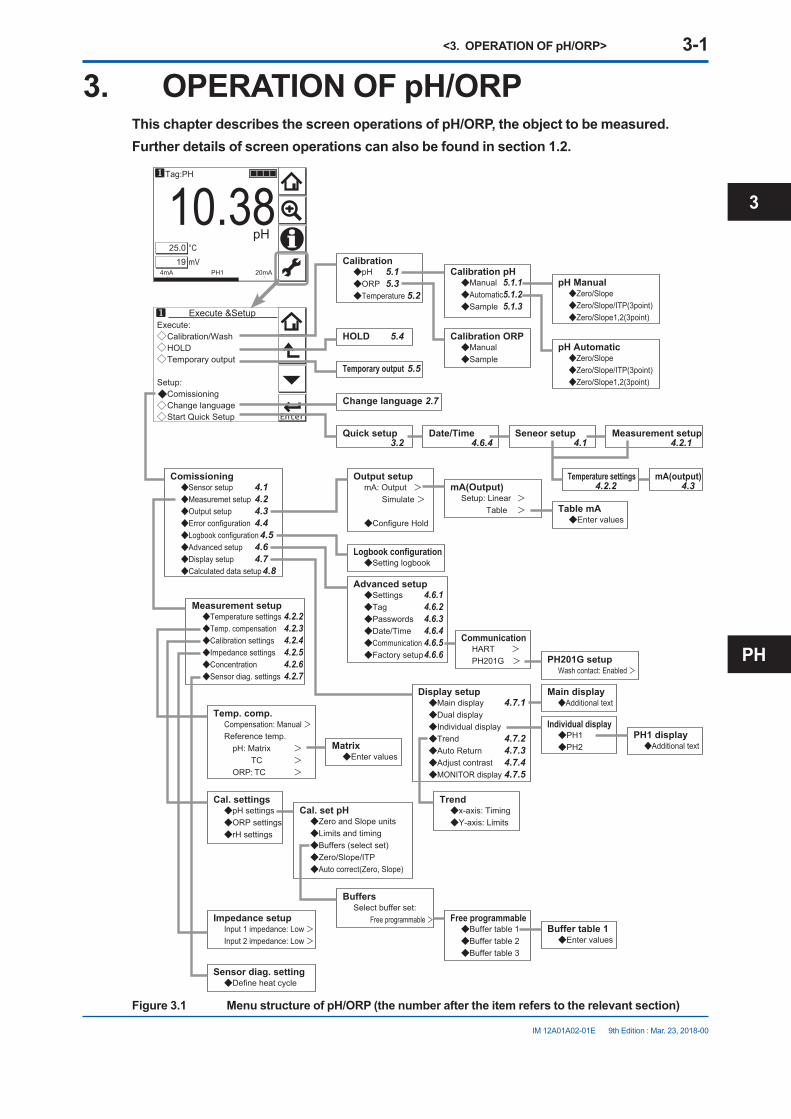
<3. OPERATION OF pH/ORP> 3-1
IM 12A01A02-01E 9th Edition : Mar. 23, 2018-00
3. OPERATION OF pH/ORPThis chapter describes the screen operations of pH/ORP, the object to be measured.Further details of screen operations can also be found in section 1.2.
10.38Tag:PH
25.0
4mA 20mAPH1
°CpH
19 mV
Execute: Calibration/Wash HOLD Temporary output
Setup: Comissioning Change language Start Quick Setup
Execute &Setup
Sensor setupMeasuremet setupOutput setupError configurationLogbook configurationAdvanced setupDisplay setupCalculated data setup
Comissioning
ManualAutomaticSample
Calibration pH
ManualSample
Calibration ORP
Zero/SlopeZero/Slope/ITP(3point)Zero/Slope1,2(3point)
pH Manual
Zero/SlopeZero/Slope/ITP(3point)Zero/Slope1,2(3point)
pH Automatic
pHORPTemperature
Calibration
Quick setup Seneor setupDate/Time Measurement setup
Temperature settings mA(output)
HART >PH201G >
Communication
Setting logbookLogbook configuration
Main displayDual displayIndividual displayTrendAuto ReturnAdjust contrastMONITOR display
Display setup
Enter valuesTable mA
Change language
Temporary output
HOLD
Setup: Linear > Table >
mA(Output)
x-axis: TimingY-axis: Limits
Trend
PH1PH2
Individual display
Enter valuesBuffer table 1
Additional textPH1 display
Additional textMain display
Buffer table 1Buffer table 2Buffer table 3
Free programmable
Enter valuesMatrix
Input 1 impedance: Low >Input 2 impedance: Low >
Impedance setup
Temperature settingsTemp. compensationCalibration settingsImpedance settingsConcentrationSensor diag. settings
Measurement setup
Compensation: Manual >Reference temp. pH: Matrix > TC > ORP: TC >
Temp. comp.
Define heat cycleSensor diag. setting
pH settingsORP settingsrH settings
Cal. settings
Zero and Slope unitsLimits and timingBuffers (select set)Zero/Slope/ITPAuto correct(Zero, Slope)
Cal. set pH
Select buffer set: Free programmable >
Buffers
mA: Output > Simulate >
Configure Hold
Output setup
SettingsTagPasswordsDate/TimeCommunicationFactory setup
Advanced setup
Wash contact: Enabled >PH201G setup
4.14.24.34.4 4.54.64.7 4.8
2.7
3.2 4.6.4 4.1 4.2.1
4.2.2 4.3
5.15.3 5.2
5.1.15.1.25.1.3
5.4
5.5
4.2.24.2.34.2.44.2.54.2.64.2.7
4.7.1
4.7.24.7.34.7.44.7.5
4.6.14.6.24.6.34.6.44.6.54.6.6
Figure 3.1 Menu structure of pH/ORP (the number after the item refers to the relevant section)
PH
3

<3. OPERATION OF pH/ORP> 3-2
IM 12A01A02-01E 9th Edition : Mar. 23, 2018-00
3.1 Change languageThescreenissettodisplayEnglishatfactoryshipment;ifyouwishtousetheFLXA202/FLXA21inanotherlanguage,firstselectalanguageasdescribedinsection2.7.
3.2 Quick setupTheQuicksetupscreenisusedtosetupthebasicitemsyouwanttosetupfirst,suchasthedate/timeandsensorsettings.Thedetailedsettingsaredescribedinchapter4,Commissioning.YoumayleavetheQuicksetupnowandreturntoitlater;however,itisrecommendedtoperformthequicksetupfirst.Each time the FLXA202/FLXA21 is started up, this screen is displayed. If it is not necessary to
change the setup, press No or .
NOTEWhen no operation is performed for 10 minutes or 60 minutes (depending on the setting of “Auto Return”), the display except Trend display automatically changes to the Monitor display (or to the MaindisplayortheHomedisplaywhentheMONITORdisplayisdisabled).

<3. OPERATION OF pH/ORP> 3-3
IM 12A01A02-01E 9th Edition : Mar. 23, 2018-00
Start quick setup?
Yes No
Chanage language
Quick setupSensor type pH+ORP
Next
Sensor setup
Format YYYY/MM/DD
Date 2010/03/03
Time 17:04:07
Next
Date/Time
Process parameter pH1
0% value 0.00 pH100% value 14.00pH
Finish
mA(output)
Temp.element Pt1000
Unit °C
Next
Temperature settings
Measurement pH+ORP
Next
Measurement setup
°C°F
YYYY/MM/DDMM/DD/YYYYDD/MM/YYYY
pHORPpH+ORP
pH1Temperature1ORP1rH1pH2Temperature2ORP2rH2
Pt1000Pt1003kBalco8k55PTC10k6k8500Ω
pHORPpH+ORPpH+rHrH
Next
NextNext
Finish
Next
Monitor display
*1
*2
*1:TheMeasurementsetupscreenappearsonlywhen“pH+ORP”isselectedontheSensorsetupscreen.*2: If two sensors are connected, the second sensor can also be set up.Figure 3.2 Quick setup
n Date/TimeThe date display format can be selected from among the three types.Enter the date or time of day by using the numerical keys.Fordetails,seesection4.6.4.
n Sensor setupSelect a suitable electrode from among the displayed electrode types and set it up.Fordetails,seesection4.1.
PH
3

<3. OPERATION OF pH/ORP> 3-4
IM 12A01A02-01E 9th Edition : Mar. 23, 2018-00
n Measurement setupSelect a suitable measurement parameter from among those displayed and set it up.Measurementparametersetupcanbemadeonlywhen“pH+ORP”isselectedontheSensorsetup screen.Fordetails,seesection4.2.1.
n Temperature settingsSelect a suitable temperature element from among those displayed and set it up.Celsius (ºC) or Fahrenheit (ºF) temperature scale can be selected.Fordetails,seesection4.2.2.
n mA (output)Select a suitable process parameter from among those displayed and set it up.Forexample,themAoutputofpHhasbeensetto0–14pHatfactoryshipment.Iftheresolutionneeds to be improved, set a suitable value for the process.Fordetails,seesection4.3.
3.3 Home display, Main display and Monitor display
Pressing changes the screen to the Main display shown in Figure 3.3 (or theHomedisplayshowninFigure3.4).
If two sensors are connected, pressing on the Main display changes the display to the HomedisplayshowninFigure3.4.
If only one sensor is connected, is grayed out and disabled on the Main display.
10.38Tag:PH
1925.0
mV4mA 20mAPH1
°CpH
Figure 3.3 Example of main display
6.35Tag:PH24.9
4mA 20mAPH1
°C24 mV
pH
Tag:PH25.0 °C
19 mV
pH
10.38
Figure 3.4 Example of home display

<3. OPERATION OF pH/ORP> 3-5
IM 12A01A02-01E 9th Edition : Mar. 23, 2018-00
OntheHomedisplay,pressing of the 1st sensor (top) or 2nd sensor (bottom) causes the display of the selected sensor to appear on the Main display.On the Main display, pressing of the 2nd or 3rd display item causes the 1st display item to be replaced by the selected item.
NOTEMeasuredvaluestobedisplayedinthe1stto3rddisplayitemsdependontheuserdefinition(seesection4.7.1).Forexample,onthedefaultconditionofpHmeasurement,the1stdisplayitemispH,the2nddisplayitemistemperature,andthe3rddisplayitemisempty.
WhentheMONITORdisplayisenabled(seesection4.7.5),pressingthe1stdisplayitemonthehome display or the main display changes the display to the Monitor display with the enlarged font of the measured value.
6.35Tag:PH24.9
4mA 20mApH1
°C24.40 mV
pH
Tag:PH25.0 °C
19.00 mV
pH
10.38
10.38Tag:PH
19.0025.0
mV4mA 20mApH1
°CpH 6.35
Tag:PH
24.4024.9
mV4mA 20mApH2
°CpH
25.0Tag:PH
19.0010.38
mV4mA 20mApH1
pH°C
19.00Tag:PH
10.3825.0
pH4mA 20mApH1
°CmV
2nd display itemMain display
Home display
(When the MONITOR display is disabled)
Monitor display
3rd display item
1st display item
10.38pH 6.35
pH
Figure 3.5 Change display
3.4 Zooming in on detailsPressing on the Main display allows you to check detailed instrument information (instrument information such as setup, sensor diagnosis, calibration, and module productions number) through a transition of screens as shown in Figure 3.6.
PH
3
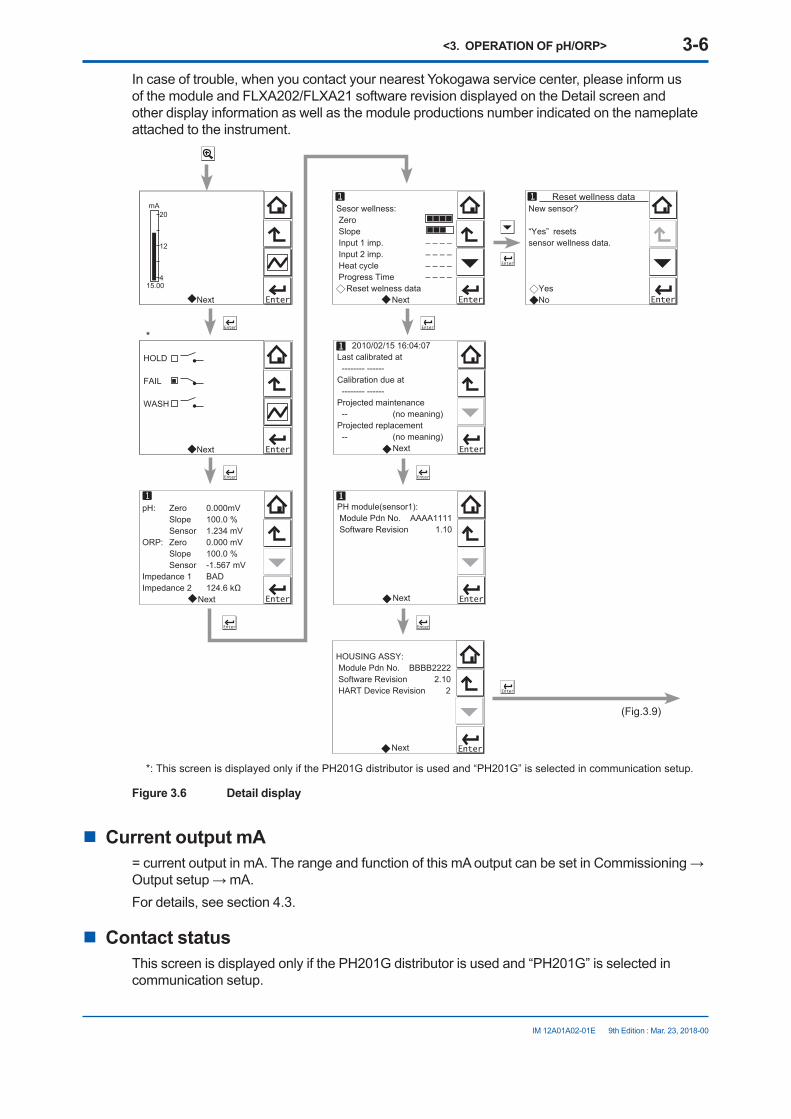
<3. OPERATION OF pH/ORP> 3-6
IM 12A01A02-01E 9th Edition : Mar. 23, 2018-00
In case of trouble, when you contact your nearest Yokogawa service center, please inform us of the module and FLXA202/FLXA21 software revision displayed on the Detail screen and other display information as well as the module productions number indicated on the nameplate attached to the instrument.
Next
20
12
4
mA
15.00
HOLD
FAIL
WASH
Next
pH: Zero 0.000mV Slope 100.0 % Sensor 1.234 mVORP: Zero 0.000 mV Slope 100.0 % Sensor -1.567 mVImpedance 1 BADImpedance 2 124.6 kΩ Next
Sesor wellness: Zero Slope Input 1 imp. – – – – Input 2 imp. – – – – Heat cycle – – – – Progress Time – – – – Reset welness data Next
New sensor?
“Yes” resetssensor wellness data.
Yes No
2010/02/15 16:04:07Last calibrated at -------- ------Calibration due at -------- ------Projected maintenance -- (no meaning)Projected replacement -- (no meaning) Next
PH module(sensor1): Module Pdn No. AAAA1111 Software Revision 1.10
Next
HOUSING ASSY: Module Pdn No. BBBB2222 Software Revision 2.10 HART Device Revision 2
Next
Reset wellness data
(Fig.3.9)
*: This screen is displayed only if the PH201G distributor is used and “PH201G” is selected in communication setup.
*
Figure 3.6 Detail display
n Current output mA=currentoutputinmA.TherangeandfunctionofthismAoutputcanbesetinCommissioning→Outputsetup→mA.Fordetails,seesection4.3.
n Contact statusThisscreenisdisplayedonlyifthePH201Gdistributorisusedand“PH201G”isselectedincommunication setup.
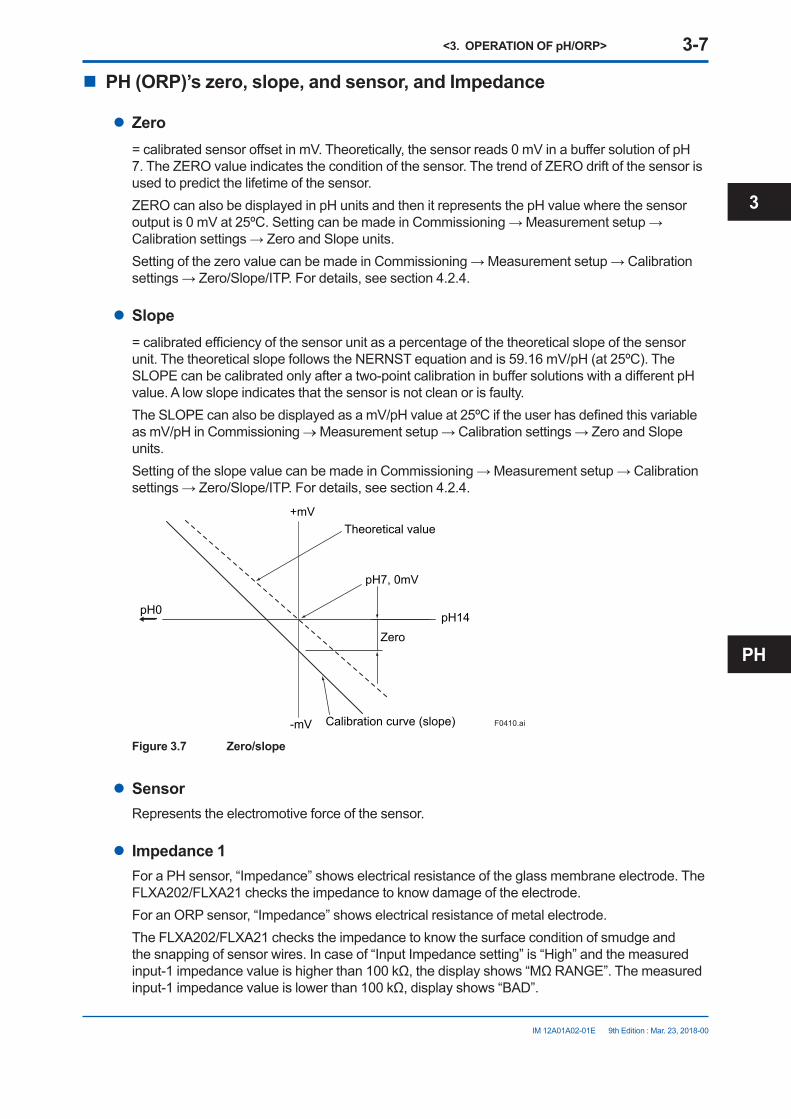
<3. OPERATION OF pH/ORP> 3-7
IM 12A01A02-01E 9th Edition : Mar. 23, 2018-00
n PH (ORP)’s zero, slope, and sensor, and Impedance
l Zero=calibratedsensoroffsetinmV.Theoretically,thesensorreads0mVinabuffersolutionofpH7. The ZERO value indicates the condition of the sensor. The trend of ZERO drift of the sensor is used to predict the lifetime of the sensor.ZEROcanalsobedisplayedinpHunitsandthenitrepresentsthepHvaluewherethesensoroutputis0mVat25ºC.SettingcanbemadeinCommissioning→Measurementsetup→Calibrationsettings→ZeroandSlopeunits.SettingofthezerovaluecanbemadeinCommissioning→Measurementsetup→Calibrationsettings→Zero/Slope/ITP.Fordetails,seesection4.2.4.
l Slope=calibratedefficiencyofthesensorunitasapercentageofthetheoreticalslopeofthesensorunit.ThetheoreticalslopefollowstheNERNSTequationandis59.16mV/pH(at25ºC).TheSLOPEcanbecalibratedonlyafteratwo-pointcalibrationinbuffersolutionswithadifferentpHvalue. A low slope indicates that the sensor is not clean or is faulty.TheSLOPEcanalsobedisplayedasamV/pHvalueat25ºCiftheuserhasdefinedthisvariableasmV/pHinCommissioning→Measurementsetup→Calibrationsettings→ZeroandSlopeunits.SettingoftheslopevaluecanbemadeinCommissioning→Measurementsetup→Calibrationsettings→Zero/Slope/ITP.Fordetails,seesection4.2.4.
pH14pH0
pH7, 0mV
Theoretical value+mV
-mV Calibration curve (slope)
Zero
F0410.ai
Figure 3.7 Zero/slope
l SensorRepresents the electromotive force of the sensor.
l Impedance 1ForaPHsensor,“Impedance”showselectricalresistanceoftheglassmembraneelectrode.TheFLXA202/FLXA21 checks the impedance to know damage of the electrode.For an ORP sensor, “Impedance” shows electrical resistance of metal electrode.The FLXA202/FLXA21 checks the impedance to know the surface condition of smudge and thesnappingofsensorwires.Incaseof“InputImpedancesetting”is“High”andthemeasuredinput-1impedancevalueishigherthan100kΩ,thedisplayshows“MΩRANGE”.Themeasuredinput-1impedancevalueislowerthan100kΩ,displayshows“BAD”.
PH
3
<3. OPERATION OF pH/ORP> 3-8
IM 12A01A02-01E 9th Edition : Mar. 23, 2018-00
Ifbothimpedancemeasurementsaredisabled(Errorsetting:Off),thedisplayshows“----(bar)”.If either impedance measurement 1 or 2 is enabled, the display shows both the impedance values.
l Impedance 2Impedance shows the electrical resistance of the reference electrode liquid junction. The liquid junction forms the electrolytic contact between the reference electrode and the measuring electrode,soitmustbekeptcleanandfilledwithconductiveelectrolyte.Otherwisethemeasurementwillsufferfrominstability,driftandmeasuringerrors.Theelectricalimpedanceisone of the most important.Incaseof“InputImpedancesetting”is“High”andthemeasuredinput-2impedancevalueishigherthan100kΩ,thedisplayshows“MΩRANGE”.Themeasuredinput-2impedancevalueislowerthan100kΩ,displayshows“BAD”.Ifbothimpedancemeasurementsaredisabled(Errorsetting:Off),thedisplayshows“----(bar)”.If either impedance measurement 1 or 2 is enabled, the display shows both the impedance values.
n Sensor wellnessAt the Sensor wellness window, the soundness of a module is displayed. A larger number of n in each gauge indicates that the parameter concerned is sound. A gauge is indicated for only those parameters whose sensor wellness setting is “enabled,” while a bar (----) is displayed if the sensor wellness setting is “disabled.”SensorwellnesssetupcanbemadeinCommissioning→Measurementsetup→Sensordiag.settings. Fordetails,seesection4.2.7.
The “Reset wellness data” button can reset wellness data.When a sensor or an electrode is exchanged or replaced, sensor wellness data should be reset.
NOTEWhen a sensor is replaced, the replacement can be recorded manually into a logbook. (Refer to thefigure3.9.)
n Last calibrated=dateonwhichthelastsensorcalibrationwasperformed.ThedisplayedvalueoftheZeroistheresult of this calibration. The displayed value of Slope was calibrated on this date only if the last calibration was a 2-point calibration.
n Calibration due=thedatewhenthecalibrationmustbedonenextaccordingtothesettingsofthecalibrationinterval.ThecalibrationintervalsaresetinCommissioning→Measurementsetup→Calibrationsettings→Limitsandtiming.
n Projected maintenanceThe projected maintenance function predicts the date when the sensor unit will need recalibrating for maintaining measurement accuracy. The function checks the input-2 impedance (reference impedance)every24hours.The function predicts the date when the input-2 impedance will cross the upper or lower limits, and indicates the date and its status (the status is displayed in parentheses).

<3. OPERATION OF pH/ORP> 3-9
IM 12A01A02-01E 9th Edition : Mar. 23, 2018-00
As shown in Figure 3.8, the date is predicted based on the intersection point of the upper or lower limits and the extrapolated line of the values obtained by the least squares method.
Day
Value Lower limit
Upper limit
Current date
Projected maintenance date F0310.ai
Figure 3.8
The status shows the certainty of the projected maintenance date in terms of the correlation coefficientR.Tables3.1and3.2showrespectivedisplaypatterns.
Table 3.1 Display pattern of the projected maintenance date
Projected date - - 0-1 month 1-3 months 3-6 months 6-12 months Over 1 year--: cannotbepredictableduetoinsufficientdata
Table 3.2 Display pattern of the status
Status (- - - - -)(R < 0.50)
(Poor)(0.50≤R<0.70)
(Reasonable)(0.70≤R<0.85)
(Excellent)(0.85≤R<1.00)
n Projected replacementThe projected replacement function predicts the date when the sensor will need replacing for maintainingthemeasurementaccuracy,basedonthepHzeroandpHslopeoneachcalibration,and reference impedance (input-2 impedance) after each calibration. The projected replacement date is predicted based on these parameters stored upon calibration, and displayed the same as that of projected maintenance. For details, see the description about the projected maintenance. Sincethreeparameters(pHzero,pHslope,andinput-2impedanceaftercalibration)areusedforthis projection, the nearest coming day is selected as the projected replacement date from the extrapolated line of the values obtained by the least squares method.
n PH module (sensor)With this screen, you can check the module productions number and software revision of the installed module.
n HOUSING ASSYWiththisscreen,youcancheckthemoduleproductionsnumber,softwarerevision,andHARTdevice revision of the housing assembly.
n Read logbookThe FLXA202/FLXA21 has two types of logbook per sensor to store history information on events, such as changed settings and calibrations.By selecting one of the logbooks that you wish to check, you can retrieve and check this information. Storage of history information on each event in a logbook or which logbook to use for storagecanbesetupontheConfigurelogbookscreen.Fordetails,seesection4.5.
PH
3
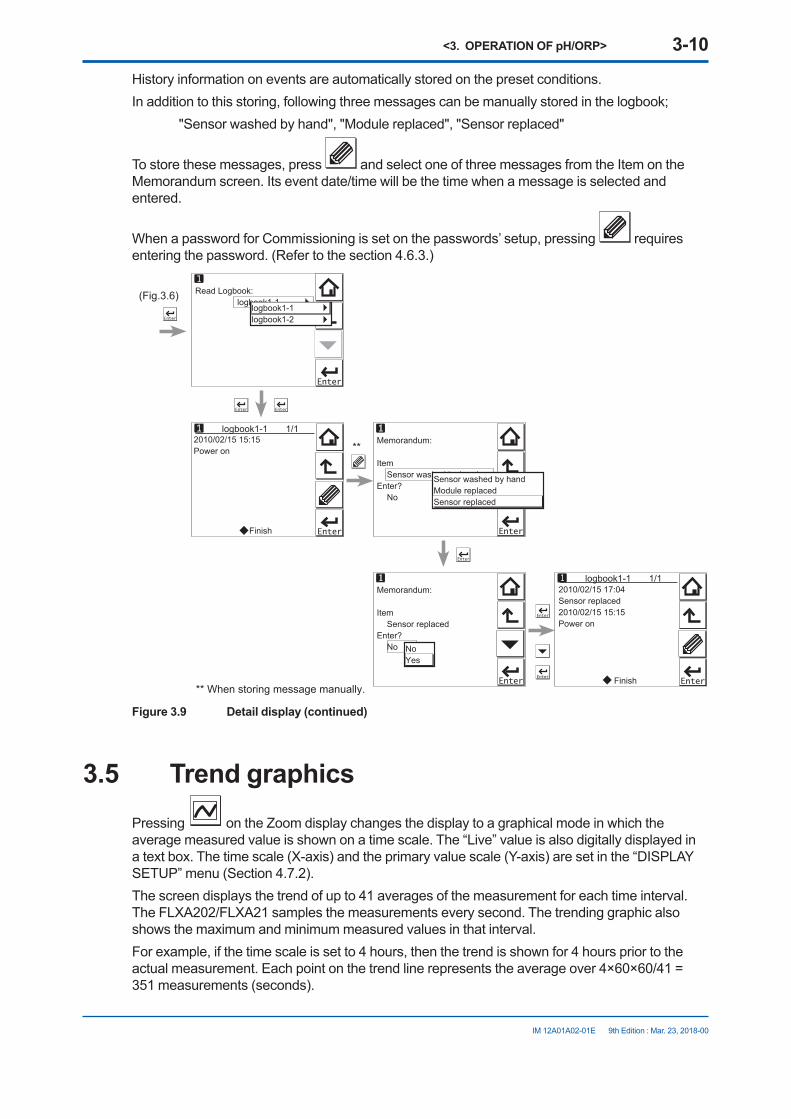
<3. OPERATION OF pH/ORP> 3-10
IM 12A01A02-01E 9th Edition : Mar. 23, 2018-00
Historyinformationoneventsareautomaticallystoredonthepresetconditions.Inadditiontothisstoring,followingthreemessagescanbemanuallystoredinthelogbook; "Sensor washed by hand", "Module replaced", "Sensor replaced"
To store these messages, press and select one of three messages from the Item on the Memorandum screen. Its event date/time will be the time when a message is selected and entered.
When a password for Commissioning is set on the passwords’ setup, pressing requires enteringthepassword.(Refertothesection4.6.3.)
Read Logbook: logbook1-1
Memorandum:
Item Sensor washed by handEnter? No
logbook1-1 1/1
Memorandum:
Item Sensor replacedEnter? No
2010/02/15 17:04Sensor replaced2010/02/15 15:15Power on
Finish
2010/02/15 15:15Power on
Finish
logbook1-1 1/1
** When storing message manually.
**
(Fig.3.6)
Sensor washed by handModule replacedSensor replaced
logbook1-1logbook1-2
NoYes
Figure 3.9 Detail display (continued)
3.5 Trend graphicsPressing on the Zoom display changes the display to a graphical mode in which the average measured value is shown on a time scale. The “Live” value is also digitally displayed in a text box. The time scale (X-axis) and the primary value scale (Y-axis) are set in the “DISPLAY SETUP”menu(Section4.7.2).Thescreendisplaysthetrendofupto41averagesofthemeasurementforeachtimeinterval.The FLXA202/FLXA21 samples the measurements every second. The trending graphic also shows the maximum and minimum measured values in that interval.Forexample,ifthetimescaleissetto4hours,thenthetrendisshownfor4hourspriortotheactualmeasurement.Eachpointonthetrendlinerepresentstheaverageover4×60×60/41=351 measurements (seconds).

<3. OPERATION OF pH/ORP> 3-11
IM 12A01A02-01E 9th Edition : Mar. 23, 2018-00
NOTEUpdating the trend screen setup resets the current trend graph and starts a new one.
12.00
8.40
5.60
2.50
12:00 12:20 12:40
10.38pH
Minimum
MaximumAverage
Time
Tag:
Mea
sure
men
t val
ue (p
H) PH pH1
Current process valueMax. and min. values on this display
Figure 3.10 Trend screen
The 1st display item data on the Main display is shown as a graph. Touching any point on the display changes the display to the 2nd display item data (and to the 3rd display item data if set) and then returns to the Main display.
12.00
8.40
5.60
2.50
12:00 12:20 12:40
10.38pHTag: PH pH1
12.00
8.40
5.60
2.50
12:00 12:20 12:40
25.0°CTag: PH Temperature1
Next
20
12
4
mA
15.00
Figure 3.11 Trend graphics
3.6 Instrument status screenIn the fieldoftheMaindisplay,the (Warning) or (Fault) sign appears according to the instrument status. Upon pressing the displayed button, detailed information of the relevant status appears.See “n Information button” on page 1-10.
PH
3
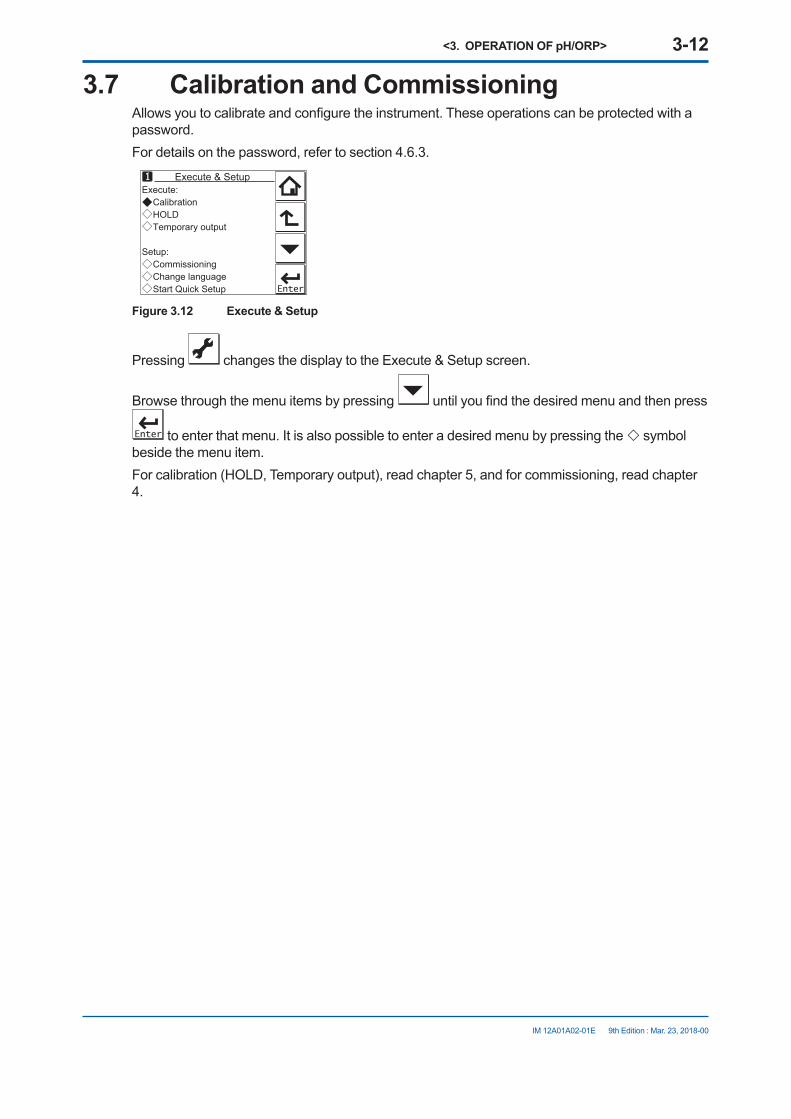
<3. OPERATION OF pH/ORP> 3-12
IM 12A01A02-01E 9th Edition : Mar. 23, 2018-00
3.7 Calibration and CommissioningAllowsyoutocalibrateandconfiguretheinstrument.Theseoperationscanbeprotectedwithapassword.Fordetailsonthepassword,refertosection4.6.3.
Execute: Calibration HOLD Temporary output
Setup: Commissioning Change language Start Quick Setup
Execute & Setup
Figure 3.12 Execute & Setup
Pressing changesthedisplaytotheExecute&Setupscreen.
Browse through the menu items by pressing untilyoufindthedesiredmenuandthenpress
to enter that menu. It is also possible to enter a desired menu by pressing the symbol beside the menu item.Forcalibration(HOLD,Temporaryoutput),readchapter5,andforcommissioning,readchapter4.
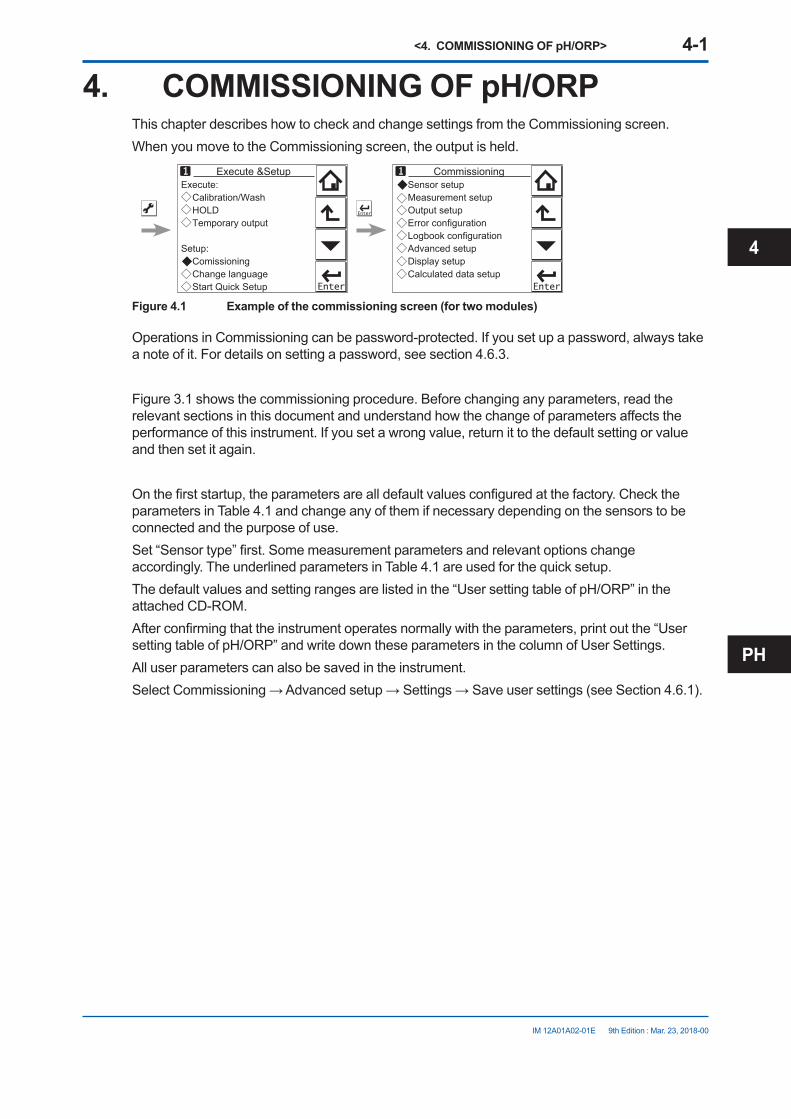
<4. COMMISSIONING OF pH/ORP> 4-1
IM 12A01A02-01E 9th Edition : Mar. 23, 2018-00
4. COMMISSIONING OF pH/ORPThis chapter describes how to check and change settings from the Commissioning screen.When you move to the Commissioning screen, the output is held.
Execute: Calibration/Wash HOLD Temporary output
Setup: Comissioning Change language Start Quick Setup
Execute &Setup Sensor setup Measurement setup Output setup Error configuration Logbook configuration Advanced setup Display setup Calculated data setup
Commissioning
Figure 4.1 Example of the commissioning screen (for two modules)
Operations in Commissioning can be password-protected. If you set up a password, always take anoteofit.Fordetailsonsettingapassword,seesection4.6.3.
Figure 3.1 shows the commissioning procedure. Before changing any parameters, read the relevantsectionsinthisdocumentandunderstandhowthechangeofparametersaffectstheperformance of this instrument. If you set a wrong value, return it to the default setting or value and then set it again.
Onthefirststartup,theparametersarealldefaultvaluesconfiguredatthefactory.ChecktheparametersinTable4.1andchangeanyofthemifnecessarydependingonthesensorstobeconnected and the purpose of use.Set“Sensortype”first.Somemeasurementparametersandrelevantoptionschangeaccordingly.TheunderlinedparametersinTable4.1areusedforthequicksetup.Thedefaultvaluesandsettingrangesarelistedinthe“UsersettingtableofpH/ORP”intheattached CD-ROM.Afterconfirmingthattheinstrumentoperatesnormallywiththeparameters,printoutthe“UsersettingtableofpH/ORP”andwritedowntheseparametersinthecolumnofUserSettings.All user parameters can also be saved in the instrument.SelectCommissioning→Advancedsetup→Settings→Saveusersettings(seeSection4.6.1).
PH
4

<4. COMMISSIONING OF pH/ORP> 4-2
IM 12A01A02-01E 9th Edition : Mar. 23, 2018-00
Table 4.1 Menu Structure and Default Values in “Commissioning”
Parameter Ref. sect.Sensor setup Sensor type 4.1Measurement setup Measurement 4.2.1
Temperature setting Temp. element 4.2.2Temp. compensation Compensation 4.2.3
Reference temp.Process Temp. Compensation
Calibration settings pHsettings Zero and Slope units 4.2.4Limits and timingBuffers(selectset)Zero/Slope/ITPAuto correct (Zero, Slope)
ORP settingsrHsettings
Limit and timingZero/Slope
Impedance settings 4.2.5Concentration Unit 4.2.6Sensor diag. settings Input 1 imp.: 4.2.7
FINEInput 2 imp.:Process timeHeatcycle:Defineheatcycle
Output setup mA 4.3Output Process parameter
Setup Linear 0%value
100%value TableBurnDamping time
Simulate Simulation perc.ConfigureHold
Errorconfiguration 4.4Logbookconfiguration 4.5Advanced setup Settings 4.6.1
Tag 4.6.2Passwords 4.6.3Date/Time 4.6.4Communication 4.6.5
HARTPH201G
Factory setup 4.6.6Display setup Main display (Dual display, Individual display) 4.7.1
Trend 4.7.2Auto Return 4.7.3Adjust contrast 4.7.4MONITOR display 4.7.5
Calculated data setup Function 4.8
NOTEAlltheparametersforthequicksetup(underlinedonesinTable4.1)arecrucialformeasurement.If you change any of them, other parameters may be initialized. For the parameters that may initialize other values, see Appendix 1.

<4. COMMISSIONING OF pH/ORP> 4-3
IM 12A01A02-01E 9th Edition : Mar. 23, 2018-00
4.1 Sensor setup“Sensor type” setup is determined by the sensor to be connected to the instrument. Select one of the following three sensor types:pH: OnlypHismeasured.Theglasselectrode(input1)isconnectedtoterminal15
and the reference electrode (input 2) is connected to terminal 13.ORP: Only Redox is measured. The metal electrode (input 1) is connected to terminal 15
and the reference electrode (or glass) (input 2) is connected to terminal 13.pH+ORP: BothpHandORParemeasuredsimultaneously.Theglasselectrodeisconnected
to terminal 15, the reference electrode to terminal 13, and the metal electrode to terminal14.ThissetupalsoallowsrHtobemeasured.
Forbestresults,connectaliquidearthtoterminal14.Fordetailsofthewiringconnections,seeSection2.5.1.Ifthereisnoliquidearth,thesensordiagnosticfunctionisdisabled;setallof“Impedance1toohigh/low”and“Impedance2toohigh/low”in“Errorconfiguration”toOffsothatno related error is caused.
NOTEThe selection of “Sensor type” determines the menu structure throughout the instrument.WhenpH+ORPisspecifiedasthesensortype,theobjectundermeasurementwillbedisplayedat the top of “Measurement setup.”IfthesensortypeischangedfrompHtoORP,partoftherelevantsetupisreset,requiringreconfiguration.WhenORPisspecified,andwhenanORPsensordoesn’thaveanytemperatureelement,setbothof“Temperaturetoohigh/low”in“Errorconfiguration”toOffsothatnorelatederroriscaused.(Refertothesection4.4.)Withouttemperatureinput,atemperatureshownontheMaindisplayortheHomedisplayisthemaximumortheminimumtemperatureofthetemperatureelement’s range set on the Temperature settings. Setting in “Display setup” can make temperaturevalueonthedisplaynottobedisplayed.(Refertothesection4.7.)
4.2 Measurement setupThis section describes how to set up various parameters relating to measurements.Measurements are performed based on the measurement parameter setup.
For measurement setup, part of the menu structure of settable items changes depending on the “Sensortype”selectedin“4.1Sensorsetup.”
4.2.1 MeasurementIf“pH”or“ORP”isselectedin“Sensortype,”ameasurementtypedoesnotneedtobeselectedand it is not displayed.If“pH+ORP”isselectedin“Sensortype,”fivemeasurementtypescanbeselectedforthe“Measurement” item at the top of the Measurement setup screen. Select a suitable measurement type for the application.Moreover,associateditemsareaddedtoparametersin“Errorconfiguration,”“Displaysetup,”etc.;checkthesettingconditionofeachitem.
PH
4

<4. COMMISSIONING OF pH/ORP> 4-4
IM 12A01A02-01E 9th Edition : Mar. 23, 2018-00
4.2.2 Temperature settingsSelect the temperature element used for compensation from among Pt1000, Pt100, 3kBalco, 8k55,PTC10k,6k8,and500Ω.Selectthesametypeasthetemperatureelementthatisactuallyconnected.
Celsius (°C) or Fahrenheit (°F) temperature units are available. If the unit is changed, the following values are also recalculated automatically to the new unit:
• Manual temp.• Reference temp.• Temp.coefficient• Temp. ranges in the matrix
4.2.3 Temperature compensationORP measurement involves no temperature input. No setting is required on the temperature compensation.Processtemperaturecompensationiseffectiveif“T.C.ORPmV/°C”in“Temp.Coef.” is set.
n Temperature compensationThiscompensationofpHvalueisperformedontheNernstequation.Two methods can be used: Automatic and Manual. Select Automatic when a temperature element is used, or select Manual when a manually set temperature is used.
NOTEWhen Manual is selected on the Temperature compensation, a process temperature should be setinthe“Manualtemp.”AtemperatureshownontheMaindisplayortheHomedisplayisthismanually set temperature.
n Reference temperatureSetareferencetemperaturetowhichthemeasuredpHvaluemustbecompensated.Normally25°C is used, so this temperature is chosen as the default value.
n Process temperature compensationSelect a temperature compensation method. “None” does not perform the temperature compensation.If“pH”isselectedin“Sensortype,”chooseprocesstemperaturecompensationfromamongNone,TC,Matrix,andNEN6411.If“ORP”isselectedin“Sensortype,”chooseitfromamongNone and TC.
l TCThis method uses the linear compensation function.Itispossibletoadjustthetemperaturecoefficient(TC)factordirectly.Ifthetemperaturecoefficientfactorofthesampleliquidisknownfromlaboratoryexperimentsorhasbeenpreviously determined, it can be entered here.ThisTCisapHvariationto1°C(∆pH/∆T).Adjustthevaluebetween-0.1to0.1pH/ºC.In combination with the reference temperature setting, a linear compensation function is obtained, which is suitable for all kinds of chemical solutions.
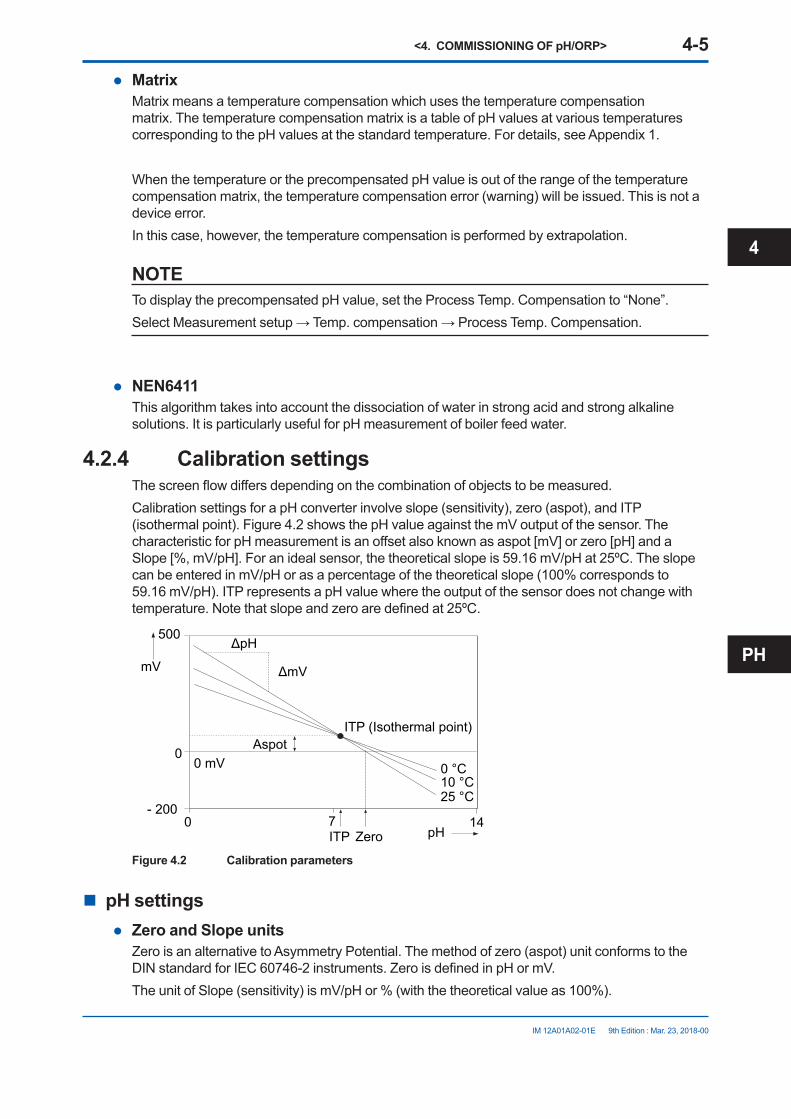
<4. COMMISSIONING OF pH/ORP> 4-5
IM 12A01A02-01E 9th Edition : Mar. 23, 2018-00
l MatrixMatrix means a temperature compensation which uses the temperature compensation matrix.ThetemperaturecompensationmatrixisatableofpHvaluesatvarioustemperaturescorrespondingtothepHvaluesatthestandardtemperature.Fordetails,seeAppendix1.
WhenthetemperatureortheprecompensatedpHvalueisoutoftherangeofthetemperaturecompensation matrix, the temperature compensation error (warning) will be issued. This is not a device error.In this case, however, the temperature compensation is performed by extrapolation.
NOTETodisplaytheprecompensatedpHvalue,settheProcessTemp.Compensationto“None”.SelectMeasurementsetup→Temp.compensation→ProcessTemp.Compensation.
l NEN6411This algorithm takes into account the dissociation of water in strong acid and strong alkaline solutions.ItisparticularlyusefulforpHmeasurementofboilerfeedwater.
4.2.4 Calibration settingsThescreenflowdiffersdependingonthecombinationofobjectstobemeasured.CalibrationsettingsforapHconverterinvolveslope(sensitivity),zero(aspot),andITP(isothermalpoint).Figure4.2showsthepHvalueagainstthemVoutputofthesensor.ThecharacteristicforpHmeasurementisanoffsetalsoknownasaspot[mV]orzero[pH]andaSlope[%,mV/pH].Foranidealsensor,thetheoreticalslopeis59.16mV/pHat25ºC.TheslopecanbeenteredinmV/pHorasapercentageofthetheoreticalslope(100%correspondsto59.16mV/pH).ITPrepresentsapHvaluewheretheoutputofthesensordoesnotchangewithtemperature.Notethatslopeandzeroaredefinedat25ºC.
ΔpH
ΔmV
ITP (Isothermal point)Aspot
0 mV 0 °C10 °C25 °C
mV
500
0
- 20014
pHITP Zero0 7
Figure 4.2 Calibration parameters
n pH settingsl Zero and Slope units
Zero is an alternative to Asymmetry Potential. The method of zero (aspot) unit conforms to the DINstandardforIEC60746-2instruments.ZeroisdefinedinpHormV.TheunitofSlope(sensitivity)ismV/pHor%(withthetheoreticalvalueas100%).
PH
4

<4. COMMISSIONING OF pH/ORP> 4-6
IM 12A01A02-01E 9th Edition : Mar. 23, 2018-00
l Limits and timingZero High/LowSet the high and low limits of Zero (aspot). During calibration, it is checked whether the new zero exceeds these high and low limits. Narrowing the band will prevent bad calibration procedures and calibration of bad sensors, which results in higher accuracy. The default values should be adjusted to suit the application and the “users” criterion.Slope High/LowSet the high and low limits of Slope (sensitivity). During calibration, it is checked whether the new slope exceeds these high and low limits. Narrowing the band will prevent bad calibration procedures and calibration of bad sensors, which results in higher accuracy. The default values should be adjusted to suit the application and the “users” criterion.Step RangeSet the range over which the stability of a measured value is checked. If variations of a measured value over the stabilization time are within this set value, the measured value is judged to have stabilized.Stabilization timeDuringcalibration,thestabilityofthepHvalueisconstantlymonitored.WhenvariationsofthepHvaluearewithinavaluesetinStepRangeoverthisstabilizationtimesethere,thevalueisregardedasbeingstable.IfthepHvaluedoesnotstabilizewithin10minutes,calibrationisaborted.Calibr. intervalSet the interval in which a new calibration must take place. If the interval set here is exceeded, theinstrumentwillbenotifiedaccordingtothesettingin“Calib.timeexceeded”intheerrorconfiguration.
l Buffers (select set)Calibrationismadeusingstandardcalibrationbuffers.WerecommendtheNIST(JISequivalent)standardbuffersforhighestaccuracy,buttheuserisfreetoselectDIN19267,US,orauser-definedbuffer.ThestandardbufferscanbefoundinAppendix1.Threetypesofuser-definedbuffertablescanbedefined.OntheFreeprogrammablescreen,selectabuffertablethatyouwishtosetup.Whenabuffertableisselectedonthisscreen,theBuffertable1toBuffertable3screensoftheselectedbuffertablearedisplayed.Clear table?Ifyouselect“Yes”andpress“Yes”whenpromptedtoclearthetable,thecontentsofthebuffertablewillbecleared,thedisplaywillreturntotheBuffertablescreenautomatically,andthe“Tablewas cleared” message will be displayed. If you want to perform temperature compensation using thematrixafterclearingthetable,matrixvaluesmustberedefined.Check values?If you select “Yes,” a value check starts. When the check ends, the results will be displayed on the screen. When the results are normal, the “No error” message appears. In case of an error, error information is displayed.
l Zero/Slope/ITPYou can enter Zero (aspot), Slope (sensitivity), and ITP values directly in the screen displayed. These data can be obtained from the manufacturer of the probe, by the users laboratory, etc.
NOTEIt is not necessary to enter this data. In most cases, as the FLXA202/FLXA21 automatically does this while performing calibration, the feature is used in the case of special electrode systems or where calibration in the process environment is not possible. See Chapter 5.
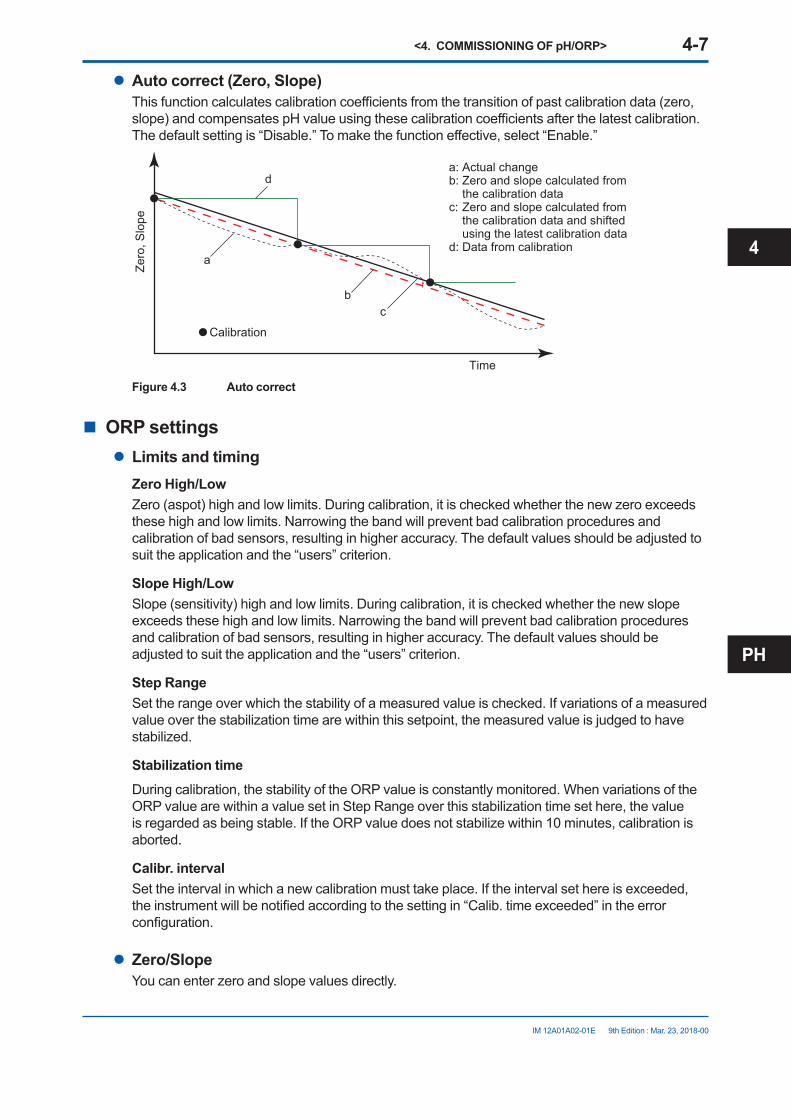
<4. COMMISSIONING OF pH/ORP> 4-7
IM 12A01A02-01E 9th Edition : Mar. 23, 2018-00
l Auto correct (Zero, Slope)Thisfunctioncalculatescalibrationcoefficientsfromthetransitionofpastcalibrationdata(zero,slope)andcompensatespHvalueusingthesecalibrationcoefficientsafterthelatestcalibration.Thedefaultsettingis“Disable.”Tomakethefunctioneffective,select“Enable.”
Time
Calibration
Zero
, Slo
pe
a
bc
da: Actual changeb: Zero and slope calculated from
the calibration datac: Zero and slope calculated from
the calibration data and shifted using the latest calibration data
d: Data from calibration
Figure 4.3 Auto correct
n ORP settingsl Limits and timing
Zero High/LowZero (aspot) high and low limits. During calibration, it is checked whether the new zero exceeds these high and low limits. Narrowing the band will prevent bad calibration procedures and calibration of bad sensors, resulting in higher accuracy. The default values should be adjusted to suit the application and the “users” criterion.
Slope High/LowSlope (sensitivity) high and low limits. During calibration, it is checked whether the new slope exceeds these high and low limits. Narrowing the band will prevent bad calibration procedures and calibration of bad sensors, resulting in higher accuracy. The default values should be adjusted to suit the application and the “users” criterion.
Step RangeSet the range over which the stability of a measured value is checked. If variations of a measured value over the stabilization time are within this setpoint, the measured value is judged to have stabilized.
Stabilization timeDuring calibration, the stability of the ORP value is constantly monitored. When variations of the ORP value are within a value set in Step Range over this stabilization time set here, the value is regarded as being stable. If the ORP value does not stabilize within 10 minutes, calibration is aborted.
Calibr. intervalSet the interval in which a new calibration must take place. If the interval set here is exceeded, theinstrumentwillbenotifiedaccordingtothesettingin“Calib.timeexceeded”intheerrorconfiguration.
l Zero/SlopeYou can enter zero and slope values directly.
PH
4

<4. COMMISSIONING OF pH/ORP> 4-8
IM 12A01A02-01E 9th Edition : Mar. 23, 2018-00
4.2.5 Impedance settingsThis screen is used to set the impedance relating to an input impedance check.Input1impedancerepresentsthe“glassmembraneimpedance”ofapHsensor.IncaseofanORP sensor, it represents “metal electrode impedance.” Input 2 impedance stands for “reference impedance.”If you select “Input impedance: Low,” the display moves to the Input impedance screen, enabling you to set the high and low limits.The FLXA202/FLXA21 has an impedance check, which is capable of monitoring the impedance ofvarioussensorsystems.Inorderto“finetune”thisdiagnostictool,itisnecessarytosetituptomatch the sensors used.The system can be set to measure the impedances of glass (input 1 impedance: high) and reference (input 2 impedance: low) electrodes. In applications that tend to leave deposits on the electrodesortoclogthereferencesensorjunction,theimpedancecheck(seterrorconfiguration)on the reference sensor can be used to initiate an alarm, or to initiate the wash cleaning process, if one of the limits is exceeded. Sensors with a liquid earth use this liquid earth in impedance measurement.SensorswithaliquidearththatYokogawacanprovideincludePH8EFP,PH8ERP,PH8EHP,OR8ERG,OR8EFG,etc.InpurewatermeasurementusingPH8EHP,theimpedanceofthesolutiontobemeasuredishigh;settingsontheErrorconfigurationscreenshouldbesettoOffsothatthe“Impedance2toohigh”errorisnotgenerated.Asensorwithoutaliquidearthcannotmeasureimpedance.AllsettingsontheErrorconfigurationscreenshouldbesettoOffsothatno“Impedance1toohigh”or“Impedance2toohigh”errorisgenerated.SensorsnotequippedwithaliquidearththatYokogawacanprovideincludeHA405,HA406,DPA406,DPA405,DPAS405,HF405,HA485,DPA485,etc.This liquid earth refers to a metal pole built into a sensor or connected externally that contacts the solution to be measured and transmits the potential of this solution to the converter.
4.2.6 ConcentrationGenerallypHvaluesarenotconvertedintoconcentrations.Followinglinearconversionisnotsuitable for a lot of measurements.
TheFLXA202/FLXA21iscapableofconvertingameasuredpHvalueintoconcentrationfordisplay. Parameters required for concentration calculation can be arbitrarily set by the user. Those parameters are as follows:Unit: Thedefaultvalueis%.Theunitcanbeselectedfromamongmg/L,g/L,and
ppm.pH: Thedefaultvaluesare0and14pH(0to14).TheyarethepHzeroandspan
required for conversion to concentration.Concentration: Thedefaultvalueare0and100%.ConcentrationforeachpHcanbeset.
ConcentrationcanbeassignedtothepHvaluezeroandspanindividually.
<4. COMMISSIONING OF pH/ORP> 4-9
IM 12A01A02-01E 9th Edition : Mar. 23, 2018-00
4.2.7 Sensor diagnostic settingsThis screen is used to set items relating to sensor diagnostics displayed on the screens invoked
by pressing .Gauges are displayed for only parameters that have been enabled in “Sensor diag. settings.”Parameters set to Disable are provided with a bar display.
ThesettingparametersincludeInput1imp.,Input2imp.,Progresstime,andHeatcycle.Wheninputimpedanceisset“High”(section4.2.5),“FINE”valuecanbechanged.Wheninputimpedanceisset“Low”,its“Highlimit”and“Lowlimit”willbethelimitsfordiagnostic.Itisalsopossibletosetthe“Badlimits”oftheprogresstimeandheatcycleandthe“Heatcycletemp”and“Heatcycletime”oftheheatcycle.
4.3 Output setupThegeneralprocedureistofirstdefinethefunctionoftheoutput,OutputorSimulate.Then,setthe process parameters associated with the output. On the Output, an output of measured value is selected. On the Simulate, a simulation value can be set.And,theparametersforHOLDfunctioncanbesetonthissetting.
l OutputTheoutputsignalisacurrentvaluespecifiedbythefollowingparameters.
Process parameterThe available process parameters depend on the selected “Sensor type” on the Sensor setup and the selected “Measurement” type on the Measurement setup.The output of the selected process parameter is shown as a bar on the bottom of the Main displayortheHomedisplay.Anditsparametersymbol(forexample,PH1orDiff-pH)isshownabove the bar, too. When a selected process parameter is displayed as a measurement value, the top left number or character is turned to be white number or character on black background (for example, or ). (Refer to the section 1.3.)
Process parameters can be selected from among:pH1,Temperature1,andORP1: 1stmodule’smeasuredvaluespH2,Temperature2,andORP2: 2ndmodule’smeasuredvaluesCalculated*1 and Redundant*2: special output based on two inputs*1: Refertothesection4.8,Calculateddatasetup.*2: Refer to the <Redundant system> below.
Calculated data and Redundant system are available when two modules are installed on the instrument.And,thesefunctionsareavailablewhenthe“pH”(ortheparameterincludingpH)or the “ORP” is selected on the “Sensor type” setting and the “Measurement” type setting. The parameter for the 1st module and the 2nd module should be the same. For wrong selection, an error is given.When the process parameter is set at “Calculated” of “Redundant”, don’t change the “Sensor type” or the “Measurement” type. If it is changed, the process parameter will go back to the default.
PH
4

<4. COMMISSIONING OF pH/ORP> 4-10
IM 12A01A02-01E 9th Edition : Mar. 23, 2018-00
<Redundant system>On the Redundant system, when a sensor (Sensor 1) of the 1st module fails, the output is automatically switched to the output of the 2nd module.After repairing the Sensor 1, manual reset of redundant system is necessary to return to the output of 1st module from the output of the 2nd module.
mA mA
mA
R(1) R(2) R(1)
F0503_2.ai
Return mA to Sensor1?
Yes No
Reset redundant system
Sensor 1
Display
Sensor 2
Alive Alive
Alive Alive Alive
Dead DeadAlive
Sensor 1 is dead.(automatic)
Repair sensor
Redundant systemrestart (manual)
If sensor 1 fails, the output is automatically switched to the sensor-2 value.
This display is the example when “Redundant” is selected as a process parameter.
Even if a fault on the sensor 1 is recovered automatically after fault detection, the output will not be switched back automatically and the sensor 2 value will continue to be output.
After repairing sensor 1, reset the backup made by the redundant system. This enables the sensor 1 value to be incorporated in the output.On the Reset redundant system, selection of “Yes” makes the output return to the output of the 1st module.
Output setupmA Output Configure Hold Reset redundant
Figure 4.4 Redundant system
SetupSelect one of the output methods: Linear and Table.Linear: Setthe0%and100%values.Table: Thisallowstheconfigurationofanoutputcurveby21points(5%intervals). (The0%and100%valuesmustbeentered.)
BurnSelectthedesignatedoutputincaseofafaultfromamongOff,Low,andHigh.See“4.4Errorconfiguration”tosettheoutput.Off: Outputdependsonthemeasuredvalue.Low: Outputisfixedto3.6mAHigh:Outputisfixedto22.0mA.
Damping timeThisisthetimetakenforaresponsetoastepinputchangetoreach90%ofthefinalvalue(attenuation time). Set this time in sec.
l SimulateWhenthisfunctionisselected,anoutputoftheinstrumentwillbeafixedcurrentvaluesetin%oftheoutputspan.Theoutputspanrangeis-2.5%to112.5%(3.6mAto22.0mA).When “Simulate” is selected, regardless of hold setting, the output is always simulated value.
<4. COMMISSIONING OF pH/ORP> 4-11
IM 12A01A02-01E 9th Edition : Mar. 23, 2018-00
n Configure HoldOntheConfigureHold,settingsareperformedtoholdofthemAoutputatapresetvalue.(Refertothesection5.4.)Thisisenabledonlyif“mA”is“Output.”During the Commissioning or the Quick Setup, the mA output is automatically held. The preset valuedependsonasettingonthe“Lastorfixed”.
“Last”: The preset value is a value measured just before hold condition.“Fixed”: The preset value is a value set in the “Fixed value mA”. When the “Fixed” is selected, set a mA value in the “Fixed value mA”.
Selectiononthe“HoldduringCalibration/Wash”decidestoactivateordeactivatetheholdfunction automatically during calibration or wash.
“Enabled”: Activation of the automatic hold function“Disabled”: No automatic hold function
Onlywhenthe“PH201G”isselectedontheCommunication,themessageof“HoldduringCalibration/Wash”isdisplayed.Onotherselections,themessageof“HoldduringCalibration”isdisplayed.
4.4 Error configurationInErrorconfiguration,configurethestatusesofvariouserrorcauses.
This allows the system to notify the user of the occurrence of an error according to the status categoriesintheErrorconfiguration.SelectastatuscategoryfromamongOff,Warn.(Warning),andFault.“Fault”automaticallyperformsburn-out.WhenBurnhasbeensettoOff(4.3Outputsetup),onlythe error message is displayed.“Warn.” displays an error message.WhenselectingPH201Ginthecommunicationsetting,makesurethatthe“Failcontact”settingis appropriate.
The settable causes of errors are determined based on the settings of the Sensor setup and Measurement setup, and a status category is set to the causes displayed in the Errors 1/3 to 3/3 screens.
PH
4

<4. COMMISSIONING OF pH/ORP> 4-12
IM 12A01A02-01E 9th Edition : Mar. 23, 2018-00
Table 4.2 Error configuration
Display item Description DefaultpHtoohigh ThepHvalueexceeds16.00. Warn.pHtoolow ThepHvalueislowerthan–2.00. Warn.Temperature too high Measured process temperature is higher than the
maximum limit.Warn.
Temperature too low Measured process temperature is lower than the minimum limit.
Warn.
ORP too high TheORPvalueishigherthan1500mV. OffORP too low TheORPvalueislowerthan–1500mV. OffrHtoohigh TherHvalueishigherthan100. OffrHtoolow TherHvalueislowerthan0. OffMatrixconfig.error The temperature compensation matrix is not set
properly(seeSection4.2.3).Fault
Calib. time exceeded Calibration time exceeds the calibration interval (seeSection4.2.4).
Off
Wash half-time error The response to wash is abnormal. OffImpedance 1 too high The sensor must be checked. OffImpedance 1 too lowImpedance 2 too highImpedance 2 too low
CAUTIONIfcancelinganerrorconfigurationcouldberisky,donotcancelitasadangeroussituationmayresult.
NOTEThe “Impedance 1 too high/too low” and “Impedance 2 too high/too low” error items are displayed intheErrorconfigurationscreen.Ingeneral,forapHsensor,“Impedance1”means“glasselectrode,” and for an ORP sensor, it means “metal electrode.” “Impedance 2” represents the reference electrode in all cases. The “Impedance 1 too high/too low” and “Impedance 2 too high/too low” errors are applied to sensors with a liquid earth. Sensors with a liquid earth include PH8EFP,PH8ERP,PH8EHP,OR8ERG,OR8EFG,etc.Forsensorsnotequippedwithaliquidearth,theseerrorsshouldallbesettoOff;thesesensorsincludeHA405,HA406,DPA406,DPA405,DPAS405,HF405,HA485,DPA485,etc.Moreover,formeasuringasolutionwithlowconductivitysuchaswhenusingapHmeterforpurewater,setthe“Impedance2toohigh”errortoOff.Otherwise,noimpedancecanbedetected.
NOTEWhenORPisspecifiedasasensortypein“Sensorsetup”,andwhenanORPsensor,suchasOR8ERG and OR8EFG, doesn’t have any temperature element, set both of “Temperature too high/low”in“Error”toOffsothatnorelatederroriscaused.Duetotheopeninputoftemperaturesignal, a false error may happen as if temperature goes over a high limit or a low limit.

<4. COMMISSIONING OF pH/ORP> 4-13
IM 12A01A02-01E 9th Edition : Mar. 23, 2018-00
4.5 Logbook configurationIn“Logbookconfiguration,”theuserconfiguresinformationtobesavedtoalogbookorinitializesthe logbooks.Logbooks are used to keep an electronic record of events such as error messages, calibrations, and programmed data changes. By referring to this log, users can, for instance, easily determine maintenance or replacement schedules.In“Logbookconfiguration,”theusercanselect“Off,”“1-1,”or“1-2”foreachitemofinteresttobelogged.(Forsensor2,select“Off,”“2-1,”or“2-2.”)ThiscanbedoneforitemsdisplayedontheSettings logbook 1/3 to 3/3 screens. Assigning 1-1 or 1-2 to each item allows information to be organized and logged in a logbook.
NOTESome events such as power-on are saved into the logbook “1-1” or “2-1”. This logbook may be full earlier. It is recommended that important information be saved into the logbook “1-2” or “2-2”.
For“Eraselogbook”,aspecifiedlogbook“1-1”or“1-2”canbeerasedindividually.When the “Warn if logbook full” is set to “Yes”, a warning is given when the logbook come to near full (maximum 13 pages).
NOTEWhen the logbook gets full, the oldest information is erased automatically.
4.6 Advanced setupAdvanced setup is used to set functions relating to matters other than measurements such as the selection of settings, tag setting, password setting for protecting calibration and commissioning operations, date setting, and communication setting.(“Factorysetup”isforserviceengineersonly;thereisnoitemtobesetbytheuser.)
4.6.1 SettingsIn “Settings,” select an item to be set as the default value from among “No action,” “Load factory settings,” “Save user settings,” and “Load user settings.”When the default values are loaded, the instrument will be restarted. (In the case of “Save user settings,” it will not be restarted.)The following parameters are not included in the defaults:
• Tag• The contents of all logbooks
NOTEWhen the “Save user setting” is only selected, save of the user-set parameters will start at once.
To avoid wrong selection, operation in this Settings must be done by , not by touching the menu message.
PH
4

<4. COMMISSIONING OF pH/ORP> 4-14
IM 12A01A02-01E 9th Edition : Mar. 23, 2018-00
If you select “Load factory settings,” the instrument will be set to the default settings at factory shipment.When this item is selected, a screen prompting whether to restart is displayed. If this is no problem,press“Yes.”Thenthe“Loading…”messageappearsandblinksandloadingisstarted.When the factory settings have been loaded, the instrument will be restarted.When “Save user settings” is selected, the current settings can be saved as the defaults. When this item is selected, the user settings will start to be saved immediately. After saving the
parameters, press or to change the display because this save doesn’t have restart function.If “Load user settings” is selected, the settings saved as user settings can be set as the defaults.When this item is selected, a screen prompting whether to restart is displayed. If this is no problem,press“Yes.”Thenthe“Loading…”messageappearsandblinksandloadingisstarted.When the user settings have been loaded, the instrument will be restarted.
4.6.2 TagAtagprovidesasymbolicreferencetoaninstrumentandisgenerallydefinedtobeuniquethroughout the control system at one plant site. A tag can contain up to 12 alphanumeric characters.ThedefaultvalueisPHorFLXA21-PH.Whentwosensormodulesareinstalled,each module can have their own tag numbers.The tag is displayed at the top of the main and home displays.
4.6.3 PasswordsCalibration and commissioning operations can be separately protected by each password. To protectexecuteoperations,enterapasswordinExecute’sinputfield.Toprotectcommissioningoperations,enterapasswordinCommissioning’sinputfield.Bydefault,bothinputfieldsareempty.Whenapasswordinputfieldisempty,operationisnotpassword-protected.Apasswordcan contain up to 8 characters.
When you set a password, always take a note of it.
When a password is set, input of the password is necessary to enter the password-protected operation. After inputting the password, the display will change to an operator ID input display. When an operator ID is input, its operation is recorded into a logbook. The input of an operator ID isnotnecessarytoentertheoperation.AnoperatorIDcancontainupto4characters.
4.6.4 Date/TimeThe Logbooks and trend graphs use the clock/calendar as a reference. The current date and time is set here. The time display format can be selected from among three types.
4.6.5 CommunicationIn“Communication,”selectthecommunicationsettingfromamongNone,HART,andPH201G.The burn down current value is 3.6 mA.
NOTETomakethechangeof“Communication”valid,turnoffthepowersupplyonce,andreboot.
Inthecaseof“None,”thereisnottheproblemevenifyoudonotchangeitas“HART”ofdefaultvalue.
<4. COMMISSIONING OF pH/ORP> 4-15
IM 12A01A02-01E 9th Edition : Mar. 23, 2018-00
n HARTSelectthismenuwhenHARTcommunication(HART5)ismade.IntheHARTsetupscreen,specifythenetworkaddressandsetupparametersforSV,TV,andFV.(PVislinkedwiththe“processparameter”settingin“Outputsettings”andcannotbechangedhere.)
l Network addressFor 1-to-1 communication, leave the default value [0] unchanged. For multi-drop where multiple HARTdevicesareconnectedonabus,setaddressesin1to15.Inthiscase,themAoutputwillbefixedto4mA.
l PVPVisaparameterselectedforanalogoutput;itcannotbechangedhere.
l SV, TV, FVTheSV,TV,andFVparametersareitemsthattheusermustsetup.Selectableitemsdifferdepending on the sensor type in “Sensor setup” and settings in “Measurement setup.”If blank is selected for a parameter, items below that parameter must all be set to blank. If an item is blank, those below it cannot be set to a status other than blank.
FormoreinformationonHARTcommunication,seetheTechnicalInformation(TI12A01A02-60E) in the attached CD-ROM.
n PH201GSelectthismenuifthePH201Gdistributorisconnectedtotheinstrument.InthePH201Gsetupscreen,makesettingsfor“Holdcontact,”“Failcontact,”and“Washcontact.”
l Hold contactSelect Disabled or Enabled.Whenthisitemisenabled,theoutputwillbeheldaccordingtothesettingof“Holdtype”ontheHoldsetupscreen.
l Fail contactSelect a status from among “Fail + Warn,” “Fail only,” and “Disabled.”Thissettingdependsontheerrorconfiguration.See“4.4Errorconfiguration.”“Fail” corresponds to “Fault.”
PH
4

<4. COMMISSIONING OF pH/ORP> 4-16
IM 12A01A02-01E 9th Edition : Mar. 23, 2018-00
l Wash contactSelect Disabled or Enabled.When this item is enabled, items for a wash can be set on the Wash settings screen.In the Wash settings screen, set the interval time, wash time, and recovery time and setup of various washes.
Interval time: Set the wash interval in hours.Wash time/measure time: Set the wash time in minutes. In a continuous wash, wash time is
replaced by measure time.Recovery time: Set the recovery time in minutes.Manual wash: Select “Disabled” or “Enabled.” When this item is enabled, a wash cycle can be activated manually. On the
Calibration/Wash screen, press the “Start manual wash cycle” to perform a manual wash.
Imp2 wash: Select “Disabled” or “Enabled.” When this item is enabled, a wash cycle can be started if the “Impedance 2
too high” error occurs with respect to the reference electrode.Continuous wash: Select “Disabled” or “Enabled.” A continuous wash cycle is started at the instant when this item is enabled. In a continuous wash, the “Measure time” and “Interval time” are reversed
(seeFigure4.5).
Tw Tr
Tint
Tw Tr
Tint
Tw Tr
Tint Tint
Tw’ Tw TrTw’
F050605_2.ai
Tint: Interval timeTw: Wash timeTr: Recovery time
Tint: Interval timeTw: Measure timeTw’: Wash timeTr: Recovery time
When a continuous wash is disabled
When a continuous wash is enabled
Figure 4.5
The instrument has a function for checking whether measurements are normally made after wash, allowing you to check a sensor response.The wash recovery check is performed by making use of the time to recover half the wash-cycle pHchange.Thehalfthewash-cyclepHchangerecoverytimereplacestherelaxationtimebytherecovery time.WhethertoconductthewashrecoverycheckcanbesetontheErrorsettings2/3screen.Halfthewash-cyclepHchangereferstohalfthevalue(1/2∆pH)ofthedifference(∆pH)betweenthepHvalueduringnormalmeasurementofanexampleinFigure4.6andthepHvaluedetectedduringwash.IfthepHvalueduringwashisgreaterthan1/2∆pHwhen1/3tRhaselapsed,theelectrodeisassumedtobegood.Ifitissmallerthan1/2∆pH,thentheelectrodeisassumedtobebad.
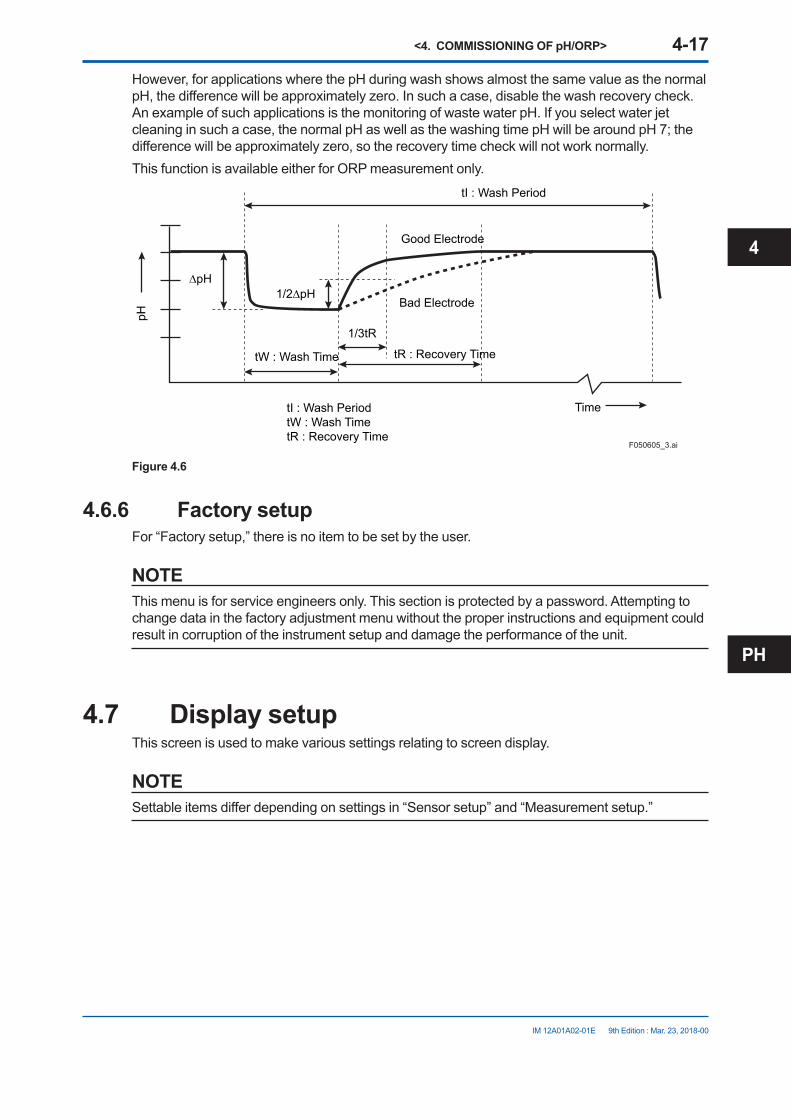
<4. COMMISSIONING OF pH/ORP> 4-17
IM 12A01A02-01E 9th Edition : Mar. 23, 2018-00
However,forapplicationswherethepHduringwashshowsalmostthesamevalueasthenormalpH,thedifferencewillbeapproximatelyzero.Insuchacase,disablethewashrecoverycheck.AnexampleofsuchapplicationsisthemonitoringofwastewaterpH.Ifyouselectwaterjetcleaninginsuchacase,thenormalpHaswellasthewashingtimepHwillbearoundpH7;thedifferencewillbeapproximatelyzero,sotherecoverytimecheckwillnotworknormally.This function is available either for ORP measurement only.
pH
Time
Good Electrode
Bad Electrode
tR : Recovery TimetW : Wash Time
tI : Wash Period
1/2∆pH∆pH
1/3tR
tI : Wash Period tW : Wash TimetR : Recovery Time
F050605_3.ai
Figure 4.6
4.6.6 Factory setupFor “Factory setup,” there is no item to be set by the user.
NOTEThis menu is for service engineers only. This section is protected by a password. Attempting to change data in the factory adjustment menu without the proper instructions and equipment could result in corruption of the instrument setup and damage the performance of the unit.
4.7 Display setupThis screen is used to make various settings relating to screen display.
NOTESettableitemsdifferdependingonsettingsin“Sensorsetup”and“Measurementsetup.”
PH
4

<4. COMMISSIONING OF pH/ORP> 4-18
IM 12A01A02-01E 9th Edition : Mar. 23, 2018-00
4.7.1 Main display (Dual display, Individual display)
Main display Trend Auto Return Ad.just contrast MONITOR display
Display setup Dual display Individual display Trend Auto Return Adjust contrast MONITOR display
or
Display setup
Figure 4.7 Display setup screens for a single module (left) and two modules (right)
l Main displayWhen one module is installed on the instrument, only the Main display is available.Three measurement values can be set to display on the Main display as a primary value (1st line), a second value (2nd line) and a third value (3rd line) respectively.On the “Additional text”, a text of up to 12 alphanumeric characters can be assigned to each measurement value.Additional texts are displayed on the Main display, and are useful for identifying measurements. Insomecases,notall12characterscanbedisplayedduetotheletters;checkthetextsdisplayed on the Main display after setting. If a part of the text is missing, adjust the number of characters.
l Dual displayThis screen is used to set items to be displayed in the top part (1st row) and bottom part (2nd row)oftheHomedisplay.Thesesettingsareavailablewhentwosensorsareinstalledintheinstrument.Whenthe“Empty”isselectedforthe2ndrow,theHomedisplaycannotbedisplayed.
l Individual displayWhen two modules are installed on the instrument, display items on the Main display for each module can be set on these settings.Onthe“PH1display”or“PH2display”screen,threemeasurementvaluescanbesettodisplayon each Main display as a primary value (1st line), a second value (2nd line) and a third value (3rd line) respectively.On the “Additional text”, a text of up to 12 alphanumeric characters can be assigned to each measurement value.Additional texts are displayed on the Main display, and are useful for identifying measurements. Insomecases,notall12characterscanbedisplayedduetotheletters;checkthetextsdisplayed on the Main display after setting. If a part of the text is missing, adjust the number of characters.

<4. COMMISSIONING OF pH/ORP> 4-19
IM 12A01A02-01E 9th Edition : Mar. 23, 2018-00
4.7.2 TrendThis screen is used to make settings for the Trend Graph Screen.Set the process parameters to be displayed for each trend. They can be set for the 1st to 3rd trends. When all three process parameters are set “Empty”, there is no trend display (no trend button).
l X-axis: TimingSelect the X-axis timing’s time span on the trend graph display from a list.
l Y-axis: LimitsSet the Y-axis high and low limits on the trend graph display on a Trend screen basis.
NOTEUpdating the trend display setup resets the current trend graph and starts a new one.
4.7.3 Auto ReturnWhen no operation is performed for the time set in “Auto Return”, the display returns to the Monitor display (or to the Main display when the MONITOR display is disabled) and the analyzer returns to a normal measuring mode. (When the Trend display is selected, the Auto Return doesn’t work.)Select the time from among Disable, 10 min, and 60 min. When the Auto Return function is not used, select “Disable.”
NOTEA default is “10 min”. When maintenance like a calibration that may take much time is performed, “60 min” or “Disable” is recommended to be selected.
4.7.4 Adjust contrastThe LCD screen contrast can be adjusted.Pressingthekeysadjuststhecontrastin11levelsfrom+5to–5(includingthedefaultvalueof “0”).
4.7.5 MONITOR displaySelect “Enable” so that the Monitor display becomes available. A default is “Enable”.DuringHold/Washconditionandawarning/faultcondition,theMaindisplayortheHomedisplayis displayed to indicate the condition.
PH
4
<4. COMMISSIONING OF pH/ORP> 4-20
IM 12A01A02-01E 9th Edition : Mar. 23, 2018-00
4.8 Calculated data setupOn this setup, parameters can be set for calculated data.Whentwomodulesareinstalledontheinstrument,thecalculateddatacanbesetforpHvaluesor ORP values measured by two sensors.Select“Differential”or“Average”ontheCalculateddatasetupscreen.Differential:Adifferencebetweenmeasurementvaluesmeasuredbyasensor1andsensor2
is an output as a calculated result.(Diff) (valueofthesensor1)–(valueofthesensor2)Average: The average of measurement values measured by a sensor 1 and sensor 2 is an
output as a calculated result.(Ave) (value of the sensor 1 + value of the sensor 2) / 2
Todisplaythecalculatedresult,select“Calculated”ontheDualdisplayscreen(Section4.7.1).(Thesettingonthe“Individualdisplay”hasnoeffect.)While displaying a calculated data, measurement value of the sensor 1 or sensor 2 can be
checked on the each sensor’s display with pressing Sensor
1 or Sensor
2 at the lower right on the Main display.
Pressing returns the display to the original calculated data display.A calculated data can be set as a process parameter on the “mA (Output)” setup screen (Section 4.3).

<5. CALIBRATION OF pH/ORP> 5-1
IM 12A01A02-01E 9th Edition : Mar. 23, 2018-00
5. CALIBRATION OF pH/ORPBeforepHmeasurement,calibratethepHsensorwiththestandardsolution.Before ORP measurement, check the electrode as a part of regular maintenance.
NOTEA default is “10 min” for “Auto Return”. When maintenance like a calibration that may take much time is performed, “60 min” or “Disable” is recommended to be selected. (Refer to the section 4.7.3.)
CalibrationExecute: Calibration HOLD Temporary output
Setup: Commissioning Change language Start Quick Setup
Execute & Setup Calibration pH pH ORP Temperature
Manual Automatic Sample Temperature calibration
or
Only when “pH + ORP” is selected on the Sensor setup screen
Figure 5.1 Calibration
ThecalibrationitemsincludepH,ORP,rH,andTemperature.The item to be calibrated is determined according to the settings made in the Sensor setup and Measurement setup in Commissioning.
Press toselectExecute:Calibration,choosetheitemtobecalibrated,configurethecalibration settings, then perform calibration.
NOTENotethefollowingwhenperformingcalibrationwithbuffersolutions.1. Before starting a calibration, make sure the electrode system is properly cleaned and
the electrodes are fully functional. They must then be rinsed with clean water to avoid contamination of the calibration solution(s).
2. Alwaysusefreshbuffersolutiontoavoidtheriskofintroducingerrorsfromcontaminatedoroldsolutions.Bufferssuppliedasliquidshavealimitedshelflife,especiallyalkalinebuffers,which absorb CO2 from the air.
3. YokogawastronglyrecommendsNIST/DIN19266bufferstandardsforthebestaccuracyandbuffercapacity.Commerciallyadjustedbuffers(e.g.,pH7.00,9.00or10.00)areacompromise as a standard, and are often supplied without a temperature dependency curve. Their stability will never be as good as NIST (JIS equivalent) solutions.
Alwaysensurethatthesensorsareproperlyconditioned,cleanandfilledwiththecorrectelectrolyte solution (if appropriate) before starting a calibration. Refer to the sensor instructions for details.
PH
5

<5. CALIBRATION OF pH/ORP> 5-2
IM 12A01A02-01E 9th Edition : Mar. 23, 2018-00
5.1 pH calibrationTherearetheManual,Automatic,andSamplemodesofpHcalibration.
5.1.1 Manual calibrationTheunitisadjustedtomatchthevalueofthebufferstandardsoraprocesssolutionwithaknownpHvalue(buffersolution).TheuserdeterminesthepHvalue,temperatureinfluence,andstability.Select the calibration type from among [zero/slope], [zero/slope/ITP(3point)], and [zero/slope1,2 (3point)].
Calibrationisperformedstepwise;followthepromptsdisplayedonthescreen.A stability check is conducted at each measurement point. Proceed to the next step only after the reading has stabilized.Atcalibration,weadviseleavingthesensorsforthreetofiveminutesinthebuffersolutionbeforeproceeding to the next step even when the reading has stabilized. This will give reliable and accurate calibration results.
NOTEWhen a sensor or an electrode is exchanged or replaced, sensor wellness data should be reset.When a sensor is replaced, the replacement can be recorded manually into a logbook. (Refer to thefigure3.9.)
l zero/slopeThis calibration type is one-point or two-point calibration.One-point calibration performs the zero adjustment only. Two-point calibration performs the zero and slope adjustments.
l zero/slope/ITP(3point)This calibration type is ITP-type three-point calibration.IfITPdoesnothavepH7,three-pointcalibrationisperformedtoobtainthezero(asymmetry),slope (sensitivity), and ITP (isothermal point) for calibration.
Limitations• ThreedifferentbuffersolutionswhosedifferenceinpHvaluebetweenbuffersolutionsis1
pHormoreshouldbeused. (1stbuffer<2ndbuffer<3rdbufferor1stbuffer>2ndbuffer>3rdbuffer)• The2ndbuffersolutionshouldbepH7±2.• Thetemperaturedifferencebetweenthe2ndand3rdbuffersolutionsshouldbe5ºCorless.
Thetemperaturesofthe2ndand3rdbuffersolutionsshouldbeatleast20ºChigherorlowerthanthetemperatureofthe1stbuffersolution.
• TocalculatethepHvalueofthe3rdbuffersolution(pH3cal),insertthepHandtemperaturevaluesofthe1stand2ndbuffersolutionsandthetemperaturevalueofthe3rdbuffersolution into the following equation.
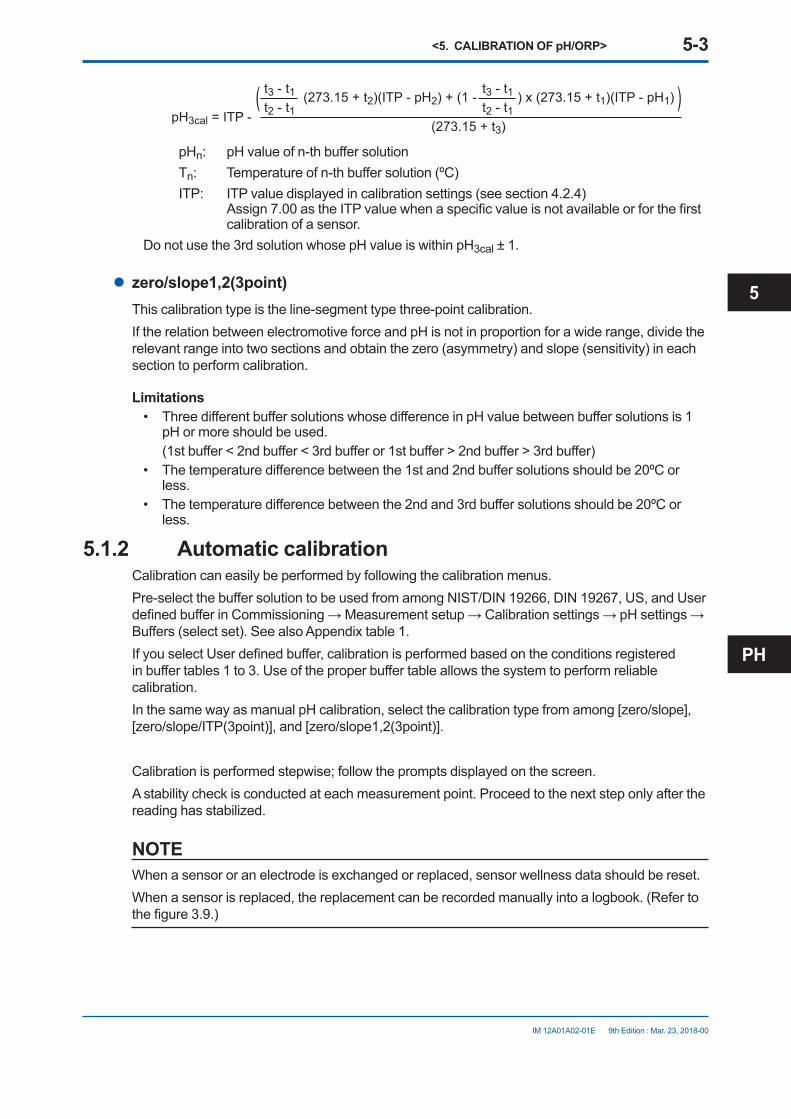
<5. CALIBRATION OF pH/ORP> 5-3
IM 12A01A02-01E 9th Edition : Mar. 23, 2018-00
pH3cal = ITP - (273.15 + t2)(ITP - pH2) + (1 - ) x (273.15 + t1)(ITP - pH1)
(273.15 + t3)
t3 - t1t2 - t1
( )t3 - t1t2 - t1
pHn: pHvalueofn-thbuffersolution Tn: Temperatureofn-thbuffersolution(ºC) ITP: ITPvaluedisplayedincalibrationsettings(seesection4.2.4)
Assign7.00astheITPvaluewhenaspecificvalueisnotavailableorforthefirst calibration of a sensor.
Donotusethe3rdsolutionwhosepHvalueiswithinpH3cal±1.
l zero/slope1,2(3point)This calibration type is the line-segment type three-point calibration.IftherelationbetweenelectromotiveforceandpHisnotinproportionforawiderange,dividetherelevant range into two sections and obtain the zero (asymmetry) and slope (sensitivity) in each section to perform calibration.
Limitations• ThreedifferentbuffersolutionswhosedifferenceinpHvaluebetweenbuffersolutionsis1
pHormoreshouldbeused. (1stbuffer<2ndbuffer<3rdbufferor1stbuffer>2ndbuffer>3rdbuffer)• Thetemperaturedifferencebetweenthe1stand2ndbuffersolutionsshouldbe20ºCor
less.• Thetemperaturedifferencebetweenthe2ndand3rdbuffersolutionsshouldbe20ºCor
less.
5.1.2 Automatic calibrationCalibration can easily be performed by following the calibration menus.Pre-selectthebuffersolutiontobeusedfromamongNIST/DIN19266,DIN19267,US,andUserdefinedbufferinCommissioning→Measurementsetup→Calibrationsettings→pHsettings→Buffers(selectset).SeealsoAppendixtable1.IfyouselectUserdefinedbuffer,calibrationisperformedbasedontheconditionsregisteredinbuffertables1to3.Useoftheproperbuffertableallowsthesystemtoperformreliablecalibration.InthesamewayasmanualpHcalibration,selectthecalibrationtypefromamong[zero/slope], [zero/slope/ITP(3point)], and [zero/slope1,2(3point)].
Calibrationisperformedstepwise;followthepromptsdisplayedonthescreen.A stability check is conducted at each measurement point. Proceed to the next step only after the reading has stabilized.
NOTEWhen a sensor or an electrode is exchanged or replaced, sensor wellness data should be reset.When a sensor is replaced, the replacement can be recorded manually into a logbook. (Refer to thefigure3.9.)
PH
5

<5. CALIBRATION OF pH/ORP> 5-4
IM 12A01A02-01E 9th Edition : Mar. 23, 2018-00
l zero/slopeSelectthesolutionthatworkswiththe“buffersolution”selectedincalibrationsettingsandperform calibration by following the prompts on the screen.
l zero/slope/ITP(3point)Calibration is performed in the sequence of the sequence selection menu (Table 5.1) of the solutionthatworkswiththe“buffersolution”selectedincalibrationsettings.Performcalibrationby following the prompts on the screen.
Limitations• ThreedifferentbuffersolutionswhosedifferenceinpHvaluebetweenbuffersolutionsis1
pHormoreshouldbeused. (1stbuffer<2ndbuffer<3rdbufferor1stbuffer>2ndbuffer>3rdbuffer)• The2ndbuffersolutioninthebuffertableintheFreeprogrammablescreenshouldbepH7
±2(at25ºC).• Either of the following conditions should be met.-Thetemperaturedifferencebetweenthe1stand2ndbuffersolutionsshouldbe5ºCorless.Thetemperatureofthe1stand2ndbuffersolutionsisatleast20ºChigherorlowerthanthetemperatureofthe3rdbuffersolution.-Thetemperaturedifferencebetweenthe2ndand3rdbuffersolutionsshouldbe5ºCorless.Thetemperatureofthe2ndand3rdbuffersolutionsisatleast20ºChigherorlowerthanthetemperatureofthe1stbuffersolution.
l zero/slope1,2(3point)Calibration is performed in the sequence of the sequence selection menu (Table 5.1) of the solutionthatworkswiththe“buffersolution”selectedincalibrationsettings.Performcalibrationby following the prompts on the screen.
Limitations• ThreedifferentbuffersolutionswhosedifferenceinpHvaluebetweenbuffersolutionsis1
pHormoreshouldbeused. (1stbuffer<2ndbuffer<3rdbufferor1stbuffer>2ndbuffer>3rdbuffer)• Thetemperaturedifferencebetweenthe1stand2ndbuffersolutionsshouldbe20ºCor
less.• Thetemperaturedifferencebetweenthe2ndand3rdbuffersolutionsshouldbe20ºCor
less.
Table 5.1 Selection of Buffer Solutions in Three-point Calibration
Buffer settings Buffer sequence selection menus NIST/DIN 19266 PH1.7→PH6.9→PH9.2
PH4.0→PH6.9→PH9.2PH9.2→PH6.9→PH1.7PH9.2→PH6.9→PH4.0
DIN 19267 PH4.7→PH6.8→PH9.2PH9.2→PH6.8→PH4.7
US PH4.0→PH7.0→PH10.0PH10.0→PH7.0→PH4.0
Userdefinedbuffer table1→table2→table3able3→table2→table1

<5. CALIBRATION OF pH/ORP> 5-5
IM 12A01A02-01E 9th Edition : Mar. 23, 2018-00
5.1.3 Sample calibrationA sample calibration is a single-point calibration for only the zero (asymmetric). It adjusts the recorded reading to a collected sample value. Press [Take Sample] to record a collected sample value in memory. Re-enter the Sample Cal. screen and press [Start calibration] to perform a sample calibration. This updates the recorded data.
NOTEWhen a sensor or an electrode is exchanged or replaced, sensor wellness data should be reset.When a sensor is replaced, the replacement can be recorded manually into a logbook. (Refer to thefigure3.9.)
5.2 Temperature calibrationFor the most accurate measurements, it is important to have a precise temperature measurement. Measure the temperature with a high-precision thermometer and adjust the sensor reading accordingly. For best accuracy, this should be done as near to the normal operating temperature as possible.
5.3 ORP calibration (rH calibration)ThecalibrationmodesforORPorrHare“Manual”and“Sample”.NoautomaticcalibrationfeatureisavailableinanORPorrHcalibration.
Calibration is performed stepwise. Follow the prompts displayed on the screen.A stability check is made at each measurement point. Proceed to the next step only after the reading has stabilized.
NOTEWhen a sensor or an electrode is exchanged or replaced, sensor wellness data should be reset.When a sensor is replaced, the replacement can be recorded manually into a logbook. (Refer to thefigure3.9.)
PH
5
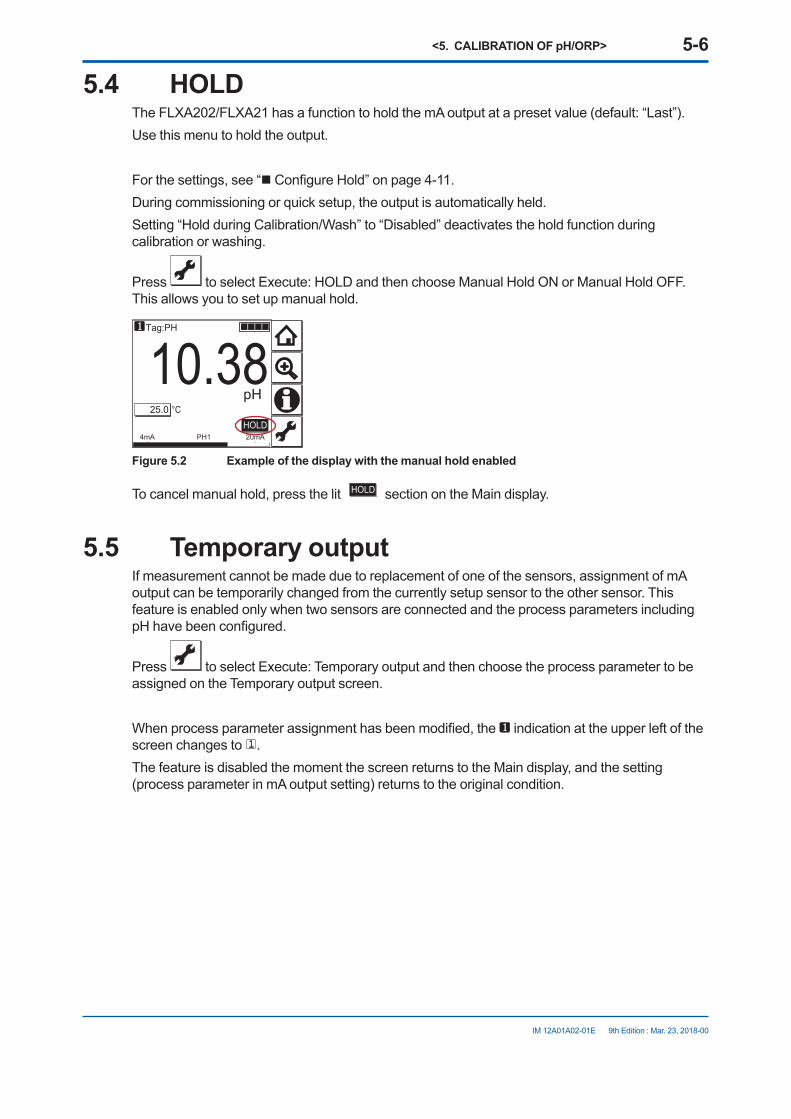
<5. CALIBRATION OF pH/ORP> 5-6
IM 12A01A02-01E 9th Edition : Mar. 23, 2018-00
5.4 HOLDThe FLXA202/FLXA21 has a function to hold the mA output at a preset value (default: “Last”).Use this menu to hold the output.
For the settings, see “nConfigureHold”onpage4-11.During commissioning or quick setup, the output is automatically held.Setting“HoldduringCalibration/Wash”to“Disabled”deactivatestheholdfunctionduringcalibration or washing.
Press toselectExecute:HOLDandthenchooseManualHoldONorManualHoldOFF.This allows you to set up manual hold.
10.38Tag:PH
25.0
4mA 20mAPH1
°CpH
HOLD
Figure 5.2 Example of the display with the manual hold enabled
To cancel manual hold, press the lit HOLD section on the Main display.
5.5 Temporary outputIf measurement cannot be made due to replacement of one of the sensors, assignment of mA output can be temporarily changed from the currently setup sensor to the other sensor. This feature is enabled only when two sensors are connected and the process parameters including pHhavebeenconfigured.
Press to select Execute: Temporary output and then choose the process parameter to be assigned on the Temporary output screen.
Whenprocessparameterassignmenthasbeenmodified,the indication at the upper left of the screen changes to .The feature is disabled the moment the screen returns to the Main display, and the setting (process parameter in mA output setting) returns to the original condition.
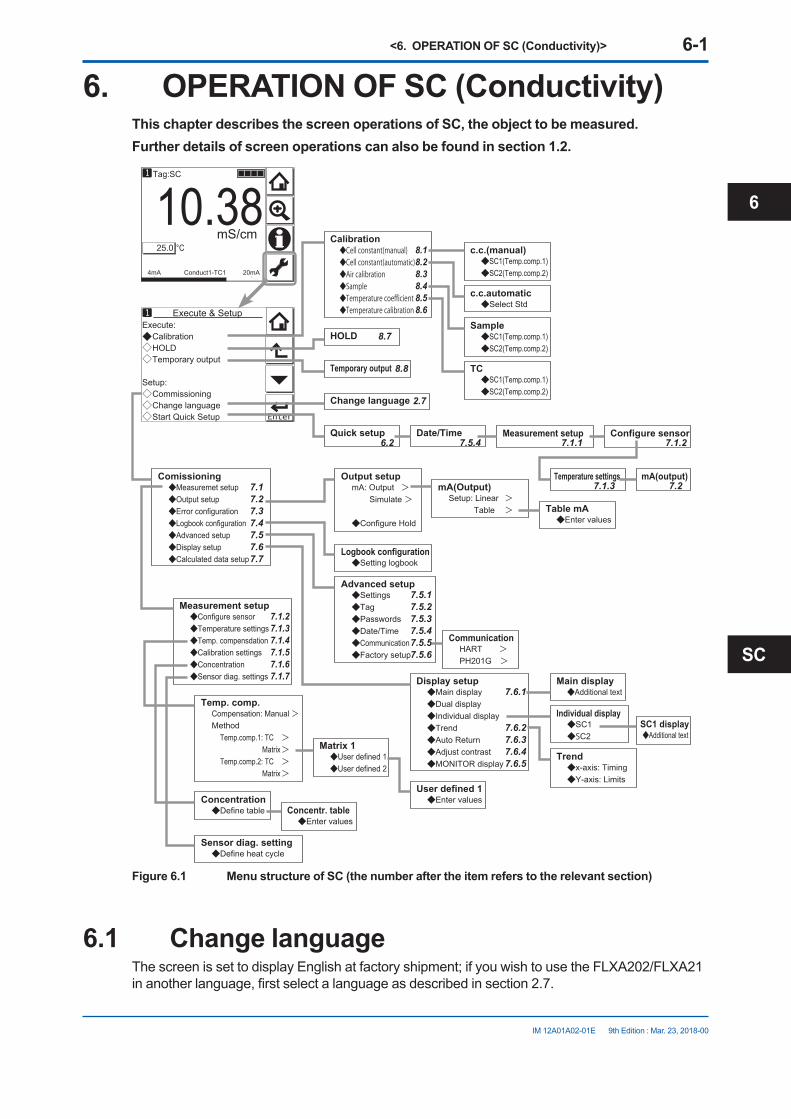
<6. OPERATION OF SC (Conductivity)> 6-1
IM 12A01A02-01E 9th Edition : Mar. 23, 2018-00
6. OPERATION OF SC (Conductivity)This chapter describes the screen operations of SC, the object to be measured.Further details of screen operations can also be found in section 1.2.
10.38Tag:SC
25.0
4mA 20mAConduct1-TC1
°CmS/cm
Execute: Calibration HOLD Temporary output
Setup: Commissioning Change language Start Quick Setup
Execute & SetupSelect Std
c.c.automatic
SC1(Temp.comp.1)SC2(Temp.comp.2)
Sample
SC1(Temp.comp.1)SC2(Temp.comp.2)
c.c.(manual)
SC1(Temp.comp.1)SC2(Temp.comp.2)
TC
Cell constant(manual)Cell constant(automatic)Air calibrationSampleTemperature coefficientTemperature calibration
Configure sensorMeasurement setup
Temperature settings mA(output)
Main displayDual displayIndividual displayTrendAuto ReturnAdjust contrastMONITOR display
Display setupAdditional text
Main display
Additional textSC1 display
x-axis: TimingY-axis: Limits
Trend
SC1SC2
Individual display
Enter valuesConcentr. table
Configure sensorTemperature settingsTemp. compensdationCalibration settingsConcentrationSensor diag. settings
Measurement setup
Compensation: Manual >Method Temp.comp.1: TC > Matrix > Temp.comp.2: TC > Matrix >
Temp. comp.
Define heat cycleSensor diag. setting
Define tableConcentration
User defined 1User defined 2
Matrix 1
Enter valuesUser defined 1
Calibration
Quick setup Date/Time
Change language
Temporary output
HOLD
Measuremet setupOutput setupError configurationLogbook configurationAdvanced setupDisplay setupCalculated data setup
Comissioning
Enter valuesTable mA
Setup: Linear > Table >
mA(Output)mA: Output > Simulate >
Configure Hold
Output setup
HART >PH201G >
Communication
Setting logbookLogbook configuration
SettingsTagPasswordsDate/TimeCommunicationFactory setup
Advanced setup
7.17.27.37.47.57.67.7
2.7
6.2 7.5.4 7.1.27.1.1
7.1.3 7.2
8.18.28.38.48.58.6
8.7
8.8
7.1.27.1.37.1.47.1.57.1.67.1.7
7.6.1
7.6.27.6.37.6.47.6.5
7.5.17.5.27.5.37.5.47.5.57.5.6
Figure 6.1 Menu structure of SC (the number after the item refers to the relevant section)
6.1 Change languageThescreenissettodisplayEnglishatfactoryshipment;ifyouwishtousetheFLXA202/FLXA21inanotherlanguage,firstselectalanguageasdescribedinsection2.7.
SC
6

<6. OPERATION OF SC (Conductivity)> 6-2
IM 12A01A02-01E 9th Edition : Mar. 23, 2018-00
6.2 Quick setupTheQuicksetupscreenisusedtosetupthebasicitemsyouwanttosetupfirst,suchasthedate/time and sensor settings. The detailed settings are described in chapter 8, Commissioning.YoumayleavetheQuicksetupnowandreturntoitlater;however,itisrecommendedtoperformthequicksetupfirst.Each time the FLXA202/FLXA21 is started up, this screen is displayed. If it is not necessary to
change the setup, press No or .
NOTEWhen no operation is performed for 10 minutes or 60 minutes (depending on the setting of “Auto Return”), the display except Trend display automatically changes to the Monitor display (or to the MaindisplayortheHomedisplaywhentheMONITORdisplayisdisabled).

<6. OPERATION OF SC (Conductivity)> 6-3
IM 12A01A02-01E 9th Edition : Mar. 23, 2018-00
Temp.element Pt1000
Unit °C
Next
Start quick setup?
Yes No
Chanage language
Quick setup
Format YYYY/MM/DD
Date 2010/03/03
Time 17:04:07
Date/Time
Process parameter Conduct1-TC1
0% value 0.000 nS/cm100% value 500.0 µS/cm
Finish
mA(output)
Temperature settings
Measure Conductivity
Next
Measurement setup
Sensor type 2-electrodeMeasuring unit /cmCell constant 0.1000 /cm(factory)
Next
Configure sensor
°C°F
ConductivityResistitivityConcentrationConduct.+Concenter.
YYYY/MM/DDMM/DD/YYYYDD/MM/YYYY /cm
/m
2-electrode4-electrode
Pt1000Pt100Ni1008k55Pb36(JIS6k)
Next
NextNext
Finish
Next
Monitor display
Conduct1-TC1Temperature1Concent1-TC1Concent1-TC2Conduct1-TC2Resist1-TC1Resist1-TC2Conduct2-TC1Temperature2Conduct2-TC2
*1
*1: If two sensors are connected, the second sensor can also be set up.
Figure 6.2 Quick setup
n Date/TimeThe date display format can be selected from among the three types.Enter the date or time of day by using the numerical keys.Fordetails,seesection7.5.4.
n Measurement setupSelect a suitable measurement parameter from among those displayed and set it up.Measurement parameter setup can be made only when “SC” is selected on the Sensor setup screen.For details, see section 7.1.1.
SC
6
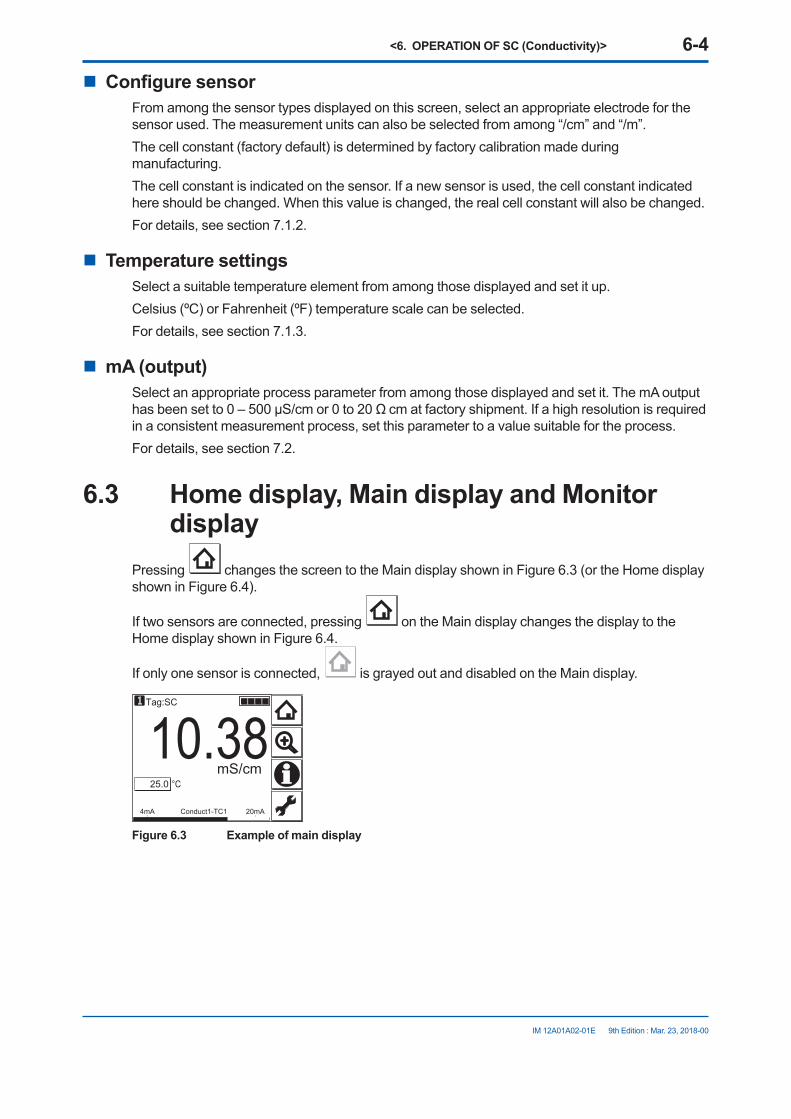
<6. OPERATION OF SC (Conductivity)> 6-4
IM 12A01A02-01E 9th Edition : Mar. 23, 2018-00
n Configure sensorFrom among the sensor types displayed on this screen, select an appropriate electrode for the sensor used. The measurement units can also be selected from among “/cm” and “/m”.The cell constant (factory default) is determined by factory calibration made during manufacturing.The cell constant is indicated on the sensor. If a new sensor is used, the cell constant indicated here should be changed. When this value is changed, the real cell constant will also be changed.For details, see section 7.1.2.
n Temperature settingsSelect a suitable temperature element from among those displayed and set it up.Celsius (ºC) or Fahrenheit (ºF) temperature scale can be selected.For details, see section 7.1.3.
n mA (output)Select an appropriate process parameter from among those displayed and set it. The mA output hasbeensetto0–500µS/cmor0to20Ω cm at factory shipment. If a high resolution is required in a consistent measurement process, set this parameter to a value suitable for the process.For details, see section 7.2.
6.3 Home display, Main display and Monitor display
Pressing changes the screen to the Main display shown in Figure 6.3(ortheHomedisplayshowninFigure6.4).
If two sensors are connected, pressing on the Main display changes the display to the HomedisplayshowninFigure6.4.
If only one sensor is connected, is grayed out and disabled on the Main display.
10.38Tag:SC
25.0
4mA 20mAConduct1-TC1
°CmS/cm
Figure 6.3 Example of main display

<6. OPERATION OF SC (Conductivity)> 6-5
IM 12A01A02-01E 9th Edition : Mar. 23, 2018-00
6.35Tag:SC24.9
4mA 20mAConduct1-TC1
°CmS/cm
Tag:SC25.0 °C
mS/cm
10.38
Figure 6.4 Example of home display
OntheHomedisplay,pressing of the 1st sensor (top) or 2nd sensor (bottom) causes the display of the selected sensor to appear on the Main display.On the Main display, pressing of the 2nd or 3rd display item causes the 1st display item to be replaced by the selected item.
NOTEMeasuredvaluestobedisplayedinthe1stto3rddisplayitemsdependontheuserdefinition(see section 7.6.1). In the default condition, the 1st display item is conductivity, the 2nd display item is temperature, and the 3rd display item is empty.
When the MONITOR display is enabled (see section 7.6.5), pressing the 1st display item on the home display or the main display changes the display to the Monitor display with the enlarged font of the measured value.
6.35Tag:SC
24.9
4mA 20mAConduct1-TC1
°C24.40 mS/cm
mS/cm
Tag:SC25.0 °C19.00 mS/cm
mS/cm
10.38
10.38Tag:SC
19.0025.0
mS/cm4mA 20mAConduct1-TC1
°CmS/cm
25.0Tag:SC
19.0010.38
mS/cm4mA 20mAConduct1-TC1
mS/cm°C
19.00Tag:SC
10.3825.0
mS/cm4mA 20mAConduct1-TC1
°CmS/cm
2nd display itemMain display
Home display
3rd display item
1st display item
6.35Tag:SC
24.4024.9
mS/cm4mA 20mAConduct2-TC2
°CmS/cm
(When the MONITOR display is disabled)
Monitor display
10.38mS/cm 6.35
mS/cm
Figure 6.5 Change Display
SC
6
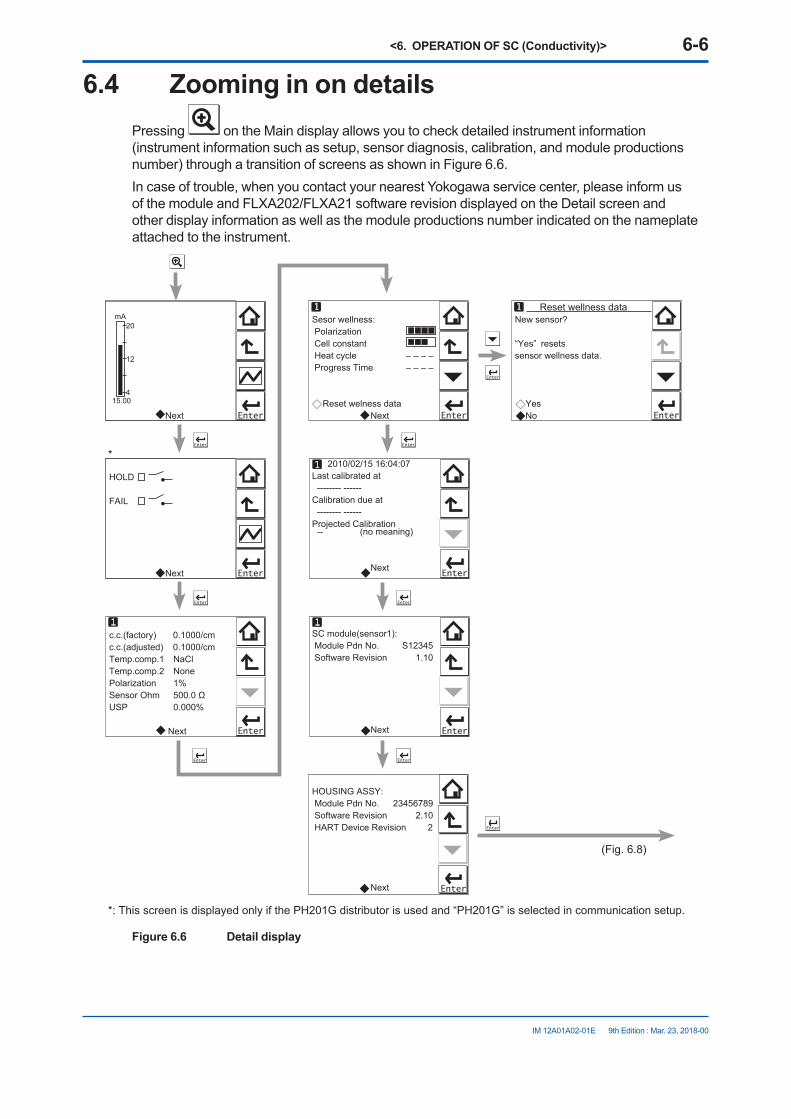
<6. OPERATION OF SC (Conductivity)> 6-6
IM 12A01A02-01E 9th Edition : Mar. 23, 2018-00
6.4 Zooming in on detailsPressing on the Main display allows you to check detailed instrument information (instrument information such as setup, sensor diagnosis, calibration, and module productions number) through a transition of screens as shown in Figure 6.6.In case of trouble, when you contact your nearest Yokogawa service center, please inform us of the module and FLXA202/FLXA21 software revision displayed on the Detail screen and other display information as well as the module productions number indicated on the nameplate attached to the instrument.
Next
20
12
4
mA
15.00
New sensor?
“Yes” resetssensor wellness data.
Yes No
Reset wellness data
HOLD
FAIL
Next
c.c.(factory) 0.1000/cmc.c.(adjusted) 0.1000/cmTemp.comp.1 NaClTemp.comp.2 NonePolarization 1%Sensor Ohm 500.0 ΩUSP 0.000%
Next
Sesor wellness: Polarization Cell constant Heat cycle – – – – Progress Time – – – –
Reset welness data Next
2010/02/15 16:04:07Last calibrated at -------- ------Calibration due at -------- ------Projected Calibration -- (no meaning)
Next
SC module(sensor1): Module Pdn No. S12345 Software Revision 1.10
Next
HOUSING ASSY: Module Pdn No. 23456789 Software Revision 2.10 HART Device Revision 2
Next
(Fig. 6.8)
*: This screen is displayed only if the PH201G distributor is used and “PH201G” is selected in communication setup.
*
Figure 6.6 Detail display
<6. OPERATION OF SC (Conductivity)> 6-7
IM 12A01A02-01E 9th Edition : Mar. 23, 2018-00
n Current output mA=currentoutputinmA.TherangeandfunctionofthismAoutputcanbesetinCommissioning→Outputsetup→mA.For details, see section 7.2.
n Contact statusThisscreenisdisplayedonlyifthePH201Gdistributorisusedand“PH201G”isselectedincommunication setup.
n c.c. (factory)This parameter displays the cell constant (factory setting).The cell constant (factory setting) is determined by factory calibration made during sensor manufacturing.ThisvaluecanbesetinCommissioning→Measurementsetup→Sensorsetup.The cell constant is indicated on the sensor or cable label.
n c.c. (adjusted)This parameter displays the cell constant (adjusted).The cell constant (adjusted) is a cell constant that has been calibrated and is set by calibration action.When the system’s cell constant is adjusted on-line by calibration using a process solution or buffersolution,anewcellconstantisloggedhere.Thedifferencebetweenthisvalueandthedefaultvaluesetatfactoryshipmentwillnotbelarge.Ifthereisalargedifferencebetweenthem,check whether the sensor is broken or contaminated.
n Temp. comp. 1This parameter shows the temperature compensation method for 1st measurement. The setting ismadeinCommissioning→Measurementsetup→Temp.comp.
n Temp. comp. 2This parameter shows the temperature compensation method for 2nd measurement. The setting ismadeinCommissioning→Measurementsetup→Temp.comp.2nd measurement does not imply that two measurements can be made individually, but it means thattwotypesofcompensationmethodscanbeconfigured,whichenablestwophasestobemonitored accurately in the same process. An example is monitoring the switching between process and washing solutions.
n PolarizationThis parameter indicates the degree of polarization of the sensor. It is an index of the degree of sensor contamination (adherents). The greater the value, the more the polarization has progressed. If the value is high, maintenance should be performed on the sensor as soon as possible.
n Sensor OhmThis parameter represents the non-compensated resistance of the sensor.
n USPUSP stands for United States Pharmacopeia and indicates the margin of safety for the water for injection (WFI) conductivity at each temperature as a percentage.
SC
6

<6. OPERATION OF SC (Conductivity)> 6-8
IM 12A01A02-01E 9th Edition : Mar. 23, 2018-00
n Sensor wellnessAt the Sensor wellness window, the soundness of a module is displayed. A larger number of n in each gauge indicates that the parameter concerned is sound. A gauge is indicated for only those parameters whose sensor wellness setting is “enabled,” while a bar (----) is displayed if the sensor wellness setting is “disabled.”SensorwellnesssetupcanbemadeinCommissioning→Measurementsetup→Sensordiag.settings. For details, see section 7.1.7.The “Reset wellness data” button can reset wellness data.When a sensor is exchanged or replaced, sensor wellness data should be reset.
NOTEWhen a sensor is replaced, the replacement can be recorded manually into a logbook. (Refer to thefigure6.8.)
n Last calibrated=dateonwhichthelastsensorcalibrationwasperformed.ThedisplayedvalueoftheZeroistheresult of this calibration. The displayed value of Slope was calibrated on this date only if the last calibration was a 2-point calibration.
n Calibration due=thedatewhenthecalibrationmustbedonenextaccordingtothesettingsofthecalibrationinterval.ThecalibrationintervalsaresetinCommissioning→Measurementsetup→Calibrationsettings→Limitsandtiming.
n Projected replacementThe projected maintenance function predicts the date when the sensor unit will need cleaning or recalibrating for maintaining measurement accuracy. This function checks the cleanliness of the sensorbymonitoringthepolarizationoftheelectrodesevery24hoursandthecellconstantafterthe calibration. Clean the sensor before the predicted date.The function predicts the following two dates:
• When the cell constant crosses the upper or lower limits• Whenthevalueofthepolarizationoftheelectrodesreachesthealarmpoint(15%ormore).
The function displays the earlier date with the status (the status is displayed in parentheses).As shown in Figure 6.7, the date is predicted based on the intersection point of the upper or lower limits and the extrapolated line of the values obtained by the least squares method.
Day
Value Lower limit
Upper limit
Current date
Projected maintenance date F0310.ai
Figure 6.7
<6. OPERATION OF SC (Conductivity)> 6-9
IM 12A01A02-01E 9th Edition : Mar. 23, 2018-00
The status shows the certainty of the projected maintenance date in terms of the correlation coefficientR.Tables6.1and6.2showrespectivedisplaypatterns.
Table 6.1 Display pattern of the projected maintenance date
Projected date - - 0-1 month 1-3 months 3-6 months 6-12 months Over 1 year--: cannotbepredictableduetoinsufficientdata
Table 6.2 Display pattern of the status
Status (- - - - -)(R < 0.50)
(Poor)(0.50≤R<0.70)
(Reasonable)(0.70≤R<0.85)
(Excellent)(0.85≤R<1.00)
n SC module (sensor)With this screen, you can check the module productions number and software revision of the installed module.
n HOUSING ASSYWiththisscreen,youcancheckthemoduleproductionsnumber,softwarerevision,andHARTdevice revision of the housing assembly.
n Read logbookThe FLXA202/FLXA21 has two types of logbook per sensor to store history information on events, such as changed settings and calibrations.By selecting one of the logbooks that you wish to check, you can retrieve and check this information. Storage of history information on each event in a logbook or which logbook to use for storagecanbesetupontheConfigurelogbookscreen.Fordetails,seesection7.4.Historyinformationoneventsareautomaticallystoredonthepresetconditions.Inadditiontothisstoring,followingthreemessagescanbemanuallystoredinthelogbook; "Sensor washed by hand", "Module replaced", "Sensor replaced"
To store these messages, press and select one of three messages from the Item on the Memorandum screen. Its event date/time will be the time when a message is selected and entered.
When a password for Commissioning is set on the passwords’ setup, pressing requires entering the password. (Refer to the section 7.5.3.)
SC
6
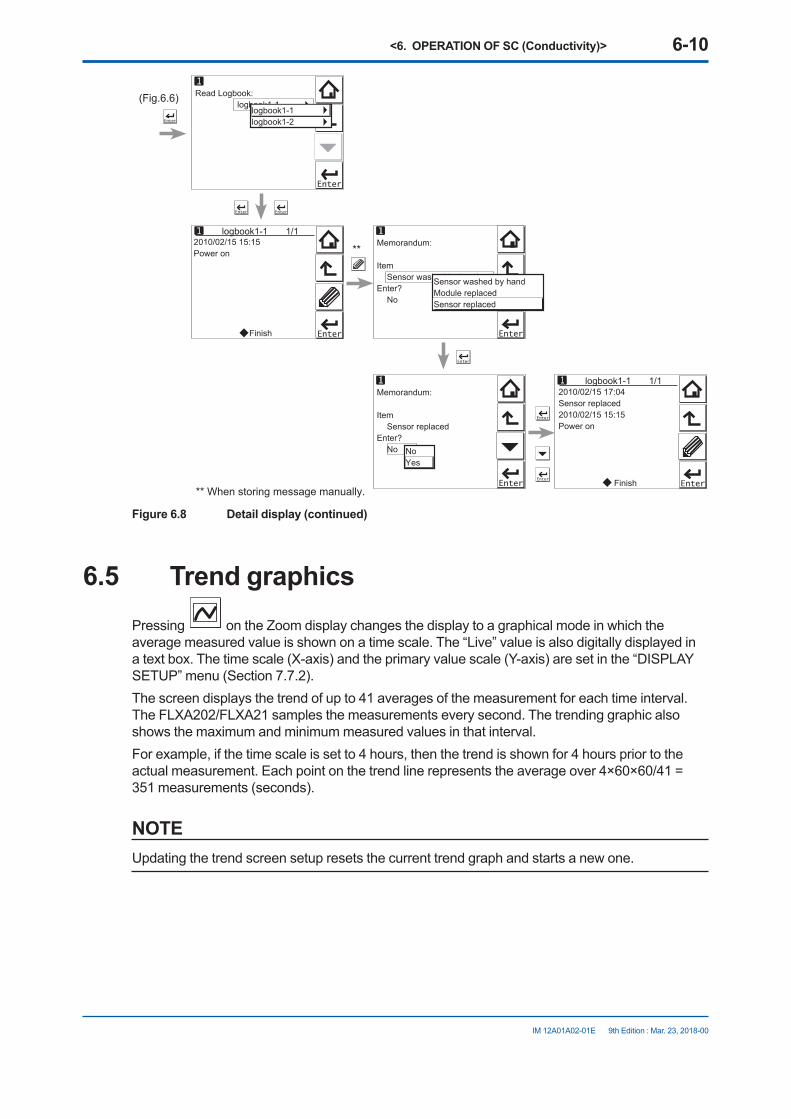
<6. OPERATION OF SC (Conductivity)> 6-10
IM 12A01A02-01E 9th Edition : Mar. 23, 2018-00
Read Logbook: logbook1-1
Memorandum:
Item Sensor washed by handEnter? No
logbook1-1 1/1
Memorandum:
Item Sensor replacedEnter? No
2010/02/15 17:04Sensor replaced2010/02/15 15:15Power on
Finish
2010/02/15 15:15Power on
Finish
logbook1-1 1/1
** When storing message manually.
**
(Fig.6.6)
Sensor washed by handModule replacedSensor replaced
logbook1-1logbook1-2
NoYes
Figure 6.8 Detail display (continued)
6.5 Trend graphicsPressing on the Zoom display changes the display to a graphical mode in which the average measured value is shown on a time scale. The “Live” value is also digitally displayed in a text box. The time scale (X-axis) and the primary value scale (Y-axis) are set in the “DISPLAY SETUP” menu (Section 7.7.2).Thescreendisplaysthetrendofupto41averagesofthemeasurementforeachtimeinterval.The FLXA202/FLXA21 samples the measurements every second. The trending graphic also shows the maximum and minimum measured values in that interval.Forexample,ifthetimescaleissetto4hours,thenthetrendisshownfor4hourspriortotheactualmeasurement.Eachpointonthetrendlinerepresentstheaverageover4×60×60/41=351 measurements (seconds).
NOTEUpdating the trend screen setup resets the current trend graph and starts a new one.
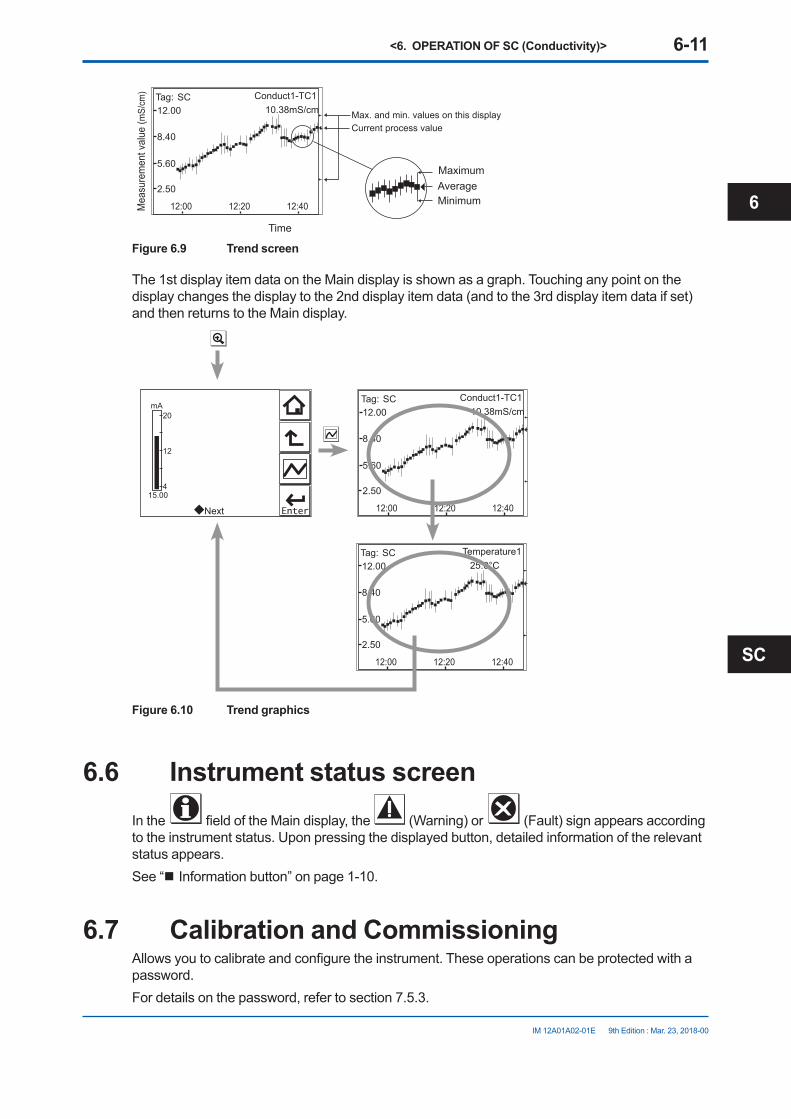
<6. OPERATION OF SC (Conductivity)> 6-11
IM 12A01A02-01E 9th Edition : Mar. 23, 2018-00
12.00
8.40
5.60
2.50
12:00 12:20 12:40
10.38mS/cm
Minimum
MaximumAverage
Time
Tag:
Mea
sure
men
t val
ue (m
S/cm
) SC Conduct1-TC1
Current process valueMax. and min. values on this display
Figure 6.9 Trend screen
The 1st display item data on the Main display is shown as a graph. Touching any point on the display changes the display to the 2nd display item data (and to the 3rd display item data if set) and then returns to the Main display.
12.00
8.40
5.60
2.50
12:00 12:20 12:40
10.38mS/cmTag: SC Conduct1-TC1
12.00
8.40
5.60
2.50
12:00 12:20 12:40
25.0°CTag: SC Temperature1
Next
20
12
4
mA
15.00
Figure 6.10 Trend graphics
6.6 Instrument status screenIn the fieldoftheMaindisplay,the (Warning) or (Fault) sign appears according to the instrument status. Upon pressing the displayed button, detailed information of the relevant status appears.See “n Information button” on page 1-10.
6.7 Calibration and CommissioningAllowsyoutocalibrateandconfiguretheinstrument.Theseoperationscanbeprotectedwithapassword.For details on the password, refer to section 7.5.3.
SC
6
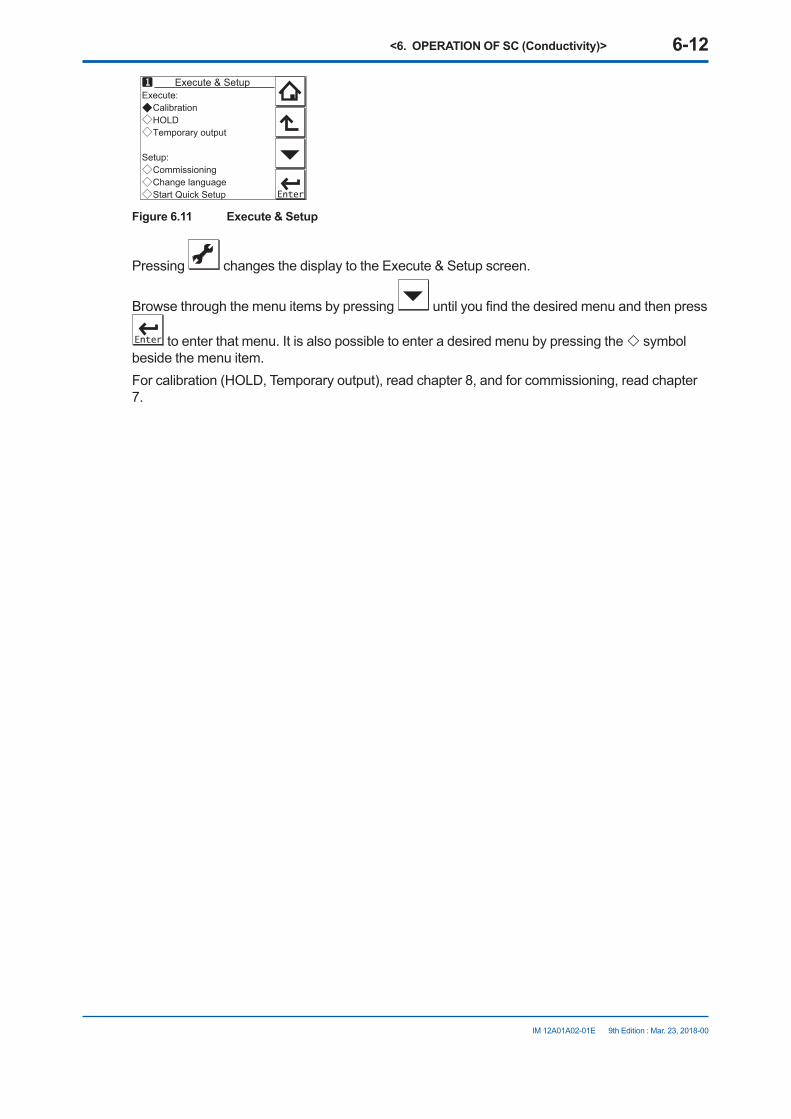
<6. OPERATION OF SC (Conductivity)> 6-12
IM 12A01A02-01E 9th Edition : Mar. 23, 2018-00
Execute: Calibration HOLD Temporary output
Setup: Commissioning Change language Start Quick Setup
Execute & Setup
Figure 6.11 Execute & Setup
Pressing changesthedisplaytotheExecute&Setupscreen.
Browse through the menu items by pressing untilyoufindthedesiredmenuandthenpress
to enter that menu. It is also possible to enter a desired menu by pressing the symbol beside the menu item.Forcalibration(HOLD,Temporaryoutput),readchapter8,andforcommissioning,readchapter7.
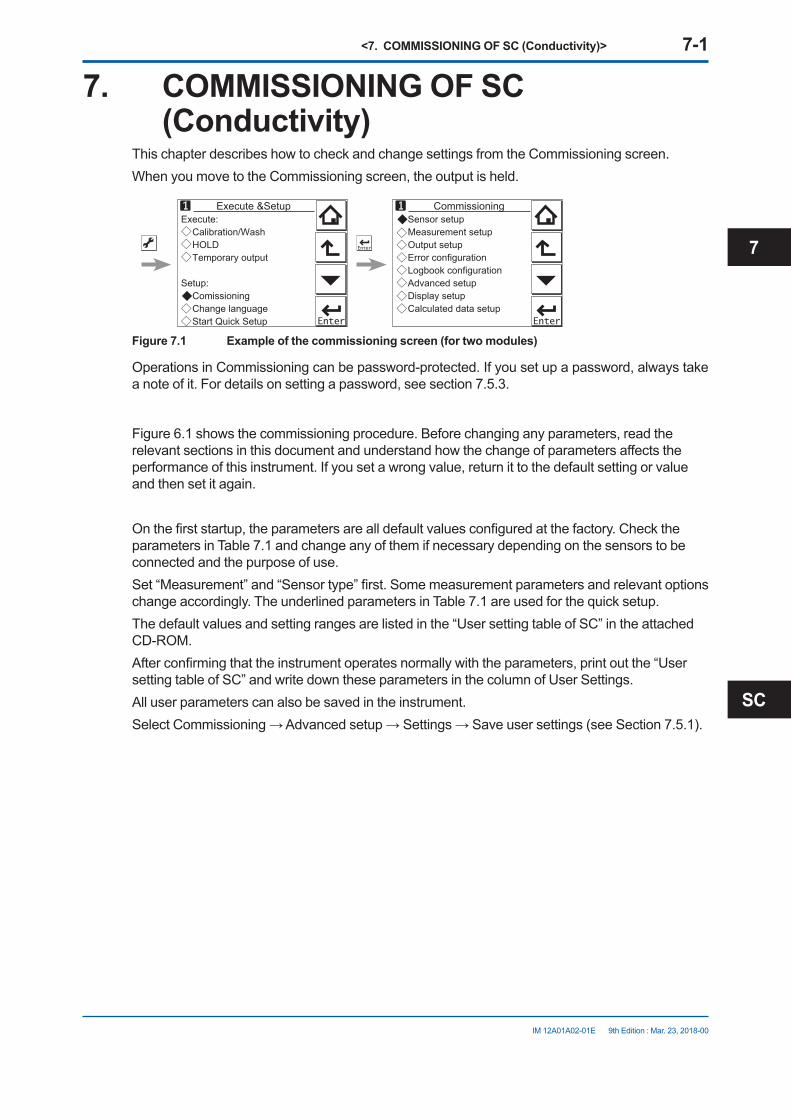
<7. COMMISSIONING OF SC (Conductivity)> 7-1
IM 12A01A02-01E 9th Edition : Mar. 23, 2018-00
7. COMMISSIONING OF SC (Conductivity)
This chapter describes how to check and change settings from the Commissioning screen.When you move to the Commissioning screen, the output is held.
Execute: Calibration/Wash HOLD Temporary output
Setup: Comissioning Change language Start Quick Setup
Execute &Setup Sensor setup Measurement setup Output setup Error configuration Logbook configuration Advanced setup Display setup Calculated data setup
Commissioning
Figure 7.1 Example of the commissioning screen (for two modules)
Operations in Commissioning can be password-protected. If you set up a password, always take a note of it. For details on setting a password, see section 7.5.3.
Figure 6.1 shows the commissioning procedure. Before changing any parameters, read the relevantsectionsinthisdocumentandunderstandhowthechangeofparametersaffectstheperformance of this instrument. If you set a wrong value, return it to the default setting or value and then set it again.
Onthefirststartup,theparametersarealldefaultvaluesconfiguredatthefactory.Checktheparameters in Table 7.1 and change any of them if necessary depending on the sensors to be connected and the purpose of use.Set“Measurement”and“Sensortype”first.Somemeasurementparametersandrelevantoptionschange accordingly. The underlined parameters in Table 7.1 are used for the quick setup.The default values and setting ranges are listed in the “User setting table of SC” in the attached CD-ROM.Afterconfirmingthattheinstrumentoperatesnormallywiththeparameters,printoutthe“Usersetting table of SC” and write down these parameters in the column of User Settings.All user parameters can also be saved in the instrument.SelectCommissioning→Advancedsetup→Settings→Saveusersettings(seeSection7.5.1).
SC
7
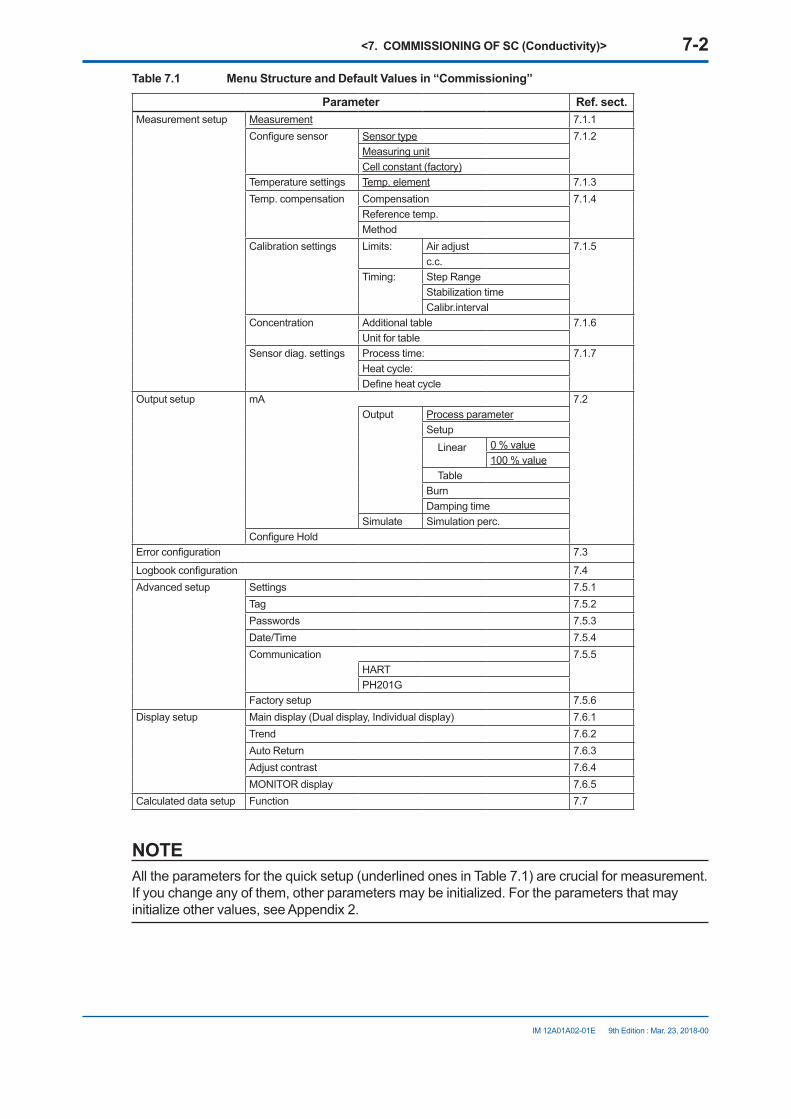
<7. COMMISSIONING OF SC (Conductivity)> 7-2
IM 12A01A02-01E 9th Edition : Mar. 23, 2018-00
Table 7.1 Menu Structure and Default Values in “Commissioning”
Parameter Ref. sect.Measurement setup Measurement 7.1.1
Configuresensor Sensor type 7.1.2Measuring unitCell constant (factory)
Temperature settings Temp. element 7.1.3Temp. compensation Compensation 7.1.4
Reference temp.Method
Calibration settings Limits: Air adjust 7.1.5c.c.
Timing: Step RangeStabilization timeCalibr.interval
Concentration Additional table 7.1.6Unit for table
Sensor diag. settings Process time: 7.1.7Heatcycle:Defineheatcycle
Output setup mA 7.2Output Process parameter
Setup Linear 0%value
100%value TableBurnDamping time
Simulate Simulation perc.ConfigureHold
Errorconfiguration 7.3
Logbookconfiguration 7.4Advanced setup Settings 7.5.1
Tag 7.5.2Passwords 7.5.3Date/Time 7.5.4Communication 7.5.5
HARTPH201G
Factory setup 7.5.6Display setup Main display (Dual display, Individual display) 7.6.1
Trend 7.6.2Auto Return 7.6.3Adjust contrast 7.6.4MONITOR display 7.6.5
Calculated data setup Function 7.7
NOTEAll the parameters for the quick setup (underlined ones in Table 7.1) are crucial for measurement. If you change any of them, other parameters may be initialized. For the parameters that may initialize other values, see Appendix 2.

<7. COMMISSIONING OF SC (Conductivity)> 7-3
IM 12A01A02-01E 9th Edition : Mar. 23, 2018-00
7.1 Measurement setupThis section describes how to set up various parameters relating to measurements.Measurements are performed based on the measurement parameter setup.
7.1.1 MeasurementSelect a measurement parameter from Conductivity, Resistivity, Concentration, and Conduct. + Concentr. The setting of the measurement parameter changes the menu structure in Error configuration,Displaysetup,etc.accordingly.
7.1.2 Configure sensorThissectiondescribeshowtoconfigurethesensortobeconnected.
l Sensor typeChoosethesensortypefrom“2-electrode”and“4-electrode.”Two-electrode sensors are usually used for conductivity and/or resistivity measurements.However,polarizationoftheelectrodesmayoccurathighconductivityranges,whichmaycauseanerrorinconductivitymeasurement.Toavoidthis,use4-electrodesensors.
l Measuring unitEither /cm or /m can be chosen here.TheprocessvalueswillbeexpressedinS/cmorS/minconductivitymodeorΩ.cmorΩ.minresistivity mode, respectively.
l Cell constant (factory)The cell constant given at factory shipment is set.When a new sensor is connected, set the new cell constant which is indicated on the sensor.When a cell constant is changed, a calibrated cell constant (c.c. (adjusted)) will be the same value of the new cell constant (factory) after resetting an old one.The cell constant is indicated on the sensor nameplate, etc. by either of the following two ways:
• Cell constant indication and input methods(1) When the cell constant itself is written on the sensor nameplate, enter it directly. (for
electrodesSC211G,SC42,SC8SG,SC4A,SC4AJ,andSC210G)(2) Whenthe“percentageofadeviationfromthenominalcellconstant(±.%)”isindicatedon
the sensor nameplate, enter the cell constant as follows. (for electrode SC210G) In case of the indication of a nominal cell constant of 5 cm-1 and a deviation value of
(CORR.%=-1.1): Theinputcellconstantis5x(100–1.1)/100=4.945;enterthis4.945.
7.1.3 Temperature settingsSelect the temperature element used for compensation from among Pt1000, Pt100, Ni100, 8k55, and Pb36 (JIS 6k). Select the same type as the temperature element that is actually connected.If a thermistor is used for the temperature sensor, select Pb36 (JIS 6k).
Celsius (°C) or Fahrenheit (°F) temperature units are available. If the unit is changed, the following values are also recalculated automatically to the new unit:
• Manual temp.• Reference temp.• Temp.coefficient• Temp. ranges in the matrix
SC
7

<7. COMMISSIONING OF SC (Conductivity)> 7-4
IM 12A01A02-01E 9th Edition : Mar. 23, 2018-00
7.1.4 Temperature compensationl Temperature compensation
Two methods can be used: Automatic and Manual. Select Automatic when a temperature element is used or Manual when a manually set temperature is used.
NOTEWhen Manual is selected on the Temperature compensation, a process temperature should be setinthe“Manualtemp.”AtemperatureshownontheMaindisplayortheHomedisplayisthismanually set temperature.
l Reference temperatureSet a reference temperature to which the measured value must be compensated. Normally 25°C is used, so this temperature is chosen as the default value.
l Process temperature compensationSelect a temperature compensation method from among None, TC, NaCl, and Matrix. “None” does not perform the temperature compensation.
l TCThis method uses the linear compensation function.Forhowtocalculateatemperaturecoefficientofthecompensationfunction,see“lTemperaturecompensationcoefficient(TC)”onpageApp.2-1.
l NaClThis method uses the standard temperature compensation function with NaCl solution.For details, see “l NaCl (standard temperature compensation)” on page App.2-1.
l MatrixThis method uses the temperature compensation matrix, which is a table of the conductivity valuesatdifferenttemperaturesandconcentrationsforaspecificsolution.Themeasuredconductivity is compensated based on this matrix to the conductivity at the reference temperature.Preparedmatrixesanduser-definedmatrixescanbeused.Twodifferentuser-definedmatrixes are available.For details, see “l Matrix” on page App.2-3.
When the measured temperature or the precompensated conductivity is out of the range, the temperature compensation error (warning) will be issued. This is not a device error.Formoredetails,see“Temperaturecompensationerror”onApp.2-8.
Any two of these three methods can be set for conductivity measurement as “Temp.comp.1” and “Temp.comp.2”. The result of either method can be output or displayed (see “7.2 Output setup” or “7.6 Display setup”).When “Measurement” is set to “Conduct. + Concentr.” for the Measurement, only one method can be set.
<7. COMMISSIONING OF SC (Conductivity)> 7-5
IM 12A01A02-01E 9th Edition : Mar. 23, 2018-00
NOTEThe temperature compensation is not performed around zero. In this case, a warning may be issued.
7.1.5 Calibration settingsThescreenflowdiffersdependingonthecombinationofobjectstobemeasured.
l Air adjust limitGenerally,aircalibrationisnotrequired.Toavoidtheeffectsofthecableonthemeasurementoflower conductivities such as pure water, a “zero” calibration with a dry sensor may be done.Whenusinga4-electrodesensor,additionalconnectionsarerequired.Temporarilyinterconnectterminals13&14witheachotherand15&16witheachotherbeforemakingtheadjustment.Thisisnecessarytoeliminatethecapacitiveinfluenceofthecables.Thelinksshouldberemovedafter this step is completed.Asthecalibrationisperformedinair,theresistivityisinfinite(openconnection).Higherconductivity values than the air adjust limit indicate that the cell is not in air or is still wet. To prevent wrong air calibrations, a limit must be given here.
l c.c. highHighlimitofthecellconstantexpressedasa%ofthenominalvalue.Duringcalibrationthisvalueis used to check if the calibrated cell constant remains within reasonable limits.
l c.c. lowLowlimitofthecellconstantexpressedasa%ofthenominalvalue.Duringcalibrationthisvalueis used to check if the calibrated cell constant remains within reasonable limits.
l Step RangeSet the range over which the stability of a measured value is checked. If variations of a measured value over the stabilization time are within this set value, the measured value is judged to have stabilized.
l Stabilization timeDuring calibration, the stability of the measurement is constantly monitored. When variations of the value are within a value set in Step Range over this stabilization time set here, the value is regarded as being stable. If the value does not stabilize within 10 minutes, calibration is aborted.
l Calibration intervalSet the interval in which a new calibration must take place. If the interval set here is exceeded, theinstrumentwillbenotifiedaccordingtothesettingin“Calib.timeexceeded”intheerrorconfiguration.
7.1.6 ConcentrationThe “Concentration” can be set only when “Conduct. + Concentr.” or “Concentration” is selected for the Measurement in the Measurement setup menu.The corresponding concentration given by a measured conductivity can be shown on the Main displayortheHomedisplay.
SC
7
<7. COMMISSIONING OF SC (Conductivity)> 7-6
IM 12A01A02-01E 9th Edition : Mar. 23, 2018-00
l Concentration tableConcentration can be calculated by using the temperature compensation matrix or the additional concentration table.
• By using the temperature compensation matrix Set the “Additional table” to “Disabled”. The concentration can be obtained from the
temperature compensation matrix (based on the relation between the conductivity at the reference temperature and the concentration).
SelectTemp.compensation→Method,andthenselectMatrix.Next,chooseasolutionorUserdefined1or2(seeSection7.1.4).Theconcentrationcannotbeobtainedbyanyothertemperature compensation method (TC or NaCl).
• By using the additional concentration table The additional concentration table indicates the relation between the conductivity and the
concentration at the reference temperature. Set the “Additional table” to “Enabled”. The concentration can be obtained from the additional concentration table.
Afterenteringvalues,select“Yes”for“Checkvalues?”.Valuesareinterpolatedintoemptycells. If any mandatory cells are left blank, an error will be issued. An error message is also issued if there is any error in the concentration table.
After completing entering values in the additional concentration table, set “Additional table” to “Enabled”.
l Unit for tableSelecttheconcentrationdisplayunitsfromamong%,ppt,ppm,andppb.Changing the unit will not result in a re-calculation of the table. Reenter values in the additional concentration table.
7.1.7 Sensor diagnostic settingsThis screen is used to set items relating to sensor diagnostics displayed on the screens invoked
by pressing .Gauges are displayed for only parameters that have been enabled in “Sensor diag. settings.”Parameters set to Disable are provided with a bar display.
ThesettingparametersincludeProgresstimeandHeatcycle.Itisalsopossibletosetthe“Badlimits”oftheprogresstimeandheatcycleandthe“Heatcycletemp”and“Heatcycletime”oftheheat cycle.
7.2 Output setupThegeneralprocedureistofirstdefinethefunctionoftheoutput,OutputorSimulate.Then,setthe process parameters associated with the output. On the Output, an output of measured value is selected. On the Simulate, a simulation value can be set.And,theparametersforHOLDfunctioncanbesetonthissetting.
l OutputTheoutputsignalisacurrentvaluespecifiedbythefollowingparameters.
Process parameterAvailable process parameters depend on the selected “Measurement” item in Measurement setup. Refer to Table 7.2.
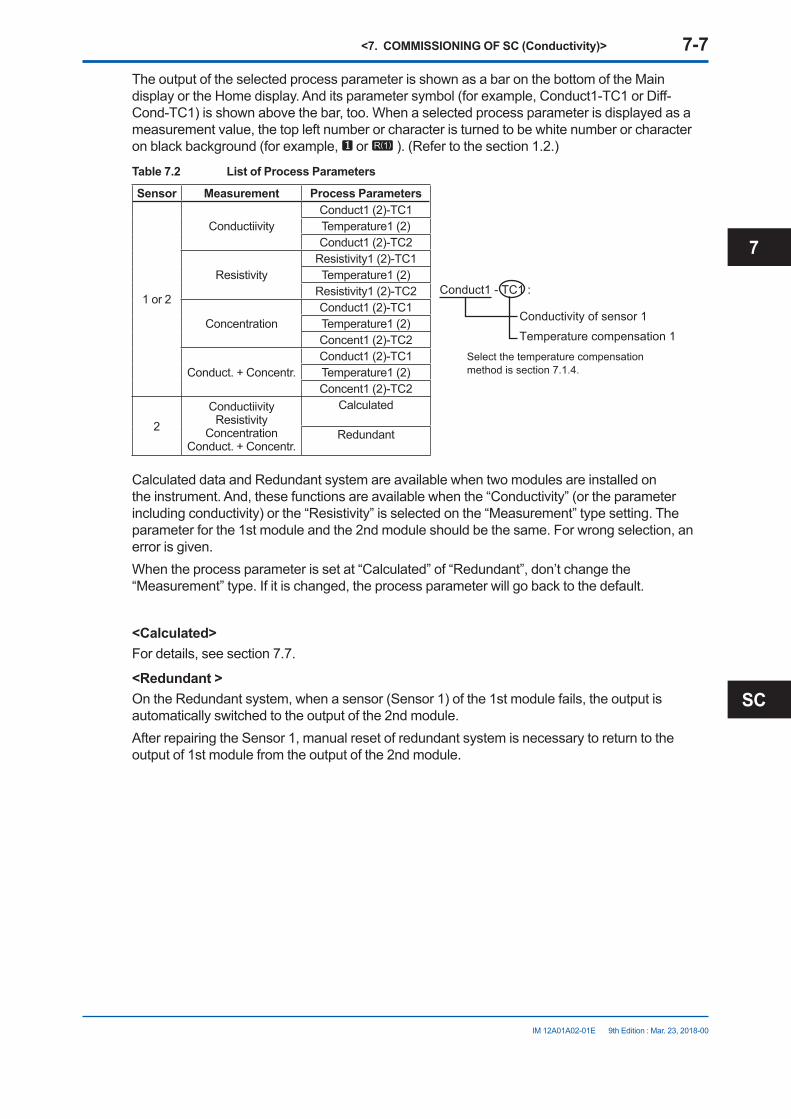
<7. COMMISSIONING OF SC (Conductivity)> 7-7
IM 12A01A02-01E 9th Edition : Mar. 23, 2018-00
The output of the selected process parameter is shown as a bar on the bottom of the Main displayortheHomedisplay.Anditsparametersymbol(forexample,Conduct1-TC1orDiff-Cond-TC1) is shown above the bar, too. When a selected process parameter is displayed as a measurement value, the top left number or character is turned to be white number or character on black background (for example, or ). (Refer to the section 1.2.)
Table 7.2 List of Process Parameters
Sensor Measurement Process Parameters
1 or 2
ConductiivityConduct1 (2)-TC1
Conduct1 - TC1 :
Conductivity of sensor 1
Temperature compensation 1
Select the temperature compensation method is section 7.1.4.
Temperature1 (2)Conduct1 (2)-TC2
ResistivityResistivity1 (2)-TC1Temperature1 (2)
Resistivity1 (2)-TC2
ConcentrationConduct1 (2)-TC1Temperature1 (2)Concent1 (2)-TC2
Conduct. + Concentr.Conduct1 (2)-TC1Temperature1 (2)Concent1 (2)-TC2
2Conductiivity
ResistivityConcentration
Conduct. + Concentr.
Calculated
Redundant
Calculated data and Redundant system are available when two modules are installed on the instrument. And, these functions are available when the “Conductivity” (or the parameter including conductivity) or the “Resistivity” is selected on the “Measurement” type setting. The parameter for the 1st module and the 2nd module should be the same. For wrong selection, an error is given.When the process parameter is set at “Calculated” of “Redundant”, don’t change the “Measurement” type. If it is changed, the process parameter will go back to the default.
<Calculated>For details, see section 7.7.
<Redundant >On the Redundant system, when a sensor (Sensor 1) of the 1st module fails, the output is automatically switched to the output of the 2nd module.After repairing the Sensor 1, manual reset of redundant system is necessary to return to the output of 1st module from the output of the 2nd module.
SC
7

<7. COMMISSIONING OF SC (Conductivity)> 7-8
IM 12A01A02-01E 9th Edition : Mar. 23, 2018-00
mA mA
mA
R(1) R(2) R(1)
F0503_2.ai
Return mA to Sensor1?
Yes No
Reset redundant system
Sensor 1
Display
Sensor 2
Alive Alive
Alive Alive Alive
Dead DeadAlive
Sensor 1 is dead.(automatic)
Repair sensor
Redundant systemrestart (manual)
If sensor 1 fails, the output is automatically switched to the sensor-2 value.
This display is the example when “Redundant” is selected as a process parameter.
Even if a fault on the sensor 1 is recovered automatically after fault detection, the output will not be switched back automatically and the sensor 2 value will continue to be output.
After repairing sensor 1, reset the backup made by the redundant system. This enables the sensor 1 value to be incorporated in the output.On the Reset redundant system, selection of “Yes” makes the output return to the output of the 1st module.
Output setupmA Output Configure Hold Reset redundant
Figure 7.2 Redundant system
SetupSelect one of the output methods: Linear and Table.Linear: Setthe0%and100%values.Table: Thisallowstheconfigurationofanoutputcurveby21points(5%intervals). (The0%and100%valuesmustbeentered.)
BurnSelectthedesignatedoutputincaseofafaultfromamongOff,Low,andHigh.See“7.3Errorconfiguration”tosettheoutput.Off: Outputdependsonthemeasuredvalue.Low: Outputisfixedto3.6mAHigh:Outputisfixedto22.0mA.
Damping timeThisisthetimetakenforaresponsetoastepinputchangetoreach90%ofthefinalvalue(attenuation time). Set this time in sec.
l SimulateWhenthisfunctionisselected,anoutputoftheinstrumentwillbeafixedcurrentvaluesetin%oftheoutputspan.Theoutputspanrangeis-2.5%to112.5%(3.6mAto22.0mA).When “Simulate” is selected, regardless of hold setting, the output is always simulated value.
n Configure HoldOntheConfigureHold,settingsareperformedtoholdofthemAoutputatapresetvalue.(Referto the section 8.7.) This is enabled only if “mA” is “Output.”

<7. COMMISSIONING OF SC (Conductivity)> 7-9
IM 12A01A02-01E 9th Edition : Mar. 23, 2018-00
During the Commissioning or the Quick Setup, the mA output is automatically held. The preset valuedependsonasettingonthe“Lastorfixed”.
“Last”: The preset value is a value measured just before hold condition.“Fixed”: The preset value is a value set in the “Fixed value mA”. When the “Fixed” is selected, set a mA value in the “Fixed value mA”.
Selectiononthe“HoldduringCalibration”decidestoactivateordeactivatetheholdfunctionautomatically during calibration.
“Enabled”: Activation of the automatic hold function
“Disabled”: No automatic hold function
7.3 Error configurationInErrorconfiguration,configurethestatusesofvariouserrorcauses.
This allows the system to notify the user of the occurrence of an error according to the status categoriesintheErrorconfiguration.SelectastatuscategoryfromamongOff,Warn.(Warning),andFault.“Fault”automaticallyperformsburn-out.WhenBurnhasbeensettoOff(7.2Outputsetup),onlythe error message is displayed.“Warn.” displays an error message.WhenselectingPH201Ginthecommunicationsetting,makesurethatthe“Failcontact”settingis appropriate.
The settable causes of errors are determined based on the settings of the Sensor setup and Measurement setup, and a status category is set to the causes displayed in the Errors 1/3 to 3/3 screens.
Table 7.3 Error configuration
Display item Description DefaultConductivity too high(or Concentration) Conductivity or resistivity is lower than the minimum limit. Warn.
Conductivity too low(or Concentration) Conductivity or resistivity is higher than the maximum limit. Warn.
Temperature too high Measured process temperature is higher than the maximum limit. Warn.Temperature too low Measured process temperature is lower than the minimum limit. Warn.Polarization detec Polarization of the electrodes is detected. Off*Calibr. time exceeded Calibration time exceeds the calibration interval (see Section 7.1.5). OffUSP Conductivity exceeds the USP limit. OffConfigurationerror:1st comp. matrix2nd comp. matrix
Thetemperaturecompensationmatrixisnotdefinedproperly(seeSection7.1.4). Fault
Concentration table Theconcentrationtableisnotdefinedproperly(seeSection7.1.6). Fault*: SC210G does not have Polarization detect function. Setting this as default may cause an error message.
CAUTIONIfcancelinganerrorconfigurationcouldberisky,donotcancelitasadangeroussituationmayresult.
SC
7
<7. COMMISSIONING OF SC (Conductivity)> 7-10
IM 12A01A02-01E 9th Edition : Mar. 23, 2018-00
NOTEWhen setting the error limits of “Conductivity too high” and “Conductivity too low,” enter values obtained by dividing the conductivity value to be used as a limit value by the cell constant (given at factory shipment) of the sensor used (conductivity / cell constant). In resistivity measurements, set a value (resistivity x cell constant).
NOTEThe temperature compensation is not performed around zero. In this case, a warning may be issued.See“Foralltemperaturecompensation”onApp.2-8.
l USPThesuitableerrorcategoryforUSP<645>monitoringcanbeset.Whenthisisset,itischeckedwhether the non-temperature-compensated conductivity is higher than the limit value directed on thestage1oftheproceduredescribedonUSP<645>.(RefertotheApp.2)
l USP safety marginTheUSP<645>monitoringcanbemodifiedbythissetting.ThepercentageofthelimitvalueofUSP<645>servesasasafetymargin.(RefertotheApp.2)
7.4 Logbook configurationIn“Logbookconfiguration,”theuserconfiguresinformationtobesavedtoalogbookorinitializesthe logbooks.Logbooks are used to keep an electronic record of events such as error messages, calibrations, and programmed data changes. By referring to this log, users can, for instance, easily determine maintenance or replacement schedules.In“Logbookconfiguration,”theusercanselect“Off,”“1-1,”or“1-2”foreachitemofinteresttobelogged.(Forsensor2,select“Off,”“2-1,”or“2-2.”)ThiscanbedoneforitemsdisplayedontheSettings logbook 1/3 to 3/3 screens. Assigning 1-1 or 1-2 to each item allows information to be organized and logged in a logbook.
NOTESome events such as power-on are saved into the logbook “1-1” or “2-1”. This logbook may be full earlier. It is recommended that important information be saved into the logbook “1-2” or “2-2”.
For“Eraselogbook”,aspecifiedlogbook“1-1”or“1-2”canbeerasedindividually.When the “Warn if logbook full” is set to “Yes”, a warning is given when the logbook come to near full (maximum 13 pages).
NOTEWhen the logbook gets full, the oldest information is erased automatically.
<7. COMMISSIONING OF SC (Conductivity)> 7-11
IM 12A01A02-01E 9th Edition : Mar. 23, 2018-00
7.5 Advanced setupAdvanced setup is used to set functions relating to matters other than measurements such as the selection of settings, tag setting, password setting for protecting calibration and commissioning operations, date setting, and communication setting.(“Factorysetup”isforserviceengineersonly;thereisnoitemtobesetbytheuser.)
7.5.1 SettingsIn “Settings,” select an item to be set as the default value from among “No action,” “Load factory settings,” “Save user settings,” and “Load user settings.”When the default values are loaded, the instrument will be restarted. (In the case of “Save user settings,” it will not be restarted.)The following parameters are not included in the defaults:
• Tag• The contents of all logbooks
NOTEWhen the “Save user setting” is only selected, save of the user-set parameters will start at once.
To avoid wrong selection, operation in this Settings must be done by , not by touching the menu message.
If you select “Load factory settings,” the instrument will be set to the default settings at factory shipment.When this item is selected, a screen prompting whether to restart is displayed. If this is no problem,press“Yes.”Thenthe“Loading…”messageappearsandblinksandloadingisstarted.When the factory settings have been loaded, the instrument will be restarted.When “Save user settings” is selected, the current settings can be saved as the defaults. When this item is selected, the user settings will start to be saved immediately. After saving the
parameters, press or to change the display because this save doesn’t have restart function.If “Load user settings” is selected, the settings saved as user settings can be set as the defaults.When this item is selected, a screen prompting whether to restart is displayed. If this is no problem,press“Yes.”Thenthe“Loading…”messageappearsandblinksandloadingisstarted.When the user settings have been loaded, the instrument will be restarted.
7.5.2 TagAtagprovidesasymbolicreferencetoaninstrumentandisgenerallydefinedtobeuniquethroughout the control system at one plant site. A tag can contain up to 12 alphanumeric characters. The default value is SC or FLXA21-SC. When two sensor modules are installed, each module can have their own tag numbers.The tag is displayed at the top of the main and home displays.
SC
7

<7. COMMISSIONING OF SC (Conductivity)> 7-12
IM 12A01A02-01E 9th Edition : Mar. 23, 2018-00
7.5.3 PasswordsCalibration and commissioning operations can be separately protected by each password. To protectexecuteoperations,enterapasswordinExecute’sinputfield.Toprotectcommissioningoperations,enterapasswordinCommissioning’sinputfield.Bydefault,bothinputfieldsareempty.Whenapasswordinputfieldisempty,operationisnotpassword-protected.Apasswordcan contain up to 8 characters.
When you set a password, always take a note of it.
When a password is set, input of the password is necessary to enter the password-protected operation. After inputting the password, the display will change to an operator ID input display. When an operator ID is input, its operation is recorded into a logbook. The input of an operator ID isnotnecessarytoentertheoperation.AnoperatorIDcancontainupto4characters.
7.5.4 Date/TimeThe Logbooks and trend graphs use the clock/calendar as a reference. The current date and time is set here. The time display format can be selected from among three types.
7.5.5 CommunicationIn“Communication,”selectthecommunicationsettingfromamongNone,HART,andPH201G.The burn down current value is 3.6 mA.
NOTETomakethechangeof“Communication”valid,turnoffthepowersupplyonce,andreboot.
Inthecaseof“None,”thereisnottheproblemevenifyoudonotchangeitas“HART”ofdefaultvalue.
n HARTSelectthismenuwhenHARTcommunication(HART5)ismade.IntheHARTsetupscreen,specifythenetworkaddressandsetupparametersforSV,TV,andFV.(PVislinkedwiththe“processparameter”settingin“Outputsettings”andcannotbechangedhere.)
l Network addressFor 1-to-1 communication, leave the default value [0] unchanged. For multi-drop where multiple HARTdevicesareconnectedonabus,setaddressesin1to15.Inthiscase,themAoutputwillbefixedto4mA.
l PVPVisaparameterselectedforanalogoutput;itcannotbechangedhere.
l SV, TV, FVTheSV,TV,andFVparametersareitemsthattheusermustsetup.Selectableitemsdifferdepending on the sensor type in “Sensor setup” and settings in “Measurement setup.”If blank is selected for a parameter, items below that parameter must all be set to blank. If an item is blank, those below it cannot be set to a status other than blank.

<7. COMMISSIONING OF SC (Conductivity)> 7-13
IM 12A01A02-01E 9th Edition : Mar. 23, 2018-00
FormoreinformationonHARTcommunication,seetheTechnicalInformation(TI12A01A02-60E) in the attached CD-ROM.
n PH201GSelectthismenuifthePH201Gdistributorisconnectedtotheinstrument.InthePH201Gsetupscreen,makesettingsfor“Holdcontact,”and“Failcontact.”
l Hold contactSelect Disabled or Enabled.Whenthisitemisenabled,theoutputwillbeheldaccordingtothesettingof“Holdtype”ontheHoldsetupscreen.
l Fail contactSelect a status from among “Fail + Warn,” “Fail only,” and “Disabled.”Thissettingdependsontheerrorconfiguration.See“7.3Errorconfiguration.”“Fail” corresponds to “Fault.”
7.5.6 Factory setupFor “Factory setup,” there is no item to be set by the user.
NOTEThis menu is for service engineers only. This section is protected by a password. Attempting to change data in the factory adjustment menu without the proper instructions and equipment could result in corruption of the instrument setup and damage the performance of the unit.
7.6 Display setupThis screen is used to make various settings relating to screen display.
NOTESettableitemsdifferdependingonsettingsin“Measurementsetup.”
7.6.1 Main display (Dual display, Individual display)
Main display Trend Auto Return Ad.just contrast MONITOR display
Display setup Dual display Individual display Trend Auto Return Adjust contrast MONITOR display
or
Display setup
Figure 7.3 Display setup screens for a single module (left) and two modules (right)
SC
7
<7. COMMISSIONING OF SC (Conductivity)> 7-14
IM 12A01A02-01E 9th Edition : Mar. 23, 2018-00
l Main displayWhen one module is installed on the instrument, only the Main display is available.Three measurement values can be set to display on the Main display as a primary value (1st line), a second value (2nd line) and a third value (3rd line) respectively.On the “Additional text”, a text of up to 12 alphanumeric characters can be assigned to each measurement value.Additional texts are displayed on the Main display, and are useful for identifying measurements. Insomecases,notall12characterscanbedisplayedduetotheletters;checkthetextsdisplayed on the Main display after setting. If a part of the text is missing, adjust the number of characters.
l Dual displayThis screen is used to set items to be displayed in the top part (1st row) and bottom part (2nd row)oftheHomedisplay.Thesesettingsareavailablewhentwosensorsareinstalledintheinstrument.Whenthe“Empty”isselectedforthe2ndrow,theHomedisplaycannotbedisplayed.
l Individual displayWhen two modules are installed on the instrument, display items on the Main display for each module can be set on these settings.On the “SC1 display” or “SC2 display” screen, three measurement values can be set to display on each Main display as a primary value (1st line), a second value (2nd line) and a third value (3rd line) respectively.On the “Additional text”, a text of up to 12 alphanumeric characters can be assigned to each measurement value.Additional texts are displayed on the Main display, and are useful for identifying measurements. Insomecases,notall12characterscanbedisplayedduetotheletters;checkthetextsdisplayed on the Main display after setting. If a part of the text is missing, adjust the number of characters.
7.6.2 TrendThis screen is used to make settings for the Trend Graph Screen.Set the process parameters to be displayed for each trend. They can be set for the 1st to 3rd trends. When all three process parameters are set “Empty”, there is no trend display (no trend button).
l X-axis: TimingSelect the X-axis timing’s time span on the trend graph display from a list.
l Y-axis: LimitsSet the Y-axis high and low limits on the trend graph display on a Trend screen basis.
NOTEUpdating the trend display setup resets the current trend graph and starts a new one.

<7. COMMISSIONING OF SC (Conductivity)> 7-15
IM 12A01A02-01E 9th Edition : Mar. 23, 2018-00
7.6.3 Auto ReturnWhen no operation is performed for the time set in “Auto Return”, the display returns to the Monitor display (or to the Main display when the MONITOR display is disabled) and the analyzer returns to a normal measuring mode. (When the Trend display is selected, the Auto Return doesn’t work.)Select the time from among Disable, 10 min, and 60 min. When the Auto Return function is not used, select “Disable.”
NOTEA default is “10 min”. When maintenance like a calibration that may take much time is performed, “60 min” or “Disable” is recommended to be selected.
7.6.4 Adjust contrastThe LCD screen contrast can be adjusted.Pressingthekeysadjuststhecontrastin11levelsfrom+5to–5(includingthedefaultvalueof “0”).
7.6.5 MONITOR displaySelect “Enable” so that the Monitor display becomes available. A default is “Enable”.DuringHoldconditionandawarning/faultcondition,theMaindisplayortheHomedisplayisdisplayed to indicate the condition.
7.7 Calculated data setupOn this setup, parameters can be set for calculated data.When two modules are installed on the instrument, the calculated data can be set for conductivity values or resistivity values measured by two sensors.OntheCalculateddatasetupscreen,selectonekindofcalculationsasshownontheTable7.4.Forresistivity,select“Differential”or“Average”.
Table 7.4 Calculation
Function Arithmetic expression Indication *Differential (valueofthesensor1)–(valueofthesensor2) DiffAverage (value of the sensor 1 + value of the sensor 2) / 2 AveRatio (value of the sensor 1) / (value of the sensor 2) RatioPassage(%) (value of the sensor 2) / (value of the sensor 1) x 100 PassRejection(%) (valueofthesensor1–valueofthesensor2)/(valueofthesensor1)x100 RejeDeviation(%) (valueofthesensor2–valueofthesensor1)/(valueofthesensor1)x100 DevpHcalc.(VGB) pH=8.6+log(valueofthesensor1)–(valueofthesensor2)/3 VGB* ParametersymbolatthebardisplayofanalogoutputwhichisdisplayedatthebottomoftheMaindisplayortheHomedisplay
when a calculated data is selected as a process parameter on the “mA (Output)” setup screen.
To display the calculated result, select “Calculated” on the Dual display screen. (Section 7.6.1.) (Thesettingonthe“Individualdisplay”hasnoeffect.)While displaying a calculated data, measurement value of the sensor 1 or sensor 2 can be
checked on the each sensor’s display with pressing Sensor
1 or Sensor
2 at the lower right on the Main display.
SC
7
<7. COMMISSIONING OF SC (Conductivity)> 7-16
IM 12A01A02-01E 9th Edition : Mar. 23, 2018-00
Pressing returns the display to the original calculated data display.A calculated data can be set as a process parameter on the “mA (Output)” setup screen. (Section 7.2.)

<8. CALIBRATION OF SC (Conductivity)> 8-1
IM 12A01A02-01E 9th Edition : Mar. 23, 2018-00
8. CALIBRATION OF SC (Conductivity)The cell constant of a conductivity meter does not change during operation, as long as it remains undamaged,andclean.Therefore,itisvitalthatinanycalibrationcheck,thefirststepshouldbeto clean the sensor, or at least to check its cleanliness. After cleaning, ensure that the sensor is carefully rinsed in distilled water to remove all traces of the cleaning medium.The cell constant is indicated on the nameplate or cable label of the SC sensor.For input of the cell constant, see section 7.1.2.
NOTEA default is “10 min” for “Auto Return”. When maintenance like a calibration that may take much time is performed, “60 min” or “Disable” is recommended to be selected. (Refer to the section 8.6.3.)
Execute: Calibration HOLD Temporary output
Setup: Commissioning Change language Start Quick Setup
Execute & Setup Calibration Cell constant(manual) Cell constant(automatic) Air calibration Sample Temperature coefficient Temperature calibration
Figure 8.1 Calibration
Calibration for conductivity can be selected from Cell constant (manual), Cell constant (automatic), Air calibration, and Sample. In most cases, Air calibration is not required.
NOTEThe standard instrument to be used in calibration with a process solution should always be accurate. Yokogawa recommends that the Model SC72 pocket conductivity meter be used for this purpose.
Where temperature compensation 1 (SC1) and temperature compensation 2 (SC2) have been configured,theconfiguredtemperaturecompensationiseffectiveevenduringcalibration.Therefore, the reading is the value converted to a conductivity value at the reference temperature set in Temperature settings.There are temperature compensation 1 (SC1) and temperature compensation 2 (SC2), but this does not mean that calibration is required twice. It means that either SC1 or SC2 temperature compensation should be selected and calibration should be made once to obtain the cell constant. The cell constant after calibration can be checked on the Detail screen.
NOTEWhen a sensor is exchanged or replaced, sensor wellness data should be reset.When a sensor is replaced, the replacement can be recorded manually into a logbook. (Refer to thefigure6.9.)
SC
8
<8. CALIBRATION OF SC (Conductivity)> 8-2
IM 12A01A02-01E 9th Edition : Mar. 23, 2018-00
8.1 Cell constant (manual)Theintentionofthiscalibrationroutineistofine-tuneasensorforwhichonlythenominalcellconstant is known, or to recalibrate a sensor that has been changed (or damaged) during operation. Choose the 1st or 2nd temperature compensation to suit the calibration solution used. The solution with an appropriate precision should be prepared or purchased. Allow the sensor to reach stable readings for both temperature and conductivity before adjusting to the value of the corresponding calibration solution.Calibration here is performed by measuring a solution with known conductivity at the set reference temperature. The calibration solution of an accurate concentration should be prepared by dissolving a certain amount of solute in water. Allow the conductivity to become stable at the set reference temperature (initial setting of 25°C) of the instrument and obtain the conductivity from literature data, etc. Appendix 2 shows the conductivity values of sodium chloride (NaCl) as a typical example.
8.2 Cell constant (automatic)This routine is built around the test method described in International Recommendation No. 56 of OIML (Organisation Internationale de Metrologie Legale). It allows the direct use of the solutions prescribed in the test method, automatically selecting the appropriate temperature compensation.Thelook-uptableisusedtofindanappropriateconductivityreadingforthemeasured temperature. See Appendix 2 for OIML solutions.
8.3 Air calibrationIt is not necessary to conduct general air calibration unless the cable length is long and a low conductivity needs to be measured.With the clean dry cell in open air, the reading should be zero. The air cal compensates for excess cable capacitance, and gives a better accuracy at low readings. This should be done when a sensor is installed or replaced. After some time in service, a dirty sensor may well show ahighzerooffsetbecauseoffouling.Cleanthesensorandtryagain.Moreover,aircalibrationshould be made in an environment free of electromagnetic interference.
NOTEThe temperature compensation is not performed around zero. In this case, a warning may be issued.See“Foralltemperaturecompensation”onApp.2-8.
8.4 SampleWith the sensor in situ, a sample can be taken for laboratory analysis. Sample calibration records the time and reading, and holds these in memory until the analysis has been completed. The laboratory data can then be entered regardless of the current process value, without the need for calculations.When sample calibration is made with temperature compensation activated, the types of temperature compensation for laboratory analysis equipment should be matched. Use of a differenttypeoftemperaturecompensationbetweenequipmentcausesanerror.Thestandardconductivity meter to be used should always be based on the accurate and same temperature compensation calculation method. Yokogawa recommends that the Model SC82 pocket conductivity meter be used for this purpose.
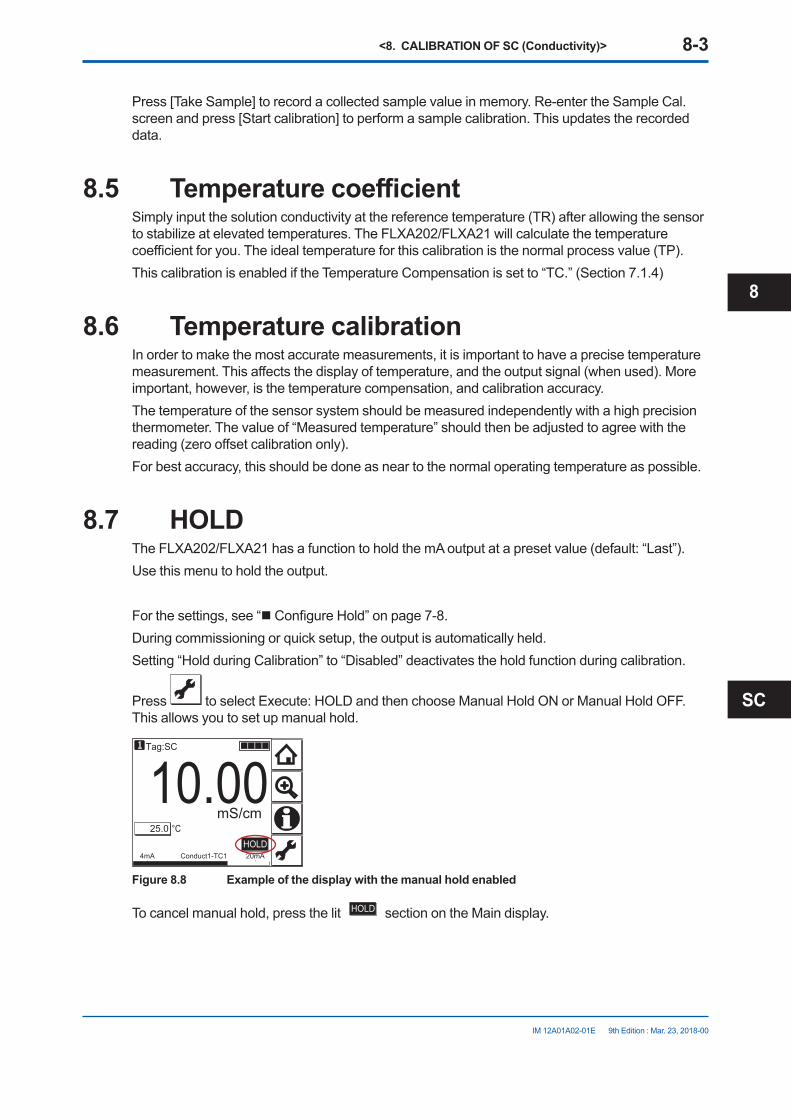
<8. CALIBRATION OF SC (Conductivity)> 8-3
IM 12A01A02-01E 9th Edition : Mar. 23, 2018-00
Press [Take Sample] to record a collected sample value in memory. Re-enter the Sample Cal. screen and press [Start calibration] to perform a sample calibration. This updates the recorded data.
8.5 Temperature coefficientSimply input the solution conductivity at the reference temperature (TR) after allowing the sensor to stabilize at elevated temperatures. The FLXA202/FLXA21 will calculate the temperature coefficientforyou.Theidealtemperatureforthiscalibrationisthenormalprocessvalue(TP).ThiscalibrationisenablediftheTemperatureCompensationissetto“TC.”(Section7.1.4)
8.6 Temperature calibrationIn order to make the most accurate measurements, it is important to have a precise temperature measurement.Thisaffectsthedisplayoftemperature,andtheoutputsignal(whenused).Moreimportant, however, is the temperature compensation, and calibration accuracy.The temperature of the sensor system should be measured independently with a high precision thermometer. The value of “Measured temperature” should then be adjusted to agree with the reading(zerooffsetcalibrationonly).For best accuracy, this should be done as near to the normal operating temperature as possible.
8.7 HOLDThe FLXA202/FLXA21 has a function to hold the mA output at a preset value (default: “Last”).Use this menu to hold the output.
For the settings, see “nConfigureHold”onpage7-8.During commissioning or quick setup, the output is automatically held.Setting“HoldduringCalibration”to“Disabled”deactivatestheholdfunctionduringcalibration.
Press toselectExecute:HOLDandthenchooseManualHoldONorManualHoldOFF.This allows you to set up manual hold.
10.00Tag:SC
25.0
4mA 20mAConduct1-TC1
°CmS/cm
HOLD
Figure 8.8 Example of the display with the manual hold enabled
To cancel manual hold, press the lit HOLD section on the Main display.
SC
8
<8. CALIBRATION OF SC (Conductivity)> 8-4
IM 12A01A02-01E 9th Edition : Mar. 23, 2018-00
8.8 Temporary outputIf measurement cannot be made due to replacement of one of the sensors, assignment of mA output can be temporarily changed from the currently setup sensor to the other sensor. This feature is enabled only when two sensors are connected.
Press to select Execute: Temporary output and then choose the process parameter to be assigned on the Temporary output screen.
Whenprocessparameterassignmenthasbeenmodified,the indication at the upper left of the screen changes to .The feature is disabled the moment the screen returns to the Main display, and the setting (process parameter in mA output setting) returns to the original condition.
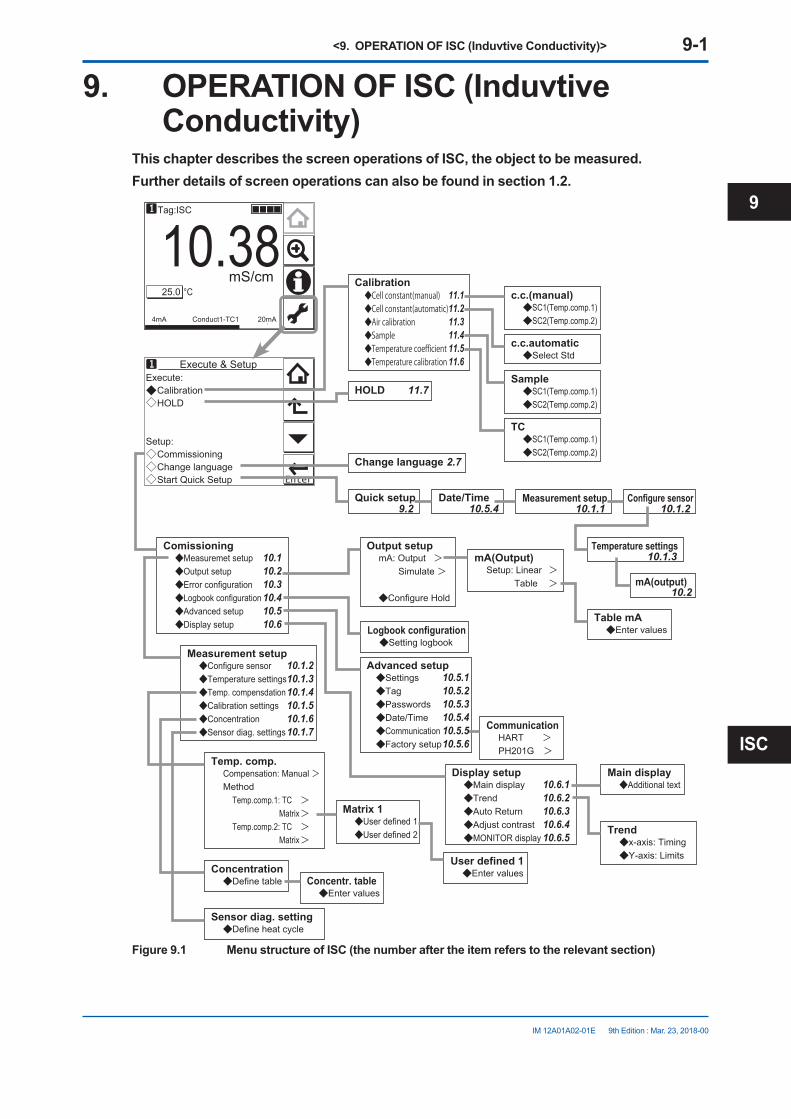
<9. OPERATION OF ISC (Induvtive Conductivity)> 9-1
IM 12A01A02-01E 9th Edition : Mar. 23, 2018-00
9. OPERATION OF ISC (Induvtive Conductivity)
This chapter describes the screen operations of ISC, the object to be measured.Further details of screen operations can also be found in section 1.2.
Execute: Calibration HOLD
Setup: Commissioning Change language Start Quick Setup
Execute & Setup
10.38Tag:ISC
25.0
4mA 20mAConduct1-TC1
°CmS/cm Calibration
Change language
HOLD
Select Stdc.c.automatic
SC1(Temp.comp.1)SC2(Temp.comp.2)
Sample
SC1(Temp.comp.1)SC2(Temp.comp.2)
c.c.(manual)
SC1(Temp.comp.1)SC2(Temp.comp.2)
TC
Cell constant(manual)Cell constant(automatic)Air calibrationSampleTemperature coefficientTemperature calibration
Configure sensorMeasurement setup
Temperature settings
mA(output)
Quick setup Date/Time
Measuremet setupOutput setupError configurationLogbook configurationAdvanced setupDisplay setup
Comissioning
Enter valuesTable mA
Setup: Linear > Table >
mA(Output)mA: Output > Simulate >
Configure Hold
Output setup
HART >PH201G >
Communication
Setting logbookLogbook configuration
SettingsTagPasswordsDate/TimeCommunicationFactory setup
Advanced setupConfigure sensorTemperature settingsTemp. compensdationCalibration settingsConcentrationSensor diag. settings
Measurement setup
Compensation: Manual >Method Temp.comp.1: TC > Matrix > Temp.comp.2: TC > Matrix >
Temp. comp.
Define heat cycleSensor diag. setting
Define tableConcentration
User defined 1User defined 2
Matrix 1
Enter valuesUser defined 1
Enter valuesConcentr. table
Main displayTrendAuto ReturnAdjust contrastMONITOR display
Display setupAdditional text
Main display
x-axis: TimingY-axis: Limits
Trend
10.110.210.310.410.510.6
2.7
11.7
10.6.110.6.210.6.310.6.410.6.5
10.5.110.5.210.5.310.5.410.5.510.5.6
11.111.211.311.411.511.6
9.2 10.5.4 10.1.1 10.1.2
10.1.3
10.1.210.1.310.1.410.1.510.1.610.1.7
10.2
Figure 9.1 Menu structure of ISC (the number after the item refers to the relevant section)
ISC
9

<9. OPERATION OF ISC (Induvtive Conductivity)> 9-2
IM 12A01A02-01E 9th Edition : Mar. 23, 2018-00
9.1 Change languageThescreenissettodisplayEnglishatfactoryshipment;ifyouwishtousetheFLXA202/FLXA21inanotherlanguage,firstselectalanguageasdescribedinsection2.7.
9.2 Quick setupThe Quick setup screen is used to set up the basic items you want to set up first, such as the date/time and sensor settings. The detailed settings are described in chapter 11, Commissioning.YoumayleavetheQuicksetupnowandreturntoitlater;however,itisrecommendedtoperformthequicksetupfirst.Each time the FLXA202/FLXA21 is started up, this screen is displayed. If it is not necessary to
change the setup, press No or .
NOTEWhen no operation is performed for 10 minutes or 60 minutes (depending on the setting of “Auto Return”), the display except Trend display automatically changes to the Monitor display (or to the Main display when the MONITOR display is disabled).

<9. OPERATION OF ISC (Induvtive Conductivity)> 9-3
IM 12A01A02-01E 9th Edition : Mar. 23, 2018-00
Temp.element Pt1000
Unit °C
Next
Start quick setup?
Yes No
Chanage language
Quick setupMeasure Conductivity
Next
Measurement setup
Format YYYY/MM/DD
Date 2010/03/03
Time 17:04:07
Date/Time
Process parameter Conduct1-TC1
0% value 0.000 nS/cm100% value 1.000 S/cm
Finish
mA(output)
Temperature settings
Measuring unit /cmCell constant 1.880 /cm(factory)
Next
Configure sensor
°C°F
YYYY/MM/DDMM/DD/YYYYDD/MM/YYYY
ConductivityConcentrationConduct.+Concenter.
Conduct1-TC1Temperature1Concent1-TC1Conduct1-TC2Concent1-TC2
/cm/m
Next
NextNext
Finish
Next
Monitor display
Pt1000NTC30k
Figure 9.2 Quick setup
n Date/TimeThe date display format can be selected from among the three types.Enter the date or time of day by using the numerical keys.Fordetails,seesection10.5.4.
n Measurement setupSelect a suitable measurement parameter from among those displayed and set it up.Measurement parameter setup can be made only when “ISC” is selected on the Sensor setup screen.For details, see section 10.1.1.
ISC
9
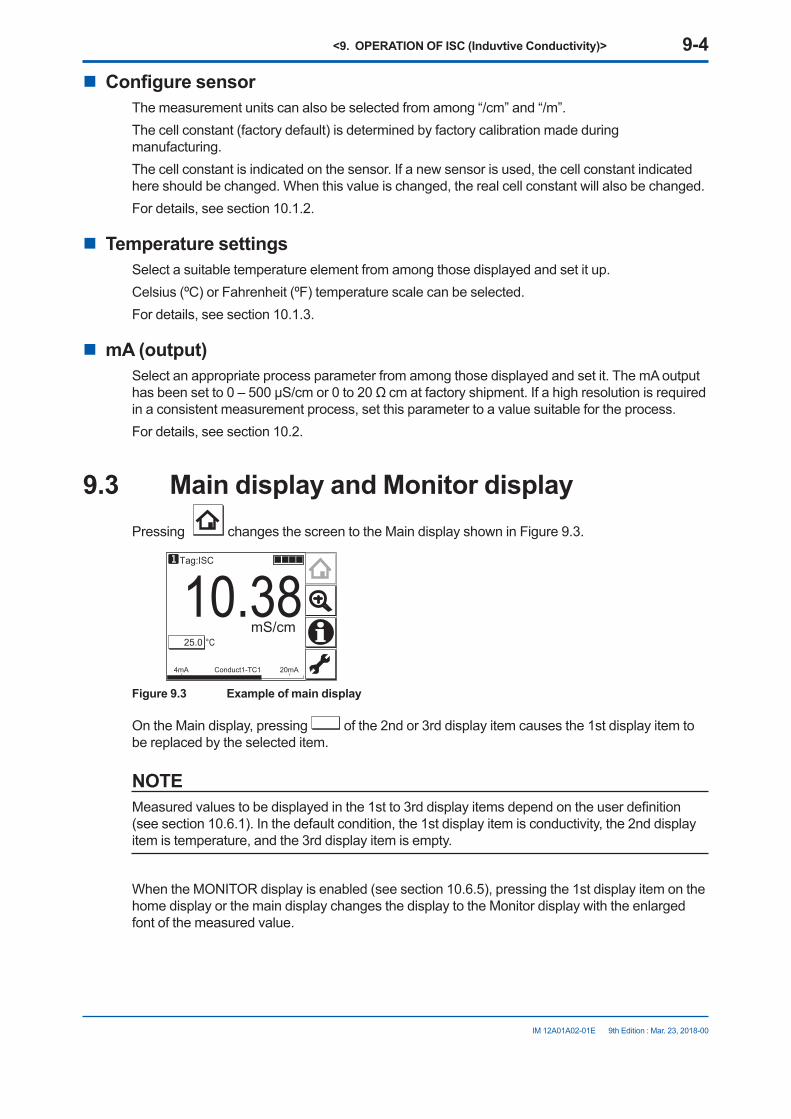
<9. OPERATION OF ISC (Induvtive Conductivity)> 9-4
IM 12A01A02-01E 9th Edition : Mar. 23, 2018-00
n Configure sensorThe measurement units can also be selected from among “/cm” and “/m”.The cell constant (factory default) is determined by factory calibration made during manufacturing.The cell constant is indicated on the sensor. If a new sensor is used, the cell constant indicated here should be changed. When this value is changed, the real cell constant will also be changed.For details, see section 10.1.2.
n Temperature settingsSelect a suitable temperature element from among those displayed and set it up.Celsius (ºC) or Fahrenheit (ºF) temperature scale can be selected.For details, see section 10.1.3.
n mA (output)Select an appropriate process parameter from among those displayed and set it. The mA output hasbeensetto0–500µS/cmor0to20Ω cm at factory shipment. If a high resolution is required in a consistent measurement process, set this parameter to a value suitable for the process.For details, see section 10.2.
9.3 Main display and Monitor displayPressing changes the screen to the Main display shown in Figure 9.3.
10.38Tag:ISC
25.0
4mA 20mAConduct1-TC1
°CmS/cm
Figure 9.3 Example of main display
On the Main display, pressing of the 2nd or 3rd display item causes the 1st display item to be replaced by the selected item.
NOTEMeasuredvaluestobedisplayedinthe1stto3rddisplayitemsdependontheuserdefinition(see section 10.6.1). In the default condition, the 1st display item is conductivity, the 2nd display item is temperature, and the 3rd display item is empty.
When the MONITOR display is enabled (see section 10.6.5), pressing the 1st display item on the home display or the main display changes the display to the Monitor display with the enlarged font of the measured value.
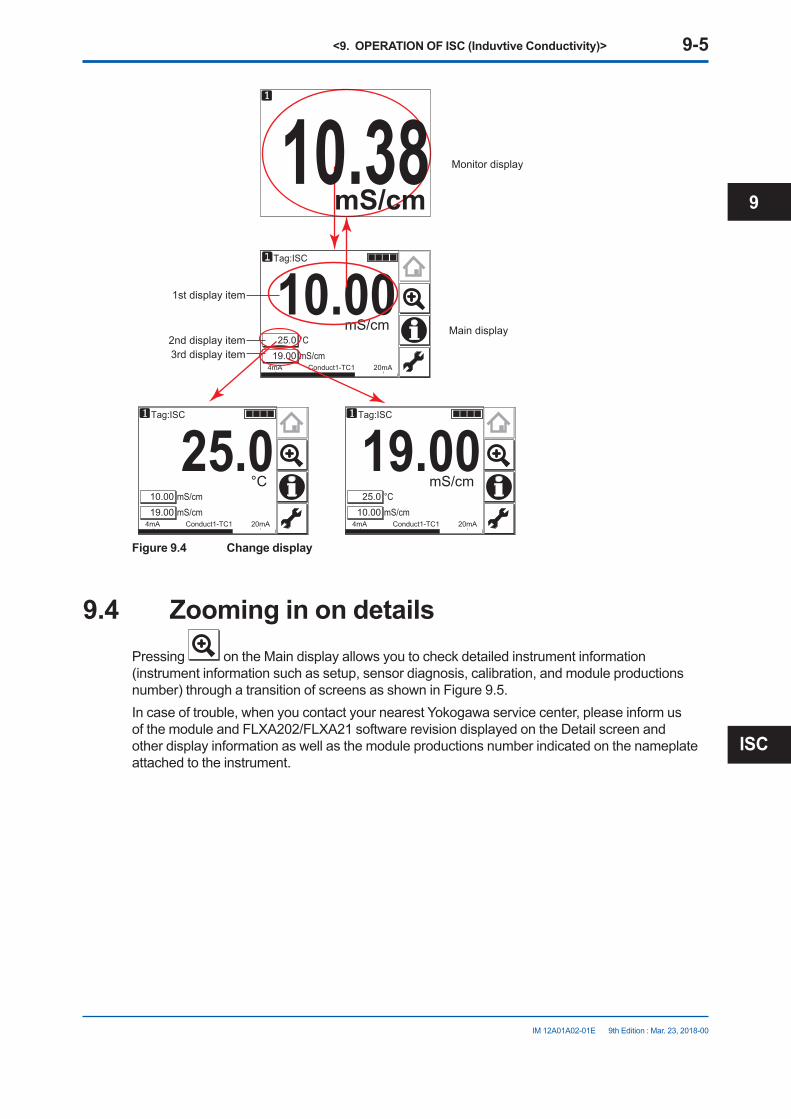
<9. OPERATION OF ISC (Induvtive Conductivity)> 9-5
IM 12A01A02-01E 9th Edition : Mar. 23, 2018-00
10.00Tag:ISC
19.0025.0
mS/cm4mA 20mAConduct1-TC1
°CmS/cm
25.0Tag:ISC
19.0010.00
mS/cm4mA 20mAConduct1-TC1
mS/cm°C
19.00Tag:ISC
10.0025.0
mS/cm4mA 20mAConduct1-TC1
°CmS/cm
2nd display itemMain display
Monitor display
3rd display item
1st display item
10.38mS/cm
Figure 9.4 Change display
9.4 Zooming in on detailsPressing on the Main display allows you to check detailed instrument information (instrument information such as setup, sensor diagnosis, calibration, and module productions number) through a transition of screens as shown in Figure 9.5.In case of trouble, when you contact your nearest Yokogawa service center, please inform us of the module and FLXA202/FLXA21 software revision displayed on the Detail screen and other display information as well as the module productions number indicated on the nameplate attached to the instrument.
ISC
9
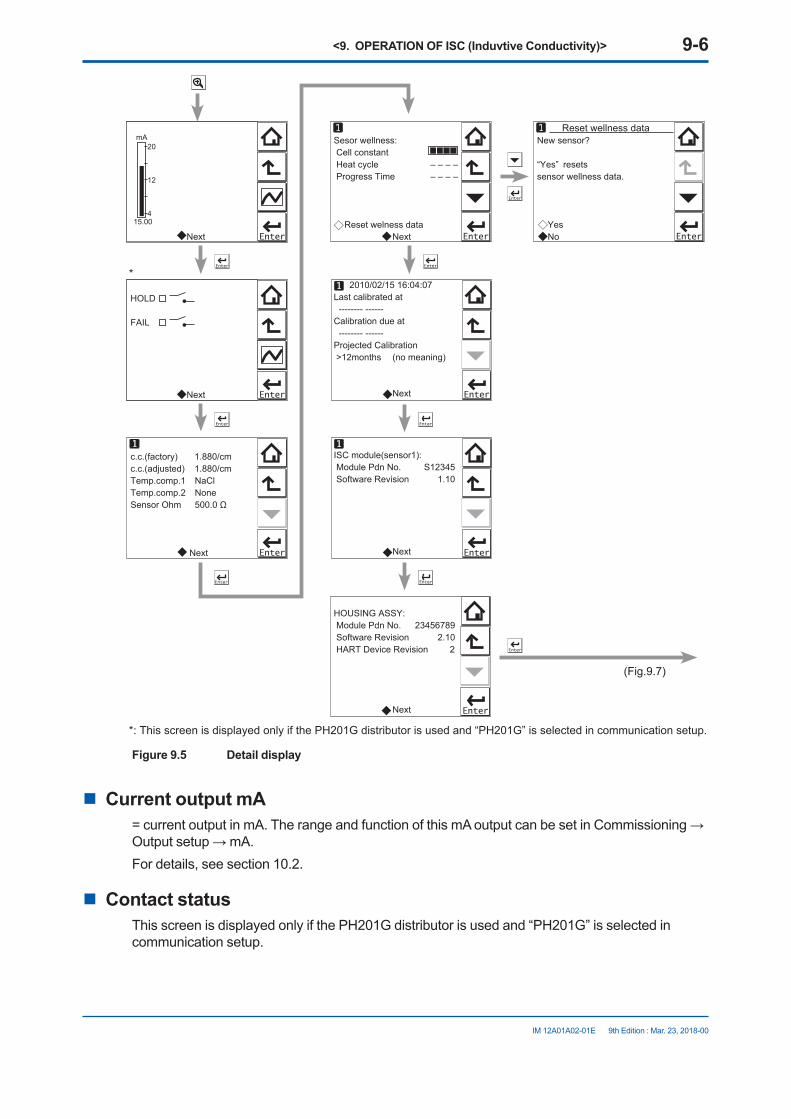
<9. OPERATION OF ISC (Induvtive Conductivity)> 9-6
IM 12A01A02-01E 9th Edition : Mar. 23, 2018-00
Next
20
12
4
mA
15.00
New sensor?
“Yes” resetssensor wellness data.
Yes No
HOUSING ASSY: Module Pdn No. 23456789 Software Revision 2.10 HART Device Revision 2
Next
Reset wellness data
HOLD
FAIL
Next
c.c.(factory) 1.880/cmc.c.(adjusted) 1.880/cmTemp.comp.1 NaClTemp.comp.2 NoneSensor Ohm 500.0 Ω
Next
Sesor wellness: Cell constant Heat cycle – – – – Progress Time – – – –
Reset welness data Next
2010/02/15 16:04:07Last calibrated at -------- ------Calibration due at -------- ------Projected Calibration >12months (no meaning)
Next
ISC module(sensor1): Module Pdn No. S12345 Software Revision 1.10
Next
(Fig.9.7)
*: This screen is displayed only if the PH201G distributor is used and “PH201G” is selected in communication setup.
*
Figure 9.5 Detail display
n Current output mA=currentoutputinmA.TherangeandfunctionofthismAoutputcanbesetinCommissioning→Outputsetup→mA.For details, see section 10.2.
n Contact statusThisscreenisdisplayedonlyifthePH201Gdistributorisusedand“PH201G”isselectedincommunication setup.

<9. OPERATION OF ISC (Induvtive Conductivity)> 9-7
IM 12A01A02-01E 9th Edition : Mar. 23, 2018-00
n c.c. (factory)This parameter displays the cell constant (factory setting).The cell constant (factory setting) is determined by factory calibration made during sensor manufacturing.ThisvaluecanbesetinCommissioning→Measurementsetup→Sensorsetup.The cell constant is indicated on the sensor or cable label.
n c.c. (adjusted)This parameter displays the cell constant (adjusted).The cell constant (adjusted) is a cell constant that has been calibrated and is set by calibration action.When the system’s cell constant is adjusted on-line by calibration using a process solution or buffersolution,anewcellconstantisloggedhere.Thedifferencebetweenthisvalueandthedefaultvaluesetatfactoryshipmentwillnotbelarge.Ifthereisalargedifferencebetweenthem,check whether the sensor is broken or contaminated.
n Temp. comp. 1This parameter shows the temperature compensation method for 1st measurement. The setting ismadeinCommissioning→Measurementsetup→Temp.comp.
n Temp. comp. 2This parameter shows the temperature compensation method for 2nd measurement. The setting ismadeinCommissioning→Measurementsetup→Temp.comp.2nd measurement does not imply that two measurements can be made individually, but it means thattwotypesofcompensationmethodscanbeconfigured,whichenablestwophasestobemonitored accurately in the same process. An example is monitoring the switching between process and washing solutions.
n Sensor OhmThis parameter represents the non-compensated resistance of the sensor.
n Sensor wellnessAt the Sensor wellness window, the soundness of a module is displayed. A larger number of n in each gauge indicates that the parameter concerned is sound. A gauge is indicated for only those parameters whose sensor wellness setting is “enabled,” while a bar (----) is displayed if the sensor wellness setting is “disabled.”SensorwellnesssetupcanbemadeinCommissioning→Measurementsetup→Sensordiag.settings. For details, see section 10.1.7.The “Reset wellness data” button can reset wellness data.When a sensor is exchanged or replaced, sensor wellness data should be reset.
NOTEWhen a sensor is replaced, the replacement can be recorded manually into a logbook. (Refer to thefigure9.7.)
ISC
9

<9. OPERATION OF ISC (Induvtive Conductivity)> 9-8
IM 12A01A02-01E 9th Edition : Mar. 23, 2018-00
n Last calibrated=dateonwhichthelastsensorcalibrationwasperformed.ThedisplayedvalueoftheZeroistheresult of this calibration. The displayed value of Slope was calibrated on this date only if the last calibration was a 2-point calibration.
n Calibration due=thedatewhenthecalibrationmustbedonenextaccordingtothesettingsofthecalibrationinterval.ThecalibrationintervalsaresetinCommissioning→Measurementsetup→Calibrationsettings→Limitsandtiming.
n Projected replacementThe projected maintenance function predicts the date when the sensor unit will need cleaning or recalibrating for maintaining measurement accuracy. The function checks the cleanliness of the sensor by monitoring the cell constant after calibration. Clean the sensor before the predicted date.The function predicts the dates when the cell constant will cross the upper or lower limits and displays the predicted date with the status (the status is displayed in parentheses).As shown in Figure 9.6, the date is predicted based on the intersection point of the upper or lower limits and the extrapolated line of the values obtained by the least squares method.
Day
Value Lower limit
Upper limit
Current date
Projected maintenance date F0310.ai
Figure 9.6
The status shows the certainty of the projected maintenance date in terms of the correlation coefficientR.Tables9.1and9.2showrespectivedisplaypatterns.
Table 9.1 Display pattern of the projected maintenance date
Projected date - - 0-1 month 1-3 months 3-6 months 6-12 months Over 1 year--: cannotbepredictableduetoinsufficientdata
Table 9.2 Display pattern of the status
Status (- - - - -)(R < 0.50)
(Poor)(0.50≤R<0.70)
(Reasonable)(0.70≤R<0.85)
(Excellent)(0.85≤R<1.00)
n ISC module (sensor)With this screen, you can check the module productions number and software revision of the installed module.
n HOUSING ASSYWiththisscreen,youcancheckthemoduleproductionsnumber,softwarerevision,andHARTdevice revision of the housing assembly.
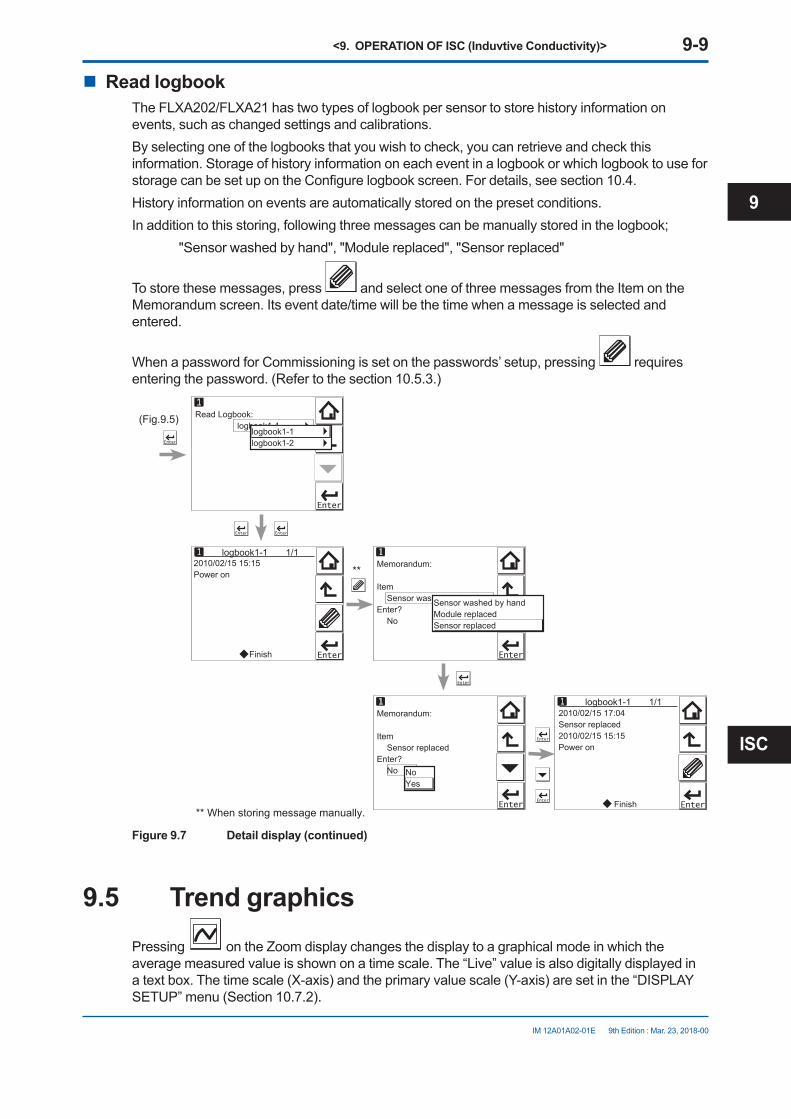
<9. OPERATION OF ISC (Induvtive Conductivity)> 9-9
IM 12A01A02-01E 9th Edition : Mar. 23, 2018-00
n Read logbookThe FLXA202/FLXA21 has two types of logbook per sensor to store history information on events, such as changed settings and calibrations.By selecting one of the logbooks that you wish to check, you can retrieve and check this information. Storage of history information on each event in a logbook or which logbook to use for storagecanbesetupontheConfigurelogbookscreen.Fordetails,seesection10.4.Historyinformationoneventsareautomaticallystoredonthepresetconditions.Inadditiontothisstoring,followingthreemessagescanbemanuallystoredinthelogbook; "Sensor washed by hand", "Module replaced", "Sensor replaced"
To store these messages, press and select one of three messages from the Item on the Memorandum screen. Its event date/time will be the time when a message is selected and entered.
When a password for Commissioning is set on the passwords’ setup, pressing requires entering the password. (Refer to the section 10.5.3.)
Read Logbook: logbook1-1
Memorandum:
Item Sensor washed by handEnter? No
logbook1-1 1/1
Memorandum:
Item Sensor replacedEnter? No
2010/02/15 17:04Sensor replaced2010/02/15 15:15Power on
Finish
2010/02/15 15:15Power on
Finish
logbook1-1 1/1
** When storing message manually.
**
(Fig.9.5)
Sensor washed by handModule replacedSensor replaced
logbook1-1logbook1-2
NoYes
Figure 9.7 Detail display (continued)
9.5 Trend graphicsPressing on the Zoom display changes the display to a graphical mode in which the average measured value is shown on a time scale. The “Live” value is also digitally displayed in a text box. The time scale (X-axis) and the primary value scale (Y-axis) are set in the “DISPLAY SETUP” menu (Section 10.7.2).
ISC
9

<9. OPERATION OF ISC (Induvtive Conductivity)> 9-10
IM 12A01A02-01E 9th Edition : Mar. 23, 2018-00
Thescreendisplaysthetrendofupto41averagesofthemeasurementforeachtimeinterval.The FLXA202/FLXA21 samples the measurements every second. The trending graphic also shows the maximum and minimum measured values in that interval.Forexample,ifthetimescaleissetto4hours,thenthetrendisshownfor4hourspriortotheactualmeasurement.Eachpointonthetrendlinerepresentstheaverageover4×60×60/41=351 measurements (seconds).
NOTEUpdating the trend screen setup resets the current trend graph and starts a new one.
12.00
8.40
5.60
2.50
12:00 12:20 12:40
10.38mS/cm
Minimum
MaximumAverage
Time
Tag:
Mea
sure
men
t val
ue (m
S/cm
)
ISC Conduct1-TC1
Current process valueMax. and min. values on this display
Figure 9.8 Trend screen
The 1st display item data on the Main display is shown as a graph. Touching any point on the display changes the display to the 2nd display item data (and to the 3rd display item data if set) and then returns to the Main display.
12.00
8.40
5.60
2.50
12:00 12:20 12:40
10.38mS/cmTag: ISC Conduct1-TC1
12.00
8.40
5.60
2.50
12:00 12:20 12:40
25.0°CTag: ISC Temperature1
Next
20
12
4
mA
15.00
Figure 9.9 Trend graphics

<9. OPERATION OF ISC (Induvtive Conductivity)> 9-11
IM 12A01A02-01E 9th Edition : Mar. 23, 2018-00
9.6 Instrument status screenIn the fieldoftheMaindisplay,the (Warning) or (Fault) sign appears according to the instrument status. Upon pressing the displayed button, detailed information of the relevant status appears.See “n Information button” on page 1-10.
9.7 Calibration and CommissioningAllowsyoutocalibrateandconfiguretheinstrument.Theseoperationscanbeprotectedwithapassword.For details on the password, refer to section 10.5.3.
Execute: Calibration HOLD
Setup: Commissioning Change language Start Quick Setup
Execute & Setup
Figure 9.10 Execute & Setup
Pressing changesthedisplaytotheExecute&Setupscreen.
Browse through the menu items by pressing untilyoufindthedesiredmenuandthenpress
to enter that menu. It is also possible to enter a desired menu by pressing the symbol beside the menu item.Forcalibration(HOLD),readchapter11,andforcommissioning,readchapter10.
ISC
9

Blank Page

<10. COMMISSIONING OF ISC (Inductive Conductivity)> 10-1
IM 12A01A02-01E 9th Edition : Mar. 23, 2018-00
10. COMMISSIONING OF ISC (Inductive Conductivity)
This chapter describes how to check and change settings from the Commissioning screen.When you move to the Commissioning screen, the output is held.
Execute: Calibration HOLD
Setup: Comissioning Change language Start Quick Setup
Execute &Setup Measurement setup Output setup Error configuration Logbook configuration Advanced setup Display setup
Commissioning
Figure 10.1 Commissioning screen
Operations in Commissioning can be password-protected. If you set up a password, always take a note of it. For details on setting a password, see section 10.5.3.
Figure 9.1 shows the commissioning procedure. Before changing any parameters, read the relevantsectionsinthisdocumentandunderstandhowthechangeofparametersaffectstheperformance of this instrument. If you set a wrong value, return it to the default setting or value and then set it again.
Onthefirststartup,theparametersarealldefaultvaluesconfiguredatthefactory.Checktheparameters in Table 10.1 and change any of them if necessary depending on the sensors to be connected and the purpose of use.Set“Measurement”first.Somemeasurementparametersandrelevantoptionschangeaccordingly. The underlined parameters in Table 10.1 are used for the quick setup.The default values and setting ranges are listed in the “User setting table of ISC” in the attached CD-ROM.Afterconfirmingthattheinstrumentoperatesnormallywiththeparameters,printoutthe“Usersetting table of ISC” and write down these parameters in the column of User Settings.All user parameters can also be saved in the instrument.SelectCommissioning→Advancedsetup→Settings→Saveusersettings(seeSection10.5.1). ISC
10

<10. COMMISSIONING OF ISC (Inductive Conductivity)> 10-2
IM 12A01A02-01E 9th Edition : Mar. 23, 2018-00
Table 10.1 Menu Structure and Default Values in “Commissioning”
Parameter Ref. sect.Measurement setup Measurement 10.1.1
Configuresensor Measuring unit 10.1.2Cell constant (factory)
Temperature settings Temp. element 10.1.3Temp. compensation Compensation 10.1.4
Reference temp.Method
Calibration settings Limits: Air adjust 10.1.5c.c.
Timing: Step RangeStabilization timeCalib.interval
Concentration Additional table 10.1.6Unit for table
Sensor diag. settings Process time: 10.1.7Heatcycle:Defineheatcycle
Output setup mA 10.2Output Process parameter
Setup Linear 0%value
100%value TableBurnDamping time
Simulate Simulation perc.ConfigureHold
Errorconfiguration 10.3
Logbookconfiguration 10.4Advanced setup Settings 10.5.1
Tag 10.5.2Passwords 10.5.3Date/Time 10.5.4Communication 10.5.5
HARTPH201G
Factory setup 10.5.6Display setup Main display 10.6.1
Trend 10.6.2Auto Return 10.6.3Adjust contrast 10.6.4MONITOR display 10.6.5
NOTEAll the parameters for the quick setup (underlined ones in Table 10.1) are crucial for measurement. If you change any of them, other parameters may be initialized. For the parameters that may initialize other values, see Appendix 3.
10.1 Measurement setupThis section describes how to set up various parameters relating to measurements.Measurements are performed based on the measurement parameter setup.

<10. COMMISSIONING OF ISC (Inductive Conductivity)> 10-3
IM 12A01A02-01E 9th Edition : Mar. 23, 2018-00
10.1.1 MeasurementSelect a measurement parameter from Conductivity, Concentration, and Conduct. + Concentr. ThesettingofthemeasurementparameterchangesthemenustructureinErrorconfiguration,Display setup, etc. accordingly.
10.1.2 Configure sensorThissectiondescribeshowtoconfigurethesensortobeconnected.
l Measuring unitEither /cm or /m can be chosen here.The process values will be expressed in S/cm or S/m.
l Cell constant (factory)The cell constant given at factory shipment is set.When a new sensor is connected, set the new cell constant which is indicated on the sensor.When a cell constant is changed, a calibrated cell constant (c.c. (adjusted)) will be the same value of the new cell constant (factory) after resetting an old one.
10.1.3 Temperature settingsSelect the temperature element used for compensation from among Pt1000 or NTC30k. Select the same type as the temperature element that is actually connected.
Celsius (°C) or Fahrenheit (°F) temperature units are available. If the unit is changed, the following values are also recalculated automatically to the new unit:
• Manual temp.• Reference temp.• Temp.coefficient• Temp. ranges in the matrix
10.1.4 Temperature compensation
l Temperature compensationTwo methods can be used: Automatic and Manual. Select Automatic when a temperature element is used or Manual when a manually set temperature is used.
NOTEWhen Manual is selected on the Temperature compensation, a process temperature should be set in the “Manual temp.” A temperature shown on the Main display is this manually set temperature.
l Reference temperatureThe temperature compensation function converts the measured conductivity value to that at the reference temperature. The reference temperature can be changed. The default value is 25ºC.
ISC
10

<10. COMMISSIONING OF ISC (Inductive Conductivity)> 10-4
IM 12A01A02-01E 9th Edition : Mar. 23, 2018-00
l Process temperature compensationSelect a temperature compensation method from among None, TC, NaCl, and Matrix. “None” does not perform the temperature compensation.
l TCThis method uses the linear compensation function.Forhowtocalculateatemperaturecoefficientofthecompensationfunction,see“l Temperaturecompensationcoefficient(TC)”onpageApp.3-1.
l NaClThis method uses the standard temperature compensation function with NaCl solution.For details, see “l NaCl (standard temperature compensation)” on page App.3-1.
l MatrixThis method uses the temperature compensation matrix, which is a table of the conductivity valuesatdifferenttemperaturesandconcentrationsforaspecificsolution.Themeasuredconductivity is compensated based on this matrix to the conductivity at the reference temperature.Preparedmatrixesanduser-definedmatrixescanbeused.Twodifferentuser-definedmatrixes are available.For details, see “l Matrix” on page App.3-3.
When the measured temperature or the precompensated conductivity is out of the range, the temperature compensation error (warning) will be issued. This is not a device error.Formoredetails,see“Temperaturecompensationerror”onApp.3-8.
Any two of these three methods can be set for conductivity measurement as “Temp.comp.1” and “Temp.comp.2”. The result of either method can be output or displayed (see “10.2 Output setup” or “10.6 Display setup”).When “Measurement” is set to “Conduct. + Concentr.” for the Measurement, only one method can be set.
NOTEThe temperature compensation is not performed around zero. In this case, a warning may be issued.
10.1.5 Calibration settingsThescreenflowdiffersdependingonthecombinationofobjectstobemeasured.
l Air adjust limitGenerally,aircalibrationisnotrequired.Toavoidtheeffectsofthecableonthemeasurementoflower conductivities such as pure water, a “zero” calibration with a dry sensor may be done.
Performazero-calibrationusingadrysensortopreventthecablefromaffectingthemeasurement. If a terminal box (BA20) and extension cable (WF10) are used, perform the zero-calibration while they are connected.Asthecalibrationisperformedinair,theresistivityisinfinite(openconnection).Higherconductivity values than the air adjust limit indicate that the cell is not in air or is still wet. To prevent wrong air calibrations, a limit must be given here.

<10. COMMISSIONING OF ISC (Inductive Conductivity)> 10-5
IM 12A01A02-01E 9th Edition : Mar. 23, 2018-00
NOTEPerform a zero check for air calibration while the temperature compensation is set to NaCl.
l c.c. highHighlimitofthecellconstantexpressedasa%ofthenominalvalue.Duringcalibrationthisvalueis used to check if the calibrated cell constant remains within reasonable limits.
l c.c. lowLowlimitofthecellconstantexpressedasa%ofthenominalvalue.Duringcalibrationthisvalueis used to check if the calibrated cell constant remains within reasonable limits.
l Step RangeSet the range over which the stability of a measured value is checked. If variations of a measured value over the stabilization time are within this set value, the measured value is judged to have stabilized.
l Stabilization timeDuring calibration, the stability of the measurement is constantly monitored. When variations of the value are within a value set in Step Range over this stabilization time set here, the value is regarded as being stable. If the value does not stabilize within 10 minutes, calibration is aborted.
l Calibration intervalSet the interval in which a new calibration must take place. If the interval set here is exceeded, theinstrumentwillbenotifiedaccordingtothesettingin“Calib.timeexceeded”intheerrorconfiguration.
10.1.6 ConcentrationThe “Concentration” can be set only when “Conduct. + Concentr.” or “Concentration” is selected for the Measurement in the Measurement setup menu.The corresponding concentration given by a measured conductivity can be shown on the Main display.
l Concentration tableConcentration can be calculated by using the temperature compensation matrix or the additional concentration table.
• By using the temperature compensation matrix Set the “Additional table” to “Disabled”. The concentration can be obtained from the
temperature compensation matrix (based on the relation between the conductivity at the reference temperature and the concentration).
SelectTemp.compensation→Method,andthenselectMatrix.Next,chooseasolutionorUserdefined1or2(seeSection10.1.4).Theconcentrationcannotbeobtainedbyanyother temperature compensation method (TC or NaCl).
• By using the additional concentration table The additional concentration table indicates the relation between the conductivity and the
concentration at the reference temperature. Set the “Additional table” to “Enabled”. The concentration can be obtained from the additional concentration table.
Afterenteringvalues,select“Yes”for“Checkvalues?”.Valuesareinterpolatedintoemptycells. If any mandatory cells are left blank, an error will be issued. An error message is also issued if there is any error in the concentration table.
After completing entering values in the additional concentration table, set “Additional table” to “Enabled”.
ISC
10
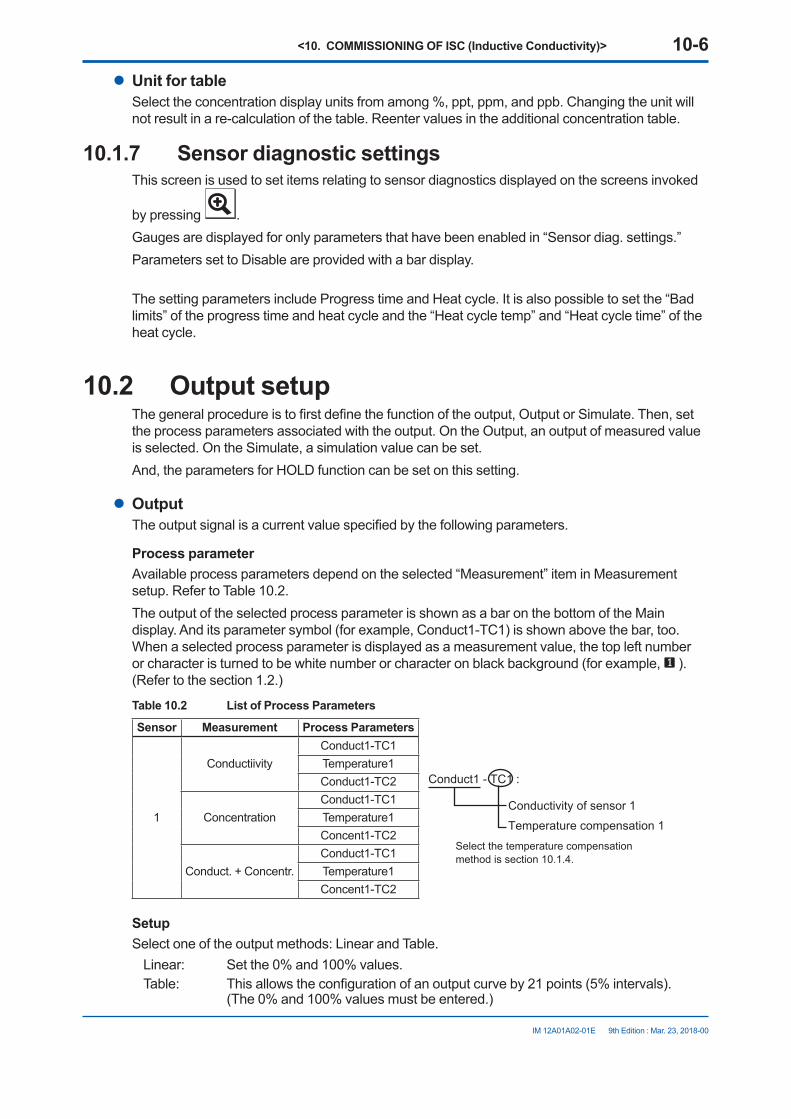
<10. COMMISSIONING OF ISC (Inductive Conductivity)> 10-6
IM 12A01A02-01E 9th Edition : Mar. 23, 2018-00
l Unit for tableSelecttheconcentrationdisplayunitsfromamong%,ppt,ppm,andppb.Changingtheunitwillnot result in a re-calculation of the table. Reenter values in the additional concentration table.
10.1.7 Sensor diagnostic settingsThis screen is used to set items relating to sensor diagnostics displayed on the screens invoked
by pressing .Gauges are displayed for only parameters that have been enabled in “Sensor diag. settings.”Parameters set to Disable are provided with a bar display.
ThesettingparametersincludeProgresstimeandHeatcycle.Itisalsopossibletosetthe“Badlimits”oftheprogresstimeandheatcycleandthe“Heatcycletemp”and“Heatcycletime”oftheheat cycle.
10.2 Output setupThegeneralprocedureistofirstdefinethefunctionoftheoutput,OutputorSimulate.Then,setthe process parameters associated with the output. On the Output, an output of measured value is selected. On the Simulate, a simulation value can be set.And,theparametersforHOLDfunctioncanbesetonthissetting.
l OutputTheoutputsignalisacurrentvaluespecifiedbythefollowingparameters.
Process parameterAvailable process parameters depend on the selected “Measurement” item in Measurement setup. Refer to Table 10.2.The output of the selected process parameter is shown as a bar on the bottom of the Main display. And its parameter symbol (for example, Conduct1-TC1) is shown above the bar, too. When a selected process parameter is displayed as a measurement value, the top left number or character is turned to be white number or character on black background (for example, ). (Refer to the section 1.2.)
Table 10.2 List of Process Parameters
Sensor Measurement Process Parameters
1
ConductiivityConduct1-TC1
Conduct1 - TC1 :
Conductivity of sensor 1
Temperature compensation 1
Select the temperature compensation method is section 10.1.4.
Temperature1Conduct1-TC2
ConcentrationConduct1-TC1Temperature1Concent1-TC2
Conduct. + Concentr.Conduct1-TC1Temperature1Concent1-TC2
SetupSelect one of the output methods: Linear and Table.Linear: Setthe0%and100%values.Table: Thisallowstheconfigurationofanoutputcurveby21points(5%intervals). (The0%and100%valuesmustbeentered.)
<10. COMMISSIONING OF ISC (Inductive Conductivity)> 10-7
IM 12A01A02-01E 9th Edition : Mar. 23, 2018-00
BurnSelectthedesignatedoutputincaseofafaultfromamongOff,Low,andHigh.See“10.3Errorconfiguration”tosettheoutput.Off: Outputdependsonthemeasuredvalue.Low: Outputisfixedto3.6mA(whenNoneissetinCommunicationsetup) Outputisfixedto3.9mA(whenHARTorPH201GisselectedinCommunicationsetup)High:Outputisfixedto22.0mA.
Damping timeThisisthetimetakenforaresponsetoastepinputchangetoreach90%ofthefinalvalue(attenuation time). Set this time in sec.
l SimulateWhenthisfunctionisselected,anoutputoftheinstrumentwillbeafixedcurrentvaluesetin%oftheoutputspan.Theoutputspanrangeis-2.5%to112.5%(3.6mAto22.0mA).When “Simulate” is selected, regardless of hold setting, the output is always simulated value.
n Configure HoldOntheConfigureHold,settingsareperformedtoholdofthemAoutputatapresetvalue.(Referto the section 11.7.) This is enabled only if “mA” is “Output.”During the Commissioning or the Quick Setup, the mA output is automatically held. The preset valuedependsonasettingonthe“Lastorfixed”.
“Last”: The preset value is a value measured just before hold condition.“Fixed”: The preset value is a value set in the “Fixed value mA”. When the “Fixed” is selected, set a mA value in the “Fixed value mA”.
Selectiononthe“HoldduringCalibration”decidestoactivateordeactivatetheholdfunctionautomatically during calibration.
“Enabled”: Activation of the automatic hold function
“Disabled”: No automatic hold function
10.3 Error configurationInErrorconfiguration,configurethestatusesofvariouserrorcauses.
This allows the system to notify the user of the occurrence of an error according to the status categoriesintheErrorconfiguration.SelectastatuscategoryfromamongOff,Warn.(Warning),andFault.“Fault”automaticallyperformsburn-out.WhenBurnhasbeensettoOff(10.2Outputsetup),onlythe error message is displayed.“Warn.” displays an error message.WhenselectingPH201Ginthecommunicationsetting,makesurethatthe“Failcontact”settingis appropriate.
The settable causes of errors are determined based on the settings of the Sensor setup and Measurement setup, and a status category is set to the causes displayed in the Errors 1/3 to 3/3 screens.
ISC
10
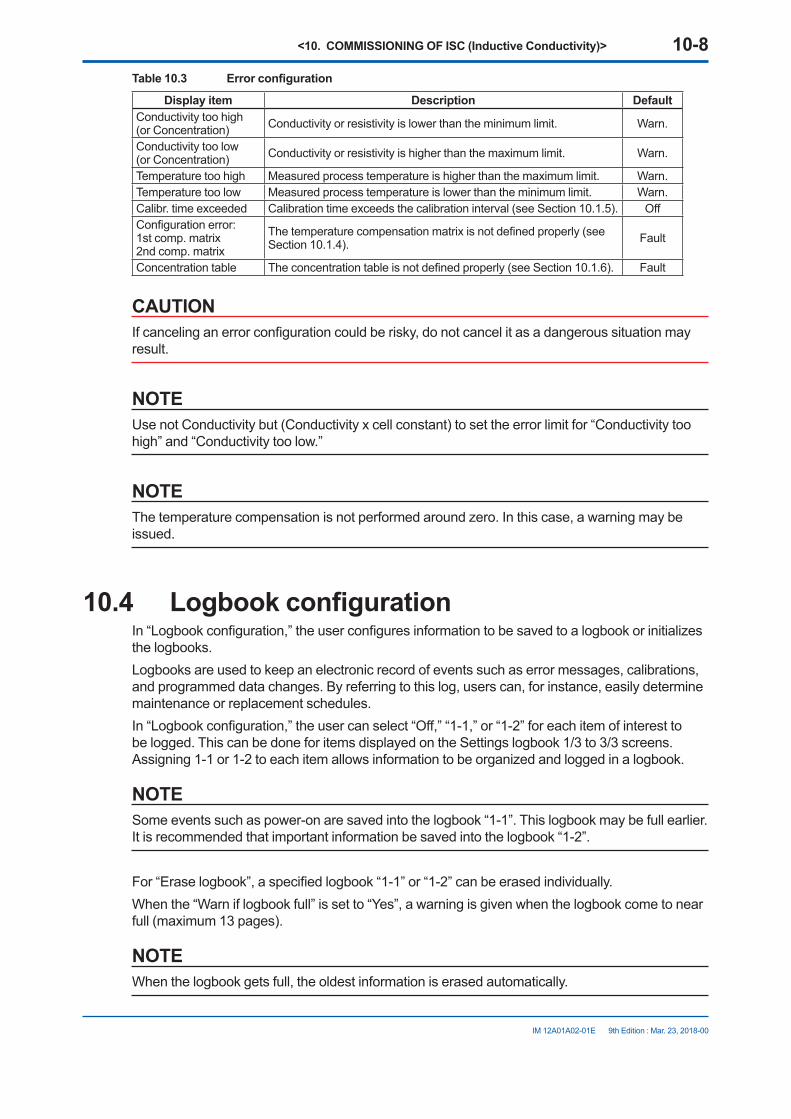
<10. COMMISSIONING OF ISC (Inductive Conductivity)> 10-8
IM 12A01A02-01E 9th Edition : Mar. 23, 2018-00
Table 10.3 Error configuration
Display item Description DefaultConductivity too high(or Concentration) Conductivity or resistivity is lower than the minimum limit. Warn.
Conductivity too low(or Concentration) Conductivity or resistivity is higher than the maximum limit. Warn.
Temperature too high Measured process temperature is higher than the maximum limit. Warn.Temperature too low Measured process temperature is lower than the minimum limit. Warn.Calibr. time exceeded Calibration time exceeds the calibration interval (see Section 10.1.5). OffConfigurationerror:1st comp. matrix2nd comp. matrix
Thetemperaturecompensationmatrixisnotdefinedproperly(seeSection10.1.4). Fault
Concentration table Theconcentrationtableisnotdefinedproperly(seeSection10.1.6). Fault
CAUTIONIfcancelinganerrorconfigurationcouldberisky,donotcancelitasadangeroussituationmayresult.
NOTEUse not Conductivity but (Conductivity x cell constant) to set the error limit for “Conductivity too high” and “Conductivity too low.”
NOTEThe temperature compensation is not performed around zero. In this case, a warning may be issued.
10.4 Logbook configurationIn“Logbookconfiguration,”theuserconfiguresinformationtobesavedtoalogbookorinitializesthe logbooks.Logbooks are used to keep an electronic record of events such as error messages, calibrations, and programmed data changes. By referring to this log, users can, for instance, easily determine maintenance or replacement schedules.In“Logbookconfiguration,”theusercanselect“Off,”“1-1,”or“1-2”foreachitemofinteresttobe logged. This can be done for items displayed on the Settings logbook 1/3 to 3/3 screens. Assigning 1-1 or 1-2 to each item allows information to be organized and logged in a logbook.
NOTESome events such as power-on are saved into the logbook “1-1”. This logbook may be full earlier. It is recommended that important information be saved into the logbook “1-2”.
For“Eraselogbook”,aspecifiedlogbook“1-1”or“1-2”canbeerasedindividually.When the “Warn if logbook full” is set to “Yes”, a warning is given when the logbook come to near full (maximum 13 pages).
NOTEWhen the logbook gets full, the oldest information is erased automatically.

<10. COMMISSIONING OF ISC (Inductive Conductivity)> 10-9
IM 12A01A02-01E 9th Edition : Mar. 23, 2018-00
10.5 Advanced setupAdvanced setup is used to set functions relating to matters other than measurements such as the selection of settings, tag setting, password setting for protecting calibration and commissioning operations, date setting, and communication setting.(“Factorysetup”isforserviceengineersonly;thereisnoitemtobesetbytheuser.)
10.5.1 SettingsIn “Settings,” select an item to be set as the default value from among “No action,” “Load factory settings,” “Save user settings,” and “Load user settings.”When the default values are loaded, the instrument will be restarted. (In the case of “Save user settings,” it will not be restarted.)The following parameters are not included in the defaults:
• Tag• The contents of all logbooks
NOTEWhen the “Save user setting” is only selected, save of the user-set parameters will start at once.
To avoid wrong selection, operation in this Settings must be done by , not by touching the menu message.
If you select “Load factory settings,” the instrument will be set to the default settings at factory shipment.When this item is selected, a screen prompting whether to restart is displayed. If this is no problem,press“Yes.”Thenthe“Loading…”messageappearsandblinksandloadingisstarted.When the factory settings have been loaded, the instrument will be restarted.When “Save user settings” is selected, the current settings can be saved as the defaults. When this item is selected, the user settings will start to be saved immediately. After saving the
parameters, press or to change the display because this save doesn’t have restart function.If “Load user settings” is selected, the settings saved as user settings can be set as the defaults.When this item is selected, a screen prompting whether to restart is displayed. If this is no problem,press“Yes.”Thenthe“Loading…”messageappearsandblinksandloadingisstarted.When the user settings have been loaded, the instrument will be restarted.
10.5.2 TagAtagprovidesasymbolicreferencetoaninstrumentandisgenerallydefinedtobeuniquethroughout the control system at one plant site. A tag can contain up to 12 alphanumeric characters. The default value is ISC or FLXA21-ISC.The tag is displayed at the top of the main display.
ISC
10

<10. COMMISSIONING OF ISC (Inductive Conductivity)> 10-10
IM 12A01A02-01E 9th Edition : Mar. 23, 2018-00
10.5.3 PasswordsCalibration and commissioning operations can be separately protected by each password. To protectexecuteoperations,enterapasswordinExecute’sinputfield.Toprotectcommissioningoperations,enterapasswordinCommissioning’sinputfield.Bydefault,bothinputfieldsareempty.Whenapasswordinputfieldisempty,operationisnotpassword-protected.Apasswordcan contain up to 8 characters.
When you set a password, always take a note of it.
When a password is set, input of the password is necessary to enter the password-protected operation. After inputting the password, the display will change to an operator ID input display. When an operator ID is input, its operation is recorded into a logbook. The input of an operator ID isnotnecessarytoentertheoperation.AnoperatorIDcancontainupto4characters.
10.5.4 Date/TimeThe Logbooks and trend graphs use the clock/calendar as a reference. The current date and time is set here. The time display format can be selected from among three types.
10.5.5 CommunicationSelectacommunicationparameterfromNone,HART,orPH201GinCommunicationsetup.Theburndowncurrentis3.9mAwhenHARTorPH201Gisselected,and3.6mAwhenNoneisselected.
NOTETomakethechangeof“Communication”valid,turnoffthepowersupplyonce,andreboot.
Inthecaseof“None,”thereisnottheproblemevenifyoudonotchangeitas“HART”ofdefaultvalueexceptthattheburndowncurrentisdifferent.
n HARTSelectthismenuwhenHARTcommunication(HART5)ismade.IntheHARTsetupscreen,specifythenetworkaddressandsetupparametersforSV,TV,andFV.(PVislinkedwiththe“processparameter”settingin“Outputsettings”andcannotbechangedhere.)
l Network addressFor 1-to-1 communication, leave the default value [0] unchanged. For multi-drop where multiple HARTdevicesareconnectedonabus,setaddressesin1to15.Inthiscase,themAoutputwillbefixedto4mA.
l PVPVisaparameterselectedforanalogoutput;itcannotbechangedhere.
l SV, TV, FVTheSV,TV,andFVparametersareitemsthattheusermustsetup.Selectableitemsdifferdepending on the sensor type in “Sensor setup” and settings in “Measurement setup.”If blank is selected for a parameter, items below that parameter must all be set to blank. If an item is blank, those below it cannot be set to a status other than blank.
FormoreinformationonHARTcommunication,seetheTechnicalInformation(TI12A01A02-60E) in the attached CD-ROM.

<10. COMMISSIONING OF ISC (Inductive Conductivity)> 10-11
IM 12A01A02-01E 9th Edition : Mar. 23, 2018-00
n PH201GSelectthismenuifthePH201Gdistributorisconnectedtotheinstrument.InthePH201Gsetupscreen,makesettingsfor“Holdcontact,”and“Failcontact.”
l Hold contactSelect Disabled or Enabled.Whenthisitemisenabled,theoutputwillbeheldaccordingtothesettingof“Holdtype”ontheHoldsetupscreen.
l Fail contactSelect a status from among “Fail + Warn,” “Fail only,” and “Disabled.”Thissettingdependsontheerrorconfiguration.See“10.3Errorconfiguration.”“Fail” corresponds to “Fault.”
10.5.6 Factory setupFor “Factory setup,” there is no item to be set by the user.
NOTEThis menu is for service engineers only. This section is protected by a password. Attempting to change data in the factory adjustment menu without the proper instructions and equipment could result in corruption of the instrument setup and damage the performance of the unit.
10.6 Display setupThis screen is used to make various settings relating to screen display.
NOTESettableitemsdifferdependingonsettingsin“Measurementsetup.”
10.6.1 Main displayThree measurement values can be set to display on the Main display as a primary value (1st line), a second value (2nd line) and a third value (3rd line) respectively.On the “Additional text”, a text of up to 12 alphanumeric characters can be assigned to each measurement value.Additional texts are displayed on the Main display, and are useful for identifying measurements. Insomecases,notall12characterscanbedisplayedduetotheletters;checkthetextsdisplayed on the Main display after setting. If a part of the text is missing, adjust the number of characters.
10.6.2 TrendThis screen is used to make settings for the Trend Graph Screen.Set the process parameters to be displayed for each trend. They can be set for the 1st to 3rd trends. When all three process parameters are set “Empty”, there is no trend display (no trend button).
ISC
10

<10. COMMISSIONING OF ISC (Inductive Conductivity)> 10-12
IM 12A01A02-01E 9th Edition : Mar. 23, 2018-00
l X-axis: TimingSelect the X-axis timing’s time span on the trend graph display from a list.
l Y-axis: LimitsSet the Y-axis high and low limits on the trend graph display on a Trend screen basis.
NOTEUpdating the trend display setup resets the current trend graph and starts a new one.
10.6.3 Auto ReturnWhen no operation is performed for the time set in “Auto Return”, the display returns to the Monitor display (or to the Main display when the MONITOR display is disabled) and the analyzer returns to a normal measuring mode. (When the Trend display is selected, the Auto Return doesn’t work.)Select the time from among Disable, 10 min, and 60 min. When the Auto Return function is not used, select “Disable.”
NOTEA default is “10 min”. When maintenance like a calibration that may take much time is performed, “60 min” or “Disable” is recommended to be selected.
10.6.4 Adjust contrastThe LCD screen contrast can be adjusted.Pressingthekeysadjuststhecontrastin11levelsfrom+5to–5(includingthedefaultvalueof “0”).
10.6.5 MONITOR displaySelect “Enable” so that the Monitor display becomes available. A default is “Enable”.DuringHoldconditionandawarning/faultcondition,theMaindisplayisdisplayedtoindicatethecondition.

<11. CALIBRATION OF ISC (Inductive Conductivity)> 11-1
IM 12A01A02-01E 9th Edition : Mar. 23, 2018-00
11. CALIBRATION OF ISC (Inductive Conductivity)
Inductive conductivity meters must be calibrated after being installed in a measurement location ormovedtoadifferentlocation.Inductive conductivity meters do not generally need to be calibrated repetitively if they have been calibrated once before the start of use. If the cell is severely contaminated or has been subject to abrasion (possibly during cleaning), calibration may be necessary.
Executeaircalibrationfirst,ifneeded.When using solutions, manual, automatic, and sample calibrations are available.
Execute: Calibration HOLD
Setup: Commissioning Change language Start Quick Setup
Execute & Setup Calibration Cell constant(manual) Cell constant(automatic) Air calibration Sample Temperature coefficient Temperature calibration
Figure 11.1 Calibration
NOTEA default is “10 min” for “Auto Return”. When maintenance like a calibration that may take much time is performed, “60 min” or “Disable” is recommended to be selected. (Refer to the section 10.6.3.)
Calibration is carried out by measuring a solution which has a known conductivity and adjusting the instrument to show the correct conductivity value.
“Cell constant (manual)”, “Cell constant (automatic)A calibration solution can be prepared in the laboratory. A salt solution is prepared with a known precise concentration. The temperature is stabilized to the reference temperature of the instrument (usually 25°C). The actual conductivity of the solution is taken from literature data. The typicalcalibrationsolutionsincludeNaClandKCl;seeAppendix3.Tocalibratetheinstrument,the sensor is removed from a process and suspended in the solution, the conductivity value from the literature data is then entered and the calibration routine completed.Make sure the sensor does not touch the sides of the container (see Figure 11.2).
“Sample calibration”This calibration uses a process solution. In this method, the conductivity of the process solution under measurement is measured with a standard instrument. In this case, care must be taken to makethemeasurementatthereferencetemperaturesincedifferencesinthetypeoftemperaturecompensation of the instruments may cause an error. With this method, it is not necessary to remove the sensor from the process. Because the sensor is immersed in the process, errors caused by the installation characteristics are compensated for.
ISC
11
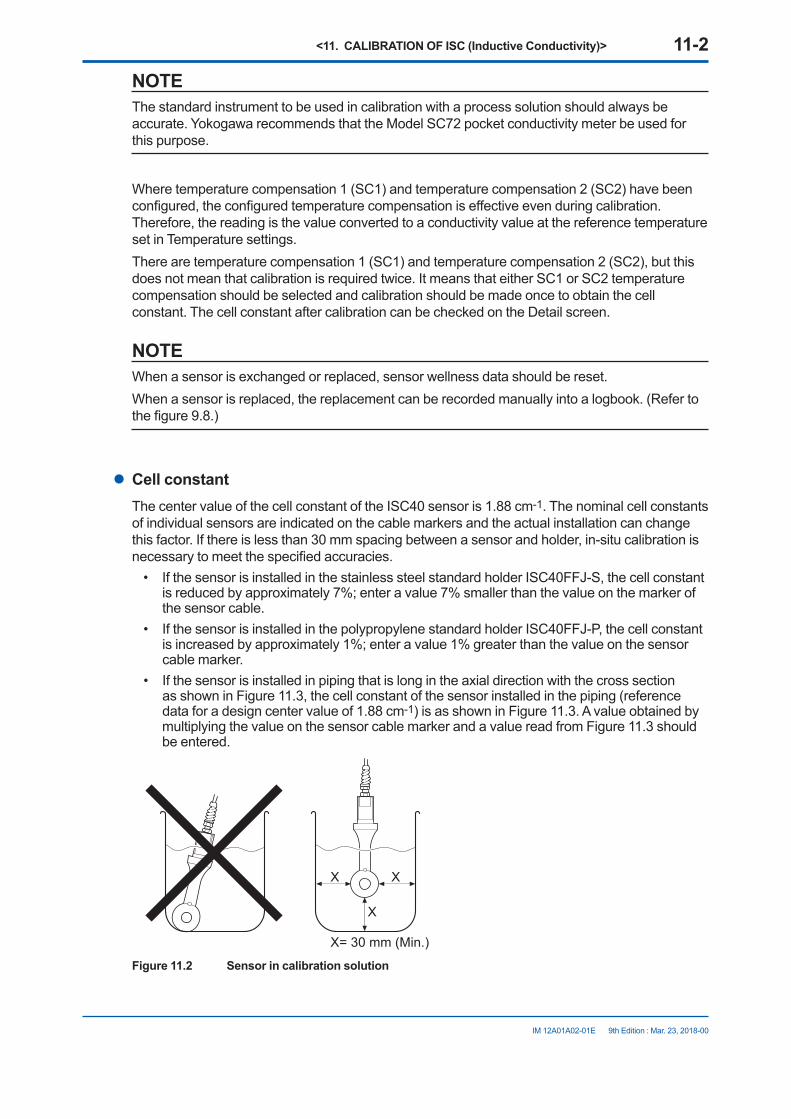
<11. CALIBRATION OF ISC (Inductive Conductivity)> 11-2
IM 12A01A02-01E 9th Edition : Mar. 23, 2018-00
NOTEThe standard instrument to be used in calibration with a process solution should always be accurate. Yokogawa recommends that the Model SC72 pocket conductivity meter be used for this purpose.
Where temperature compensation 1 (SC1) and temperature compensation 2 (SC2) have been configured,theconfiguredtemperaturecompensationiseffectiveevenduringcalibration.Therefore, the reading is the value converted to a conductivity value at the reference temperature set in Temperature settings.There are temperature compensation 1 (SC1) and temperature compensation 2 (SC2), but this does not mean that calibration is required twice. It means that either SC1 or SC2 temperature compensation should be selected and calibration should be made once to obtain the cell constant. The cell constant after calibration can be checked on the Detail screen.
NOTEWhen a sensor is exchanged or replaced, sensor wellness data should be reset.When a sensor is replaced, the replacement can be recorded manually into a logbook. (Refer to thefigure9.8.)
l Cell constantThecentervalueofthecellconstantoftheISC40sensoris1.88cm-1. The nominal cell constants of individual sensors are indicated on the cable markers and the actual installation can change this factor. If there is less than 30 mm spacing between a sensor and holder, in-situ calibration is necessarytomeetthespecifiedaccuracies.
• IfthesensorisinstalledinthestainlesssteelstandardholderISC40FFJ-S,thecellconstantisreducedbyapproximately7%;enteravalue7%smallerthanthevalueonthemarkerofthe sensor cable.
• IfthesensorisinstalledinthepolypropylenestandardholderISC40FFJ-P,thecellconstantisincreasedbyapproximately1%;enteravalue1%greaterthanthevalueonthesensorcable marker.
• If the sensor is installed in piping that is long in the axial direction with the cross section as shown in Figure 11.3, the cell constant of the sensor installed in the piping (reference data for a design center value of 1.88 cm-1) is as shown in Figure 11.3. A value obtained by multiplying the value on the sensor cable marker and a value read from Figure 11.3 should be entered.
X= 30 mm (Min.)
XX
X
Figure 11.2 Sensor in calibration solution
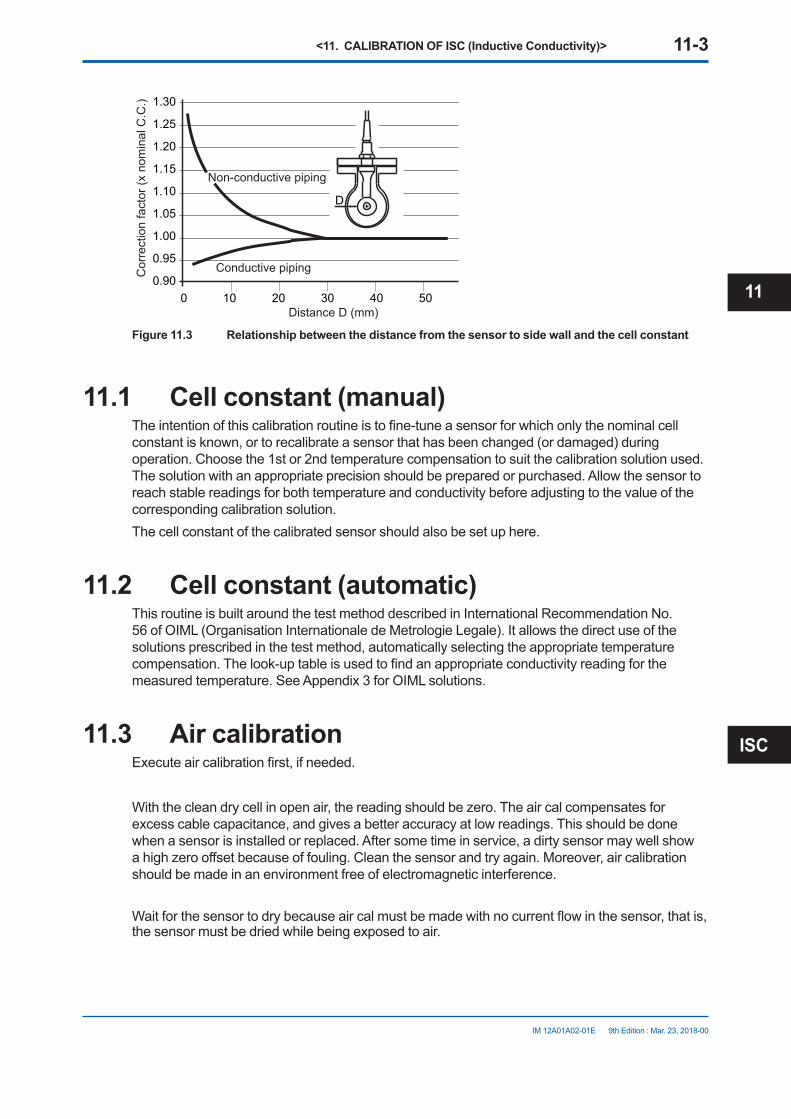
<11. CALIBRATION OF ISC (Inductive Conductivity)> 11-3
IM 12A01A02-01E 9th Edition : Mar. 23, 2018-00
D
Non-conductive piping
Conductive piping
Distance D (mm)0 10 20 30 40 50
0.90Cor
rect
ion
fact
or (x
nom
inal
C.C
.)
0.95
1.30
1.25
1.20
1.00
1.05
1.10
1.15
Figure 11.3 Relationship between the distance from the sensor to side wall and the cell constant
11.1 Cell constant (manual)Theintentionofthiscalibrationroutineistofine-tuneasensorforwhichonlythenominalcellconstant is known, or to recalibrate a sensor that has been changed (or damaged) during operation. Choose the 1st or 2nd temperature compensation to suit the calibration solution used. The solution with an appropriate precision should be prepared or purchased. Allow the sensor to reach stable readings for both temperature and conductivity before adjusting to the value of the corresponding calibration solution.The cell constant of the calibrated sensor should also be set up here.
11.2 Cell constant (automatic)This routine is built around the test method described in International Recommendation No. 56 of OIML (Organisation Internationale de Metrologie Legale). It allows the direct use of the solutions prescribed in the test method, automatically selecting the appropriate temperature compensation.Thelook-uptableisusedtofindanappropriateconductivityreadingforthemeasured temperature. See Appendix 3 for OIML solutions.
11.3 Air calibrationExecuteaircalibrationfirst,ifneeded.
With the clean dry cell in open air, the reading should be zero. The air cal compensates for excess cable capacitance, and gives a better accuracy at low readings. This should be done when a sensor is installed or replaced. After some time in service, a dirty sensor may well show ahighzerooffsetbecauseoffouling.Cleanthesensorandtryagain.Moreover,aircalibrationshould be made in an environment free of electromagnetic interference.
Waitforthesensortodrybecauseaircalmustbemadewithnocurrentflowinthesensor,thatis,the sensor must be dried while being exposed to air.
ISC
11

<11. CALIBRATION OF ISC (Inductive Conductivity)> 11-4
IM 12A01A02-01E 9th Edition : Mar. 23, 2018-00
NOTEThetemperaturecompensationshouldbesettoNaClwhenconfirmingzeroduringaircalibration.
NOTEThe temperature compensation is not performed around zero. In this case, a warning may be issued.
Not being wet, the sensor measures the conductivity of air, which is close to zero. Because zero conductivity is out of the range for temperature compensation (this range is based on the temperatureandconductivityofsolutionsandispresetto0.033μS/cmat20°C),awarningmaybe issued. This is not a device error.Theconductivityofairiszeroanditdoesnothaveatemperaturecoefficient.Executezerocalibration regardless of the warning.
11.4 SampleWith the sensor in situ, a sample can be taken for laboratory analysis. Sample calibration records the time and reading, and holds these in memory until the analysis has been completed. The laboratory data can then be entered regardless of the current process value, without the need for calculations.When sample calibration is made with temperature compensation activated, the types of temperature compensation for laboratory analysis equipment should be matched. Use of a differenttypeoftemperaturecompensationbetweenequipmentcausesanerror.Thestandardconductivity meter to be used should always be based on the accurate and same temperature compensation calculation method. Yokogawa recommends that the Model SC82 pocket conductivity meter be used for this purpose.
Press [Take Sample] to record a collected sample value in memory. Re-enter the Sample Cal. screen and press [Start calibration] to perform a sample calibration. This updates the recorded data.
11.5 Temperature coefficientSimply input the solution conductivity at the reference temperature (TR) after allowing the sensor to stabilize at elevated temperatures. The FLXA202/FLXA21 will calculate the temperature coefficientforyou.Theidealtemperatureforthiscalibrationisthenormalprocessvalue(TP).This calibration is enabled if the Temperature Compensation is set to “TC.” (Refer to section 10.1.4)
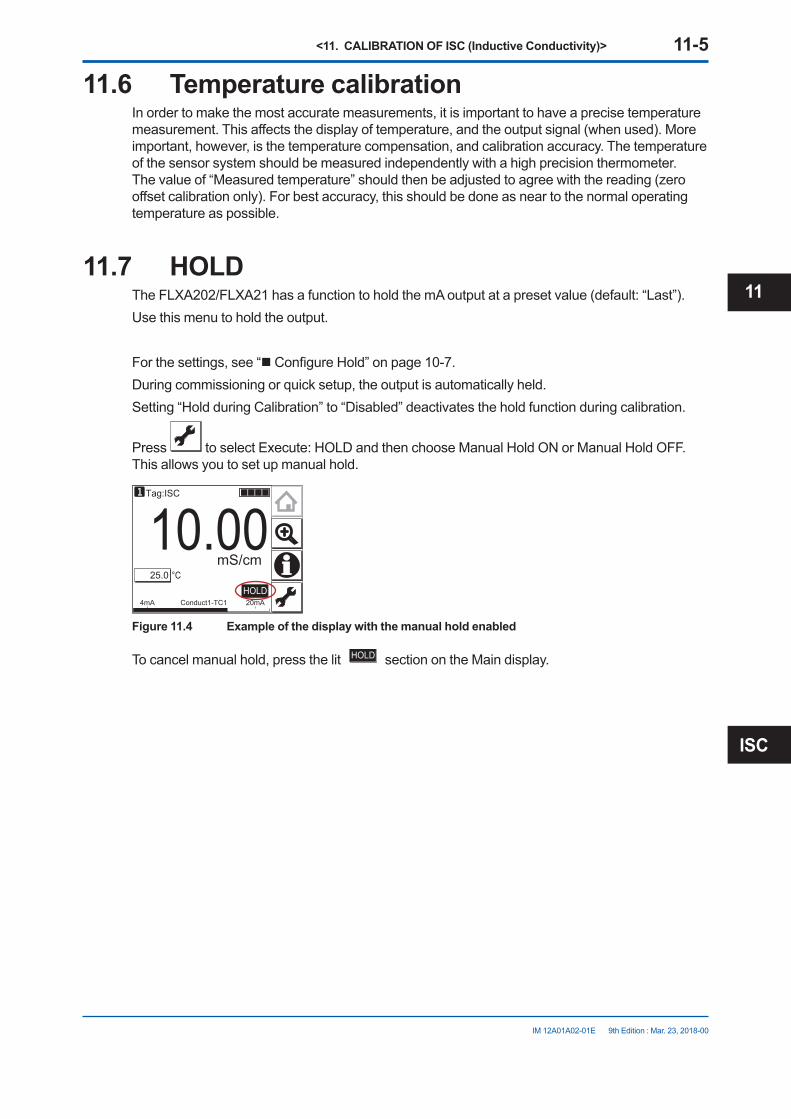
<11. CALIBRATION OF ISC (Inductive Conductivity)> 11-5
IM 12A01A02-01E 9th Edition : Mar. 23, 2018-00
11.6 Temperature calibrationIn order to make the most accurate measurements, it is important to have a precise temperature measurement.Thisaffectsthedisplayoftemperature,andtheoutputsignal(whenused).Moreimportant, however, is the temperature compensation, and calibration accuracy. The temperature of the sensor system should be measured independently with a high precision thermometer. The value of “Measured temperature” should then be adjusted to agree with the reading (zero offsetcalibrationonly).Forbestaccuracy,thisshouldbedoneasneartothenormaloperatingtemperature as possible.
11.7 HOLDThe FLXA202/FLXA21 has a function to hold the mA output at a preset value (default: “Last”).Use this menu to hold the output.
For the settings, see “nConfigureHold”onpage10-7.During commissioning or quick setup, the output is automatically held.Setting“HoldduringCalibration”to“Disabled”deactivatestheholdfunctionduringcalibration.
Press toselectExecute:HOLDandthenchooseManualHoldONorManualHoldOFF.This allows you to set up manual hold.
10.00Tag:ISC
25.0
4mA 20mAConduct1-TC1
°CmS/cm
HOLD
Figure 11.4 Example of the display with the manual hold enabled
To cancel manual hold, press the lit HOLD section on the Main display.
ISC
11

Blank Page
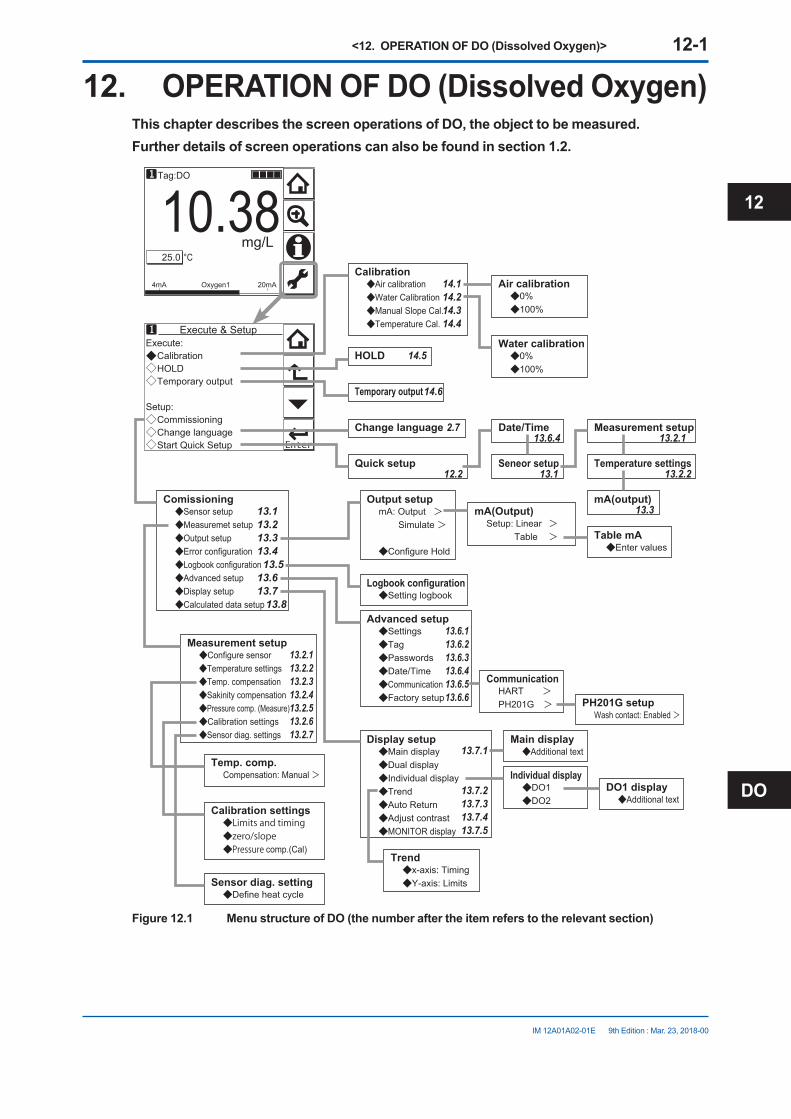
<12. OPERATION OF DO (Dissolved Oxygen)> 12-1
IM 12A01A02-01E
12. OPERATION OF DO (Dissolved Oxygen)This chapter describes the screen operations of DO, the object to be measured.Further details of screen operations can also be found in section 1.2.
Execute: Calibration HOLD Temporary output
Setup: Commissioning Change language Start Quick Setup
Execute & Setup
10.38Tag:DO
25.0
4mA 20mAOxygen1
°Cmg/L
0%100%
Water calibration
0%100%
Air calibrationAir calibrationWater CalibrationManual Slope Cal.Temperature Cal.
Calibration
Quick setup Seneor setup
Date/Time Measurement setup
Temperature settings
mA(output)
Change language
HOLD
Configure sensorTemperature settingsTemp. compensationSakinity compensationPressure comp. (Measure)Calibration settingsSensor diag. settings
Measurement setup
Compensation: Manual >Temp. comp.
Define heat cycleSensor diag. setting
Limits and timingzero/slopePressure comp.(Cal)
Calibration settings
Temporary output
Sensor setupMeasuremet setupOutput setupError configurationLogbook configurationAdvanced setupDisplay setupCalculated data setup
Comissioning
HART >PH201G >
Communication
Setting logbookLogbook configuration
Enter valuesTable mA
Setup: Linear > Table >
mA(Output)mA: Output > Simulate >
Configure Hold
Output setup
SettingsTagPasswordsDate/TimeCommunicationFactory setup
Advanced setup
Wash contact: Enabled >PH201G setup
Main displayDual displayIndividual displayTrendAuto ReturnAdjust contrastMONITOR display
Display setup
x-axis: TimingY-axis: Limits
Trend
DO1DO2
Individual display
Additional textDO1 display
Additional textMain display
2.7
12.2
13.6.4
13.1
13.2.1
13.2.2
13.3
14.114.214.314.4
14.5
14.6
13.2.113.2.213.2.313.2.413.2.513.2.613.2.7
13.7.1
13.7.213.7.313.7.413.7.5
13.113.213.313.4 13.513.613.7 13.8
13.6.113.6.213.6.313.6.413.6.513.6.6
Figure 12.1 Menu structure of DO (the number after the item refers to the relevant section)
9th Edition : Mar. 23, 2018-00
DO
12
<12. OPERATION OF DO (Dissolved Oxygen)> 12-2
IM 12A01A02-01E
12.1 Change languageThescreenissettodisplayEnglishatfactoryshipment;ifyouwishtousetheFLXA202/FLXA21inanotherlanguage,firstselectalanguageasdescribedinsection2.7.
12.2 Quick setupTheQuicksetupscreenisusedtosetupthebasicitemsyouwanttosetupfirst,suchasthedate/timeandsensorsettings.Thedetailedsettingsaredescribedinchapter14,Commissioning.YoumayleavetheQuicksetupnowandreturntoitlater;however,itisrecommendedtoperformthequicksetupfirst.Each time the FLXA202/FLXA21 is started up, this screen is displayed. If it is not necessary to
change the setup, press No or .
NOTEWhen no operation is performed for 10 minutes or 60 minutes (depending on the setting of “Auto Return”), the display except Trend display automatically changes to the Monitor display (or to the MaindisplayortheHomedisplaywhentheMONITORdisplayisdisabled).
9th Edition : Mar. 23, 2018-00

<12. OPERATION OF DO (Dissolved Oxygen)> 12-3
IM 12A01A02-01E
Temp.element Pt1000
Unit °C
Next
Start quick setup?
Yes No
Chanage language
Quick setupSensor type Galvanic
Next
Sensor setup
Format YYYY/MM/DD
Date 2010/03/03
Time 17:04:07
Date/Time
Process parameter Oxygen1
0% value 0.00 pH100% value 14.00pH
Finish
mA(output)
Temperature settings
Unit mg/Lsensor sensitivity 0.45A/ppm(50um)sensor type Others
Next
Configure sensor
°C°F
YYYY/MM/DDMM/DD/YYYYDD/MM/YYYY
GalvanicPolarographic
Oxygen1Temperature1Oxygen2Temperature2
0.45µA/ppm(50um)0.90µA/ppm(25um)OthersOthersDO30G
Pt1000NTC22k
Next
NextNext
Finish
Next
Monitor displaymg/Lppmppb%SAT
*1
*1: If two sensors are connected, the second sensor can also be set up.
Figure 12.2 Quick setup
n Date/TimeThe date display format can be selected from among the three types.Enter the date or time of day by using the numerical keys.Fordetails,seesection13.6.4.
n Sensor setupSelect a suitable electrode from among the displayed electrode types and set it up.For details, see section 13.1.
9th Edition : Mar. 23, 2018-00
DO
12

<12. OPERATION OF DO (Dissolved Oxygen)> 12-4
IM 12A01A02-01E
n Configure sensorOn this screen, select the units and set the sensor sensitivity. If Polarograph is selected for the sensor type, the polarograph application voltage can also be set. For details, see section 13.2.1.ForDO30G,setthesensortypeto“DO30G”.TheAvailableKOHparameteronthedetaildisplaywill be enabled.
n Temperature settingsSelect a suitable temperature element from among those displayed and set it up.Celsius (ºC) or Fahrenheit (ºF) temperature scale can be selected.For details, see section 13.2.2.
n mA (output)Select an appropriate process parameter from among those displayed and set it. If it is necessary to improve the resolution, set it to a value suitable for the relevant process.For details, see section 13.3.
12.3 Home display, Main display and Monitor display
Pressing changes the screen to the Main display shown in Figure 12.3(ortheHomedisplayshowninFigure12.4).
If two sensors are connected, pressing on the Main display changes the display to the HomedisplayshowninFigure12.4.
If only one sensor is connected, is grayed out and disabled on the Main display.
10.38Tag:DO
25.0
4mA 20mAOxygen1
°Cmg/L
Figure 12.3 Example of main display
6.35Tag:DO
24.9
4mA 20mAOxygen1
°Cmg/L
Tag:DO25.0 °C
mg/L
10.38
Figure 12.4 Example of home display
OntheHomedisplay,pressing of the 1st sensor (top) or 2nd sensor (bottom) causes the display of the selected sensor to appear on the Main display.
9th Edition : Mar. 23, 2018-00

<12. OPERATION OF DO (Dissolved Oxygen)> 12-5
IM 12A01A02-01E
On the Main display, pressing of the 2nd or 3rd display item causes the 1st display item to be replaced by the selected item.
NOTEMeasuredvaluestobedisplayedinthe1stto3rddisplayitemsdependontheuserdefinition(seesection13.7.1). In the default condition, the 1st display item is oxygen, the 2nd display item is temperature, and the 3rd display item is empty.
When the MONITOR display is enabled (see section 13.7.5), pressing the 1st display item on the home display or the main display changes the display to the Monitor display with the enlarged font of the measured value.
6.35Tag:DO
24.9
4mA 20mAOxygen1
°Cmg/L
Tag:DO25.0 °C
mg/L
10.38
10.38Tag:DO
19.0025.0
mg/L4mA 20mAOxygen1
°Cmg/L
25.0Tag:DO
19.0010.38
mg/L4mA 20mAOxygen1
mg/L°C
19.00Tag:DO
10.3825.0
mg/L4mA 20mAOxygen1
°Cmg/L
2nd display itemMain display
Home display
3rd display item
1st display item
24.40 mg/L
19.00 mg/L
6.35Tag:DO
24.4024.9
mg/L4mA 20mAOxygen2
°Cmg/L
(When the MONITOR display is disabled)
Monitor display
10.38mg/L 6.35
mg/L
Figure 12.5 Change display
12.4 Zooming in on detailsPressing on the Main display allows you to check detailed instrument information (instrument information such as setup, sensor diagnosis, calibration, and module productions number) through a transition of screens as shown in Figure 12.6.In case of trouble, when you contact your nearest Yokogawa service center, please inform us of the module and FLXA202/FLXA21 software revision displayed on the Detail screen and other display information as well as the module productions number indicated on the nameplate attached to the instrument.
9th Edition : Mar. 23, 2018-00
DO
12

<12. OPERATION OF DO (Dissolved Oxygen)> 12-6
IM 12A01A02-01E
Next
20
12
4
mA
15.00
HOLD
FAIL
WASH
Next
New sensor?
“Yes” resetssensor wellness data.
Yes No
HOUSING ASSY: Module Pdn No. 23456789 Software Revision 2.10 HART Device Revision 2
Next
Reset wellness data
Zero Current 0.00 µASlope 100.0 %Sensor Current 0.00 µAAvailable KOH 100 %Compensation: NaCl Disable Press(Process) 101.3 kPa (Cal.) 101.3 kPa Next
Sesor wellness: Slope Heat cycle – – – – Progress Time – – – –
Reset welness data Next
DO module(sensor1): Module Pdn No. S12345 Software Revision 1.10
Next
2010/02/15 16:04:07Last calibrated at -------- ------Calibration due at -------- ------
Next
(Fig.12.7)
*: This screen is displayed only if the PH201G distributor is used and “PH201G” is selected in communication setup.
*
Figure 12.6 Detail display
n Current output mA=currentoutputinmA.TherangeandfunctionofthismAoutputcanbesetinCommissioning→Outputsetup→mA.For details, see section 13.3.
n Contact statusThisscreenisdisplayedonlyifthePH201Gdistributorisusedand“PH201G”isselectedincommunication setup.
9th Edition : Mar. 23, 2018-00

<12. OPERATION OF DO (Dissolved Oxygen)> 12-7
IM 12A01A02-01E
n Zero Current=Theoffsetvalueofacalibratedsensor.Thisistheoffsetofthesensorandsensorcircuitinthezero oxygen condition.
n SlopeThis parameter indicates the sensitivity of the sensor after calibration. It is indicated as a percentage of the reference sensitivity based on the selection of the sensor or that has been entered.
n Sensor Current=Therawoutputofthesensorbeforeitiscalibratedandtemperaturecompensated.
n Available KOHWhenthesensortypeunderConfiguresensorissetto“DO30G”,anumberisdisplayed.Whenset to “Others”, a bar (----) is displayed.ThisparameterindicatestheamountofavailableKOHremaininginthesensor.ThisamountiscalculatedanddisplayedbytotalizingtheamountofKOHconsumedbydissolvedoxygenmeasurements.When replacing the solution in the sensor, calibration should be made to reset (clear) diagnostic sensor data.
n CompensationFor compensation of measured value, salinity compensation and pressure compensation are available. To use pressure compensation, enter the pressure level directly.
n Sensor wellnessAt the Sensor wellness window, the soundness of a module is displayed. A larger number of n in each gauge indicates that the parameter concerned is sound. A gauge is indicated for only those parameters whose sensor wellness setting is “enabled,” while a bar (----) is displayed if the sensor wellness setting is “disabled.”SensorwellnesssetupcanbemadeinCommissioning→Measurementsetup→Sensordiag.settings. For details, see section 13.2.7.The “Reset wellness data” button can reset wellness data.When a sensor or a membrane is exchanged or replaced, sensor wellness data should be reset.
NOTEWhen a sensor is replaced, the replacement can be recorded manually into a logbook. (Refer to thefigure12.7.)
n Last calibrated=dateonwhichthelastsensorcalibrationwasperformed.ThedisplayedvalueoftheZeroistheresult of this calibration. The displayed value of Slope was calibrated on this date only if the last calibration was a 2-point calibration.
n Calibration due=thedatewhenthecalibrationmustbedonenextaccordingtothesettingsofthecalibrationinterval.ThecalibrationintervalsaresetinCommissioning→Measurementsetup→Calibrationsettings→Limitsandtiming.
9th Edition : Mar. 23, 2018-00
DO
12

<12. OPERATION OF DO (Dissolved Oxygen)> 12-8
IM 12A01A02-01E
n DO module (sensor)With this screen, you can check the module productions number and software revision of the installed module.
n HOUSING ASSYWiththisscreen,youcancheckthemoduleproductionsnumber,softwarerevision,andHARTdevice revision of the housing assembly.
n Read logbookThe FLXA202/FLXA21 has two types of logbook per sensor to store history information on events, such as changed settings and calibrations.By selecting one of the logbooks that you wish to check, you can retrieve and check this information. Storage of history information on each event in a logbook or which logbook to use for storagecanbesetupontheConfigurelogbookscreen.Fordetails,seesection13.5.Historyinformationoneventsareautomaticallystoredonthepresetconditions.Inadditiontothisstoring,followingthreemessagescanbemanuallystoredinthelogbook; "Sensor washed by hand", "Module replaced", "Sensor replaced"
To store these messages, press and select one of three messages from the Item on the Memorandum screen. Its event date/time will be the time when a message is selected and entered.
When a password for Commissioning is set on the passwords’ setup, pressing requires entering the password. (Refer to the section 13.6.3.)
Read Logbook: logbook1-1
Memorandum:
Item Sensor washed by handEnter? No
logbook1-1 1/1
Memorandum:
Item Sensor replacedEnter? No
2010/02/15 17:04Sensor replaced2010/02/15 15:15Power on
Finish
2010/02/15 15:15Power on
Finish
logbook1-1 1/1
** When storing message manually.
**
(Fig.12.6)
Sensor washed by handModule replacedSensor replaced
logbook1-1logbook1-2
NoYes
Figure 12.7 Detail display (continued)
9th Edition : Mar. 23, 2018-00
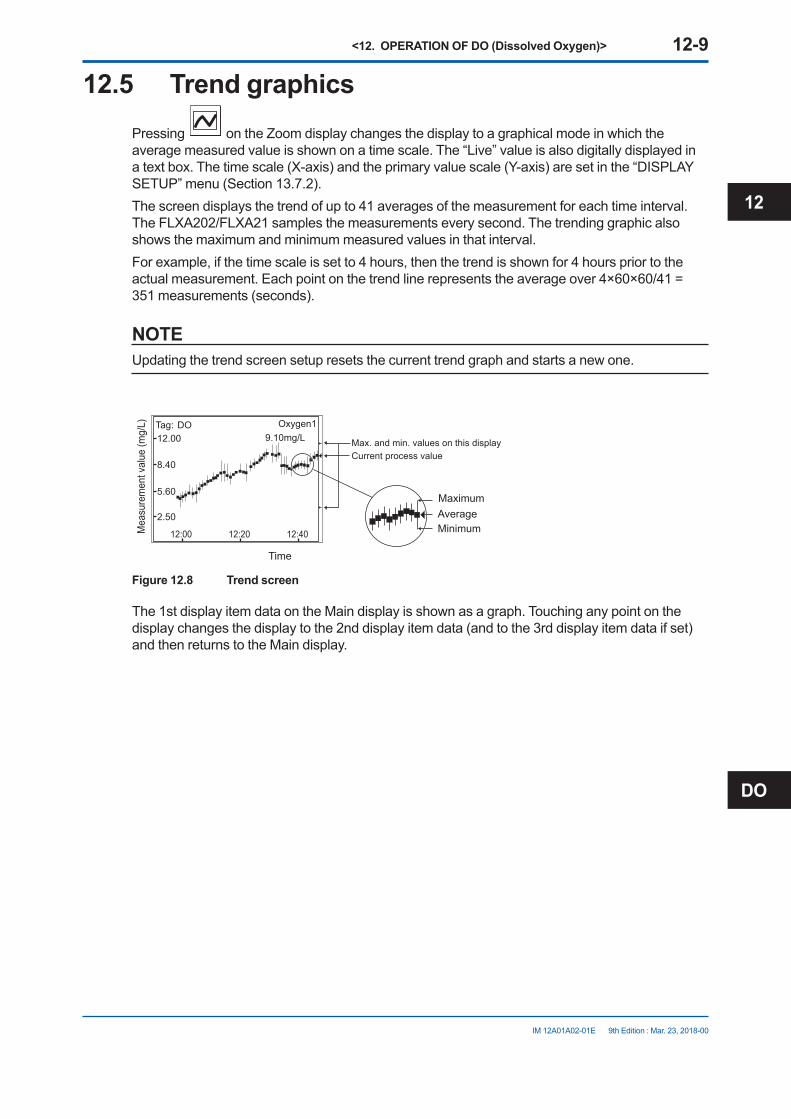
<12. OPERATION OF DO (Dissolved Oxygen)> 12-9
IM 12A01A02-01E
12.5 Trend graphicsPressing on the Zoom display changes the display to a graphical mode in which the average measured value is shown on a time scale. The “Live” value is also digitally displayed in a text box. The time scale (X-axis) and the primary value scale (Y-axis) are set in the “DISPLAY SETUP” menu (Section 13.7.2).Thescreendisplaysthetrendofupto41averagesofthemeasurementforeachtimeinterval.The FLXA202/FLXA21 samples the measurements every second. The trending graphic also shows the maximum and minimum measured values in that interval.Forexample,ifthetimescaleissetto4hours,thenthetrendisshownfor4hourspriortotheactualmeasurement.Eachpointonthetrendlinerepresentstheaverageover4×60×60/41=351 measurements (seconds).
NOTEUpdating the trend screen setup resets the current trend graph and starts a new one.
12.00
8.40
5.60
2.50
12:00 12:20 12:40
9.10mg/L
Minimum
MaximumAverage
Time
Tag:
Mea
sure
men
t val
ue (m
g/L) DO Oxygen1
Current process valueMax. and min. values on this display
Figure 12.8 Trend screen
The 1st display item data on the Main display is shown as a graph. Touching any point on the display changes the display to the 2nd display item data (and to the 3rd display item data if set) and then returns to the Main display.
9th Edition : Mar. 23, 2018-00
DO
12
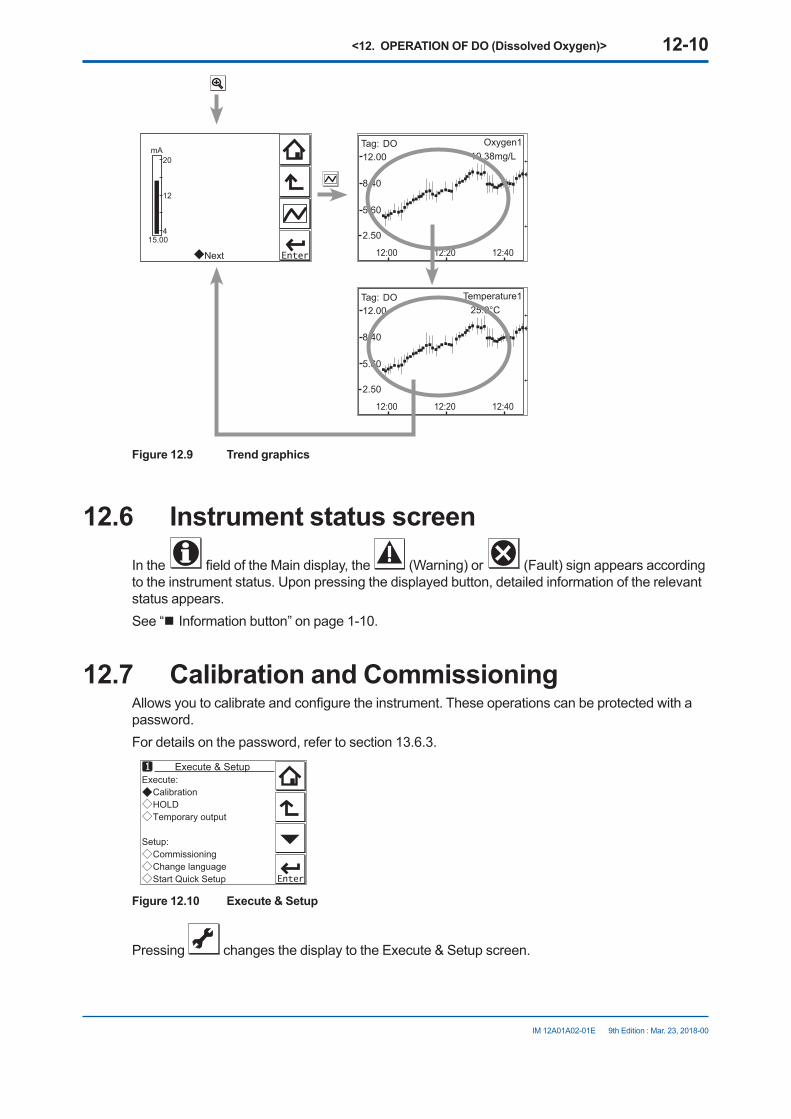
<12. OPERATION OF DO (Dissolved Oxygen)> 12-10
IM 12A01A02-01E
12.00
8.40
5.60
2.50
12:00 12:20 12:40
10.38mg/LTag: DO Oxygen1
12.00
8.40
5.60
2.50
12:00 12:20 12:40
25.0°CTag: DO Temperature1
Next
20
12
4
mA
15.00
Figure 12.9 Trend graphics
12.6 Instrument status screenIn the fieldoftheMaindisplay,the (Warning) or (Fault) sign appears according to the instrument status. Upon pressing the displayed button, detailed information of the relevant status appears.See “n Information button” on page 1-10.
12.7 Calibration and CommissioningAllowsyoutocalibrateandconfiguretheinstrument.Theseoperationscanbeprotectedwithapassword.For details on the password, refer to section 13.6.3.
Execute: Calibration HOLD Temporary output
Setup: Commissioning Change language Start Quick Setup
Execute & Setup
Figure 12.10 Execute & Setup
Pressing changesthedisplaytotheExecute&Setupscreen.
9th Edition : Mar. 23, 2018-00
<12. OPERATION OF DO (Dissolved Oxygen)> 12-11
IM 12A01A02-01E
Browse through the menu items by pressing untilyoufindthedesiredmenuandthenpress
to enter that menu. It is also possible to enter a desired menu by pressing the symbol beside the menu item.Forcalibration(HOLD,Temporaryoutput),readchapter14,andforcommissioning,readchapter13.
9th Edition : Mar. 23, 2018-00
DO
12

Blank Page
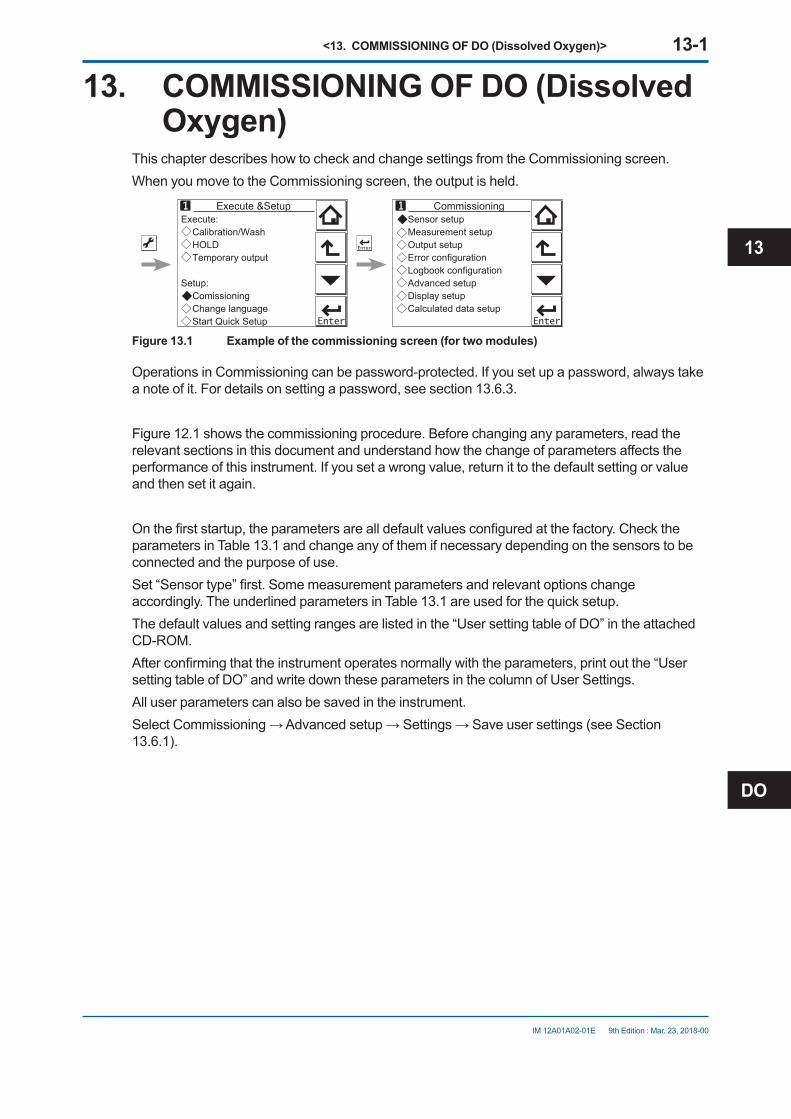
<13. COMMISSIONING OF DO (Dissolved Oxygen)> 13-1
IM 12A01A02-01E 9th Edition : Mar. 23, 2018-00
13. COMMISSIONING OF DO (Dissolved Oxygen)
This chapter describes how to check and change settings from the Commissioning screen.When you move to the Commissioning screen, the output is held.
Execute: Calibration/Wash HOLD Temporary output
Setup: Comissioning Change language Start Quick Setup
Execute &Setup Sensor setup Measurement setup Output setup Error configuration Logbook configuration Advanced setup Display setup Calculated data setup
Commissioning
Figure 13.1 Example of the commissioning screen (for two modules)
Operations in Commissioning can be password-protected. If you set up a password, always take a note of it. For details on setting a password, see section 13.6.3.
Figure 12.1 shows the commissioning procedure. Before changing any parameters, read the relevantsectionsinthisdocumentandunderstandhowthechangeofparametersaffectstheperformance of this instrument. If you set a wrong value, return it to the default setting or value and then set it again.
Onthefirststartup,theparametersarealldefaultvaluesconfiguredatthefactory.Checktheparameters in Table 13.1 and change any of them if necessary depending on the sensors to be connected and the purpose of use.Set“Sensortype”first.Somemeasurementparametersandrelevantoptionschangeaccordingly. The underlined parameters in Table 13.1 are used for the quick setup.The default values and setting ranges are listed in the “User setting table of DO” in the attached CD-ROM.Afterconfirmingthattheinstrumentoperatesnormallywiththeparameters,printoutthe“Usersetting table of DO” and write down these parameters in the column of User Settings.All user parameters can also be saved in the instrument.SelectCommissioning→Advancedsetup→Settings→Saveusersettings(seeSection13.6.1).
DO
13
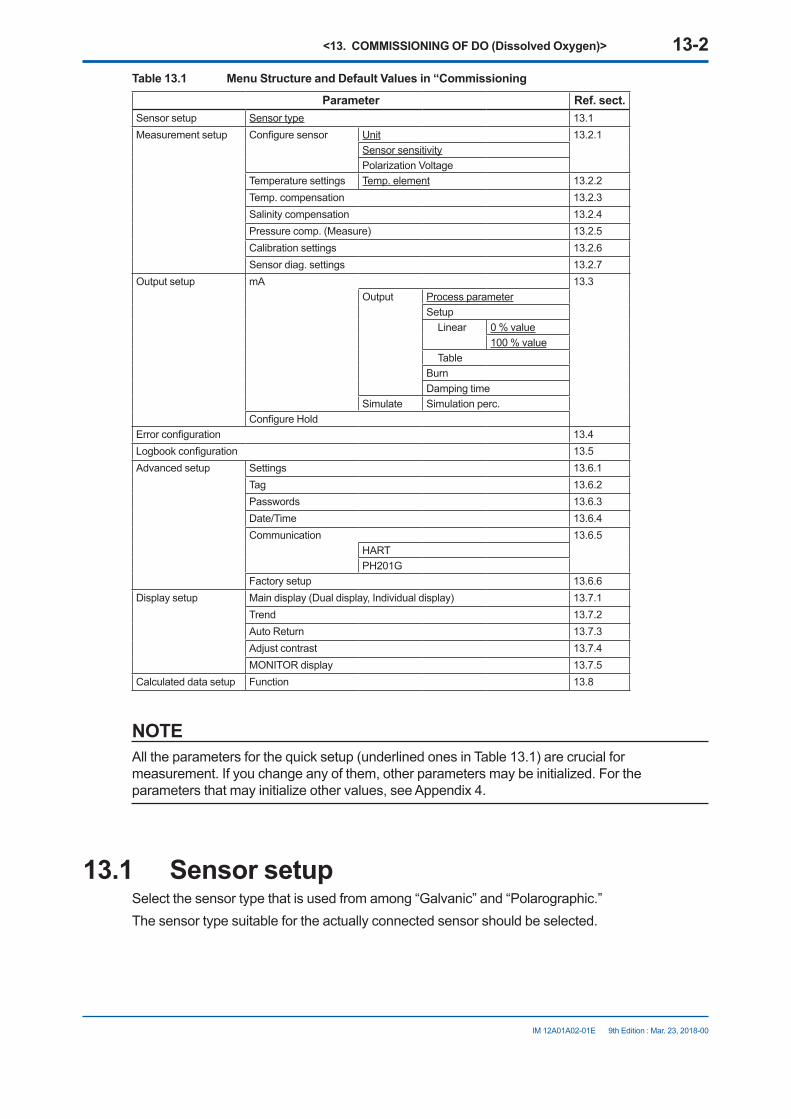
<13. COMMISSIONING OF DO (Dissolved Oxygen)> 13-2
IM 12A01A02-01E 9th Edition : Mar. 23, 2018-00
Table 13.1 Menu Structure and Default Values in “Commissioning
Parameter Ref. sect.Sensor setup Sensor type 13.1Measurement setup Configuresensor Unit 13.2.1
Sensor sensitivityPolarizationVoltage
Temperature settings Temp. element 13.2.2Temp. compensation 13.2.3Salinity compensation 13.2.4Pressure comp. (Measure) 13.2.5Calibration settings 13.2.6Sensor diag. settings 13.2.7
Output setup mA 13.3Output Process parameter
Setup Linear 0%value
100%value TableBurnDamping time
Simulate Simulation perc.ConfigureHold
Errorconfiguration 13.4Logbookconfiguration 13.5Advanced setup Settings 13.6.1
Tag 13.6.2Passwords 13.6.3Date/Time 13.6.4Communication 13.6.5
HARTPH201G
Factory setup 13.6.6Display setup Main display (Dual display, Individual display) 13.7.1
Trend 13.7.2Auto Return 13.7.3Adjust contrast 13.7.4MONITOR display 13.7.5
Calculated data setup Function 13.8
NOTEAll the parameters for the quick setup (underlined ones in Table 13.1) are crucial for measurement. If you change any of them, other parameters may be initialized. For the parametersthatmayinitializeothervalues,seeAppendix4.
13.1 Sensor setupSelect the sensor type that is used from among “Galvanic” and “Polarographic.”The sensor type suitable for the actually connected sensor should be selected.

<13. COMMISSIONING OF DO (Dissolved Oxygen)> 13-3
IM 12A01A02-01E 9th Edition : Mar. 23, 2018-00
13.2 Measurement setupIn this section, set up various parameters relating to measurements.Measurements are performed based on the measurement parameter setup.If “Polarographic” is selected for “Sensor type” in the Sensor setup screen, the polarographic application voltage can be set.
13.2.1 Sensor setupSelectaunitforsensorsfrommg/L,ppm,ppb,and%SAT.Selectavalueforsensorsensitivityfrom0.45μA/ppm(50µm),0.90μA/ppm(25µm),andother.Ifyouselect“other,”enteranappropriate value.
13.2.2 Temperature settingsSelect the temperature element used for compensation from among Pt1000 and NTC22k. Select the same type as the temperature element that is actually connected.
Celsius (°C) or Fahrenheit (°F) temperature units are available. If the unit is changed, the following values are also recalculated automatically to the new unit:
• Manual temp.• Reference temp.• Temp.coefficient• Temp. ranges in the matrix
13.2.3 Temperature compensationSelect “Manual” or “Automatic” for the temperature compensation type.Select “Automatic” if the temperature sensor’s measured value is used or “Manual” if no temperature sensor is used.
NOTEWhen Manual is selected on the Temperature compensation, a process temperature should be setinthe“Manualtemp.”AtemperatureshownontheMaindisplayortheHomedisplayisthismanually set temperature.
13.2.4 Salinity compensationThis function is used to measure sample water containing salt such as sea water.Thedissolvedoxygeninasolutionisaffectedbysalinity.Therefore,toconductaccuratemeasurements,itisnecessarytocompensatetheinfluenceofthesalinityofthesamplesolution.To make salinity compensation, select “Enabled” for “Compensation.”Calculate the saturated concentration value from the salinity and temperature of the actual samplewaterbasedonTable1ofAppendix4(Solubilityofoxygeninwaterasafunctionoftemperature and salinity) and enter the value.
13.2.5 Pressure comp. (Measure)Dissolved oxygen concentration changes depending on changes in the process pressure or air pressure. To compensate this, enter a value of pressure (air pressure).See Tables 2 and 3 in the Appendix.
DO
13

<13. COMMISSIONING OF DO (Dissolved Oxygen)> 13-4
IM 12A01A02-01E 9th Edition : Mar. 23, 2018-00
13.2.6 Calibration settingsIn “Calibration settings,” set the high and low limits of Zero/Slope and set up parameters relating to stabilization performed during calibration.
l Limits and timingZero High/LowSet the high and low limits of Zero. During calibration, it is checked whether the new zero exceeds these high and low limits. Narrowing the band will prevent bad calibration procedures and calibration of bad sensors, which results in higher accuracy. The default values should be adjusted to suit the application and the “users” criterion.Slope High/LowSet the high and low limits of Slope. During calibration, it is checked whether the new slope exceeds these high and low limits. Narrowing the band will prevent bad calibration procedures and calibration of bad sensors, which results in higher accuracy. The default values should be adjusted to suit the application and the “users” criterion.Stabilization timeDuring calibration, the stability of the measurement is constantly monitored. When variations of the value are within a value set in Step Range over this stabilization time set here, the value is regarded as being stable. If the value does not stabilize within 60 minutes, calibration is aborted.Step RangeSet the range over which the stability of a measured value is checked. If variations of a measured value over the stabilization time are within this set value, the measured value is judged to have stabilized.Calibr. intervalSet the interval in which a new calibration must take place. If the interval set here is exceeded, theinstrumentwillbenotifiedaccordingtothesettingin“Calib.timeexceeded”intheerrorconfiguration.
l Zero/SlopeYou can enter zero and slope values directly.Zero current values can be set only when the setting of “Zero Calibration” is “Enabled.”
l Pressure comp. (Cal.)You can enter the pressure level directly.
l Zero CalibrationIf zero calibration is required, select “Enabled” for this parameter. The default value is “Disabled.” When this feature is enabled, “Zero current values” can be set in zero settings.
NOTEWhen the zero calibration is set to “disabled” after performing the calibration, the result of the calibration turns invalid (default).
<13. COMMISSIONING OF DO (Dissolved Oxygen)> 13-5
IM 12A01A02-01E 9th Edition : Mar. 23, 2018-00
13.2.7 Sensor diag. settingsThis screen is used to set items relating to sensor diagnostics displayed on the screens invoked
by pressing .Gauges are displayed for only parameters that have been enabled in “Sensor diag. settings.”Parameters set to Disable are provided with a bar display.
ThesettingparametersincludeProgresstimeandHeatcycle.Itisalsopossibletosetthe“Badlimits”oftheprogresstimeandheatcycleandthe“Heatcycletemp”and“Heatcycletime”oftheheat cycle.
13.3 Output setupThegeneralprocedureistofirstdefinethefunctionoftheoutput,OutputorSimulate.Then,setthe process parameters associated with the output. On the Output, an output of measured value is selected. On the Simulate, a simulation value can be set.And,theparametersforHOLDfunctioncanbesetonthissetting.
l OutputTheoutputsignalisacurrentvaluespecifiedbythefollowingparameters.
Process parameterFor the available process parameters, see Table 13.2.The output of the selected process parameter is shown as a bar on the bottom of the Main displayortheHomedisplay.Anditsparametersymbol(forexample,Oxygen1orDiff-Oxygen1)is shown above the bar, too. When a selected process parameter is displayed as a measurement value, the top left number or character is turned to be white number or character on black background (for example, or ). (Refer to the section 1.2.)
Table 13.2 List of Process Parameters
Number of sensors Process Parameters1 Oxygen1 (2)
Temperature1 (2) 2 Oxygen1
Temperature1Oxygen2Temperature2Calculated*1 Redundant*2
*1: Refer to section 13.8, Calculated data setup.*2: Refer to the <Redundant system> below.
Calculated data and Redundant system are available when two modules are installed on the instrument.
<Redundant system>On the Redundant system, when a sensor (Sensor 1) of the 1st module fails, the output is automatically switched to the output of the 2nd module.After repairing the Sensor 1, manual reset of redundant system is necessary to return to the output of 1st module from the output of the 2nd module.
DO
13
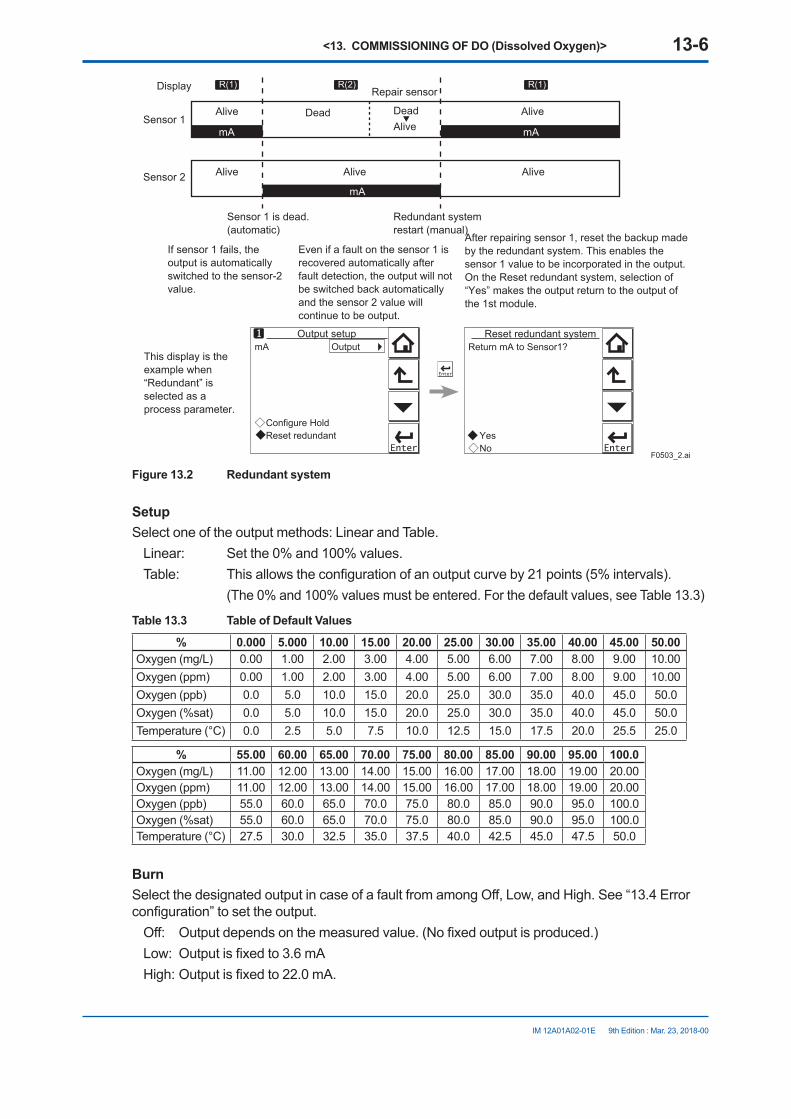
<13. COMMISSIONING OF DO (Dissolved Oxygen)> 13-6
IM 12A01A02-01E 9th Edition : Mar. 23, 2018-00
mA mA
mA
R(1) R(2) R(1)
F0503_2.ai
Return mA to Sensor1?
Yes No
Reset redundant system
Sensor 1
Display
Sensor 2
Alive Alive
Alive Alive Alive
Dead DeadAlive
Sensor 1 is dead.(automatic)
Repair sensor
Redundant systemrestart (manual)
If sensor 1 fails, the output is automatically switched to the sensor-2 value.
This display is the example when “Redundant” is selected as a process parameter.
Even if a fault on the sensor 1 is recovered automatically after fault detection, the output will not be switched back automatically and the sensor 2 value will continue to be output.
After repairing sensor 1, reset the backup made by the redundant system. This enables the sensor 1 value to be incorporated in the output.On the Reset redundant system, selection of “Yes” makes the output return to the output of the 1st module.
Output setupmA Output Configure Hold Reset redundant
Figure 13.2 Redundant system
SetupSelect one of the output methods: Linear and Table.Linear: Setthe0%and100%values.Table: Thisallowstheconfigurationofanoutputcurveby21points(5%intervals). (The0%and100%valuesmustbeentered. For the default values, see Table 13.3)
Table 13.3 Table of Default Values
% 0.000 5.000 10.00 15.00 20.00 25.00 30.00 35.00 40.00 45.00 50.00Oxygen (mg/L) 0.00 1.00 2.00 3.00 4.00 5.00 6.00 7.00 8.00 9.00 10.00Oxygen (ppm) 0.00 1.00 2.00 3.00 4.00 5.00 6.00 7.00 8.00 9.00 10.00Oxygen (ppb) 0.0 5.0 10.0 15.0 20.0 25.0 30.0 35.0 40.0 45.0 50.0Oxygen(%sat) 0.0 5.0 10.0 15.0 20.0 25.0 30.0 35.0 40.0 45.0 50.0Temperature (°C) 0.0 2.5 5.0 7.5 10.0 12.5 15.0 17.5 20.0 25.5 25.0
% 55.00 60.00 65.00 70.00 75.00 80.00 85.00 90.00 95.00 100.0Oxygen (mg/L) 11.00 12.00 13.00 14.00 15.00 16.00 17.00 18.00 19.00 20.00Oxygen (ppm) 11.00 12.00 13.00 14.00 15.00 16.00 17.00 18.00 19.00 20.00Oxygen (ppb) 55.0 60.0 65.0 70.0 75.0 80.0 85.0 90.0 95.0 100.0Oxygen(%sat) 55.0 60.0 65.0 70.0 75.0 80.0 85.0 90.0 95.0 100.0Temperature (°C) 27.5 30.0 32.5 35.0 37.5 40.0 42.5 45.0 47.5 50.0
BurnSelectthedesignatedoutputincaseofafaultfromamongOff,Low,andHigh.See“13.4Errorconfiguration”tosettheoutput.Off: Outputdependsonthemeasuredvalue.(Nofixedoutputisproduced.)Low: Outputisfixedto3.6mAHigh:Outputisfixedto22.0mA.

<13. COMMISSIONING OF DO (Dissolved Oxygen)> 13-7
IM 12A01A02-01E 9th Edition : Mar. 23, 2018-00
Damping timeThisisthetimetakenforaresponsetoastepinputchangetoreach90%ofthefinalvalue(attenuation time). Set this time in sec.
l SimulateWhenthisfunctionisselected,anoutputoftheinstrumentwillbeafixedcurrentvaluesetin%oftheoutputspan.Theoutputspanrangeis-2.5%to112.5%(3.6mAto22.0mA).When “Simulate” is selected, regardless of hold setting, the output is always simulated value.
n Configure HoldOntheConfigureHold,settingsareperformedtoholdofthemAoutputatapresetvalue.(Refertothesection14.5.) This is enabled only if “mA” is “Output.”During the Commissioning or the Quick Setup, the mA output is automatically held. The preset valuedependsonasettingonthe“Lastorfixed”.
“Last”: The preset value is a value measured just before hold condition.“Fixed”: The preset value is a value set in the “Fixed value mA”. When the “Fixed” is selected, set a mA value in the “Fixed value mA”.
Selectiononthe“HoldduringCalibration/Wash”decidestoactivateordeactivatetheholdfunction automatically during calibration or wash.
“Enabled”: Activation of the automatic hold function“Disabled”: No automatic hold function
Onlywhenthe“PH201G”isselectedontheCommunication,themessageof“HoldduringCalibration/Wash”isdisplayed.Onotherselections,themessageof“HoldduringCalibration”isdisplayed.
13.4 Error configurationInErrorconfiguration,configurethestatusesofvariouserrorcauses.
This allows the system to notify the user of the occurrence of an error according to the status categoriesintheErrorconfiguration.SelectastatuscategoryfromamongOff,Warn.(Warning),andFault.“Fault”automaticallyperformsburn-out.WhenBurnhasbeensettoOff(13.3Outputsetup),onlythe error message is displayed.“Warn.” displays an error message.WhenselectingPH201Ginthecommunicationsetting,makesurethatthe“Failcontact”settingis appropriate.
The settable causes of errors are determined based on the settings of the Sensor setup and Measurement setup, and a status category is set to the causes displayed in the Errors 1/2 and 2/2 screens.
DO
13

<13. COMMISSIONING OF DO (Dissolved Oxygen)> 13-8
IM 12A01A02-01E 9th Edition : Mar. 23, 2018-00
Table 13.4 Error configuration
Display item Description DefaultDO too high Inputisover50μA(galvanic)or1200nA
(polarographic).Warn.
DO too low Inputisbelow−0.05μA(galvanic)or−1.2nA(polarographic).
Warn.
Temperature too high Measured process temperature is higher than the maximum limit.
Warn.
Temperature too low Measured process temperature is lower than the minimum limit.
Warn.
Sensor membrane Sensor membrane is damaged. OffCalib. time exceeded Calibration time exceeds the calibration interval
(see Section 13.2.6).Off
CAUTIONIfcancelinganerrorconfigurationcouldberisky,donotcancelitasadangeroussituationmayresult.
13.5 Logbook configurationIn“Logbookconfiguration,”theuserconfiguresinformationtobesavedtoalogbookorinitializesthe logbooks.Logbooks are used to keep an electronic record of events such as error messages, calibrations, and programmed data changes. By referring to this log, users can, for instance, easily determine maintenance or replacement schedules.
In“Logbookconfiguration,”theusercanselect“Off,”“1-1,”or“1-2”foreachitemofinteresttobelogged.(Forsensor2,select“Off,”“2-1,”or“2-2.”)ThiscanbedoneforitemsdisplayedontheSettings logbook 1/3 to 3/3 screens. Assigning 1-1 or 1-2 to each item allows information to be organized and logged in a logbook.
NOTESome events such as power-on are saved into the logbook “1-1” or “2-1”. This logbook may be full earlier. It is recommended that important information be saved into the logbook “1-2” or “2-2”.
For“Eraselogbook”,aspecifiedlogbook“1-1”or“1-2”canbeerasedindividually.When the “Warn if logbook full” is set to “Yes”, a warning is given when the logbook come to near full (maximum 13 pages).
NOTEWhen the logbook gets full, the oldest information is erased automatically.

<13. COMMISSIONING OF DO (Dissolved Oxygen)> 13-9
IM 12A01A02-01E 9th Edition : Mar. 23, 2018-00
13.6 Advanced setupAdvanced setup is used to set functions relating to matters other than measurements such as the selection of settings, tag setting, password setting for protecting calibration and commissioning operations, date setting, and communication setting.(“Factorysetup”isforserviceengineersonly;thereisnoitemtobesetbytheuser.)
13.6.1 SettingsIn “Settings,” select an item to be set as the default value from among “No action,” “Load factory settings,” “Save user settings,” and “Load user settings.”When the default values are loaded, the instrument will be restarted. (In the case of “Save user settings,” it will not be restarted.)The following parameters are not included in the defaults:
• Tag• The contents of all logbooks
NOTEWhen the “Save user setting” is only selected, save of the user-set parameters will start at once.
To avoid wrong selection, operation in this Settings must be done by , not by touching the menu message.
If you select “Load factory settings,” the instrument will be set to the default settings at factory shipment.When this item is selected, a screen prompting whether to restart is displayed. If this is no problem,press“Yes.”Thenthe“Loading…”messageappearsandblinksandloadingisstarted.When the factory settings have been loaded, the instrument will be restarted.When “Save user settings” is selected, the current settings can be saved as the defaults. When this item is selected, the user settings will start to be saved immediately. After saving the
parameters, press or to change the display because this save doesn’t have restart function.If “Load user settings” is selected, the settings saved as user settings can be set as the defaults.When this item is selected, a screen prompting whether to restart is displayed. If this is no problem,press“Yes.”Thenthe“Loading…”messageappearsandblinksandloadingisstarted.When the user settings have been loaded, the instrument will be restarted.
13.6.2 TagAtagprovidesasymbolicreferencetoaninstrumentandisgenerallydefinedtobeuniquethroughout the control system at one plant site. A tag can contain up to 12 alphanumeric characters. The default value is DO or FLXA21-DO. When two sensor modules are installed, each module can have their own tag numbers.The tag is displayed at the top of the main and home displays.
DO
13
<13. COMMISSIONING OF DO (Dissolved Oxygen)> 13-10
IM 12A01A02-01E 9th Edition : Mar. 23, 2018-00
13.6.3 PasswordsCalibration and commissioning operations can be separately protected by each password. To protectexecuteoperations,enterapasswordinExecute’sinputfield.Toprotectcommissioningoperations,enterapasswordinCommissioning’sinputfield.Bydefault,bothinputfieldsareempty.Whenapasswordinputfieldisempty,operationisnotpassword-protected.Apasswordcan contain up to 8 characters.
When you set a password, always take a note of it.
When a password is set, input of the password is necessary to enter the password-protected operation. After inputting the password, the display will change to an operator ID input display. When an operator ID is input, its operation is recorded into a logbook. The input of an operator ID isnotnecessarytoentertheoperation.AnoperatorIDcancontainupto4characters.
13.6.4 Date/TimeThe Logbooks and trend graphs use the clock/calendar as a reference. The current date and time is set here. The time display format can be selected from among three types.
13.6.5 CommunicationIn“Communication,”selectthecommunicationsettingfromamongNone,HART,andPH201G.The burn down current value is 3.6 mA.
NOTETomakethechangeof“Communication”valid,turnoffthepowersupplyonce,andreboot.
Inthecaseof“None,”thereisnottheproblemevenifyoudonotchangeitas“HART”ofdefaultvalue.
n HARTSelectthismenuwhenHARTcommunication(HART5)ismade.IntheHARTsetupscreen,specifythenetworkaddressandsetupparametersforSV,TV,andFV.(PVislinkedwiththe“processparameter”settingin“Outputsettings”andcannotbechangedhere.)
l Network addressFor 1-to-1 communication, leave the default value [0] unchanged. For multi-drop where multiple HARTdevicesareconnectedonabus,setaddressesin1to15.Inthiscase,themAoutputwillbefixedto4mA.
l PVPVisaparameterselectedforanalogoutput;itcannotbechangedhere.
l SV, TV, FVTheSV,TV,andFVparametersareitemsthattheusermustsetup.Selectableitemsdifferdepending on the sensor type in “Sensor setup” and settings in “Measurement setup.”
<13. COMMISSIONING OF DO (Dissolved Oxygen)> 13-11
IM 12A01A02-01E 9th Edition : Mar. 23, 2018-00
If blank is selected for a parameter, items below that parameter must all be set to blank. If an item is blank, those below it cannot be set to a status other than blank.
FormoreinformationonHARTcommunication,seetheTechnicalInformation(TI12A01A02-60E) in the attached CD-ROM.
n PH201GSelectthismenuifthePH201Gdistributorisconnectedtotheinstrument.InthePH201Gsetupscreen,makesettingsfor“Holdcontact,”“Failcontact,”and“Washcontact.”
l Hold contactSelect Disabled or Enabled.Whenthisitemisenabled,theoutputwillbeheldaccordingtothesettingof“Holdtype”ontheHoldsetupscreen.
l Fail contactSelect a status from among “Fail + Warn,” “Fail only,” and “Disabled.”Thissettingdependsontheerrorconfiguration.See“13.4Errorconfiguration.”“Fail” corresponds to “Fault.”
l Wash contactSelect Disabled or Enabled.When this item is enabled, items for a wash can be set on the Wash settings screen.In the Wash settings screen, set the interval time, wash time, and recovery time and setup of various washes.
Interval time: Set the wash interval in hours.Wash time/measure time: Set the wash time in minutes. In a continuous wash, wash time is
replaced by measure time.Recovery time: Set the recovery time in minutes.Manual wash: Select “Disabled” or “Enabled.” When this item is enabled, a wash cycle can be activated manually. On the
Calibration/Wash screen, press the “Start manual wash cycle” to perform a manual wash.
Imp2 wash: Select “Disabled” or “Enabled.” When this item is enabled, a wash cycle can be started if the “Impedance 2
too high” error occurs with respect to the reference electrode.Continuous wash: Select “Disabled” or “Enabled.” A continuous wash cycle is started at the instant when this item is enabled. In a continuous wash, the “Measure time” and “Interval time” are reversed
(see Figure 13.3).
DO
13

<13. COMMISSIONING OF DO (Dissolved Oxygen)> 13-12
IM 12A01A02-01E 9th Edition : Mar. 23, 2018-00
Tw Tr
Tint
Tw Tr
Tint
Tw Tr
Tint Tint
Tw’ Tw TrTw’
F050605_2.ai
Tint: Interval timeTw: Wash timeTr: Recovery time
Tint: Interval timeTw: Measure timeTw’: Wash timeTr: Recovery time
When a continuous wash is disabled
When a continuous wash is enabled
Figure 13.3
13.6.6 Factory setupFor “Factory setup,” there is no item to be set by the user.
NOTEThis menu is for service engineers only. This section is protected by a password. Attempting to change data in the factory adjustment menu without the proper instructions and equipment could result in corruption of the instrument setup and damage the performance of the unit.
13.7 Display setupThis screen is used to make various settings relating to screen display.
13.7.1 Main display (Dual display, Individual display)
Main display Trend Auto Return Ad.just contrast MONITOR display
Display setup Dual display Individual display Trend Auto Return Adjust contrast MONITOR display
or
Display setup
Figure 13.4 Display setup screens for a single module (left) and two modules (right)
l Main displayWhen one module is installed on the instrument, only the Main display is available.
<13. COMMISSIONING OF DO (Dissolved Oxygen)> 13-13
IM 12A01A02-01E 9th Edition : Mar. 23, 2018-00
Three measurement values can be set to display on the Main display as a primary value (1st line), a second value (2nd line) and a third value (3rd line) respectively.On the “Additional text”, a text of up to 12 alphanumeric characters can be assigned to each measurement value.Additional texts are displayed on the Main display, and are useful for identifying measurements. Insomecases,notall12characterscanbedisplayedduetotheletters;checkthetextsdisplayed on the Main display after setting. If a part of the text is missing, adjust the number of characters.
l Dual displayThis screen is used to set items to be displayed in the top part (1st row) and bottom part (2nd row)oftheHomedisplay.Thesesettingsareavailablewhentwosensorsareinstalledintheinstrument.Whenthe“Empty”isselectedforthe2ndrow,theHomedisplaycannotbedisplayed.
l Individual displayWhen two modules are installed on the instrument, display items on the Main display for each module can be set on these settings.On the “DO1 display” or “DO2 display” screen, three measurement values can be set to display on each Main display as a primary value (1st line), a second value (2nd line) and a third value (3rd line) respectively.On the “Additional text”, a text of up to 12 alphanumeric characters can be assigned to each measurement value.Additional texts are displayed on the Main display, and are useful for identifying measurements. Insomecases,notall12characterscanbedisplayedduetotheletters;checkthetextsdisplayed on the Main display after setting. If a part of the text is missing, adjust the number of characters.
13.7.2 TrendThis screen is used to make settings for the Trend Graph Screen.Set the process parameters to be displayed for each trend. They can be set for the 1st to 3rd trends. When all three process parameters are set “Empty”, there is no trend display (no trend button).
l X-axis: TimingSelect the X-axis timing’s time span on the trend graph display from a list.
l Y-axis: LimitsSet the Y-axis high and low limits on the trend graph display on a Trend screen basis.
NOTEUpdating the trend display setup resets the current trend graph and starts a new one.
DO
13

<13. COMMISSIONING OF DO (Dissolved Oxygen)> 13-14
IM 12A01A02-01E 9th Edition : Mar. 23, 2018-00
13.7.3 Auto ReturnWhen no operation is performed for the time set in “Auto Return”, the display returns to the Monitor display (or to the Main display when the MONITOR display is disabled) and the analyzer returns to a normal measuring mode. (When the Trend display is selected, the Auto Return doesn’t work.)Select the time from among Disable, 10 min, and 60 min. When the Auto Return function is not used, select “Disable.”
NOTEA default is “10 min”. When maintenance like a calibration that may take much time is performed, “60 min” or “Disable” is recommended to be selected.
13.7.4 Adjust contrastThe LCD screen contrast can be adjusted.Pressingthekeysadjuststhecontrastin11levelsfrom+5to–5(includingthedefaultvalueof “0”).
13.7.5 MONITOR displaySelect “Enable” so that the Monitor display becomes available. A default is “Enable”.DuringHold/Washconditionandawarning/faultcondition,theMaindisplayortheHomedisplayis displayed to indicate the condition.
13.8 Calculated data setupOn this setup, parameters can be set for calculated data.When two modules are installed on the instrument, the calculated data can be set for values measured by two sensors.Select“Differential”or“Average”ontheCalculateddatasetupscreen.Differential:Adifferencebetweenmeasurementvaluesmeasuredbyasensor1andsensor2
is an output as a calculated result.(Diff) (valueofthesensor1)–(valueofthesensor2)Average: The average of measurement values measured by a sensor 1 and sensor 2 is an
output as a calculated result.(Ave) (value of the sensor 1 + value of the sensor 2) / 2
To display the calculated result, select “Calculated” on the Dual display screen. (Section 13.7.1.) (Thesettingonthe“Individualdisplay”hasnoeffect.)While displaying a calculated data, measurement value of the sensor 1 or sensor 2 can be
checked on the each sensor’s display with pressing Sensor
1 or Sensor
2 at the lower right on the Main display.
Pressing returns the display to the original calculated data display.A calculated data can be set as a process parameter on the “mA (Output)” setup screen. (Section 13.3.)
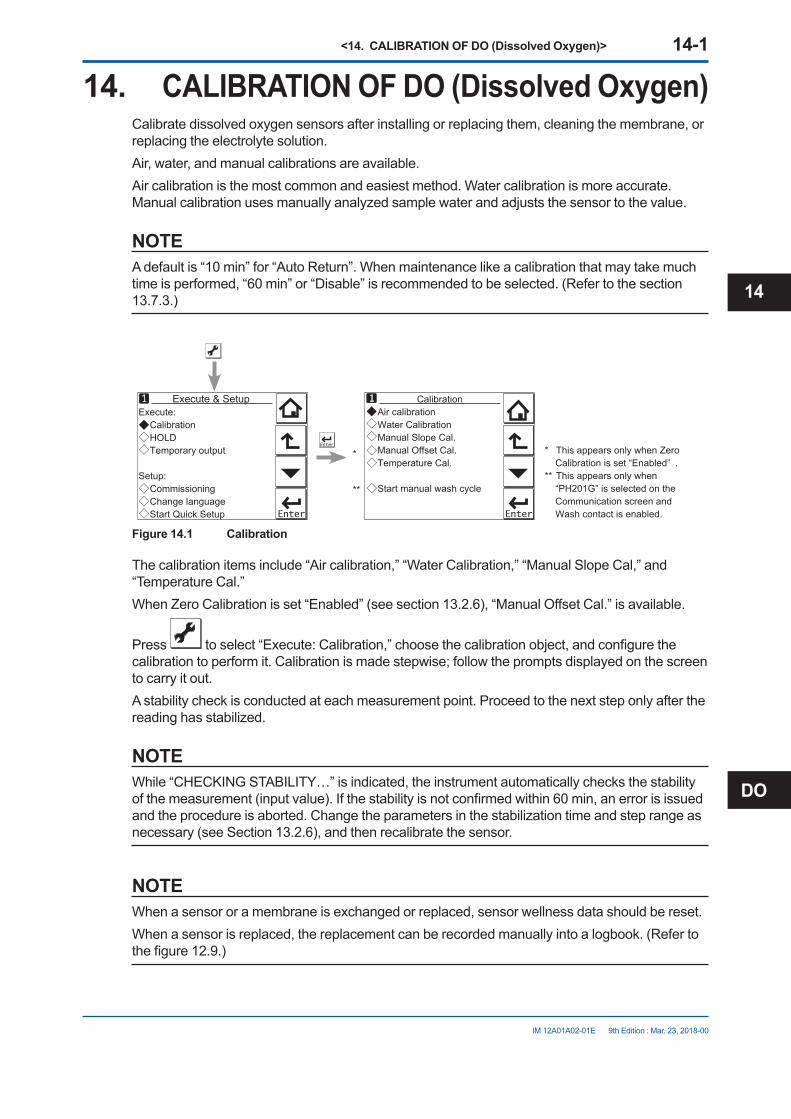
<14. CALIBRATION OF DO (Dissolved Oxygen)> 14-1
IM 12A01A02-01E 9th Edition : Mar. 23, 2018-00
14. CALIBRATION OF DO (Dissolved Oxygen)Calibrate dissolved oxygen sensors after installing or replacing them, cleaning the membrane, or replacing the electrolyte solution.Air, water, and manual calibrations are available.Air calibration is the most common and easiest method. Water calibration is more accurate. Manual calibration uses manually analyzed sample water and adjusts the sensor to the value.
NOTEA default is “10 min” for “Auto Return”. When maintenance like a calibration that may take much time is performed, “60 min” or “Disable” is recommended to be selected. (Refer to the section 13.7.3.)
Execute: Calibration HOLD Temporary output
Setup: Commissioning Change language Start Quick Setup
Execute & Setup Calibration Air calibration Water Calibration Manual Slope Cal. Manual Offset Cal. Temperature Cal.
Start manual wash cycle
* This appears only when Zero Calibration is set “Enabled” .
** This appears only when “PH201G” is selected on the Communication screen and Wash contact is enabled.
**
*
Figure 14.1 Calibration
The calibration items include “Air calibration,” “Water Calibration,” “Manual Slope Cal,” and “Temperature Cal.”WhenZeroCalibrationisset“Enabled”(seesection13.2.6),“ManualOffsetCal.”isavailable.
Press toselect“Execute:Calibration,”choosethecalibrationobject,andconfigurethecalibrationtoperformit.Calibrationismadestepwise;followthepromptsdisplayedonthescreento carry it out.A stability check is conducted at each measurement point. Proceed to the next step only after the reading has stabilized.
NOTEWhile“CHECKINGSTABILITY…”isindicated,theinstrumentautomaticallychecksthestabilityofthemeasurement(inputvalue).Ifthestabilityisnotconfirmedwithin60min,anerrorisissuedand the procedure is aborted. Change the parameters in the stabilization time and step range as necessary (see Section 13.2.6), and then recalibrate the sensor.
NOTEWhen a sensor or a membrane is exchanged or replaced, sensor wellness data should be reset.When a sensor is replaced, the replacement can be recorded manually into a logbook. (Refer to thefigure12.9.)
DO
14

<14. CALIBRATION OF DO (Dissolved Oxygen)> 14-2
IM 12A01A02-01E 9th Edition : Mar. 23, 2018-00
14.1 Air calibrationSpan calibration in the ambient atmosphere is the most common and easiest method.AlthoughsettingtheZeroCalibrationto“Enabled”allows2-pointcalibrationofZero(0%)andSpan(100%),onlyspancalibrationisgenerallyperformed.Forzerocalibration,seethenextsection.
Setthesensorinthemaintenancemode.Washoffanystainonthemembraneanduseasofttissuetowipeoffanyremainingwaterfromthemembrane.Leavethesensorinanenvironmentwithouttemperaturefluctuationorairflowforabout10minutes,suchasinanemptycontainer.Afterconfirmingthatthereadingisstable,calibratethesensor.
14.2 Water calibrationWater calibration is a method of calibrating dissolved oxygen analyzers in a laboratory. Accurate results can be obtained if the span calibration is performed carefully in air-saturated water.AlthoughsettingtheZeroCalibrationto“Enabled”allows2-pointcalibrationofZero(0%)andSpan(100%),thereadingmusthavebeenstablebeforeperformingzerocalibration.Therefore,zero calibration takes a relatively long time.Conduct water calibration in fresh water. For zero calibration in salt water, perform it by manual calibration.Setthesensorinthemaintenancemode.Washoffanystainonthemembraneanduseasofttissuetowipeoffanyremainingwaterfromthemembrane.
l Air-saturated waterPour water (without salt content) into a beaker or other container, and place it on a magnetic stirrer or other agitator. Put a stirring bar in it and agitate the water, and send air from a pump (bubbling). It takes 15 to 30 minutes until the water is fully saturated. Then put the sensor in this water which is still agitated and bubbling, and calibrate it. Keep the sensor at least 3 cm above the bottom of the beaker to prevent the membrane from directly contacting the air bubbles.
l Water for zero calibrationZero calibration takes a long time and normally there is no need to perform it. A clean sensor does not have a zero current and thus does not require zero calibration.Forthezerocalibrationwater,dissolve20to30gramsofsodiumsulfitein1literofdesalinatedwater.
NOTEDissolvesodiumsulfiteinthewaterandwaituntilthereadingbecomesstablebeforecalibratingthesensor.Evenahealthysensorneeds40to50minutes.Leavethesensorinthesolution.
<14. CALIBRATION OF DO (Dissolved Oxygen)> 14-3
IM 12A01A02-01E 9th Edition : Mar. 23, 2018-00
14.3 Manual slope calibrationCalibrate the sensitivity of the sensor with a solution of known oxygen concentration.First, analyze the oxygen concentration of a sample solution and then calibrate the sensor sensitivity to adjust to this value. From the actual measurement of salinity and temperature, obtainthedissolvedoxygenconcentrationbyreferringtoTable1inAppendix4andenterit.When salinity must be considered, perform the calibration manually.
Note the following:• Quickly analyze the sample water to prevent the dissolved oxygen concentration or
temperature from changing.• Before analyzing the sample water, analyze the reference with a calibrated laboratory
instrument.• To eliminate any discrepancies, the laboratory instrument must have been calibrated with
thesamecalibrationdataasspecifiedinISO5814.Confirmthatthereadingoftheinstrumentisstableandthesensorisclean.Ifthereadingremainsunstable,setthesensorinthemaintenancemodeandwashoffanystainonthesensormembrane. Return the sensor to the sample water and leave it until the reading becomes stable.
l Salinity compensationTocompensatesalinity,select“Enabled”in“Measurementsetup”–“Salinitycompensation”–“Compensation”(seeSection13.2.4).PerformcalibrationbyreferringtoTable1inAppendix4.
Example:When the atmospheric pressure is 101.325 kPa, the solution temperature is 22.5°C, and the salinityis30g/kg(3wt%seawaterequivalent):
(1) Calculate the saturated concentration of desalinated water. AccordingtoTable1inAppendix4,thesaturatedconcentrationis8.74mg/lat22°Cand
8.58 mg/l at 23°C. The value at 22.5ºC is calculated as follows: 8.74+(8.58–8.74)×(22.5–22)=8.66mg/l(2) Compensate the value for salinity. The compensation value for 30 g/kg salinity at 22.5°C is calculated as follows: 0.0453+(0.0443–0.0453)×(22.5–22)=0.0448mg/l 0.0448×30=1.34mg/l(3) Calculate the saturated concentration of the solution (for calibration). The saturated concentration for 30 g/kg salinity at 22.5ºC is calculated as follows: 8.66–1.34=7.32mg/l
14.4 Temperature calibrationFor the most accurate measurements, it is important to have a precise temperature measurement. Measure the temperature with a high-precision thermometer and adjust the sensor reading accordingly. For best accuracy, this should be done as near to the normal operating temperature as possible.
DO
14

<14. CALIBRATION OF DO (Dissolved Oxygen)> 14-4
IM 12A01A02-01E 9th Edition : Mar. 23, 2018-00
14.5 HOLDThe FLXA202/FLXA21 has a function to hold the mA output at a preset value (default: “Last”).Use this menu to hold the output.
For the settings, see “nConfigureHold”onpage13-7.During commissioning or quick setup, the output is automatically held.Setting“HoldduringCalibration/Wash”to“Disabled”deactivatestheholdfunctionduringcalibration or washing.
Press toselectExecute:HOLDandthenchooseManualHoldONorManualHoldOFF.This allows you to set up manual hold.
10.38Tag:DO
25.0
4mA 20mAOxygen1
°Cmg/L
HOLD
Figure 14.2 Example of the display with the manual hold enabled
To cancel manual hold, press the lit HOLD section on the Main display.
14.6 Temporary outputIf measurement cannot be made due to replacement of one of the sensors, assignment of mA output can be temporarily changed from the currently setup sensor to the other sensor. This feature is enabled only when two sensors are connected.
Press to select Execute: Temporary output and then choose the process parameter to be assigned on the Temporary output screen.
Whenprocessparameterassignmenthasbeenmodified,the indication at the upper left of the screen changes to .The feature is disabled the moment the screen returns to the Main display, and the setting (process parameter in mA output setting) returns to the original condition.

<15. OPERATION OF SENCOM pH/ORP> 15-1
IM 12A01A02-01E 9th Edition : Mar. 23, 2018-00
15. OPERATION OF SENCOM pH/ORPThis chapter describes the screen operations of SENCOM pH/ORP, the object to be measured.Further details of screen operations can also be found in section 1.2.
10.38Tag:SENCOM
25.0
4mA 20mAPH1
°CpH
19 mV
Execute: Calibration HOLD
Setup: Commissioning Change language Start Quick Setup
Execute & Setup
Sensor setupMeasuremet setupOutput setupError configurationLogbook configurationAdvanced setupDisplay setup
Comissioning
ManualAutomaticSample
Calibration pH
ManualSample
Calibration ORP
Zero/SlopeZero/Slope/ITP(3point)Zero/Slope1,2(3point)
pH Manual
Zero/SlopeZero/Slope/ITP(3point)Zero/Slope1,2(3point)
pH Automatic
pHORPTemperature
Calibration
HART >PH201G >
Communication
Setting logbookLogbook configuration
Main displayTrendAuto ReturnAdjust contrastMONITOR display
Display setup
Enter valuesTable mA
Change language
HOLD
Setup: Linear > Table >
mA(Output)
x-axis: TimingY-axis: Limits
Trend
Additional textMain display
Enter valuesMatrix
Input 1 impedance: Low >Input 2 impedance: Low >
Impedance setup
Temperature settingsTemp. compensationCalibration settingsImpedance settingsConcentrationSensor diag. settings
Measurement setup
Compensation: Manual >Reference temp. pH: Matrix > TC > ORP: TC >
Temp. comp.
Define heat cycleDefine SENCOM status
Sensor diag. setting
pH settingsORP settingsrH settings
Cal. settings
Zero and Slope unitsLimits and timingBuffers (select set)Zero/Slope/ITPAuto correct(Zero, Slope)
Cal. set pH
Select buffer set: Free programmable >
Buffers
mA: Output > Simulate >
Configure Hold
Output setup
SettingsTagPasswordsDate/TimeCommunicationFactory setup
Advanced setup
Wash contact: Enabled >PH201G setup
Enter valuesBuffer table 1Buffer table 1
Buffer table 2Buffer table 3
Free programmable
Quick setup Seneor setupDate/Time Measurement setup
Temperature settings mA(output)16.116.216.316.416.516.616.7
2.7
17.117.3 17.2
17.1.117.1.217.1.3
17.4
16.2.216.2.316.2.416.2.516.2.616.2.7
16.7.116.7.216.7.316.7.416.7.5
16.6.116.6.216.6.316.6.416.6.516.6.6
15.2 16.6.4 16.1 16.2.1
16.2.2 16.3
Figure 15.1 Menu structure of SENCOM pH/ORP (the number after the item refers to the relevant section)
15
SENCOM

<15. OPERATION OF SENCOM pH/ORP> 15-2
IM 12A01A02-01E 9th Edition : Mar. 23, 2018-00
15.1 Change languageThescreenissettodisplayEnglishatfactoryshipment;ifyouwishtousetheFLXA202/FLXA21inanotherlanguage,firstselectalanguageasdescribedinsection2.7.
15.2 Quick setupTheQuicksetupscreenisusedtosetupthebasicitemsyouwanttosetupfirst,suchasthedate/time and sensor settings. The detailed settings are described in chapter 16, Commissioning.YoumayleavetheQuicksetupnowandreturntoitlater;however,itisrecommendedtoperformthequicksetupfirst.Each time the FLXA202/FLXA21 is started up, this screen is displayed. If it is not necessary to
change the setup, press No or .
NOTEWhen no operation is performed for 10 minutes or 60 minutes (depending on the setting of “Auto Return”), the display except Trend display automatically changes to the Monitor display (or to the Main display when the MONITOR display is disabled).
NOTEThe display may show “---- (bar)” when starting measurement, which means the sensor is not ready to measure. But the temperature is displayed normally. Wait until measurement values are displayed.
Whileabar(----)isdisplayed,asforthemAoutput,inthecaseof“Off”or“Low,”[Burn]oftheOutputsetup(seesection16.3)isfixed3.6mA,and,inthecaseof“High,”22.0mAbecomesfixed.

<15. OPERATION OF SENCOM pH/ORP> 15-3
IM 12A01A02-01E 9th Edition : Mar. 23, 2018-00
Start quick setup?
Yes No
Chanage language
Quick setupSensor type pH+ORP
Next
Sensor setup
Format YYYY/MM/DD
Date 2010/03/03
Time 17:04:07
Next
Date/Time
Process parameter pH1
0% value 0.00 pH100% value 14.00pH
Finish
mA(output)
Temp.element Pt1000
Unit °C
Next
Temperature settings
Measurement pH+ORP
Next
Measurement setup
°C°F
YYYY/MM/DDMM/DD/YYYYDD/MM/YYYY
pHORPpH+ORP
pH1Temperature1ORP1rH1
pHORPpH+ORPpH+rHrH
Next
NextNext
Finish
Next
Monitor display
*1
*1:TheMeasurementsetupscreenappearsonlywhen“pH+ORP”isselectedontheSensorsetupscreen.Figure 15.2 Quick setup
n Date/TimeThe date display format can be selected from among the three types.Enter the date or time of day by using the numerical keys.Fordetails,seesection16.6.4.
n Sensor setupSelect a suitable electrode from among the displayed electrode types and set it up.For details, see section 16.1.
15
SENCOM

<15. OPERATION OF SENCOM pH/ORP> 15-4
IM 12A01A02-01E 9th Edition : Mar. 23, 2018-00
n Measurement setupSelect a suitable measurement parameter from among those displayed and set it up.Measurementparametersetupcanbemadeonlywhen“pH+ORP”isselectedontheSensorsetup screen.For details, see section 16.2.1.
n Temperature settingsIn the case of temperature sensors, the temperature parameter is automatically set when connection is made.Celsius (ºC) or Fahrenheit (ºF) temperature scale can be selected.For details, see section 16.2.2.
n mA (output)Select a suitable process parameter from among those displayed and set it up.Forexample,themAoutputofpHhasbeensetto0–14pHatfactoryshipment.Iftheresolutionneeds to be improved, set a suitable value for the process.For details, see section 16.3.
15.3 Main display and Monitor displayPressing changes the screen to the Main display shown in Figure 15.3.
10.38Tag:SENCOM
25.0
4mA 20mAPH1
°CpH
19 mV
Figure 15.3 Example of main display
On the Main display, pressing of the 2nd or 3rd display item causes the 1st display item to be replaced by the selected item.
NOTEMeasuredvaluestobedisplayedinthe1stto3rddisplayitemsdependontheuserdefinition(seesection16.7.1).Forexample,onthedefaultconditionofpHmeasurement,the1stdisplayitemispH,the2nddisplayitemistemperature,andthe3rddisplayitemisempty.
When the MONITOR display is enabled (see section 16.7.5), pressing the 1st display item on the home display or the main display changes the display to the Monitor display with the enlarged font of the measured value.
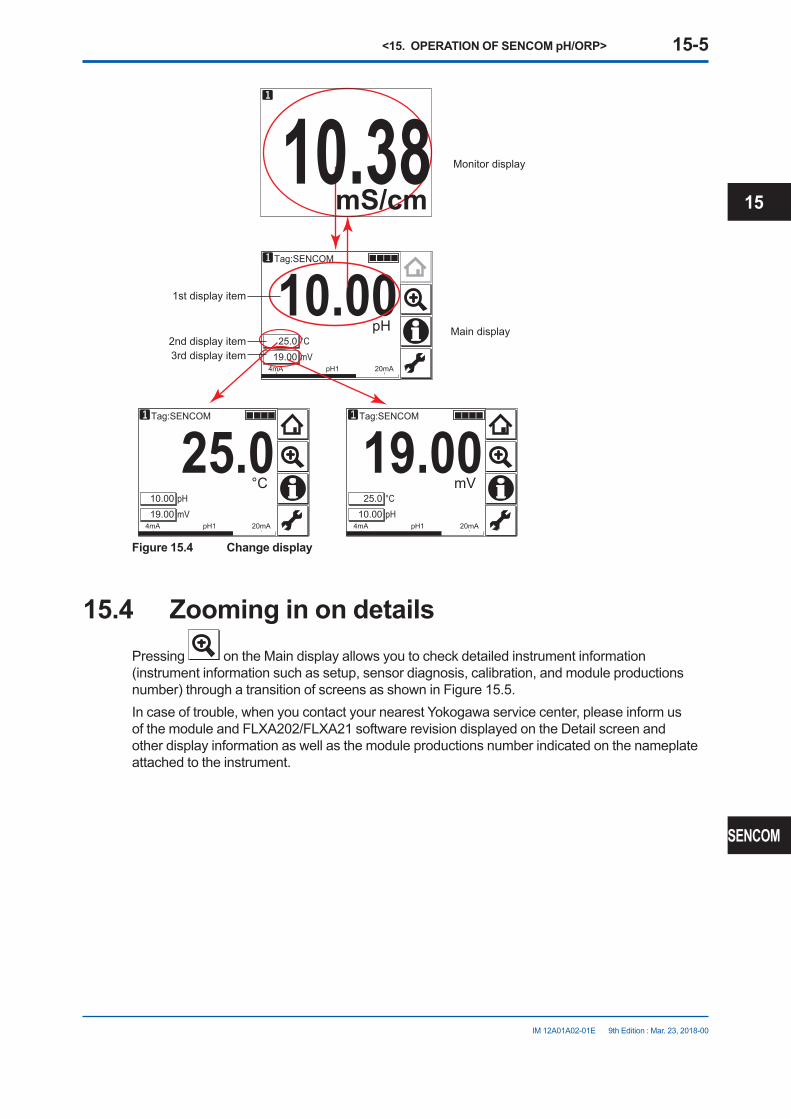
<15. OPERATION OF SENCOM pH/ORP> 15-5
IM 12A01A02-01E 9th Edition : Mar. 23, 2018-00
10.00Tag:SENCOM
19.0025.0
mV4mA 20mApH1
°CpH
25.0Tag:SENCOM
19.0010.00
mV4mA 20mApH1
pH°C
19.00Tag:SENCOM
10.0025.0
pH4mA 20mApH1
°CmV
2nd display itemMain display
3rd display item
1st display item
Monitor display10.38mS/cm
Figure 15.4 Change display
15.4 Zooming in on detailsPressing on the Main display allows you to check detailed instrument information (instrument information such as setup, sensor diagnosis, calibration, and module productions number) through a transition of screens as shown in Figure 15.5.In case of trouble, when you contact your nearest Yokogawa service center, please inform us of the module and FLXA202/FLXA21 software revision displayed on the Detail screen and other display information as well as the module productions number indicated on the nameplate attached to the instrument.
15
SENCOM

<15. OPERATION OF SENCOM pH/ORP> 15-6
IM 12A01A02-01E 9th Edition : Mar. 23, 2018-00
Next
20
12
4
mA
15.00
HOLD
FAIL
WASH
Next
pH: Zero 0.000mV Slope 100.0 % Sensor 1.234 mVORP: Zero 0.000 mV Slope 100.0 % Sensor -1.567 mVImpedance 1 BADImpedance 2 124.6 kΩ Next
Sesor wellness: Zero Slope Input 1 imp. – – – – Input 2 imp. – – – – Heat cycle – – – – Progress Time – – – – Reset welness data Next
SENCOM sensor status1: Max temp.exposed 35.0°C High pH total time 50 h. Low pH total time 27 h. Sterilization 7 Last date of Sterilization 2013/02/28 10:11:12
Next
2013/02/21 16:04:07Last calibrated at -------- ------Calibration due at -------- ------Projected maintenance -- (no meaning)Projected replacement -- (no meaning) Next
SENCOM module: Module Pdn No. AAAA1111 Software Revision 1.10
Next
SENCOM sensor status2: High temp.1 total. 107 h. Last date of High temp.1 2013/03/01 13:14:15 High temp.2 total. 63 h. Last date of High temp.2 2013/03/01 12:13:14
Next
SENCOM sensor: Moddel dode FU20F Software Revision 1.10 Assy Revison 1.10 Serial Number CCCC3333 Fact date 2013/02/20
Next
HOUSING ASSY: Module Pdn No. BBBB2222 Software Revision 2.10 HART Device Revision 2
Next
New sensor?
“Yes” resetssensor wellness data.
Yes No
Reset wellness data
(Fig.15.9)
*
*: This screen is displayed only if the PH201G distributor is used and “PH201G” is selected in communication setup.
Figure 15.5 Detail display
n Current output mA=currentoutputinmA.TherangeandfunctionofthismAoutputcanbesetinCommissioning→Outputsetup→mA.For details, see section 16.3.
n Contact statusThisscreenisdisplayedonlyifthePH201Gdistributorisusedand“PH201G”isselectedincommunication setup.
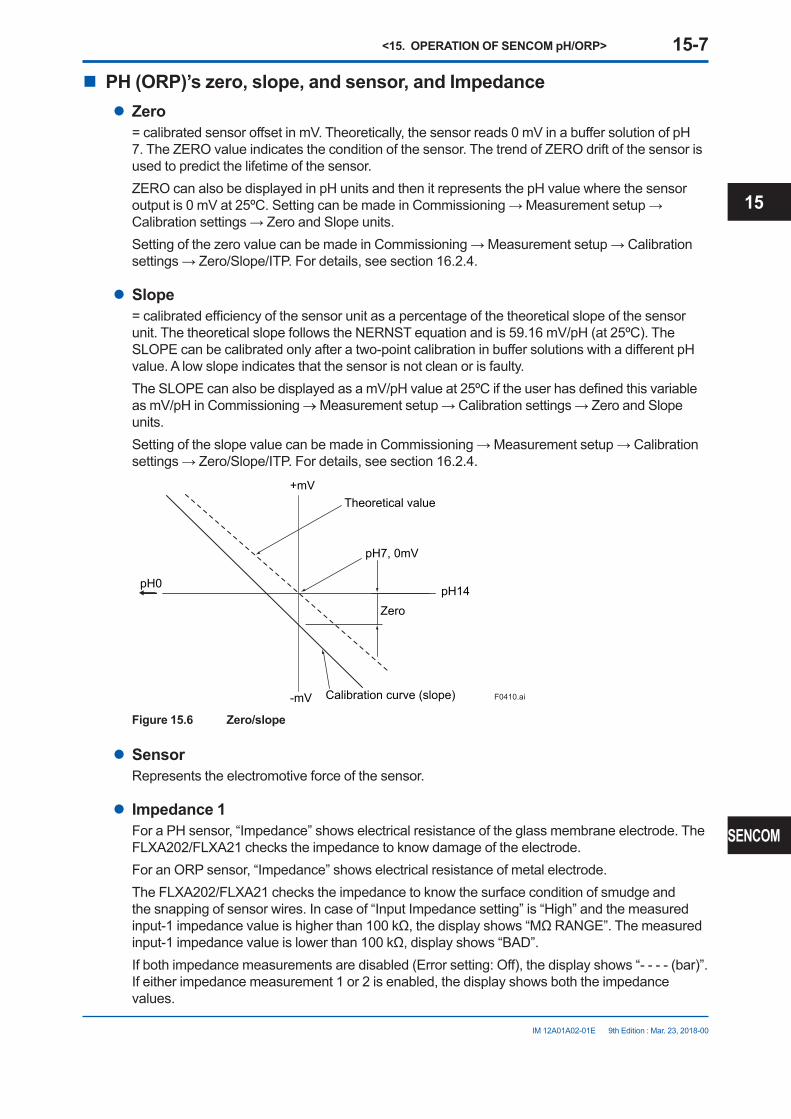
<15. OPERATION OF SENCOM pH/ORP> 15-7
IM 12A01A02-01E 9th Edition : Mar. 23, 2018-00
n PH (ORP)’s zero, slope, and sensor, and Impedancel Zero
=calibratedsensoroffsetinmV.Theoretically,thesensorreads0mVinabuffersolutionofpH7. The ZERO value indicates the condition of the sensor. The trend of ZERO drift of the sensor is used to predict the lifetime of the sensor.ZEROcanalsobedisplayedinpHunitsandthenitrepresentsthepHvaluewherethesensoroutputis0mVat25ºC.SettingcanbemadeinCommissioning→Measurementsetup→Calibrationsettings→ZeroandSlopeunits.SettingofthezerovaluecanbemadeinCommissioning→Measurementsetup→Calibrationsettings→Zero/Slope/ITP.Fordetails,seesection16.2.4.
l Slope=calibratedefficiencyofthesensorunitasapercentageofthetheoreticalslopeofthesensorunit.ThetheoreticalslopefollowstheNERNSTequationandis59.16mV/pH(at25ºC).TheSLOPEcanbecalibratedonlyafteratwo-pointcalibrationinbuffersolutionswithadifferentpHvalue. A low slope indicates that the sensor is not clean or is faulty.TheSLOPEcanalsobedisplayedasamV/pHvalueat25ºCiftheuserhasdefinedthisvariableasmV/pHinCommissioning→Measurementsetup→Calibrationsettings→ZeroandSlopeunits.SettingoftheslopevaluecanbemadeinCommissioning→Measurementsetup→Calibrationsettings→Zero/Slope/ITP.Fordetails,seesection16.2.4.
pH14pH0
pH7, 0mV
Theoretical value+mV
-mV Calibration curve (slope)
Zero
F0410.ai
Figure 15.6 Zero/slope
l SensorRepresents the electromotive force of the sensor.
l Impedance 1ForaPHsensor,“Impedance”showselectricalresistanceoftheglassmembraneelectrode.TheFLXA202/FLXA21 checks the impedance to know damage of the electrode.For an ORP sensor, “Impedance” shows electrical resistance of metal electrode.The FLXA202/FLXA21 checks the impedance to know the surface condition of smudge and thesnappingofsensorwires.Incaseof“InputImpedancesetting”is“High”andthemeasuredinput-1impedancevalueishigherthan100kΩ,thedisplayshows“MΩRANGE”.Themeasuredinput-1impedancevalueislowerthan100kΩ,displayshows“BAD”.Ifbothimpedancemeasurementsaredisabled(Errorsetting:Off),thedisplayshows“----(bar)”.If either impedance measurement 1 or 2 is enabled, the display shows both the impedance values.
15
SENCOM
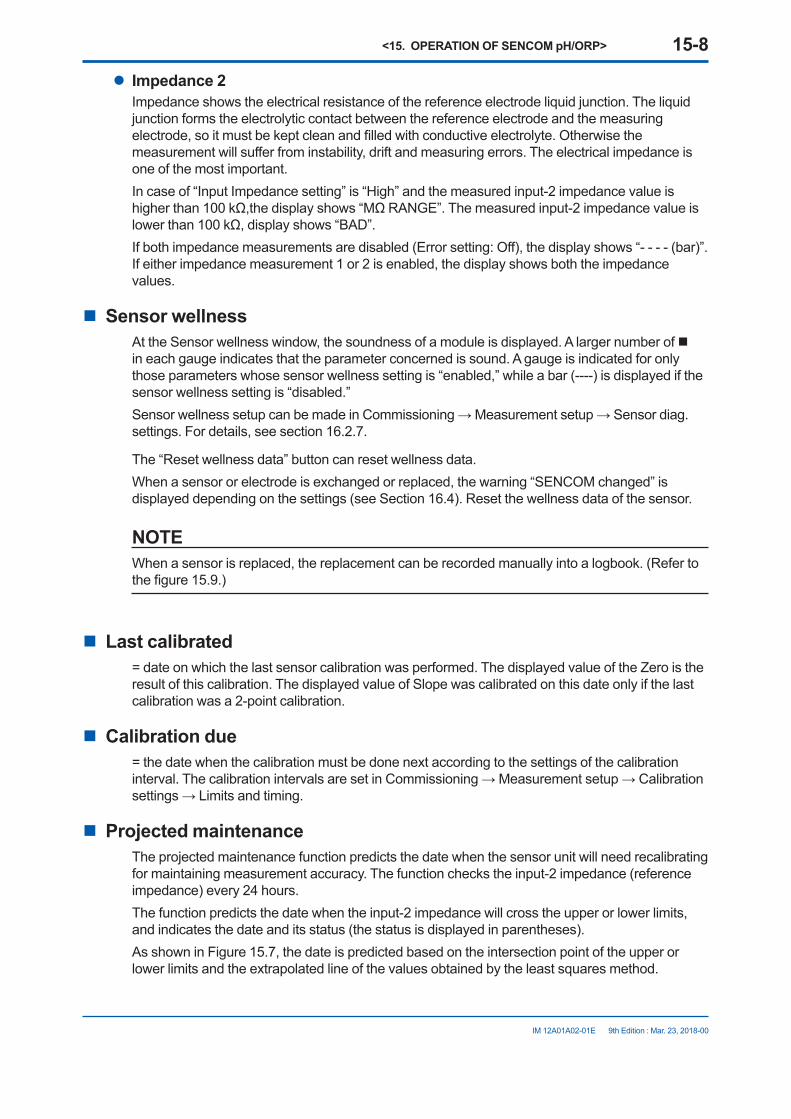
<15. OPERATION OF SENCOM pH/ORP> 15-8
IM 12A01A02-01E 9th Edition : Mar. 23, 2018-00
l Impedance 2Impedance shows the electrical resistance of the reference electrode liquid junction. The liquid junction forms the electrolytic contact between the reference electrode and the measuring electrode,soitmustbekeptcleanandfilledwithconductiveelectrolyte.Otherwisethemeasurementwillsufferfrominstability,driftandmeasuringerrors.Theelectricalimpedanceisone of the most important.Incaseof“InputImpedancesetting”is“High”andthemeasuredinput-2impedancevalueishigherthan100kΩ,thedisplayshows“MΩRANGE”.Themeasuredinput-2impedancevalueislowerthan100kΩ,displayshows“BAD”.Ifbothimpedancemeasurementsaredisabled(Errorsetting:Off),thedisplayshows“----(bar)”.If either impedance measurement 1 or 2 is enabled, the display shows both the impedance values.
n Sensor wellnessAt the Sensor wellness window, the soundness of a module is displayed. A larger number of n in each gauge indicates that the parameter concerned is sound. A gauge is indicated for only those parameters whose sensor wellness setting is “enabled,” while a bar (----) is displayed if the sensor wellness setting is “disabled.”SensorwellnesssetupcanbemadeinCommissioning→Measurementsetup→Sensordiag.settings. For details, see section 16.2.7.
The “Reset wellness data” button can reset wellness data.When a sensor or electrode is exchanged or replaced, the warning “SENCOM changed” is displayeddependingonthesettings(seeSection16.4).Resetthewellnessdataofthesensor.
NOTEWhen a sensor is replaced, the replacement can be recorded manually into a logbook. (Refer to thefigure15.9.)
n Last calibrated=dateonwhichthelastsensorcalibrationwasperformed.ThedisplayedvalueoftheZeroistheresult of this calibration. The displayed value of Slope was calibrated on this date only if the last calibration was a 2-point calibration.
n Calibration due=thedatewhenthecalibrationmustbedonenextaccordingtothesettingsofthecalibrationinterval.ThecalibrationintervalsaresetinCommissioning→Measurementsetup→Calibrationsettings→Limitsandtiming.
n Projected maintenanceThe projected maintenance function predicts the date when the sensor unit will need recalibrating for maintaining measurement accuracy. The function checks the input-2 impedance (reference impedance)every24hours.The function predicts the date when the input-2 impedance will cross the upper or lower limits, and indicates the date and its status (the status is displayed in parentheses).As shown in Figure 15.7, the date is predicted based on the intersection point of the upper or lower limits and the extrapolated line of the values obtained by the least squares method.
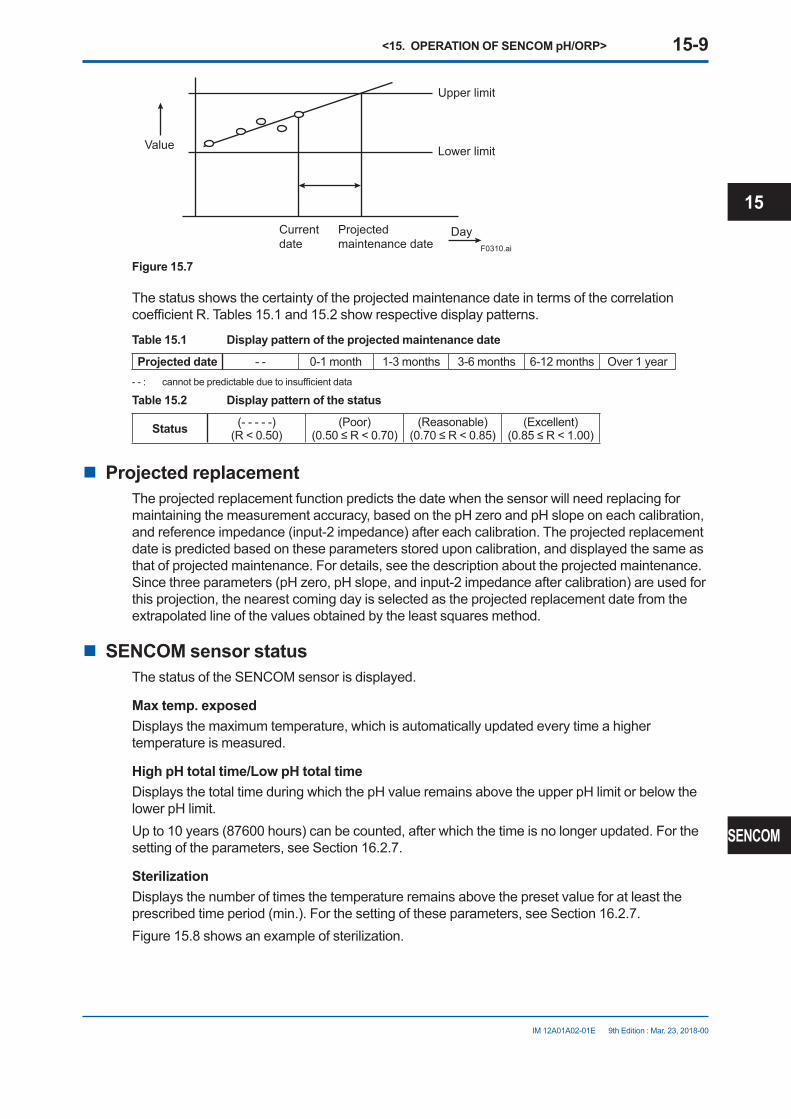
<15. OPERATION OF SENCOM pH/ORP> 15-9
IM 12A01A02-01E 9th Edition : Mar. 23, 2018-00
Day
Value Lower limit
Upper limit
Current date
Projected maintenance date F0310.ai
Figure 15.7
The status shows the certainty of the projected maintenance date in terms of the correlation coefficientR.Tables15.1and15.2showrespectivedisplaypatterns.
Table 15.1 Display pattern of the projected maintenance date
Projected date - - 0-1 month 1-3 months 3-6 months 6-12 months Over 1 year--: cannotbepredictableduetoinsufficientdata
Table 15.2 Display pattern of the status
Status (- - - - -)(R < 0.50)
(Poor)(0.50≤R<0.70)
(Reasonable)(0.70≤R<0.85)
(Excellent)(0.85≤R<1.00)
n Projected replacementThe projected replacement function predicts the date when the sensor will need replacing for maintainingthemeasurementaccuracy,basedonthepHzeroandpHslopeoneachcalibration,and reference impedance (input-2 impedance) after each calibration. The projected replacement date is predicted based on these parameters stored upon calibration, and displayed the same as that of projected maintenance. For details, see the description about the projected maintenance. Sincethreeparameters(pHzero,pHslope,andinput-2impedanceaftercalibration)areusedforthis projection, the nearest coming day is selected as the projected replacement date from the extrapolated line of the values obtained by the least squares method.
n SENCOM sensor statusThe status of the SENCOM sensor is displayed.
Max temp. exposedDisplays the maximum temperature, which is automatically updated every time a higher temperature is measured.
High pH total time/Low pH total timeDisplaysthetotaltimeduringwhichthepHvalueremainsabovetheupperpHlimitorbelowthelowerpHlimit.Up to 10 years (87600 hours) can be counted, after which the time is no longer updated. For the setting of the parameters, see Section 16.2.7.
SterilizationDisplays the number of times the temperature remains above the preset value for at least the prescribed time period (min.). For the setting of these parameters, see Section 16.2.7.Figure 15.8 shows an example of sterilization.
15
SENCOM
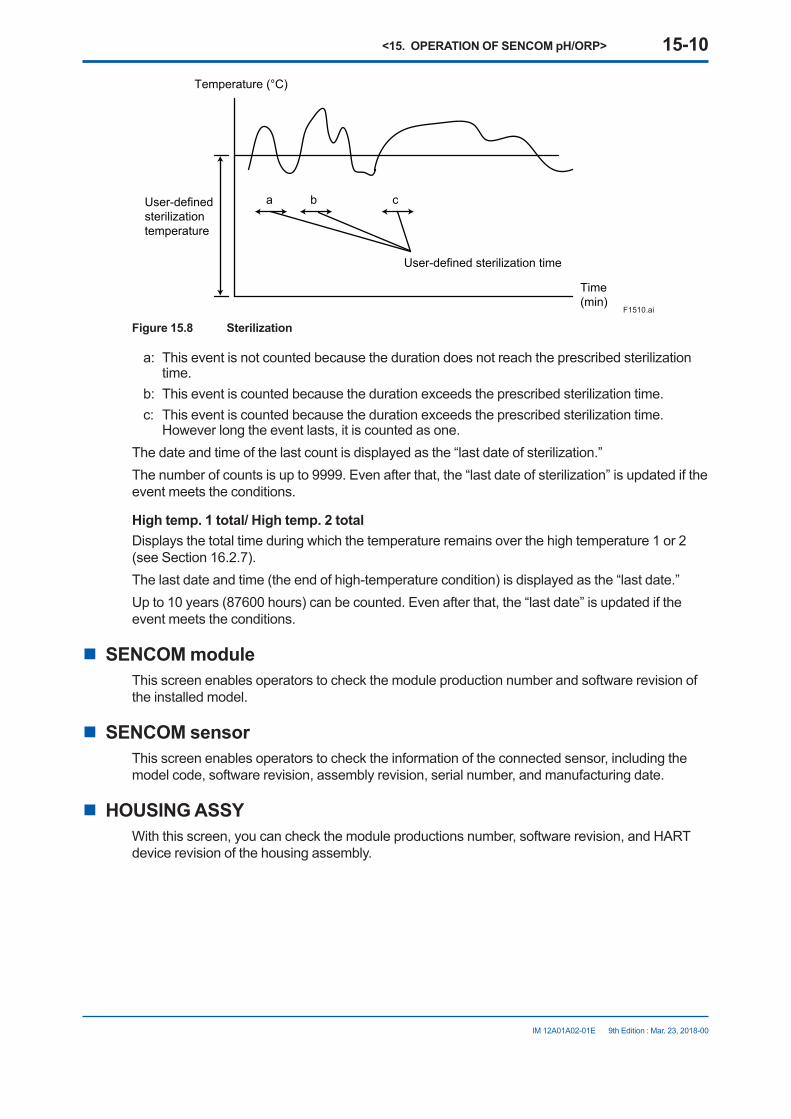
<15. OPERATION OF SENCOM pH/ORP> 15-10
IM 12A01A02-01E 9th Edition : Mar. 23, 2018-00
F1510.ai
User-defined sterilization time
User-defined sterilization temperature
Time(min)
Temperature (°C)
a b c
Figure 15.8 Sterilization
a: This event is not counted because the duration does not reach the prescribed sterilization time.
b: This event is counted because the duration exceeds the prescribed sterilization time.c: This event is counted because the duration exceeds the prescribed sterilization time.
Howeverlongtheeventlasts,itiscountedasone.The date and time of the last count is displayed as the “last date of sterilization.”The number of counts is up to 9999. Even after that, the “last date of sterilization” is updated if the event meets the conditions.
High temp. 1 total/ High temp. 2 totalDisplays the total time during which the temperature remains over the high temperature 1 or 2 (see Section 16.2.7).The last date and time (the end of high-temperature condition) is displayed as the “last date.”Up to 10 years (87600 hours) can be counted. Even after that, the “last date” is updated if the event meets the conditions.
n SENCOM moduleThis screen enables operators to check the module production number and software revision of the installed model.
n SENCOM sensorThis screen enables operators to check the information of the connected sensor, including the model code, software revision, assembly revision, serial number, and manufacturing date.
n HOUSING ASSYWiththisscreen,youcancheckthemoduleproductionsnumber,softwarerevision,andHARTdevice revision of the housing assembly.
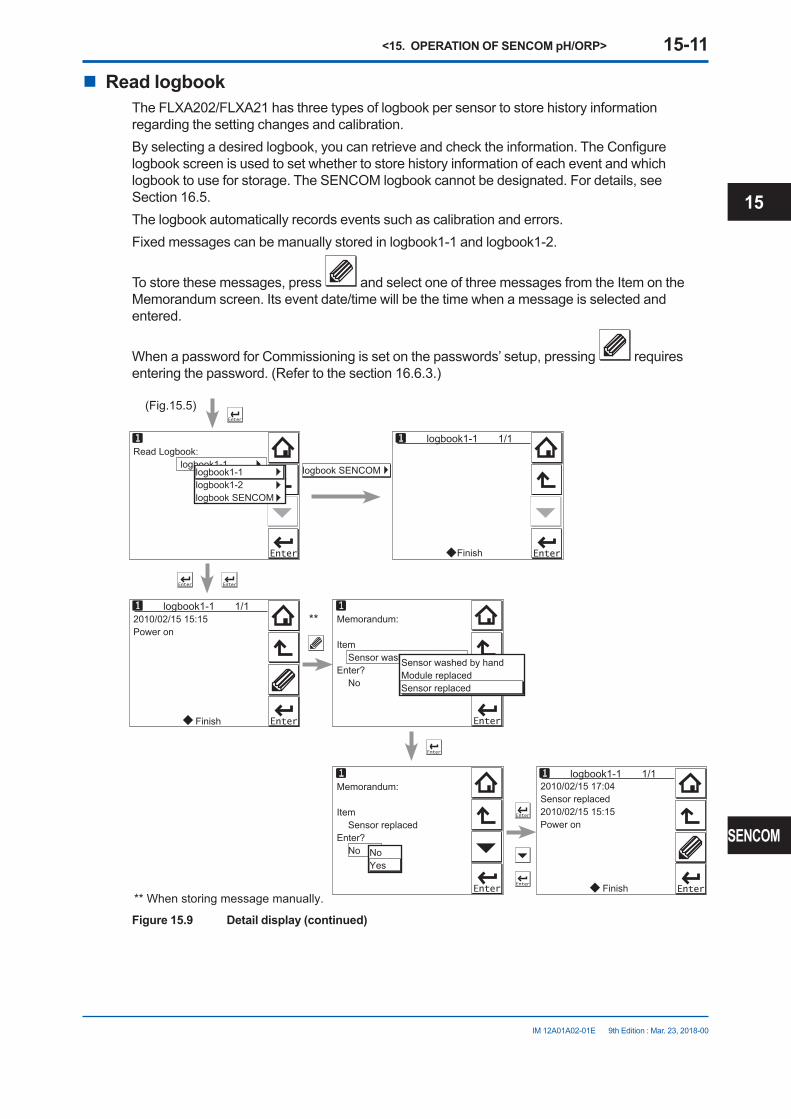
<15. OPERATION OF SENCOM pH/ORP> 15-11
IM 12A01A02-01E 9th Edition : Mar. 23, 2018-00
n Read logbookThe FLXA202/FLXA21 has three types of logbook per sensor to store history information regarding the setting changes and calibration.Byselectingadesiredlogbook,youcanretrieveandchecktheinformation.TheConfigurelogbook screen is used to set whether to store history information of each event and which logbook to use for storage. The SENCOM logbook cannot be designated. For details, see Section 16.5.The logbook automatically records events such as calibration and errors.Fixed messages can be manually stored in logbook1-1 and logbook1-2.
To store these messages, press and select one of three messages from the Item on the Memorandum screen. Its event date/time will be the time when a message is selected and entered.
When a password for Commissioning is set on the passwords’ setup, pressing requires entering the password. (Refer to the section 16.6.3.)
Read Logbook: logbook1-1
2010/02/15 15:15Power on
Finish
Memorandum:
Item Sensor washed by handEnter? No
logbook1-1 1/1
logbook1-1 1/1
Finish
Memorandum:
Item Sensor replacedEnter? No
2010/02/15 17:04Sensor replaced2010/02/15 15:15Power on
Finish
logbook1-1 1/1
** When storing message manually.
(Fig.15.5)
**
Sensor washed by handModule replacedSensor replaced
logbook1-1logbook1-2logbook SENCOM
NoYes
logbook SENCOM
Figure 15.9 Detail display (continued)
15
SENCOM

<15. OPERATION OF SENCOM pH/ORP> 15-12
IM 12A01A02-01E 9th Edition : Mar. 23, 2018-00
15.5 Trend graphicsPressing on the Zoom display changes the display to a graphical mode in which the average measured value is shown on a time scale. The “Live” value is also digitally displayed in a text box. The time scale (X-axis) and the primary value scale (Y-axis) are set in the “DISPLAY SETUP” menu (Section 16.7.2).Thescreendisplaysthetrendofupto41averagesofthemeasurementforeachtimeinterval.The FLXA202/FLXA21 samples the measurements every second. The trending graphic also shows the maximum and minimum measured values in that interval.Forexample,ifthetimescaleissetto4hours,thenthetrendisshownfor4hourspriortotheactualmeasurement.Eachpointonthetrendlinerepresentstheaverageover4×60×60/41=351 measurements (seconds).
NOTEUpdating the trend screen setup resets the current trend graph and starts a new one.
12.00
8.40
5.60
2.50
12:00 12:20 12:40
10.38pH
Minimum
MaximumAverage
Time
Tag:
Mea
sure
men
t val
ue (p
H) SENCOM pH1
Current process valueMax. and min. values on this display
Figure 15.10 Trend screen
The 1st display item data on the Main display is shown as a graph. Touching any point on the display changes the display to the 2nd display item data (and to the 3rd display item data if set) and then returns to the Main display.

<15. OPERATION OF SENCOM pH/ORP> 15-13
IM 12A01A02-01E 9th Edition : Mar. 23, 2018-00
12.00
8.40
5.60
2.50
12:00 12:20 12:40
10.38pHTag: SENCOM pH1
12.00
8.40
5.60
2.50
12:00 12:20 12:40
25.0°CTag: SENCOM Temperature1
Next
20
12
4
mA
15.00
Figure 15.11 Trend graphics
15.6 Instrument status screenIn the fieldoftheMaindisplay,the (Warning) or (Fault) sign appears according to the instrument status. Upon pressing the displayed button, detailed information of the relevant status appears.See “n Information button” on page 1-10.
15.7 Calibration and CommissioningAllowsyoutocalibrateandconfiguretheinstrument.Theseoperationscanbeprotectedwithapassword.For details on the password, refer to section 16.6.3.
Execute: Calibration HOLD
Setup: Commissioning Change language Start Quick Setup
Execute & Setup
Figure 15.12 Execute & Setup
Pressing changesthedisplaytotheExecute&Setupscreen.
15
SENCOM
<15. OPERATION OF SENCOM pH/ORP> 15-14
IM 12A01A02-01E 9th Edition : Mar. 23, 2018-00
Browse through the menu items by pressing untilyoufindthedesiredmenuandthenpress
to enter that menu. It is also possible to enter a desired menu by pressing the symbol beside the menu item.Forcalibration(HOLD),readchapter17,andforcommissioning,readchapter16.

<16. COMMISSIONING OF SENCOM pH/ORP> 16-1
IM 12A01A02-01E 9th Edition : Mar. 23, 2018-00
16. COMMISSIONING OF SENCOM pH/ORPThis chapter describes how to check and change settings from the Commissioning screen.When you move to the Commissioning screen, the output is held.
Execute: Calibration/Wash HOLD
Setup: Comissioning Change language Start Quick Setup
Execute &Setup Sensor setup Measurement setup Output setup Error configuration Logbook configuration Advanced setup Display setup
Commissioning
Figure 16.1 Commissioning screen
Operations in Commissioning can be password-protected. If you set up a password, always take a note of it. For details on setting a password, see section 16.6.3.
Figure 15.1 shows the commissioning procedure. Before changing any parameters, read the relevantsectionsinthisdocumentandunderstandhowthechangeofparametersaffectstheperformance of this instrument. If you set a wrong value, return it to the default setting or value and then set it again.
Onthefirststartup,theparametersarealldefaultvaluesconfiguredatthefactory.Checktheparameters in Table 16.1 and change any of them if necessary depending on the sensors to be connected and the purpose of use.Set“Sensortype”first.Somemeasurementparametersandrelevantoptionschangeaccordingly. The underlined parameters in Table 16.1 are used for the quick setup.The default values and setting ranges are listed in the “User setting table of SENCOM” in the attached CD-ROM.Afterconfirmingthattheinstrumentoperatesnormallywiththeparameters,printoutthe“Usersetting table of SENCOM” and write down these parameters in the column of User Settings.All user parameters can also be saved in the instrument.SelectCommissioning→Advancedsetup→Settings→Saveusersettings(seeSection16.6.1).
16
SENCOM

<16. COMMISSIONING OF SENCOM pH/ORP> 16-2
IM 12A01A02-01E 9th Edition : Mar. 23, 2018-00
Table 16.1 Menu Structure and Default Values in “Commissioning”
Parameter Ref. sect.Sensor setup Sensor type 16.1Measurement setup Measurement 16.2.1
Temperature setting Temp. element 16.2.2Temp. compensation Compensation 16.2.3
Reference temp.Process Temp. Compensation
Calibration settings pHsettings Zero and Slope units 16.2.4Limits and timingBuffers(selectset)Zero/Slope/ITPAuto correct (Zero, Slope)
ORP settingsrHsettings
Limit and timingZero/Slope
Impedance settings 16.2.5Concentration Unit 16.2.6Sensor diag. settings Input 1 imp.: 16.2.7
FINEInput 2 imp.:Process timeHeatcycle:DefineheatcycleDefineSENCOMstatus
Output setup mA 16.3Output Process parameter
Setup Linear 0%value
100%value TableBurnDamping time
Simulate Simulation perc.ConfigureHold
Errorconfiguration 16.4Logbookconfiguration 16.5Advanced setup Settings 16.6.1
Tag 16.6.2Passwords 16.6.3Date/Time 16.6.4Communication 16.6.5
HARTPH201G
Factory setup 16.6.6Display setup Main display 16.7.1
Trend 16.7.2Auto Return 16.7.3Adjust contrast 16.7.4MONITOR display 16.7.5
NOTEAll the parameters for the quick setup (underlined ones in Table 16.1) are crucial for measurement. If you change any of them, other parameters may be initialized. For the parameters that may initialize other values, see Appendix 1.
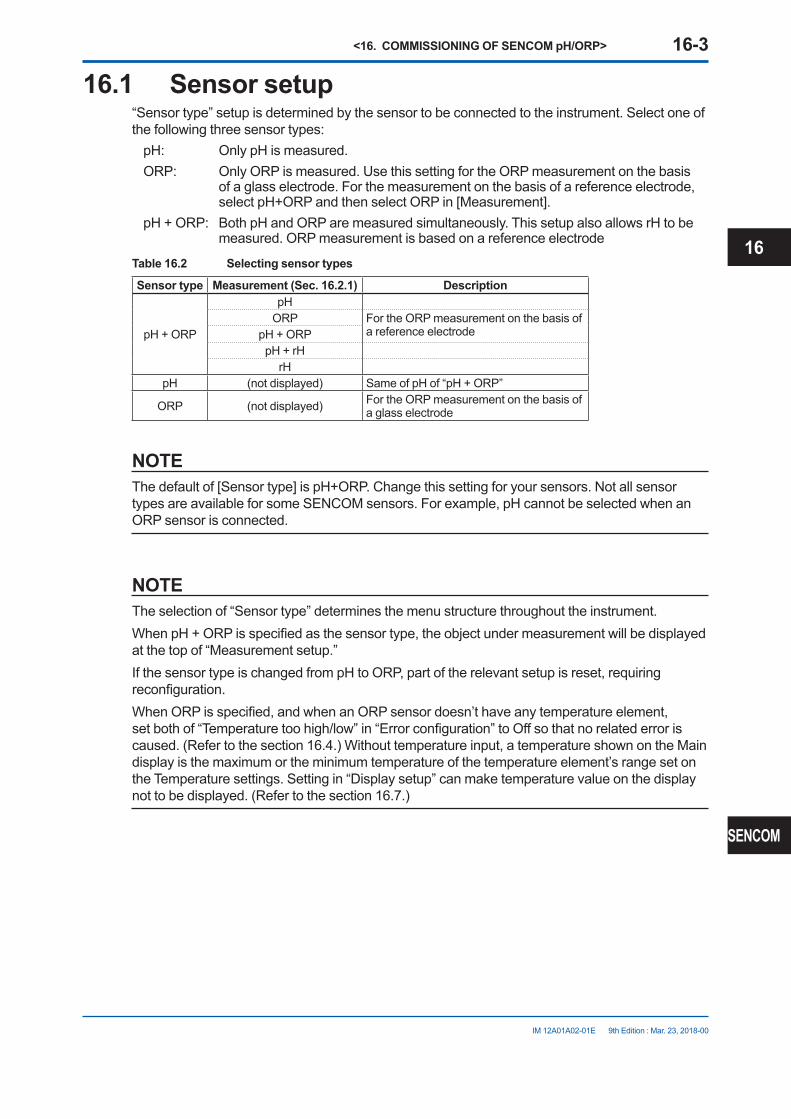
<16. COMMISSIONING OF SENCOM pH/ORP> 16-3
IM 12A01A02-01E 9th Edition : Mar. 23, 2018-00
16.1 Sensor setup“Sensor type” setup is determined by the sensor to be connected to the instrument. Select one of the following three sensor types:pH: OnlypHismeasured.ORP: Only ORP is measured. Use this setting for the ORP measurement on the basis
of a glass electrode. For the measurement on the basis of a reference electrode, selectpH+ORPandthenselectORPin[Measurement].
pH+ORP: BothpHandORParemeasuredsimultaneously.ThissetupalsoallowsrHtobemeasured. ORP measurement is based on a reference electrode
Table 16.2 Selecting sensor types
Sensor type Measurement (Sec. 16.2.1) Description
pH+ORP
pHORP For the ORP measurement on the basis of
a reference electrodepH+ORPpH+rHrH
pH (not displayed) SameofpHof“pH+ORP”
ORP (not displayed) For the ORP measurement on the basis of a glass electrode
NOTEThedefaultof[Sensortype]ispH+ORP.Changethissettingforyoursensors.NotallsensortypesareavailableforsomeSENCOMsensors.Forexample,pHcannotbeselectedwhenanORP sensor is connected.
NOTEThe selection of “Sensor type” determines the menu structure throughout the instrument.WhenpH+ORPisspecifiedasthesensortype,theobjectundermeasurementwillbedisplayedat the top of “Measurement setup.”IfthesensortypeischangedfrompHtoORP,partoftherelevantsetupisreset,requiringreconfiguration.WhenORPisspecified,andwhenanORPsensordoesn’thaveanytemperatureelement,setbothof“Temperaturetoohigh/low”in“Errorconfiguration”toOffsothatnorelatederroriscaused.(Refertothesection16.4.)Withouttemperatureinput,atemperatureshownontheMaindisplay is the maximum or the minimum temperature of the temperature element’s range set on the Temperature settings. Setting in “Display setup” can make temperature value on the display not to be displayed. (Refer to the section 16.7.)
16
SENCOM
<16. COMMISSIONING OF SENCOM pH/ORP> 16-4
IM 12A01A02-01E 9th Edition : Mar. 23, 2018-00
16.2 Measurement setupThis section describes how to set up various parameters relating to measurements.Measurements are performed based on the measurement parameter setup.
For measurement setup, part of the menu structure of settable items changes depending on the “Sensor type” selected in “16.1 Sensor setup.”
16.2.1 MeasurementIfpHorORPisselectedin“Sensortype,”ameasurementtypedoesnotneedtobeselectedandit is not displayed.If“pH+ORP”isselectedin“Sensortype,”fivemeasurementtypescanbeselectedforthe“Measurement” item at the top of the Measurement setup screen. Select a suitable measurement type for the application.Moreover,associateditemsareaddedtoparametersin“Errorconfiguration,”“Displaysetup,”etc.;checkthesettingconditionofeachitem.
16.2.2 Temperature settingsWhen SENCOM sensors are connected, temperature elements for compensation are automatically set.
Celsius (°C) or Fahrenheit (°F) temperature units are available. If the unit is changed, the following values are also recalculated automatically to the new unit:
• Manual temp.• Reference temp.• Temp.coefficient• Temp. ranges in the matrix
16.2.3 Temperature compensationORP measurement involves no temperature input. No setting is required on the temperature compensation.Processtemperaturecompensationiseffectiveif“T.C.ORPmV/°C”in“Temp.Coef.” is set.
n Temperature compensationThiscompensationofpHvalueisperformedontheNernstequation.Two methods can be used: Automatic and Manual. Select Automatic when a temperature element is used, or select Manual when a manually set temperature is used.
NOTEWhen Manual is selected on the Temperature compensation, a process temperature should be set in the “Manual temp.” A temperature shown on the Main display is this manually set temperature.
n Reference temperatureSetareferencetemperaturetowhichthemeasuredpHvaluemustbecompensated.Normally25°C is used, so this temperature is chosen as the default value.
<16. COMMISSIONING OF SENCOM pH/ORP> 16-5
IM 12A01A02-01E 9th Edition : Mar. 23, 2018-00
n Process temperature compensationSelect a temperature compensation method. “None” does not perform the temperature compensation.If“pH”isselectedin“Sensortype,”chooseprocesstemperaturecompensationfromamongNone,TC,Matrix,andNEN6411.If“ORP”isselectedin“Sensortype,”chooseitfromamongNone and TC.
l TCThis method uses the linear compensation function.Itispossibletoadjustthetemperaturecoefficient(TC)factordirectly.Ifthetemperaturecoefficientfactorofthesampleliquidisknownfromlaboratoryexperimentsorhasbeenpreviously determined, it can be entered here.ThisTCisapHvariationto1°C(∆pH/∆T).Adjustthevaluebetween-0.1to0.1pH/ºC.In combination with the reference temperature setting, a linear compensation function is obtained, which is suitable for all kinds of chemical solutions.
l MatrixMatrix means a temperature compensation which uses the temperature compensation matrix.ThetemperaturecompensationmatrixisatableofpHvaluesatvarioustemperaturescorrespondingtothepHvaluesatthestandardtemperature.Fordetails,seeAppendix1.
WhenthetemperatureortheprecompensatedpHvalueisoutoftherangeofthetemperaturecompensation matrix, the temperature compensation error (warning) will be issued. This is not a device error.In this case, however, the temperature compensation is performed by extrapolation.
NOTETodisplaytheprecompensatedpHvalue,settheProcessTemp.Compensationto“None”.SelectMeasurementsetup→Temp.compensation→ProcessTemp.Compensation.
l NEN6411This algorithm takes into account the dissociation of water in strong acid and strong alkaline solutions.ItisparticularlyusefulforpHmeasurementofboilerfeedwater.
16
SENCOM
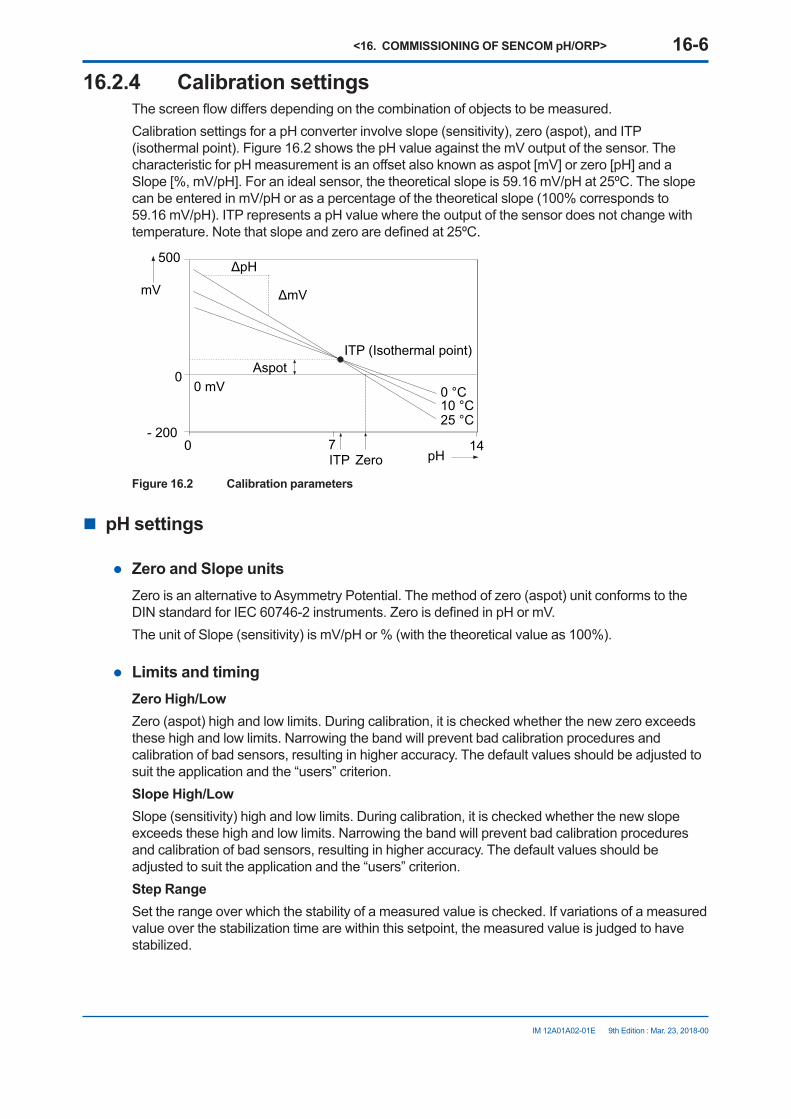
<16. COMMISSIONING OF SENCOM pH/ORP> 16-6
IM 12A01A02-01E 9th Edition : Mar. 23, 2018-00
16.2.4 Calibration settingsThescreenflowdiffersdependingonthecombinationofobjectstobemeasured.CalibrationsettingsforapHconverterinvolveslope(sensitivity),zero(aspot),andITP(isothermalpoint).Figure16.2showsthepHvalueagainstthemVoutputofthesensor.ThecharacteristicforpHmeasurementisanoffsetalsoknownasaspot[mV]orzero[pH]andaSlope[%,mV/pH].Foranidealsensor,thetheoreticalslopeis59.16mV/pHat25ºC.TheslopecanbeenteredinmV/pHorasapercentageofthetheoreticalslope(100%correspondsto59.16mV/pH).ITPrepresentsapHvaluewheretheoutputofthesensordoesnotchangewithtemperature.Notethatslopeandzeroaredefinedat25ºC.
ΔpH
ΔmV
ITP (Isothermal point)Aspot
0 mV 0 °C10 °C25 °C
mV
500
0
- 20014
pHITP Zero0 7
Figure 16.2 Calibration parameters
n pH settings
l Zero and Slope unitsZero is an alternative to Asymmetry Potential. The method of zero (aspot) unit conforms to the DINstandardforIEC60746-2instruments.ZeroisdefinedinpHormV.TheunitofSlope(sensitivity)ismV/pHor%(withthetheoreticalvalueas100%).
l Limits and timingZero High/LowZero (aspot) high and low limits. During calibration, it is checked whether the new zero exceeds these high and low limits. Narrowing the band will prevent bad calibration procedures and calibration of bad sensors, resulting in higher accuracy. The default values should be adjusted to suit the application and the “users” criterion.Slope High/LowSlope (sensitivity) high and low limits. During calibration, it is checked whether the new slope exceeds these high and low limits. Narrowing the band will prevent bad calibration procedures and calibration of bad sensors, resulting in higher accuracy. The default values should be adjusted to suit the application and the “users” criterion.Step RangeSet the range over which the stability of a measured value is checked. If variations of a measured value over the stabilization time are within this setpoint, the measured value is judged to have stabilized.

<16. COMMISSIONING OF SENCOM pH/ORP> 16-7
IM 12A01A02-01E 9th Edition : Mar. 23, 2018-00
Stabilization timeThisisthetimeoverwhichthestabilityofapHvalueismonitoredduringcalibration.WhenvariationsofthepHvaluearewithinavaluesetinStepRangeoverthisstabilizationtimesethere,thevalueisregardedasbeingstable.IfthepHvaluedoesnotstabilizewithin10minutes,calibration is aborted.Calibr. intervalSet the interval in which a new calibration must take place. If the interval set here is exceeded, theinstrumentwillgiveawarningorfaultaccordingtothesettingontheErrorconfigurationscreen.
l Buffers (select set)Calibrationismadeusingstandardcalibrationbuffers.WerecommendtheNIST(JISequivalent)standardbuffersforhighestaccuracy,buttheuserisfreetoselectDIN19267,US,orauser-definedbuffer.ThestandardbufferscanbefoundinAppendix1.Threetypesofuser-definedbuffertablescanbedefined.OntheFreeprogrammablescreen,selectabuffertablethatyouwishtosetup.Whenabuffertableisselectedonthisscreen,theBuffertable1toBuffertable3screensoftheselectedbuffertablearedisplayed.Clear table?Ifyouselect“Yes”andpress“Yes”whenpromptedtoclearthetable,thecontentsofthebuffertablewillbecleared,thedisplaywillreturntotheBuffertablescreenautomatically,andthe“Tablewas cleared” message will be displayed. If you want to perform temperature compensation using thematrixafterclearingthetable,matrixvaluesmustberedefined.Check values?If you select “Yes,” a value check starts. When the check ends, the results will be displayed on the screen. When the results are normal, the “No error” message appears. In case of an error, error information is displayed.
l Zero/Slope/ITPYou can enter Zero (aspot), Slope (sensitivity), and ITP values directly in the screen displayed. These data can be obtained from the manufacturer of the probe, by the users laboratory, etc.
NOTEIt is not necessary to enter this data. In most cases, as the FLXA202/FLXA21 automatically does this while performing calibration, the feature is used in the case of special electrode systems or where calibration in the process environment is not possible. See Chapter 17.
l Auto correct (Zero, Slope)Thisfunctioncalculatescalibrationcoefficientsfromthetransitionofpastcalibrationdata(zero,slope)andcompensatespHvalueusingthesecalibrationcoefficientsafterthelatestcalibration.Thedefaultsettingis“Disable.”Tomakethefunctioneffective,select“Enable.”
16
SENCOM
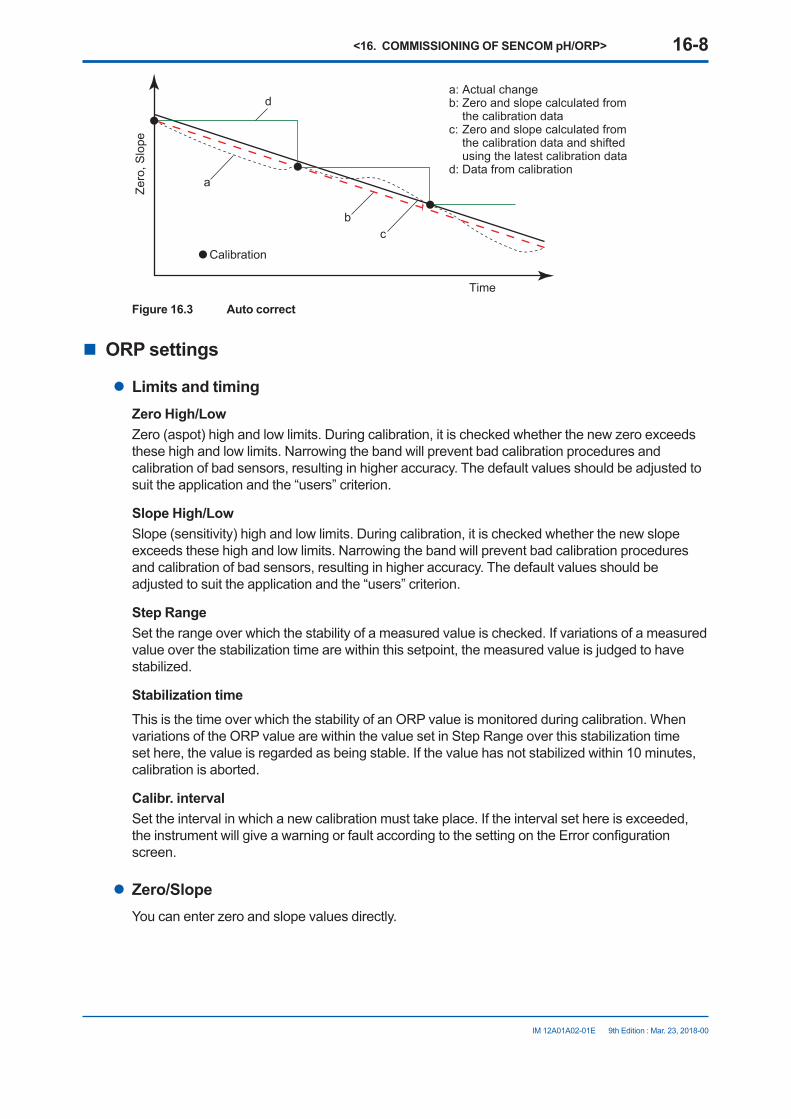
<16. COMMISSIONING OF SENCOM pH/ORP> 16-8
IM 12A01A02-01E 9th Edition : Mar. 23, 2018-00
Time
Calibration
Zero
, Slo
pe
a
bc
da: Actual changeb: Zero and slope calculated from
the calibration datac: Zero and slope calculated from
the calibration data and shifted using the latest calibration data
d: Data from calibration
Figure 16.3 Auto correct
n ORP settings
l Limits and timingZero High/LowZero (aspot) high and low limits. During calibration, it is checked whether the new zero exceeds these high and low limits. Narrowing the band will prevent bad calibration procedures and calibration of bad sensors, resulting in higher accuracy. The default values should be adjusted to suit the application and the “users” criterion.
Slope High/LowSlope (sensitivity) high and low limits. During calibration, it is checked whether the new slope exceeds these high and low limits. Narrowing the band will prevent bad calibration procedures and calibration of bad sensors, resulting in higher accuracy. The default values should be adjusted to suit the application and the “users” criterion.
Step RangeSet the range over which the stability of a measured value is checked. If variations of a measured value over the stabilization time are within this setpoint, the measured value is judged to have stabilized.
Stabilization timeThis is the time over which the stability of an ORP value is monitored during calibration. When variations of the ORP value are within the value set in Step Range over this stabilization time set here, the value is regarded as being stable. If the value has not stabilized within 10 minutes, calibration is aborted.
Calibr. intervalSet the interval in which a new calibration must take place. If the interval set here is exceeded, theinstrumentwillgiveawarningorfaultaccordingtothesettingontheErrorconfigurationscreen.
l Zero/SlopeYou can enter zero and slope values directly.

<16. COMMISSIONING OF SENCOM pH/ORP> 16-9
IM 12A01A02-01E 9th Edition : Mar. 23, 2018-00
16.2.5 Impedance settingsThis screen is used to set the impedance relating to an input impedance check.“High”or“Low”isautomaticallysetaccordingtotheconnectedSENCOMsensor.Youcannotselect the setting. In the case of “Low”, high and low limits can be set.ForFU20Fsensors,Impedance1is“High”andImpedance2is“Low”.
Input1impedancerepresentsthe“glassmembraneimpedance”ofapHsensor.IncaseofanORP sensor, it represents “metal electrode impedance.” Input 2 impedance stands for “reference impedance.”
The FLXA202/FLXA21 has an impedance check, which is capable of monitoring the impedance of various sensor systems.The system can be set to measure the impedances of glass (input 1 impedance: high) and reference (input 2 impedance: low) electrodes. In applications that tend to leave deposits on the electrodesortoclogthereferencesensorjunction,theimpedancecheck(seterrorconfiguration)on the reference sensor can be used to initiate an alarm, or to initiate the wash cleaning process, if one of the limits is exceeded.
16.2.6 ConcentrationGenerallypHvaluesarenotconvertedintoconcentrations.Followinglinearconversionisnotsuitable for a lot of measurements.
TheFLXA202/FLXA21iscapableofconvertingameasuredpHvalueintoconcentrationfordisplay. Parameters required for concentration calculation can be arbitrarily set by the user. Those parameters are as follows:Unit: Thedefaultvalueis%.Theunitcanbeselectedfromamongmg/L,g/L,and
ppm.pH: Thedefaultvaluesare0and14pH(0to14).TheyarethepHzeroandspan
required for conversion to concentration.Concentration: Thedefaultvalueare0and100%.ConcentrationforeachpHcanbeset.
ConcentrationcanbeassignedtothepHvaluezeroandspanindividually.
16.2.7 Sensor diagnostic settingsThis screen is used to set items relating to sensor diagnostics displayed on the screens invoked
by pressing .Gauges are displayed for only parameters that have been enabled in “Sensor diag. settings.”Parameters set to Disable are provided with a bar display.
ThesettingparametersincludeInput1imp.,Input2imp.,Progresstime,andHeatcycle.Wheninputimpedanceisset“High”(section16.2.5),“FINE”valuecanbechanged.Wheninputimpedanceisset“Low”,its“Highlimit”and“Lowlimit”willbethelimitsfordiagnostic.ForFU20Fsensors,Impedance1is“High”andImpedance2is“Low”.
Itisalsopossibletosetthe“Badlimits”oftheprogresstimeandheatcycleandthe“Heatcycletemp”and“Heatcycletime”oftheheatcycle.
16
SENCOM
<16. COMMISSIONING OF SENCOM pH/ORP> 16-10
IM 12A01A02-01E 9th Edition : Mar. 23, 2018-00
l Define SENCOM statusSet the parameters for analyzing the SENCOM sensor. They are displayed on the detail screen.TheparametersareSterilizedtemp.,Sterilizedtime,Hightemp.1,Hightemp.2,LowpHvalue,andHighpHvalue.
16.3 Output setupThegeneralprocedureistofirstdefinethefunctionoftheoutput,OutputorSimulate.Then,setthe process parameters associated with the output. On the Output, an output of measured value is selected. On the Simulate, a simulation value can be set.And,theparametersforHOLDfunctioncanbesetonthissetting.
l OutputTheoutputsignalisacurrentvaluespecifiedbythefollowingparameters.
Process parameterThe available process parameters depend on the selected “Sensor type” on the Sensor setup and the selected “Measurement” type on the Measurement setup.The output of the selected process parameter is shown as a bar on the bottom of the Main display.Anditsparametersymbol(forexample,PH1)isshownabovethebar,too.Whena selected process parameter is displayed as a measurement value, the top left number or character is turned to be white number or character on black background (for example, ). (Refer to the section 1.2.)
Process parameters can be selected from among:pH1,Temperature1,andORP1: SENCOMmodule’smeasuredvalues
SetupSelect one of the output methods: Linear and Table.Linear: Setthe0%and100%values.Table: Thisallowstheconfigurationofanoutputcurveby21points(5%intervals). (The0%and100%valuesmustbeentered.)
BurnSelectthedesignatedoutputincaseofafaultfromamongOff,Low,andHigh.See“16.4Errorconfiguration”tosettheoutput.Off: Outputdependsonthemeasuredvalue.Low: Outputisfixedto3.6mAHigh:Outputisfixedto22.0mA.
Damping timeThisisthetimetakenforaresponsetoastepinputchangetoreach90%ofthefinalvalue(attenuation time). Set this time in sec.
l SimulateWhenthisfunctionisselected,anoutputoftheinstrumentwillbeafixedcurrentvaluesetin%oftheoutputspan.Theoutputspanrangeis-2.5%to112.5%(3.6mAto22.0mA).When “Simulate” is selected, regardless of hold setting, the output is always simulated value.
<16. COMMISSIONING OF SENCOM pH/ORP> 16-11
IM 12A01A02-01E 9th Edition : Mar. 23, 2018-00
n Configure HoldOntheConfigureHold,settingsareperformedtoholdofthemAoutputatapresetvalue.(Refertothesection17.4.)Thisisenabledonlyif“mA”is“Output.”During the Commissioning or the Quick Setup, the mA output is automatically held. The preset valuedependsonasettingonthe“Lastorfixed”.
“Last”: The preset value is a value measured just before hold condition.“Fixed”: The preset value is a value set in the “Fixed value mA”. When the “Fixed” is selected, set a mA value in the “Fixed value mA”.
Selectiononthe“HoldduringCalibration/Wash”decidestoactivateordeactivatetheholdfunction automatically during calibration or wash.
“Enabled”: Activation of the automatic hold function“Disabled”: No automatic hold function
Onlywhenthe“PH201G”isselectedontheCommunication,themessageof“HoldduringCalibration/Wash”isdisplayed.Onotherselections,themessageof“HoldduringCalibration”isdisplayed.
16.4 Error configurationInErrorconfiguration,configurethestatusesofvariouserrorcauses.
This allows the system to notify the user of the occurrence of an error according to the status categoriesintheErrorconfiguration.SelectastatuscategoryfromamongOff,Warn.(Warning),andFault.“Fault”automaticallyperformsburn-out.WhenBurnhasbeensettoOff(16.3Outputsetup),onlythe error message is displayed.“Warn.” displays an error message.WhenselectingPH201Ginthecommunicationsetting,makesurethatthe“Failcontact”settingis appropriate.
The settable causes of errors are determined based on the settings of the Sensor setup and Measurement setup, and a status category is set to the causes displayed in the Errors 1/3 to 3/3 screens.
16
SENCOM

<16. COMMISSIONING OF SENCOM pH/ORP> 16-12
IM 12A01A02-01E 9th Edition : Mar. 23, 2018-00
Table 16.3 Error configuration
Display item Description DefaultpHtoohigh ThepHvalueexceeds16.00. Warn.pHtoolow ThepHvalueislowerthan–2.00. Warn.Temperature too high Measured process temperature is higher than the
maximum limit.Warn.
Temperature too low Measured process temperature is lower than the minimum limit.
Warn.
ORP too high TheORPvalueishigherthan1500mV. OffORP too low TheORPvalueislowerthan–1500mV. OffrHtoohigh TherHvalueishigherthan100. OffrHtoolow TherHvalueislowerthan0. OffMatrixconfig.error The temperature compensation matrix is not set
properly (see Section 16.2.3).Fault
Calib. time exceeded Calibration time exceeds the calibration interval (seeSection16.2.4).
Off
Wash half-time error The response to wash is abnormal. OffImpedance 1 too high The sensor must be checked. OffImpedance 1 too lowImpedance 2 too highImpedance 2 too lowSENCOM changed The SENCOM sensor has been changed.
ThiserrorsettingcanbesettoeitherOfforWarn..Warn.
CAUTIONIfcancelinganerrorconfigurationcouldberisky,donotcancelitasadangeroussituationmayresult.
NOTEThe “Impedance 1 too high/too low” and “Impedance 2 too high/too low” error items are displayed intheErrorconfigurationscreen.Ingeneral,forapHsensor,“Impedance1”means“glasselectrode,” and for an ORP sensor, it means “metal electrode.” “Impedance 2” represents the reference electrode in all cases.
NOTEBefore using sensors which do not have any temperature measuring elements, set both of “Temperaturetoohigh”and“Temperaturetoolow”toOffonthe“Errorsetting”screen.Duetotheopen input of temperature signal, a false error may happen as if temperature goes over a high limit or a low limit.
16.5 Logbook configurationIn“Logbookconfiguration,”theuserconfiguresinformationtobesavedtoalogbookorinitializesthe logbooks.Logbooks are used to keep an electronic record of events such as error messages, calibrations, and programmed data changes. By referring to this log, users can, for instance, easily determine maintenance or replacement schedules.
<16. COMMISSIONING OF SENCOM pH/ORP> 16-13
IM 12A01A02-01E 9th Edition : Mar. 23, 2018-00
In“Logbookconfiguration,”theusercanselect“Off,”“1-1,”or“1-2”foreachitemofinteresttobelogged.TheSENCOMlogbookcannotbespecified.This can be done for items displayed on the Settings logbook 1/3 to 3/3 screens. Assigning 1-1 or 1-2 to each item allows information to be organized and logged in a logbook.
NOTESome events such as power-on are saved into the logbook “1-1”. This logbook may be full earlier. It is recommended that important information be saved into the logbook “1-2”.
For“Eraselogbook”,aspecifiedlogbook“1-1”,“1-2”or“SENCOM”canbeerasedindividually.When the “Warn if logbook full” is set to “Yes”, a warning is given when the logbook come to near full (up to 3 pages for the SENCOM logbook, up to 13 pages for others).
NOTEWhen the logbook gets full, the oldest information is erased automatically.
16.6 Advanced setupAdvanced setup is used to set functions relating to matters other than measurements such as the selection of settings, tag setting, password setting for protecting calibration and commissioning operations, date setting, and communication setting.(“Factorysetup”isforserviceengineersonly;thereisnoitemtobesetbytheuser.)
16.6.1 SettingsIn “Settings,” select an item to be set as the default value from among “No action,” “Load factory settings,” “Save user settings,” and “Load user settings.”When the default values are loaded, the instrument will be restarted. (In the case of “Save user settings,” it will not be restarted.)The following parameters are not included in the defaults:
• Tag• The contents of all logbooks
NOTEWhen the “Save user setting” is only selected, save of the user-set parameters will start at once.
To avoid wrong selection, operation in this Settings must be done by , not by touching the menu message.
If you select “Load factory settings,” the instrument will be set to the default settings at factory shipment.When this item is selected, a screen prompting whether to restart is displayed. If this is no problem,press“Yes.”Thenthe“Loading…”messageappearsandblinksandloadingisstarted.When the factory settings have been loaded, the instrument will be restarted.
16
SENCOM
<16. COMMISSIONING OF SENCOM pH/ORP> 16-14
IM 12A01A02-01E 9th Edition : Mar. 23, 2018-00
When “Save user settings” is selected, the current settings can be saved as the defaults. When this item is selected, the user settings will start to be saved immediately. After saving the
parameters, press or to change the display because this save doesn’t have restart function.If “Load user settings” is selected, the settings saved as user settings can be set as the defaults.When this item is selected, a screen prompting whether to restart is displayed. If this is no problem,press“Yes.”Thenthe“Loading…”messageappearsandblinksandloadingisstarted.When the user settings have been loaded, the instrument will be restarted.
16.6.2 TagAtagprovidesasymbolicreferencetoaninstrumentandisgenerallydefinedtobeuniquethroughout the control system at one plant site. A tag can contain up to 12 alphanumeric characters. The default value is SENCOM.The tag is displayed at the top of the main display.
16.6.3 PasswordsCalibration and commissioning operations can be separately protected by each password. To protectexecuteoperations,enterapasswordinExecute’sinputfield.Toprotectcommissioningoperations,enterapasswordinCommissioning’sinputfield.Bydefault,bothinputfieldsareempty.Whenapasswordinputfieldisempty,operationisnotpassword-protected.Apasswordcan contain up to 8 characters.
When you set a password, always take a note of it.
When a password is set, input of the password is necessary to enter the password-protected operation. After inputting the password, the display will change to an operator ID input display. When an operator ID is input, its operation is recorded into a logbook. The input of an operator ID isnotnecessarytoentertheoperation.AnoperatorIDcancontainupto4characters.
16.6.4 Date/TimeThe Logbooks and trend graphs use the clock/calendar as a reference. The current date and time is set here. The time display format can be selected from among three types.
16.6.5 CommunicationIn“Communication,”selectthecommunicationsettingfromamongNone,HART,andPH201G.The burn down current value is 3.6 mA.
NOTETomakethechangeof“Communication”valid,turnoffthepowersupplyonce,andreboot.
Inthecaseof“None,”thereisnottheproblemevenifyoudonotchangeitas“HART”ofdefaultvalue.

<16. COMMISSIONING OF SENCOM pH/ORP> 16-15
IM 12A01A02-01E 9th Edition : Mar. 23, 2018-00
n HARTSelectthismenuwhenHARTcommunication(HART5)ismade.IntheHARTsetupscreen,specifythenetworkaddressandsetupparametersforSV,TV,andFV.(PVislinkedwiththe“processparameter”settingin“Outputsettings”andcannotbechangedhere.)
l Network addressFor 1-to-1 communication, leave the default value [0] unchanged. For multi-drop where multiple HARTdevicesareconnectedonabus,setaddressesin1to15.Inthiscase,themAoutputwillbefixedto4mA.
l PVPVisaparameterselectedforanalogoutput;itcannotbechangedhere.
l SV, TV, FVTheSV,TV,andFVparametersareitemsthattheusermustsetup.Selectableitemsdifferdepending on the sensor type in “Sensor setup” and settings in “Measurement setup.”If blank is selected for a parameter, items below that parameter must all be set to blank. If an item is blank, those below it cannot be set to a status other than blank.
FormoreinformationonHARTcommunication,seetheTechnicalInformation(TI12A01A02-60E) in the attached CD-ROM.
n PH201GSelectthismenuifthePH201Gdistributorisconnectedtotheinstrument.InthePH201Gsetupscreen,makesettingsfor“Holdcontact,”“Failcontact,”and“Washcontact.”
l Hold contactSelect Disabled or Enabled.Whenthisitemisenabled,theoutputwillbeheldaccordingtothesettingof“Holdtype”ontheHoldsetupscreen.
l Fail contactSelect a status from among “Fail + Warn,” “Fail only,” and “Disabled.”Thissettingdependsontheerrorconfiguration.See“16.4Errorconfiguration.”“Fail” corresponds to “Fault.”
l Wash contactSelect Disabled or Enabled.When this item is enabled, items for a wash can be set on the Wash settings screen.In the Wash settings screen, set the interval time, wash time, and recovery time and setup of various washes.
Interval time: Set the wash interval in hours.
16
SENCOM

<16. COMMISSIONING OF SENCOM pH/ORP> 16-16
IM 12A01A02-01E 9th Edition : Mar. 23, 2018-00
Wash time/measure time: Set the wash time in minutes. In a continuous wash, wash time is replaced by measure time.
Recovery time: Set the recovery time in minutes.Manual wash: Select “Disabled” or “Enabled.” When this item is enabled, a wash cycle can be activated manually. On the
Calibration/Wash screen, press the “Start manual wash cycle” to perform a manual wash.
Imp2 wash: Select “Disabled” or “Enabled.” When this item is enabled, a wash cycle can be started if the “Impedance 2
too high” error occurs with respect to the reference electrode.Continuous wash: Select “Disabled” or “Enabled.” A continuous wash cycle is started at the instant when this item is enabled. In a continuous wash, the “Measure time” and “Interval time” are reversed
(seeFigure16.4).
Tw Tr
Tint
Tw Tr
Tint
Tw Tr
Tint Tint
Tw’ Tw TrTw’
F050605_2.ai
Tint: Interval timeTw: Wash timeTr: Recovery time
Tint: Interval timeTw: Measure timeTw’: Wash timeTr: Recovery time
When a continuous wash is disabled
When a continuous wash is enabled
Figure 16.4
The instrument has a function for checking whether measurements are normally made after wash, allowing you to check a sensor response.The wash recovery check is performed by making use of the time to recover half the wash-cycle pHchange.Thehalfthewash-cyclepHchangerecoverytimereplacestherelaxationtimebytherecovery time.WhethertoconductthewashrecoverycheckcanbesetontheErrorsettings2/3screen.Halfthewash-cyclepHchangereferstohalfthevalue(1/2∆pH)ofthedifference(∆pH)betweenthepHvalueduringnormalmeasurementofanexampleinFigure16.5andthepHvaluedetectedduringwash.IfthepHvalueduringwashisgreaterthan1/2∆pHwhen1/3tRhaselapsed,theelectrodeisassumedtobegood.Ifitissmallerthan1/2∆pH,thentheelectrodeisassumedtobebad.However,forapplicationswherethepHduringwashshowsalmostthesamevalueasthenormalpH,thedifferencewillbeapproximatelyzero.Insuchacase,disablethewashrecoverycheck.AnexampleofsuchapplicationsisthemonitoringofwastewaterpH.Ifyouselectwaterjetcleaninginsuchacase,thenormalpHaswellasthewashingtimepHwillbearoundpH7;thedifferencewillbeapproximatelyzero,sotherecoverytimecheckwillnotworknormally.This function is available either for ORP measurement only.
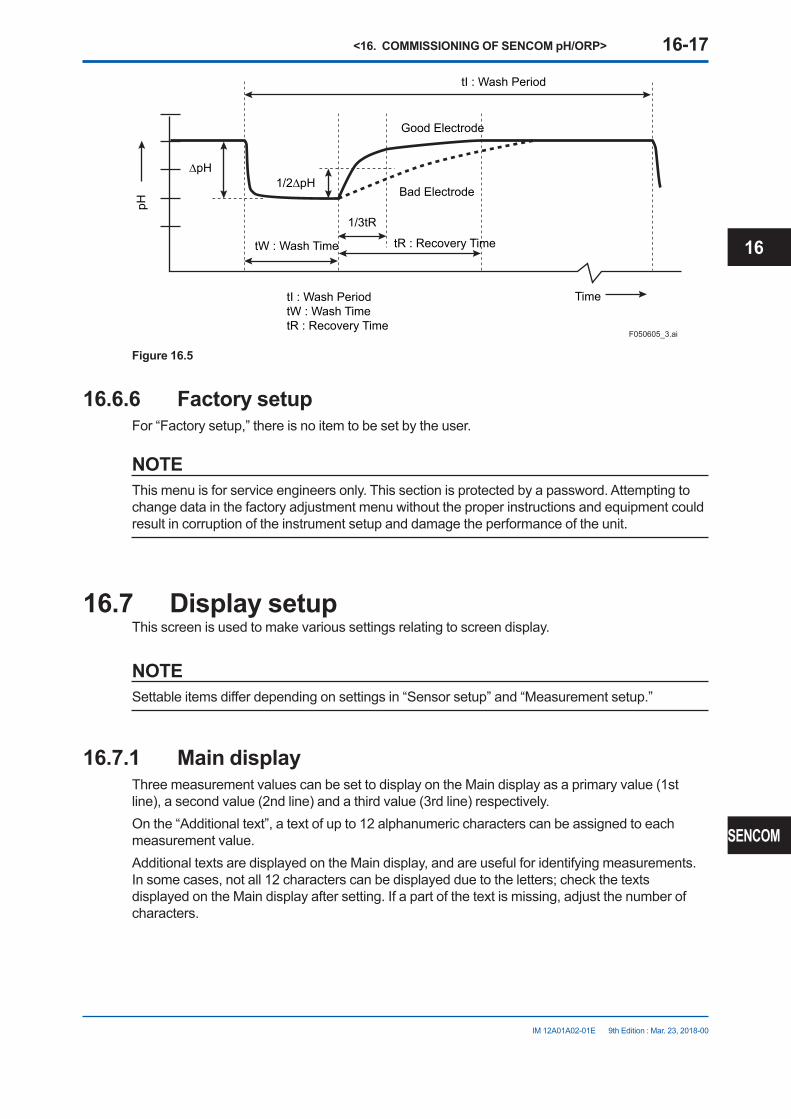
<16. COMMISSIONING OF SENCOM pH/ORP> 16-17
IM 12A01A02-01E 9th Edition : Mar. 23, 2018-00
pH
Time
Good Electrode
Bad Electrode
tR : Recovery TimetW : Wash Time
tI : Wash Period
1/2∆pH∆pH
1/3tR
tI : Wash Period tW : Wash TimetR : Recovery Time
F050605_3.ai
Figure 16.5
16.6.6 Factory setupFor “Factory setup,” there is no item to be set by the user.
NOTEThis menu is for service engineers only. This section is protected by a password. Attempting to change data in the factory adjustment menu without the proper instructions and equipment could result in corruption of the instrument setup and damage the performance of the unit.
16.7 Display setupThis screen is used to make various settings relating to screen display.
NOTESettableitemsdifferdependingonsettingsin“Sensorsetup”and“Measurementsetup.”
16.7.1 Main displayThree measurement values can be set to display on the Main display as a primary value (1st line), a second value (2nd line) and a third value (3rd line) respectively.On the “Additional text”, a text of up to 12 alphanumeric characters can be assigned to each measurement value.Additional texts are displayed on the Main display, and are useful for identifying measurements. Insomecases,notall12characterscanbedisplayedduetotheletters;checkthetextsdisplayed on the Main display after setting. If a part of the text is missing, adjust the number of characters.
16
SENCOM

<16. COMMISSIONING OF SENCOM pH/ORP> 16-18
IM 12A01A02-01E 9th Edition : Mar. 23, 2018-00
16.7.2 TrendThis screen is used to make settings for the Trend Graph Screen.Set the process parameters to be displayed for each trend. They can be set for the 1st to 3rd trends. When all three process parameters are set “Empty”, there is no trend display (no trend button).
l X-axis: TimingSelect the X-axis timing’s time span on the trend graph display from a list.
l Y-axis: LimitsSet the Y-axis high and low limits on the trend graph display on a Trend screen basis.
NOTEUpdating the trend display setup resets the current trend graph and starts a new one.
16.7.3 Auto ReturnWhen no operation is performed for the time set in “Auto Return”, the display returns to the Monitor display (or to the Main display when the MONITOR display is disabled) and the analyzer returns to a normal measuring mode. (When the Trend display is selected, the Auto Return doesn’t work.)Select the time from among Disable, 10 min, and 60 min. When the Auto Return function is not used, select “Disable.”
NOTEA default is “10 min”. When maintenance like a calibration that may take much time is performed, “60 min” or “Disable” is recommended to be selected.
16.7.4 Adjust contrastThe LCD screen contrast can be adjusted.Pressingthekeysadjuststhecontrastin11levelsfrom+5to–5(includingthedefaultvalueof “0”).
16.7.5 MONITOR displaySelect “Enable” so that the Monitor display becomes available. A default is “Enable”.DuringHold/Washconditionandawarning/faultcondition,theMaindisplayisdisplayedtoindicate the condition.

<17. CALIBRATION OF SENCOM pH/ORP> 17-1
IM 12A01A02-01E 9th Edition : Mar. 23, 2018-00
17. CALIBRATION OF SENCOM pH/ORPThe FLXA202/FLXA21 checks the status of sensors including the connection.While an error is issued, calibration cannot be performed.
NOTEDo not disconnect the sensor during calibration.
BeforepHmeasurement,calibratethepHsensorwiththestandardsolution.Before ORP measurement, check the electrode as a part of regular maintenance.
NOTEA default is “10 min” for “Auto Return”. When maintenance like a calibration that may take much time is performed, “60 min” or “Disable” is recommended to be selected. (Refer to the section 16.7.3.)
CalibrationExecute: Calibration HOLD
Setup: Commissioning Change language Start Quick Setup
Execute & Setup Calibration pH pH ORP Temperature
Manual Automatic Sample Temperature calibration
or
Only when “pH + ORP” is selected on the Sensor setup screen
Figure 17.1 Calibration
ThecalibrationitemsincludepH,ORP,rH,andTemperature.The item to be calibrated is determined according to the settings made in the Sensor setup and Measurement setup in Commissioning.
Press toselectExecute:Calibration,choosetheitemtobecalibrated,configurethecalibration settings, then perform calibration.
NOTENotethefollowingwhenperformingcalibrationwithbuffersolutions.1. Before starting a calibration, make sure the electrode system is properly cleaned and
the electrodes are fully functional. They must then be rinsed with clean water to avoid contamination of the calibration solution(s).
2. Alwaysusefreshbuffersolutiontoavoidtheriskofintroducingerrorsfromcontaminatedoroldsolutions.Bufferssuppliedasliquidshavealimitedshelflife,especiallyalkalinebuffers,which absorb CO2 from the air.
3. YokogawastronglyrecommendsNIST/DIN19266bufferstandardsforthebestaccuracyandbuffercapacity.Commerciallyadjustedbuffers(e.g.,pH7.00,9.00or10.00)areacompromise as a standard, and are often supplied without a temperature dependency curve. Their stability will never be as good as NIST (JIS equivalent) solutions.
Alwaysensurethatthesensorsareproperlyconditioned,cleanandfilledwiththecorrectelectrolyte solution (if appropriate) before starting a calibration. Refer to the sensor instructions for details.
17
SENCOM
<17. CALIBRATION OF SENCOM pH/ORP> 17-2
IM 12A01A02-01E 9th Edition : Mar. 23, 2018-00
17.1 pH calibrationTherearetheManual,Automatic,andSamplemodesofpHcalibration.
17.1.1 Manual calibrationTheunitisadjustedtomatchthevalueofthebufferstandardsoraprocesssolutionwithaknownpHvalue(buffersolution).TheuserdeterminesthepHvalue,temperatureinfluence,andstability.Select the calibration type from among [zero/slope], [zero/slope/ITP(3point)], and [zero/slope1,2 (3point)].
Calibrationisperformedstepwise;followthepromptsdisplayedonthescreen.A stability check is conducted at each measurement point. Proceed to the next step only after the reading has stabilized.Atcalibration,weadviseleavingthesensorsforthreetofiveminutesinthebuffersolutionbeforeproceeding to the next step even when the reading has stabilized. This will give reliable and accurate calibration results.
NOTEWhen a sensor or an electrode is exchanged or replaced, sensor wellness data should be reset.When a sensor is replaced, the replacement can be recorded manually into a logbook. (Refer to thefigure15.11.)
l zero/slopeThis calibration type is one-point or two-point calibration.One-point calibration performs the zero adjustment only. Two-point calibration performs the zero and slope adjustments.
l zero/slope/ITP(3point)This calibration type is ITP-type three-point calibration.IfITPdoesnothavepH7,three-pointcalibrationisperformedtoobtainthezero(asymmetry),slope (sensitivity), and ITP (isothermal point) for calibration.
Limitations• ThreedifferentbuffersolutionswhosedifferenceinpHvaluebetweenbuffersolutionsis1
pHormoreshouldbeused. (1stbuffer<2ndbuffer<3rdbufferor1stbuffer>2ndbuffer>3rdbuffer)• The2ndbuffersolutionshouldbepH7±2.• Thetemperaturedifferencebetweenthe2ndand3rdbuffersolutionsshouldbe5ºCorless.
Thetemperaturesofthe2ndand3rdbuffersolutionsshouldbeatleast20ºChigherorlowerthanthetemperatureofthe1stbuffersolution.
• TocalculatethepHvalueofthe3rdbuffersolution(pH3cal),insertthepHandtemperaturevaluesofthe1stand2ndbuffersolutionsandthetemperaturevalueofthe3rdbuffersolution into the following equation.
<17. CALIBRATION OF SENCOM pH/ORP> 17-3
IM 12A01A02-01E 9th Edition : Mar. 23, 2018-00
pH3cal = ITP - (273.15 + t2)(ITP - pH2) + (1 - ) x (273.15 + t1)(ITP - pH1)
(273.15 + t3)
t3 - t1t2 - t1
( )t3 - t1t2 - t1
pHn: pHvalueofn-thbuffersolution Tn: Temperatureofn-thbuffersolution(ºC) ITP: ITPvaluedisplayedincalibrationsettings(seesection16.2.4)
Assign7.00astheITPvaluewhenaspecificvalueisnotavailableorforthefirst calibration of a sensor.
Donotusethe3rdsolutionwhosepHvalueiswithinpH3cal±1.
l zero/slope1,2(3point)This calibration type is the line-segment type three-point calibration.IftherelationbetweenelectromotiveforceandpHisnotinproportionforawiderange,dividetherelevant range into two sections and obtain the zero (asymmetry) and slope (sensitivity) in each section to perform calibration.
Limitations• ThreedifferentbuffersolutionswhosedifferenceinpHvaluebetweenbuffersolutionsis1
pHormoreshouldbeused. (1stbuffer<2ndbuffer<3rdbufferor1stbuffer>2ndbuffer>3rdbuffer)• Thetemperaturedifferencebetweenthe1stand2ndbuffersolutionsshouldbe20ºCor
less.• Thetemperaturedifferencebetweenthe2ndand3rdbuffersolutionsshouldbe20ºCor
less.
17.1.2 Automatic calibrationCalibration can easily be performed by following the calibration menus.Pre-selectthebuffersolutiontobeusedfromamongNIST/DIN19266,DIN19267,US,andUserdefinedbufferinCommissioning→Measurementsetup→Calibrationsettings→pHsettings→Buffers(selectset).SeealsoAppendixtable1.IfyouselectUserdefinedbuffer,calibrationisperformedbasedontheconditionsregisteredinbuffertables1to3.Useoftheproperbuffertableallowsthesystemtoperformreliablecalibration.InthesamewayasmanualpHcalibration,selectthecalibrationtypefromamong[zero/slope], [zero/slope/ITP(3point)], and [zero/slope1,2(3point)].
Calibrationisperformedstepwise;followthepromptsdisplayedonthescreen.A stability check is conducted at each measurement point. Proceed to the next step only after the reading has stabilized.
NOTEWhen a sensor or an electrode is exchanged or replaced, sensor wellness data should be reset.When a sensor is replaced, the replacement can be recorded manually into a logbook. (Refer to thefigure15.11.)
17
SENCOM
<17. CALIBRATION OF SENCOM pH/ORP> 17-4
IM 12A01A02-01E 9th Edition : Mar. 23, 2018-00
l zero/slopeSelectthesolutionthatworkswiththe“buffersolution”selectedincalibrationsettingsandperform calibration by following the prompts on the screen.
l zero/slope/ITP(3point)Calibration is performed in the sequence of the sequence selection menu (Table 17.1) of the solutionthatworkswiththe“buffersolution”selectedincalibrationsettings.Performcalibrationby following the prompts on the screen.
Limitations• ThreedifferentbuffersolutionswhosedifferenceinpHvaluebetweenbuffersolutionsis1
pHormoreshouldbeused. (1stbuffer<2ndbuffer<3rdbufferor1stbuffer>2ndbuffer>3rdbuffer)• The2ndbuffersolutioninthebuffertableintheFreeprogrammablescreenshouldbepH7
±2(at25ºC).• Either of the following conditions should be met.-Thetemperaturedifferencebetweenthe1stand2ndbuffersolutionsshouldbe5ºCorless.Thetemperatureofthe1stand2ndbuffersolutionsisatleast20ºChigherorlowerthanthetemperatureofthe3rdbuffersolution.-Thetemperaturedifferencebetweenthe2ndand3rdbuffersolutionsshouldbe5ºCorless.Thetemperatureofthe2ndand3rdbuffersolutionsisatleast20ºChigherorlowerthanthetemperatureofthe1stbuffersolution.
l zero/slope1,2(3point)Calibration is performed in the sequence of the sequence selection menu (Table 17.1) of the solutionthatworkswiththe“buffersolution”selectedincalibrationsettings.Performcalibrationby following the prompts on the screen.
Limitations• ThreedifferentbuffersolutionswhosedifferenceinpHvaluebetweenbuffersolutionsis1
pHormoreshouldbeused. (1stbuffer<2ndbuffer<3rdbufferor1stbuffer>2ndbuffer>3rdbuffer)• Thetemperaturedifferencebetweenthe1stand2ndbuffersolutionsshouldbe20ºCor
less.• Thetemperaturedifferencebetweenthe2ndand3rdbuffersolutionsshouldbe20ºCor
less.
Table 17.1 Selection of Buffer Solutions in Three-point Calibration
Buffer settings Buffer sequence selection menus NIST/DIN 19266 PH1.7→PH6.9→PH9.2
PH4.0→PH6.9→PH9.2PH9.2→PH6.9→PH1.7PH9.2→PH6.9→PH4.0
DIN 19267 PH4.7→PH6.8→PH9.2PH9.2→PH6.8→PH4.7
US PH4.0→PH7.0→PH10.0PH10.0→PH7.0→PH4.0
Userdefinedbuffer table1→table2→table3able3→table2→table1
<17. CALIBRATION OF SENCOM pH/ORP> 17-5
IM 12A01A02-01E 9th Edition : Mar. 23, 2018-00
17.1.3 Sample calibrationA sample calibration is a single-point calibration for only the zero (asymmetric). It adjusts the recorded reading to a collected sample value. Press [Take Sample] to record a collected sample value in memory. Re-enter the Sample Cal. screen and press [Start calibration] to perform a sample calibration. This updates the recorded data.
NOTEWhen a sensor or an electrode is exchanged or replaced, sensor wellness data should be reset.When a sensor is replaced, the replacement can be recorded manually into a logbook. (Refer to thefigure15.11.)
17.2 Temperature calibrationFor the most accurate measurements, it is important to have a precise temperature measurement. Measure the temperature with a high-precision thermometer and adjust the sensor reading accordingly. For best accuracy, this should be done as near to the normal operating temperature as possible.
17.3 ORP calibration (rH calibration)ThecalibrationmodesforORPorrHare“Manual”and“Sample”.NoautomaticcalibrationfeatureisavailableinanORPorrHcalibration.
Calibration is performed stepwise. Follow the prompts displayed on the screen.A stability check is made at each measurement point. Proceed to the next step only after the reading has stabilized.
NOTEWhen a sensor or an electrode is exchanged or replaced, sensor wellness data should be reset.When a sensor is replaced, the replacement can be recorded manually into a logbook. (Refer to thefigure15.11.)
17
SENCOM

<17. CALIBRATION OF SENCOM pH/ORP> 17-6
IM 12A01A02-01E 9th Edition : Mar. 23, 2018-00
17.4 HOLDThe FLXA202/FLXA21 has a function to hold the mA output at a preset value (default: “Last”).Use this menu to hold the output.
For the settings, see “nConfigureHold”onpage16-11.During commissioning or quick setup, the output is automatically held.Setting“HoldduringCalibration/Wash”to“Disabled”deactivatestheholdfunctionduringcalibration or washing.
Press toselectExecute:HOLDandthenchooseManualHoldONorManualHoldOFF.This allows you to set up manual hold.
10.38Tag:SENCOM
25.0
4mA 20mAPH1
°CpH
HOLD
Figure 17.2 Example of the display with the manual hold enabled
To cancel manual hold, press the lit HOLD section on the Main display.
<18. MAINTENANCE> 18-1
IM 12A01A02-01E 9th Edition : Mar. 23, 2018-00
18. MAINTENANCEn Periodic maintenance
The FLXA202/FLXA21 requires very little periodic maintenance, except to make sure the front window is kept clean in order to permit a clear view of the display and allow proper operation of the touchscreen. If the window becomes soiled, clean it using a soft damp cloth or soft tissue.To deal with more stubborn stains, a neutral detergent may be used.When you must open the front cover and/or glands, make sure that the seals are clean and correctlyfittedwhentheunitisre-assembledinordertomaintainthehousing’sweatherproofintegrity against water and water vapor.
ThepHmeasurementuseshighimpedancesensorsandmayotherwisebepronetoproblemscaused by exposure of the circuitry to condensation.
CAUTIONNever use harsh chemicals or solvents. In the event that the window does become heavily stained or scratched, refer to the parts list for replacement part numbers.
l BatteryThe FLXA202/FLXA21 has a logbook feature that uses a clock to provide the timings. The instrument contains a lithium cell (battery) to continue the clock function while the power is turned off.Althoughthecellhasanexpectedworkinglifeof10years,thisisnotguaranteed.Whenthiscell needs replacing, contact your nearest Yokogawa service center.
n Periodic maintenance of the sensorPlease follow the manual of each sensor about the maintenance of the sensor.
l Predictive maintenanceThe FLXA202/FLXA21 has a unique prediction function (wellness check).By making settings concerning the sensor wellness check, you can grap the condition of the sensor in the gauge display in the Detail screen and carry out predictive maintenance.Seesection4.2.7,7.1.7,10.1.7,13.2.7,or16.2.7,Sensordiag.settings.
PH
SC
ISC
DO
SENCOM
18

Blank Page
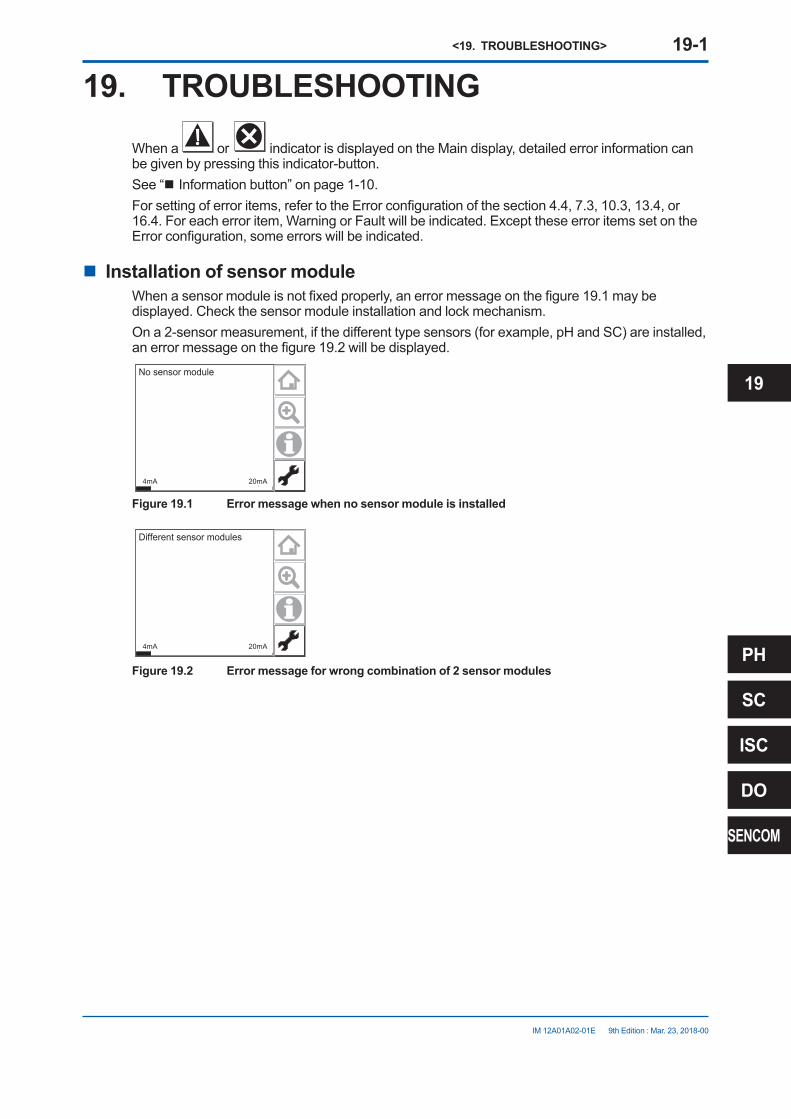
<19. TROUBLESHOOTING> 19-1
IM 12A01A02-01E 9th Edition : Mar. 23, 2018-00
19. TROUBLESHOOTINGWhen a or indicator is displayed on the Main display, detailed error information can be given by pressing this indicator-button.See “n Information button” on page 1-10.Forsettingoferroritems,refertotheErrorconfigurationofthesection4.4,7.3,10.3,13.4,or16.4.Foreacherroritem,WarningorFaultwillbeindicated.ExcepttheseerroritemssetontheErrorconfiguration,someerrorswillbeindicated.
n Installation of sensor moduleWhenasensormoduleisnotfixedproperly,anerrormessageonthefigure19.1maybedisplayed. Check the sensor module installation and lock mechanism.Ona2-sensormeasurement,ifthedifferenttypesensors(forexample,pHandSC)areinstalled,anerrormessageonthefigure19.2willbedisplayed.
No sensor module
4mA 20mA
Figure 19.1 Error message when no sensor module is installed
Different sensor modules
4mA 20mA
Figure 19.2 Error message for wrong combination of 2 sensor modulesPH
SC
ISC
DO
SENCOM
19

<19. TROUBLESHOOTING> 19-2
IM 12A01A02-01E 9th Edition : Mar. 23, 2018-00
n FLXA21 Replacement of ModulesOnly authorized person of Yokogawa is allowed to replace modules.Be sure to keep the replacement procedure below.
CAUTIONTurnoffthepowersupplytotheanalyzerbeforereplacementofmodules.
Lock UnlockFigure 19.3 Locking the module
Donotholdtheupperfinepartwhenpullingoutthemodule.First, unlock the module by releasing the lock mechanism on the left and right of the module.Useaslotted(flathead)screwdrivertopull-outthemodule.Beforepull-outthemodule,looseaterminal screw to hook a screwdriver.
Figure 19.4 Pull-out the module
After replacement of modules, wire the sensor.
NOTEWhenthewiringofsensorsisfinished,besuretoattachthewiringcovers.Furthermore,makesure the module is locked with the mechanisms on the left and right of the module.
NOTEConfirmthatalllocking-tabs(includingforBLANKslots)are“Locked”positionwhenclosethefront panel.If locking-tabs are “Unlock” position, the front panel may be interfered with locking-tabs.
<19. TROUBLESHOOTING> 19-3
IM 12A01A02-01E 9th Edition : Mar. 23, 2018-00
l Checking nameplates of safety markingIncaseofIntrinsicsafetytypeortype”n”ornonincendivemodel,confirmthenameplateonthehousing assembly and the sensor module. See “n Mark position of explosion protected type” on page v.
CAUTIONIntrinsicsafetytypeortypenornonincendivehousingassembly/sensormodulearecertifiedindependently.So they must be combined appropriately.
CAUTIONDon’t use General Purpose housing assembly / sensor module as Intrinsic safety type module.
PH
SC
ISC
DO
SENCOM
19

Blank Page
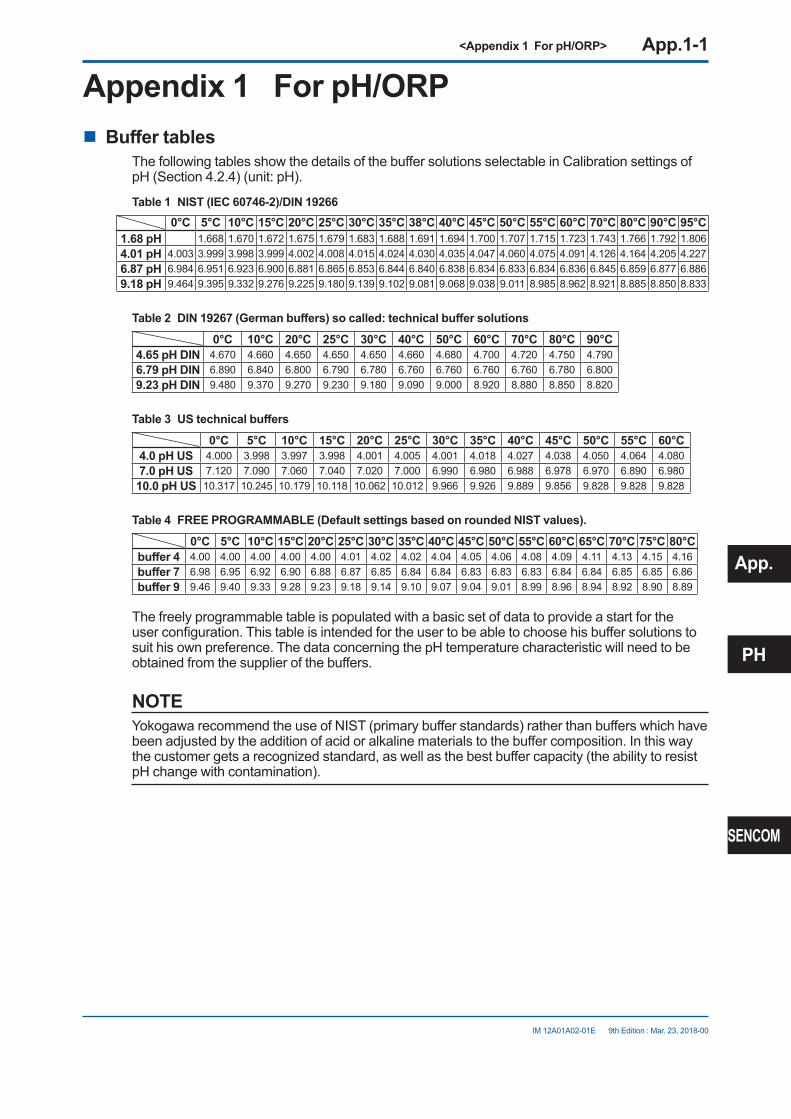
<Appendix 1 For pH/ORP> App.1-1
IM 12A01A02-01E 9th Edition : Mar. 23, 2018-00
Appendix 1 For pH/ORPn Buffer tables
ThefollowingtablesshowthedetailsofthebuffersolutionsselectableinCalibrationsettingsofpH(Section4.2.4)(unit:pH).
Table 1 NIST (IEC 60746-2)/DIN 192660°C 5°C 10°C 15°C 20°C 25°C 30°C 35°C 38°C 40°C 45°C 50°C 55°C 60°C 70°C 80°C 90°C 95°C
1.68 pH 1.668 1.670 1.672 1.675 1.679 1.683 1.688 1.691 1.694 1.700 1.707 1.715 1.723 1.743 1.766 1.792 1.8064.01 pH 4.003 3.999 3.998 3.999 4.002 4.008 4.015 4.024 4.030 4.035 4.047 4.060 4.075 4.091 4.126 4.164 4.205 4.2276.87 pH 6.984 6.951 6.923 6.900 6.881 6.865 6.853 6.844 6.840 6.838 6.834 6.833 6.834 6.836 6.845 6.859 6.877 6.8869.18 pH 9.464 9.395 9.332 9.276 9.225 9.180 9.139 9.102 9.081 9.068 9.038 9.011 8.985 8.962 8.921 8.885 8.850 8.833
Table 2 DIN 19267 (German buffers) so called: technical buffer solutions0°C 10°C 20°C 25°C 30°C 40°C 50°C 60°C 70°C 80°C 90°C
4.65 pH DIN 4.670 4.660 4.650 4.650 4.650 4.660 4.680 4.700 4.720 4.750 4.7906.79 pH DIN 6.890 6.840 6.800 6.790 6.780 6.760 6.760 6.760 6.760 6.780 6.8009.23 pH DIN 9.480 9.370 9.270 9.230 9.180 9.090 9.000 8.920 8.880 8.850 8.820
Table 3 US technical buffers0°C 5°C 10°C 15°C 20°C 25°C 30°C 35°C 40°C 45°C 50°C 55°C 60°C
4.0 pH US 4.000 3.998 3.997 3.998 4.001 4.005 4.001 4.018 4.027 4.038 4.050 4.064 4.0807.0 pH US 7.120 7.090 7.060 7.040 7.020 7.000 6.990 6.980 6.988 6.978 6.970 6.890 6.98010.0 pH US 10.317 10.245 10.179 10.118 10.062 10.012 9.966 9.926 9.889 9.856 9.828 9.828 9.828
Table 4 FREE PROGRAMMABLE (Default settings based on rounded NIST values).0°C 5°C 10°C 15°C 20°C 25°C 30°C 35°C 40°C 45°C 50°C 55°C 60°C 65°C 70°C 75°C 80°C
buffer 4 4.00 4.00 4.00 4.00 4.00 4.01 4.02 4.02 4.04 4.05 4.06 4.08 4.09 4.11 4.13 4.15 4.16buffer 7 6.98 6.95 6.92 6.90 6.88 6.87 6.85 6.84 6.84 6.83 6.83 6.83 6.84 6.84 6.85 6.85 6.86buffer 9 9.46 9.40 9.33 9.28 9.23 9.18 9.14 9.10 9.07 9.04 9.01 8.99 8.96 8.94 8.92 8.90 8.89
The freely programmable table is populated with a basic set of data to provide a start for the userconfiguration.Thistableisintendedfortheusertobeabletochoosehisbuffersolutionstosuithisownpreference.ThedataconcerningthepHtemperaturecharacteristicwillneedtobeobtainedfromthesupplierofthebuffers.
NOTEYokogawarecommendtheuseofNIST(primarybufferstandards)ratherthanbufferswhichhavebeenadjustedbytheadditionofacidoralkalinematerialstothebuffercomposition.Inthiswaythecustomergetsarecognizedstandard,aswellasthebestbuffercapacity(theabilitytoresistpHchangewithcontamination).
App.
PH
SENCOM

<Appendix 1 For pH/ORP> App.1-2
IM 12A01A02-01E 9th Edition : Mar. 23, 2018-00
n Matrix temperature compensationTable 5 shows the defaults for the matrix temperature compensation selectable in Temperature compensation(Section4.2.3).
Table 5 Defaults for the matrix temperature compensation (Reference temperature (Tref.): 25.0°C)Temp. range Solution 1
(Min.)Solution 2 Solution 3 Solution 4 Solution 5
(Max.)Tref. (25.0°C) 6.40pH 7.00pH 7.30pH 7.60pH 9.00pH
Tmin. (T1) 5.0°C 6.42pH 7.38pH 7.94pH 8.31pH 9.74pHT2 25.0°C 6.40pH 7.00pH 7.30pH 7.60pH 9.00pHT3 45.0°C 6.34pH 6.70pH 6.86pH 7.06pH 8.40pHT4 65.0°C 6.23pH 6.45pH 6.54pH 6.67pH 7.91pH
Tmax. (T5) 85.0°C 6.11pH 6.25pH 6.31pH 6.40pH 7.51pH
l User settingDelete the matrix and then enter new values as shown in Table 6. Gray areas are mandatory. Other areas can be omitted.
Table 6 Example of user setting (Reference temperature (Tref.): 25.0°C)Temp. range Solution 1
(Min.)Solution 2 Solution 3 Solution 4 Solution 5
(Max.)Tref. (25.0°C) 6.40pH 7.00pH 7.30pH 7.60pH 9.00pH
Tmin. (T1) 5.0°C 6.42pH 7.38pH 7.94pH 8.31pH 9.74pHT2 25.0°C 6.40pH 7.00pH 7.30pH 7.60pH 9.00pHT3 45.0°C 6.34pH 6.70pH 6.86pH 7.06pH 8.40pHT4 65.0°C 6.23pH 6.45pH 6.54pH 6.67pH 7.91pH
Tmax. (T5) 85.0°C 6.11pH 6.25pH 6.31pH 6.40pH 7.51pHNote: The gray areas must be entered.
The reference temperature is set in the Temperature Compensation menu (default: 25.0°C).
Input temperatures for compensation in the Temp. ranges menu.InputvaluesfromSolution1(lowpH)toSolution5(highpH).
After entering all values, select “Check values?” to verify that there is no error. This function checks if the matrix is consistently incremental or decremental. If any error is found, its location is specified.When there is no error, the matrix is compensated linearly and the blanks of the table (if any) are filled.Ifsomeareasareleftemptywithoutrunning“Checkvalues?”,a1st/2ndcomp.matrixerrorwill be issued.
n Changing the settingsIf any setting is accidentally changed, values to the right of the relevant arrow in Table 7 are all initialized.
Table 7 Parameters that initialize other values
Sensor type -> Measurement -> Output: Process parameter ->
Linear:0%value,100%valueTableCommunication:HART:PV
Display setup: Individual display (Main display)Trend Graph Screen -> Y-axis (low, high)Communication:HART
Impedance settings

<Appendix 1 For pH/ORP> App.1-3
IM 12A01A02-01E 9th Edition : Mar. 23, 2018-00
n Checking ORP sensor electrodesThe normal functionality of the ORP sensor electrode is determined by measuring the ORP value of the solution with a known ORP value, and by checking if the value is within the tolerable range.To check the ORP sensor before regular operation, follow the procedure below.The electrode is checked in measurement mode.
l Solution for checkingUse solutions with a known ORP value, such as quinhydrone, ferrous, and other solutions.
l Checking procedure(1) Pour 50 to 100 ml of the solution into a clean 200-ml beaker.(2) Remove the ORP sensor from the holder. Flush the measurement solution remaining on the
sensorwithwaterandwipeoffthewater.Ifthedetectingpartandliquidoutletofthesensorare stained, clean them with water.
(3) Immerse the tip of the ORP sensor into the solution. Read the ORP value after the reading becomes stable (usually 5 to 10 minutes).
Measure the solution temperature and check if the ORP value at the temperature is in the tolerable range.
l Yokogawa’s checking solution and tolerable rangeYokogawaoffersthefollowingreagentsforchecking.Usethemasdescribedbelow. Quinhydrone(partnumber:K9024EC) Ferrous(partnumber:K9024ED)Quinhydrone solution
Put one bag of the reagent into a wide-mouthed jar (at least 250 ml) and pour deionized water into the jar to make a total solution volume of 250 ml. Cold deionized water may not dissolvethereagentcompletelyandthereagentmaypartlyfloatonthesurface,butthisdoes not cause any problem for measurement.
Ferrous solutionPut one bag of the reagent into a wide-mouthed jar (at least 250 mL) and pour 2 mol/l solution of sulfuric acid to make a total solution volume of 250 ml.Whenusingconcentratedsulfuricacid,firstpourapproximately150mlofpurewaterintoawide-mouthedjarthatcontainsthereagent.Add14mlofconcentratedsulfuricacidwhilestirring the solution. Add more pure water to further dissolve the reagent and make a total solution volume of 250 ml.
CAUTIONBe careful to touch the concentrated sulfuric acid.
Figure 1 shows the ORP values of the checking solutions prepared with Yokogawa’s reagents. If the measured ORP value is in the tolerable range, the electrode of the ORP sensor is working normally.If the ORP value is out of the range, calibrate the sensor. If the ORP value is slightly out of range, verify whether the checking solution has been properly prepared.
App.
PH
SENCOM
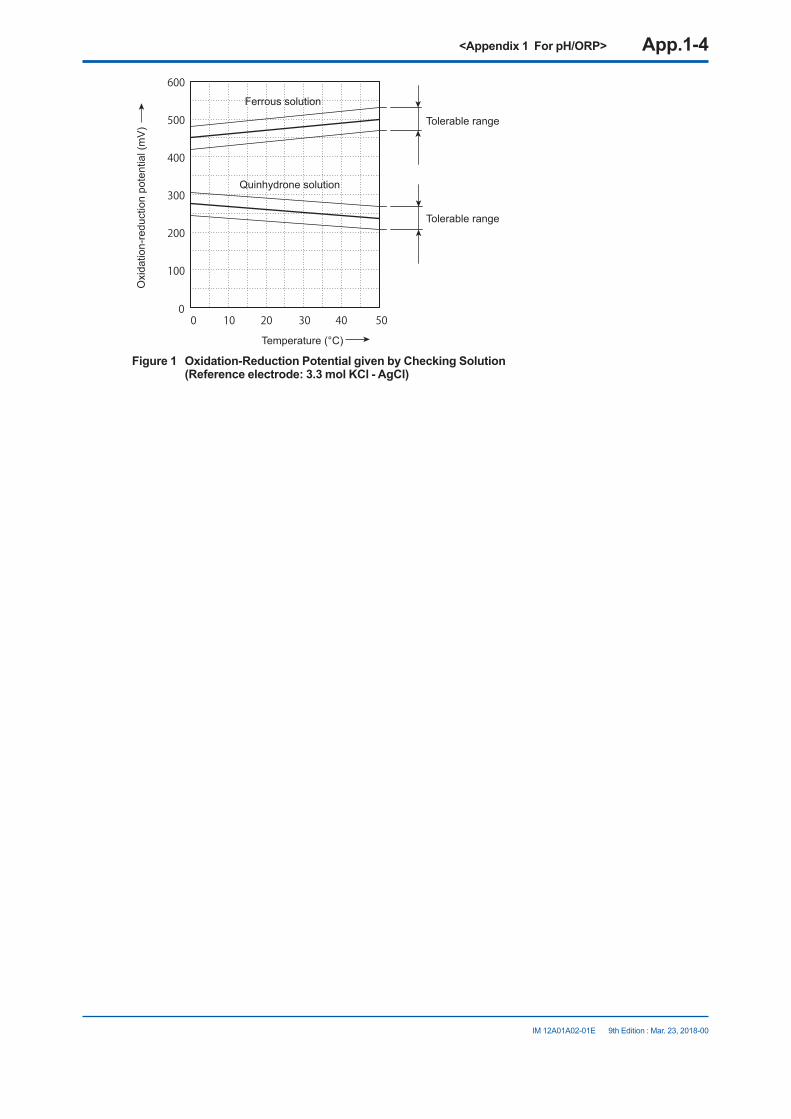
<Appendix 1 For pH/ORP> App.1-4
IM 12A01A02-01E 9th Edition : Mar. 23, 2018-00
0 10 20 30 40 500
100
200
300
400
500
600
Temperature (°C)
Oxi
datio
n-re
duct
ion
pote
ntia
l (m
V)
Ferrous solution
Quinhydrone solution
Tolerable range
Tolerable range
Figure 1 Oxidation-Reduction Potential given by Checking Solution (Reference electrode: 3.3 mol KCl - AgCl)
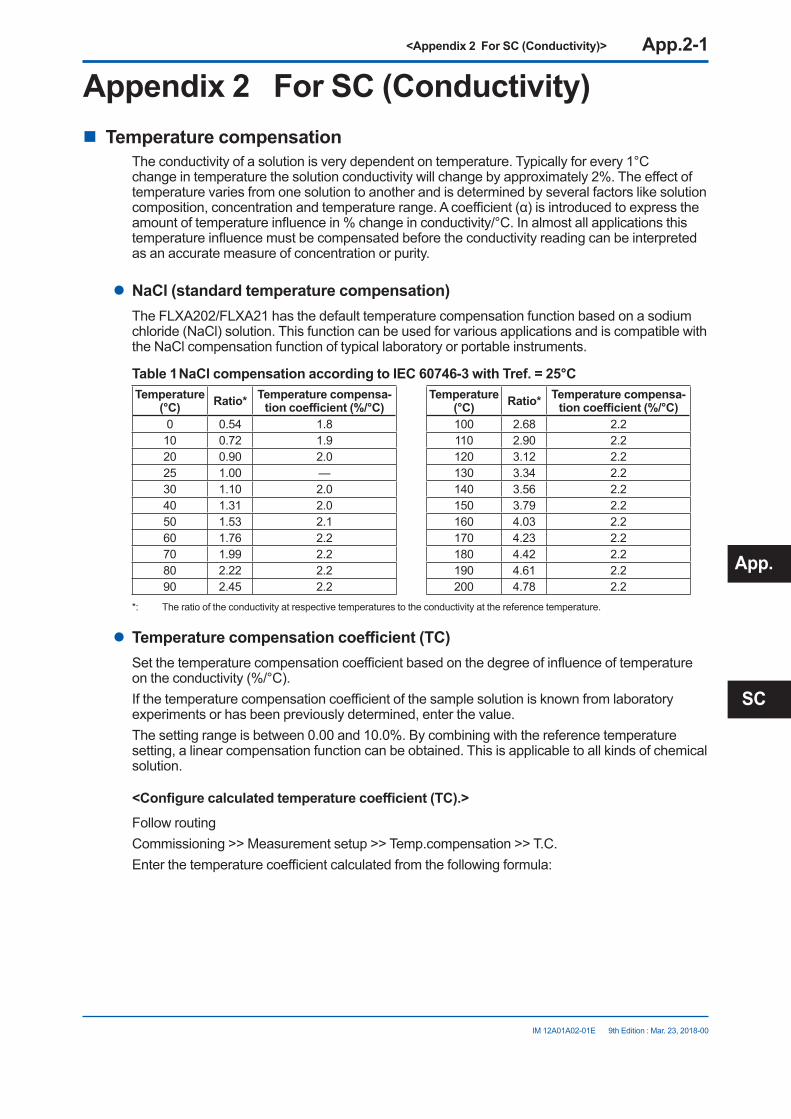
<Appendix 2 For SC (Conductivity)> App.2-1
IM 12A01A02-01E 9th Edition : Mar. 23, 2018-00
Appendix 2 For SC (Conductivity)n Temperature compensation
The conductivity of a solution is very dependent on temperature. Typically for every 1°C changeintemperaturethesolutionconductivitywillchangebyapproximately2%.Theeffectoftemperature varies from one solution to another and is determined by several factors like solution composition,concentrationandtemperaturerange.Acoefficient(α)isintroducedtoexpresstheamountoftemperatureinfluencein%changeinconductivity/°C.Inalmostallapplicationsthistemperatureinfluencemustbecompensatedbeforetheconductivityreadingcanbeinterpretedas an accurate measure of concentration or purity.
l NaCl (standard temperature compensation)The FLXA202/FLXA21 has the default temperature compensation function based on a sodium chloride (NaCl) solution. This function can be used for various applications and is compatible with the NaCl compensation function of typical laboratory or portable instruments.
Table 1 NaCl compensation according to IEC 60746-3 with Tref. = 25°CTemperature
(°C) Ratio* Temperature compensa-tion coefficient (%/°C)
Temperature (°C) Ratio* Temperature compensa-
tion coefficient (%/°C)0 0.54 1.8 100 2.68 2.210 0.72 1.9 110 2.90 2.220 0.90 2.0 120 3.12 2.225 1.00 — 130 3.34 2.230 1.10 2.0 140 3.56 2.240 1.31 2.0 150 3.79 2.250 1.53 2.1 160 4.03 2.260 1.76 2.2 170 4.23 2.270 1.99 2.2 180 4.42 2.280 2.22 2.2 190 4.61 2.290 2.45 2.2 200 4.78 2.2
*: The ratio of the conductivity at respective temperatures to the conductivity at the reference temperature.
l Temperature compensation coefficient (TC)Setthetemperaturecompensationcoefficientbasedonthedegreeofinfluenceoftemperatureontheconductivity(%/°C).Ifthetemperaturecompensationcoefficientofthesamplesolutionisknownfromlaboratoryexperiments or has been previously determined, enter the value.Thesettingrangeisbetween0.00and10.0%.Bycombiningwiththereferencetemperaturesetting, a linear compensation function can be obtained. This is applicable to all kinds of chemical solution.
<Configure calculated temperature coefficient (TC).>Follow routingCommissioning >> Measurement setup >> Temp.compensation >> T.C.Enterthetemperaturecoefficientcalculatedfromthefollowingformula:
App.
SC
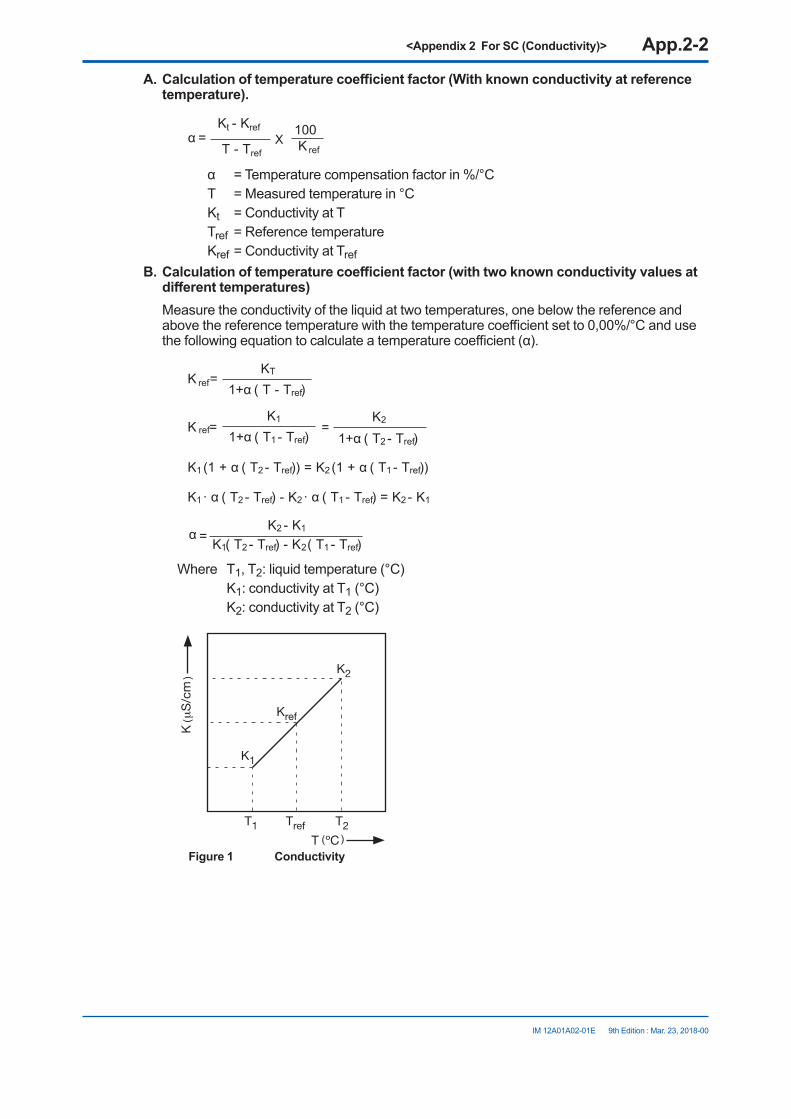
<Appendix 2 For SC (Conductivity)> App.2-2
IM 12A01A02-01E 9th Edition : Mar. 23, 2018-00
A. Calculation of temperature coefficient factor (With known conductivity at reference temperature).
Kt - Krefα =
T - Tref
100K ref
X
α =Temperaturecompensationfactorin%/°CT =Measuredtemperaturein°CKt =ConductivityatTTref =ReferencetemperatureKref=ConductivityatTref
B. Calculation of temperature coefficient factor (with two known conductivity values at different temperatures)
Measure the conductivity of the liquid at two temperatures, one below the reference and abovethereferencetemperaturewiththetemperaturecoefficientsetto0,00%/°Candusethefollowingequationtocalculateatemperaturecoefficient(α).
KTK ref= 1+α ( T - Tref)
K2 - K1α = K1( T2 - Tref) - K2( T1 - Tref)
K1 K2K ref= =1+α ( T1 - Tref) 1+α ( T2 - Tref)
K1 (1 + α ( T2 - Tref )) = K2 (1 + α ( T1 - Tref ))
K1 · α ( T2 - Tref ) - K2 · α ( T1 - Tref ) = K2 - K1
Where T1, T2: liquid temperature (°C) K1: conductivity at T1 (°C) K2: conductivity at T2 (°C)
( )
(
(
Figure 1 Conductivity

<Appendix 2 For SC (Conductivity)> App.2-3
IM 12A01A02-01E 9th Edition : Mar. 23, 2018-00
<Calculation example> Calculatethetemperaturecoefficientofaliquidfromthefollowingdata. Conductivity124.5µS/cmataliquidtemperatureof18.0°Candaconductivity147.6µS/cm
at a liquid temperature of 31.0 °C. Substituting the data in the above formula gives the following result.
147.6 - 124.5x 100= 1.298 %/°Cα =
124.5x(31.0 - 25) - 147.6x(18.0 - 25)
SetthetemperaturecoefficientintheFLXA202/FLXA21converter.
Whenthetemperaturecoefficientalreadysetisaccurate,theconductivitytobedisplayedmust be constant regardless of liquid temperature. The following check will make sure that the temperaturecoefficientalreadysetisaccurate.If, when the liquid temperature is lowered, a larger conductivity value is indicated, the temperaturecoefficientalreadysetistoosmall.Theoppositealsoapplies.Ifasmallerconductivityvalueisindicated,thetemperaturecoefficientalreadysetistoolarge.Ineithercase,changethetemperaturecoefficientsothattheconductivityno longer changes.
l MatrixMatrix means temperature compensation with the temperature compensation matrix.Thetemperaturecompensationmatrixisatableofconductivityvaluesatdifferenttemperaturesand concentrations.Ready-madematrixesanduser-definedmatrixesareavailable.
<Ready-made matrixes>Ready-made temperature compensation matrixes are available for common inorganic acids and bases. Those for ammonia and morpholine are also available.
Table 2 Ready-made temperature compensation matrixes
Select matrix Compound to be measured Concentration Temperature Details
Ammonia 0..50ppb Ammonia 0 to 50 ppb 0to90˚C Table AMorpholine 0..500ppb Morpholine 0 to 500 ppb 0to90˚C Table BAmmonia15..30% Ammonia 15to30% 10to50˚C Table CSulfunicacid0..27% H2SO4 0to27% -1.1to98.9˚C Table DSulfunicacid39..85% H2SO4 39to85% -17.8to115.6˚C Table ESulfunicacid93..100% H2SO4 93to100% 10to90˚C Table FNaOH0..15% NaOH 0to15% 0to100˚C Table GNaOH25..50% NaOH 25to50% 0to80˚C TableHHCl0..200ppb HCl 0 to 200 ppb 0to100˚C Table IHCl0..18% HCI 0to18.2% -10to65˚C Table JHCl24..44% HCI 23.7to43.8% -20to65˚C Table KHNO30..25% HNO3 0to24.80% 0to80˚C Table LHNO335..88% HNO3 35.0to87.7% -16to60˚C Table M
The ready-made temperature compensation matrixes are listed in Table A to M where temperatures are in the column and concentrations are in the rows.
App.
SC
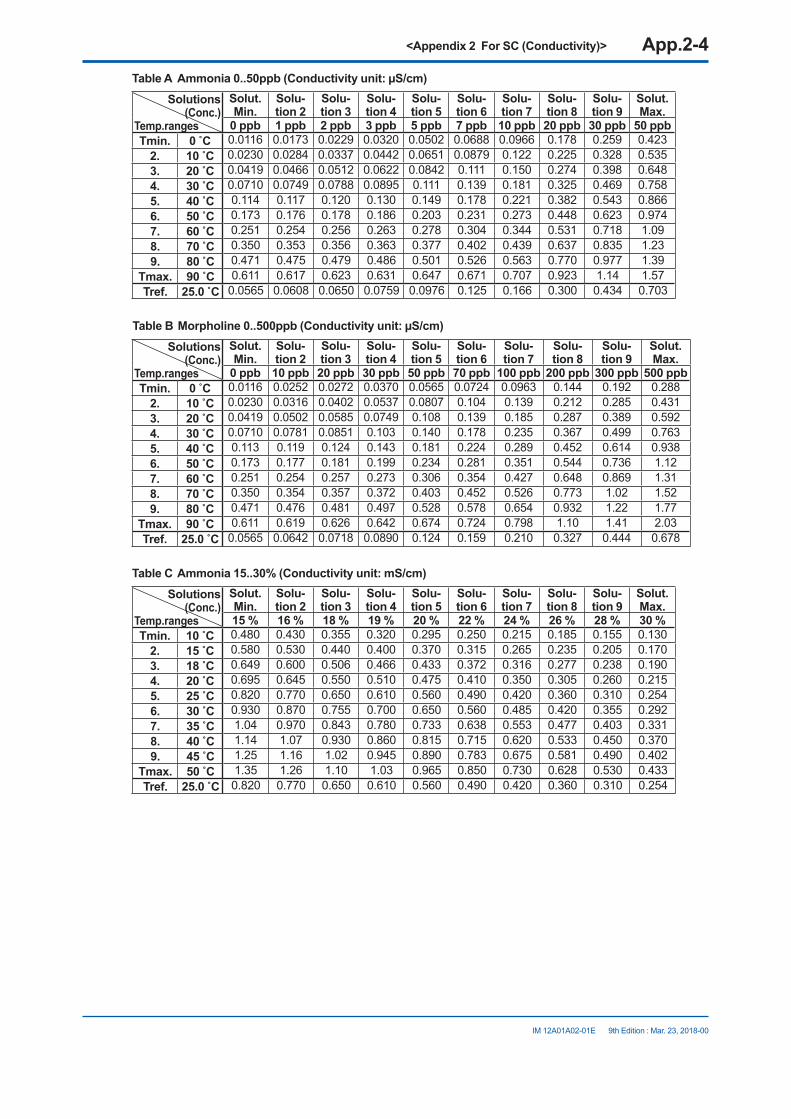
<Appendix 2 For SC (Conductivity)> App.2-4
IM 12A01A02-01E 9th Edition : Mar. 23, 2018-00
Table A Ammonia 0..50ppb (Conductivity unit: µS/cm)Solutions
(Conc.)Temp.ranges
Solut.Min.
Solu-tion 2
Solu-tion 3
Solu-tion 4
Solu-tion 5
Solu-tion 6
Solu-tion 7
Solu-tion 8
Solu-tion 9
Solut.Max.
0 ppb 1 ppb 2 ppb 3 ppb 5 ppb 7 ppb 10 ppb 20 ppb 30 ppb 50 ppbTmin. 0 C 0.0116 0.0173 0.0229 0.0320 0.0502 0.0688 0.0966 0.178 0.259 0.423
2. 10 C 0.0230 0.0284 0.0337 0.0442 0.0651 0.0879 0.122 0.225 0.328 0.5353. 20 C 0.0419 0.0466 0.0512 0.0622 0.0842 0.111 0.150 0.274 0.398 0.6484. 30 C 0.0710 0.0749 0.0788 0.0895 0.111 0.139 0.181 0.325 0.469 0.7585. 40 C 0.114 0.117 0.120 0.130 0.149 0.178 0.221 0.382 0.543 0.8666. 50 C 0.173 0.176 0.178 0.186 0.203 0.231 0.273 0.448 0.623 0.9747. 60 C 0.251 0.254 0.256 0.263 0.278 0.304 0.344 0.531 0.718 1.098. 70 C 0.350 0.353 0.356 0.363 0.377 0.402 0.439 0.637 0.835 1.239. 80 C 0.471 0.475 0.479 0.486 0.501 0.526 0.563 0.770 0.977 1.39
Tmax. 90 C 0.611 0.617 0.623 0.631 0.647 0.671 0.707 0.923 1.14 1.57Tref. 25.0 C 0.0565 0.0608 0.0650 0.0759 0.0976 0.125 0.166 0.300 0.434 0.703
Table B Morpholine 0..500ppb (Conductivity unit: µS/cm)Solutions
(Conc.)Temp.ranges
Solut.Min.
Solu-tion 2
Solu-tion 3
Solu-tion 4
Solu-tion 5
Solu-tion 6
Solu-tion 7
Solu-tion 8
Solu-tion 9
Solut.Max.
0 ppb 10 ppb 20 ppb 30 ppb 50 ppb 70 ppb 100 ppb 200 ppb 300 ppb 500 ppbTmin. 0 C 0.0116 0.0252 0.0272 0.0370 0.0565 0.0724 0.0963 0.144 0.192 0.288
2. 10 C 0.0230 0.0316 0.0402 0.0537 0.0807 0.104 0.139 0.212 0.285 0.4313. 20 C 0.0419 0.0502 0.0585 0.0749 0.108 0.139 0.185 0.287 0.389 0.5924. 30 C 0.0710 0.0781 0.0851 0.103 0.140 0.178 0.235 0.367 0.499 0.7635. 40 C 0.113 0.119 0.124 0.143 0.181 0.224 0.289 0.452 0.614 0.9386. 50 C 0.173 0.177 0.181 0.199 0.234 0.281 0.351 0.544 0.736 1.127. 60 C 0.251 0.254 0.257 0.273 0.306 0.354 0.427 0.648 0.869 1.318. 70 C 0.350 0.354 0.357 0.372 0.403 0.452 0.526 0.773 1.02 1.529. 80 C 0.471 0.476 0.481 0.497 0.528 0.578 0.654 0.932 1.22 1.77
Tmax. 90 C 0.611 0.619 0.626 0.642 0.674 0.724 0.798 1.10 1.41 2.03Tref. 25.0 C 0.0565 0.0642 0.0718 0.0890 0.124 0.159 0.210 0.327 0.444 0.678
Table C Ammonia 15..30% (Conductivity unit: mS/cm)Solutions
(Conc.)Temp.ranges
Solut.Min.
Solu-tion 2
Solu-tion 3
Solu-tion 4
Solu-tion 5
Solu-tion 6
Solu-tion 7
Solu-tion 8
Solu-tion 9
Solut.Max.
15 % 16 % 18 % 19 % 20 % 22 % 24 % 26 % 28 % 30 %Tmin. 10 C 0.480 0.430 0.355 0.320 0.295 0.250 0.215 0.185 0.155 0.130
2. 15 C 0.580 0.530 0.440 0.400 0.370 0.315 0.265 0.235 0.205 0.1703. 18 C 0.649 0.600 0.506 0.466 0.433 0.372 0.316 0.277 0.238 0.1904. 20 C 0.695 0.645 0.550 0.510 0.475 0.410 0.350 0.305 0.260 0.2155. 25 C 0.820 0.770 0.650 0.610 0.560 0.490 0.420 0.360 0.310 0.2546. 30 C 0.930 0.870 0.755 0.700 0.650 0.560 0.485 0.420 0.355 0.2927. 35 C 1.04 0.970 0.843 0.780 0.733 0.638 0.553 0.477 0.403 0.3318. 40 C 1.14 1.07 0.930 0.860 0.815 0.715 0.620 0.533 0.450 0.3709. 45 C 1.25 1.16 1.02 0.945 0.890 0.783 0.675 0.581 0.490 0.402
Tmax. 50 C 1.35 1.26 1.10 1.03 0.965 0.850 0.730 0.628 0.530 0.433Tref. 25.0 C 0.820 0.770 0.650 0.610 0.560 0.490 0.420 0.360 0.310 0.254
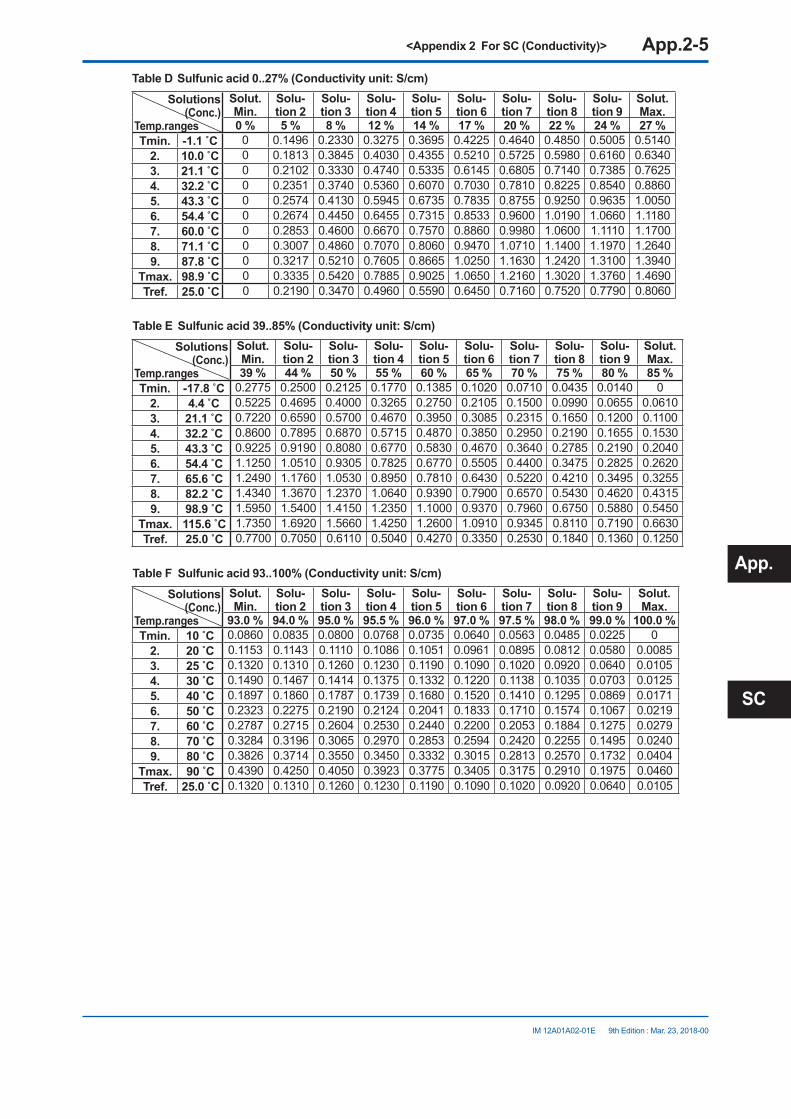
<Appendix 2 For SC (Conductivity)> App.2-5
IM 12A01A02-01E 9th Edition : Mar. 23, 2018-00
Table D Sulfunic acid 0..27% (Conductivity unit: S/cm)Solutions
(Conc.)Temp.ranges
Solut.Min.
Solu-tion 2
Solu-tion 3
Solu-tion 4
Solu-tion 5
Solu-tion 6
Solu-tion 7
Solu-tion 8
Solu-tion 9
Solut.Max.
0 % 5 % 8 % 12 % 14 % 17 % 20 % 22 % 24 % 27 %Tmin. -1.1 C 0 0.1496 0.2330 0.3275 0.3695 0.4225 0.4640 0.4850 0.5005 0.5140
2. 10.0 C 0 0.1813 0.3845 0.4030 0.4355 0.5210 0.5725 0.5980 0.6160 0.63403. 21.1 C 0 0.2102 0.3330 0.4740 0.5335 0.6145 0.6805 0.7140 0.7385 0.76254. 32.2 C 0 0.2351 0.3740 0.5360 0.6070 0.7030 0.7810 0.8225 0.8540 0.88605. 43.3 C 0 0.2574 0.4130 0.5945 0.6735 0.7835 0.8755 0.9250 0.9635 1.00506. 54.4 C 0 0.2674 0.4450 0.6455 0.7315 0.8533 0.9600 1.0190 1.0660 1.11807. 60.0 C 0 0.2853 0.4600 0.6670 0.7570 0.8860 0.9980 1.0600 1.1110 1.17008. 71.1 C 0 0.3007 0.4860 0.7070 0.8060 0.9470 1.0710 1.1400 1.1970 1.26409. 87.8 C 0 0.3217 0.5210 0.7605 0.8665 1.0250 1.1630 1.2420 1.3100 1.3940
Tmax. 98.9 C 0 0.3335 0.5420 0.7885 0.9025 1.0650 1.2160 1.3020 1.3760 1.4690Tref. 25.0 C 0 0.2190 0.3470 0.4960 0.5590 0.6450 0.7160 0.7520 0.7790 0.8060
Table E Sulfunic acid 39..85% (Conductivity unit: S/cm)Solutions
(Conc.)Temp.ranges
Solut.Min.
Solu-tion 2
Solu-tion 3
Solu-tion 4
Solu-tion 5
Solu-tion 6
Solu-tion 7
Solu-tion 8
Solu-tion 9
Solut.Max.
39 % 44 % 50 % 55 % 60 % 65 % 70 % 75 % 80 % 85 %Tmin. -17.8 C 0.2775 0.2500 0.2125 0.1770 0.1385 0.1020 0.0710 0.0435 0.0140 0
2. 4.4 C 0.5225 0.4695 0.4000 0.3265 0.2750 0.2105 0.1500 0.0990 0.0655 0.06103. 21.1 C 0.7220 0.6590 0.5700 0.4670 0.3950 0.3085 0.2315 0.1650 0.1200 0.11004. 32.2 C 0.8600 0.7895 0.6870 0.5715 0.4870 0.3850 0.2950 0.2190 0.1655 0.15305. 43.3 C 0.9225 0.9190 0.8080 0.6770 0.5830 0.4670 0.3640 0.2785 0.2190 0.20406. 54.4 C 1.1250 1.0510 0.9305 0.7825 0.6770 0.5505 0.4400 0.3475 0.2825 0.26207. 65.6 C 1.2490 1.1760 1.0530 0.8950 0.7810 0.6430 0.5220 0.4210 0.3495 0.32558. 82.2 C 1.4340 1.3670 1.2370 1.0640 0.9390 0.7900 0.6570 0.5430 0.4620 0.43159. 98.9 C 1.5950 1.5400 1.4150 1.2350 1.1000 0.9370 0.7960 0.6750 0.5880 0.5450
Tmax. 115.6 C 1.7350 1.6920 1.5660 1.4250 1.2600 1.0910 0.9345 0.8110 0.7190 0.6630Tref. 25.0 C 0.7700 0.7050 0.6110 0.5040 0.4270 0.3350 0.2530 0.1840 0.1360 0.1250
Table F Sulfunic acid 93..100% (Conductivity unit: S/cm)Solutions
(Conc.)Temp.ranges
Solut.Min.
Solu-tion 2
Solu-tion 3
Solu-tion 4
Solu-tion 5
Solu-tion 6
Solu-tion 7
Solu-tion 8
Solu-tion 9
Solut.Max.
93.0 % 94.0 % 95.0 % 95.5 % 96.0 % 97.0 % 97.5 % 98.0 % 99.0 % 100.0 %Tmin. 10 C 0.0860 0.0835 0.0800 0.0768 0.0735 0.0640 0.0563 0.0485 0.0225 0
2. 20 C 0.1153 0.1143 0.1110 0.1086 0.1051 0.0961 0.0895 0.0812 0.0580 0.00853. 25 C 0.1320 0.1310 0.1260 0.1230 0.1190 0.1090 0.1020 0.0920 0.0640 0.01054. 30 C 0.1490 0.1467 0.1414 0.1375 0.1332 0.1220 0.1138 0.1035 0.0703 0.01255. 40 C 0.1897 0.1860 0.1787 0.1739 0.1680 0.1520 0.1410 0.1295 0.0869 0.01716. 50 C 0.2323 0.2275 0.2190 0.2124 0.2041 0.1833 0.1710 0.1574 0.1067 0.02197. 60 C 0.2787 0.2715 0.2604 0.2530 0.2440 0.2200 0.2053 0.1884 0.1275 0.02798. 70 C 0.3284 0.3196 0.3065 0.2970 0.2853 0.2594 0.2420 0.2255 0.1495 0.02409. 80 C 0.3826 0.3714 0.3550 0.3450 0.3332 0.3015 0.2813 0.2570 0.1732 0.0404
Tmax. 90 C 0.4390 0.4250 0.4050 0.3923 0.3775 0.3405 0.3175 0.2910 0.1975 0.0460Tref. 25.0 C 0.1320 0.1310 0.1260 0.1230 0.1190 0.1090 0.1020 0.0920 0.0640 0.0105
App.
SC
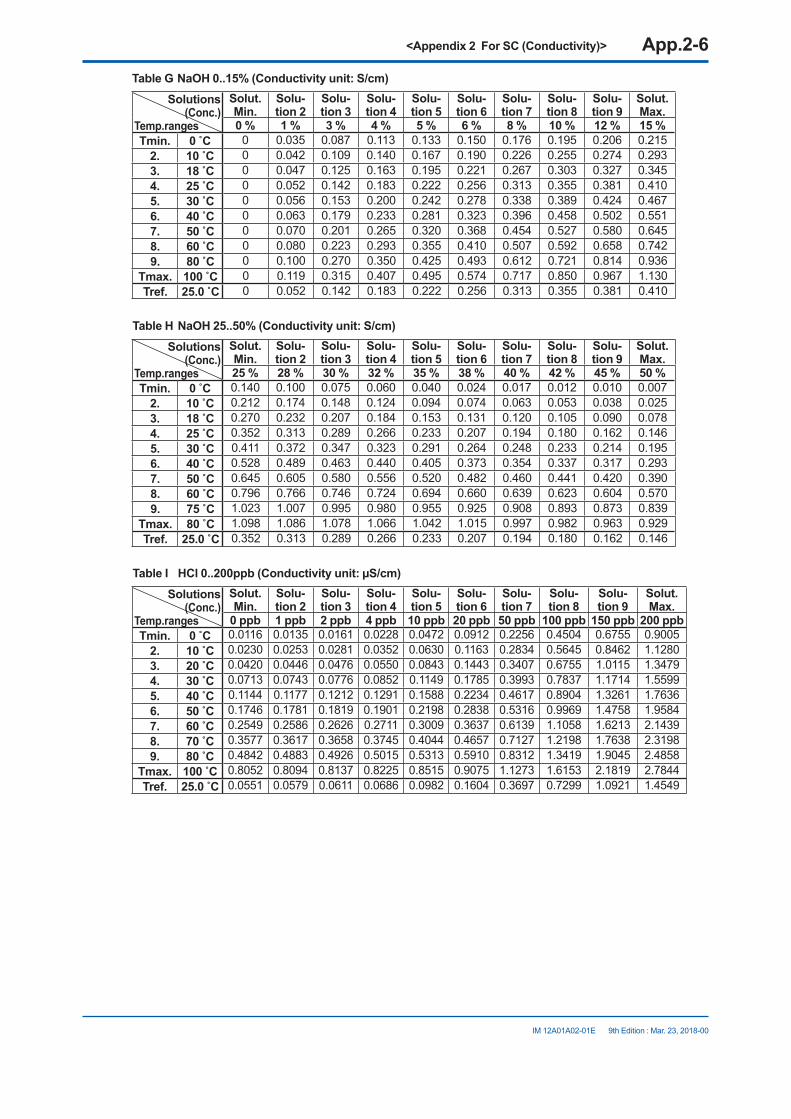
<Appendix 2 For SC (Conductivity)> App.2-6
IM 12A01A02-01E 9th Edition : Mar. 23, 2018-00
Table G NaOH 0..15% (Conductivity unit: S/cm)Solutions
(Conc.)Temp.ranges
Solut.Min.
Solu-tion 2
Solu-tion 3
Solu-tion 4
Solu-tion 5
Solu-tion 6
Solu-tion 7
Solu-tion 8
Solu-tion 9
Solut.Max.
0 % 1 % 3 % 4 % 5 % 6 % 8 % 10 % 12 % 15 %Tmin. 0 C 0 0.035 0.087 0.113 0.133 0.150 0.176 0.195 0.206 0.215
2. 10 C 0 0.042 0.109 0.140 0.167 0.190 0.226 0.255 0.274 0.2933. 18 C 0 0.047 0.125 0.163 0.195 0.221 0.267 0.303 0.327 0.3454. 25 C 0 0.052 0.142 0.183 0.222 0.256 0.313 0.355 0.381 0.4105. 30 C 0 0.056 0.153 0.200 0.242 0.278 0.338 0.389 0.424 0.4676. 40 C 0 0.063 0.179 0.233 0.281 0.323 0.396 0.458 0.502 0.5517. 50 C 0 0.070 0.201 0.265 0.320 0.368 0.454 0.527 0.580 0.6458. 60 C 0 0.080 0.223 0.293 0.355 0.410 0.507 0.592 0.658 0.7429. 80 C 0 0.100 0.270 0.350 0.425 0.493 0.612 0.721 0.814 0.936
Tmax. 100 C 0 0.119 0.315 0.407 0.495 0.574 0.717 0.850 0.967 1.130Tref. 25.0 C 0 0.052 0.142 0.183 0.222 0.256 0.313 0.355 0.381 0.410
Table H NaOH 25..50% (Conductivity unit: S/cm)Solutions
(Conc.)Temp.ranges
Solut.Min.
Solu-tion 2
Solu-tion 3
Solu-tion 4
Solu-tion 5
Solu-tion 6
Solu-tion 7
Solu-tion 8
Solu-tion 9
Solut.Max.
25 % 28 % 30 % 32 % 35 % 38 % 40 % 42 % 45 % 50 %Tmin. 0 C 0.140 0.100 0.075 0.060 0.040 0.024 0.017 0.012 0.010 0.007
2. 10 C 0.212 0.174 0.148 0.124 0.094 0.074 0.063 0.053 0.038 0.0253. 18 C 0.270 0.232 0.207 0.184 0.153 0.131 0.120 0.105 0.090 0.0784. 25 C 0.352 0.313 0.289 0.266 0.233 0.207 0.194 0.180 0.162 0.1465. 30 C 0.411 0.372 0.347 0.323 0.291 0.264 0.248 0.233 0.214 0.1956. 40 C 0.528 0.489 0.463 0.440 0.405 0.373 0.354 0.337 0.317 0.2937. 50 C 0.645 0.605 0.580 0.556 0.520 0.482 0.460 0.441 0.420 0.3908. 60 C 0.796 0.766 0.746 0.724 0.694 0.660 0.639 0.623 0.604 0.5709. 75 C 1.023 1.007 0.995 0.980 0.955 0.925 0.908 0.893 0.873 0.839
Tmax. 80 C 1.098 1.086 1.078 1.066 1.042 1.015 0.997 0.982 0.963 0.929Tref. 25.0 C 0.352 0.313 0.289 0.266 0.233 0.207 0.194 0.180 0.162 0.146
Table I HCl 0..200ppb (Conductivity unit: µS/cm)Solutions
(Conc.)Temp.ranges
Solut.Min.
Solu-tion 2
Solu-tion 3
Solu-tion 4
Solu-tion 5
Solu-tion 6
Solu-tion 7
Solu-tion 8
Solu-tion 9
Solut.Max.
0 ppb 1 ppb 2 ppb 4 ppb 10 ppb 20 ppb 50 ppb 100 ppb 150 ppb 200 ppbTmin. 0 C 0.0116 0.0135 0.0161 0.0228 0.0472 0.0912 0.2256 0.4504 0.6755 0.9005
2. 10 C 0.0230 0.0253 0.0281 0.0352 0.0630 0.1163 0.2834 0.5645 0.8462 1.12803. 20 C 0.0420 0.0446 0.0476 0.0550 0.0843 0.1443 0.3407 0.6755 1.0115 1.34794. 30 C 0.0713 0.0743 0.0776 0.0852 0.1149 0.1785 0.3993 0.7837 1.1714 1.55995. 40 C 0.1144 0.1177 0.1212 0.1291 0.1588 0.2234 0.4617 0.8904 1.3261 1.76366. 50 C 0.1746 0.1781 0.1819 0.1901 0.2198 0.2838 0.5316 0.9969 1.4758 1.95847. 60 C 0.2549 0.2586 0.2626 0.2711 0.3009 0.3637 0.6139 1.1058 1.6213 2.14398. 70 C 0.3577 0.3617 0.3658 0.3745 0.4044 0.4657 0.7127 1.2198 1.7638 2.31989. 80 C 0.4842 0.4883 0.4926 0.5015 0.5313 0.5910 0.8312 1.3419 1.9045 2.4858
Tmax. 100 C 0.8052 0.8094 0.8137 0.8225 0.8515 0.9075 1.1273 1.6153 2.1819 2.7844Tref. 25.0 C 0.0551 0.0579 0.0611 0.0686 0.0982 0.1604 0.3697 0.7299 1.0921 1.4549
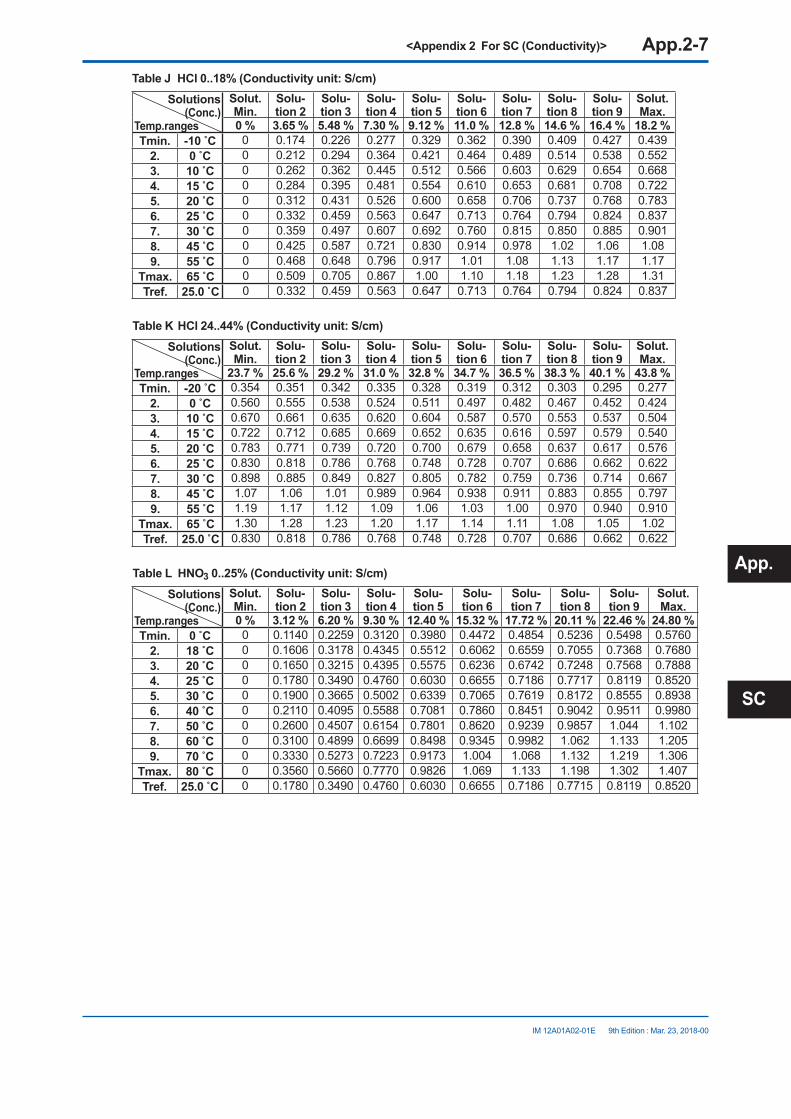
<Appendix 2 For SC (Conductivity)> App.2-7
IM 12A01A02-01E 9th Edition : Mar. 23, 2018-00
Table J HCl 0..18% (Conductivity unit: S/cm)Solutions
(Conc.)Temp.ranges
Solut.Min.
Solu-tion 2
Solu-tion 3
Solu-tion 4
Solu-tion 5
Solu-tion 6
Solu-tion 7
Solu-tion 8
Solu-tion 9
Solut.Max.
0 % 3.65 % 5.48 % 7.30 % 9.12 % 11.0 % 12.8 % 14.6 % 16.4 % 18.2 %Tmin. -10 C 0 0.174 0.226 0.277 0.329 0.362 0.390 0.409 0.427 0.439
2. 0 C 0 0.212 0.294 0.364 0.421 0.464 0.489 0.514 0.538 0.5523. 10 C 0 0.262 0.362 0.445 0.512 0.566 0.603 0.629 0.654 0.6684. 15 C 0 0.284 0.395 0.481 0.554 0.610 0.653 0.681 0.708 0.7225. 20 C 0 0.312 0.431 0.526 0.600 0.658 0.706 0.737 0.768 0.7836. 25 C 0 0.332 0.459 0.563 0.647 0.713 0.764 0.794 0.824 0.8377. 30 C 0 0.359 0.497 0.607 0.692 0.760 0.815 0.850 0.885 0.9018. 45 C 0 0.425 0.587 0.721 0.830 0.914 0.978 1.02 1.06 1.089. 55 C 0 0.468 0.648 0.796 0.917 1.01 1.08 1.13 1.17 1.17
Tmax. 65 C 0 0.509 0.705 0.867 1.00 1.10 1.18 1.23 1.28 1.31Tref. 25.0 C 0 0.332 0.459 0.563 0.647 0.713 0.764 0.794 0.824 0.837
Table K HCl 24..44% (Conductivity unit: S/cm)Solutions
(Conc.)Temp.ranges
Solut.Min.
Solu-tion 2
Solu-tion 3
Solu-tion 4
Solu-tion 5
Solu-tion 6
Solu-tion 7
Solu-tion 8
Solu-tion 9
Solut.Max.
23.7 % 25.6 % 29.2 % 31.0 % 32.8 % 34.7 % 36.5 % 38.3 % 40.1 % 43.8 %Tmin. -20 C 0.354 0.351 0.342 0.335 0.328 0.319 0.312 0.303 0.295 0.277
2. 0 C 0.560 0.555 0.538 0.524 0.511 0.497 0.482 0.467 0.452 0.4243. 10 C 0.670 0.661 0.635 0.620 0.604 0.587 0.570 0.553 0.537 0.5044. 15 C 0.722 0.712 0.685 0.669 0.652 0.635 0.616 0.597 0.579 0.5405. 20 C 0.783 0.771 0.739 0.720 0.700 0.679 0.658 0.637 0.617 0.5766. 25 C 0.830 0.818 0.786 0.768 0.748 0.728 0.707 0.686 0.662 0.6227. 30 C 0.898 0.885 0.849 0.827 0.805 0.782 0.759 0.736 0.714 0.6678. 45 C 1.07 1.06 1.01 0.989 0.964 0.938 0.911 0.883 0.855 0.7979. 55 C 1.19 1.17 1.12 1.09 1.06 1.03 1.00 0.970 0.940 0.910
Tmax. 65 C 1.30 1.28 1.23 1.20 1.17 1.14 1.11 1.08 1.05 1.02Tref. 25.0 C 0.830 0.818 0.786 0.768 0.748 0.728 0.707 0.686 0.662 0.622
Table L HNO3 0..25% (Conductivity unit: S/cm)Solutions
(Conc.)Temp.ranges
Solut.Min.
Solu-tion 2
Solu-tion 3
Solu-tion 4
Solu-tion 5
Solu-tion 6
Solu-tion 7
Solu-tion 8
Solu-tion 9
Solut.Max.
0 % 3.12 % 6.20 % 9.30 % 12.40 % 15.32 % 17.72 % 20.11 % 22.46 % 24.80 %Tmin. 0 C 0 0.1140 0.2259 0.3120 0.3980 0.4472 0.4854 0.5236 0.5498 0.5760
2. 18 C 0 0.1606 0.3178 0.4345 0.5512 0.6062 0.6559 0.7055 0.7368 0.76803. 20 C 0 0.1650 0.3215 0.4395 0.5575 0.6236 0.6742 0.7248 0.7568 0.78884. 25 C 0 0.1780 0.3490 0.4760 0.6030 0.6655 0.7186 0.7717 0.8119 0.85205. 30 C 0 0.1900 0.3665 0.5002 0.6339 0.7065 0.7619 0.8172 0.8555 0.89386. 40 C 0 0.2110 0.4095 0.5588 0.7081 0.7860 0.8451 0.9042 0.9511 0.99807. 50 C 0 0.2600 0.4507 0.6154 0.7801 0.8620 0.9239 0.9857 1.044 1.1028. 60 C 0 0.3100 0.4899 0.6699 0.8498 0.9345 0.9982 1.062 1.133 1.2059. 70 C 0 0.3330 0.5273 0.7223 0.9173 1.004 1.068 1.132 1.219 1.306
Tmax. 80 C 0 0.3560 0.5660 0.7770 0.9826 1.069 1.133 1.198 1.302 1.407Tref. 25.0 C 0 0.1780 0.3490 0.4760 0.6030 0.6655 0.7186 0.7715 0.8119 0.8520
App.
SC

<Appendix 2 For SC (Conductivity)> App.2-8
IM 12A01A02-01E 9th Edition : Mar. 23, 2018-00
Table M HNO3 35..88% (Conductivity unit: S/cm)Solutions
(Conc.)Temp.ranges
Solut.Min.
Solu-tion 2
Solu-tion 3
Solu-tion 4
Solu-tion 5
Solu-tion 6
Solu-tion 7
Solu-tion 8
Solu-tion 9
Solut.Max.
35.0 % 37.2 % 43.3 % 49.6 % 55.8 % 62.0 % 75.0 % 76.6 % 82.0 % 87.7 %Tmin. -16 C 0.412 0.400 0.368 0.334 0.288 0.254 0.163 0.147 0.089 0.044
2. 0 C 0.576 0.555 0.507 0.456 0.404 0.352 0.227 0.208 0.128 0.0603. 10 C 0.678 0.666 0.614 0.555 0.493 0.438 0.268 0.246 0.153 0.0694. 18 C 0.770 0.754 0.700 0.634 0.565 0.506 0.300 0.277 0.172 0.0775. 20 C 0.786 0.776 0.721 0.654 0.583 0.512 0.310 0.290 0.175 0.0796. 25 C 0.842 0.831 0.784 0.714 0.636 0.559 0.340 0.315 0.185 0.0817. 30 C 0.895 0.886 0.827 0.754 0.672 0.590 0.370 0.335 0.190 0.0838. 40 C 1.001 0.995 0.938 0.858 0.774 0.690 0.430 0.375 0.200 0.0879. 50 C 1.105 1.095 1.038 0.958 0.874 0.790 0.485 0.415 0.210 0.091
Tmax. 60 C 1.205 1.195 1.138 1.058 0.974 0.890 0.530 0.455 0.220 0.095Tref. 25.0 C 0.842 0.831 0.784 0.714 0.636 0.559 0.340 0.315 0.185 0.081
<User-defined matrixes>Theuser-definedtemperaturecompensationmatrixisamatrixdefinedbyusers.Entervaluesasshown in Table 3. The gray areas must be entered.
Table 3 Example of user-defined matrix (Reference temperature (Tref.): 25.0 C, Conductivity unit: S/cm)Solutions
(Conc.)Temp.ranges
Solut.Min.
Solut.Max.
Solu-tion 2
Solu-tion 3
Solu-tion 4
Solu-tion 5
Solu-tion 6
Solu-tion 7
Solu-tion 8
Solu-tion 9
0% 15% 1% 3% 4% 5% 6% 8% 10% 12%Tref. (25.0˚C) 0.013 0.410 0.052 0.142 0.183 0.222 0.256 0.313 0.355 0.381Tmin. 0 C 0.009 0.215 0.035 0.087 0.113 0.133 0.150 0.176 0.195 0.206Tmax. 100˚C 0.025 1.13 0.119 0.315 0.407 0.495 0.574 0.717 0.850 0.967
2. 10˚C 0.010 0.293 0.042 0.109 0.140 0.167 0.190 0.226 0.255 0.2743. 18˚C 0.012 0.357 0.047 0.125 0.163 0.195 0.221 0.267 0.303 0.3274. 25˚C 0.013 0.410 0.052 0.142 0.183 0.222 0.256 0.313 0.355 0.3815. 30˚C 0.014 0.468 0.056 0.153 0.200 0.242 0.278 0.338 0.389 0.4246. 40˚C 0.015 0.551 0.067 0.179 0.233 0.281 0.323 0.396 0.458 0.5027. 50˚C 0.017 0.645 0.070 0.201 0.265 0.320 0.368 0.454 0.527 0.5808. 60˚C 0.018 0.742 0.080 0.223 0.293 0.355 0.410 0.507 0.592 0.6589. 80˚C 0.021 0.936 0.100 0.270 0.350 0.425 0.493 0.612 0.721 0.814
Note: This table is as shown on the screen. The gray areas must be entered.
Set the reference temperature in the Temp. comp. screen (default: 25.0°C).
Input concentration values in the Solution screen.The values must be entered in ascending order from Solution (Min.) to Solution (Max.). Solution (Min.) and Solution (Max.) must be entered.Input temperatures for compensation in the Temp. ranges screen.Input the conductivity values* at respective temperatures in the Solution (Min.) screen and those in the Solution (Max.) screen. Input other values, if any, in the Solution n screen.*: Enter the precompensated conductivity.
Allcellsoftwouser-definedmatrixesareblankasadefault.Ifanycellsarenotblank,clearthem.
After entering all values, select “Check values?” to verify that there is no error.This function checks if the matrix is consistently incremental or decremental. If any error is found, itslocationisspecified.Ifthereisnoerror,thematrixiscompensatedlinearlyandtheblanksofthetable(ifany)arefilled.If some areas are left empty without running “Check values?”, a 1st/2nd comp. matrix error will be issued.
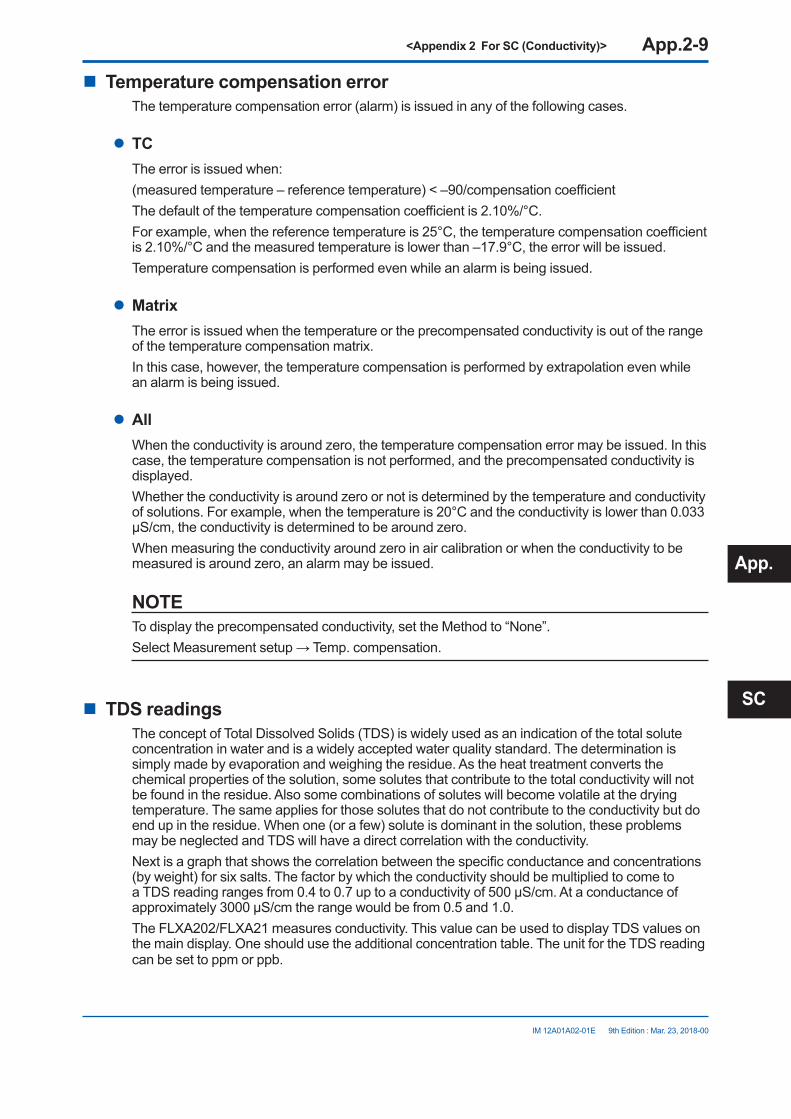
<Appendix 2 For SC (Conductivity)> App.2-9
IM 12A01A02-01E 9th Edition : Mar. 23, 2018-00
n Temperature compensation errorThe temperature compensation error (alarm) is issued in any of the following cases.
l TCThe error is issued when:(measuredtemperature–referencetemperature)<–90/compensationcoefficientThedefaultofthetemperaturecompensationcoefficientis2.10%/°C.Forexample,whenthereferencetemperatureis25°C,thetemperaturecompensationcoefficientis2.10%/°Candthemeasuredtemperatureislowerthan–17.9°C,theerrorwillbeissued.Temperature compensation is performed even while an alarm is being issued.
l MatrixThe error is issued when the temperature or the precompensated conductivity is out of the range of the temperature compensation matrix.In this case, however, the temperature compensation is performed by extrapolation even while an alarm is being issued.
l AllWhen the conductivity is around zero, the temperature compensation error may be issued. In this case, the temperature compensation is not performed, and the precompensated conductivity is displayed.Whether the conductivity is around zero or not is determined by the temperature and conductivity of solutions. For example, when the temperature is 20°C and the conductivity is lower than 0.033 μS/cm,theconductivityisdeterminedtobearoundzero.When measuring the conductivity around zero in air calibration or when the conductivity to be measured is around zero, an alarm may be issued.
NOTETo display the precompensated conductivity, set the Method to “None”.SelectMeasurementsetup→Temp.compensation.
n TDS readingsThe concept of Total Dissolved Solids (TDS) is widely used as an indication of the total solute concentration in water and is a widely accepted water quality standard. The determination is simply made by evaporation and weighing the residue. As the heat treatment converts the chemical properties of the solution, some solutes that contribute to the total conductivity will not be found in the residue. Also some combinations of solutes will become volatile at the drying temperature. The same applies for those solutes that do not contribute to the conductivity but do end up in the residue. When one (or a few) solute is dominant in the solution, these problems may be neglected and TDS will have a direct correlation with the conductivity.Nextisagraphthatshowsthecorrelationbetweenthespecificconductanceandconcentrations(by weight) for six salts. The factor by which the conductivity should be multiplied to come to aTDSreadingrangesfrom0.4to0.7uptoaconductivityof500µS/cm.Ataconductanceofapproximately3000µS/cmtherangewouldbefrom0.5and1.0.The FLXA202/FLXA21 measures conductivity. This value can be used to display TDS values on the main display. One should use the additional concentration table. The unit for the TDS reading can be set to ppm or ppb.
App.
SC

<Appendix 2 For SC (Conductivity)> App.2-10
IM 12A01A02-01E 9th Edition : Mar. 23, 2018-00
0 1000 2000 3000 4000 5000
1000
2000
3000
4000
5000
6000
7000
Concentration (mg/L)
Con
duct
ivity
(µS
/cm
, 25°
C)
MgCI2 Na2SO4
MgSO4
CaCI2
NaCI KCI
Figure 2 Relations of concentration and conductivity
n Calibration solutions for conductivityThe calibration (cell constant) of a sensor does not change unless the sensor is damaged.It can also appear to change because of coating of the electrodes, or partial blockage. It does not make sense to regularly recalibrate the FLXA202/FLXA21.
Acalibrationcheck,however,isanothermatter.Whentheobjectiveisclearlydefinedasadiagnosticexercisearegularcheckcanbringanextralevelofsecurityandconfidencetothemeasurement.Sensordamage,and/orcoatingscanbedifficulttoseeandthecalibrationcheckcanconfirmtheir presence, by a deviation from the known solution conductivity. The remedial action should be to clean the sensor, and carefully check for blockage or damage (not simply to recalibrate).Higherconductivitysolutionsshouldbeusedwherepossible.Thelowertheconductivityofthetest solution, the easier it is to contaminate. Carbon dioxide from the air can be quickly absorbed to cause an error. All containers must be suitably clean, and all materials suitably pure. Outside of a well-equipped laboratory these conditions are hard to meet.
Also note that the check must be performed with due regard to the cell constant of the sensor, asitlimitstheeffectiveworkingrange.Thedocumentationprovidedwiththesensorshouldbeconsulted to determine its maximum working value. By using a checking solution close to the upper range limit of the sensor, the detection of contamination is better. A slightly contaminated sensormayreadperfectlyatlowerconductivity,butshowsignificanterrorsathighervalues.Thisis caused by the early onset of polarization, the factor that limits the upper range of the sensor in any case. Polarization is seen in contaminated sensors, and it is for this reason that there is a sophisticated polarization check built into the FLXA202/FLXA21.
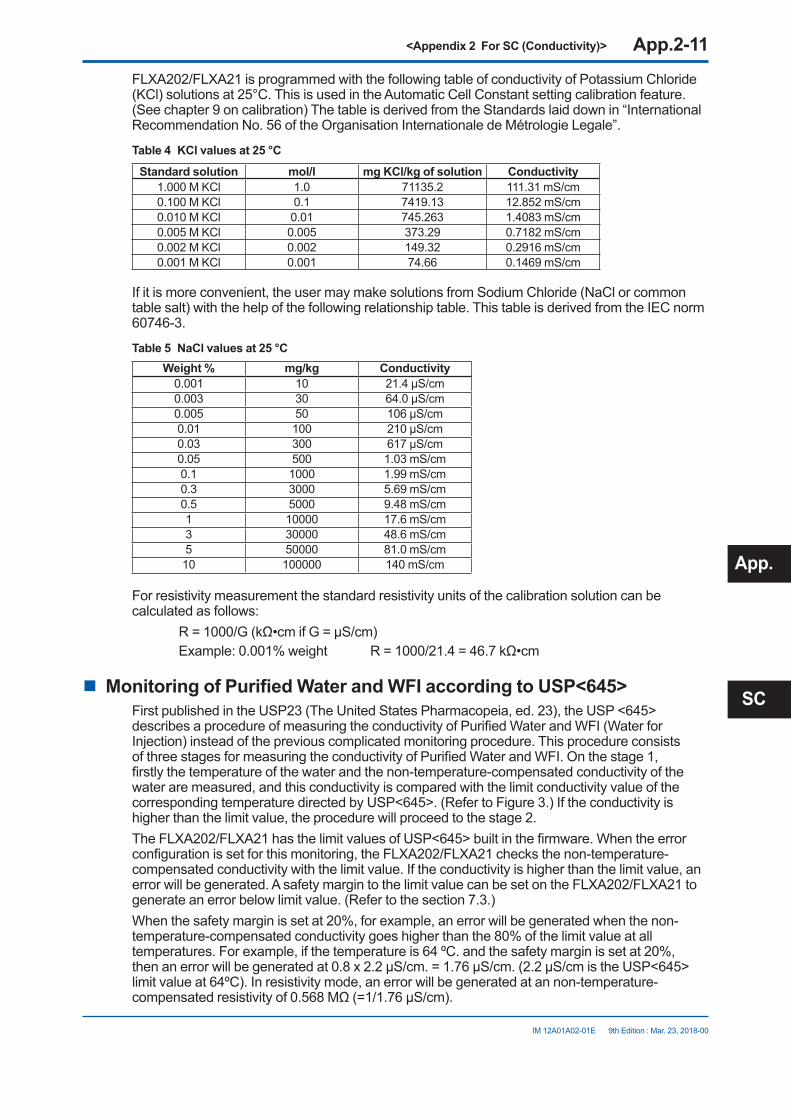
<Appendix 2 For SC (Conductivity)> App.2-11
IM 12A01A02-01E 9th Edition : Mar. 23, 2018-00
FLXA202/FLXA21 is programmed with the following table of conductivity of Potassium Chloride (KCl) solutions at 25°C. This is used in the Automatic Cell Constant setting calibration feature. (See chapter 9 on calibration) The table is derived from the Standards laid down in “International Recommendation No. 56 of the Organisation Internationale de Métrologie Legale”.
Table 4 KCl values at 25 °CStandard solution mol/l mg KCl/kg of solution Conductivity
1.000 M KCl 1.0 71135.2 111.31 mS/cm0.100 M KCl 0.1 7419.13 12.852 mS/cm0.010 M KCl 0.01 745.263 1.4083mS/cm0.005 M KCl 0.005 373.29 0.7182 mS/cm0.002 M KCl 0.002 149.32 0.2916 mS/cm0.001 M KCl 0.001 74.66 0.1469mS/cm
If it is more convenient, the user may make solutions from Sodium Chloride (NaCl or common table salt) with the help of the following relationship table. This table is derived from the IEC norm 60746-3.
Table 5 NaCl values at 25 °CWeight % mg/kg Conductivity
0.001 10 21.4µS/cm0.003 30 64.0µS/cm0.005 50 106µS/cm0.01 100 210µS/cm0.03 300 617µS/cm0.05 500 1.03 mS/cm0.1 1000 1.99 mS/cm0.3 3000 5.69 mS/cm0.5 5000 9.48mS/cm1 10000 17.6 mS/cm3 30000 48.6mS/cm5 50000 81.0 mS/cm10 100000 140mS/cm
For resistivity measurement the standard resistivity units of the calibration solution can be calculated as follows: R=1000/G(kΩ•cmifG=µS/cm) Example:0.001%weight R=1000/21.4=46.7kΩ•cm
n Monitoring of Purified Water and WFI according to USP<645>FirstpublishedintheUSP23(TheUnitedStatesPharmacopeia,ed.23),theUSP<645>describesaprocedureofmeasuringtheconductivityofPurifiedWaterandWFI(WaterforInjection) instead of the previous complicated monitoring procedure. This procedure consists ofthreestagesformeasuringtheconductivityofPurifiedWaterandWFI.Onthestage1,firstlythetemperatureofthewaterandthenon-temperature-compensatedconductivityofthewater are measured, and this conductivity is compared with the limit conductivity value of the correspondingtemperaturedirectedbyUSP<645>.(RefertoFigure3.)Iftheconductivityishigher than the limit value, the procedure will proceed to the stage 2.TheFLXA202/FLXA21hasthelimitvaluesofUSP<645>builtinthefirmware.Whentheerrorconfigurationissetforthismonitoring,theFLXA202/FLXA21checksthenon-temperature-compensated conductivity with the limit value. If the conductivity is higher than the limit value, an error will be generated. A safety margin to the limit value can be set on the FLXA202/FLXA21 to generate an error below limit value. (Refer to the section 7.3.)Whenthesafetymarginissetat20%,forexample,anerrorwillbegeneratedwhenthenon-temperature-compensatedconductivitygoeshigherthanthe80%ofthelimitvalueatalltemperatures.Forexample,ifthetemperatureis64ºC.andthesafetymarginissetat20%,thenanerrorwillbegeneratedat0.8x2.2μS/cm.=1.76μS/cm.(2.2μS/cmistheUSP<645>limitvalueat64ºC).Inresistivitymode,anerrorwillbegeneratedatannon-temperature-compensatedresistivityof0.568MΩ(=1/1.76μS/cm).
App.
SC

<Appendix 2 For SC (Conductivity)> App.2-12
IM 12A01A02-01E 9th Edition : Mar. 23, 2018-00
TheUSP<645>limitvalueisanon-temperature-compensatedconductivity.Whenameasuringconductivity needs to be shown on the main or home display as a non-temperature-compensated conductivity,setthetemperaturecompensationon“None”.(Refertothesection7.1.4.)
0.00.51.01.52.02.53.03.5
25 50 75 100
USP safety margin(user programmable)
USP limit
Temperature (°C)
Con
duct
ivity
(µS
/cm
)
Figure 3 Conductivity limit value and temperature directed by USP<645>
n Changing the settingsIf any setting is accidentally changed, values to the right of the relevant arrow in Table 6 are all initialized.
Table 6 Parameters that initialize other values
Measurement -> Output: Process parameter ->
Linear:0%value,100%valueTableCommunication:HART:PV
Display setup: Individual display (Main display)Trend Graph Screen -> Y-axis (low, high)Communication:HART
Configuresensor:Measuring unit ->
Display setup: Individual display (Main display): unit
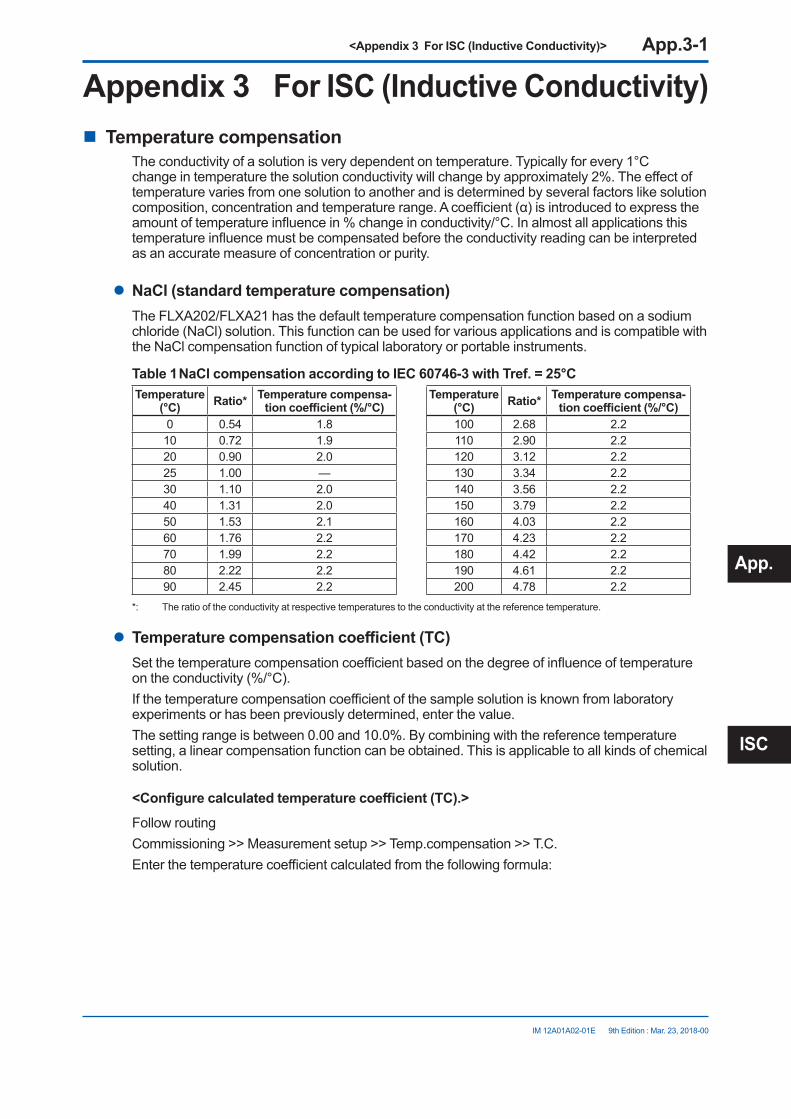
<Appendix 3 For ISC (Inductive Conductivity)> App.3-1
IM 12A01A02-01E 9th Edition : Mar. 23, 2018-00
Appendix 3 For ISC (Inductive Conductivity)n Temperature compensation
The conductivity of a solution is very dependent on temperature. Typically for every 1°C changeintemperaturethesolutionconductivitywillchangebyapproximately2%.Theeffectoftemperature varies from one solution to another and is determined by several factors like solution composition,concentrationandtemperaturerange.Acoefficient(α)isintroducedtoexpresstheamountoftemperatureinfluencein%changeinconductivity/°C.Inalmostallapplicationsthistemperatureinfluencemustbecompensatedbeforetheconductivityreadingcanbeinterpretedas an accurate measure of concentration or purity.
l NaCl (standard temperature compensation)The FLXA202/FLXA21 has the default temperature compensation function based on a sodium chloride (NaCl) solution. This function can be used for various applications and is compatible with the NaCl compensation function of typical laboratory or portable instruments.
Table 1 NaCl compensation according to IEC 60746-3 with Tref. = 25°CTemperature
(°C) Ratio* Temperature compensa-tion coefficient (%/°C)
Temperature (°C) Ratio* Temperature compensa-
tion coefficient (%/°C)0 0.54 1.8 100 2.68 2.210 0.72 1.9 110 2.90 2.220 0.90 2.0 120 3.12 2.225 1.00 — 130 3.34 2.230 1.10 2.0 140 3.56 2.240 1.31 2.0 150 3.79 2.250 1.53 2.1 160 4.03 2.260 1.76 2.2 170 4.23 2.270 1.99 2.2 180 4.42 2.280 2.22 2.2 190 4.61 2.290 2.45 2.2 200 4.78 2.2
*: The ratio of the conductivity at respective temperatures to the conductivity at the reference temperature.
l Temperature compensation coefficient (TC)Setthetemperaturecompensationcoefficientbasedonthedegreeofinfluenceoftemperatureontheconductivity(%/°C).Ifthetemperaturecompensationcoefficientofthesamplesolutionisknownfromlaboratoryexperiments or has been previously determined, enter the value.Thesettingrangeisbetween0.00and10.0%.Bycombiningwiththereferencetemperaturesetting, a linear compensation function can be obtained. This is applicable to all kinds of chemical solution.
<Configure calculated temperature coefficient (TC).>Follow routingCommissioning >> Measurement setup >> Temp.compensation >> T.C.Enterthetemperaturecoefficientcalculatedfromthefollowingformula:
App.
ISC
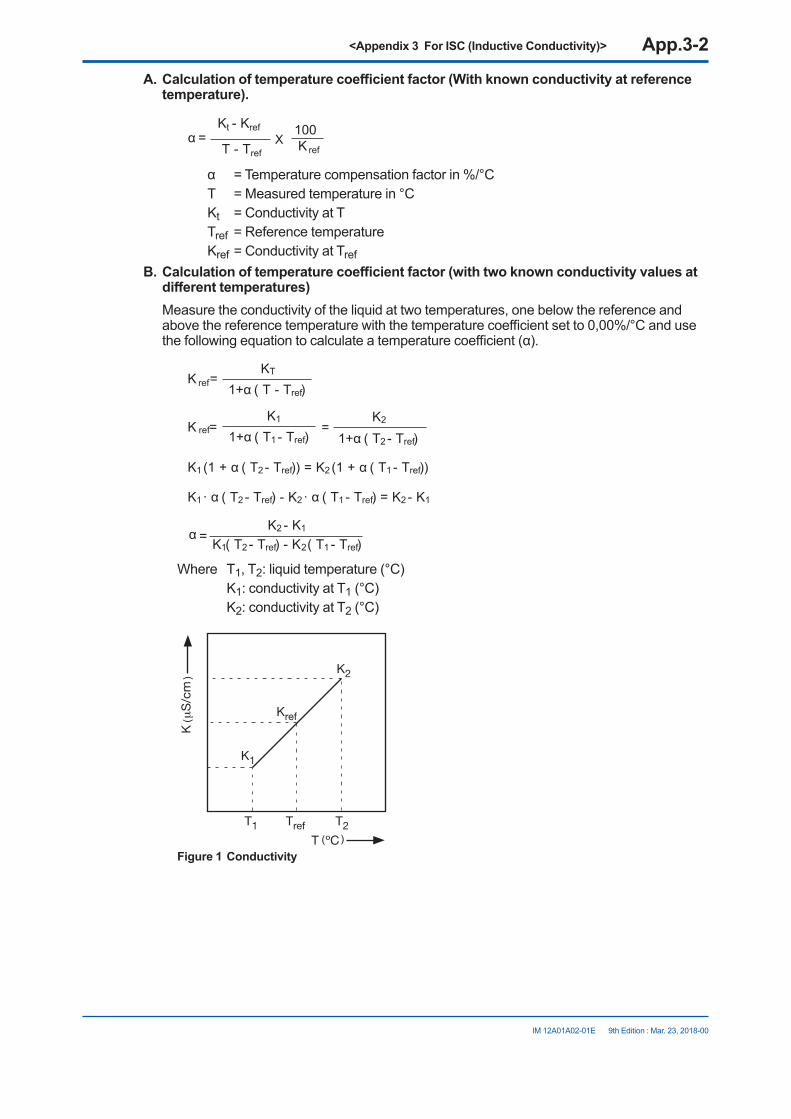
<Appendix 3 For ISC (Inductive Conductivity)> App.3-2
IM 12A01A02-01E 9th Edition : Mar. 23, 2018-00
A. Calculation of temperature coefficient factor (With known conductivity at reference temperature).
Kt - Krefα =
T - Tref
100K ref
X
α =Temperaturecompensationfactorin%/°CT =Measuredtemperaturein°CKt =ConductivityatTTref =ReferencetemperatureKref=ConductivityatTref
B. Calculation of temperature coefficient factor (with two known conductivity values at different temperatures)
Measure the conductivity of the liquid at two temperatures, one below the reference and abovethereferencetemperaturewiththetemperaturecoefficientsetto0,00%/°Candusethefollowingequationtocalculateatemperaturecoefficient(α).
KTK ref= 1+α ( T - Tref)
K2 - K1α = K1( T2 - Tref) - K2( T1 - Tref)
K1 K2K ref= =1+α ( T1 - Tref) 1+α ( T2 - Tref)
K1 (1 + α ( T2 - Tref )) = K2 (1 + α ( T1 - Tref ))
K1 · α ( T2 - Tref ) - K2 · α ( T1 - Tref ) = K2 - K1
Where T1, T2: liquid temperature (°C) K1: conductivity at T1 (°C) K2: conductivity at T2 (°C)
( )
(
(
Figure 1 Conductivity

<Appendix 3 For ISC (Inductive Conductivity)> App.3-3
IM 12A01A02-01E 9th Edition : Mar. 23, 2018-00
<Calculation example> Calculatethetemperaturecoefficientofaliquidfromthefollowingdata. Conductivity124.5µS/cmataliquidtemperatureof18.0°Candaconductivity147.6µS/cm
at a liquid temperature of 31.0 °C. Substituting the data in the above formula gives the following result.
147.6 - 124.5x 100= 1.298 %/°Cα =
124.5x(31.0 - 25) - 147.6x(18.0 - 25)
SetthetemperaturecoefficientintheFLXA202/FLXA21converter.
Whenthetemperaturecoefficientalreadysetisaccurate,theconductivitytobedisplayedmust be constant regardless of liquid temperature. The following check will make sure that the temperaturecoefficientalreadysetisaccurate.If, when the liquid temperature is lowered, a larger conductivity value is indicated, the temperaturecoefficientalreadysetistoosmall.Theoppositealsoapplies.Ifasmallerconductivityvalueisindicated,thetemperaturecoefficientalreadysetistoolarge.Ineithercase,changethetemperaturecoefficientsothattheconductivityno longer changes.
l MatrixMatrix means temperature compensation with the temperature compensation matrix.Thetemperaturecompensationmatrixisatableofconductivityvaluesatdifferenttemperaturesand concentrations.Ready-madematrixesanduser-definedmatrixesareavailable.
<Ready-made matrixes>Ready-made temperature compensation matrixes are available for common inorganic acids and bases.
Table 2 Ready-made temperature compensation matrixes
Select matrix Compound to be measured Concentration Temperature Details
Sulfunicacid1..5% H2SO4 1to5% 0 to 100˚C Table ASulfunicacid0..27% H2SO4 0to27% -1.1to98.9˚C Table BSulfunicacid39..85% H2SO4 39to85% -17.8to115.6˚C Table CSulfunicacid93..100% H2SO4 93to100% 10to90˚C Table DHCl1..5% HCl 1to5% 0to60˚C Table EHCl0..18% HCI 0to18.2% -10to65˚C Table FHCl24..44% HCI 23.7to43.8% -20to65˚C Table GHNO31..5% HNO3 1to5% 0to80˚C TableHHNO30..25% HNO3 0to24.80% 0to80˚C Table IHNO335..88% HNO3 35.0to87.7% -16to60˚C Table JNaOH1..5% NaOH 1to5% 0to100˚C Table KNaOH0..15% NaOH 0to15% 0to100˚C Table LNaOH25..50% NaOH 25to50% 0to80˚C Table M
The ready-made temperature compensation matrixes are listed in Table A to M where temperatures are in the column and concentrations are in the rows.
App.
ISC

<Appendix 3 For ISC (Inductive Conductivity)> App.3-4
IM 12A01A02-01E 9th Edition : Mar. 23, 2018-00
Table A Sulfunic acid 1..5% (Conductivity unit: S/cm)Solutions
(Conc.)Temp.ranges
Solut.Min.
Solu-tion 2
Solu-tion 3
Solu-tion 4
Solu-tion 5
Solu-tion 6
Solu-tion 7
Solu-tion 8
Solu-tion 9
Solut.Max.
1.0 % 1.5 % 2.0 % 2.5 % 3.0 % 3.3 % 3.7 % 4.0 % 4.5 % 5.0 %Tmin. 0 C 0.0338 0.0487 0.0635 0.0793 0.0950 0.105 0.115 0.124 0.139 0.154
2. 10 C 0.0391 0.0571 0.0750 0.0931 0.111 0.123 0.134 0.146 0.163 0.1803. 20 C 0.0444 0.0655 0.0865 0.107 0.127 0.141 0.154 0.167 0.186 0.2054. 30 C 0.0491 0.0727 0.0963 0.119 0.141 0.156 0.172 0.186 0.207 0.2285. 40 C 0.0533 0.0789 0.104 0.129 0.154 0.170 0.187 0.203 0.226 0.2496. 50 C 0.0575 0.0850 0.113 0.139 0.166 0.184 0.202 0.220 0.245 0.2707. 63 C 0.0606 0.0899 0.119 0.148 0.177 0.196 0.216 0.235 0.262 0.2898. 75 C 0.0637 0.0949 0.126 0.157 0.189 0.209 0.229 0.249 0.278 0.3079. 88 C 0.0659 0.0988 0.132 0.165 0.197 0.218 0.240 0.261 0.291 0.322
Tmax. 100 C 0.0680 0.103 0.138 0.172 0.206 0.228 0.251 0.273 0.305 0.336Tref. 25.0 C 0.0470 0.0697 0.0923 0.114 0.135 0.149 0.164 0.178 0.198 0.218
Table B Sulfunic acid 0..27% (Conductivity unit: S/cm)Solutions
(Conc.)Temp.ranges
Solut.Min.
Solu-tion 2
Solu-tion 3
Solu-tion 4
Solu-tion 5
Solu-tion 6
Solu-tion 7
Solu-tion 8
Solu-tion 9
Solut.Max.
0 % 5 % 8 % 12 % 14 % 17 % 20 % 22 % 24 % 27 %Tmin. -1.1 C 0 0.1496 0.2330 0.3275 0.3695 0.4225 0.4640 0.4850 0.5005 0.5140
2. 10.0 C 0 0.1813 0.3845 0.4030 0.4355 0.5210 0.5725 0.5980 0.6160 0.63403. 21.1 C 0 0.2102 0.3330 0.4740 0.5335 0.6145 0.6805 0.7140 0.7385 0.76254. 32.2 C 0 0.2351 0.3740 0.5360 0.6070 0.7030 0.7810 0.8225 0.8540 0.88605. 43.3 C 0 0.2574 0.4130 0.5945 0.6735 0.7835 0.8755 0.9250 0.9635 1.00506. 54.4 C 0 0.2674 0.4450 0.6455 0.7315 0.8533 0.9600 1.0190 1.0660 1.11807. 60.0 C 0 0.2853 0.4600 0.6670 0.7570 0.8860 0.9980 1.0600 1.1110 1.17008. 71.1 C 0 0.3007 0.4860 0.7070 0.8060 0.9470 1.0710 1.1400 1.1970 1.26409. 87.8 C 0 0.3217 0.5210 0.7605 0.8665 1.0250 1.1630 1.2420 1.3100 1.3940
Tmax. 98.9 C 0 0.3335 0.5420 0.7885 0.9025 1.0650 1.2160 1.3020 1.3760 1.4690Tref. 25.0 C 0 0.2190 0.3470 0.4960 0.5590 0.6450 0.7160 0.7520 0.7790 0.8060
Table C Sulfunic acid 39..85% (Conductivity unit: S/cm)Solutions
(Conc.)Temp.ranges
Solut.Min.
Solu-tion 2
Solu-tion 3
Solu-tion 4
Solu-tion 5
Solu-tion 6
Solu-tion 7
Solu-tion 8
Solu-tion 9
Solut.Max.
39 % 44 % 50 % 55 % 60 % 65 % 70 % 75 % 80 % 85 %Tmin. -17.8 C 0.2775 0.2500 0.2125 0.1770 0.1385 0.1020 0.0710 0.0435 0.0140 0
2. 4.4 C 0.5225 0.4695 0.4000 0.3265 0.2750 0.2105 0.1500 0.0990 0.0655 0.06103. 21.1 C 0.7220 0.6590 0.5700 0.4670 0.3950 0.3085 0.2315 0.1650 0.1200 0.11004. 32.2 C 0.8600 0.7895 0.6870 0.5715 0.4870 0.3850 0.2950 0.2190 0.1655 0.15305. 43.3 C 0.9225 0.9190 0.8080 0.6770 0.5830 0.4670 0.3640 0.2785 0.2190 0.20406. 54.4 C 1.1250 1.0510 0.9305 0.7825 0.6770 0.5505 0.4400 0.3475 0.2825 0.26207. 65.6 C 1.2490 1.1760 1.0530 0.8950 0.7810 0.6430 0.5220 0.4210 0.3495 0.32558. 82.2 C 1.4340 1.3670 1.2370 1.0640 0.9390 0.7900 0.6570 0.5430 0.4620 0.43159. 98.9 C 1.5950 1.5400 1.4150 1.2350 1.1000 0.9370 0.7960 0.6750 0.5880 0.5450
Tmax. 115.6 C 1.7350 1.6920 1.5660 1.4250 1.2600 1.0910 0.9345 0.8110 0.7190 0.6630Tref. 25.0 C 0.7700 0.7050 0.6110 0.5040 0.4270 0.3350 0.2530 0.1840 0.1360 0.1250
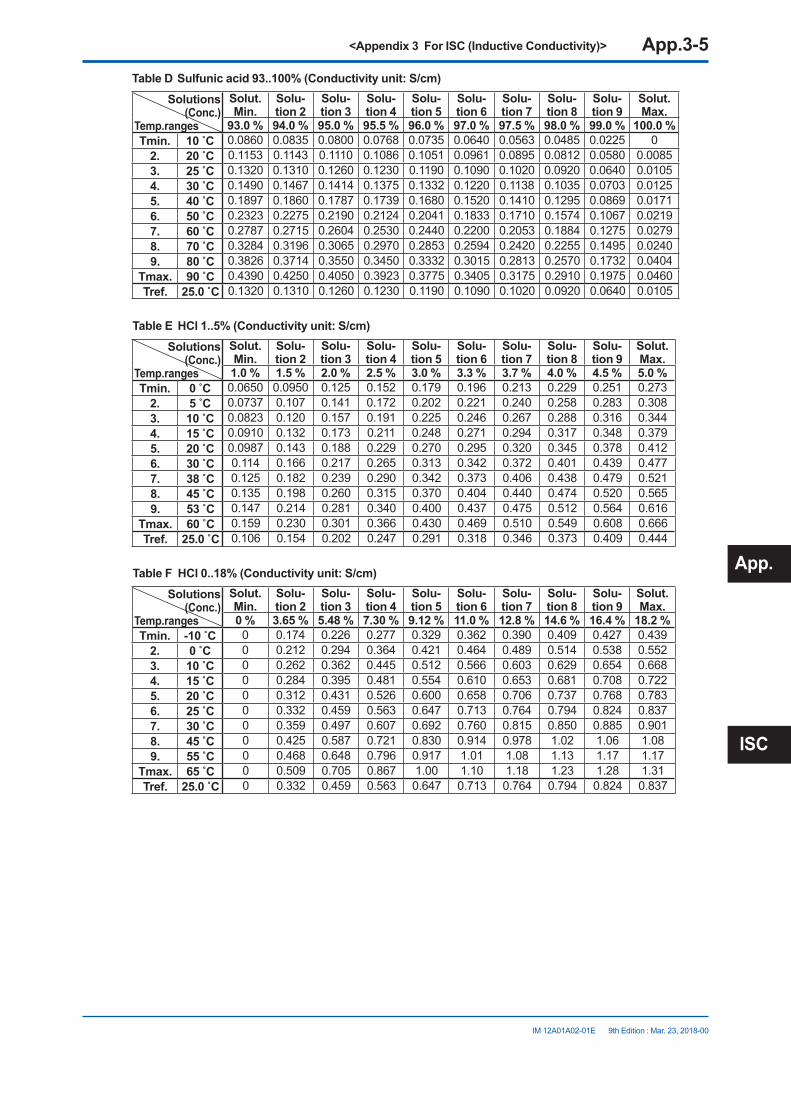
<Appendix 3 For ISC (Inductive Conductivity)> App.3-5
IM 12A01A02-01E 9th Edition : Mar. 23, 2018-00
Table D Sulfunic acid 93..100% (Conductivity unit: S/cm)Solutions
(Conc.)Temp.ranges
Solut.Min.
Solu-tion 2
Solu-tion 3
Solu-tion 4
Solu-tion 5
Solu-tion 6
Solu-tion 7
Solu-tion 8
Solu-tion 9
Solut.Max.
93.0 % 94.0 % 95.0 % 95.5 % 96.0 % 97.0 % 97.5 % 98.0 % 99.0 % 100.0 %Tmin. 10 C 0.0860 0.0835 0.0800 0.0768 0.0735 0.0640 0.0563 0.0485 0.0225 0
2. 20 C 0.1153 0.1143 0.1110 0.1086 0.1051 0.0961 0.0895 0.0812 0.0580 0.00853. 25 C 0.1320 0.1310 0.1260 0.1230 0.1190 0.1090 0.1020 0.0920 0.0640 0.01054. 30 C 0.1490 0.1467 0.1414 0.1375 0.1332 0.1220 0.1138 0.1035 0.0703 0.01255. 40 C 0.1897 0.1860 0.1787 0.1739 0.1680 0.1520 0.1410 0.1295 0.0869 0.01716. 50 C 0.2323 0.2275 0.2190 0.2124 0.2041 0.1833 0.1710 0.1574 0.1067 0.02197. 60 C 0.2787 0.2715 0.2604 0.2530 0.2440 0.2200 0.2053 0.1884 0.1275 0.02798. 70 C 0.3284 0.3196 0.3065 0.2970 0.2853 0.2594 0.2420 0.2255 0.1495 0.02409. 80 C 0.3826 0.3714 0.3550 0.3450 0.3332 0.3015 0.2813 0.2570 0.1732 0.0404
Tmax. 90 C 0.4390 0.4250 0.4050 0.3923 0.3775 0.3405 0.3175 0.2910 0.1975 0.0460Tref. 25.0 C 0.1320 0.1310 0.1260 0.1230 0.1190 0.1090 0.1020 0.0920 0.0640 0.0105
Table E HCl 1..5% (Conductivity unit: S/cm)Solutions
(Conc.)Temp.ranges
Solut.Min.
Solu-tion 2
Solu-tion 3
Solu-tion 4
Solu-tion 5
Solu-tion 6
Solu-tion 7
Solu-tion 8
Solu-tion 9
Solut.Max.
1.0 % 1.5 % 2.0 % 2.5 % 3.0 % 3.3 % 3.7 % 4.0 % 4.5 % 5.0 %Tmin. 0 C 0.0650 0.0950 0.125 0.152 0.179 0.196 0.213 0.229 0.251 0.273
2. 5 C 0.0737 0.107 0.141 0.172 0.202 0.221 0.240 0.258 0.283 0.3083. 10 C 0.0823 0.120 0.157 0.191 0.225 0.246 0.267 0.288 0.316 0.3444. 15 C 0.0910 0.132 0.173 0.211 0.248 0.271 0.294 0.317 0.348 0.3795. 20 C 0.0987 0.143 0.188 0.229 0.270 0.295 0.320 0.345 0.378 0.4126. 30 C 0.114 0.166 0.217 0.265 0.313 0.342 0.372 0.401 0.439 0.4777. 38 C 0.125 0.182 0.239 0.290 0.342 0.373 0.406 0.438 0.479 0.5218. 45 C 0.135 0.198 0.260 0.315 0.370 0.404 0.440 0.474 0.520 0.5659. 53 C 0.147 0.214 0.281 0.340 0.400 0.437 0.475 0.512 0.564 0.616
Tmax. 60 C 0.159 0.230 0.301 0.366 0.430 0.469 0.510 0.549 0.608 0.666Tref. 25.0 C 0.106 0.154 0.202 0.247 0.291 0.318 0.346 0.373 0.409 0.444
Table F HCl 0..18% (Conductivity unit: S/cm)Solutions
(Conc.)Temp.ranges
Solut.Min.
Solu-tion 2
Solu-tion 3
Solu-tion 4
Solu-tion 5
Solu-tion 6
Solu-tion 7
Solu-tion 8
Solu-tion 9
Solut.Max.
0 % 3.65 % 5.48 % 7.30 % 9.12 % 11.0 % 12.8 % 14.6 % 16.4 % 18.2 %Tmin. -10 C 0 0.174 0.226 0.277 0.329 0.362 0.390 0.409 0.427 0.439
2. 0 C 0 0.212 0.294 0.364 0.421 0.464 0.489 0.514 0.538 0.5523. 10 C 0 0.262 0.362 0.445 0.512 0.566 0.603 0.629 0.654 0.6684. 15 C 0 0.284 0.395 0.481 0.554 0.610 0.653 0.681 0.708 0.7225. 20 C 0 0.312 0.431 0.526 0.600 0.658 0.706 0.737 0.768 0.7836. 25 C 0 0.332 0.459 0.563 0.647 0.713 0.764 0.794 0.824 0.8377. 30 C 0 0.359 0.497 0.607 0.692 0.760 0.815 0.850 0.885 0.9018. 45 C 0 0.425 0.587 0.721 0.830 0.914 0.978 1.02 1.06 1.089. 55 C 0 0.468 0.648 0.796 0.917 1.01 1.08 1.13 1.17 1.17
Tmax. 65 C 0 0.509 0.705 0.867 1.00 1.10 1.18 1.23 1.28 1.31Tref. 25.0 C 0 0.332 0.459 0.563 0.647 0.713 0.764 0.794 0.824 0.837
App.
ISC
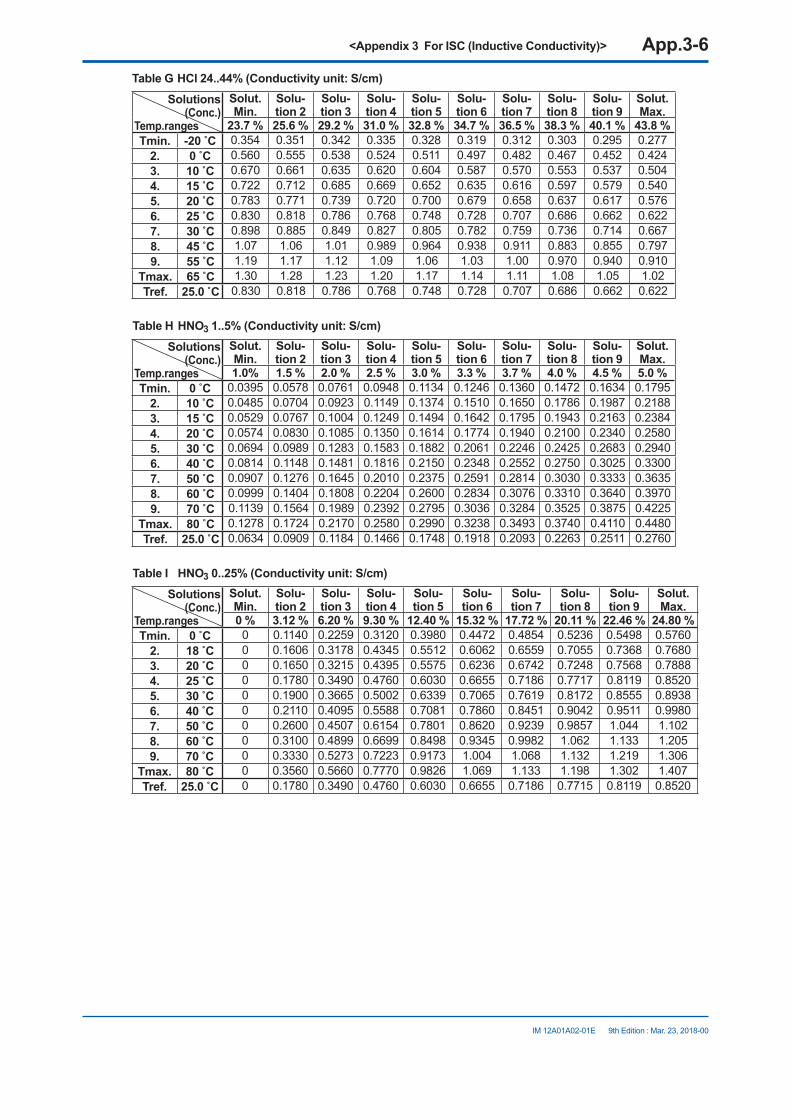
<Appendix 3 For ISC (Inductive Conductivity)> App.3-6
IM 12A01A02-01E 9th Edition : Mar. 23, 2018-00
Table G HCl 24..44% (Conductivity unit: S/cm)Solutions
(Conc.)Temp.ranges
Solut.Min.
Solu-tion 2
Solu-tion 3
Solu-tion 4
Solu-tion 5
Solu-tion 6
Solu-tion 7
Solu-tion 8
Solu-tion 9
Solut.Max.
23.7 % 25.6 % 29.2 % 31.0 % 32.8 % 34.7 % 36.5 % 38.3 % 40.1 % 43.8 %Tmin. -20 C 0.354 0.351 0.342 0.335 0.328 0.319 0.312 0.303 0.295 0.277
2. 0 C 0.560 0.555 0.538 0.524 0.511 0.497 0.482 0.467 0.452 0.4243. 10 C 0.670 0.661 0.635 0.620 0.604 0.587 0.570 0.553 0.537 0.5044. 15 C 0.722 0.712 0.685 0.669 0.652 0.635 0.616 0.597 0.579 0.5405. 20 C 0.783 0.771 0.739 0.720 0.700 0.679 0.658 0.637 0.617 0.5766. 25 C 0.830 0.818 0.786 0.768 0.748 0.728 0.707 0.686 0.662 0.6227. 30 C 0.898 0.885 0.849 0.827 0.805 0.782 0.759 0.736 0.714 0.6678. 45 C 1.07 1.06 1.01 0.989 0.964 0.938 0.911 0.883 0.855 0.7979. 55 C 1.19 1.17 1.12 1.09 1.06 1.03 1.00 0.970 0.940 0.910
Tmax. 65 C 1.30 1.28 1.23 1.20 1.17 1.14 1.11 1.08 1.05 1.02Tref. 25.0 C 0.830 0.818 0.786 0.768 0.748 0.728 0.707 0.686 0.662 0.622
Table H HNO3 1..5% (Conductivity unit: S/cm)Solutions
(Conc.)Temp.ranges
Solut.Min.
Solu-tion 2
Solu-tion 3
Solu-tion 4
Solu-tion 5
Solu-tion 6
Solu-tion 7
Solu-tion 8
Solu-tion 9
Solut.Max.
1.0% 1.5 % 2.0 % 2.5 % 3.0 % 3.3 % 3.7 % 4.0 % 4.5 % 5.0 %Tmin. 0 C 0.0395 0.0578 0.0761 0.0948 0.1134 0.1246 0.1360 0.1472 0.1634 0.1795
2. 10 C 0.0485 0.0704 0.0923 0.1149 0.1374 0.1510 0.1650 0.1786 0.1987 0.21883. 15 C 0.0529 0.0767 0.1004 0.1249 0.1494 0.1642 0.1795 0.1943 0.2163 0.23844. 20 C 0.0574 0.0830 0.1085 0.1350 0.1614 0.1774 0.1940 0.2100 0.2340 0.25805. 30 C 0.0694 0.0989 0.1283 0.1583 0.1882 0.2061 0.2246 0.2425 0.2683 0.29406. 40 C 0.0814 0.1148 0.1481 0.1816 0.2150 0.2348 0.2552 0.2750 0.3025 0.33007. 50 C 0.0907 0.1276 0.1645 0.2010 0.2375 0.2591 0.2814 0.3030 0.3333 0.36358. 60 C 0.0999 0.1404 0.1808 0.2204 0.2600 0.2834 0.3076 0.3310 0.3640 0.39709. 70 C 0.1139 0.1564 0.1989 0.2392 0.2795 0.3036 0.3284 0.3525 0.3875 0.4225
Tmax. 80 C 0.1278 0.1724 0.2170 0.2580 0.2990 0.3238 0.3493 0.3740 0.4110 0.4480Tref. 25.0 C 0.0634 0.0909 0.1184 0.1466 0.1748 0.1918 0.2093 0.2263 0.2511 0.2760
Table I HNO3 0..25% (Conductivity unit: S/cm)Solutions
(Conc.)Temp.ranges
Solut.Min.
Solu-tion 2
Solu-tion 3
Solu-tion 4
Solu-tion 5
Solu-tion 6
Solu-tion 7
Solu-tion 8
Solu-tion 9
Solut.Max.
0 % 3.12 % 6.20 % 9.30 % 12.40 % 15.32 % 17.72 % 20.11 % 22.46 % 24.80 %Tmin. 0 C 0 0.1140 0.2259 0.3120 0.3980 0.4472 0.4854 0.5236 0.5498 0.5760
2. 18 C 0 0.1606 0.3178 0.4345 0.5512 0.6062 0.6559 0.7055 0.7368 0.76803. 20 C 0 0.1650 0.3215 0.4395 0.5575 0.6236 0.6742 0.7248 0.7568 0.78884. 25 C 0 0.1780 0.3490 0.4760 0.6030 0.6655 0.7186 0.7717 0.8119 0.85205. 30 C 0 0.1900 0.3665 0.5002 0.6339 0.7065 0.7619 0.8172 0.8555 0.89386. 40 C 0 0.2110 0.4095 0.5588 0.7081 0.7860 0.8451 0.9042 0.9511 0.99807. 50 C 0 0.2600 0.4507 0.6154 0.7801 0.8620 0.9239 0.9857 1.044 1.1028. 60 C 0 0.3100 0.4899 0.6699 0.8498 0.9345 0.9982 1.062 1.133 1.2059. 70 C 0 0.3330 0.5273 0.7223 0.9173 1.004 1.068 1.132 1.219 1.306
Tmax. 80 C 0 0.3560 0.5660 0.7770 0.9826 1.069 1.133 1.198 1.302 1.407Tref. 25.0 C 0 0.1780 0.3490 0.4760 0.6030 0.6655 0.7186 0.7715 0.8119 0.8520

<Appendix 3 For ISC (Inductive Conductivity)> App.3-7
IM 12A01A02-01E 9th Edition : Mar. 23, 2018-00
Table J HNO3 35..88% (Conductivity unit: S/cm)Solutions
(Conc.)Temp.ranges
Solut.Min.
Solu-tion 2
Solu-tion 3
Solu-tion 4
Solu-tion 5
Solu-tion 6
Solu-tion 7
Solu-tion 8
Solu-tion 9
Solut.Max.
35.0 % 37.2 % 43.3 % 49.6 % 55.8 % 62.0 % 75.0 % 76.6 % 82.0 % 87.7 %Tmin. -16 C 0.412 0.400 0.368 0.334 0.288 0.254 0.163 0.147 0.089 0.044
2. 0 C 0.576 0.555 0.507 0.456 0.404 0.352 0.227 0.208 0.128 0.0603. 10 C 0.678 0.666 0.614 0.555 0.493 0.438 0.268 0.246 0.153 0.0694. 18 C 0.770 0.754 0.700 0.634 0.565 0.506 0.300 0.277 0.172 0.0775. 20 C 0.786 0.776 0.721 0.654 0.583 0.512 0.310 0.290 0.175 0.0796. 25 C 0.842 0.831 0.784 0.714 0.636 0.559 0.340 0.315 0.185 0.0817. 30 C 0.895 0.886 0.827 0.754 0.672 0.590 0.370 0.335 0.190 0.0838. 40 C 1.001 0.995 0.938 0.858 0.774 0.690 0.430 0.375 0.200 0.0879. 50 C 1.105 1.095 1.038 0.958 0.874 0.790 0.485 0.415 0.210 0.091
Tmax. 60 C 1.205 1.195 1.138 1.058 0.974 0.890 0.530 0.455 0.220 0.095Tref. 25.0 C 0.842 0.831 0.784 0.714 0.636 0.559 0.340 0.315 0.185 0.081
Table K NaOH 1..5% (Conductivity unit: S/cm)Solutions
(Conc.)Temp.ranges
Solut.Min.
Solu-tion 2
Solu-tion 3
Solu-tion 4
Solu-tion 5
Solu-tion 6
Solu-tion 7
Solu-tion 8
Solu-tion 9
Solut.Max.
1.0 % 1.5 % 2.0 % 2.5 % 3.0 % 3.3 % 3.7 % 4.0 % 4.5 % 5.0 %Tmin. 0 C 0.0310 0.0460 0.0610 0.0735 0.0860 0.0923 0.0987 0.105 0.116 0.127
2. 10 C 0.0398 0.0584 0.0770 0.0933 0.110 0.119 0.128 0.137 0.151 0.1653. 20 C 0.0486 0.0708 0.0930 0.113 0.133 0.145 0.157 0.169 0.186 0.2044. 30 C 0.0576 0.0833 0.109 0.133 0.157 0.172 0.187 0.202 0.222 0.2425. 40 C 0.0668 0.0959 0.125 0.154 0.182 0.200 0.217 0.235 0.258 0.2816. 50 C 0.0760 0.109 0.141 0.174 0.207 0.227 0.248 0.268 0.294 0.3197. 63 C 0.0868 0.124 0.162 0.199 0.236 0.258 0.281 0.304 0.334 0.3648. 75 C 0.0975 0.140 0.182 0.223 0.264 0.289 0.314 0.339 0.374 0.4089. 88 C 0.108 0.155 0.203 0.247 0.291 0.319 0.347 0.375 0.413 0.452
Tmax. 100 C 0.119 0.171 0.223 0.271 0.318 0.348 0.380 0.410 0.453 0.495Tref. 25.0 C 0.0530 0.0770 0.101 0.123 0.145 0.158 0.172 0.185 0.204 0.223
Table L NaOH 0..15% (Conductivity unit: S/cm)Solutions
(Conc.)Temp.ranges
Solut.Min.
Solu-tion 2
Solu-tion 3
Solu-tion 4
Solu-tion 5
Solu-tion 6
Solu-tion 7
Solu-tion 8
Solu-tion 9
Solut.Max.
0 % 1 % 3 % 4 % 5 % 6 % 8 % 10 % 12 % 15 %Tmin. 0 C 0 0.035 0.087 0.113 0.133 0.150 0.176 0.195 0.206 0.215
2. 10 C 0 0.042 0.109 0.140 0.167 0.190 0.226 0.255 0.274 0.2933. 18 C 0 0.047 0.125 0.163 0.195 0.221 0.267 0.303 0.327 0.3454. 25 C 0 0.052 0.142 0.183 0.222 0.256 0.313 0.355 0.381 0.4105. 30 C 0 0.056 0.153 0.200 0.242 0.278 0.338 0.389 0.424 0.4676. 40 C 0 0.063 0.179 0.233 0.281 0.323 0.396 0.458 0.502 0.5517. 50 C 0 0.070 0.201 0.265 0.320 0.368 0.454 0.527 0.580 0.6458. 60 C 0 0.080 0.223 0.293 0.355 0.410 0.507 0.592 0.658 0.7429. 80 C 0 0.100 0.270 0.350 0.425 0.493 0.612 0.721 0.814 0.936
Tmax. 100 C 0 0.119 0.315 0.407 0.495 0.574 0.717 0.850 0.967 1.130Tref. 25.0 C 0 0.052 0.142 0.183 0.222 0.256 0.313 0.355 0.381 0.410
App.
ISC

<Appendix 3 For ISC (Inductive Conductivity)> App.3-8
IM 12A01A02-01E 9th Edition : Mar. 23, 2018-00
Table M NaOH 25..50% (Conductivity unit: S/cm)Solutions
(Conc.)Temp.ranges
Solut.Min.
Solu-tion 2
Solu-tion 3
Solu-tion 4
Solu-tion 5
Solu-tion 6
Solu-tion 7
Solu-tion 8
Solu-tion 9
Solut.Max.
25 % 28 % 30 % 32 % 35 % 38 % 40 % 42 % 45 % 50 %Tmin. 0 C 0.140 0.100 0.075 0.060 0.040 0.024 0.017 0.012 0.010 0.007
2. 10 C 0.212 0.174 0.148 0.124 0.094 0.074 0.063 0.053 0.038 0.0253. 18 C 0.270 0.232 0.207 0.184 0.153 0.131 0.120 0.105 0.090 0.0784. 25 C 0.352 0.313 0.289 0.266 0.233 0.207 0.194 0.180 0.162 0.1465. 30 C 0.411 0.372 0.347 0.323 0.291 0.264 0.248 0.233 0.214 0.1956. 40 C 0.528 0.489 0.463 0.440 0.405 0.373 0.354 0.337 0.317 0.2937. 50 C 0.645 0.605 0.580 0.556 0.520 0.482 0.460 0.441 0.420 0.3908. 60 C 0.796 0.766 0.746 0.724 0.694 0.660 0.639 0.623 0.604 0.5709. 75 C 1.023 1.007 0.995 0.980 0.955 0.925 0.908 0.893 0.873 0.839
Tmax. 80 C 1.098 1.086 1.078 1.066 1.042 1.015 0.997 0.982 0.963 0.929Tref. 25.0 C 0.352 0.313 0.289 0.266 0.233 0.207 0.194 0.180 0.162 0.146
<User-defined matrixes>Theuser-definedtemperaturecompensationmatrixisamatrixdefinedbyusers.Entervaluesasshown in Table 3. The gray areas must be entered.
Table 3 Example of user-defined matrix (Reference temperature (Tref.): 25.0 C, Conductivity unit: S/cm)Solutions
(Conc.)Temp.ranges
Solut.Min.
Solut.Max.
Solu-tion 2
Solu-tion 3
Solu-tion 4
Solu-tion 5
Solu-tion 6
Solu-tion 7
Solu-tion 8
Solu-tion 9
0% 15% 1% 3% 4% 5% 6% 8% 10% 12%Tref. (25.0˚C) 0.013 0.410 0.052 0.142 0.183 0.222 0.256 0.313 0.355 0.381Tmin. 0 C 0.009 0.215 0.035 0.087 0.113 0.133 0.150 0.176 0.195 0.206Tmax. 100˚C 0.025 1.13 0.119 0.315 0.407 0.495 0.574 0.717 0.850 0.967
2. 10˚C 0.010 0.293 0.042 0.109 0.140 0.167 0.190 0.226 0.255 0.2743. 18˚C 0.012 0.357 0.047 0.125 0.163 0.195 0.221 0.267 0.303 0.3274. 25˚C 0.013 0.410 0.052 0.142 0.183 0.222 0.256 0.313 0.355 0.3815. 30˚C 0.014 0.468 0.056 0.153 0.200 0.242 0.278 0.338 0.389 0.4246. 40˚C 0.015 0.551 0.067 0.179 0.233 0.281 0.323 0.396 0.458 0.5027. 50˚C 0.017 0.645 0.070 0.201 0.265 0.320 0.368 0.454 0.527 0.5808. 60˚C 0.018 0.742 0.080 0.223 0.293 0.355 0.410 0.507 0.592 0.6589. 80˚C 0.021 0.936 0.100 0.270 0.350 0.425 0.493 0.612 0.721 0.814
Note: This table is as shown on the screen. The gray areas must be entered.
Set the reference temperature in the Temp. comp. screen (default: 25.0°C).
Input concentration values in the Solution screen.The values must be entered in ascending order from Solution (Min.) to Solution (Max.). Solution (Min.) and Solution (Max.) must be entered.Input temperatures for compensation in the Temp. ranges screen.Input the conductivity values* at respective temperatures in the Solution (Min.) screen and those in the Solution (Max.) screen. Input other values, if any, in the Solution n screen.*: Enter the precompensated conductivity.
Allcellsoftwouser-definedmatrixesareblankasadefault.Ifanycellsarenotblank,clearthem.
After entering all values, select “Check values?” to verify that there is no error.This function checks if the matrix is consistently incremental or decremental. If any error is found, itslocationisspecified.Ifthereisnoerror,thematrixiscompensatedlinearlyandtheblanksofthetable(ifany)arefilled.If some areas are left empty without running “Check values?”, a 1st/2nd comp. matrix error will be issued.

<Appendix 3 For ISC (Inductive Conductivity)> App.3-9
IM 12A01A02-01E 9th Edition : Mar. 23, 2018-00
n Temperature compensation errorThe temperature compensation error (alarm) is issued in any of the following cases.
l TCThe error is issued when:(measuredtemperature–referencetemperature)<–90/compensationcoefficientThedefaultofthetemperaturecompensationcoefficientis2.10%/°C.Forexample,whenthereferencetemperatureis25°C,thetemperaturecompensationcoefficientis2.10%/°Candthemeasuredtemperatureislowerthan–17.9°C,theerrorwillbeissued.Temperature compensation is performed even while an alarm is being issued.
l MatrixThe error is issued when the temperature or the precompensated conductivity is out of the range of the temperature compensation matrix.In this case, however, the temperature compensation is performed by extrapolation even while an alarm is being issued.
l AllWhen the conductivity is around zero, the temperature compensation error may be issued. In this case, the temperature compensation is not performed, and the precompensated conductivity is displayed.Whether the conductivity is around zero or not is determined by the temperature and conductivity of solutions. For example, when the temperature is 20°C and the conductivity is lower than 0.033 μS/cm,theconductivityisdeterminedtobearoundzero.When measuring the conductivity around zero in air calibration or when the conductivity to be measured is around zero, an alarm may be issued.
NOTETo display the precompensated conductivity, set the Method to “None”.SelectMeasurementsetup→Temp.compensation.
n Calibration solutions for conductivityThe calibration (cell constant) of a sensor does not change unless the sensor is damaged.It can also appear to change because of coating of the electrodes, or partial blockage. It does not make sense to regularly recalibrate the FLXA202/FLXA21.
Acalibrationcheck,however,isanothermatter.Whentheobjectiveisclearlydefinedasadiagnosticexercisearegularcheckcanbringanextralevelofsecurityandconfidencetothemeasurement.Sensordamage,and/orcoatingscanbedifficulttoseeandthecalibrationcheckcanconfirmtheir presence, by a deviation from the known solution conductivity. The remedial action should be to clean the sensor, and carefully check for blockage or damage (not simply to recalibrate).Higherconductivitysolutionsshouldbeusedwherepossible.Thelowertheconductivityofthetest solution, the easier it is to contaminate. Carbon dioxide from the air can be quickly absorbed to cause an error. All containers must be suitably clean, and all materials suitably pure. Outside of a well-equipped laboratory these conditions are hard to meet.
App.
ISC
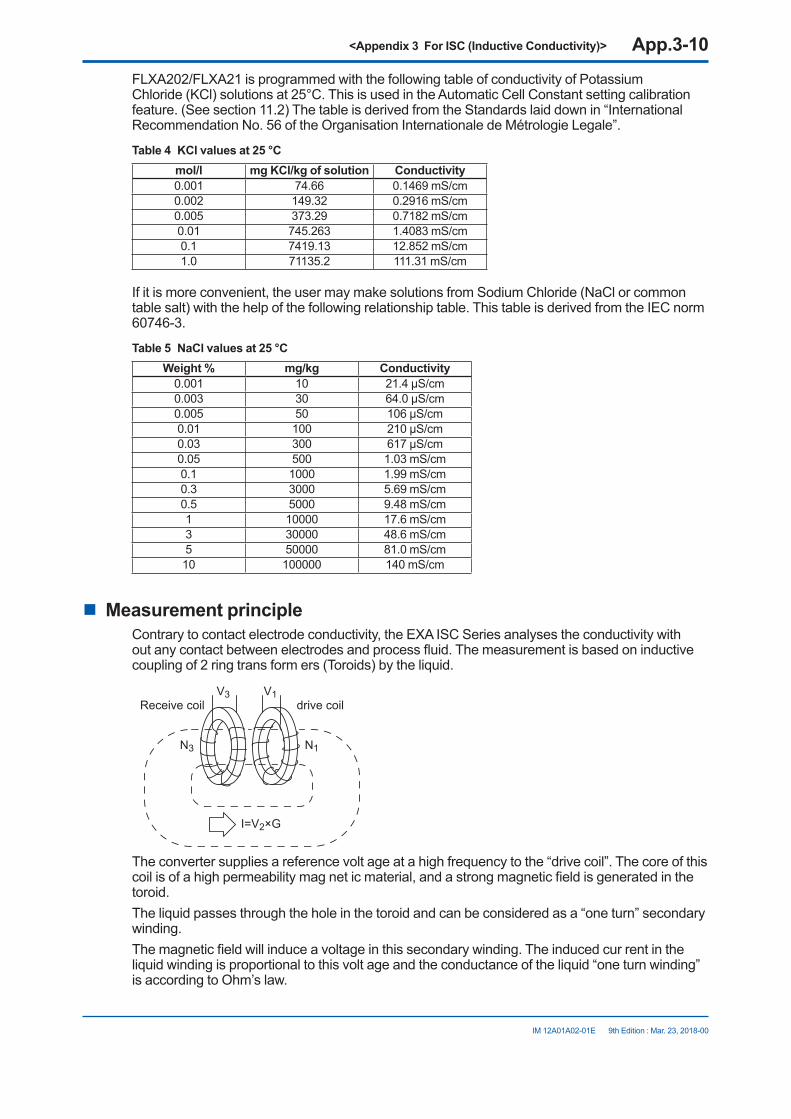
<Appendix 3 For ISC (Inductive Conductivity)> App.3-10
IM 12A01A02-01E 9th Edition : Mar. 23, 2018-00
FLXA202/FLXA21 is programmed with the following table of conductivity of Potassium Chloride (KCl) solutions at 25°C. This is used in the Automatic Cell Constant setting calibration feature. (See section 11.2) The table is derived from the Standards laid down in “International Recommendation No. 56 of the Organisation Internationale de Métrologie Legale”.
Table 4 KCl values at 25 °Cmol/l mg KCl/kg of solution Conductivity0.001 74.66 0.1469mS/cm0.002 149.32 0.2916 mS/cm0.005 373.29 0.7182 mS/cm0.01 745.263 1.4083mS/cm0.1 7419.13 12.852 mS/cm1.0 71135.2 111.31 mS/cm
If it is more convenient, the user may make solutions from Sodium Chloride (NaCl or common table salt) with the help of the following relationship table. This table is derived from the IEC norm 60746-3.
Table 5 NaCl values at 25 °CWeight % mg/kg Conductivity
0.001 10 21.4µS/cm0.003 30 64.0µS/cm0.005 50 106µS/cm0.01 100 210µS/cm0.03 300 617µS/cm0.05 500 1.03 mS/cm0.1 1000 1.99 mS/cm0.3 3000 5.69 mS/cm0.5 5000 9.48mS/cm1 10000 17.6 mS/cm3 30000 48.6mS/cm5 50000 81.0 mS/cm10 100000 140mS/cm
n Measurement principleContrary to contact electrode conductivity, the EXA ISC Series analyses the conductivity with outanycontactbetweenelectrodesandprocessfluid.Themeasurementisbasedoninductivecoupling of 2 ring trans form ers (Toroids) by the liquid.
V3 V1
N3 N1
drive coilReceive coil
I=V2×G
The converter supplies a reference volt age at a high frequency to the “drive coil”. The core of this coilisofahighpermeabilitymagneticmaterial,andastrongmagneticfieldisgeneratedinthetoroid.The liquid passes through the hole in the toroid and can be considered as a “one turn” secondary winding.Themagneticfieldwillinduceavoltageinthissecondarywinding.Theinducedcurrentintheliquid winding is proportional to this volt age and the conductance of the liquid “one turn winding” is according to Ohm’s law.
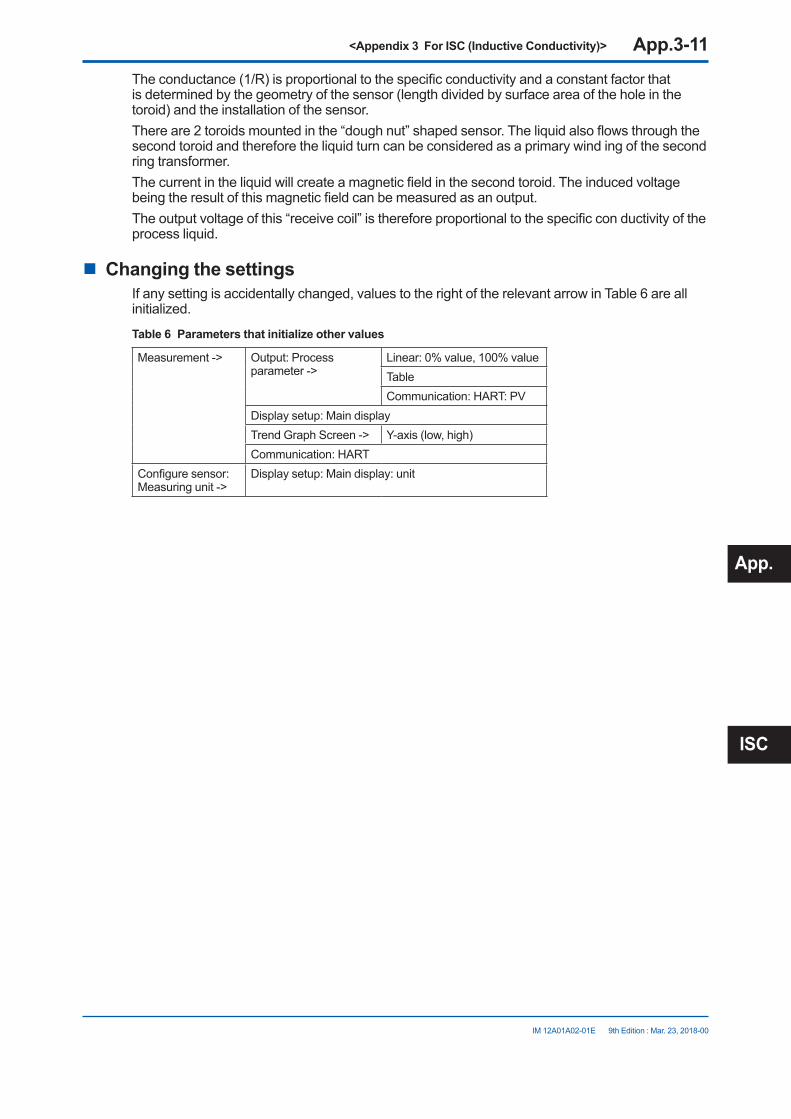
<Appendix 3 For ISC (Inductive Conductivity)> App.3-11
IM 12A01A02-01E 9th Edition : Mar. 23, 2018-00
Theconductance(1/R)isproportionaltothespecificconductivityandaconstantfactorthatis determined by the geometry of the sensor (length divided by surface area of the hole in the toroid) and the installation of the sensor.Thereare2toroidsmountedinthe“doughnut”shapedsensor.Theliquidalsoflowsthroughthesecond toroid and therefore the liquid turn can be considered as a primary wind ing of the second ring transformer.Thecurrentintheliquidwillcreateamagneticfieldinthesecondtoroid.Theinducedvoltagebeingtheresultofthismagneticfieldcanbemeasuredasanoutput.Theoutputvoltageofthis“receivecoil”isthereforeproportionaltothespecificconductivityoftheprocess liquid.
n Changing the settingsIf any setting is accidentally changed, values to the right of the relevant arrow in Table 6 are all initialized.
Table 6 Parameters that initialize other values
Measurement -> Output: Process parameter ->
Linear:0%value,100%valueTableCommunication:HART:PV
Display setup: Main displayTrend Graph Screen -> Y-axis (low, high)Communication:HART
Configuresensor:Measuring unit ->
Display setup: Main display: unit
App.
ISC

Blank Page
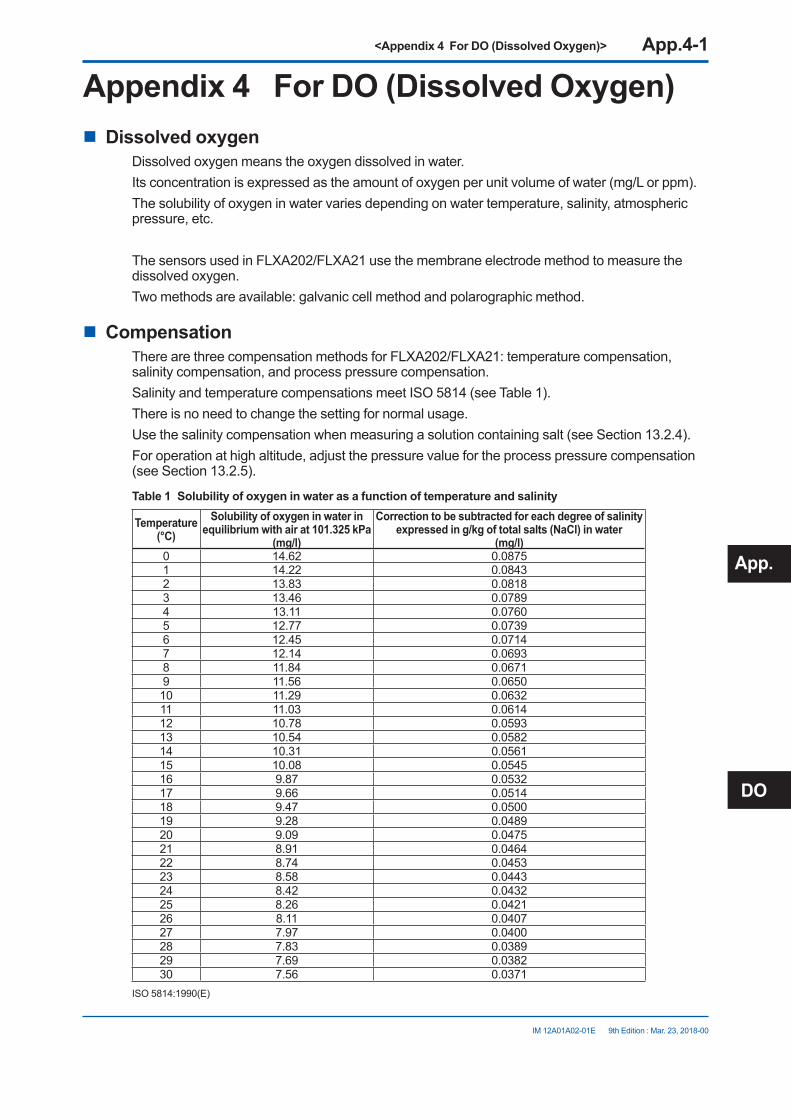
<Appendix 4 For DO (Dissolved Oxygen)> App.4-1
IM 12A01A02-01E 9th Edition : Mar. 23, 2018-00
Appendix 4 For DO (Dissolved Oxygen)n Dissolved oxygen
Dissolved oxygen means the oxygen dissolved in water.Its concentration is expressed as the amount of oxygen per unit volume of water (mg/L or ppm).The solubility of oxygen in water varies depending on water temperature, salinity, atmospheric pressure, etc.
The sensors used in FLXA202/FLXA21 use the membrane electrode method to measure the dissolved oxygen.Two methods are available: galvanic cell method and polarographic method.
n CompensationThere are three compensation methods for FLXA202/FLXA21: temperature compensation, salinity compensation, and process pressure compensation.SalinityandtemperaturecompensationsmeetISO5814(seeTable1).There is no need to change the setting for normal usage.Usethesalinitycompensationwhenmeasuringasolutioncontainingsalt(seeSection13.2.4).For operation at high altitude, adjust the pressure value for the process pressure compensation (see Section 13.2.5).
Table 1 Solubility of oxygen in water as a function of temperature and salinity
Temperature(°C)
Solubility of oxygen in water in equilibrium with air at 101.325 kPa
(mg/l)
Correction to be subtracted for each degree of salinity expressed in g/kg of total salts (NaCl) in water
(mg/l)0 14.62 0.08751 14.22 0.08432 13.83 0.08183 13.46 0.07894 13.11 0.07605 12.77 0.07396 12.45 0.07147 12.14 0.06938 11.84 0.06719 11.56 0.065010 11.29 0.063211 11.03 0.061412 10.78 0.059313 10.54 0.058214 10.31 0.056115 10.08 0.054516 9.87 0.053217 9.66 0.051418 9.47 0.050019 9.28 0.048920 9.09 0.047521 8.91 0.046422 8.74 0.045323 8.58 0.044324 8.42 0.043225 8.26 0.042126 8.11 0.040727 7.97 0.040028 7.83 0.038929 7.69 0.038230 7.56 0.0371
ISO5814:1990(E)
App.
DO

<Appendix 4 For DO (Dissolved Oxygen)> App.4-2
IM 12A01A02-01E 9th Edition : Mar. 23, 2018-00
Table 2 Solubility of oxygen in water as a function of temperature and pressure
Temperature(°C)
Pressure [kPa (atm) *1]111.5 (1.1) 101.3 (1.0) 91.2 (0.9) 81.1 (0.8) 70.9 (0.7) 60.8 (0.6) 50.7 (0.5)
Solubility (mg/l)0.05.010.015.0
16.0914.0612.4311.10
13.1411.4810.159.05
11.6910.209.008.03
10.218.917.867.01
8.747.626.715.98
8.747.626.715.98
7.276.345.584.96
20.025.030.035.040.0
10.029.128.357.697.10
8.147.406.766.225.72
7.236.565.995.475.03
6.305.705.194.754.34
5.374.844.604.013.65
5.374.844.604.013.65
4.444.003.623.282.96
ISO5814:1990(E)*1: Unitsatstandardbarometricpressure(normalatmosphericpressureatsealevel):101.325kPa=101.325kN/m2=1atm=760
mmHg
Table 3 Variation of atmospheric pressure with respect to altitude
Altitude (m) Mean atmospheric pressure (kPa)0
100200300400
101.3100.198.897.696.4
5006007008009001000
95.294.092.891.790.589.4
11001200130014001500
88.387.286.185.084.0
160017001800190020002100
82.981.980.979.978.977.9
ISO5814:1990(E)
n Changing the settingsIfanysettingisaccidentallychanged,valuestotherightoftherelevantarrowinTable4areallinitialized.
Table 4 Parameters that initialize other values
Sensor type -> Sensor sensitivityCalibration settings: Limits and timing: Zero, Slope (low, high)
Output: Process parameter -> Linear:0%value,100%valueTableCommunication:HART:PV
Trend Graph Screen -> Y-axis (low, high)Communication:HART
Configuresensor:Unit-> Trend: Y-axis: Limits: Oxygen (low, high)
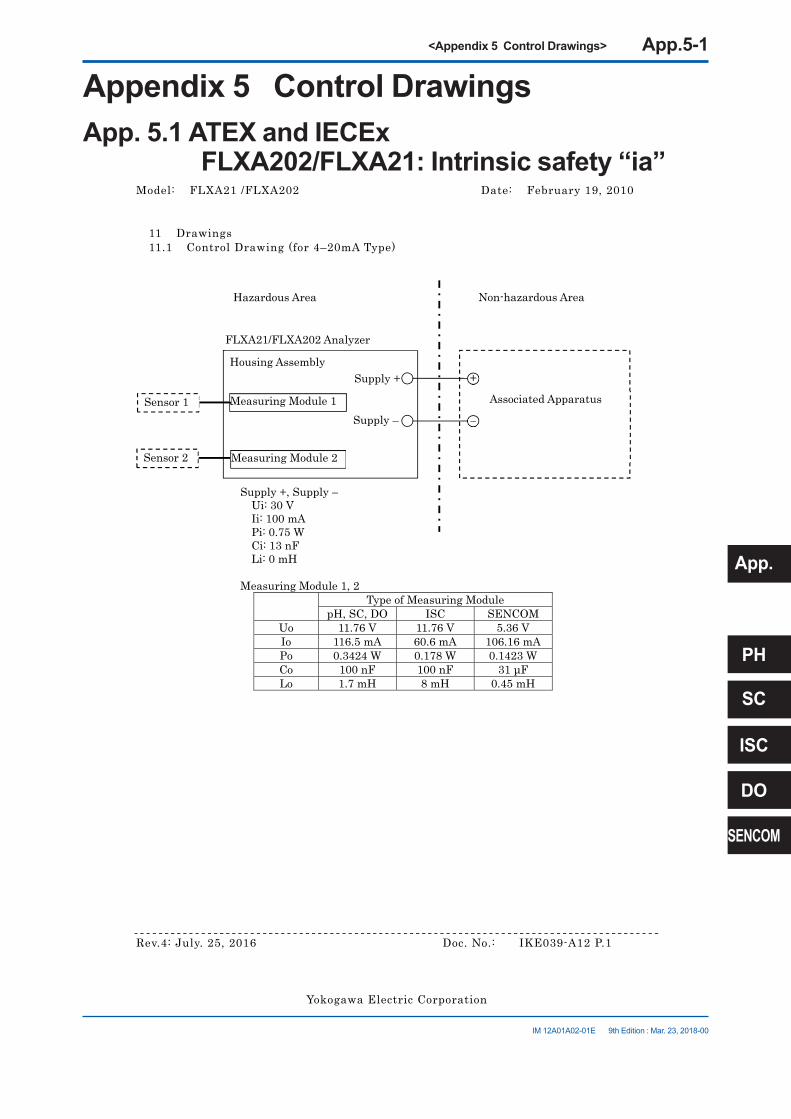
<Appendix 5 Control Drawings> App.5-1
IM 12A01A02-01E 9th Edition : Mar. 23, 2018-00
Appendix 5 Control DrawingsApp. 5.1 ATEX and IECEx
FLXA202/FLXA21: Intrinsic safety “ia”Model: FLXA21 /FLXA202 Date: February 19, 2010
Rev.4: July. 25, 2016 Doc. No.: IKE039-A12 P.1
Yokogawa Electric Corporation
11 Drawings 11.1 Control Drawing (for 4–20mA Type)
Supply +, Supply – Ui: 30 V Ii: 100 mA Pi: 0.75 W Ci: 13 nF Li: 0 mH Measuring Module 1, 2
Type of Measuring ModulepH, SC, DO ISC SENCOM
Uo 11.76 V 11.76 V 5.36 V Io 116.5 mA 60.6 mA 106.16 mA Po 0.3424 W 0.178 W 0.1423 W Co 100 nF 100 nF 31 μF Lo 1.7 mH 8 mH 0.45 mH
Non-hazardous Area
Supply + +
–Supply –
Housing Assembly
Measuring Module 1
Measuring Module 2
FLXA21/FLXA202 Analyzer
Sensor 1
Sensor 2
Hazardous Area
Associated Apparatus
App.
DO
PH
ISC
SENCOM
SC
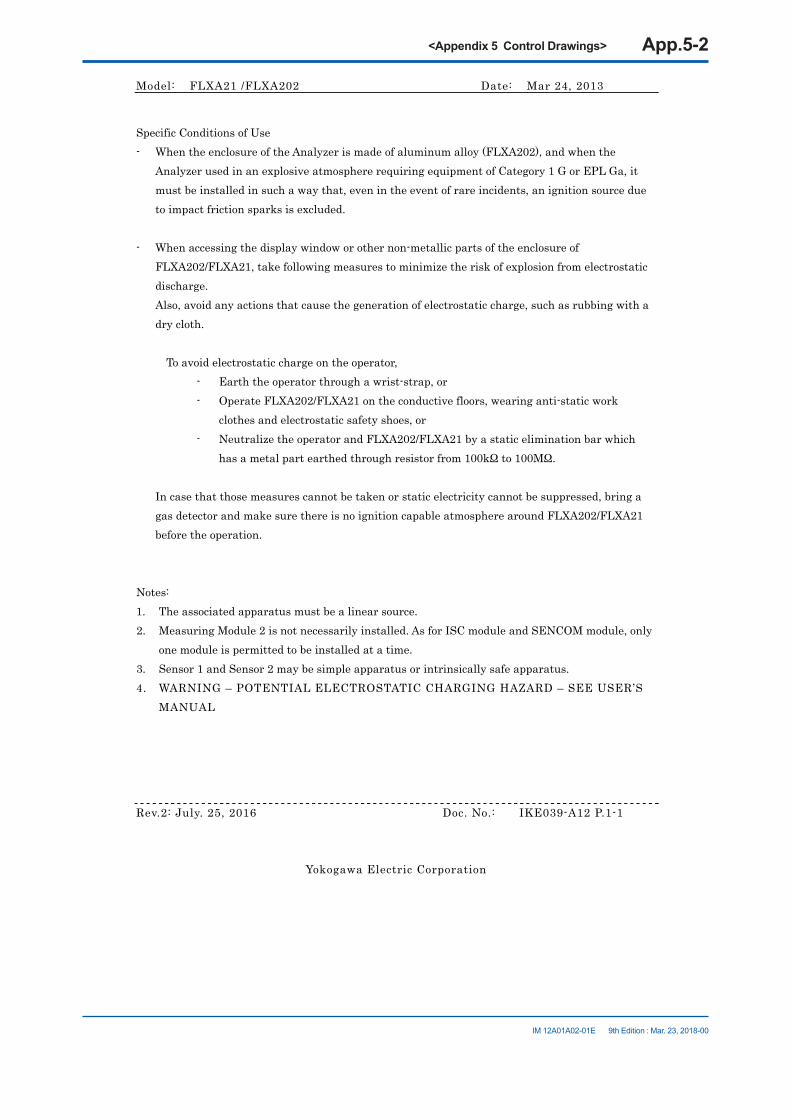
<Appendix 5 Control Drawings> App.5-2
IM 12A01A02-01E 9th Edition : Mar. 23, 2018-00
Model: FLXA21 /FLXA202 Date: Mar 24, 2013
Rev.2: July. 25, 2016 Doc. No.: IKE039-A12 P.1-1
Yokogawa Electric Corporation
Specific Conditions of Use - When the enclosure of the Analyzer is made of aluminum alloy (FLXA202), and when the
Analyzer used in an explosive atmosphere requiring equipment of Category 1 G or EPL Ga, it must be installed in such a way that, even in the event of rare incidents, an ignition source due to impact friction sparks is excluded.
- When accessing the display window or other non-metallic parts of the enclosure of FLXA202/FLXA21, take following measures to minimize the risk of explosion from electrostatic discharge. Also, avoid any actions that cause the generation of electrostatic charge, such as rubbing with a dry cloth.
To avoid electrostatic charge on the operator, - Earth the operator through a wrist-strap, or - Operate FLXA202/FLXA21 on the conductive floors, wearing anti-static work
clothes and electrostatic safety shoes, or - Neutralize the operator and FLXA202/FLXA21 by a static elimination bar which
has a metal part earthed through resistor from 100kΩ to 100MΩ.
In case that those measures cannot be taken or static electricity cannot be suppressed, bring a gas detector and make sure there is no ignition capable atmosphere around FLXA202/FLXA21 before the operation.
Notes: 1. The associated apparatus must be a linear source. 2. Measuring Module 2 is not necessarily installed. As for ISC module and SENCOM module, only
one module is permitted to be installed at a time. 3. Sensor 1 and Sensor 2 may be simple apparatus or intrinsically safe apparatus. 4. WARNING – POTENTIAL ELECTROSTATIC CHARGING HAZARD – SEE USER’S
MANUAL
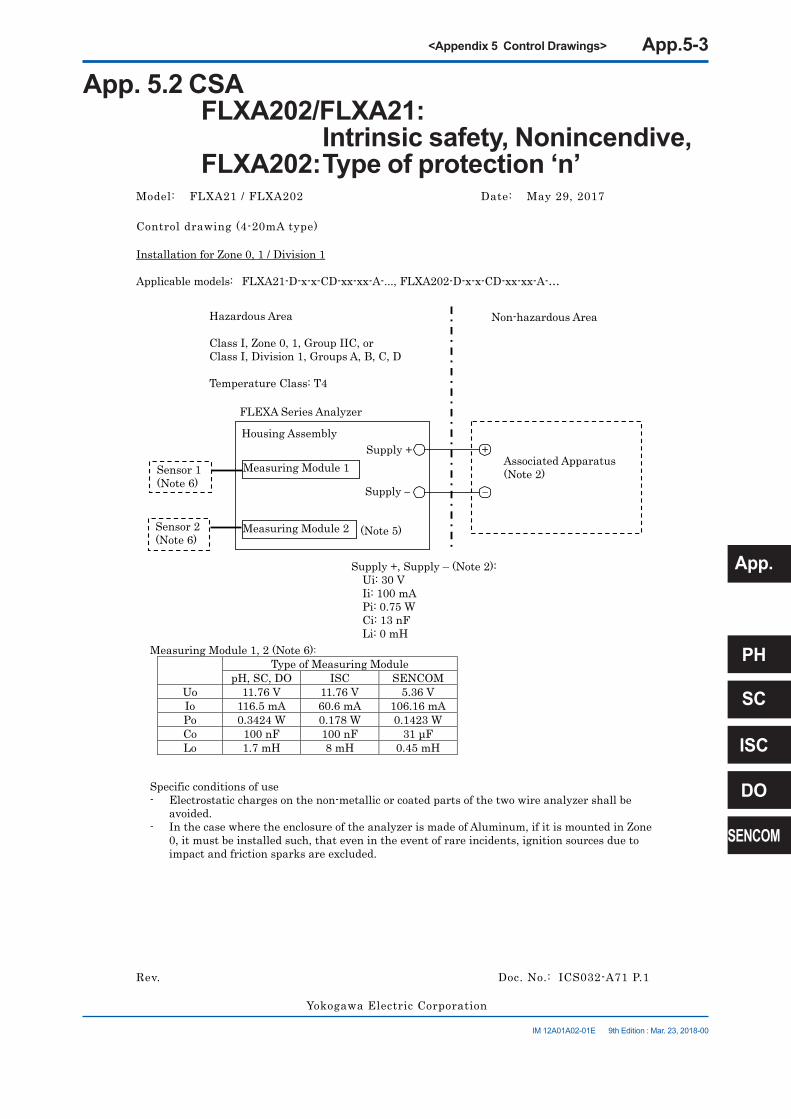
<Appendix 5 Control Drawings> App.5-3
IM 12A01A02-01E 9th Edition : Mar. 23, 2018-00
App. 5.2 CSA FLXA202/FLXA21: Intrinsic safety, Nonincendive, FLXA202: Type of protection ‘n’
Model: FLXA21 / FLXA202 Date: May 29, 2017
Rev. Doc. No.: ICS032-A71 P.1
Yokogawa Electric Corporation
Control drawing (4-20mA type) Installation for Zone 0, 1 / Division 1 Applicable models: FLXA21-D-x-x-CD-xx-xx-A-..., FLXA202-D-x-x-CD-xx-xx-A-…
Non-hazardous AreaHazardous Area Class I, Zone 0, 1, Group IIC, or Class I, Division 1, Groups A, B, C, D Temperature Class: T4
Supply +
Supply –
Housing Assembly
Measuring Module 1
Measuring Module 2
FLEXA Series Analyzer
Sensor 1 (Note 6)
Sensor 2 (Note 6)
Measuring Module 1, 2 (Note 6): Type of Measuring Module
pH, SC, DO ISC SENCOMUo 11.76 V 11.76 V 5.36 VIo 116.5 mA 60.6 mA 106.16 mAPo 0.3424 W 0.178 W 0.1423 WCo 100 nF 100 nF 31 μFLo 1.7 mH 8 mH 0.45 mH
Specific conditions of use - Electrostatic charges on the non-metallic or coated parts of the two wire analyzer shall be
avoided. - In the case where the enclosure of the analyzer is made of Aluminum, if it is mounted in Zone
0, it must be installed such, that even in the event of rare incidents, ignition sources due to impact and friction sparks are excluded.
+Associated Apparatus(Note 2)
–
Supply +, Supply – (Note 2): Ui: 30 V Ii: 100 mA Pi: 0.75 W Ci: 13 nF Li: 0 mH
(Note 5)
App.
DO
PH
ISC
SENCOM
SC
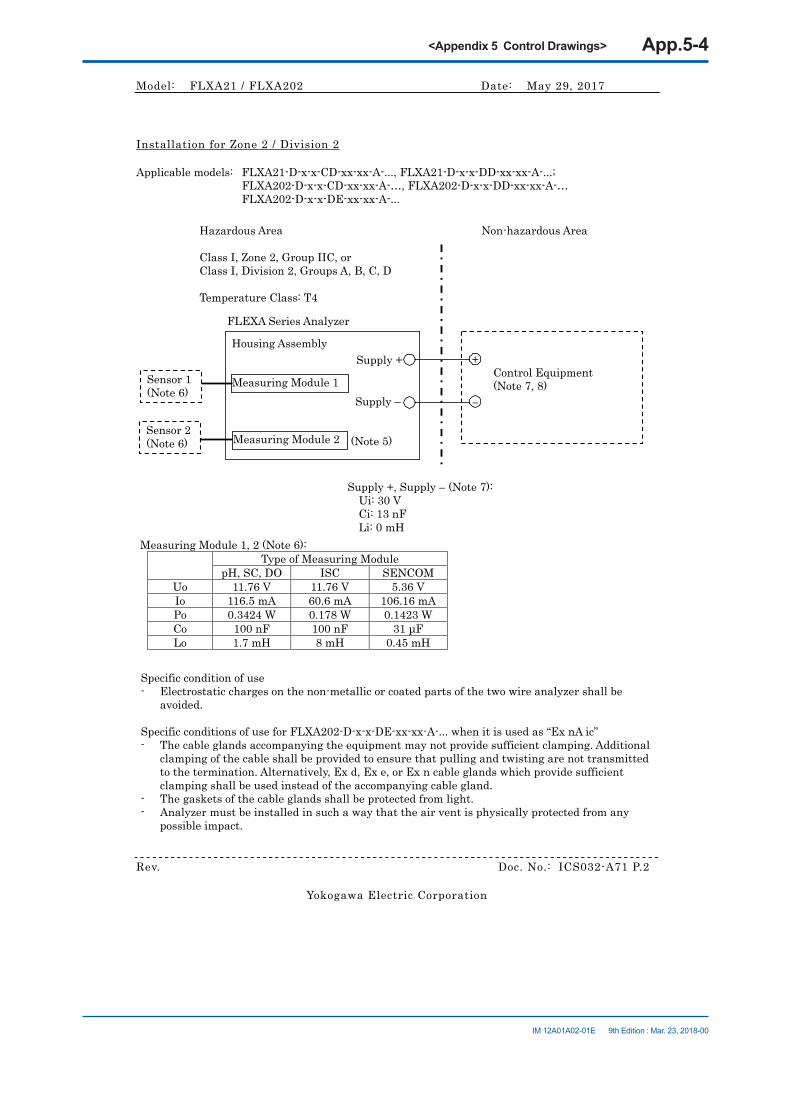
<Appendix 5 Control Drawings> App.5-4
IM 12A01A02-01E 9th Edition : Mar. 23, 2018-00
Model: FLXA21 / FLXA202 Date: May 29, 2017
Rev. Doc. No.: ICS032-A71 P.2
Yokogawa Electric Corporation
Installation for Zone 2 / Division 2 Applicable models: FLXA21-D-x-x-CD-xx-xx-A-..., FLXA21-D-x-x-DD-xx-xx-A-...; FLXA202-D-x-x-CD-xx-xx-A-…, FLXA202-D-x-x-DD-xx-xx-A-… FLXA202-D-x-x-DE-xx-xx-A-...
Non-hazardous AreaHazardous Area Class I, Zone 2, Group IIC, or Class I, Division 2, Groups A, B, C, D Temperature Class: T4
Supply +, Supply – (Note 7): Ui: 30 V Ci: 13 nF Li: 0 mH
Measuring Module 1, 2 (Note 6): Type of Measuring Module
pH, SC, DO ISC SENCOMUo 11.76 V 11.76 V 5.36 VIo 116.5 mA 60.6 mA 106.16 mAPo 0.3424 W 0.178 W 0.1423 WCo 100 nF 100 nF 31 μFLo 1.7 mH 8 mH 0.45 mH
Supply +
Supply –
Housing Assembly
Measuring Module 1
Measuring Module 2
FLEXA Series Analyzer
Sensor 1 (Note 6)
Sensor 2 (Note 6)
+Control Equipment(Note 7, 8)
–
(Note 5)
Specific condition of use - Electrostatic charges on the non-metallic or coated parts of the two wire analyzer shall be
avoided. Specific conditions of use for FLXA202-D-x-x-DE-xx-xx-A-... when it is used as “Ex nA ic” - The cable glands accompanying the equipment may not provide sufficient clamping. Additional
clamping of the cable shall be provided to ensure that pulling and twisting are not transmitted to the termination. Alternatively, Ex d, Ex e, or Ex n cable glands which provide sufficient clamping shall be used instead of the accompanying cable gland.
- The gaskets of the cable glands shall be protected from light. - Analyzer must be installed in such a way that the air vent is physically protected from any
possible impact.

<Appendix 5 Control Drawings> App.5-5
IM 12A01A02-01E 9th Edition : Mar. 23, 2018-00
Model: FLXA21 / FLXA202 Date: May 29, 2017
Rev. Doc. No.: ICS032-A71 P.3
Yokogawa Electric Corporation
Notes: 1. Installation must be in accordance with the Canadian Electric Code Part I (C22.1),
ANSI/ISA-RP12.06.01 and relevant local codes. 2. The associated apparatus must be a linear source meeting the following conditions.
Uo (or Voc) ≤ Ui Io (or Isc) ≤ Ii Po ≤ Pi Co (or Ca) ≥ Ci + Ccable Lo (or La) ≥ Li + Lcable
3. Control equipment connected to the associated apparatus must not use or generate a
voltage which exceeds Um of the associated apparatus. 4. The control drawing of the associated apparatus must be followed when installing the
equipment. 5. Measuring Module 2 is not always installed. As for ISC module and SENCOM module,
only one module is permitted to be installed at a time. 6. When installed in Zone 0 or 1, or Division 1, Sensor 1 and Sensor 2 may be simple
apparatus or intrinsically safe apparatus meeting the conditions below. When installed in Zone 2 or Division 2, Sensor 1 and Sensor 2 may be simple apparatus or
non-incendive field wiring apparatus meeting the conditions below, or alternatively, they may be equipment suitable for Zone 2 or Division 2 respectively, if a suitable wiring method other than non-incendive field wiring is employed.
Ui (or Vmax) ≥ Uo Ii (or Imax) ≥ Io Pi ≥ Po Ci ≤ Co – Ccable Li ≤ Lo – Lcable
7. The control equipment must be an associated non-incendive field wiring apparatus meeting the conditions below. Alternatively, it may be general-purpose equipment, if a suitable wiring method other than non-incendive field wiring is employed.
Uo (or Voc) ≤ Ui Co (or Ca) ≥ Ci + Ccable Lo (or La) ≥ Li + Lcable
8. When FLXA202-D-x-x-DE-xx-xx-A-... is used as “Ex nA ic”, it must be installed in accordance with one of the following:
a) in a SELV or PELV system, or b) via a safety isolating transformer complying with the requirements of
IEC 61558-2-6, or a technically equivalent standard, or c) directly connected to apparatus complying with IEC60950 series, IEC61010-1,
or a technically equivalent standard, or d) fed directly from cells or batteries.
9. When FLXA202-D-x-x-DE-xx-xx-A-... is used as “Ex nA ic” and with the accompanying cable glands, cable with an external diameter of 6 to 12 mm must be used for field wiring. The cable glands must be secured with a tightening torque of 6 Nm so that they can be released only with the aid of a tool. Unused cable gland shall be sealed with the accompanying metal plug.
App.
DO
PH
ISC
SENCOM
SC
<Appendix 5 Control Drawings> App.5-6
IM 12A01A02-01E 9th Edition : Mar. 23, 2018-00
Model: FLXA21 / FLXA202 Date: May 29, 2017
Rev. Doc. No.: ICS032-A71 P.4
Yokogawa Electric Corporation
10. WARNING – POTENTIAL ELECTROSTATIC CHARGING HAZARD
AVERTISSEMENT – DANGER POTENTIEL DE CHARGES ÉLECTROSTATIQUES 11. WARNING – SUBSTITUTION OF COMPONENTS MAY IMPAIR INTRINSIC SAFETY
AVERTISSEMENT – LA SUBSTITUTION DE COMPOSANTS PEUT COMPROMETTRE LA SÉCURITÉ INTRINSÉQUE.
12. WARNING – SUBSTITUTION OF COMPONENTS MAY IMPAIR SUITABILITY FOR ZONE 2 / DIVISION 2 AVERTISSEMENT –LA SUBSTITUTION DE COMPOSANTS PEUT RENDRE CE MATÉRIEL INACCEPTABLE POUR LES EMPLACEMENTS DE ZONE 2 / DIVISION 2
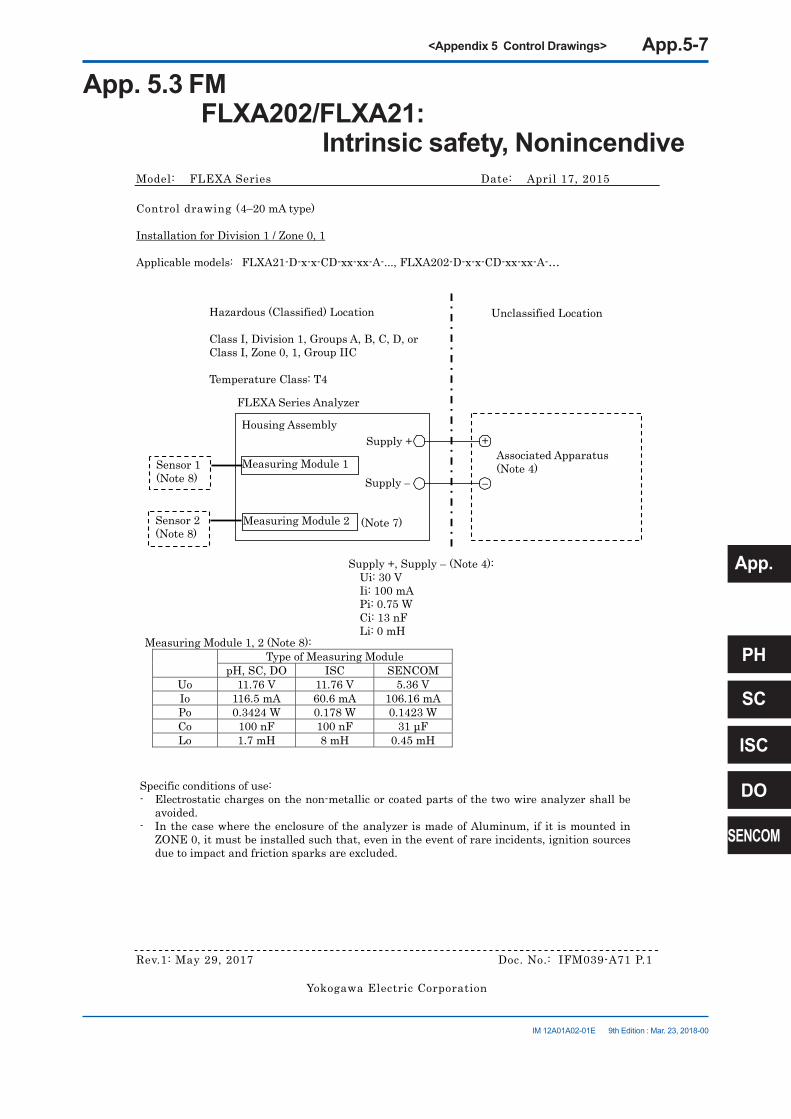
<Appendix 5 Control Drawings> App.5-7
IM 12A01A02-01E 9th Edition : Mar. 23, 2018-00
App. 5.3 FM FLXA202/FLXA21: Intrinsic safety, Nonincendive
Model: FLEXA Series Date: April 17, 2015
Rev.1: May 29, 2017 Doc. No.: IFM039-A71 P.1
Yokogawa Electric Corporation
Control drawing (4–20 mA type) Installation for Division 1 / Zone 0, 1 Applicable models: FLXA21-D-x-x-CD-xx-xx-A-..., FLXA202-D-x-x-CD-xx-xx-A-…
Unclassified LocationHazardous (Classified) Location Class I, Division 1, Groups A, B, C, D, or Class I, Zone 0, 1, Group IIC Temperature Class: T4
Measuring Module 1, 2 (Note 8):
Type of Measuring ModulepH, SC, DO ISC SENCOM
Uo 11.76 V 11.76 V 5.36 VIo 116.5 mA 60.6 mA 106.16 mAPo 0.3424 W 0.178 W 0.1423 WCo 100 nF 100 nF 31 μFLo 1.7 mH 8 mH 0.45 mH
Specific conditions of use: - Electrostatic charges on the non-metallic or coated parts of the two wire analyzer shall be
avoided. - In the case where the enclosure of the analyzer is made of Aluminum, if it is mounted in
ZONE 0, it must be installed such that, even in the event of rare incidents, ignition sourcesdue to impact and friction sparks are excluded.
Supply + +Associated Apparatus(Note 4)
–Supply –
Housing Assembly
Measuring Module 1
Measuring Module 2
FLEXA Series Analyzer
Sensor 1 (Note 8)
Sensor 2 (Note 8)
Supply +, Supply – (Note 4): Ui: 30 V Ii: 100 mA Pi: 0.75 W Ci: 13 nF Li: 0 mH
(Note 7)
App.
DO
PH
ISC
SENCOM
SC
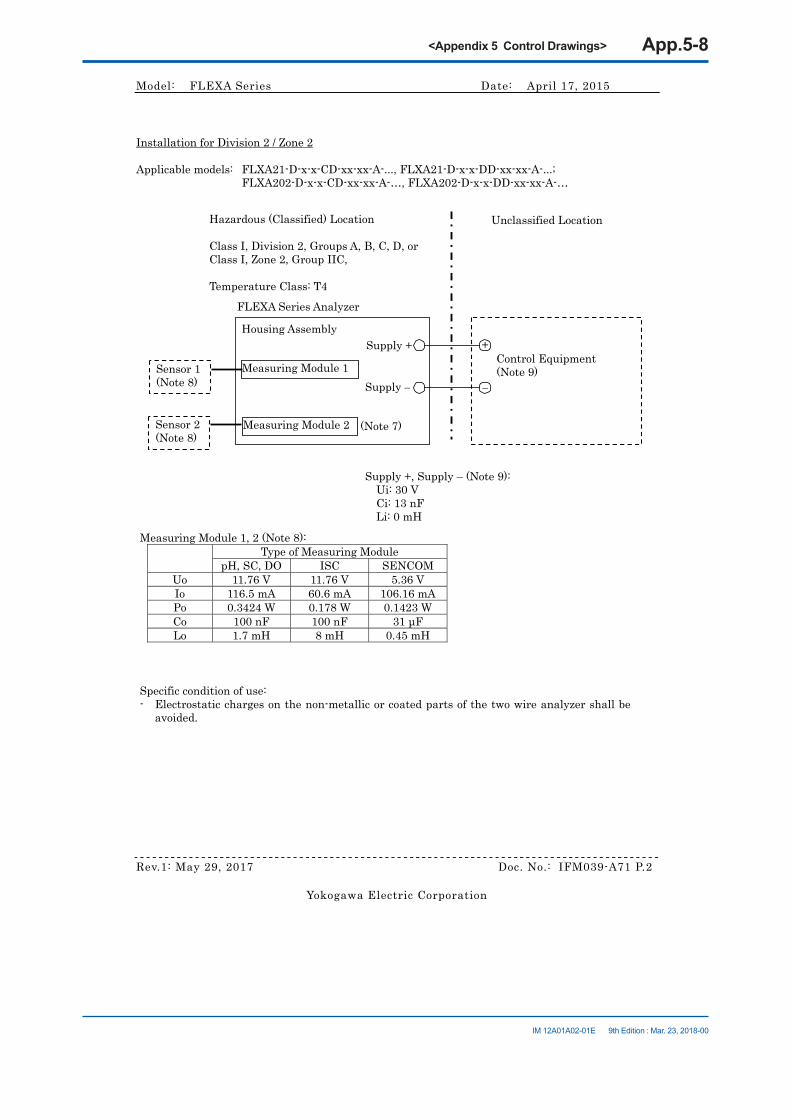
<Appendix 5 Control Drawings> App.5-8
IM 12A01A02-01E 9th Edition : Mar. 23, 2018-00
Model: FLEXA Series Date: April 17, 2015
Rev.1: May 29, 2017 Doc. No.: IFM039-A71 P.2
Yokogawa Electric Corporation
Installation for Division 2 / Zone 2 Applicable models: FLXA21-D-x-x-CD-xx-xx-A-..., FLXA21-D-x-x-DD-xx-xx-A-...; FLXA202-D-x-x-CD-xx-xx-A-…, FLXA202-D-x-x-DD-xx-xx-A-…
Unclassified LocationHazardous (Classified) Location Class I, Division 2, Groups A, B, C, D, or Class I, Zone 2, Group IIC, Temperature Class: T4
Measuring Module 1, 2 (Note 8): Type of Measuring Module
pH, SC, DO ISC SENCOMUo 11.76 V 11.76 V 5.36 VIo 116.5 mA 60.6 mA 106.16 mAPo 0.3424 W 0.178 W 0.1423 WCo 100 nF 100 nF 31 μFLo 1.7 mH 8 mH 0.45 mH
Specific condition of use: - Electrostatic charges on the non-metallic or coated parts of the two wire analyzer shall be
avoided.
Supply + +Control Equipment(Note 9)
–Supply –
Housing Assembly
Measuring Module 1
Measuring Module 2
FLEXA Series Analyzer
Sensor 1 (Note 8)
Sensor 2 (Note 8)
Supply +, Supply – (Note 9): Ui: 30 V Ci: 13 nF Li: 0 mH
(Note 7)
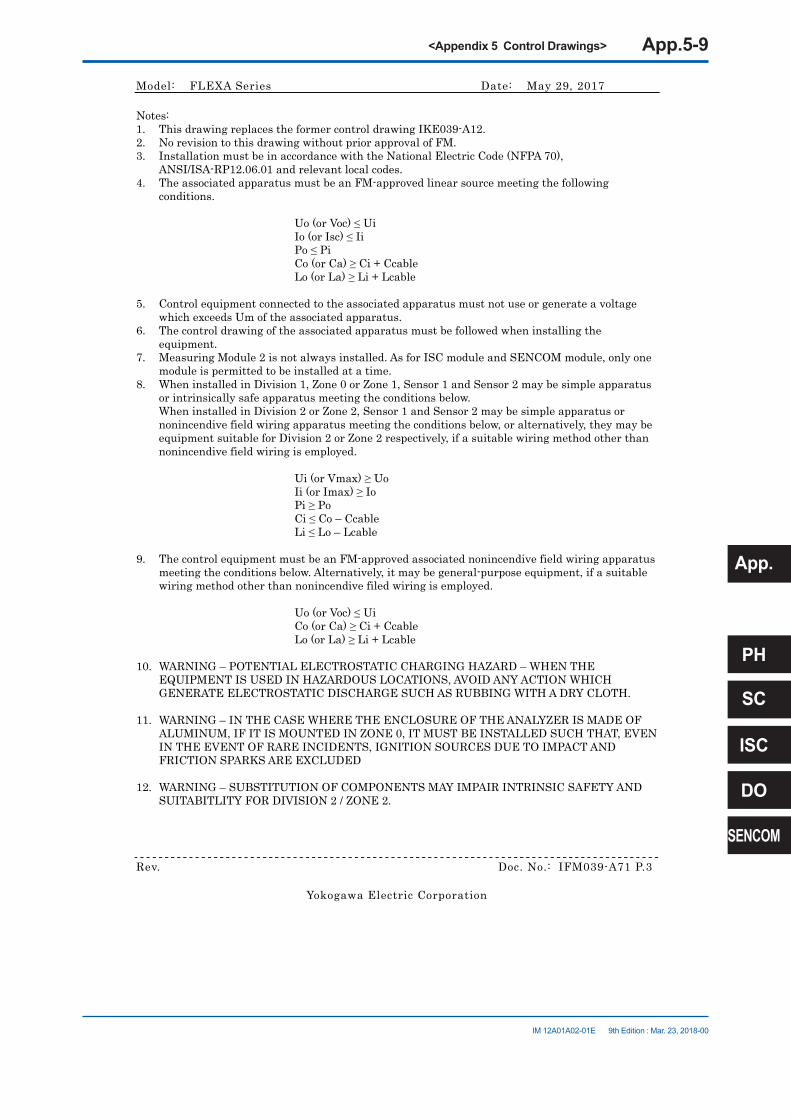
<Appendix 5 Control Drawings> App.5-9
IM 12A01A02-01E 9th Edition : Mar. 23, 2018-00
Model: FLEXA Series Date: May 29, 2017
Rev. Doc. No.: IFM039-A71 P.3
Yokogawa Electric Corporation
Notes: 1. This drawing replaces the former control drawing IKE039-A12. 2. No revision to this drawing without prior approval of FM. 3. Installation must be in accordance with the National Electric Code (NFPA 70),
ANSI/ISA-RP12.06.01 and relevant local codes. 4. The associated apparatus must be an FM-approved linear source meeting the following
conditions. Uo (or Voc) ≤ Ui Io (or Isc) ≤ Ii Po ≤ Pi Co (or Ca) ≥ Ci + Ccable Lo (or La) ≥ Li + Lcable
5. Control equipment connected to the associated apparatus must not use or generate a voltage which exceeds Um of the associated apparatus.
6. The control drawing of the associated apparatus must be followed when installing the equipment.
7. Measuring Module 2 is not always installed. As for ISC module and SENCOM module, only one module is permitted to be installed at a time.
8. When installed in Division 1, Zone 0 or Zone 1, Sensor 1 and Sensor 2 may be simple apparatus or intrinsically safe apparatus meeting the conditions below.
When installed in Division 2 or Zone 2, Sensor 1 and Sensor 2 may be simple apparatus or nonincendive field wiring apparatus meeting the conditions below, or alternatively, they may be equipment suitable for Division 2 or Zone 2 respectively, if a suitable wiring method other than nonincendive field wiring is employed.
Ui (or Vmax) ≥ Uo Ii (or Imax) ≥ Io Pi ≥ Po Ci ≤ Co – Ccable Li ≤ Lo – Lcable
9. The control equipment must be an FM-approved associated nonincendive field wiring apparatus meeting the conditions below. Alternatively, it may be general-purpose equipment, if a suitable wiring method other than nonincendive filed wiring is employed.
Uo (or Voc) ≤ Ui Co (or Ca) ≥ Ci + Ccable Lo (or La) ≥ Li + Lcable
10. WARNING – POTENTIAL ELECTROSTATIC CHARGING HAZARD – WHEN THE EQUIPMENT IS USED IN HAZARDOUS LOCATIONS, AVOID ANY ACTION WHICH GENERATE ELECTROSTATIC DISCHARGE SUCH AS RUBBING WITH A DRY CLOTH.
11. WARNING – IN THE CASE WHERE THE ENCLOSURE OF THE ANALYZER IS MADE OF
ALUMINUM, IF IT IS MOUNTED IN ZONE 0, IT MUST BE INSTALLED SUCH THAT, EVEN IN THE EVENT OF RARE INCIDENTS, IGNITION SOURCES DUE TO IMPACT AND FRICTION SPARKS ARE EXCLUDED
12. WARNING – SUBSTITUTION OF COMPONENTS MAY IMPAIR INTRINSIC SAFETY AND
SUITABITLITY FOR DIVISION 2 / ZONE 2.
App.
DO
PH
ISC
SENCOM
SC

<Appendix 5 Control Drawings> App.5-10
IM 12A01A02-01E 9th Edition : Mar. 23, 2018-00
App. 5.4 ATEX (Type n) FLXA202: Type of protection ‘n’
Model: FLXA202 Date: December 25, 2015
Rev. 1: July 24, 2017 Doc.No.: NKE053-A71 P.1
Yokogawa Electric Corporation
Control Drawing
Non Hazardous AreaHazardous Area
+Power Supply /Control Equipment (Note 4)
–
Supply +
Supply –
Housing Assembly
Measuring Module 1
Measuring Module 2
FLXA202 Analyzer
Sensor 1
Sensor 2
Ex nA ic Ratings Supply +, Supply – Um: 29.6V Un:16V to 29.6V (pH/ORP,SC,DO one module)
17V to 29.6V (ISC one module) 21V to 29.6V (SENCOM one module) 22.8V to 29.6V (pH/ORP,SC, DO two modules)
Measuring Module 1, 2 Type of Measuring Module
pH, SC, DO ISC SENCOM Uo 11.76 V 11.76 V 5.36 V Io 116.5 mA 60.6 mA 106.16 mA Po 0.3424 W 0.178 W 0.1423 W Co 100 nF 100 nF 31 μF Lo 1.7 mH 8 mH 0.45 mH
Specific condition of use - Electrostatic charges on the non-metallic or coated parts of the two wire analyzershall be avoided. - The cable gland accompanying the equipment may not provide sufficient clamping.Additional clamping of the cable shall be provided to ensure that pulling andtwisting are not transmitted to the termination. Alternatively, an Ex d, Ex e, or Ex ncable gland which provides sufficient clamping shall be used instead of theaccompanying cable gland. - Analyzer must be installed in such a way that the air vent is physically protectedfrom any possible impact.

<Appendix 5 Control Drawings> App.5-11
IM 12A01A02-01E 9th Edition : Mar. 23, 2018-00
Model: FLXA202 Date: December 25, 2015
Rev. 1: July 24, 2017 Doc.No.: NKE053-A71 P.2
Yokogawa Electric Corporation
Notes: 1. Installation must be in accordance with EN60079-14 and relevant local codes.
2. Measuring Module 2 is not always installed. As for ISC module and SENCOM module,
only one module is permitted to be installed at a time.
3. When installed in an area where the use of Category 3 G equipment is required, Sensor 1 and Sensor 2 may be simple apparatus, intrinsically safe apparatus meeting conditions below, or other Category 3 G equipment.
Ui (or Vmax) ≥ Uo Ii (or Imax) ≥ Io Pi ≥ Po Ci ≤ Co – Ccable Li ≤ Lo – Lcable 4. FLXA202 Analyzer must be installed in accordance with one of the following:
a) in a SELV or PELV system, or b) via a safety isolating transformer complying with the requirements of IEC
61558-2-6, or a technically equivalent standard, or c) directly connected to apparatus complying with IEC60950 series, IEC61010-1, or a
technically equivalent standard, or d) fed directly from cells or batteries.
5. When FLXA202 Analyzer is installed with accompanying cable glands, cable with an external diameter of 6 mm to 12 mm must be used for field wiring. The cable glands must be secured with a tightening torque of 6 Nm so that they can be released only with the aid of a tool. Unused cable gland shall be sealed with the accompanying metal plug.
6. The gaskets of the cable glands shall be protected from light.
App.
DO
PH
ISC
SENCOM
SC

<Appendix 5 Control Drawings> App.5-12
IM 12A01A02-01E 9th Edition : Mar. 23, 2018-00
App. 5.5 IECEx (Type n) FLXA202: Type of protection ‘n’
Model: FLXA202 Date: March 31, 2016
Rev. Doc.No.: NIE015-A71 P.1
Yokogawa Electric Corporation
Control Drawing
Non Hazardous AreaHazardous Area
+Power Supply /Control Equipment (Note 4)
–
Supply +
Supply –
Housing Assembly
Measuring Module 1
Measuring Module 2
FLXA202 Analyzer
Sensor 1
Sensor 2
Ex nA ic Ratings Supply +, Supply – Um: 29.6V Un:16V to 29.6V (pH/ORP,SC,DO one module)
17V to 29.6V (ISC one module) 21V to 29.6V (SENCOM one module) 22.8V to 29.6V (pH/ORP,SC, DO two modules)
Measuring Module 1, 2 Type of Measuring Module
pH, SC, DO ISC SENCOM Uo 11.76 V 11.76 V 5.36 V Io 116.5 mA 60.6 mA 106.16 mA Po 0.3424 W 0.178 W 0.1423 W Co 100 nF 100 nF 31 μF Lo 1.7 mH 8 mH 0.45 mH
Specific condition of use - Electrostatic charges on the non-metallic or coated parts of the two wire
analyzer shall be avoided. - The cable gland accompanying the equipment may not provide sufficient
clamping. Additional clamping of the cable shall be provided to ensure that pulling and twisting are not transmitted to the termination. Alternatively, an Exd, Ex e, or Ex n cable gland which provides sufficient clamping shall be used instead of the accompanying cable gland.
- The gaskets of the cable glands shall be protected from light. - Analyzer must be installed in such a way that the air vent is physically protected
from any possible impact.

<Appendix 5 Control Drawings> App.5-13
IM 12A01A02-01E 9th Edition : Mar. 23, 2018-00
Model: FLXA202 Date: March 31, 2016
Rev. Doc.No.: NIE015-A71 P.2
Yokogawa Electric Corporation
Notes: 1. Installation must be in accordance with IEC60079-14 and relevant local codes.
2. Measuring Module 2 is not always installed. As for ISC module and SENCOM module,
only one module is permitted to be installed at a time.
3. When installed in an area where EPL Gc is required, Sensor 1 and Sensor 2 may be simple apparatus, intrinsically safe apparatus meeting conditions below, or other EPL Gc equipment.
Ui (or Vmax) ≥ Uo Ii (or Imax) ≥ Io Pi ≥ Po Ci ≤ Co – Ccable Li ≤ Lo – Lcable 4. FLXA202 Analyzer must be installed in accordance with one of the following:
a) in a SELV or PELV system, or b) via a safety isolating transformer complying with the requirements of IEC
61558-2-6, or a technically equivalent standard, or c) directly connected to apparatus complying with IEC60950 series, IEC61010-1, or a
technically equivalent standard, or d) fed directly from cells or batteries.
5. When FLXA202 Analyzer is installed with accompanying cable glands, cable with an external diameter of 6 mm to 12 mm must be used for field wiring. The cable glands must be secured with a tightening torque of 6 Nm so that they can be released only with the aid of a tool. Unused cable gland shall be sealed with the accompanying metal plug.
App.
DO
PH
ISC
SENCOM
SC

<Appendix 5 Control Drawings> App.5-14
IM 12A01A02-01E 9th Edition : Mar. 23, 2018-00
App. 5.6 NEPSI and KOSHA FLXA202/FLXA21: Intrinsic safety “ia”
(Refer to App. 5.1 ATEX and IECEx Control Drawing)
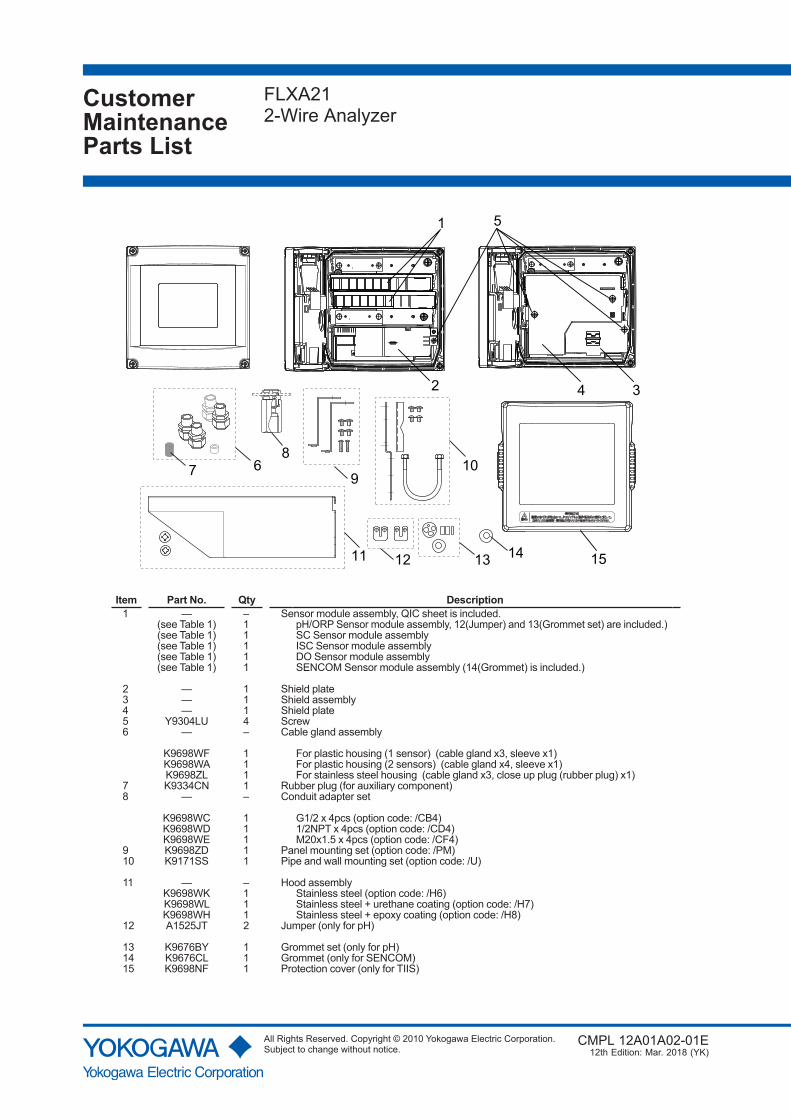
CustomerMaintenanceParts List
FLXA212-Wire Analyzer
CMPL 12A01A02-01E12th Edition: Mar. 2018 (YK)
68
1
2
5
4 3
15
7
12 13 14
910
11
Item Part No. Qty Description1 — – Sensor module assembly, QIC sheet is included.
(see Table 1) 1 pH/ORPSensormodule assembly, 12(Jumper) and 13(Grommet set) are included.)(see Table 1) 1 SC Sensor module assembly(see Table 1) 1 ISC Sensor module assembly(see Table 1) 1 DO Sensor module assembly(see Table 1) 1 SENCOM Sensor module assembly(14(Grommet)isincluded.)
2 — 1 Shield plate3 — 1 Shield assembly4 — 1 Shield plate5 Y9304LU 4 Screw6 — – Cable gland assembly
K9698WF 1 For plastic housing (1 sensor) (cable gland x3, sleeve x1)K9698WA 1 Forplastichousing(2sensors)(cableglandx4,sleevex1)K9698ZL 1 For stainless steel housing (cable gland x3, close up plug (rubber plug) x1)
7 K9334CN 1 Rubber plug (for auxiliary component)8 — – Conduit adapter set
K9698WC 1 G1/2x4pcs(optioncode:/CB4)K9698WD 1 1/2NPTx4pcs(optioncode:/CD4)K9698WE 1 M20x1.5x4pcs(optioncode:/CF4)
9 K9698ZD 1 Panel mounting set (option code: /PM)10 K9171SS 1 Pipe and wall mounting set (option code: /U)
11 — – HoodassemblyK9698WK 1 Stainlesssteel(optioncode:/H6)K9698WL 1 Stainlesssteel+urethanecoating(optioncode:/H7)K9698WH 1 Stainlesssteel+epoxycoating(optioncode:/H8)
12 A1525JT 2 Jumper(onlyforpH)
13 K9676BY 1 Grommetset(onlyforpH)14 K9676CL 1 Grommet (only for SENCOM)15 K9698NF 1 Protection cover (only for TIIS)
All Rights Reserved. Copyright © 2010 Yokogawa Electric Corporation.Subject to change without notice.
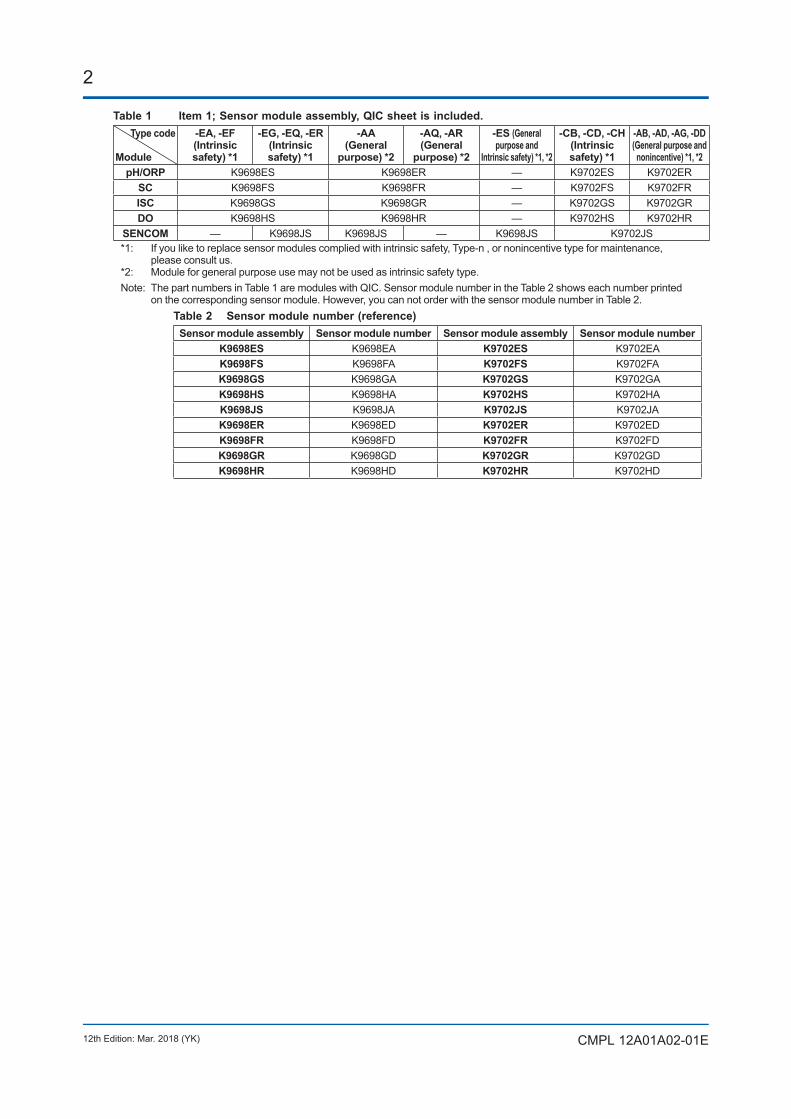
2
12th Edition: Mar. 2018 (YK) CMPL 12A01A02-01E
Table 1 Item 1; Sensor module assembly, QIC sheet is included.Type code
Module
-EA, -EF(Intrinsic safety) *1
-EG, -EQ, -ER(Intrinsic safety) *1
-AA(General
purpose) *2
-AQ, -AR(General
purpose) *2
-ES (General purpose and
Intrinsic safety) *1, *2
-CB, -CD, -CH(Intrinsic safety) *1
-AB, -AD, -AG, -DD(General purpose and nonincentive) *1, *2
pH/ORP K9698ES K9698ER — K9702ES K9702ERSC K9698FS K9698FR — K9702FS K9702FRISC K9698GS K9698GR — K9702GS K9702GRDO K9698HS K9698HR — K9702HS K9702HR
SENCOM — K9698JS K9698JS — K9698JS K9702JS*1: If you like to replace sensor modules complied with intrinsic safety, Type-n , or nonincentive type for maintenance,
please consult us.*2: Module for general purpose use may not be used as intrinsic safety type.Note: The part numbers in Table 1 are modules with QIC. Sensor module number in the Table 2 shows each number printed
onthecorrespondingsensormodule.However,youcannotorderwiththesensormodulenumberinTable2.Table 2 Sensor module number (reference)Sensor module assembly Sensor module number Sensor module assembly Sensor module number
K9698ES K9698EA K9702ES K9702EAK9698FS K9698FA K9702FS K9702FAK9698GS K9698GA K9702GS K9702GAK9698HS K9698HA K9702HS K9702HAK9698JS K9698JA K9702JS K9702JAK9698ER K9698ED K9702ER K9702EDK9698FR K9698FD K9702FR K9702FDK9698GR K9698GD K9702GR K9702GDK9698HR K9698HD K9702HR K9702HD

CustomerMaintenanceParts List
FLXA2022-Wire Analyzer
CMPL 12A01A03-01EN3rd Edition: Mar. 2018 (YK)
57
1
4 3
2
1514
6
11 12 13
89
10
Item Part No. Qty Description1 K9699MD 1 Shield plate2 K9699ME Shield plate3 — – Cover assembly
K9699QK 1 urethane coatingK9699QL 1 epoxy coating
K9699QM 1 high anti-corrosion coating4 K9699PP 1 Hingepinassembly(Hingepin+spring)5 — – Cable gland assembly
K9699ZN 1 For Type n (metal cable gland x3, close up plug (rubber plug) x1)K9699ZM 1 Except Type n (plastic cable gland x3, close up plug (rubber plug) x1)
6 K9334CN 1 Rubber plug (for auxiliary component)7 — – Conduit adapter set
K9699WF 1 G1/2x3pcs(optioncode:/CB4)K9699WG 1 1/2NPTx3pcs(optioncode:/CD4)K9699WH 1 M20x1.5x3pcs(optioncode:/CF4)
8 K9698ZD 1 Panel mouting set (option code: /PM)9 K9171SS 1 Pipe and wall mounting set (option code: /U)10 — – Hoodassembly
K9698WK 1 Stainlesssteel(optioncode:/H6)K9698WL 1 Stainlesssteel+urethanecoating(optioncode:/H7)
K9698WH 1 Stainlesssteel+epoxycoating(optioncode:/H8)11 A1525JT 2 Jumper(onlyforpH)12 K9676BY 1 Grommetset(onlyforpH)13 K9676CL 1 Grommet (only for SENCOM)14 K9699PL 5 Screw assembly (M5 screw + spring)
15 — – Sensor module assembly, QIC sheet is included.(see Table 1) pH/ORPSensormoduleassembly(12(Jumper)and13(Grommetset)areincluded.)(see Table 1) SC Sensor module assembly(see Table 1) ISC Sensor module assembly(see Table 1) DO Sensor module assembly(see Table 1) SENCOMSensormoduleassembly(14(Grommet)isincluded.)
All Rights Reserved. Copyright © 2015 Yokogawa Electric Corporation.Subject to change without notice.
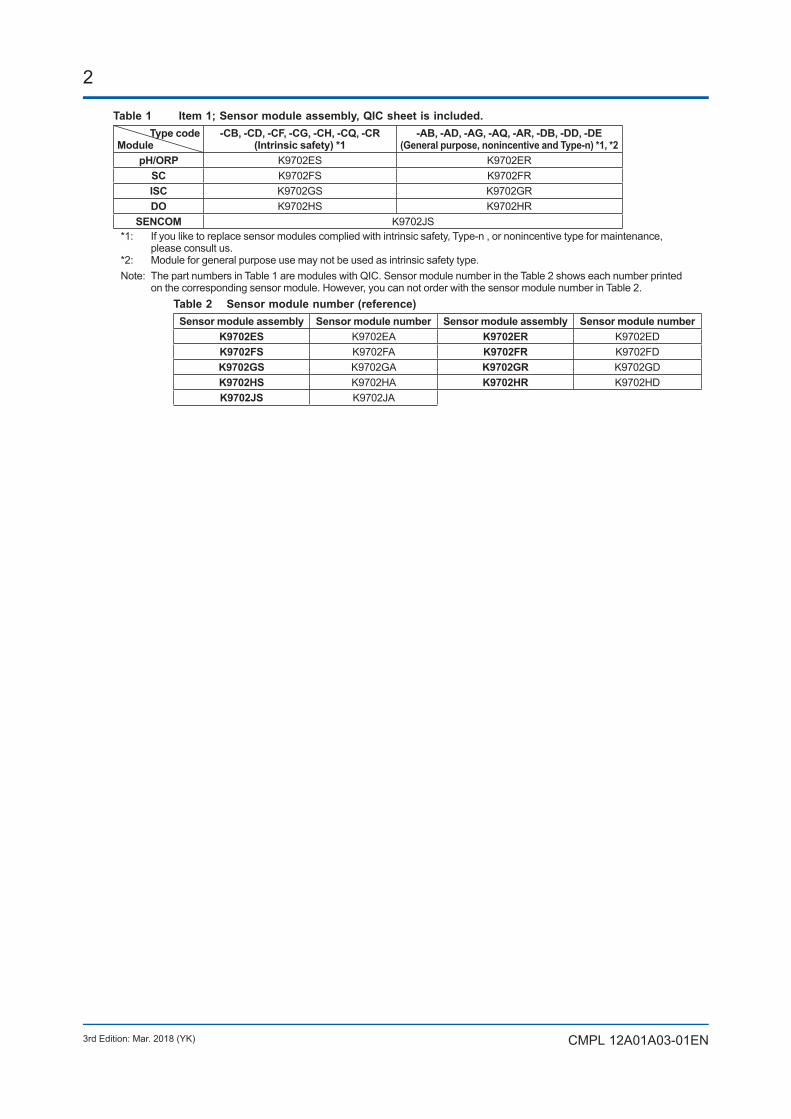
2
3rd Edition: Mar. 2018 (YK) CMPL 12A01A03-01EN
Table 1 Item 1; Sensor module assembly, QIC sheet is included.Type code
Module-CB, -CD, -CF, -CG, -CH, -CQ, -CR
(Intrinsic safety) *1-AB, -AD, -AG, -AQ, -AR, -DB, -DD, -DE
(General purpose, nonincentive and Type-n) *1, *2pH/ORP K9702ES K9702ER
SC K9702FS K9702FRISC K9702GS K9702GRDO K9702HS K9702HR
SENCOM K9702JS*1: If you like to replace sensor modules complied with intrinsic safety, Type-n , or nonincentive type for maintenance,
please consult us.*2: Module for general purpose use may not be used as intrinsic safety type.Note: The part numbers in Table 1 are modules with QIC. Sensor module number in the Table 2 shows each number printed
onthecorrespondingsensormodule.However,youcannotorderwiththesensormodulenumberinTable2.Table 2 Sensor module number (reference)Sensor module assembly Sensor module number Sensor module assembly Sensor module number
K9702ES K9702EA K9702ER K9702EDK9702FS K9702FA K9702FR K9702FDK9702GS K9702GA K9702GR K9702GDK9702HS K9702HA K9702HR K9702HDK9702JS K9702JA

i
IM 12A01A02-01E 9th Edition : Mar. 23, 2018-00
Revision Recordl Manual Title : Model FLXA202 / FLXA21 2-Wire Analyzerl Manual No. : IM 12A01A02-01E
Mar. 2018/9th EditionOverall review.Changeandadditionofthemarkposition(P.v,vi,1-4) Regulatory Compliance (P.1-11)ExplodionProtectedTypeCompliance(P.1-12,1-13,2-4,2-5,2-9)AdditionofModel&SufficCodes(P.1-16to1-19) Addition of Control Drawings (Appendix 5)Correction (P.i,ii,viii,ix,1-3,1-5,2-2,2-6to2-8,2-11to2-14,2-20,4-15,7-3,7-9,7-12,10-10,13-10,
16-15,App.1-4,App.2-3,App.2-4,App.2-8,App.3-3,App.3-7,CMPL12A01A02-01E, CMPL 12A01A03-01EN)
HOUSINGASSYSoftwareRevision2.13
Oct. 2015/8th EditionAddition of FLXA202FLXA202 Product Career S1FLXA21 Product Career S3
Apr. 2015/7th EditionHOUSINGASSYSoftwareRevision2.11 Softwarerevision(P.3-3,6-3,12-3,12-4,12-7,16-2to16-4) User’s Manual for FOUNDATION Fieldbus or PROFIBUS PA Communication (P.i) Regulatory Compliance (P.1-9) Noteforwallmounting(P.2-14) Change of “type of ground” of the stainless steel housing (P.2-1, 2-3, 2-5, 2-6) Correction (P.App.2-8, App3-8)
Oct. 2014/6th Edition Addition of NEPSI and ATEX/IECEx (SENCOM module).
Oct. 2013/5th EditionHOUSINGASSYSoftwareRevision2.10 Addition of MONITOR display, and other corrections
Sep. 2013/4th EditionProductCareerS2,HOUSINGASSYSoftwareRevision2.02 AdditionofSENCOMpH/ORPsensor DeletionofsectionofGeneralSpecification Change of safety symbols and words Addition of FM and CSA intrinsically safe approval Changeofnumberofcableentriesonstainlesssteelhousing;Changeofpartsofcableglands
and change of sealing Change of display message for malfunction and warning Change of menu trees Addition of check method for ORP sensor electrode Addition of detail data of temperature compensation matrixes SeparationofappendixofHARTCommunication(ThisappendixisissuedasTechnical
Information, TI 12A01A02-60E.) And, other minor changes and corrections
Feb. 2012/3rd Edition Change of numbers of chapters (composition of manual) Addition of descriptions and drawings for intrinsically safe type Change of descriptions of messages on displays Changeoffiguresofhousingduetochangeofpositionofexternalgroundingforstainlesssteel
housing Changeoffiguresofwiringcovers
ii
IM 12A01A02-01E 9th Edition : Mar. 23, 2018-00
Change of description of message language due to addition of message languages Addition of CAUTIONs for replacement of modules for intrinsically safe type And, other corrections
Aug. 2010/2nd Editionp.i Additionof“CompositionofthisUser’sManual”Section 1.3 Addition of WARNING, explanation, and examples of displays of calculated data and redundant
systemSection1.4 Additionof“Passwords”Section2 Additionofspecificationofwireterminal,andstylecodeofPH201GSection 3 Revision and addition of drawings and explanation of stainless steel housing due to change of
design (grounding terminal and plate) Addition of sleeve for grounding cable line of plastic housing Correction of torque value Addition of DANGER, WARNING and CAUTION Addition of explanation of wire terminal Addition of drawing of hoodSection6,11,14,and17 Addition of CAUTION, and example of display of calibrationSection8 Additionof“Installationofsensormodule”Section 10.7 Correction and addition of calculated dataAppendix2 Additionof“MonitoringofPurifiedWaterandWFIaccordingtoUSP<645>”Appendix4 Correctionoferror AdditionofCAUTION,“OperationalPrecaution”,and“NoteforFunctions”** Above are main revisions.
May 2010/1st EditionNewly published
Yokogawa Electric Corporation 2-9-32 Nakacho, Musashino-shi, Tokyo 180-8750, JAPAN Homepage:http://www.yokogawa.com/