Embed Size (px)
Citation preview
MODEL CONVECTIVE AND STRATIFORM PRECIPITATION PARTITION DEPENDENCE
ON HORIZONTAL RESOLUTION
Gomes, Jorge Luís 1, Chou, Sin Chan 1
1. Centro de Previsão de Tempo e Estudos Climáticos – Instituto Nacional de Pesquisas
Espaciais - Cachoeira Paulista - Brazil
[email protected], [email protected]
ABSTRACT
Model precipitation can be produced
explicitly or through convective
parameterization schemes. Different types
of precipitation produce distinct vertical
profiles of latent heat to the atmosphere,
however, to estimate the effect of these
different profiles of heating it is important
to know accurately the partition between
convective and stratiform precipitation.
Models with resolution coarser than 20 km
are able to reproduce the cumulus
convection with some skill through
parameterization schemes. On the other
hand, models with grid-size resolution
smaller than 1 km should solve the
convection explicitly. Within the range of
these two resolutions hybrid solutions are
suggested, with cumulus convection
acting together with the explicit form of
representation. In the present work, the
Eta model was used to simulate a
precipitation event associated with the
South Atlantic Convergence Zone (SACZ).
This type of system exhibits a large band
of stratiform cloudiness with embedded
convective cells. The Eta Model uses the
Kain-Fritsch cumulus parameterization
scheme. Cloud microphysics was treated
by Ferrier scheme. The convective
scheme has a parameter that controls the
fraction of condensate that goes into rain
and snow in each layer. A change is
proposed to the parameter to include
resolution dependence. The convective
scheme converts less condensed water
into precipitation, part of the condensed
water is made available to cloud
microphysics scheme and another part
evaporates. In grid resolution higher than
1 km, convective scheme still acts in
removing convective instability and all
precipitation is produced by cloud
microphysics. Simulations with different
horizontal resolutions, 20, 10 and 5 km,
have been carried out up to 5-day
integrations which is the average duration
of SACZ events. The changes produced
two major impacts: the position of
maximum precipitation area was better
simulated and the amount of total
precipitation became closer to the
observations. The simulations showed that
the increase of horizontal resolution

changed the distribution of stratiform and
convective precipitation.
1. INTRODUCTION.
The precipitation of the NWP models may
be generated implicit by though convective
parameterization scheme and explicitly
though excess of water vapor over a
prescribed threshold. Convective
parameterization schemes work in a
model grid where convective instability is
found. The cloud microphysics schemes,
such as Lin et al. (1983), Zhao (1997),
Eta-Ferrier (2002), etc. produce
precipitation explicitly. According with the
model resolution it is expected greater or
lesser activity of each of these two
schemes. According Molinare (1993)
models with resolution greater than 20 km
the precipitation would be simulated by
implicit convective schemes with
reasonable skill. Models with resolutions
lesser than 3 km, where the model grid
approaches the scale of cloud
development, the precipitation would be
simulated by explicit schemes. Adequate
representations of implicit and explicit
precipitation partition by NWP are
essential to get a better representation of
precipitation. With increasing the
resolution the explicit scheme becomes
more important. In this case, the clouds
processes become more sensitive with
respect to the model grid scale. In this
paper the objective is to evaluate the
precipitation production and partition at
different horizontal resolution for a case of
SACZ.
2. THE ETA MODEL.
The Eta Model was first developed in
Belgrade University by Mesinger (1988)
and a comprehensive physical package
has been incorporated into the model by
Janjic (1990, 1994). It is a hydrostatic/no
hydrostatic model with an accurate
treatment of complex topography using
eta vertical coordinate system (Mesinger,
1984). The model topography is
represented as discrete steps whose tops
coincide exactly with one of the model
vertical layer interfaces (BLACK, 1994).
The model uses a semistaggered
Arakawa E grid as a horizontal grid. The
radiation package used in the model is
one developed at GFDL. Planetary
boundary layer (PBL) uses a modified
Mellor-Yamada Level 2.5 scheme (Black
1994). The prognostics variables of the
model are: temperature, specific humidity,
zonal and meridional components of the
wind, surface pressure, turbulent kinetic
energy and cloud hidrometeores. The
explicit precipitation is generated by cloud
microphysics Eta-Ferrier scheme Ferrier
(2002), hereafter referred to FR, and
implicit precipitation generated by Kain-
Fritsch cumulus parameterization scheme
(Kain and Fritsch, 1990 and 1993; Kain,
2004), hereafter referred as KF. Further
details of the model can be found at
Mesinger et al. 1988 and Black, 1994.

2.1. PRECIPITATION SCHEMES
In this section a brief review of the
precipitation schemes used in this work
are show and a new modification in Kain-
Fritsh scheme is proposed.
- The Eta-Ferrier scheme (FR). The
scheme predicts changes in water
vapor and condensate in the forms
of cloud water, rain, cloud ice, and
precipitation ice
(snow/graupel/sleet). The
individual hydrometeors are
combined into total condensate.
The water vapor and total
condensate that are advected in
the model.
- Kain-Fritsch scheme (KF): uses a
Lagrangian Parcel method along
with vertical momentum dynamics
to estimate the properties of
cumulus convection, It
incorporates a trigger function, a
mass flux formulation and closure
assumption. The trigger function
identifies the potential updraft
source layers associated with
convection, whereas the mass flux
formulation calculates the updraft,
downdraft and associated
environmental mass flux. The
scheme assumes conservation of
mass, thermal energy, total
moisture and momentum. The
efficiency Productions of rain and
snow are controlled by a
parameter that specifies the
fraction of the precipitation mass to
be transferred from KF to the host
model.
3. METHODOLOGY
The Eta model was configured with 20, 10
and 5 km of horizontal resolutions. In the
first and second cases the vertical
resolution used was 38 layers and the
model run in a hydrostatic mode. The time
steps were 40 and 20 seconds
respectively. With 5 km resolution the
model was run in non-hydrostatic mode 50
layers, with time step set to 10 seconds.
The domain was centered at -23.5S, -
48.0W. The domain of the 3 resolution
was the same to avoid any possible
differences in the simulations. Initial and
lateral boundary conditions were taken
from NCEP (National Centers for
Environmental Prediction) global analyses
with T126L28 resolution. The lateral
conditions were updated every 6 hours.
The domains for all experiments are
shown in Figure 2. The model was
integrated up to 132 hours. The resolution
dependence was introduced into the
scheme through the F parameter. This
parameter varies between 0 and 1. When
the model resolution is 3 km or higher the
parameter is set to 1; between 3 and 40
km the parameter follows a function given
by Figure 1; and when the model grid size
is 40km or smaller, the parameter is set to
0. The F parameter included the horizontal

resolutions dependence into the
precipitation efficiency and the convective
adjustment through temperature and
moisture profiles. In the 20 km experiment
where F parameter was set to 0.4
cloud water is converted to
case, the convective activity was reduced
by 40%. For the resolutions
the convective efficiency and th
convective activity were reduced by 6
and 80%.
Figura 1: F parameter (non dimensional).
20 km
a)
10 km
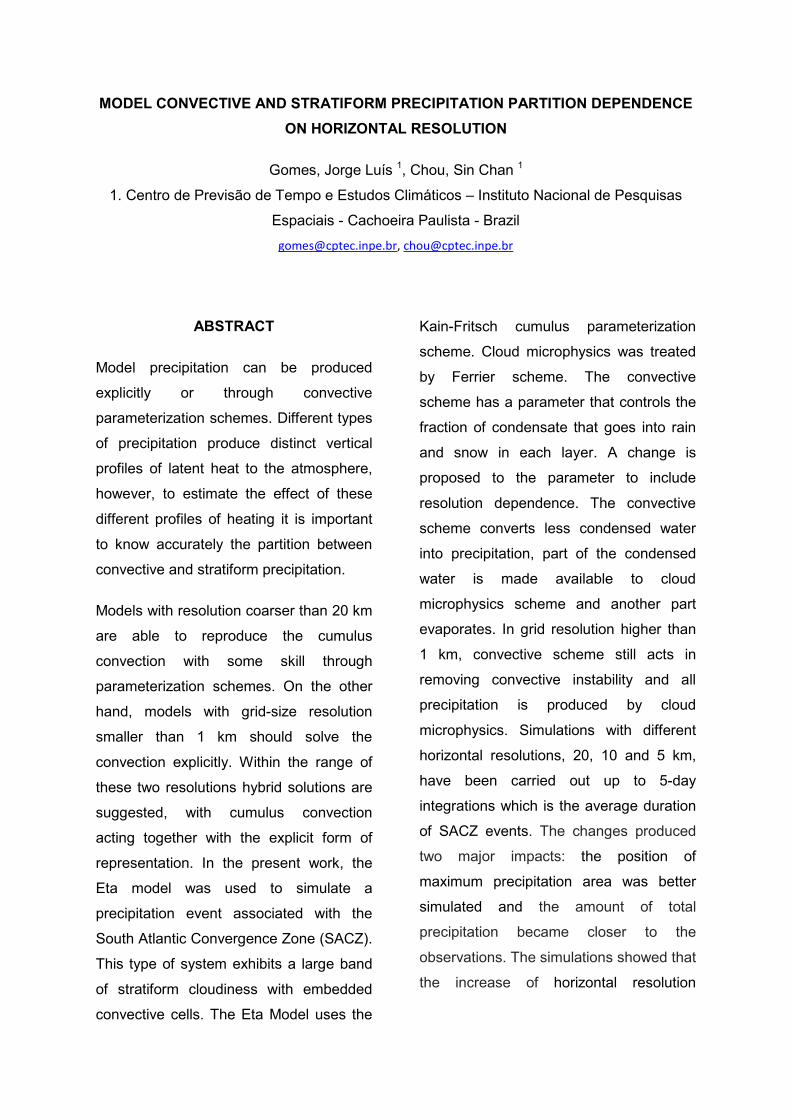
b) Figure 2: Topography and domains of the
experiments for: a) 20 km; b) 10 km and c)
5 km
3.1. CASE ANALYSIS
The case chosen for this study was the
SACZ event from January 24
The JAN24 cloud band
meridional orientation and
rainfall over southeast Brazil, mainly in the
southern part of São Paulo State, where
the maximum of the precipitation
200-300 mm was observed (Figure 3
resolutions dependence into the
cy and the convective
through temperature and
n the 20 km experiment
set to 0.4, 60% of
cloud water is converted to rain. In this
he convective activity was reduced
10 and 5km
the convective efficiency and the
reduced by 60%
non dimensional).
5 km
c)
Topography and domains of the
experiments for: a) 20 km; b) 10 km and c)
The case chosen for this study was the
event from January 24-29, 2004.
exhibited a
and significant
all over southeast Brazil, mainly in the
southern part of São Paulo State, where
of the precipitation between
was observed (Figure 3 a
and b). The Figure 2b shows the
PERSIANN (Precipitation Estimation from
Remotely Sensed Informatio
Artificial Neural Networks) accumulated
precipitation for JAN24 period. The
precipitation band exhibited
orientation, with axis that
Triângulo Mineiro through the extreme
south of the São Paulo State and followed
by the Atlantic Ocean. The sequence of IR
images from GOES-8 shows that the
system was acting over the region
between January 24
streamlines at high levels showed a
cyclonic vortex positioned closer
coastline of Northeast o
the SACZ over the southern and
southeast region. The cold
ocean was maintained by
trough.
a)
Figure 3: Observed precipitat
accumulated for SACZ event
observations and b) PERSIANN data
4. RESULTS
4.1. CONTROL RUN
In the 20 km simulated
precipitation was positioned
(Figure 5a) when compared with the
The Figure 2b shows the
PERSIANN (Precipitation Estimation from
Remotely Sensed Information using
Artificial Neural Networks) accumulated
precipitation for JAN24 period. The
exhibited southern
that extends from
Triângulo Mineiro through the extreme
São Paulo State and followed
The sequence of IR
8 shows that the
system was acting over the region
n January 24-29, 2004. The
streamlines at high levels showed a
cyclonic vortex positioned closer to the
coastline of Northeast of Brazil which kept
the SACZ over the southern and
The cold front over the
ocean was maintained by upper level
b)
Observed precipitation
accumulated for SACZ event: a) surface
and b) PERSIANN data
imulated maximum
positioned too south
a) when compared with the

observations (Figure 5a and 5b). In the
C20, the precipitation band was positioned
over Santa Catarina and Paraná States,
whereas the observations showed the
cloud band to the north. In this case, the
maximum accumulated precipitation was
400 mm over Santa Catarina State,
whereas in the observations the amounts
were smaller and the cloud band
positioned to the north, over São Paulo
State. The comparison between the
Figures 5g and 5n shows that most part of
precipitation was generated by the implicit
scheme. The runs with different
resolutions showed the same distribution
of implicit and explicit precipitation
(Figures 5 c, j and p; Figures 5e, l and r).
The differences between C10-C20 and
C05-C20 where showed a little shift in the
precipitation band toward north but a
significant increase in the maximum
precipitation when increased the
horizontal resolution was increased.
However, the increase in the total
precipitation is associated with an
increase of convective scheme (Figures
5g, j and l), although it would be expected
that the explicit scheme acted more
strongly with resolution increase.
4.2. F PARAMETER
The comparison between the 20-km runs,
control and F experiment showed that the
position of the precipitation band is further
north, closer to the observation (Figure 3a
and b). One can note in Figure 5b and h
that there was a reduction in the amount
of precipitation produced by the implicit
scheme. The greater availability of liquid
water for the explicit scheme contributed
to an increase in the amount and area of
precipitation produced by the explicit
scheme. The explicit scheme became
more active and contributed to positioni
the precipitation maximum to the north
(Figures 5n and o). With the increase of
resolution, the liquid water produced by
the convective scheme and the
temperature and humidity tendencies were
reduced by 60% and 80% in the 10-km
and 5-km runs, respectively. Comparison
among the Figures 5b, d and f against the
Figures 5a and b one can note that the
resolution increase improved the
simulated position of precipitation band.
5. CONCLUSIONS
Experiments carried out with the Eta
Model at 20, 10 and 5-km resolutions with
original KF and FR setups ) showed that
the model produced heavy precipitation
and had some position error in the
precipitation band associated with the
SACZ event. The KF scheme produced
the largest contribution to the total
precipitation in the control runs. Despite
the resolution increase, the precipitation
maximum was intensified due to greater
activity of the KF convective scheme.
The inclusion of resolution dependence to
the F parameter caused the reduction of
the convective activity, the reduction in the

precipitation amount generated by th
scheme and an increase of the explicit
precipitation. This new precipitation
partition reduced the overprediction
resolution insensitive of the schemes in
20km
C20 E0.420
a) b)
g) h)
n) o)
Figure 5: 5-day accumulated p
The different resolutions are
second row is the implicit precipitation and the third row is explicit
6. REFERENCES
BLACK, T. L., 1994: The new NMC
mesoscale Eta model: Description ad
forecast examples. Wea. Forecasting
265-278.
FERRIER, B. S., Y. LIN, T. BLACK, E.
ROGERS, AND G. DiMEGO, 2002:
Implementation of a new grid
and precipitation scheme in the NCEP Eta
model. Preprints, 15th Conference on
generated by the
of the explicit
precipitation. This new precipitation
partition reduced the overprediction and
sensitive of the schemes in
the control runs. As the horizontal
resolution increases the position
precipitation band associated with the
SACZ event was also
10km 5km
C10 E0.610 C05
c)
d) e)
j)
k) l)
p)
q) r)
accumulated precipitation for the control and F-parameter
shown in columns. The first row is the total precipitation, the
second row is the implicit precipitation and the third row is explicit
BLACK, T. L., 1994: The new NMC
mesoscale Eta model: Description ad
Wea. Forecasting, 9,
FERRIER, B. S., Y. LIN, T. BLACK, E.
ROGERS, AND G. DiMEGO, 2002:
Implementation of a new grid-scale cloud
in the NCEP Eta
model. Preprints, 15th Conference on
Numerical Weather Prediction, San
Antonio, TX, Amer. Meteor. Soc
KAIN, J. S. 2004: The Kain
convective parameterization: An update. J.
Appl. Meteor., 43, 170-181.
___, and J. M. FRITSCH, 1993:
Convective parameterization for
mesoscale models: The Kain
scheme. The Representation o
Convection in Numerical Models, Meteor.
Monogr., No. 46, Amer. Meteor. Soc., 165
170.
. As the horizontal
lution increases the position of the
on band associated with the
also better positioned.
5km
E0.805
f)
m)
s)
parameter experiment runs.
The first row is the total precipitation, the
second row is the implicit precipitation and the third row is explicit precipitation.
Numerical Weather Prediction, San
Amer. Meteor. Soc., 280-283.
KAIN, J. S. 2004: The Kain-Fritsch
convective parameterization: An update. J.
181.
___, and J. M. FRITSCH, 1993:
Convective parameterization for
mesoscale models: The Kain-Fritsch
scheme. The Representation of Cumulus
Convection in Numerical Models, Meteor.
Monogr., No. 46, Amer. Meteor. Soc., 165-

___, AND ___, 1990: A one-dimensional
entraining/detraining plume model and its
application in convective parameterization.
J. Atmos. Sci., 47, 2784-2802.
MESINGER, F., 1984: A blocking
technique for representation of mountains
in atmospheric models. Riv. Meteor.
Aeronaut., 44, 195-202.
___, JANJIC, Z. I., NICKOVIC, S.,
GAVRILOV, D. AND DEAVEN, D. G.
1988: The step-mountain coordinate:
Model description description and
performance for cases of Alpine lee
cyclogenesis and for a case of
Appalachian redevelopment. Mon. Wea.
Rev., 116, 1493-1518.
MOLINARI, J., 1993: Na overview of
cumulus parameterization in mesoescale
models. The Representation of Cumulus
Convection In Numerical Models. Amer.
Meteor. Soc., Vol. 24, 46, 155-158.
ZHAO, Q., T. BLACK AND M. E. Baldwin,
1997: Cloud prediction scheme in the Eta
model at NCEP. Wea. Forecasting, 12,
697-712.
Acknowlegments: This work is partially
funded by FAPESP under grant no.
04/09649-0 and partially by CNPq under
grant no 308725/2007-7