Embed Size (px)
Citation preview
RESEARCH ARTICLE Open Access
Model-based extension of high-throughput tohigh-content dataAndrea C Pfeifer1,2†, Daniel Kaschek3†, Julie Bachmann1, Ursula Klingmüller1,2, Jens Timmer3,4*
Abstract
Background: High-quality quantitative data is a major limitation in systems biology. The experimental data used insystems biology can be assigned to one of the following categories: assays yielding average data of a cellpopulation, high-content single cell measurements and high-throughput techniques generating single cell data forlarge cell populations. For modeling purposes, a combination of data from different categories is highly desirablein order to increase the number of observable species and processes and thereby maximize the identifiability ofparameters.
Results: In this article we present a method that combines the power of high-content single cell measurementswith the efficiency of high-throughput techniques. A calibration on the basis of identical cell populations measuredby both approaches connects the two techniques. We develop a mathematical model to relate quantitiesexclusively observable by high-content single cell techniques to those measurable with high-content as well ashigh-throughput methods. The latter are defined as free variables, while the variables measurable with only onetechnique are described in dependence of those. It is the combination of data calibration and model into a singlemethod that makes it possible to determine quantities only accessible by single cell assays but using high-throughput techniques. As an example, we apply our approach to the nucleocytoplasmic transport of STAT5B ineukaryotic cells.
Conclusions: The presented procedure can be generally applied to systems that allow for dividing observablesinto sets of free quantities, which are easily measurable, and variables dependent on those. Hence, it extends theinformation content of high-throughput methods by incorporating data from high-content measurements.
BackgroundIn systems biology, a wide range of experimental data isused for mathematical modeling. Qualitative data mostlyserves as a basis for determining network structures,whereas dynamic pathway modeling relies on high-qualityquantitative data. In general, experimental data describ-ing biological systems can be divided into three groups.Firstly, data generated from large cell populations yieldsan average information of the whole population behavior.However, cell population assays such as biochemicalmeasurements or microarray studies can be misleadingas large cell-to-cell variations are often observed, even inseemingly uniform populations. This stochasticity can be
caused by asynchronous cell cycles, differences in cellsizes and varying protein states or expression levels[1-3]. Secondly, single cell data with high-content infor-mation from a limited number of cells result in a sto-chastic distribution of measured quantities. Many singlecell approaches are based on microscopy, but other tech-nologies are under development to investigate for exam-ple gene expression or proteins in single cells [4-6]. Thethird group covers a small range of experimental techni-ques that generate single cell data from large cell popula-tions in a high-throughput format. Most common amongthose is flow cytometry, which however is limited tomeasurements from cells in suspension. Moreover, incontrast to microscopy, standard flow cytometry canonly detect average whole cell fluorescence intensitieslacking spatially resolved information. Currently, high-throughput imaging techniques as well as imaging flowcytometers digitally imaging cells directly in flow are
* Correspondence: [email protected]† Contributed equally3Physics Institute, University of Freiburg, Hermann-Herder-Strasse 3, 79104Freiburg i.Br., GermanyFull list of author information is available at the end of the article
Pfeifer et al. BMC Systems Biology 2010, 4:106http://www.biomedcentral.com/1752-0509/4/106
© 2010 Pfeifer et al; licensee BioMed Central Ltd. This is an Open Access article distributed under the terms of the Creative CommonsAttribution License (http://creativecommons.org/licenses/by/2.0), which permits unrestricted use, distribution, and reproduction inany medium, provided the original work is properly cited.

being developed, with the goal to gather high-contentinformation from a large number of single cells [7,8].This will increase the number of parameters that can bedetermined in parallel by high-throughput and high-content techniques.For modeling purposes it is essential to link data from
different types of experiments in order to include asmany details of the system as possible in the modelingprocess and to avoid non-identifiabilities during the para-meter estimation. However, some of the components canonly be measured by time consuming high-content tech-niques. For models describing entire cell populations,high-content data for large cell numbers is necessary butoften impossible to provide. In contrast, high-throughputtechniques can generate these large data sets, despite alack in detailed single cell information.A signaling pathway that has been extensively investi-
gated by dynamic pathway modeling is the JAK-STATpathway [9]. Upon binding of an extracellular ligand tothe respective receptor latent signal transducers andactivators of transcription (STATs) are activated byJanus kinases (JAK) leading to rapid nucleocytoplasmiccycling of STATs. In addition, constitutive nucleocyto-plasmic cycling of unphosphorylated STAT has beenshown for several STAT proteins by biochemical andmicroscopic experiments [10-15]. It has been proposedthat import of STAT is enhanced upon activation [16],while export of activated STAT is slowed down eitherthrough retention in the nucleus by DNA binding [17]or possibly a different export mechanism [15]. Pre-viously, rapid nucleocytoplasmic cycling of activatedSTAT5 has been identified as the step most sensitive toperturbation within the core module of the JAK2/STAT5 pathway by mathematical modeling based onbiochemical data [18], but import and export ratescould not be measured experimentally. These transportsteps are crucial as important decisions regulating cellfate are made by the nuclear reactions of STATs.A method to determine the rates for nuclear import
and export of STAT5 is fluorescence recovery afterphotobleaching (FRAP). FRAP is a single cell fluores-cence microscopy method routinely used to measure thekinetics of transport processes between cell compart-ments as well as diffusion and dynamic binding reac-tions [19,20]. One prerequisite for a quantitative FRAPexperiment is that the investigated system is in a steadystate on the time scale of the experiment otherwise amathematical description of the data is difficult toobtain. The JAK-STAT system is only in a steady statein unstimulated cells, ligand stimulation induces phos-phorylation of STATs and thereby perturbs the steadystate. Therefore, we focused on the nuclear import andexport rates of unphosphorylated STAT5 with the goalto generate rates for the steady state in unstimulated
cells that can be set to a fixed value in a larger pathwaymodel. Biochemical data describing the phosphorylationdynamics of the pathway components after stimulationin combination with mathematical modeling can thenserve to indirectly determine nuclear import and exportrates for phosphorylated STAT5.Here, we present a model for extracting the import
and export rates from FRAP experiments of STAT5B-GFP in the steady state of unstimulated NIH3T3-EpoRcells. Furthermore, the dependence of these rates onSTAT5B-GFP concentration and cell size is shown. Tobe able to combine this information with biochemicaldata from cell populations expressing STAT5B-GFP, cellsize distribution and STAT5B-GFP concentration distri-bution within the respective cell population are addi-tionally measured by flow cytometry. Cell size as well asSTAT5B-GFP concentration are estimated directly fromflow cytometry data after calibration of these data tomicroscopy data.The calibration procedure can be generally applied to
link data from powerful high-content techniques andfast, efficient high-throughput methods. In combinationwith the mathematical model, it provides a novel ratio-nale to determine formerly inaccessible information forlarge cell populations by less time-consuming high-throughput measurements.
Results and DiscussionData calibration links high-content with high-throughputdataTo formulate a general calibration procedure for com-bining high-content and high-throughput data we use amethod based on least squares regression of the quan-tile-quantile plot (QQ-plot) for corresponding popula-tion measurements. Let
High-Content : Y mX dC= + (1)
High-Throughput : Y m X dT= ′ + ′ (2)
where Y refers to the quantity of interest, e.g. proteinconcentration, cell volume, total amount of protein, XC
and XT are observables for the high content or high-throughput technique that are both linearly connectedto Y via slopes m, m’ and intercepts d, d’. In a moregeneral formalism, a measurement technique is a strictlymonotonic function F with Y = F(X), i.e. F uniquelyrelates an observable to a quantity of interest. Practi-cally, the scale of X is chosen in such a way that F islinear. The strict monotony of F requires m, m’ to benon-zero. Eqs. (1) and (2) show that for every value of Y
mX Y d m X Y dC T( ) ( )+ = ′ + ′ (3)
Pfeifer et al. BMC Systems Biology 2010, 4:106http://www.biomedcentral.com/1752-0509/4/106
Page 2 of 13

⇔ =′
+ − ′′
X Ym
mX Y
d d
mT C( ) ( ) , (4)
i.e. XT (Y ) depends linearly on the high-content quan-tity XC(Y ). The slope m
m′ and intercept d dm− ′
′ of eq. (4)need to be determined in order to translate XC into XT
and vice versa. For this purpose, the distribution quan-tiles of XC and XT are used.Assuming that NC and NT >NC measurements have
been performed for the high-content and high-through-put techniques, respectively, the ordered set of measure-ments {XC,i}i = 1,...,NC is an estimate of the NC equallyspaced quantiles { }, , ,
�XC i i NC= …1 of the theoretical distri-bution of XC. In the same way, the sample quantiles{ }, , ,�XT i i NC= …1 of {XT,i}i = 1,...,NT estimate the NC theo-
retical quantiles of XT. According to eq. (4) the distribu-tions of XT and XC belong to the same location-scalefamily. Consequently, the QQ-plot of XT versus XC issupposed to follow a straight line with intercept d d
m− ′
′and slope m
m′ . A least squares fit of the QQ-plot givesasymptotically unbiased estimates of slope and interceptfor a large class of theoretical distributions. The conver-gence of the sample quantiles to the theoretical quantilesas well as the convergence of the least squares estimatoris well known and is carried out rigorously in [21].An implementation of this calibration procedure is pro-
vided by the R script [Additional file 1] in the supplement.A sample configuration is given by [Additional file 2].The calibration is then included in the overall procedure
linking high-throughput with high-content data (fig. 1).The essential steps are the calibration and the mathemati-cal model depicted in the center of the workflow diagram.For calibration, the identical cell population is measuredby a single-cell technique as well as a high-throughputmethod to determine a subset of matching quantities,defined as the free variables. At the current state of tech-nology only flow cytometry is widely available and fulfillsthe requirement of generating high-throughput data at thesingle-cell level. This restricts the free variables that can bedetermined experimentally to cell volume (Vcell) and con-centration of a fluorescently labeled marker (Ccell). A high-content technique that can be combined with flow cyto-metry and that can also assess cell volume and fluores-cence intensity is microscopy. As new high-throughputtechniques advance other parameters can be considered asfree variables. The data for the free variables are then com-pared and the resulting calibration creates the possibilityto switch between the different measurement units. Next,the quantities of interest, i.e. any high-content informationdetermined by for example microscopy that is dependenton cell size or concentration of the fluorescently labeledmarker or both, need to be expressed in dependence ofthe free variables. A valid model and parameter estimation
connecting dependent and free variables of the single cellmeasurement has to be identified. The high-throughputmeasurements can then be translated via calibration intothe ambit of single-cell measurements and via the fixedparameter model into cell population quantities. Themethod can be applied to combine experimental data gen-erated by different experimental techniques if the free vari-ables can be measured by all of the techniques used fordata generation.
Nucleocytoplasmic cycling of STAT5B is modeled assaturatable pumpAs an example, the analysis of nuclear import andexport of the transcription factor STAT5B was chosen.Nucleocytoplasmic cycling is only measurable by singlecell microscopy, namely FRAP, whereas other crucialfeatures such as the dynamic changes of the phosphory-lation state of the proteins are accessed by biochemicalmeasurements from cell populations. In eukaryotic cells,the nucleus is separated from the cytoplasm by thenuclear envelope. Molecules can only migrate betweenthose two compartments through nuclear pores formingsmall holes in the membrane. Small molecules (<20-40kDa) can diffuse freely through nuclear pores whereaslarger molecules require active transport aided by solu-ble transport proteins that interact with the cargo mole-cule as well as the nuclear pore. Active nuclear importand export are regulated by different mechanisms. Inorder to be imported into the nucleus, proteins usuallycarry a nuclear localization signal (NLS) to whichimportins can bind and enable nuclear translocation.Similarly, a nuclear export signal (NES) within the cargoprotein structure is recognized by an exportin. For mostproteins of the STAT family, the respective importinshave been identified (reviewed in [22]). In the case ofSTAT5B however, so far no importins could be identi-fied that directly interact with the transcription factor[23]. Instead, import of STAT5B has been suggested torequire additional factors acting as chaperones betweenthe importins and STAT5B [24]. Active nuclear exportof STATs is generally mediated by the exportin CRM1.Here, a simple model for the active transport of
STAT5B through the nuclear pore was used. A singlenuclear pore and the respective import and export fac-tors necessary to transport a single protein of interestwere modeled as a pump [25,26] making the followingassumptions: For small concentrations, the amount ofprotein transported through the pores is proportional tothe concentration. For large concentrations the trans-port current, i.e. the number of molecules per time,saturates. For a large set of nuclear pores for which thecapacity of every pore may vary a Michaelis-Mentencurve is a reasonable way to model the overall current.
Pfeifer et al. BMC Systems Biology 2010, 4:106http://www.biomedcentral.com/1752-0509/4/106
Page 3 of 13

I c Ncc
( ) : .= =+
� βγ
(5)
For large concentrations (c ≫ g) I saturates withsaturation value b. For small concentrations (c ≪ g) Idepends linearly on c with slope β
γ .Equation (5) is the resulting current for all pores of a
cell. The constants b and g may still vary within a popu-lation, i.e. from cell to cell. In a next step the saturationvalue b = kK as well as the slope
= ′K are assumedto depend linearly on a quantity K which is the productof the abundance of transport factors and the numberof nuclear pores. This is appropriate for two reasons:First, if the system is in saturation and the number of
nuclear pores is doubled, then the system has twice thecapacity to transport STAT5B and the current will bedoubled. The same holds for the transport factors.
Hence, the saturation value b is proportional to the pro-duct of transport factor abundance and nuclear porenumber. Second, if the STAT5B concentration is lowand consequently the transport rate is independent ofthe concentration then doubling the number of pores orthe number of transport factors will lead to a doublingof the transport rate. Hence, the transport rate, i.e. the
slope of the current βγ , is proportional to the product as
well. Plugging in b = �K in = ′K reveals that
= ′is independent of K and eq. (5) reads
I cKc
cK( ) .=
′+
(6)
Consequently, given an arbitrary cell from the popula-tion and knowing about K, the current IK is a much bet-ter estimator for the transport current than the mere
Figure 1 Workflow for calibrating and linking data from different experiments. The calibration and model are the crucial steps of theprocedure described here. Data calibration by a quantile-quantile (QQ) plot allows to translate data from one technique to the units of anothermeasurement. Here, it is necessary to determine quantities with a known relationship from the identical cell population by both methods (blue).Furthermore, a model has to be developed to describe the dependent variables only measurable by one technique in terms of the free variablesassessable by both techniques (green). Then, additional cell populations can be measured by the high-throughput technique only and theinformation content of the data can be increased via the calibration and the model (dashed arrows, red) to be finally combined with cellpopulation data for mathematical modeling by an ordinary differential equation (ODE) model (transparent red). General terms are shown in boldletters, the specific case of the example system is given below. Steps shown in transparent colors are not subject of this study.
Pfeifer et al. BMC Systems Biology 2010, 4:106http://www.biomedcentral.com/1752-0509/4/106
Page 4 of 13

population average. The question arising from this is ifand how K is accessible. Three cases seem plausible:
1. K is dominated by the number of nuclear poreswhich have a similar density throughout the cellpopulation. Hence, K depends linearly on thenuclear surface area Anuc.2. K is dominated by the number of cytoplasmictransport factors with the same concentration in allcells which is proportional to the cytoplasmicvolume Vcyt.3. K is dominated by the number of nuclear trans-port factors with the same concentration in all cellswhich is proportional to the nuclear volume Vnuc.
The different hypotheses represent different models,model 1 is without any normalization. Models 2 - 4 aredefined by the respective normalized currents:
jI cAnuc
jI cVnuc
jI cVcyt
A V Vnuc nuc cyt= = =( ),
( ) ( ).and (7)
Reformulating the problem as
j cc
cc c l A V Vl
l
ll nuc nuc cyt( ) ( ) , , ,=
+≡ ⋅ =
(8)
demonstrates the concentration dependency of thenormalized transport currents under the assumptionthat the parameters bl and gl are constant throughoutthe population. This assumption is necessary for a validformula describing the import and export currentswithin a population. The second formulation with al (c)follows the idea of a linearly increasing current for smallconcentrations and will also be used.
Import and export current distribution for STAT5BImport and export currents depend on STAT5Bconcentration and cell sizeTo determine the import and export rates aimp and aexp
39 FRAP data sets generated from cells expressing varyingconcentrations of STAT5B-GFP were fitted with eq. (23)described in the Methods section. Variable protein levelswere achieved by a tightly regulatable expression systemthat we developed based on a Tet-inducible promoter.The cell-to-cell variability of aimp and aexp exceeded
the confidence intervals of the rate values by far (fig.2A). This supported the assumption of a confoundingvariable K. The three hypotheses described above weretested for cell-to-cell variability of the transport rates.The comparison of different normalizations was basedon the normalized currents jl (c) given by equation (8).For every normalization the Michaelis-Menten curve
was determined from a least squares fit, i.e. the differentnormalizations were ranked by decreasing c2 values.The results for no normalization, normalization by thenuclear surface area and normalization by the originat-ing compartment volumes are shown in fig. 2B-D, theestimated parameters are shown in tab. 1.The significance of the c2 reduction has been tested
with a bootstrap method: from the 39 data points 39points have been drawn randomly with replacement.Then for all models, i.e. without normalization, K ∝ A, K∝ Vnuc and K ∝ Vcyt pairwise differences ij i j= −2 2 ofthe c2 values have been computed leading to 6 differencevalues for the import and 6 difference values for theexport models. This procedure has been repeated 104
times resulting in 2 × 6 distributions ijexp( ) and ij
imp( ) ofc2 difference values. The position of zero with respect tosuch a distribution decides whether one of the comparedmodels is superior to the other. More precisely:Let q Pij
exp
ijexp
( )( ) ( )= < 0 be the probability that a value δ
drawn from the distribution ijexp( ) is lower than zero.
Then q pijexp( ) < means that export model j is superior to
export model i at a confidence level of 1 - p. The other wayround, q pij
exp( ) ( )> −1 means that model i is superior tomodel j at 1 - p confidence level. Analogously for imp. Thecomputed values qij
imp( ) and qijexp( ) can be found in fig. 3,
import values in the upper left triangle, export values inthe lower right triangle.For the export distributions model 3 - normalization
by nucleus volume - is superior to all other models at a99% confidence level (3s). For the import data the situa-tion is not so clear. Models 3 and 4 cannot be discrimi-nated and seem to describe the data equally well. Bothmodels are clearly superior to model 1 and exceedmodel 2 at a 1s level.We decided to follow the hypothesis of normalization
by the volumes of the originating compartments, i.e.export model 3 and import model 4. From a biologicalpoint of view this seems to be the most reasonablehypothesis. From a practical point of view, models 3 and4 describe the import equally well and cannot be distin-guished given the data at hand.Calibration of flow cytometry data to microscopy datayields comparable quantitiesData calibration requires the measurement of the identi-cal cell population by both techniques. In con-focalmicroscopy only intact, living cells attached to a surfacecan be observed. However, for flow cytometry cells aredetached from their growth surfaces, generating a cellsuspension of intact, living cells mixed with dead cellsand cell fragments. Therefore, the flow cytometry datahave to be preprocessed, so that it only includes livingcells and is comparable to the microscopy data. Toachieve this, the scatter (F0 ∝ cell cross-section area)
Pfeifer et al. BMC Systems Biology 2010, 4:106http://www.biomedcentral.com/1752-0509/4/106
Page 5 of 13

Figure 2 Rates and currents of STAT5B nucleocytoplasmic cycling. (A) Summary of all rates aimp and aexp. The rates directly correspond tothe exponential of the fits to the FRAP data. Gaussian error propagation leads to the error bars for aimp and aexp. The relative uncertainty of thefitted parameter a1 is negligible compared to the relative uncertainty of the denominator. Relative errors of concentrations and volumes can beestimated to be around 10% and lead to the rate uncertainties. In addition, for the currents (panels (B)-(D)) a small constant error has beenadded to every point to avoid overvaluing small currents. (B) Michaelis-Menten fit for import (left) and export currents (right) not normalized, (C)normalized to nucleus surface area and (D) normalized to the respective originating compartment volume. c2 values of the fit are indicated inthe plot.
Pfeifer et al. BMC Systems Biology 2010, 4:106http://www.biomedcentral.com/1752-0509/4/106
Page 6 of 13

was plotted against the side scatter (F1 ∝ granularity)(fig. 4A). To exclude dead cells and cell fragments, lin-ear cuts were sufficient: a line through the point cloudwas defined by linear regression without intercept forthe scatter plot. Based on this line two perpendicularlines - the cuts - were introduced separating vital cellsin the inner region from undesired cells in the outerregion. The resulting subset of cells had the same
volume and STAT5B-GFP distribution as the micro-scopy cells.To yield comparable distributions, it has to be consid-
ered that different quantities are measured by the twotechniques. Microscopy data directly result in absolutenumbers for compartment volumes and protein concen-trations, whereas flow cytometry data from the fluores-cence intensity channel F2 are logarithmic due to theamplification of the signal by the instrument and theforward scatter of a flow cytometer using light scatteringis an approximate measure of the cell cross-section area(see [27]). Therefore, values from either flow cytometryor microscopy measurements had to be transformed toyield comparable quantities. For practical reasons, themicroscopy fluorescence intensities Imicro were logarith-mized yielding XM = log Imicro. Similarly, cell volumesVmicro determined by microscopy were converted tocross-section areas assuming a spherical shape of thecell as is the case for flow cytometry samples. Thisyields X VM micro= 363
23 · . For flow cytometry, XF = F2
and XF = F0 for fluorescence intensity and cross sectionarea respectively. XM and XF defined like this build thebasis for the calibration method described above.To take the different sensitivities of the two experi-
mental techniques for fluorescence detection into
Table 1 Estimated Parameters
b [mol/s] g [μM]
Iimp 18.04 ± 6.55 3.56 ± 2.63
Iexp 19.01 ± 7.06 6.49 ± 4.71
bA [mM/s] g [μM]
Jimp,A 16.13 ± 3.88 3.12 ± 1.63
Jexp,A 74.72 ± 22.21 7.07 ± 3.96
bV [mM μm/s] g [μM]
Jimp,Vnuc 86.37 ± 18.82 2.98 ± 1.44
Jexp,Vnuc 40.13 ± 10.54 6.81 ± 3.42
Jimp,Vcyt 22.14 ± 5.30 3.43 ± 1.71
Jexp,Vcyt 8.28 ± 2.37 5.31 ± 3.25
Estimated parameters b, bA, bV and g from the c2 fit. The uncertaintiescorrespond to a 1s confidence level.
Figure 3 Pairwise import/export model comparison. Plot of the estimated significance of model difference for pairwise compared importmodels (upper left triangle) and export models (lower right triangle). Values q < 0.5 indicate superiority of the model on the vertical axiscompared to the model on the horizontal axis at a confidence level of 1 - q. Accordingly for values q > 0.5.
Pfeifer et al. BMC Systems Biology 2010, 4:106http://www.biomedcentral.com/1752-0509/4/106
Page 7 of 13
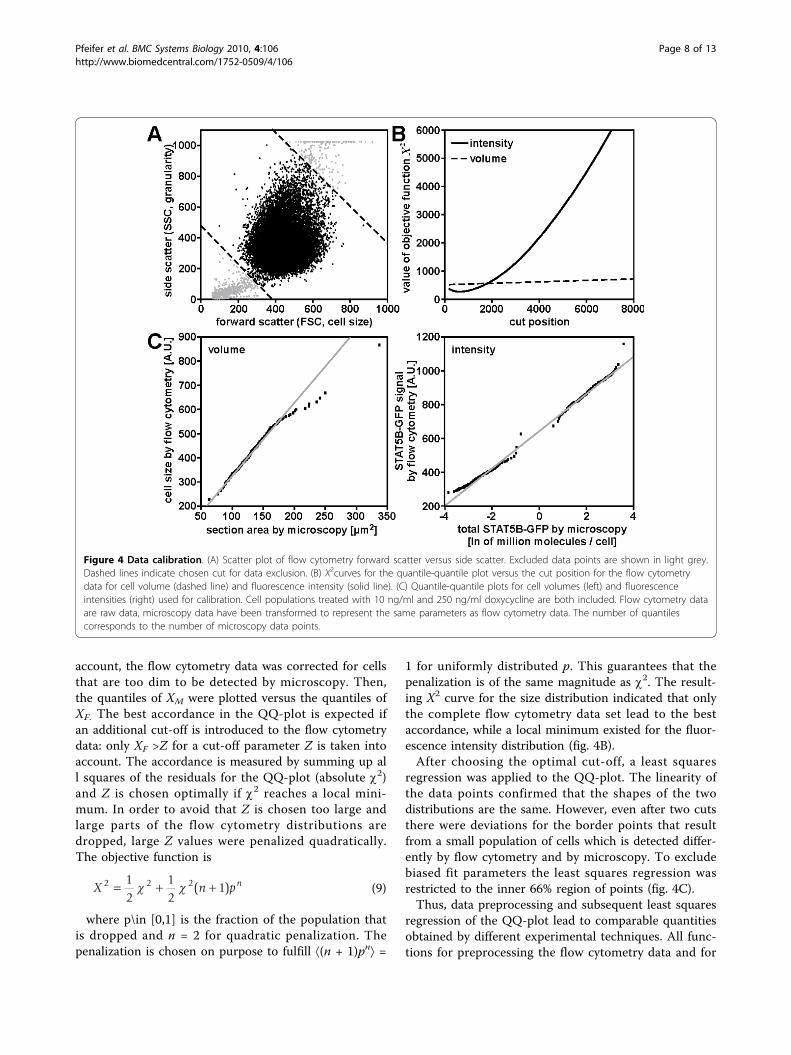
account, the flow cytometry data was corrected for cellsthat are too dim to be detected by microscopy. Then,the quantiles of XM were plotted versus the quantiles ofXF. The best accordance in the QQ-plot is expected ifan additional cut-off is introduced to the flow cytometrydata: only XF >Z for a cut-off parameter Z is taken intoaccount. The accordance is measured by summing up all squares of the residuals for the QQ-plot (absolute c2)and Z is chosen optimally if c2 reaches a local mini-mum. In order to avoid that Z is chosen too large andlarge parts of the flow cytometry distributions aredropped, large Z values were penalized quadratically.The objective function is
X n pn2 2 212
12
1= + +χ χ ( ) (9)
where p\in [0,1] is the fraction of the population thatis dropped and n = 2 for quadratic penalization. Thepenalization is chosen on purpose to fulfill ⟨(n + 1)pn⟩ =
1 for uniformly distributed p. This guarantees that thepenalization is of the same magnitude as c2. The result-ing X2 curve for the size distribution indicated that onlythe complete flow cytometry data set lead to the bestaccordance, while a local minimum existed for the fluor-escence intensity distribution (fig. 4B).After choosing the optimal cut-off, a least squares
regression was applied to the QQ-plot. The linearity ofthe data points confirmed that the shapes of the twodistributions are the same. However, even after two cutsthere were deviations for the border points that resultfrom a small population of cells which is detected differ-ently by flow cytometry and by microscopy. To excludebiased fit parameters the least squares regression wasrestricted to the inner 66% region of points (fig. 4C).Thus, data preprocessing and subsequent least squares
regression of the QQ-plot lead to comparable quantitiesobtained by different experimental techniques. All func-tions for preprocessing the flow cytometry data and for
Figure 4 Data calibration. (A) Scatter plot of flow cytometry forward scatter versus side scatter. Excluded data points are shown in light grey.Dashed lines indicate chosen cut for data exclusion. (B) X2curves for the quantile-quantile plot versus the cut position for the flow cytometrydata for cell volume (dashed line) and fluorescence intensity (solid line). (C) Quantile-quantile plots for cell volumes (left) and fluorescenceintensities (right) used for calibration. Cell populations treated with 10 ng/ml and 250 ng/ml doxycycline are both included. Flow cytometry dataare raw data, microscopy data have been transformed to represent the same parameters as flow cytometry data. The number of quantilescorresponds to the number of microscopy data points.
Pfeifer et al. BMC Systems Biology 2010, 4:106http://www.biomedcentral.com/1752-0509/4/106
Page 8 of 13
calibration of flow cytometry to microscopy data areincluded in the R script 3.1 provided in the supplement.Distributions of transport currents for an exemplary cellpopulation are calculatedIn order to compute the distribution of currents for asample flow cytometry measurement, the calibrationwas combined with the formula describing the currents(eq. (8)). As has been shown above (fig. 2D), the ratesain and aout depend on the STAT5B concentrations Ccyt
in the cytoplasm and Cnuc in the nucleus as well as thecompartment volumes Vnuc and Vcyt for nuclear exportand import, respectively.Since the individual cell compartments cannot be dis-
tinguished by flow cytometry, an average ratio of thecytoplasmic to nuclear quantities had to be estimatedfrom microscopy data. For every FRAP data set, thefractions fV
VcytVnuc
= were determined and averaged. In addi-tion, we tested if the fraction fV and the cell volume Vor fC and the total concentration c of STAT5B-GFP arecorrelated. A large correlation value would indicate thatan additional model for describing the dependency ofthe compartment quantities on the overall quantitieswould be necessary. The data lead to fV = 4.27 ± 0.11and fc = 0.645 ± 0.015 and the correlation test revealedcor(fV, V ) = 0.15 ± 0.28 and cor(fc, c) = -0.37 ± 0.26.Thus, the assumption of a correlation for the cellvolume would not lead to a better estimate of fV Evenfor fc considering the correlation would have a minoreffect.For the population current calculation, only the mean
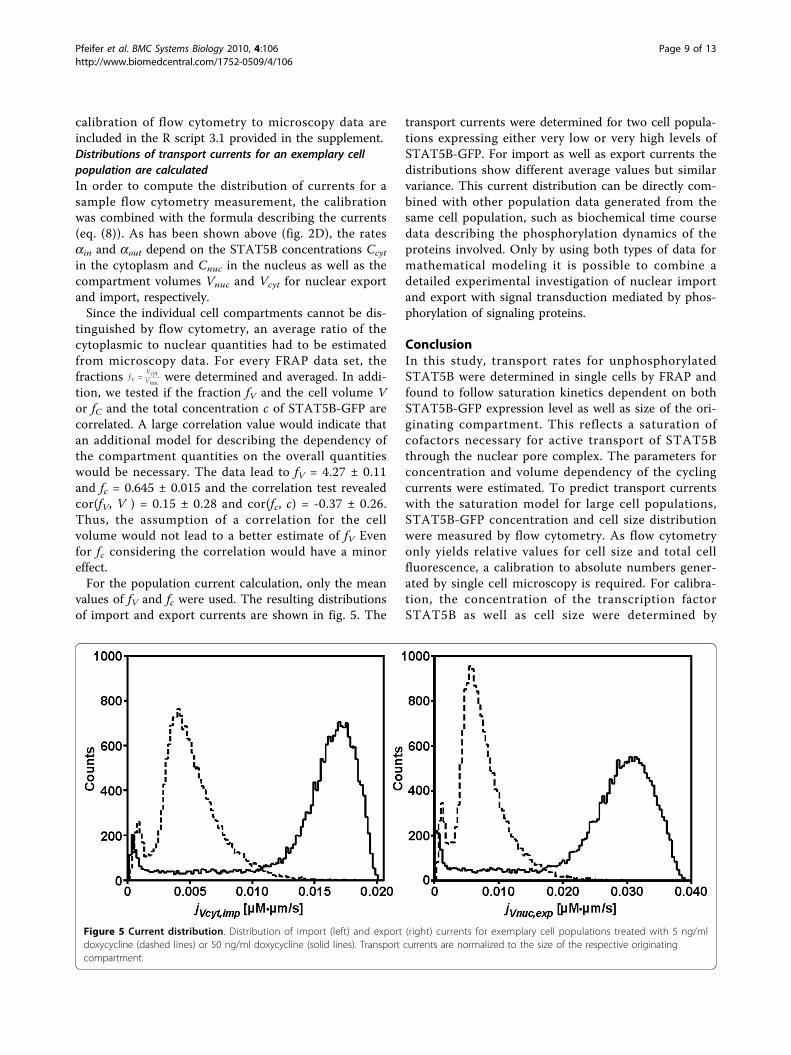
values of fV and fc were used. The resulting distributionsof import and export currents are shown in fig. 5. The
transport currents were determined for two cell popula-tions expressing either very low or very high levels ofSTAT5B-GFP. For import as well as export currents thedistributions show different average values but similarvariance. This current distribution can be directly com-bined with other population data generated from thesame cell population, such as biochemical time coursedata describing the phosphorylation dynamics of theproteins involved. Only by using both types of data formathematical modeling it is possible to combine adetailed experimental investigation of nuclear importand export with signal transduction mediated by phos-phorylation of signaling proteins.
ConclusionIn this study, transport rates for unphosphorylatedSTAT5B were determined in single cells by FRAP andfound to follow saturation kinetics dependent on bothSTAT5B-GFP expression level as well as size of the ori-ginating compartment. This reflects a saturation ofcofactors necessary for active transport of STAT5Bthrough the nuclear pore complex. The parameters forconcentration and volume dependency of the cyclingcurrents were estimated. To predict transport currentswith the saturation model for large cell populations,STAT5B-GFP concentration and cell size distributionwere measured by flow cytometry. As flow cytometryonly yields relative values for cell size and total cellfluorescence, a calibration to absolute numbers gener-ated by single cell microscopy is required. For calibra-tion, the concentration of the transcription factorSTAT5B as well as cell size were determined by
Figure 5 Current distribution. Distribution of import (left) and export (right) currents for exemplary cell populations treated with 5 ng/mldoxycycline (dashed lines) or 50 ng/ml doxycycline (solid lines). Transport currents are normalized to the size of the respective originatingcompartment.
Pfeifer et al. BMC Systems Biology 2010, 4:106http://www.biomedcentral.com/1752-0509/4/106
Page 9 of 13
confocal microscopy and flow cytometry from the iden-tical cell population, resulting in a linear calibrationcurve. Subsequently, absolute cell size and STAT5B-GFP concentration distributions were computed fromflow cytometry data using the calibration curve. Finally,transport current distributions and thereby cell-to-cellvariation were predicted using the saturation model.In recent years, other members of the STAT protein
family have been studied by FRAP to investigate nucleo-cytoplasmic cycling [12,15,28], but the data have so faronly been interpreted qualitatively. Our results provide aprocedure to link directly measured import and exportrates of unphosphorylated STAT5B with data indirectlydescribing the nucleocytoplasmic cycling of activatedSTAT5B generated by biochemical experiments.Furthermore, by using an inducible expression systemfor STAT5B-GFP, we identify a saturation-like behaviorof STAT5B nuclear import and export, indicating a lim-itation in transport factors. The nature of these factorsremains to be identified.The proposed method is generic and is applicable as
long as two conditions are fulfilled. First, the quantitiesthat are measured by a certain high-content methodhave to be functionally related. This allows for expres-sing a subset of the quantities, defined as the dependentvariables, as a function of the remaining, free variables.Second, the free variables have to be part of the quanti-ties that can be measured by a given high-throughputmethod. If these conditions hold, it is possible to deter-mine the function connecting free and dependent vari-ables by setting up a mathematical model andestimating its parameters. Furthermore, it is possible tocalibrate the two measurement techniques against eachother as the high-throughput quantities are in particularpart of the high-content quantities. This means that ahigh-throughput measurement can be translated intothe ambit of a high-content measurement. Applying thefixed parameter model then leads to a prediction of thedependent variables’ distributions representing an indir-ect determination of these variables for every cell of thepopulation. The method is especially useful if there is agreat discrepancy in accessibility between free anddependent variables. This combination of two experi-mental approaches results in a higher degree of mea-sured variables suitable for mathematical modeling anda reduction of non-identifiabilities in the parameterestimation.
MethodsExperimental ProceduresThe retroviral expression vector pMOWS containingthe cDNA for murine HA-EpoR was introduced intoNIH3T3 cells (ATCC) and a single cell clone stablyexpressing HA-EpoR was obtained by selection with
G418. pMOWSIN-TREt-STAT5B-GFP was cotrans-duced into NIH3T3-EpoR cells together with thecDNA for the transactivator protein contained inpMOWS-rtTAM2. A single cell clone stably expressingmurine STAT5B-GFP was obtained by selection withpuromycin. Expression of STAT5BGFP was regulatedby a Tet-inducible promoter included in pMOWSIN-TREt. pMOWSIN-TREt was generated by digestingpTRE-tight (Clontech) and inserting TREt into theself-inactivating (SIN) retroviral vector pMOWSIN.pMOWS-rtTAM2 was generated by introducing cDNAof rtTAM2 from pUHrT-62-1 (H. Bujard, Heidelberg,Germany) into pMOWS using BamHI/EcoRI restric-tion sites [29]. To simplify identification of the nucleicells used for FRAP experiments also were transducedwith pMOWS-H2B-mCherry. All cells were maintainedin DMEM supplemented with 10% calf serum and 1%PenStrep.For FRAP experiments cells were grown to 60-80%
confluency in Labtek chambered coverglasses over night.Doxycycline was added at a concentration of 10-250 ng/ml approximately 16 hours before serum-starvation.Cells were serum-starved in DMEM supplemented with25 mM HEPES pH 7.4 and doxycycline for at least 5hours. Confocal microscopy was performed on a LeicaSP5 with a 63×/1.4 NA oil immersion objective and thepinhole set to 1 Airy unit. All live cell imaging was per-formed at 37°C. For cell volume and STAT5B-GFP con-centration estimation a z-stack of the entire cell wasacquired prior to each FRAP experiment. Cytoplasmicand nuclear volume was estimated from z-stack data bymeasuring the whole cell area or nuclear area of eachslice in ImageJ (see [30]) and calculating the respectivevolume by summing up the voxels per slice. Cytoplas-mic volume Vcyt was calculated as the difference of thenuclear volume Vnuc subtracted from the whole cellvolume Vcell. To avoid overestimation of bright cells dueto scattered light, the number of slices considered wasdetermined by measuring the maximum average inten-sity in a small region of the nucleus over the wholestack. Only those slices with at least half the maximummean intensity were included in the analysis. Meanintensities in the nucleus and the whole cell were con-verted to GFP concentrations by using a dilution seriesof recombinant SBP-GFP in PBS and embedded in 15%polyacrylamide gel as reference. The cytoplasmic con-centration of STAT5B-GFP ccyt was calculated as
cV c V
V
ccyt
cell cell nuc nuc
cyt
= −(10)
To determine import and export currents, STAT5B-GFP was photobleached in the entire nuclear regionwith 100% laser power (488 nm). For analysis of the
Pfeifer et al. BMC Systems Biology 2010, 4:106http://www.biomedcentral.com/1752-0509/4/106
Page 10 of 13

transport dynamics 10 prebleach and approximately 240postbleach images of the whole cell were acquired for30-40 min after bleaching.Flow cytometry analysis of STAT5B-GFP expression
level and measurement of the approximate cell sizewere performed on a BD FACSCalibur system with thesoftware package CellQuest. Cells were grown in 60 mmcell culture dishes and were treated as for microscopy.Cells were detached from the dishes by 0.05% trypsin/EDTA and washed once in PBS/0.3% BSA. For each cellpopulation 20 000 cells were measured. Forward andside scatter were detected linearly, for fluorescenceintensity detection the signal was logarithmically ampli-fied. NIH3T3-EpoR cells were used as control for cellu-lar autofluorescence and cell size. Raw data wasextracted from CellQuest files with FCSExtract [31].Fluorescence intensity values were directly used for ana-lysis. Values for the forward scatter were assumed to beapproximately proportional to the cross-section area ofthe cell [27]. Cell shape was assumed to be roughlyspherical for detached cells and therefore the relationbetween cross-section area and volume is known.For the calibration measurement, cells from one cell
population were seeded in 60 mm dishes as well as Lab-tek chambers 20 hours before the experiment. STAT5B-GFP expression was induced with either 10 or 250 ng/ml doxycycline 16 hours prior to serum-starvation. Flowcytometry analysis was performed as described above. z-stacks of 100 tiled frames were acquired by confocalmicroscopy. For each doxycyline treatment the cellvolume and the total amount of STAT5B-GFP per cellwere determined for 200 cells as described for FRAPexperiments above.
Mathematical ModelImport and export currents from FRAP dataIn the biological system employed here, fluorescentlylabeled STAT5B (STAT5B-GFP) is introduced into thecells in addition to endogenous STAT5B so that
c c ccyt cyt L cyt E= +, , (11)
c c cnuc nuc nuc EL= +, , (12)
consist always of the sum of labeled (L) and endogen-ous (E) molecule concentrations. With the concentra-tions normalized currents are associated:
jccyt Lccyt
jimp impL,,= (13)
jcnuc Lcnuc
jexp expL,, .= (14)
Here imp indicates transport from cytoplasm tonucleus and accordingly exp transport from nucleus tocytoplasm. From the definition of jimp/exp arises a systemof coupled differential equations for the labeled mole-cule concentrations:
cKj
Vc
Kj
Vc ccyt
imp
cyt cytcyt
exp
cyt nucnuc cytL L L L
c c, , , ,= − + − (15)
cKj
Vc
Kj
Vc cnuc
imp
nuc cytcyt
exp
nuc nucnuc nucL L L L
c c, , , , .= − − (16)
As in the previous section K = A, Vcyt, Vnuc accountsfor the normalization. The associated index l is omittedas an index of j. The ε-terms describe the continuousbleaching due to constant laser exposition during post-bleach image acquisition.The two-compartment system is in equilibrium, i.e.
jimp = jexp = j and j(t) is constant in time. Also, during theshort period of photobleaching j remains constant becausethe bleaching process only destroys the fluorescing dyebut not the molecule of interest. By combining equation (8)with the equilibrium condition and the ansatz ccyt/nuc,L(t) =ccyt/nuc,0(t)e
-εt, equation (16) transforms into
c
cK
V V
V V
cyt
nuc
cyt cyt
nuc nuc
imp
imp exp
,
,
exp
0
0
⎛
⎝⎜
⎞
⎠⎟ =
−
−
⎛
⎝
⎜⎜
⎜⎜⎜⎜
⎞
⎠
⎟⎟⎟⎟⎟
⎛
⎝⎜
⎞
⎠⎟
=:
,
,
M
cyt
nuc
c
c
0
0 (17)
with α impj
ccyt= and α exp
jcnuc
= . This linear ODE canbe solved. The system has a constant solution
V c t V c t N constcyt cyt nuc nuc tot, ,( ) ( ) .0 0+ = = (18)
corresponding to the eigenvalue l1 = 0 of M and asolution
c
ct
V
Vecyt
nuc
cyt
nuc
t,
,( )0
0
2⎛
⎝⎜
⎞
⎠⎟ ∝
−⎛
⎝⎜
⎞
⎠⎟
− (19)
with λα α
2 = +impVcyt
expVnuc
.
In the experiment, fluorescent signals Scyt and Snuc aremeasured. The signal
S f t c t f t e c tLt= = −( ) ( ) ( ) ( )
0 (20)
depends linearly on the concentration; the scaling fac-tor f between concentration and signal may be timedependent. In order to get rid of the scaling factor andε, new variables cyt and nuc are introduced and trans-formed using eq. (20):
Pfeifer et al. BMC Systems Biology 2010, 4:106http://www.biomedcentral.com/1752-0509/4/106
Page 11 of 13
cytVcytScyt
VcytScyt VnucSnuc
Vcyt cytNtot
c:
,=+
= 0 (21)
nucVnucSnuc
VcytScyt VnucSnuc
Vnuc nucNtot
c: , .=
+= 0 (22)
Consequently, the experimentally accessible quantitiescyt and nuc are directly associated to the concentrationsappearing in the ODE system. Note that the exponentialdecrease of the signal (due to continuous bleaching) andthe proportionality factor between the signal S and theconcentration cL drop out. This is even true if the pro-portionality factor is time dependent.Using both eq. (19) and the experimental quantities
cyt and nuc
cyt tV
Vnuc t
V
Va e anuc
cyt
cyt
nuc
a t( ) ( )⋅ − ⋅ = +−0 2
1 (23)
can be fitted to an exponential curve and the fit para-meter a1 gives the desired result
imp
cyt
cyt
nuc nuc
a
KV
c
c V
=
+⎛
⎝⎜⎜
⎞
⎠⎟⎟
1
1 1 (24)
exp
nuc
nuc
cyt cyt
a
KV
cc V
=
+⎛
⎝⎜⎜
⎞
⎠⎟⎟
1
1 1.
(25)
The resulting rate function al(c) or equivalently jl(c) =cal(c) can be used for microscopy data: cell images areanalyzed for the quantity K and for fluorescence intensi-ties which allow calculating the protein concentrationsof interest. Plugging these values in the formula for jl(c)yields an estimate for the current between nucleus andcytoplasm of the investigated cell without measuring itexplicitly.
Additional material
Additional file 1: The file is an R script file designed for calibratingflow cytometry data to microscopy data. A documentation of how touse the script is included in the header of the file.
Additional file 2: Sample config file for populist.R. In the file“Purpose” can either be “Calibration” or “Measurement”. “Method” iseither “FACS” or “Microscopy”. “Dox” refers to the preparation and canhave arbitrary numbers. For every value of “Dox”, an extra calibration isperformed. “Intensity” and “Volume” refer to the column names ofmicroscopy and flow cytometry data where intensity and volume valuescan be found. Finally, “File” is the filename of the data file that should beused.
AcknowledgementsThe authors thank Hermann Bujard for the generous gift of the cDNA forrtTAM2. We also thank Clemens Kreutz and Verena Becker for valuablediscussions and critically reading the manuscript.This work was supported by the German Federal Ministry of Education andResearch (BMBF) grants FORSYS-ViroQuant (#0313923), LungSys(FKZ0315415E) and the Excellence Initiative of the German Federal and StateGovernments.
Author details1Division Systems Biology of Signal Transduction, DKFZ-ZMBH Alliance,German Cancer Research Center, Im Neuenheimer Feld 280, 69120Heidelberg, Germany. 2Bioquant, Heidelberg University, BioQuant Building,Im Neuenheimer Feld 267, 69120 Heidelberg, Germany. 3Physics Institute,University of Freiburg, Hermann-Herder-Strasse 3, 79104 Freiburg i.Br.,Germany. 4Freiburg Institute for Advanced Studies (FRIAS), University ofFreiburg, Albertstrasse 19, 79104 Freiburg i.Br., Germany.
Authors’ contributionsACP and DK conceived and designed the methodology. ACP generated allbiological data and wrote parts of the manuscript. DK devised themathematical model, developed the software and wrote parts of themanuscript. JB established the Tet-inducible expression system. UK and JTparticipated in the design of the methodology and critiqued the manuscript.All authors read and approved the final manuscript.
Received: 30 April 2010 Accepted: 5 August 2010Published: 5 August 2010
References1. Sigal A, Milo R, Cohen A, Geva-Zatorsky N, Klein Y, Liron Y, Rosenfeld N,
Danon T, Perzov N, Alon U: Variability and memory of protein levels inhuman cells. Nature 2006, 444(7119):643-646.
2. Spencer SL, Gaudet S, Albeck JG, Burke JM, Sorger PK: Non-genetic originsof cell-to-cell variability in TRAIL-induced apoptosis. Nature 2009,459(7245):428-432.
3. Halter M, Elliott JT, Hubbard JB, Tona A, Plant AL: Cell volume distributionsreveal cell growth rates and division times. J Theor Biol 2009, 257:124-130.
4. Diercks A, Kostner H, Ozinsky A: Resolving cell population heterogeneity:real-time PCR for simultaneous multiplexed gene detection in multiplesingle-cell samples. PLoS One 2009, 4(7):e6326.
5. Masujima T: Live single-cell mass spectrometry. Anal Sci 2009,25(8):953-960.
6. Lapainis T, Rubakhin SS, Sweedler JV: Capillary electrophoresis withelectrospray ionization mass spectrometric detection for single-cellmetabolomics. Anal Chem 2009, 81(14):5858-5864.
7. Pepperkok R, Ellenberg J: High-throughput fluorescence microscopy forsystems biology. Nat Rev Mol Cell Biol 2006, 7(9):690-696.
8. George T, Morrissey P, Cui C, Singh S, Fitzgerald-Bocarsly P: Measurementof cytoplasmic to nuclear translocation. Curr Protoc Cytom 2009.
9. Pfeifer AC, Timmer J, Klingmüller U: Systems biology of JAK/STATsignalling. Essays Biochem 2008, 45:109-120.
10. Meyer T, Begitt A, Lödige I, van Rossum M, Vinkemeier U: Constitutive andIFN-gamma-induced nuclear import of STAT1 proceed throughindependent pathways. EMBO J 2002, 21(3):344-354.
11. Bhattacharya S, Schindler C: Regulation of Stat3 nuclear export. J ClinInvest 2003, 111(4):553-559.
12. Pranada AL, Metz S, Herrmann A, Heinrich PC, Müller-Newen G: Real timeanalysis of STAT3 nucleocytoplasmic shuttling. J Biol Chem 2004,279(15):15114-15123.
13. Liu L, McBride KM, Reich NC: STAT3 nuclear import is independent oftyrosine phosphorylation and mediated by importin-alpha3. Proc NatlAcad Sci USA 2005, 102(23):8150-8155.
14. Zeng R, Aoki Y, Yoshida M, ichi Arai K, Watanabe S: Stat5B shuttlesbetween cytoplasm and nucleus in a cytokine-dependent and-independent manner. J Immunol 2002, 168(9):4567-4575.
15. Iyer J, Reich NC: Constitutive nuclear import of latent and activatedSTAT5a by its coiled coil domain. FASEB J 2008, 22(2):391-400.
16. Marg A, Shan Y, Meyer T, Meissner T, Brandenburg M, Vinkemeier U:Nucleocytoplasmic shuttling by nucleoporins Nup153 and Nup214 and
Pfeifer et al. BMC Systems Biology 2010, 4:106http://www.biomedcentral.com/1752-0509/4/106
Page 12 of 13

CRM1-dependent nuclear export control the subcellular distribution oflatent Stat1. J Cell Biol 2004, 165(6):823-833.
17. Meyer T, Marg A, Lemke P, Wiesner B, Vinkemeier U: DNA binding controlsinactivation and nuclear accumulation of the transcription factor Stat1.Genes Dev 2003, 17(16):1992-2005.
18. Swameye I, Müller TG, Timmer J, Sandra O, Klingmüller U: Identification ofnucleocytoplasmic cycling as a remote sensor in cellular signaling bydatabased modeling. Proc Natl Acad Sci USA 2003, 100(3):1028-1033.
19. Axelrod D, Koppel DE, Schlessinger J, Elson E, Webb WW: Mobilitymeasurement by analysis of fluorescence photobleaching recoverykinetics. Bio-phys J 1976, 16(9):1055-69.
20. Sprague BL, McNally JG: FRAP analysis of binding: proper and fitting.Trends Cell Biol 2005, 15(2):84-91.
21. Das B, Resnick SI: QQ - Plots, Random Sets and Data from a Heavy TailedDistribution. Stochastic Models 2008, 24:103.
22. Reich NC, Liu L: Tracking STAT nuclear traffic. Nat Rev Immunol 2006,6(8):602-612.
23. Ma J, Cao X: Regulation of Stat3 nuclear import by importin alpha5 andimportin alpha7 via two different functional sequence elements. CellSignal 2006, 18(8):1117-1126.
24. Kawashima T, Bao YC, Minoshima Y, Nomura Y, Hatori T, Hori T,Fukagawa T, Fukada T, Takahashi N, Nosaka T, Inoue M, Sato T, Kukimoto-Niino M, Shirouzu M, Yokoyama S, Kitamura T: A Rac GTPase-activatingprotein, MgcRacGAP, is a nuclear localizing signal-containing nuclearchaperone in the activation of STAT transcription factors. Mol Cell Biol2009, 29(7):1796-1813.
25. Timney BL, Tetenbaum-Novatt J, Agate DS, Williams R, Zhang W, Chait BT,Rout MP: Simple kinetic relationships and nonspecific competitiongovern nuclear import rates in vivo. J Cell Biol 2006, 175(4):579-593.
26. Kopito RB, Elbaum M: Reversibility in nucleocytoplasmic transport.Proceedings of the National Academy of Sciences 2007, 104(31):12743-12748.
27. Hawley TS, Hawley RG: Flow Cytometry Protocols (Methods in MoldecularBiology). Humana Press 2004.
28. Köster M, Frahm T, Hauser H: Nucleocytoplasmic shuttling revealed byFRAP and FLIP technologies. Curr Opin Biotechnol 2005, 16:28-34.
29. Ketteler R, Glaser S, Sandra O, Martens UM, Klingmüller U: Enhancedtransgene expression in primitive hematopoietic progenitor cells andembryonic stem cells efficiently transduced by optimized retroviralhybrid vectors. Gene Ther 2002, 9(8):477-487.
30. Rasband W: ImageJ 1997 - 2009.[http://rsb.info.nih.gov/ij].31. Glynn E: FCSExtract. 2006 [http://research.stowers-institute.org/efg/
ScientificSoftware/Utility/FCSExtract/index.htm].
doi:10.1186/1752-0509-4-106Cite this article as: Pfeifer et al.: Model-based extension of high-throughput to high-content data. BMC Systems Biology 2010 4:106.
Submit your next manuscript to BioMed Centraland take full advantage of:
• Convenient online submission
• Thorough peer review
• No space constraints or color figure charges
• Immediate publication on acceptance
• Inclusion in PubMed, CAS, Scopus and Google Scholar
• Research which is freely available for redistribution
Submit your manuscript at www.biomedcentral.com/submit
Pfeifer et al. BMC Systems Biology 2010, 4:106http://www.biomedcentral.com/1752-0509/4/106
Page 13 of 13