Embed Size (px)
Citation preview
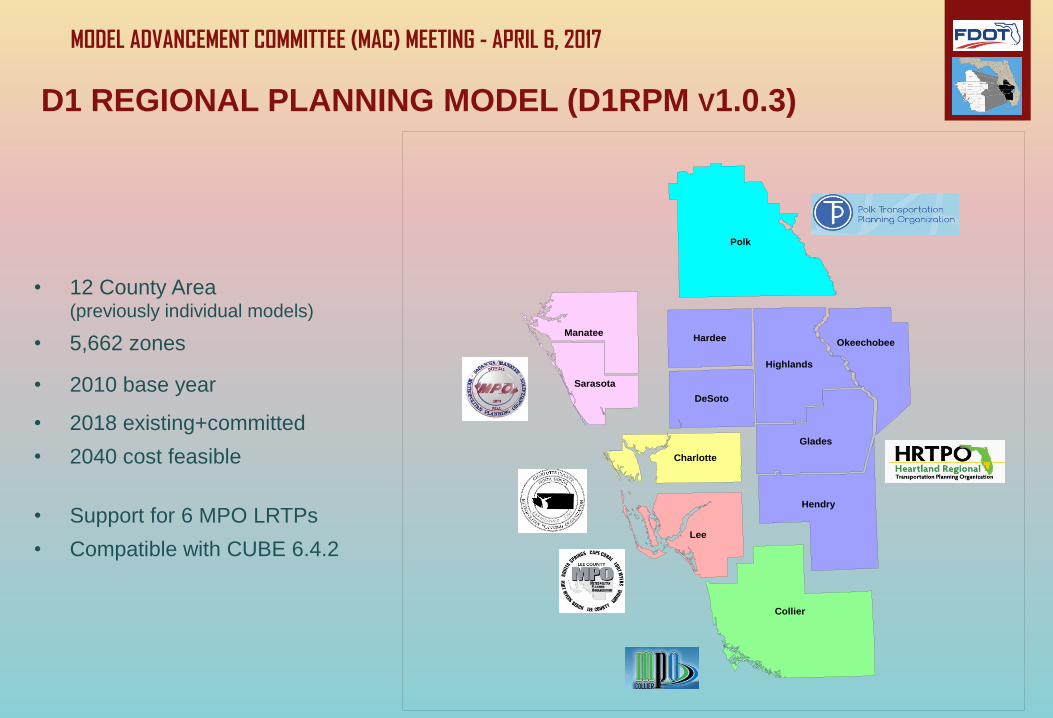
MODEL ADVANCEMENT COMMITTEE (MAC) MEETING ‐ APRIL 6, 2017
D1 REGIONAL PLANNING MODEL (D1RPM V1.0.3)
Polk
Glades
Okeechobee
Highlands
Hardee
Hendry
Charlotte
Collier
DeSoto
Lee
Manatee
Sarasota
• 12 County Area(previously individual models)
• 5,662 zones
• 2010 base year
• 2018 existing+committed
• 2040 cost feasible
• Support for 6 MPO LRTPs
• Compatible with CUBE 6.4.2
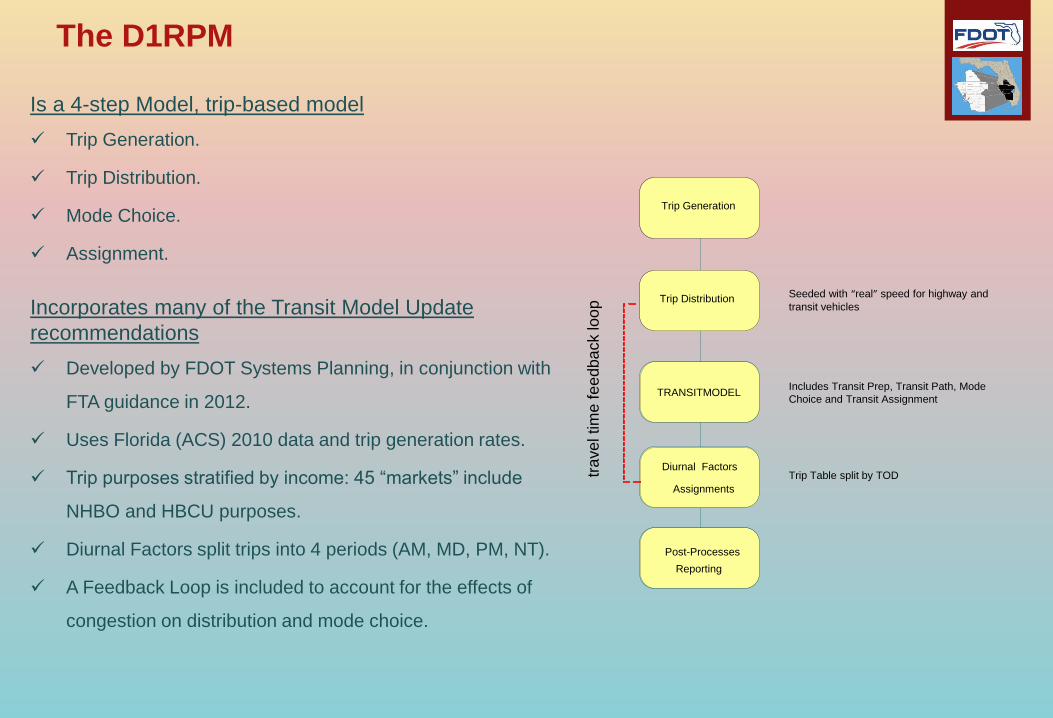
The D1RPM
Is a 4-step Model, trip-based model
Trip Generation.
Trip Distribution.
Mode Choice.
Assignment.
Incorporates many of the Transit Model Update
recommendations
Developed by FDOT Systems Planning, in conjunction with
FTA guidance in 2012.
Uses Florida (ACS) 2010 data and trip generation rates.
Trip purposes stratified by income: 45 “markets” include
NHBO and HBCU purposes.
Diurnal Factors split trips into 4 periods (AM, MD, PM, NT).
A Feedback Loop is included to account for the effects of
congestion on distribution and mode choice.
Trip Generation
Trip Distribution
TRANSITMODEL
Post-Processes
Reporting
Diurnal Factors
Seeded with “real” speed for highway and
transit vehicles
Trip Table split by TODtra
ve
l tim
e f
ee
dba
ck loo
p
Includes Transit Prep, Transit Path, Mode
Choice and Transit Assignment
Assignments
The D1RPM
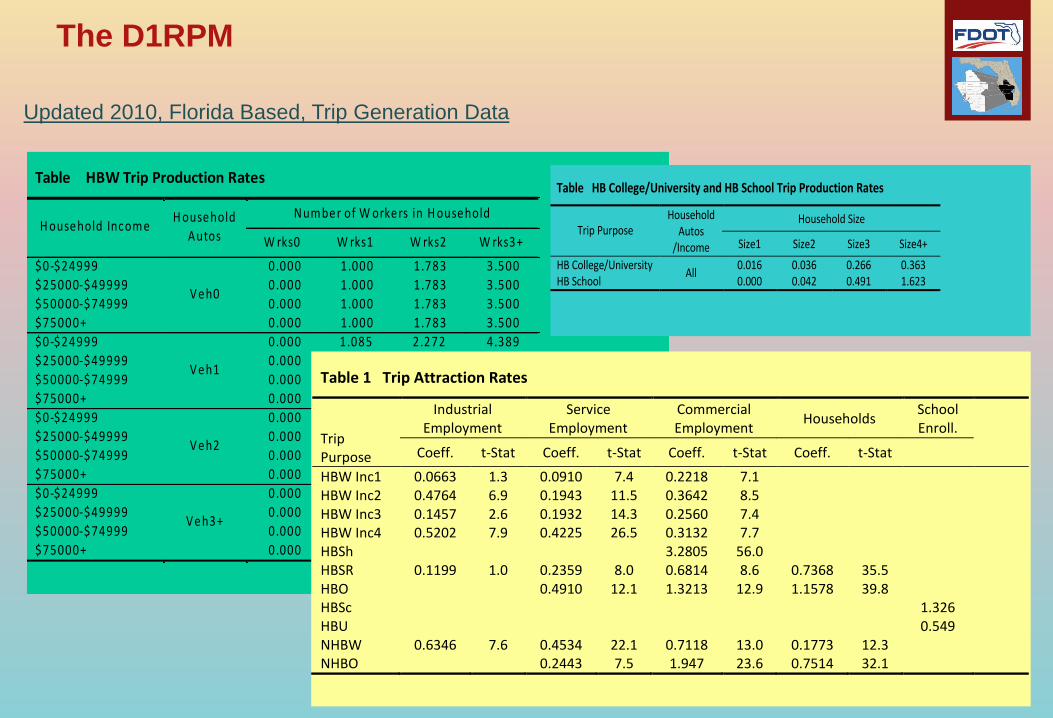
Updated 2010, Florida Based, Trip Generation Data
Table HBW Trip Production Rates
Number of W orkers in H ousehold H ousehold Income
H ousehold
Autos W rks0 W rks1 W rks2 W rks3+
$0-$24999 0.000 1.000 1.783 3.500
$25000-$49999 0.000 1.000 1.783 3.500
$50000-$74999 0.000 1.000 1.783 3.500
$75000+
V eh0
0.000 1.000 1.783 3.500
$0-$24999 0.000 1.085 2.272 4.389
$25000-$49999 0.000 1.332 3.145 4.389
$50000-$74999 0.000 1.145 2.172 4.389
$75000+
V eh1
0.000 0.954 2.094 4.389
$0-$24999 0.000 1.581 2.974 4.102
$25000-$49999 0.000 1.604 3.171 4.102
$50000-$74999 0.000 1.572 2.863 4.102
$75000+
V eh2
0.000 1.330 3.111 4.102
$0-$24999 0.000 1.595 3.130 5.075
$25000-$49999 0.000 2.297 3.109 5.075
$50000-$74999 0.000 1.967 3.247 5.799
$75000+
V eh3+
0.000 1.551 3.119 5.799
Table 1 Trip Attraction Rates
Trip Purpose
Industrial Employment
Service Employment
Commercial Employment
Households School Enroll.
Coeff. t-Stat Coeff. t-Stat Coeff. t-Stat Coeff. t-Stat
HBW Inc1 0.0663 1.3 0.0910 7.4 0.2218 7.1 HBW Inc2 0.4764 6.9 0.1943 11.5 0.3642 8.5 HBW Inc3 0.1457 2.6 0.1932 14.3 0.2560 7.4 HBW Inc4 0.5202 7.9 0.4225 26.5 0.3132 7.7 HBSh 3.2805 56.0 HBSR 0.1199 1.0 0.2359 8.0 0.6814 8.6 0.7368 35.5 HBO 0.4910 12.1 1.3213 12.9 1.1578 39.8 HBSc 1.326 HBU 0.549 NHBW 0.6346 7.6 0.4534 22.1 0.7118 13.0 0.1773 12.3 NHBO 0.2443 7.5 1.947 23.6 0.7514 32.1
Table HB College/University and HB School Trip Production Rates
Household Size Trip Purpose
Household Autos
/Income Size1 Size2 Size3 Size4+
HB College/University 0.016 0.036 0.266 0.363 HB School
All 0.000 0.042 0.491 1.623
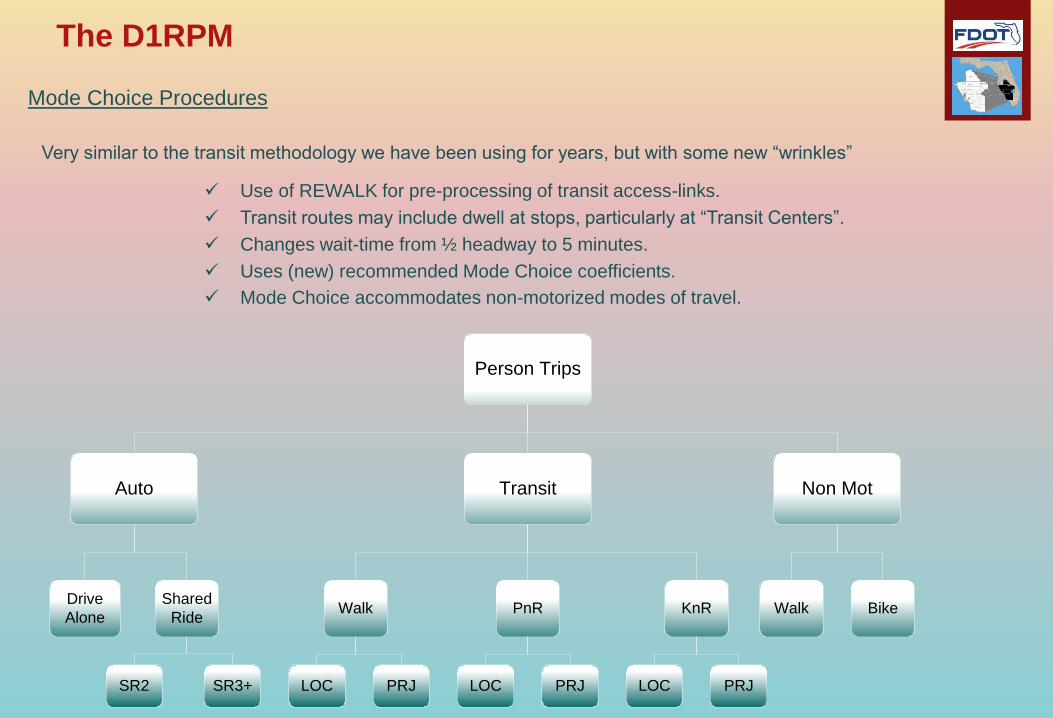
The D1RPM
Mode Choice Procedures
Very similar to the transit methodology we have been using for years, but with some new “wrinkles”
Use of REWALK for pre-processing of transit access-links.
Transit routes may include dwell at stops, particularly at “Transit Centers”.
Changes wait-time from ½ headway to 5 minutes.
Uses (new) recommended Mode Choice coefficients.
Mode Choice accommodates non-motorized modes of travel.
Person Trips
Auto Transit Non Mot
Drive
Alone
Shared
Ride
SR3+
Walk PnR KnR
LOCSR2 PRJ LOC PRJ LOC PRJ
Walk Bike
The D1RPM
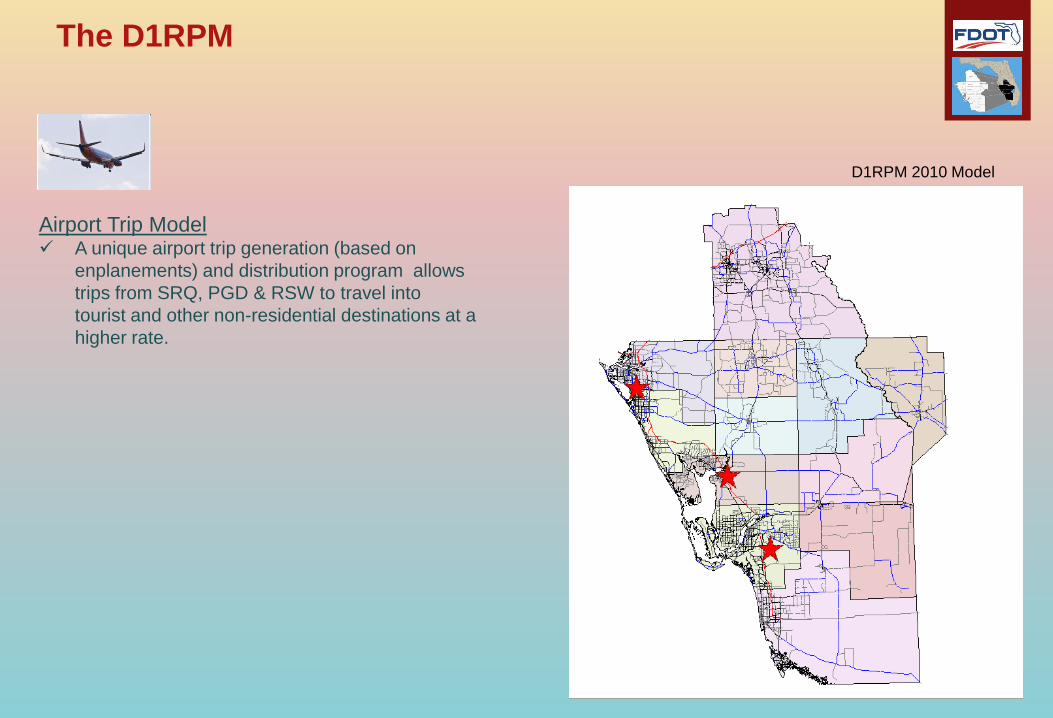
D1RPM 2010 Model
Airport Trip Model A unique airport trip generation (based on
enplanements) and distribution program allows
trips from SRQ, PGD & RSW to travel into
tourist and other non-residential destinations at a
higher rate.
The D1RPM
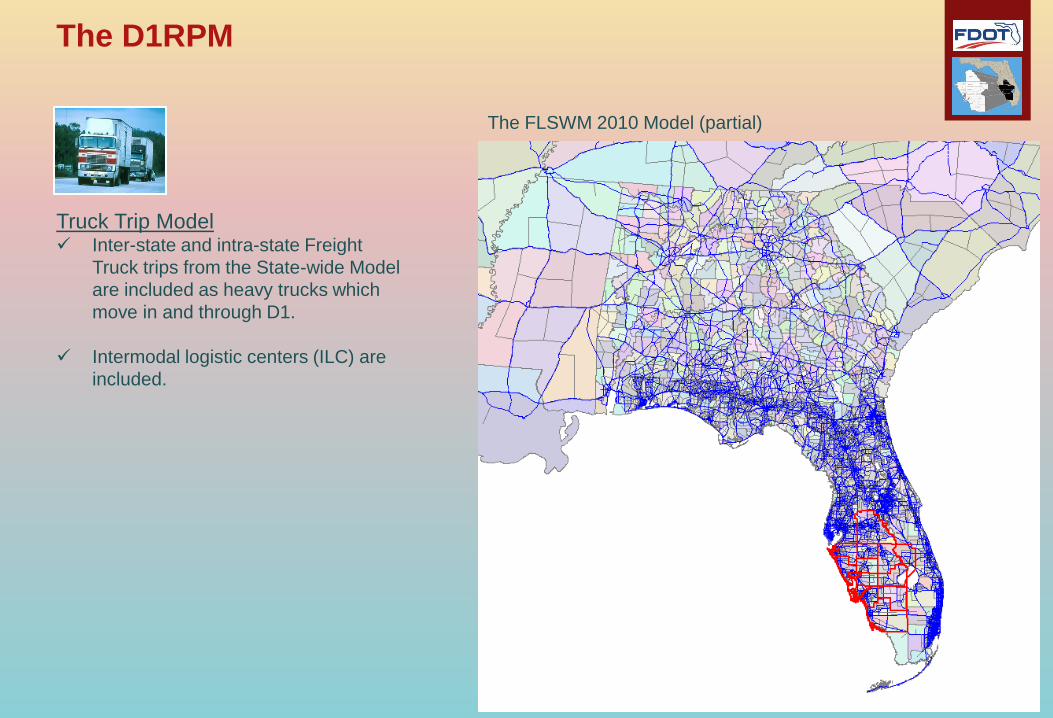
The FLSWM 2010 Model (partial)
Truck Trip Model Inter-state and intra-state Freight
Truck trips from the State-wide Model
are included as heavy trucks which
move in and through D1.
Intermodal logistic centers (ILC) are
included.
The D1RPM
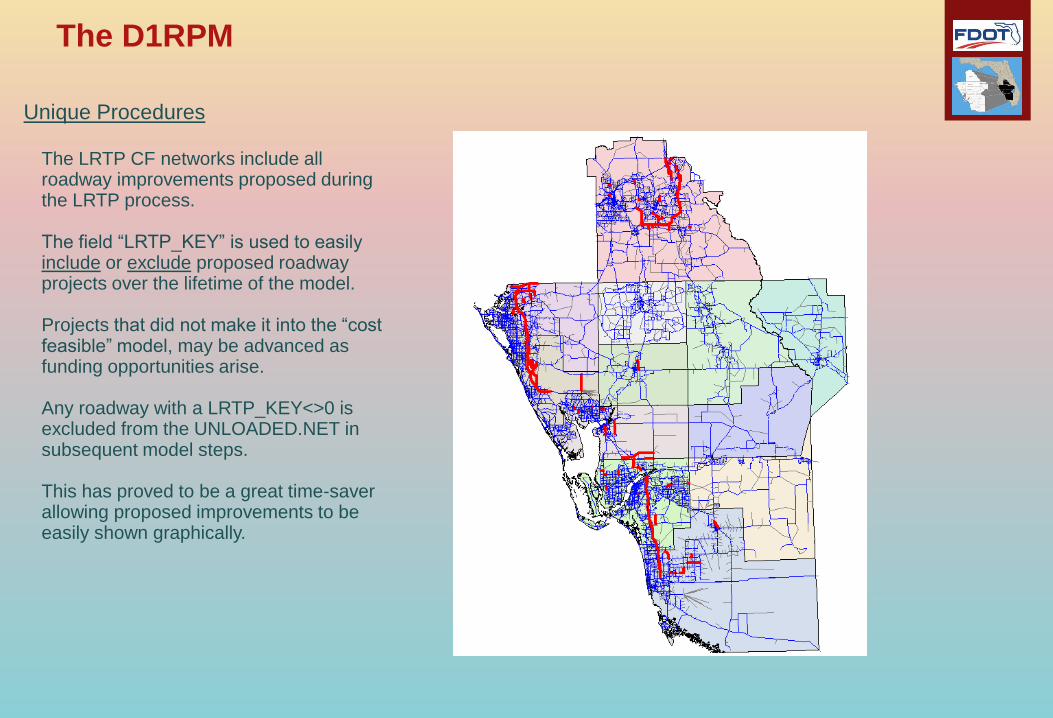
Unique Procedures
The LRTP CF networks include all roadway improvements proposed during the LRTP process.
The field “LRTP_KEY” is used to easily include or exclude proposed roadway projects over the lifetime of the model.
Projects that did not make it into the “cost feasible” model, may be advanced as funding opportunities arise.
Any roadway with a LRTP_KEY<>0 is excluded from the UNLOADED.NET in subsequent model steps.
This has proved to be a great time-saver allowing proposed improvements to be easily shown graphically.
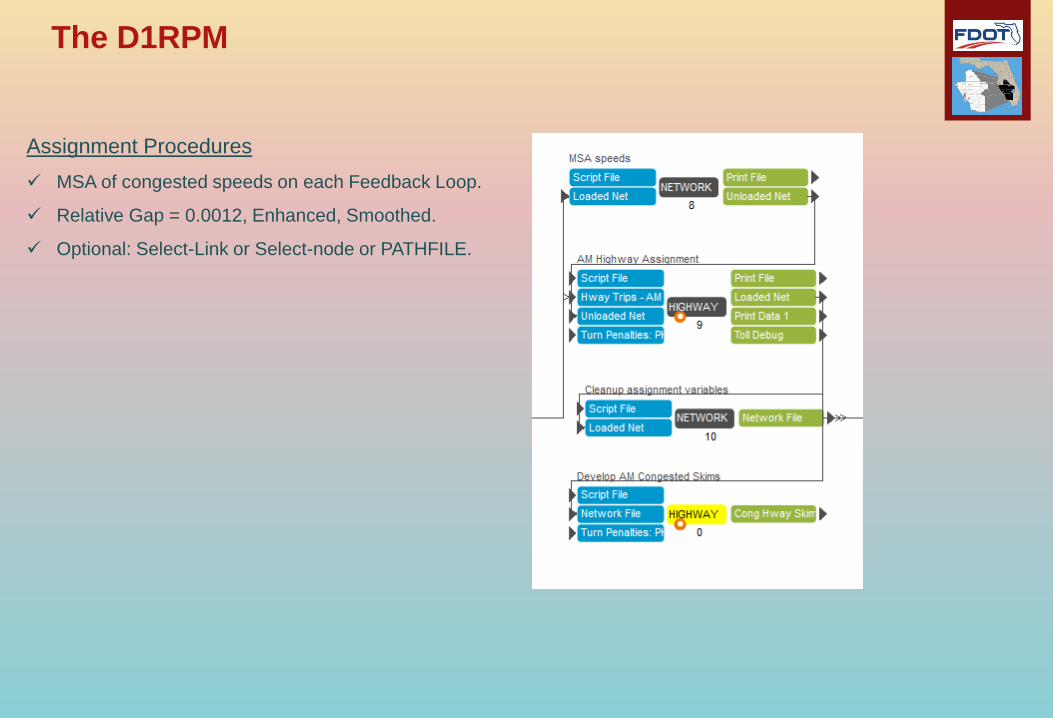
Assignment Procedures
MSA of congested speeds on each Feedback Loop.
Relative Gap = 0.0012, Enhanced, Smoothed.
Optional: Select-Link or Select-node or PATHFILE.
The D1RPM
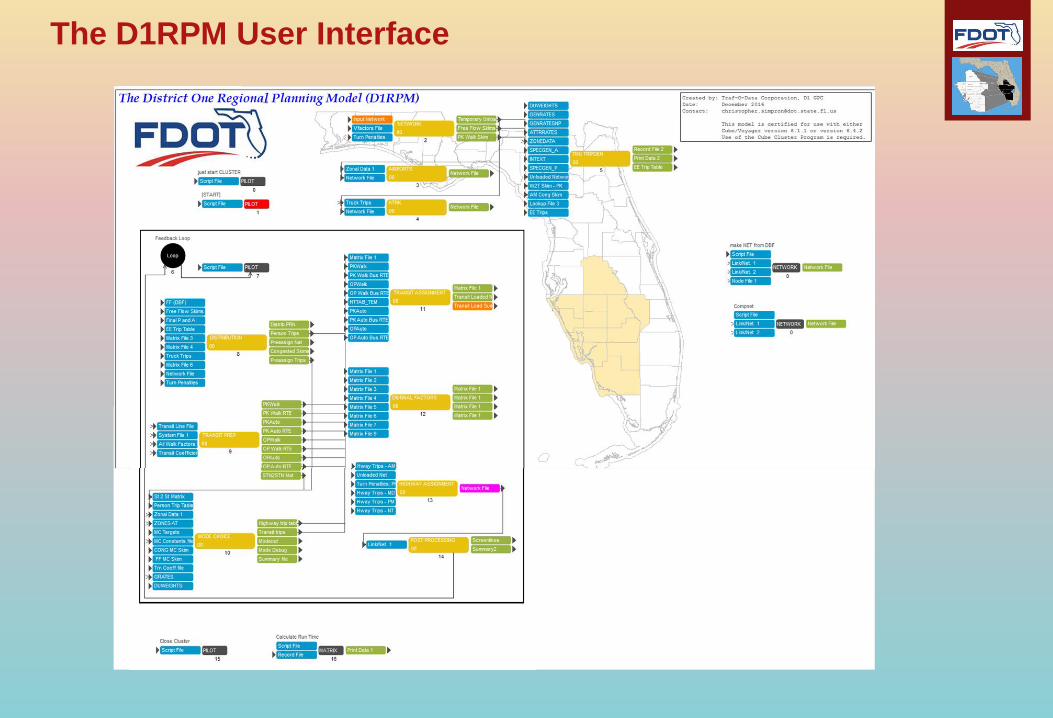
The D1RPM User Interface
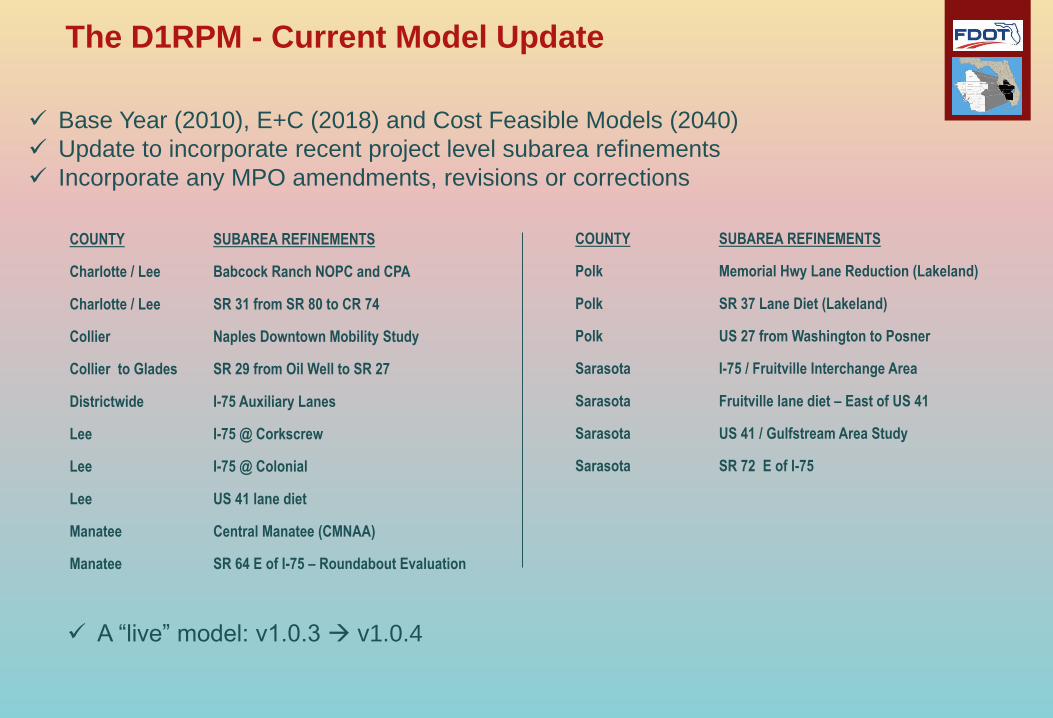
The D1RPM - Current Model Update
COUNTY SUBAREA REFINEMENTS
Charlotte / Lee Babcock Ranch NOPC and CPA
Charlotte / Lee SR 31 from SR 80 to CR 74
Collier Naples Downtown Mobility Study
Collier to Glades SR 29 from Oil Well to SR 27
Districtwide I-75 Auxiliary Lanes
Lee I-75 @ Corkscrew
Lee I-75 @ Colonial
Lee US 41 lane diet
Manatee Central Manatee (CMNAA)
Manatee SR 64 E of I-75 – Roundabout Evaluation
COUNTY SUBAREA REFINEMENTS
Polk Memorial Hwy Lane Reduction (Lakeland)
Polk SR 37 Lane Diet (Lakeland)
Polk US 27 from Washington to Posner
Sarasota I-75 / Fruitville Interchange Area
Sarasota Fruitville lane diet – East of US 41
Sarasota US 41 / Gulfstream Area Study
Sarasota SR 72 E of I-75
A “live” model: v1.0.3 v1.0.4
Base Year (2010), E+C (2018) and Cost Feasible Models (2040)
Update to incorporate recent project level subarea refinements
Incorporate any MPO amendments, revisions or corrections
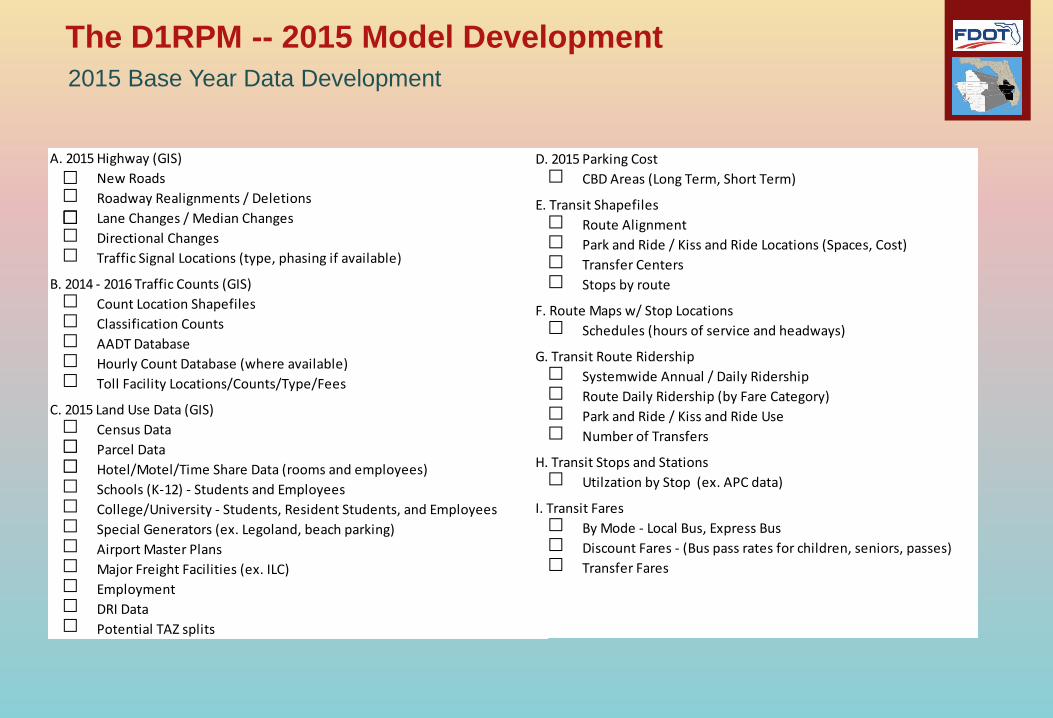
The D1RPM -- 2015 Model Development
2015 Base Year Data Development
A. 2015 Highway (GIS)
New Roads
Roadway Realignments / Deletions
Lane Changes / Median Changes
Directional Changes
Traffic Signal Locations (type, phasing if available)
B. 2014 - 2016 Traffic Counts (GIS)
Count Location Shapefiles
Classification Counts
AADT Database
Hourly Count Database (where available)
Toll Facility Locations/Counts/Type/Fees
C. 2015 Land Use Data (GIS)
Census Data
Parcel Data
Hotel/Motel/Time Share Data (rooms and employees)
Schools (K-12) - Students and Employees
College/University - Students, Resident Students, and Employees
Special Generators (ex. Legoland, beach parking)
Airport Master Plans
Major Freight Facilities (ex. ILC)
Employment
DRI Data
Potential TAZ splits
D. 2015 Parking Cost
CBD Areas (Long Term, Short Term)
E. Transit Shapefiles
Route Alignment
Park and Ride / Kiss and Ride Locations (Spaces, Cost)
Transfer Centers
Stops by route
F. Route Maps w/ Stop Locations
Schedules (hours of service and headways)
G. Transit Route Ridership
Systemwide Annual / Daily Ridership
Route Daily Ridership (by Fare Category)
Park and Ride / Kiss and Ride Use
Number of Transfers
H. Transit Stops and Stations
Utilzation by Stop (ex. APC data)
I. Transit Fares
By Mode - Local Bus, Express Bus
Discount Fares - (Bus pass rates for children, seniors, passes)
Transfer Fares
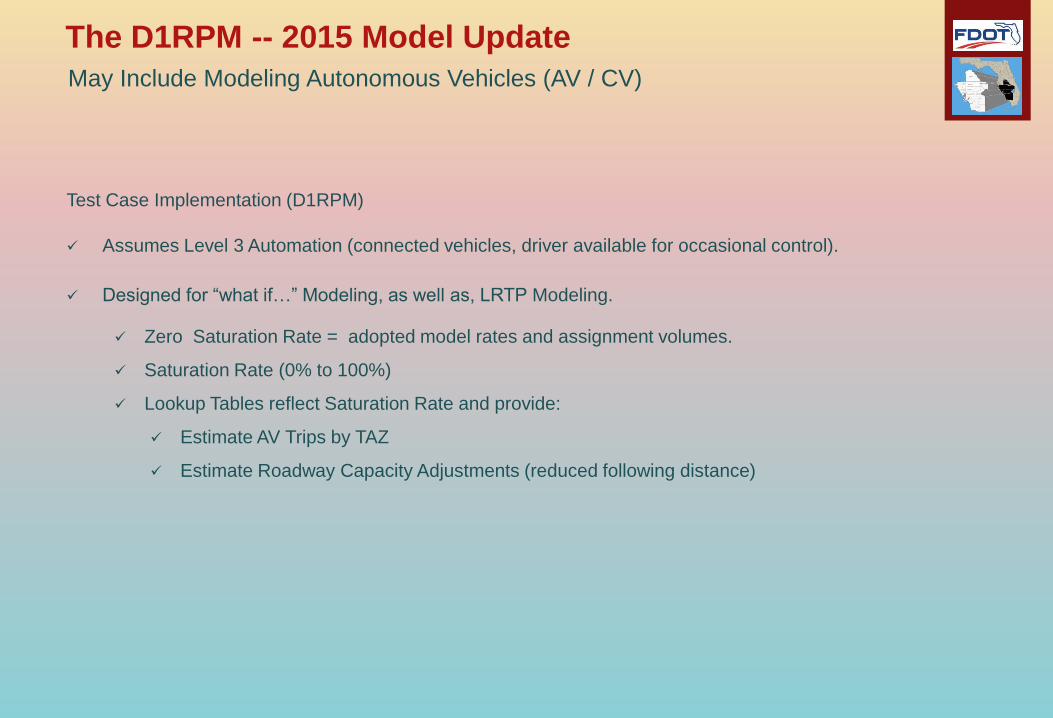
Test Case Implementation (D1RPM)
Assumes Level 3 Automation (connected vehicles, driver available for occasional control).
Designed for “what if…” Modeling, as well as, LRTP Modeling.
Zero Saturation Rate = adopted model rates and assignment volumes.
Saturation Rate (0% to 100%)
Lookup Tables reflect Saturation Rate and provide:
Estimate AV Trips by TAZ
Estimate Roadway Capacity Adjustments (reduced following distance)
The D1RPM -- 2015 Model Update
May Include Modeling Autonomous Vehicles (AV / CV)
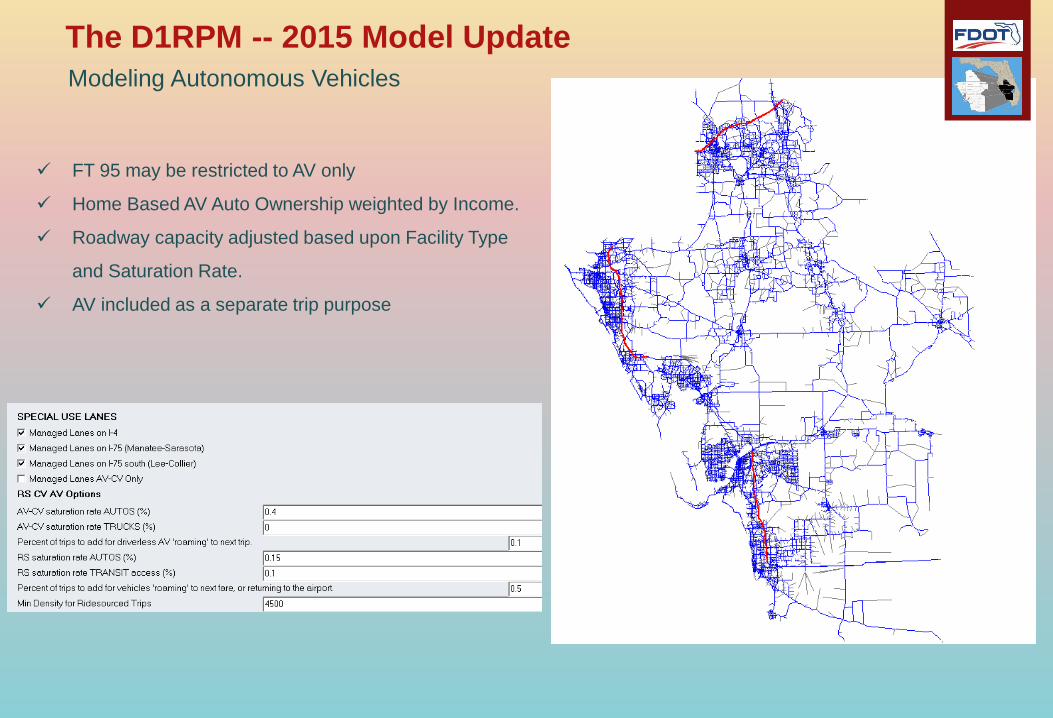
FT 95 may be restricted to AV only
Home Based AV Auto Ownership weighted by Income.
Roadway capacity adjusted based upon Facility Type
and Saturation Rate.
AV included as a separate trip purpose
The D1RPM -- 2015 Model Update
Modeling Autonomous Vehicles
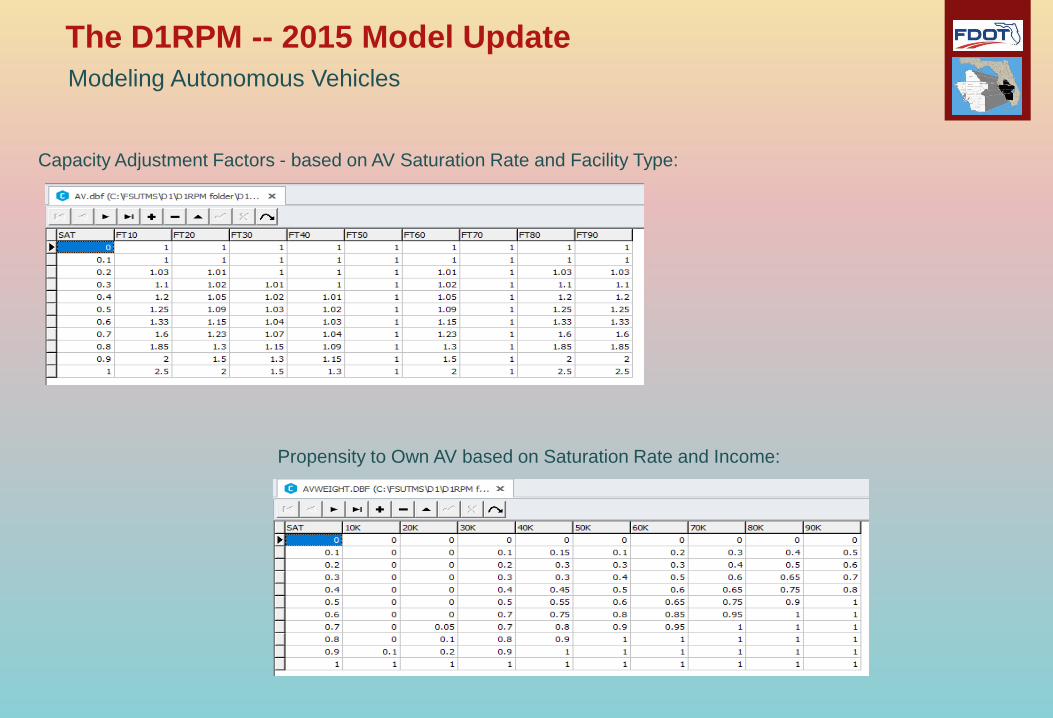
Capacity Adjustment Factors - based on AV Saturation Rate and Facility Type:
Propensity to Own AV based on Saturation Rate and Income:
The D1RPM -- 2015 Model Update
Modeling Autonomous Vehicles
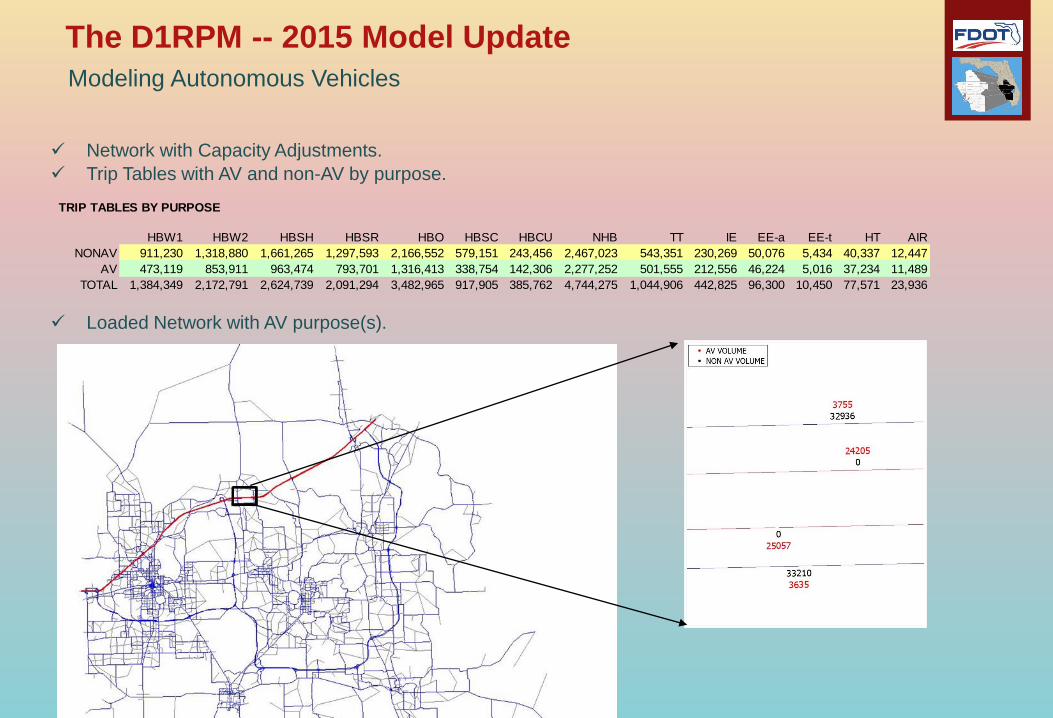
Network with Capacity Adjustments.
Trip Tables with AV and non-AV by purpose.
Loaded Network with AV purpose(s).
TRIP TABLES BY PURPOSE
HBW1 HBW2 HBSH HBSR HBO HBSC HBCU NHB TT IE EE-a EE-t HT AIR
NONAV 911,230 1,318,880 1,661,265 1,297,593 2,166,552 579,151 243,456 2,467,023 543,351 230,269 50,076 5,434 40,337 12,447
AV 473,119 853,911 963,474 793,701 1,316,413 338,754 142,306 2,277,252 501,555 212,556 46,224 5,016 37,234 11,489
TOTAL 1,384,349 2,172,791 2,624,739 2,091,294 3,482,965 917,905 385,762 4,744,275 1,044,906 442,825 96,300 10,450 77,571 23,936
The D1RPM -- 2015 Model Update
Modeling Autonomous Vehicles
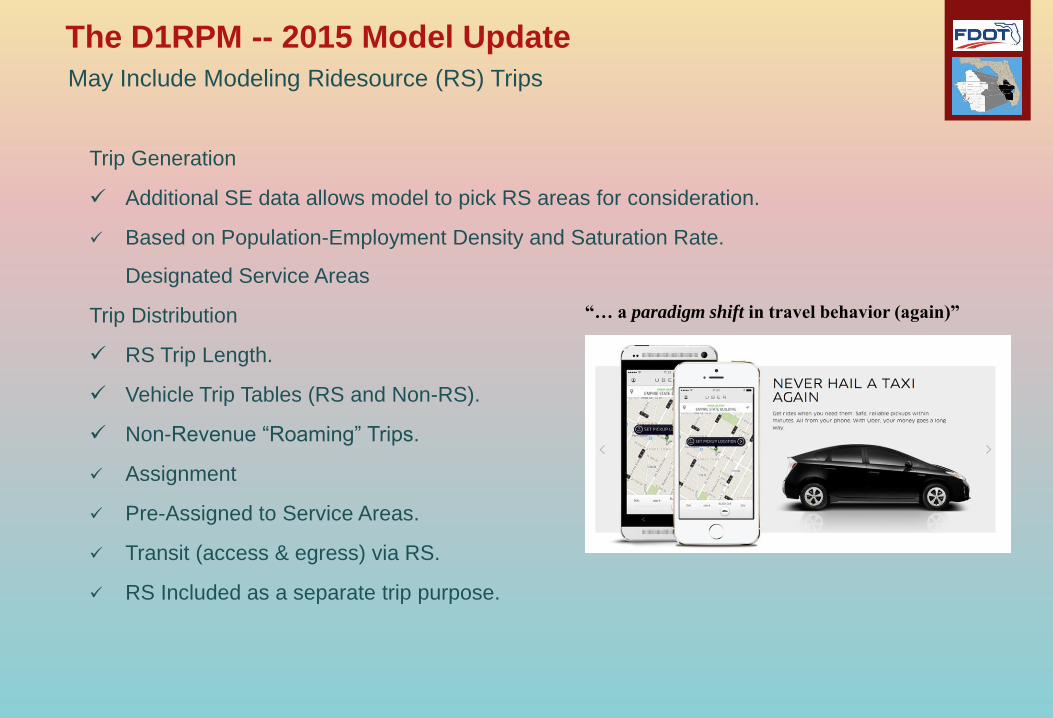
Trip Generation
Additional SE data allows model to pick RS areas for consideration.
Based on Population-Employment Density and Saturation Rate.
Designated Service Areas
Trip Distribution
RS Trip Length.
Vehicle Trip Tables (RS and Non-RS).
Non-Revenue “Roaming” Trips.
Assignment
Pre-Assigned to Service Areas.
Transit (access & egress) via RS.
RS Included as a separate trip purpose.
“… a paradigm shift in travel behavior (again)”
The D1RPM -- 2015 Model Update
May Include Modeling Ridesource (RS) Trips
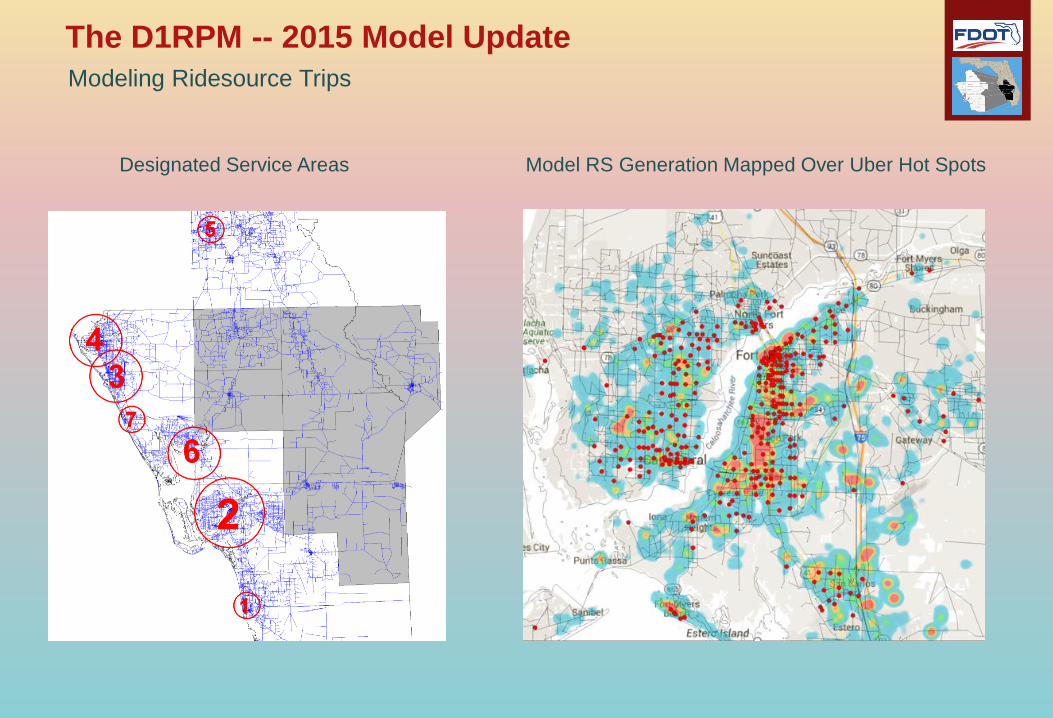
Designated Service Areas Model RS Generation Mapped Over Uber Hot Spots
The D1RPM -- 2015 Model Update
Modeling Ridesource Trips
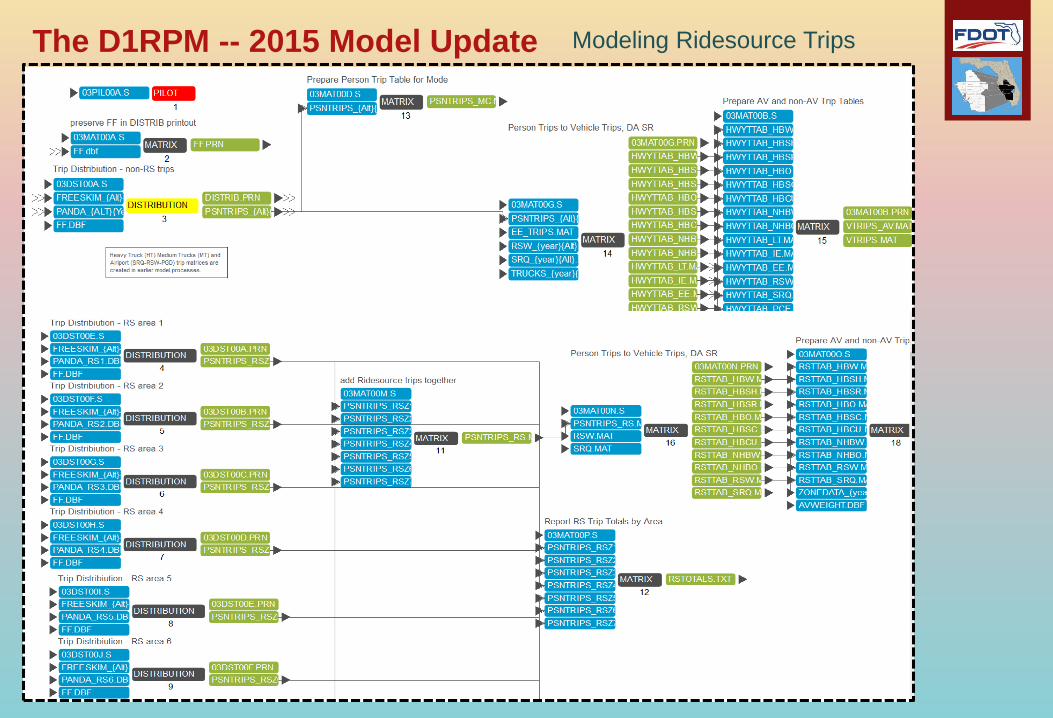
The D1RPM -- 2015 Model Update Modeling Ridesource Trips
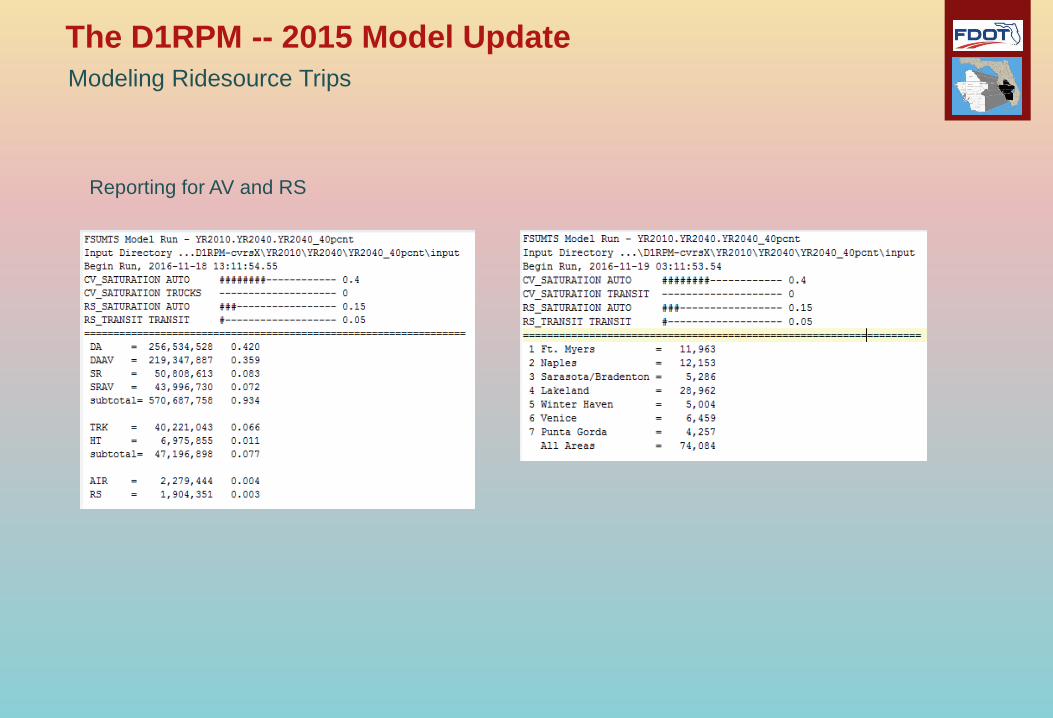
Reporting for AV and RS
The D1RPM -- 2015 Model Update
Modeling Ridesource Trips

EXTRA SLIDES
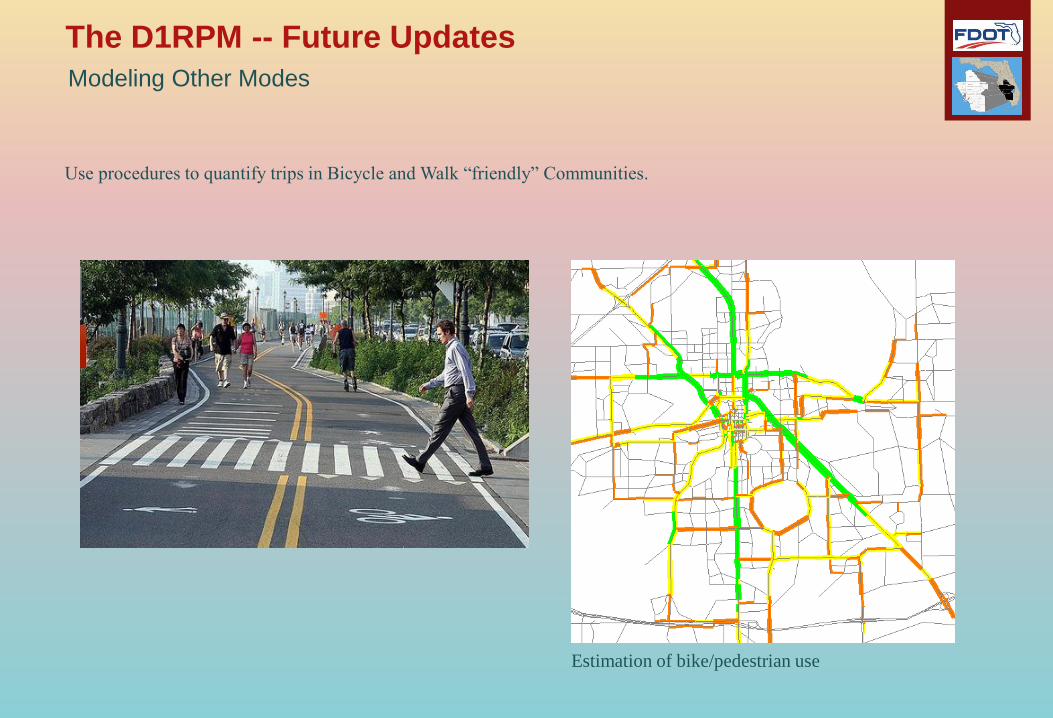
Use procedures to quantify trips in Bicycle and Walk “friendly” Communities.
The D1RPM -- Future Updates
Modeling Other Modes
Estimation of bike/pedestrian use
The D1RPM -- Future Updates
Network
Use of “true-shape”, as needed.
Use of posted speeds.
Trip Generation
Use EE IE data FLSWM
Time-of-Day (TOD) factoring here
Trip Distribution
Distribution by TOD
TRANSITMODEL
Transit periods to match TOD
Mode choice calibration by TOD
Assignment
Tolls by TOD
Enhanced reporting