Embed Size (px)
Citation preview

United States Office of Research and EPA600R-01065 Environmental Protection Development August 2001 Agency Washington DC 20460
Environmental Technology Verification Report
Explosives Detection Technology
SRI Instruments Model 8610C Gas Chromatograph Thermionic Ionization Detection
Oak Ridge National Laboratory
THE ENVIRONMENTAL TECHNOLOGY VERIFICATION PROGRAM
Oak Ridge National Laboratory
Joint Verification Statement
TECHNOLOGY TYPE GAS CHROMATOGRAPHY
APPLICATION MEASUREMENT OF EXPLOSIVES IN CONTAMINATED SOIL
TECHNOLOGY NAME Model 8610C Gas ChromatographThermionic Ionization Detection
COMPANY SRI Instruments
ADDRESS 20720 Earl Street PHONE (310) 214-5092 Torrance CA 90503 FAX (310) 214-5097
WEB SITE wwwsrigccom EMAIL hagoldsmithearthlinknet
The US Environmental Protection Agency (EPA) has created the Environmental Technology Verificashytion Program (ETV) to facilitate the deployment of innovative or improved environmental technologies through performance verification and dissemination of information The goal of the ETV Program is to further environmental protection by substantially accelerating the acceptance and use of improved and cost-effective technologies ETV seeks to achieve this goal by providing high quality peer-reviewed data on technology performance to those involved in the design distribution financing permitting purchase and use of environmental technologies
ETV works in partnership with recognized standards and testing organizations stakeholder groups consisting of regulators buyers and vendor organizations with the full participation of individual technology developers The program evaluates the performance of innovative technologies by developing test plans that are responsive to the needs of stakeholders conducting field or laboratory tests (as appropriate) collecting and analyzing data and preparing peer-reviewed reports All evaluations are conducted in accordance with rigorous quality assurance protocols to ensure that data of known and adequate quality are generated and that the results are defensible
EPA-VS-SCM-48 The accompanying notice is an integral part of this verification statement August 2001
The Department of Defense (DoD) has a similar verification program known as the Environmental Security Technology Certification Program (ESTCP) The purpose of ESTCP is to demonstrate and validate the most promising innovative technologies that target DoDrsquos most urgent environmental needs and are projected to pay back the investment within 5 years through cost savings and improved efficiencies ESTCP demonstrations are typically conducted under operational field conditions at DoD facilities The demonstrations are intended to generate supporting cost and performance data for acceptance or validation of the technology The goal is to transition mature environmental science and technology projects through the demonstration validation phase enabling promising technologies to receive regulatory and end user acceptance in order to be field tested and commercialized more rapidly
The Oak Ridge National Laboratory (ORNL) is one of the verification organizations operating under the Site Characterization and Monitoring Technologies (SCMT) program SCMT which is administered by EPArsquos National Exposure Research Laboratory is one of 12 technology areas under ETV In this verification test ORNL evaluated the performance of explosives detection technologies This verification statement provides a summary of the test results for SRI Instrumentsrsquo Model 8610C gas chromatograph with thermionic ionization detection (GCTID) This verification was conducted jointly with DoDrsquos ESTCP
VERIFICATION TEST DESCRIPTION This verification test was designed to evaluate technologies that detect and measure explosives in soil The test was conducted at ORNL in Oak Ridge Tennessee from August 21 through 30 2000 Spiked samples of known concentration were used to assess the accuracy of the technology Environmentally contaminated soil samples collected from DoD sites in California Louisiana Iowa and Tennessee and ranging in concentration from 0 to approximately 90000 mgkg were used to assess several performance characteristics The primary constituents in the samples were 246-trinitrotoluene (TNT) isomeric dinitrotoluene (DNT) including both 24-dinitrotoluene and 26-dinitrotoluene hexahydro-135-trinitroshy135-triazine (RDX) and octahydro-1357-tetranitro-1357-tetrazocine (HMX) The results of the soil analyses conducted under field conditions by the GCTID were compared with results from reference laboratory analyses of homogenous replicate samples analyzed using EPA SW-846 Method 8330 Details of the verification including a data summary and discussion of results may be found in the report entitled Environmental Technology Verification Report Explosives Detection TechnologymdashSRI Instruments GCTID EPA600R-01065
TECHNOLOGY DESCRIPTION The SRI Model 8610C gas chromatograph (GC) is a transportable instrument that can provide on-site analysis of soils for explosives Coupling this transportable gas chromatograph with a thermionic ionization detector (TID) allows for the determination of explosives in soil matrices following simple sample preparation procedures Samples are extracted in acetone diluted and injected directly onto the GC column within a heated injection port The high temperature of the injection port instantaneously vaporizes the solvent extract and explosives allowing them to travel as a vapor through the GC column in the presence of the nitrogen carrier gas The stationary phase of the GC column and the programmable oven temperature separate the components present in sample extracts based on their relative affinities and vapor pressures Upon elution from the columnrsquos end compounds containing nitro groups are ionized on the surface of the thermionic bead and the increased conductivity of atmosphere within the heated detector is measured with a collector electrode In this verification test the instrument was verified for its ability to detect and quantify 24-dinitrotoluene (24-DNT) RDX and TNT Analytical run times were typically less than 7 min and reporting limits were typically 05 mgkg
EPA-VS-SCM-48 The accompanying notice is an integral part of this verification statement August 2001
VERIFICATION OF PERFORMANCE The following performance characteristics of SRIrsquos GCTID were observed
Precision The mean relative standard deviations (RSDs) for 24-DNT RDX and TNT were 15 14 and 23 respectively indicating that the determinations of all analytes were precise
Accuracy Accuracy was assessed using the performance evaluation (PE) soil samples which were spiked to nominal TNT and RDX concentrations of 0 10 50 100 250 and 500 mgkg each by an independent laboratory The mean percent recoveries for RDX and TNT were 91 and 97 respectively indicating that the analyses were unbiased
False positivefalse negative results Of the 20 blank soils SRI reported TNT in five samples (25 false positives) No false positives were reported for 24-DNT and RDX False positive and false negative results were also estimated by comparing the GCTID result to the reference laboratory result for the environmental and spiked samples (eg whether SRI reported a result as a nondetect that the reference laboratory reported as a detection and vice versa) For these soils 3 of the 24-DNT results and 7 of the TNT results were reported as false positives relative to the reference laboratory results but none of the RDX results were reported as false positives Similarly a small percentage of the results were reported as nondetects by SRI (ie false negatives) when the laboratory reported a detection (2 for RDX 4 for TNT none for 24-DNT)
Completeness The GCTID generated results for all 108 soil samples for a completeness of 100
Comparability A one-to-one sample comparison of the GCTID results and the reference laboratory results was performed for all samples (spiked and environmental) that were reported as detects The correlation coefficient (r) for the comparison of the entire soil data set for TNT (excluding one suspect measurement for the reference laboratory) was 095 (slope (m) = 132) When comparability was assessed for specific concentration ranges the r value did not change dramatically for TNT ranging from 089 to 093 depending on the concentrations selected RDX correlation coefficient with the reference laboratory for all soil results was slightly lower than TNT (r = 085 m = 091) The GCTIDrsquos results for RDX correlated better with the reference laboratory for concentrations lt500 mgkg (r = 096 m = 083) than for samples where concentrations were gt500 mgkg (r = 049 m = 056) For the limited number of data points where both the reference laboratory and SRI reported results for 24-DNT (n = 14) the correlation was 044 (m = 033)
Sample Throughput Throughput was approximately three samples per hour This rate was accomplished by two operators and included sample preparation and analysis
Ease of Use No particular level of educational training is required for the operator but knowledge of chromatographic techniques and experience in field instrument deployments would be advantageous
EPA-VS-SCM-48 The accompanying notice is an integral part of this verification statement August 2001
Overall Evaluation The overall performance of the GCTID for the analysis of 24-DNT RDX and TNT was characterized as precise and unbiased As with any technology selection the user must determine if this technology is appropriate for the application and the projectrsquos data quality objectives For more information on this and other verified technologies visit the ETV web site at httpwwwepagovetv
Gary J Foley PhD W Frank Harris PhD Director Associate Laboratory Director National Exposure Research Laboratory Biological and Environmental Sciences Office of Research and Development Oak Ridge National Laboratory
Jeffrey Marqusee PhD Director Environmental Security Technology Certification Program Department of Defense
NOTICE EPA and ESTCP verifications are based on evaluations of technology performance under specific predetermined criteria and appropriate quality assurance procedures EPA ESTCP and ORNL make no expressed or implied warranties as to the performance of the technology and do not certify that a technology will always operate as verified The end user is solely responsible for complying with any and all applicable federal state and local requirements Mention of commercial product names does not imply endorsement or recommendation
EPA-VS-SCM-48 The accompanying notice is an integral part of this verification statement August 2001
EPA600R-01065 August 2001
Environmental Technology Verification Report
Explosives Detection Technology
SRI Instruments Gas ChromatographThermionic Ionization Detection
By
Amy B DindalCharles K Bayne PhDRoger A Jenkins PhD
Oak Ridge National LaboratoryOak Ridge Tennessee 37831-6120
Eric N Koglin US Environmental Protection Agency
Environmental Sciences Division National Exposure Research Laboratory
Las Vegas Nevada 89193-3478
This verification was conducted in cooperation with the US Department of Defense
Environmental Security Technology Certification Program
Notice
The US Environmental Protection Agency (EPA) through its Office of Research and Development (ORD) and the US Department of Defensersquos Environmental Security Technology Certification Program (ESTCP) Program funded and managed through Interagency Agreement No DW89937854 with Oak Ridge National Laboratory the verification effort described herein This report has been peer and administratively reviewed and has been approved for publication as an EPA document Mention of trade names or commercial products does not constitute endorsement or recommendation for use of a specific product
ii
Table of Contents
List of Figures v List of Tables vii Acknowledgments ix Abbreviations and Acronyms xi
1 INTRODUCTION 1
2 TECHNOLOGY DESCRIPTION 3 Technology Overview 3 Sample Preparation 3 Analytical Procedure 3 Instrument Calibration and Quantification of Sample Results 4
3 VERIFICATION TEST DESIGN 5 Objective 5 Testing Location and Conditions 5 Soil Sample Descriptions 5
Sources of Samples 5 Iowa Army Ammunition Plant 5 Louisiana Army Ammunition Plant 5 Milan Army Ammunition Plant 5 Volunteer Army Ammunition Plant 5 Fort Ord Military Base 5
Performance Evaluation Samples 6 Soil Sample Preparation 6
Sample Randomization 6 Summary of Experimental Design 7 Description of Performance Factors 7
Precision 7 Accuracy 7 False PositiveNegative Results 7 Completeness 8 Comparability 8 Sample Throughput 8 Ease of Use 8 Cost 8 Miscellaneous Factors 8
4 REFERENCE LABORATORY ANALYSES 10 Reference Laboratory Selection 10 Reference Laboratory Method 10 Reference Laboratory Performance 10
5 TECHNOLOGY EVALUATION 12 Objective and Approach 12 Precision 12 Accuracy 12 False PositiveFalse Negative Results 12
iii
Completeness 13 Comparability 13 Sample Throughput 15 Ease of Use 15 Cost Assessment 15
GCTID Costs 16 Labor 16 Equipment 17
Reference Laboratory Costs 17 Sample Shipment 17 Labor and Equipment 18
Cost Assessment Summary 18 Miscellaneous Factors 18 Summary of Performance 18
6 REPRESENTATIVE APPLICATIONS 20
7 REFERENCES 21
Appendix A mdash GCTID Sample Results Compared with Reference Laboratory Results 22 Appendix B mdash Data Quality Objective (DQO) Example 25
iv
List of Figures
1 SRI Model 8610C gas chromatograph 3 2 Comparison of reference laboratory results with GCTID results for all
RDX soil concentrations 14 3 Comparison of reference laboratory results with GCTID results for SRI TNT
soil concentrations lt500 mgkg 15 4 Range of percent difference values for 24-DNT RDX and TNT 16
v
List of Tables
1 Summary of Soil Samples 7 2 Summary of the Reference Laboratory Performance for Soil Samples 11 3 Summary of the Reference Laboratory Performance on Blank Samples 11 4 Summary of GCTID Precision 12 5 Summary of GCTID Accuracy 12 6 Number of GCTID Results within Acceptance Ranges for Spiked Soils 13 7 Summary of GCTID False Positive Performance on Blank Samples 13 8 Summary of the GCTID DetectNondetect Performance Relative to the
Reference Laboratory Results 13 9 GCTID Correlation with Reference Data for Various Vendor
Soil Concentration Ranges 14 10 Estimated Analytical Costs for Explosives-Contaminated Samples 17 11 Performance Summary for the GCTID 19
vii
Acknowledgments
The authors wish to acknowledge the support of all those who helped plan and conduct the verification test analyze the data and prepare this report In particular we recognize Dr Thomas Jenkins (US Army Cold Regions Research and Engineering Laboratory) and Dr Michael Maskarinec (Oak Ridge National Laboratory) who served as the technical experts for this project We thank the people who helped us to obtain the samples from the various sites including Dr Jenkins Danny Harrelson (Waterways Experiment Station) Kira Lynch (US Army Corp of Engineers Seattle District) Larry Stewart (Milan Army Ammunition Plant) Dick Twitchell and Bob Elmore (Volunteer Army Ammunition Plant) For external peer review we thank Dr C L Grant (Professor Emeritus University of New Hampshire) and Harry Craig (US EPA Region 10) for EPA peer review The authors also acknowledge the participation of Hugh Goldsmith of SRI Instruments and Alan Hewitt and Tom Ranney of US Army Cold Regions Research and Engineering Laboratory who performed the analyses during verification testing
For more information on the Explosives Detection Technology Verification contact
Eric N Koglin Roger A Jenkins Project Technical Leader Program Manager Environmental Protection Agency Oak Ridge National Laboratory Environmental Sciences Division Chemical and Analytical Sciences Division National Exposure Research Laboratory PO Box 2008 P O Box 93478 Building 4500S MS-6120 Las Vegas Nevada 89193-3478 Oak Ridge TN 37831- 6120 (702) 798-2432 (865) 574-4871 koglinericepagov jenkinsraornlgov
For more information on SRI Instrumentsrsquo Model 8610C GC contact
Hugh Goldsmith President SRI Instruments 20720 Earl Street Torrance CA 90503 (310) 214-5092 hagoldsmithearthlinknet wwwsrigccom
ix
Abbreviations and Acronyms
D percent difference 2-Am-DNT 2-amino-46-dinitrotoluene 4-Am-DNT 4-amino-26-dinitrotoluene 24-DNT 24-dinitrotoluene 26-DNT 26-dinitrotoluene DNT isomeric dinitrotoluene (includes both 24-DNT and 26-DNT) DoD US Department of Defense EPA US Environmental Protection Agency ERA Environmental Resource Associates ESTCP Environmental Security Technology Certification Program (DoD) ETV Environmental Technology Verification Program FA false-acceptance error rate fn false negative result fp false positive result FR false-rejection error rate GC gas chromatograph GCTID gas chromatograph with thermionic ionization detection HMX octahydro-1357-tetranitro-1357-tetrazine HPLC high-performance liquid chromatograph LAAAP Louisiana Army Ammunition Plant MLAAP Milan Army Ammunition Plant NERL National Exposure Research Laboratory (EPA) NO2 nitro OBOD open burning and open detonation ORNL Oak Ridge National Laboratory PE performance evaluation QA quality assurance QC quality control RDX hexahydro-135-trinitro-135-triazine RSD relative standard deviation SAI Specialized Assays Inc SCMT Site Characterization and Monitoring Technologies Center SD standard deviation TBAOH 5 millimolar (mM) tetrabutyl-ammonium hydroxide TID thermionic ionization detector TNB 135-trinitrobenzene TNT 246-trinitrotoluene
xi
Section 1 mdash Introduction
The US Environmental Protection Agency (EPA) created the Environmental Technology Verification Program (ETV) to facilitate the deployment of innovative or improved environmental technologies through performance verification and dissemination of information The goal of the ETV Program is to further environmental protection by substantially accelerating the acceptance and use of improved and cost-effective technologies ETV seeks to achieve this goal by providing high-quality peer-reviewed data on technology performance to those involved in the design distribution financing permitting purchase and use of environmental technologies
ETV works in partnership with recognized standards and testing organizations and stakeholder groups consisting of regulators buyers and vendor organizations with the full participation of individual technology developers The program evaluates the performance of innovative technologies by developing verification test plans that are responsive to the needs of stakeholders conducting field or laboratory tests (as appropriate) collecting and analyzing data and preparing peershyreviewed reports All evaluations are conducted in accordance with rigorous quality assurance (QA) protocols to ensure that data of known and adequate quality are generated and that the results are defensible
ETV is a voluntary program that seeks to provide objective performance information to all of the participants in the environmental marketplace and to assist them in making informed technology decisions ETV does not rank technologies or compare their performance label or list technologies as acceptable or unacceptable seek to determine ldquobest available technologyrdquo or approve or disapprove technologies The program does not evaluate technologies at the bench or pilot scale and does not conduct or support research Rather it conducts and reports on testing designed to describe the performance of technologies under a range of environmental conditions and matrices
The program now operates 12 centers covering a broad range of environmental areas ETV began with a 5-year pilot phase (1995ndash2000) to test a wide range of partner and procedural alternatives in
various technology areas as well as the true market demand for and response to such a program In these centers EPA utilizes the expertise of partner ldquoverification organizationsrdquo to design efficient processes for conducting performance tests of innovative technologies These expert partners are both public and private organizations including federal laboratories states industry consortia and private sector entities Verification organizations oversee and report verification activities based on testing and QA protocols developed with input from all major stakeholdercustomer groups associated with the technology area The verification described in this report was administered by the Site Characterization and Monitoring Technologies (SCMT) Center with Oak Ridge National Laboratory (ORNL) serving as the verification organization (To learn more about ETV visit ETVrsquos Web site at wwwepagovetv) The SCMT Center is administered by EPArsquos National Exposure Research Laboratory (NERL) Environmental Sciences Division in Las Vegas Nevada
The Department of Defense (DoD) has a similar verification program known as the Environmental Security Technology Certification Program (ESTCP) The purpose of ESTCP is to demonstrate and validate the most promising innovative technologies that target DoDrsquos most urgent environmental needs and are projected to pay back the investment within 5 years through cost savings and improved efficiencies ESTCP responds to (1) concern over the slow pace and cost of remediation of environmentally contaminated sites on military installations (2) congressional direction to conduct demonstrations specifically focused on new technologies (3) Executive Order 12856 which requires federal agencies to place high priority on obtaining funding and resources needed for the development of innovative pollution prevention programs and technologies for installations and in acquisitions and (4) the need to improve defense readiness by reducing the drain on the Departmentrsquos operation and maintenance dollars caused by real world commitments such as environmental restoration and waste management ESTCP demonstrations are typically conducted under operational field conditions at DoD facilities The demonstrations are intended to generate supporting
1
cost and performance data for acceptance or validation of the technology The goal is to transition mature environmental science and technology projects through the demonstration validation phase enabling promising technologies to receive regulatory and end user acceptance in order to be field tested and commercialized more rapidly (To learn more about ESTCP visit ESTCPrsquos web site at wwwestcporg)
EPArsquos ETV program and DoDrsquos ESTCP program established a memorandum of agreement in 1999 to work cooperatively on the verification of technologies that are used to improve environmental cleanup and protection at both DOD and non-DOD sites The verification of field analytical technologies for explosives detection described in this report was conducted jointly by ETVrsquos SCMT Center and ESTCP The verification was conducted at ORNL in Oak Ridge Tennessee from August 21 through 30 2000 The performances of two field analytical techniques for explosives were
determined under field conditions Each technology was independently evaluated by comparing field analysis results with those obtained using an approved reference method EPA SW-846 Method 8330 The verification was designed to evaluate the field technologyrsquos ability to detect and measure explosives in soil The primary constituents in the samples were 246-trinitrotoluene (TNT) isomeric dinitrotoluene (DNT) including both 24shydinitrotoluene (24-DNT) and 26-dinitrotoluene (26-DNT) hexahydro-135-trinitro-135-triazine (RDX) and octahydro-1357-tetranitro-1357shytetrazocine (HMX) Naturally contaminated environmental soil samples ranging in concentration from 0 to about 90000 mgkg were collected from DoD sites in California Louisiana Iowa and Tennessee and were used to assess several performance characteristics This report discusses the performance of SRI Instrumentsrsquo Model 8610C gas chromatograph equipped with a thermionic ionization detector (TID)
2
Section 2 mdash Technology Description
In this section the vendor (with minimal editorial changes by ORNL) provides a description of the technology and the analytical procedure used during the verification testing activities
Figure 1 SRI Model 8610C gas chromatograph
Technology Overview The SRI Model 8610C gas chromatograph (GC) is a transportable instrument that can provide on-site analysis for explosives (Figure 1) Coupling this field-portable gas chromatograph with a thermionic ionization detector allows for the determination of explosives in soil matrices following simple sample preparation procedures The instrument has a TID that uses an electrically heated emission source composed of alkali metals impregnated into a ceramic bead When compounds containing nitro (NO2) functional groups impinge on the beadrsquos surface they are selectively ionized and measured with a collector electrode The stationary phase of the GC column and the programmable oven temperature separate the components present in sample extracts based on their relative affinities and vapor pressures
For instrumental analysis sample extracts are injected directly onto the GC column within a heated injection port The high temperature of the injection port instantaneously vaporizes the solvent extract and explosives allowing them to travel as a vapor through the GC column in the presence of the nitrogen carrier gas Upon elution from the columnrsquos end compounds containing nitro groups are ionized on the surface of the thermionic bead and the increased conductivity of atmosphere within the
heated detector is measured with a collector electrode Analytical run times are typically lt7 min long and baseline resolution often is achieved between explosives that are frequently identified at munition manufacturing facilities depots training ranges and military test centers
Sample Preparation Soil samples were prepared by extracting 20 to 40 g of soil with a 40 mL volume of acetone Extraction was performed by intermittently shaking (manual) the soilacetone slurry for several short time intervals (2 min) over a 30 min extraction period then allowing the soil to settle A clear aliquot of the extractant was filtering by passing it through a Millex SR (05-m) filter using a disposable plastic syringe with a Luer-Lock type fitting To screen sample extracts for high concentrations of nitroaromatic compounds (ie TNT) a 025 mL volume was transferred to a clear 2 mL vial and 001 mL of 5 mM tetrabutyl-ammonium hydroxide (TBAOH [Aldrich]) was added The formation of a dark purple or red solution gives a visual indication that a high concentration of nitroaromatics are present Depending on the color formed extraction aliquots were diluted from 12000 to 110 or not diluted at all prior to analysis
Analytical Procedure Manual injections of 1 L volumes of the acetone extracts are made with a 10-L glass syringe equipped with an extra long needle (60 to 70 cm) into the injection port of a field-portable SRI Model 8610C gas chromatograph equipped with a TID detector The injection port is heated to 225degC and the oven holding the 15-m MXT-1 column (ie 053 mm 15-m crossbond 100 dimethyl polysiloxane film coating) is programmed to separate and elute the explosives of interest The detector voltage and temperature are set at -34 V and 250degC respectively The nitrogen carrier gas is supplied at a pressure of 10 psi or greater and an onshyboard air compressor set at 5 psi supplies make up gas to the detector Operation under these conditions
3
requires only that electrical service and a source of nitrogen gas be available
Instrument Calibration and Quantification of Sample Results A five-point calibration ranging from 04 to 40 mgL in acetone was established at the beginning of
the field trial and when instrumental response for an explosive of interest has changed by more than plusmn20 Concentrations of explosives in sample extracts were calculated from curves generated from the calibration standards Instrument performance was continuously monitored by reanalysis of standards after every fifth sample
4
Section 3 mdash Verification Test Design
Objective The purpose of this section is to describe the verification test design It is a summary of the test plan (ORNL 2000)
Testing Location and Conditions The verification of field analytical technologies for explosives was conducted on the grounds outside of ORNLrsquos Building 5507 in Oak Ridge Tennessee The temperature and relative humidity were monitored during field testing Over the five days of testing the average temperature was 83degF and ranged from 63 to 98degF The average relative humidity was 58 and ranged from 27 to 95
The samples used in this study were shipped to the testing location for evaluation by the vendors Explosives-contaminated soils from Army ammunition plants in Iowa Louisiana Tennessee and a former Army base in California (Fort Ord) were used in this verification Because samples were obtained from multiple DoD sites the samples represented a reasonable cross section of the population of explosives-contaminated matrices such that the versatility of the field technology could be evaluated More specific details about the samples are presented in the following sections
Soil Sample Descriptions The primary contaminants in the soil samples were TNT DNT RDX and HMX The samples also contained trace amounts of 2-amino-46shydinitrotoluene (2-Am-DNT) and 4-amino-26shydinitrotoluene (4-Am-DNT) which are degradation products of TNT The total concentration of explosives ranged from 0 to approximately 90000 mgkg The following sections describe the sites from which the samples were collected
Sources of Samples Iowa Army Ammunition Plant Currently an active site the Iowa Army Ammunition Plant was constructed to load assemble and pack various conventional ammunition and fusing systems Current production includes 120-mm tank rounds warheads for missiles and mine systems During the early years of operation the installation used surface impoundments landfills and sumps for disposal of industrial wastes containing explosives
The major contaminants in these samples are TNT RDX and HMX
Louisiana Army Ammunition Plant The Louisiana Army Ammunition Plant (LAAAP) near Shreveport Louisiana is a government-owned facility that began production in 1942 The facility is currently an Army Reserve plant Production items at LAAAP have included metal parts for artillery shells the plant also loads assembles and packs artillery shells mines rockets mortar rounds and demolition blocks As a result of these activities and the resulting soil and groundwater contamination EPA placed LAAAP on the National Priorities List of contaminated sites (Superfund) in 1989 The major constituents in the samples from this site are TNT RDX and HMX with trace levels of 135-trinitrobenzene (TNB) DNT 2-Am-DNT and 4-Am-DNT
Milan Army Ammunition Plant Currently active the Milan Army Ammunition Plant (MLAAP) in Milan Tennessee was established in late 1940 as part of the prendashWorld War II buildup The facility still has ten ammunition loading assembly and packaging lines Munitions-related wastes have resulted in soil contamination The primary contaminants in these soils are RDX and TNT
Volunteer Army Ammunition Plant The Volunteer Army Ammunition Plant in Chattanooga Tennessee was built in 1941 to manufacture TNT and DNT All production ceased in 1977 Past production practices resulted in significant soil and groundwater contamination In the samples from this site concentrations of TNT and DNT ranged from 10 to 90000 mgkg with significantly smaller concentrations of Am-DNT isomers
Fort Ord Military Base Fort Ord located near Marina California was opened in 1917 as a training and staging facility for infantry troops and was closed as a military installation in 1993 Since then several nonmilitary uses have been established on the site California State University at Monterey Bay has opened its doors on former Fort Ord property the University of California at Santa Cruz has established a new
5
research center there the Monterey Institute of International Studies will take over the officerrsquos club and several other buildings and the postrsquos airfield was turned over to the city of Marina The Army still occupies several buildings
An Army study conducted in 1994 revealed that the impact areas at the inland firing ranges of Fort Ord were contaminated with residues of high explosives (Jenkins Walsh and Thorne 1998) Fort Ord is on the National Priorities List of contaminated sites (Superfund) requiring the installation to be characterized and remediated to a condition that does not pose unacceptable risks to public health or the environment The contaminant present at the highest concentration (as much as 300 mgkg) was HMX much lower concentrations of RDX TNT 2-Am-DNT and 4-Am-DNT are present
Performance Evaluation Samples Spiked soil samples were obtained from Environmental Resource Associates (ERA Arvada Colorado) The soil was prepared using ERArsquos semivolatile blank soil matrix This matrix was a 40 clay topsoil that had been dried sieved and homogenized Particle size was 60 mesh and smaller The samples also referred to as performance evaluation (PE) samples contained known levels of TNT and RDX The concentrations that were evaluated contained 10 50 100 250 and 500 mgkg of each analyte Prior to the verification test ORNL analyzed the spiked samples to confirm the concentrations were within the performance acceptance limits established by the preparation laboratory The method used was a modified Method 8330 similar to the reference laboratory method described in Section 4 For the verification test four replicates were prepared at each concentration level
Blank soil samples were evaluated to determine the technologyrsquos ability to identify samples with no contamination (ie to ascertain the false positive error rate) The soil was collected in Monroe County Tennessee and was certified by ORNL to be free of contamination prior to verification testing A reasonable number of blanks (N = 20) was chosen to balance the uncertainty for estimating the false positive error rate and the required number of blank samples to be measured
Soil Sample Preparation A few weeks prior to the verification test all of the soil samples were shipped in plastic bags at ambient temperature to ORNL The samples were stored frozen (lt0degC) prior to preparation To ensure that the vendors and the reference laboratory analyzed comparable samples the soils were homogenized prior to sample splitting The process was as follows The sample was kneaded in the Ziplock plastic bag to break up large clumps Approximately 1500 g of soil was poured into a Pyrex pan and debris was removed The sample was then air dried overnight The sample was sieved using a 10-mesh (2-mm particle size) screen and placed in a 1-L widemouthed jar After thorough mixing with a metal spatula the sample was quartered After mixing each quarter approximately 250 g from each quarter was placed back in the 1-L widemouthed jar for a total sample amount of approximately 1000 g Analysis by the ORNL method confirmed sample homogeneity (variability of 20 relative standard deviation or less for replicate measurements) The sample was then split into subsamples for analysis during the verification test Each 4-oz sample jar contained approximately 20 g of soil Four replicate splits of each soil sample were prepared for each participant The design included a one-to-one pairing of the replicates such that the vendor and reference lab samples could be directly matched Three replicate sets of samples were also prepared for archival storage To ensure that degradation did not occur the soil samples were frozen (lt0degC) until analysis (Maskarinec et al 1991)
Sample Randomization The samples were randomized in two stages First the order in which the filled jars were distributed was randomized so that the same vendor did not always receive the first jar filled for a given sample set Second the order of analysis was randomized so that each participant analyzed the same set of samples but in a different order Each jar was labeled with a sample number Replicate samples were assigned unique (but not sequential) sample numbers Spiked materials and blanks were labeled in the same manner such that these quality control samples were indistinguishable from other samples All samples were analyzed blindly by both the developer and the reference laboratory
6
Summary of Experimental Design The distribution of samples from the various sites is described in Table 1 A total of 108 soil samples were analyzed with approximately 60 of the samples being naturally contaminated environmental soils and the remaining 40 being spikes and blanks Four replicates were analyzed for each sample type For example 4 replicate splits of each of 3 Fort Ord soils were analyzed for a total of 12 individual Fort Ord samples
Table 1 Summary of Soil Samples
Sample source or type No of soil samples
Fort Ord 12
Iowa 4
LAAAP 16
MLAAP 20
Umatilla 0
Volunteer 12
Spiked 24
Blank 20
Total 108
Description of Performance Factors In Section 5 technology performance is described in terms of precision accuracy completeness and comparability which are indicators of data quality (EPA 1996) False positive and negative results sample throughput and ease of use are also described Each of these performance characteristics is defined in this section
Precision Precision is the reproducibility of measurements under a given set of conditions Standard deviation (SD) and relative standard deviation (RSD) for replicate results are used to assess precision using the following equation
RSD = (SDaverage concentration) times 100 (Eq 1)
The overall RSD is characterized by three summary values
bull mean (average) bull median (50th percentile value at which 50 of
all individual RSD values are below and 50 are above) and
bull range (the highest and lowest RSD values that were reported)
The average RSD may not be the best representation of precision but it is reported for convenient reference RSDs greater than 100 should be viewed as indicators of large variability and possibly non-normal distributions
Accuracy Accuracy represents the closeness of the techshynologyrsquos measured concentrations to known (in this case spikedPE) values Accuracy is assessed in terms of percent recovery calculated by the following equation
recovery = (measured concentration known concentration) times 100 (Eq 2)
As with precision the overall percent recovery is characterized by three summary values mean median and range
False PositiveNegative Results A false positive (fp) result is one in which the technology detects explosives in the sample when there actually are none (Berger McCarty and Smith 1996) A false negative (fn) result is one in which the technology indicates that no explosives are present in the sample when there actually are (Berger McCarty and Smith 1996) The evaluation of fp and fn results is influenced by the actual concentration in the sample and includes an assessment of the reporting limits of the technology False positive results are assessed in two ways First the results are assessed relative to the blanks (ie the technology reports a detected value when the sample is a blank) Second the results are assessed on environmental and spiked samples where the analyte was not detected by the reference laboratory (ie the reference laboratory reports a nondetect and the field technology reports a detection) False negative results also assessed for environmental and spiked samples indicate the frequency that the technology reported a nondetect (ie lt reporting limits) and the reference laboratory reported a detection Note that the reference laboratory results were validated by ORNL so that
7
fpfn assessment would not be influenced by faulty laboratory data The reporting limit is considered in the evaluation For example if the reference laboratory reported a result as 09 mgkg and the technologyrsquos paired result was reported as below reporting limits (lt1 mgkg) the technologyrsquos result was considered correct and not a false negative result
Completeness Completeness is defined as the percentage of measurements that are judged to be usable (ie the result is not rejected) The acceptable completeness is 95 or greater
Comparability Comparability refers to how well the field technology and reference laboratory data agree The difference between accuracy and comparability is that accuracy is judged relative to a known value and comparability is judged relative to the results of a standard or reference procedure which may or may not report the results accurately Note that the reference laboratory result is not assumed to be the ldquocorrectrdquo result This evaluation is performed for comparison of the field analytical technology result with what a typical fixed analytical laboratory might report for the same sample A one-to-one sample comparison of the technology results and the reference laboratory results is performed in Section 5
A correlation coefficient quantifies the linear relationship between two measurements (Draper and Smith 1981) The correlation coefficient is denoted by the letter r its value ranges from ndash1 to +1 where 0 indicates the absence of any linear relationship The value r = ndash1 indicates a perfect negative linear relation (one measurement decreases as the second measurement increases) the value r = +1 indicates a perfect positive linear relation (one measurement increases as the second measurement increases) The slope of the linear regression line denoted by the letter m is related to r Whereas r represents the linear association between the vendor and reference laboratory concentrations m quantifies the amount of change in the vendorrsquos measurements relative to the reference laboratoryrsquos measurements A value of +1 for the slope indicates perfect agreement (It should be noted that the intercept of the line must be close to zero [ie not statistically different from zero] in order for the slope value of +1 to indicate
perfect agreement) Values greater than 1 indicate that the vendor results are generally higher than the reference laboratoryrsquos while values less than 1 indicate that the vendor results are usually lower than the reference laboratoryrsquos
In addition a direct comparison between the field technology and reference laboratory data is performed by evaluating the percent difference (D) between the measured concentrations defined as
D = ([field technology] ndash [ref lab])(ref lab) times 100 (Eq 3)
The range of D values is summarized and reported in Section 5
Sample Throughput Sample throughput is a measure of the number of samples that can be processed and reported by a technology in a given period of time This is reported in Section 5 as the number of samples per hour times the number of analysts
Ease of Use A significant factor in purchasing an instrument or a test kit is how easy the technology is to use Several factors are evaluated and reported on in Section 5
bull What is the required operator skill level (eg technician or advanced degree)
bull How many operators were used during the verification test Could the technology be run by a single person
bull How much training would be required in order to run this technology
bull How much subjective decision-making is required
Cost An important factor in the consideration of whether to purchase a technology is cost Costs involved with operating the technology and the standard reference analyses are estimated in Section 5 To account for the variability in cost data and assumptions the economic analysis is presented as a list of cost elements and a range of costs for sample analysis Several factors affect the cost of analysis Where possible these factors are addressed so that decision makers can independently complete a siteshyspecific economic analysis to suit their needs
8
Miscellaneous Factors Any other information that might be useful to a person who is considering purchasing the technology is documented in Section 5 Examples of information that might be useful to a prospective purchaser are the amount of hazardous waste
generated during the analyses the ruggedness of the technology the amount of electrical or battery power necessary to operate the technology and aspects of the technology or method that make it easy to use
9
Section 4 mdash Reference Laboratory Analyses
Reference Laboratory Selection The verification process is based on the presence of a statistically validated data set against which the performance of the technology may be compared The choice of an appropriate reference method and reference laboratory are critical to the success of the verification test To assess the performance of the explosives field analytical technologies the data obtained from verification test participants were compared to data obtained using conventional analytical methods
The first evaluation of explosives-detection technologies under the ETV program occurred in 1999 Specialized Assays Inc (SAI) now known as TestAmerica Inc of Nashville Tennessee was selected as the reference laboratory for that study A sample holding time study performed by ORNL in May 2000 indicated that the concentration of explosives in the samples had not changed significantly Therefore archived soil samples and the reference laboratory data generated in 1999 were used for comparison with the vendor results
The following describes how SAI was chosen to perform the 1999 analyses Specialized Assays Inc was selected to perform the analyses based on ORNLrsquos experience with laboratories capable of performing explosives analyses using EPA SW-846 Method 8330 ORNL reviewed Specialized Assaysrsquo record of laboratory validation performed by the US Army Corps of Engineers (Omaha Nebraska) EPA and ORNL decided that based on the credibility of the Army Corps program and ORNLrsquos prior experience with the laboratory Specialized Assays would be selected to perform the reference analyses
ORNL conducted an audit of Specialized Assaysrsquo laboratory operations on May 4 1999 This evaluation focused specifically on the procedures that would be used for the analysis of the verification test samples Results from this audit indicated that Specialized Assays was proficient in several areas including quality management documentrecord control sample control and information management Specialized Assays was found to be compliant with implementation of Method 8330 analytical procedures The company
provided a copy of its QA plan which details all of the QA and quality control (QC) procedures for all laboratory operations (Specialized Assays 1999) The audit team noted that Specialized Assays had excellent procedures in place for data backup retrievability and long-term storage ORNL conducted a second audit at Specialized Assays while the analyses were being performed Since the initial qualification visit management of this laboratory had changed because Specialized Assays became part of TestAmerica The visit included tours of the laboratory interviews with key personnel and review of data packages Overall no major deviations from procedures were observed and laboratory practices appeared to meet the QA requirements of the technology test plan (ORNL 1999)
Reference Laboratory Method The reference laboratoryrsquos analytical method presented in the technology test plan followed the guidelines established in EPA SW-846 Method 8330 (EPA 1994) According to Specialized Assaysrsquo procedures soil samples were prepared by extracting 2-g samples of soil in acetonitrile by sonication for approximately 16 h An aliquot of the extract was then combined with a calcium chloride solution to precipitate out suspended particulates After the solution was filtered the filtrate was ready for analysis The analytes were identified and quantified using a high-performance liquid chromatograph (HPLC) with a 254-nm UV detector The primary analytical column was a C-18 reversedshyphase column with confirmation by a secondary cyano column The practical quantitation limit for soil was 05 mgkg
Reference Laboratory Performance ORNL validated all of the reference laboratory data according to the procedure described in the test plan (ORNL 2000) During the validation the following aspects of the data were reviewed completeness of the data package adherence to holding time requirements correctness of the data correlation between replicate sample results evaluation of QC sample results and evaluation of spiked sample results Each of these categories is described in detail in the test plan The reference laboratory reported valid results for all samples so
10
completeness was 100 Preanalytical holding time The accuracy and precision of the reference requirements (14 days to extract 40 days to analyze) laboratory results are summarized in Table 2 were met A few errors were found in a small portion of the data (~4) Those data were corrected for transcription and calculation errors that were identified during the validation One data point a replicate Iowa soil sample was identified as suspect The result for this sample was 08 mgkg the results from the other three replicates averaged 27400 mgkg Inclusion or exclusion of this data point in the evaluation of comparability with the field technology (reported in Section 5) did not significantly change the r value so it was included in the analysis The reference laboratory results for QC samples were flagged when the results were outside the QC acceptance limits The reference laboratory results were evaluated by a statistical analysis of the data Due to the limited results reported for the other Method 8330 analytes only the results for the major constituents in the samples (24-DNT HMX RDX and TNT) are evaluated in this report
Accuracy was assessed using the spiked samples while precision was assessed using the results from both spiked and environmental samples The reference laboratory results were unbiased (accurate) as mean percentage recovery values were near 100 The reference laboratory results were precise all but one of the mean RSDs were less than 30 The one mean RSD that was greater than 30 (soil DNT 56) was for a limited data set of three and the problem was caused by one replicate of one sample
Table 3 presents the laboratory results for blank samples A false positive result is identified as any detected result on a known blank For the soil samples one false positive detection appeared to be a preparation error because the concentration was near 70000 mgkg Overall it was concluded that the reference laboratory results were unbiased precise and acceptable for comparison with the field analytical technology
Table 2 Summary of the Reference Laboratory Performance for Soil Samples
Statistic
Accuracy ( recovery)
Precision a
( RSD)
RDX N = 20
TNT N = 20
24-DNT NR = 3 b
HMX NR = 13
RDX NR = 13
TNT NR = 18
Mean 102 100 56 29 25 29
Median 99 96 25 30 21 25
Range 84ndash141 76ndash174 19ndash123 12ndash63 4ndash63 2ndash72
a Calculated from those samples where all four replicates were reported as a detect b NR represents the number of replicate sets N represents the number of individual samples
Table 3 Summary of the Reference Laboratory Performance on Blank Samples
Statistic Soil
DNT HMX RDX TNT
Number of data points 20 20 20 20
Number of detects 0 0 0 2
of fp results 0 0 0 10
11
Section 5 mdash Technology Evaluation
Objective and Approach The purpose of this section is to present a statistical evaluation of the GCTID data and determine the instrumentrsquos ability to measure explosives in contaminated soil samples The technologyrsquos performance is presented for 24-DNT RDX and TNT including an evaluation of comparability through a one-to-one comparison with the reference laboratory data Other aspects of the technology (such as cost sample throughput hazardous waste generation and logistical operation) are also evaluated in this section Appendix A contains the raw data provided by the vendor during the verification test that were used to assess the performance of the GCTID
Precision Precision is the reproducibility of measurements under a given set of conditions Precision was determined by examining the results of blind
for RDX while 100 (20 of 20) met the criteria for TNT
False PositiveFalse Negative Results Table 7 shows the GCTID performance for false positive (fp) results for blank samples Of the 20 blank soils SRI did not report 24-DNT or RDX in any samples but reported TNT in 5 samples (25 fp) Table 8 summarizes the GCTIDrsquos fp and fn results relative to the reference laboratory results (See Section 3 for a more detailed discussion of this evaluation) For the environmental and spiked soils 3 of the 24-DNT results 0 of the RDX results and 7 of the TNT results were reported as false positives relative to the reference laboratory results (ie the laboratory reported the analyte as a nondetect when SRI reported it as a detect) In the case where the laboratory reported a detection and SRI reported a nondetect (ie false negatives) 0
analyses for four replicates of each sample Data were evaluated for only those samples where all four replicates were reported as a detect For example for RDX NR = 13 (13 sets of four replicates) represents a total of 52 individual sample analyses A summary of the overall precision of the GCTID for the soil sample results is presented in Table 4 For the soil samples the mean RSDs for 24-DNT RDX and TNT were 15 14 and 23 respectively indicating that the analyses were precise
Table 4 Summary of the GCTID Precision
Statistic
Soil RSD a
()
24-DNT NR = 4 b
RDX NR = 13
TNT NR = 17
Mean 15 14 23
Median 90 10 13
Range 89ndash31 5ndash44 2ndash107
Accuracy Accuracy represents the closeness of the GCTIDrsquos measured concentrations to the known content of spiked samples A summary of the GCTIDrsquos overall accuracy for the soil results is presented in Table 5 Note that the PE samples were spiked with only TNT and RDX so accuracy for 24-DNT could not be evaluated For the soil samples the recoveries for both RDX and TNT were similar ranging from 74 to 112 overall The mean recovery values for RDX = 91 and TNT = 97 suggested that the results were unbiased Based on the performance acceptance ranges shown in Table 6 which are the guidelines established by the provider of the spiked materials to gauge acceptable analytical results 90 of the results (18 of 20) met the acceptance criteria
a Calculated from only those samples where all four replicates were reported as a detect
b NR represents the number of replicate sets
Table 5 Summary of the GCTID Accuracy
Statistic
Soil recovery ()
RDX N = 20
TNT N = 20
Mean 91 97
Median 90 96
Range 74ndash112 87ndash110
12
Table 6 Number of GCTID Results within Acceptance Ranges for Spiked Soils
Spike RDX TNT
concentration (mgkg)
Acceptance range (mgkg)
No of results within range
Acceptance range (mgkg)
No of results within range
10 8ndash11 3 out of 4 7ndash13 4 out of 4
50 38ndash57 4 out of 4 35ndash63 4 out of 4
100 76ndash113 3 out of 4 70ndash126 4 out of 4
250 190ndash283 4 out of 4 174ndash315 4 out of 4
500 379ndash566 4 out of 4 348ndash630 4 out of 4
Table 7 Summary of GCTID False Positive Performance on Blank Samples
Statistic 24-DNT RDX TNT
Number of data points 20 20 20
Number of fp results 0 0 5
of total results which were fp 0 0 25
Table 8 Summary of the GCTID DetectNondetect PerformanceRelative to the Reference Laboratory Results
Statistic 24-DNT RDX TNT
Number of data points lab reported as non-detect 74 33 14
Number of fp results by GCTID 2 0 1
of total results which were fp 3 0 7
Number of data points lab reported as detection 14 55 74
Number of fn results by GCTID 0 1 3
of total results which were fn 0 2 4
of the 24-DNT 2 of the RDX and 4 of the TNT results were false negatives
Completeness Completeness is defined as the percentage of measurements that are judged to be usable (ie the result was not rejected) Valid results were obtained by the technology for all 108 soil samples Therefore completeness was 100
Comparability Comparability refers to how well the GCTID and reference laboratory data agreed In this evaluation the laboratory results are not presumed to be the ldquocorrectrdquo answers Rather these results represent what a typical fixed laboratory would report for these types of samples A one-to-one sample comparison of the GCTID results and the reference laboratory results was performed for all
13
environmental and spiked samples that were reported as a detect (Please refer to Appendix A to review the raw data See Section 4 for a complete evaluation of the reference laboratory results) In Table 9 the comparability of the results are presented in terms of correlation coefficients (r) and slopes (m) of the linear regression analysis
A limited number of comparable data points (N = 14) was available for 24-DNT All of these values
were less than 50 mgkg The correlation coefficient for the comparison was 044 (m = 033) for the entire soil data set of 24-DNT results Figure 2 is a plot of the GCTID RDX results versus those for the reference laboratory for all results (N = 52) One unusual SRI result at approximately 8000 mgkg is highlighted by a box surrounding the point This data point greatly influenced the correlation coefficient value The GCTID correlation coefficient with the reference laboratory for all
Table 9 GCTID Correlation with Reference Data for Various Vendor Soil Concentration Ranges
Vendor concentration
range
24-DNT RDX TNT a
Correlation coefficient
(r)
Slope (m)
Correlation coefficient
(r)
Slope (m)
Correlation coefficient
(r)
Slope (m)
All values b 044 033 085096 c 091086 095 132
500 mgkg d 044 033 096 083 089 072
gt500 mgkg na e na 049084 056064 093 146
gt10000 mgkg na na na na 089 146
a Excluding the one reference laboratory TNT unusual valueb Excluding those values reported as ldquolt reporting limitsrdquoc Includingexcluding the one SRI unusual valued Based on SRIrsquos reported values eNo values above were reported at this concentration level
GC
TID
RD
X r
esul
t (m
gkg
) 10000
8000
6000
4000
2000
0
0 1000 2000 3000 4000 5000 6000 7000
Reference laboratory RDX result (mgkg)
Figure 2 Comparison of reference laboratory results with GCTID results for all RDX soil concentrations The data point highlighted by a box is considered an unusual value for SRI Please refer to Table 9 for regression constants calculated with and without this unusual value
14
samples was 085 (m = 091) including the unusual value and 096 (m = 086) excluding it The effect is even more pronounced when the results are evaluated exclusively for samples where concentrations were gt500 mgkg [r = 049 (m = 056) including the unusual value while r = 084 (m = 064) excluding it] The GCTIDrsquos correlation coefficient with the reference laboratory for RDX concentrations lt500 mgkg was r = 096 (m = 083) The correlation coefficient for the comparison of the entire soil data set for TNT (excluding one suspect measurement for the reference laboratory) was 095 (m = 132) When comparability was assessed for specific concentration ranges the r value did not change dramatically for TNT ranging from 089 to 093 depending on the concentrations selected Figure 3 presents a plot of the GCTID TNT results versus those for the reference laboratory for concentrations lt500 mgkg As this figure indicates the GCTID TNT soil measurements generally agreed with but were slightly lower than the reference laboratory results
Another metric of comparability is the D between the reference laboratory and the GCTID results The ranges of D values for 24-DNT RDX and TNT are presented in Figure 4 Acceptable D values would be between ndash25 and 25 or near the middle of the x-axis of the plots For 24-DNT the values were mostly negative indicating that the GCTID result was usually less than the reference laboratory result For RDX 65 of the D values were between ndash25 and 25 supporting the
conclusions that the RDX results generally agreed with the reference laboratory results For TNT most of the D values are near the middle of the x-axis with 45 of the results were between ndash25 and 25 The median absolute D values for 24-DNT RDX and TNT were 66 19 and 28 respectively
Sample Throughput Sample throughput is representative of the estimated amount of time required to prepare and analyze the sample and perform the data analysis Operating in the field the two-person SRI team accomplished a sample throughput rate of approximately three samples per hour for the 108 soil analysis The instrument run time for each analysis was approximately 7 min
Ease of Use Two operators were used for the test because of the number of samples and working conditions but the technology can be operated by a single person SRI Instruments provides a free one-half day of training at their Torrance California facility with an instrument purchase Users unfamiliar with gas chromatography may need one or two days of additional training to operate the instrument No particular level of educational training is required for the operator
Cost Assessment The purpose of this economic analysis is to estimate
r = 089 m = 072
intercept = 8 mgkg
0
100 200
300
400
500 600
700
800
0 100 200 300 400 500 600 700 800
Reference laboratory TNT result (mgkg)
GC
TID
TN
T r
esul
t(m
gkg
)
Figure 3 Comparison of reference laboratory results with GCTID results for SRI TNT soil concentrations lt500 mgkg
15
0
5
10
15
20
25
-100
to
-75
-74
to -
51
-50
to -
26
-25
to 0
1 to
25
26 t
o 50
51 t
o 75
76 t
o 10
0
gt 10
0
Range of percent difference values
Num
ber
of s
ampl
es
24-DNT
RDX
TNT
Figure 4 Range of percent difference values for 24-DNT RDX and TNT
the range of costs for analysis of explosivesshycontaminated soil samples using the GCTID and a conventional analytical reference laboratory method The analysis was based on the results and experience gained from this verification test costs are provided by SRI and representative costs provided by the reference analytical laboratories that offered to analyze these samples To account for the variability in cost data and assumptions the economic analysis is presented as a list of cost elements and a range of costs for sample analysis by the GCTID instrument and by the reference laboratory
Several factors affected the cost of analysis Where possible these factors were addressed so that decision makers can complete a site-specific economic analysis to suit their needs The following categories are considered in the estimate
bull sample shipment costs bull labor costs and bull equipment costs
Each of these cost factors is defined and discussed and serves as the basis for the estimated cost ranges presented in Table 10 This analysis assumed that the individuals performing the analyses are fully trained to operate the technology Costs for sample
acquisition and preanalytical sample preparation which are tasks common to both methods were not included in this assessment GCTID Costs The costs associated with using the GCTID instrument included labor equipment and waste disposal costs No sample shipment charges were associated with the cost of operating the instrument because the samples were analyzed on-site
Labor Labor costs included mobilizationdemobilization travel per diem expenses and on-site labor
bull Mobilizationdemobilization This cost element included the time for one person to prepare for and travel to each site This estimate ranged from 0 (if the analyst was on-site) to 5 h at a rate of $50h
bull Travel This element was the cost for the analyst(s) to travel to the site If the analyst is located at the site the cost of commuting to the site would be zero The estimated cost of an analyst traveling to the site for this verification test ($1000) included the cost of airline travel and rental car fees
bull Per diem expenses This cost element included food lodging and incidental expenses The estimate ranged from zero (for a local site) to
16
Table 10 Estimated Analytical Costs for Explosives-Contaminated Samples
Analysis method GCTID Analystmanufacturer SRI Instruments
Sample throughput 3 samplesh
Analysis method Analystmanufacturer
Typical turnaround
EPA SW-486 Method 8330Reference laboratory
21 working days
Cost category Cost ($) Cost category Cost ($)
Sample shipment 0
Labor Mobilizationdemobilization Travel Per diem expenses Rate
0ndash250 0ndash1000 per analyst 0ndash150day per analyst 30ndash75h per analyst
Equipment Mobilizationdemobilization Instrument purchase price Reagentssupplies
0ndash150 8995 variable
Sample shipment Labor Overnight shipping
Labor Mobilizationdemobilization Travel Per diem expenses Rate
Equipment
100ndash200 50ndash150
Included a
Included Included 150ndash188 per sample
Included
aldquoIncludedrdquo indicates that the cost is included in the labor rate
$150day for each analyst bull Rate The cost of the on-site labor was estimated
at a rate of $30ndash75h depending on the required expertise level of the analyst This cost element included the labor involved with the entire analytical process comprising sample preparation sample management analysis and reporting
Equipment Equipment costs included mobilization demobilization rental fees or purchase of equipment and the reagents and other consumable supplies necessary to complete the analysis
bull Mobilizationdemobilization This included the cost of shipping the equipment to the test site If the site is local the cost would be zero For this verification test the cost of shipping equipment and supplies was estimated at $150
bull Instrument purchase At the time of the verification test the SRI Model 8610C gas chromatograph equipped with TID detector heated injector built-in air compressor PeakSimple serial data system and 15-m MXT-1 capillary column has a list price of $8995 It comes with a reusable plastic shipping container that allows the GC to ship via overnight express
services and even meets the size and weight limits for airline baggage As with any instrument the cost on a per-sample basis would decrease as the number of analyses performed increases The instrument can also be rented from SRI for $6746 per day (12-day minimum) or $1799 per month With the purchase of an instrument SRI offers one-half day training at their Torrance California facility on the functional aspects of the instrument If the operator requires additional training in basic gas chromatography SRI has a list of recommendations of qualified people in their manual
bull Reagentssupplies These items are consumable and are purchased on a per sample basis
Reference Laboratory Costs Sample Shipment Sample shipment costs to the reference laboratory included the overnight shipping charges as well as labor charges associated with the various organizations involved in the shipping process
bull Labor This cost element included all of the tasks associated with the shipment of the samples to the reference laboratory Tasks included packing the shipping coolers
17
completing the chain-of-custody documentation and completing the shipping forms The estimate to complete this task ranged from 2 to 4 h at $50h
bull Overnight shipping The overnight express shipping service cost was estimated to be $50 for one 50-lb cooler of samples
Labor and Equipment The labor bids from commercial analytical reference laboratories that offered to perform the reference analysis for this verification test ranged from $150 to $188 per sample The bid was dependent on many factors including the perceived difficulty of the sample matrix the current workload of the laboratory and the competitiveness of the market This rate was a fully loaded analytical cost that included equipment labor waste disposal and report preparation
Cost Assessment Summary An overall cost estimate for use of the GCTID instrument versus use of the reference laboratory was not made because of the extent of variation in the different cost factors as outlined in Table 10 The overall costs for the application of any technology would be based on the number of samples requiring analysis the sample type and the site location and characteristics Decision-making factors such as turnaround time for results must also be weighed against the cost estimate to determine the value of the field technologyrsquos providing immediate answers versus the reference laboratoryrsquos provision of reporting data within 30 days of receipt of samples
Miscellaneous Factors The following are general observations regarding the field operation and performance of the GCTID instrument
bull The system which weighs approximately 75 lb was transportable by one person The instrument comes with a plastic carrying case that can be used to ship the instrument or be checked as baggage on an airplane
bull The instrument appeared to be rugged as the analysts were able to run the instrument during a late afternoon storm that had strong winds
bull The SRI team completely disassembled their work station at the close of each day It took the
team less than an hour each morning to prepare for sample analyses
bull The instrument required 110 V of electrical power for operation
bull The SRI team employed a colorimetric method to screen samples for high concentration of TNT and related nitroaromatic compounds This undoubtedly prevented unnecessary overloading of the instrument and potential downtime
bull Sample preparation including extraction colorimetric screening and dilutions was completed for all 108 samples in 18 h of labor by one analyst (approximately 10 min per sample)
bull Other SW-846 Method 8330 analytes (eg trinitrobenzene tetryl HMX) could potentially be determined by this method but this was not verified in this study
bull Hazardous waste generated during the test included the following which was classified as RCRA waste 02 L of vials with acetone and trace explosives 05 L of syringe filters with spent acetone and trace explosives 03 L of acetone used for rinsing and 43 L of acetone and soil mixtures
Summary of Performance A summary of performance is presented in Table 11 Precision defined as the mean RSD was 15 14 and 23 for 24-DNT RDX and TNT soil sample results respectively Accuracy defined as the mean percent recovery relative to the spiked concentration was 91 and 97 for RDX and TNT soil sample results respectively indicating that the soil results were unbiased Of the 20 blank soil samples SRI reported TNT in five samples (25 false positives) no false positives were reported for 24-DNT or RDX Additionally false positive and false negative results were determined by comparing the GCTID result to the reference laboratory result for the environmental and spiked samples None of the RDX results were reported as false positives but 3 of the 24-DNT and 7 of the TNT results were relative to the reference laboratory results A low percentage of results were also found to be false negatives (0 for 24-DNT 2 for RDX and 4 for TNT) The SRI results were comparable to the reference laboratory results with r values of 085 and 095 for RDX and TNT respectively
18
The verification test found that the GCTID instrument was relatively simple for a trained analyst to operate in the field requiring less than an hour for initial setup The sample throughput of the GCTID was three samples per hour Two operators analyzed samples during the verification test but the
technology can be run by a single trained operator The overall performance of the GCTID for the analysis of 24-DNT RDX and TNT was characterized as unbiased and precise for soil analyses
Table 11 Performance Summary for the GCTID
FeatureParameter Performance summary
Precision Mean RSD 24-DNT 15 RDX 14 TNT 23
Accuracy Mean recovery RDX 91 TNT 97
False positive results on blank samples
24-DNT none RDX none TNT 25
False positive results relative to reference laboratory results
24-DNT 3 RDX none TNT 7
False negative results relative to reference laboratory results
24-DNT none RDX 2 TNT 4
Comparison with reference laboratory results (all data excluding suspect values)
Correlation Absolute median coefficient Slope percent difference
24-DNT 044 033 66 RDX 096 086 19 TNT 095 132 28
Range of percent difference
ndash83 to 216 ndash51 to 275 ndash85 to 475
Completeness 100 of 108 soil samples
Weight 75 lb
Sample throughput (2 operators) 3 samples per hour
Power requirements 110 V
Training requirements One-half day instrument-specific training
Cost Instrument $8995
19
Section 6 mdash Representative Applications
In this section the vendor (with minimal editorial changes by ORNL) provides a list of representative applications in which its technology has been used
The SRI Model 8610C GCTID has been used onshysite for the analysis of soil samples contaminated with explosives that have been obtained from locations used for the open burning and open detonation (OBOD) of obsolete munitions and from a land mine test facility The GCTID analysis of soil samples taken from the OBOD sites established the presence of nitroaromatic nitramine and nitrate ester explosive compounds Reanalysis of the soil sample extracts from the OBOD sites by EPA SWshy846 Method 8095 (EPA 1999) confirmed the on-site GCTID concentrations established for TNB TNT and RDX and qualitatively confirmed the presence of nitroglycerin (NG) and pentaerythritol tetranitrate (PETN) these two compounds were not present in the field calibration standards
To detect explosive residues around buried land mines the GCTID was optimized for the analysis of 24-DNT TNT 2-Am-DNT at concentrations between 0005 and 01 mgkg and for 4-Am-DNT at
concentrations between 005 and 05 mgkg Most of the land mines at this test facility contained TNT as the main charge This on-site capability made it possible to establish whether these four explosives were present in surface soil samples taken above the land mines For a couple of mines where mgkg levels of explosive residues were detected an extensive iterative sampling protocol was performed to delineate the surface boundaries of the explosive-related chemical signature The reanalysis of soil sample extracts from this mine-field site by Method 8095 confirmed the on-site GCTID results for these explosive compounds
Additional applications using the GCTID instrument have been (1) to analyze explosive vapors collected on solid phase microextraction fibers after thermal desorption in the heated inlet and (2) to characterize explosive residues on range scrap following wipe sampling or solvent immersion
20
Section 7 mdash References
ASTM (American Society for Testing and Materials) 1997a Standard Practice for Generation of Environmental Data Related to Waste Management Activities Quality Assurance and Quality Control Planning and Implementation D5283-92
ASTM (American Society for Testing and Materials) 1997b Standard Practice for Generation of Environmental Data Related to Waste Management Activities Development of Data Quality Objectives D5792-95
Berger W H McCarty and R-K Smith 1996 Environmental Laboratory Data Evaluation Genium Publishing Corp Schenectady NY
Draper N R and H Smith 1981 Applied Regression Analysis 2nd ed John Wiley amp Sons NY
EPA (US Environmental Protection Agency) 1994 ldquoMethod 8330 Nitroaromatics and Nitramines by High Performance Liquid Chromatography (HPLC)rdquo In Test Methods for Evaluating Solid Waste Physical Chemical Methods Update II SW-846 US Environmental Protection Agency Washington DC September
EPA (US Environmental Protection Agency) 1996 Guidance for Data Quality Assessment EPA QAG-9 EPA600R-96084 EPA Washington DC July
EPA (US Environmental Protection Agency) 1999 ldquoMethod 8095 Nitroaromatics and Nitramines by GC-ECDrdquo In Test Methods for Evaluating Solid Waste Physical Chemical Methods Update II SW-846 US Environmental Protection Agency Washington DC
Jenkins T F M E Walsh and P G Thorne 1998 Site Characterization for Explosives Contamination at a Military Firing Range Impact Area Special Report 98-9 US Army Cold Regions Research and Engineering Laboratory Hanover NH Available at httpwwwcrrelusacearmymil
Maskarinec M P C K Bayne L H Johnson S K Holladay R A Jenkins and B A Tomkins 1991 Stability of Explosives in Environmental Water and Soil Samples ORNLTM-11770 Oak Ridge National Laboratory Oak Ridge Tenn January
ORNL (Oak Ridge National Laboratory) 1999 Technology Demonstration Plan Evaluation of Explosives Field Analytical Techniques Oak Ridge National Laboratory Oak Ridge Tenn August
ORNL (Oak Ridge National Laboratory) 2000 Technology Verification Test Plan Evaluation of Explosives Field Analytical Techniques Oak Ridge National Laboratory Oak Ridge Tenn August
Specialized Assays Inc 1999 Comprehensive Quality Assurance Plan SAL-QC-Rec 50 January 6
21
Appendix A
GCTID Sample Results Compared withReference Laboratory Results
Sample site or type
Sample no
Sample replicate
24-DNT (mgkg)
SRI Ref Lab
RDX (mgkg)
SRI Ref Lab
TNT (mgkg)
SRI Ref Lab
SRI Analysis Order a
Blank 1 1 lt05 lt05 lt05 lt05 lt05 lt05 1079 Blank 1 2 lt05 lt05 lt05 lt05 lt05 lt05 1076 Blank 1 3 lt05 lt05 lt05 lt05 lt05 lt05 1062 Blank 1 4 lt05 lt05 lt05 lt05 lt05 lt05 1078
Blank 2 1 lt05 lt05 lt05 lt05 lt05 lt05 1070 Blank 2 2 lt05 lt51 lt05 lt51 lt05 709000 1108 Blank 2 3 lt05 lt05 lt05 lt05 lt05 lt05 1038 Blank 2 4 lt05 lt05 lt05 lt05 lt05 lt05 1054
Blank 3 1 lt05 lt05 lt05 lt05 lt05 lt05 1043 Blank 3 2 lt05 lt05 lt05 lt05 lt05 lt05 1052 Blank 3 3 lt05 lt05 lt05 lt05 11 lt05 1008 Blank 3 4 lt05 lt05 lt05 lt05 05 lt05 1102
Blank 4 1 lt05 lt05 lt05 lt05 lt05 09 1024 Blank 4 2 lt05 lt05 lt05 lt05 lt05 lt05 1018 Blank 4 3 lt05 lt05 lt05 lt05 07 lt05 1101 Blank 4 4 lt05 lt05 lt05 lt05 05 lt05 1022
Blank 5 1 lt05 lt05 lt05 lt05 lt05 lt05 1088 Blank 5 2 lt05 lt05 lt05 lt05 lt05 lt05 1046 Blank 5 3 lt05 lt05 lt05 lt05 63 lt05 1006 Blank 5 4 lt05 lt05 lt05 lt05 lt05 lt05 1053
Fort Ord 1 1 lt05 lt05 lt05 06 lt05 lt05 1050 Fort Ord 1 2 lt05 lt05 lt05 lt05 lt05 08 1073 Fort Ord 1 3 lt05 lt05 lt05 lt05 lt05 08 1092 Fort Ord 1 4 lt05 lt05 lt05 05 lt05 lt05 1013
Fort Ord 2 1 lt05 lt05 lt05 lt05 06 08 1034 Fort Ord 2 2 lt05 lt05 lt05 lt05 lt05 21 1031 Fort Ord 2 3 lt05 lt05 lt05 lt05 30 08 1098 Fort Ord 2 4 lt05 lt05 lt05 lt05 05 08 1067
Fort Ord 3 1 lt05 lt05 lt05 lt05 lt05 lt05 1026 Fort Ord 3 2 lt05 lt05 lt05 lt05 lt05 lt05 1084 Fort Ord 3 3 lt05 lt05 lt05 lt05 lt05 lt05 1066 Fort Ord 3 4 lt05 lt05 lt05 lt05 lt05 lt05 1030
Iowa 1 1 110 lt51 lt50 lt51 210000 204000 1077 Iowa 1 2 lt500 lt05 lt500 lt05 310000 08 1003 Iowa 1 3 180 lt532 lt50 lt532 230000 334000 1021 Iowa 1 4 100 lt505 lt50 lt505 220000 283000 1023
22
Sample site or type
Sample no
Sample replicate
24-DNT (mgkg)
SRI Ref Lab
RDX (mgkg)
SRI Ref Lab
TNT (mgkg)
SRI Ref Lab
SRI Analysis Order a
Louisiana 1 1 lt05 lt05 25000 34600 1500 1090 1107 Louisiana 1 2 lt500 lt05 24000 35200 1200 1200 1090 Louisiana 1 3 lt500 lt05 23000 21400 1200 1110 1100 Louisiana 1 4 lt50 lt250 22000 19000 990 1250 1025
Louisiana 2 1 lt5 lt05 14000 11800 660 500 1010 Louisiana 2 2 lt5 lt05 11000 14500 760 510 1027 Louisiana 2 3 lt5 lt05 13000 11700 610 510 1029 Louisiana 2 4 lt5 lt05 12000 3200 630 106 1012
Louisiana 3 1 lt50 lt05 48000 43000 810 2050 1082 Louisiana 3 2 lt50 lt50 35000 35500 890 1700 1041 Louisiana 3 3 55 lt50 34000 46500 450 3000 1055 Louisiana 3 4 lt5 lt05 40000 58500 1500 4000 1037
Louisiana 4 1 140 800 61 120 800 890 1081 Louisiana 4 2 88 114 71 107 840 780 1007 Louisiana 4 3 85 119 69 108 820 815 1056 Louisiana 4 4 72 95 46 77 730 675 1087
Milan 1 1 lt05 lt05 1100 1490 33 27 1097 Milan 1 2 lt05 lt05 1300 1180 93 11 1019 Milan 1 3 lt05 lt05 1100 722 09 14 1083 Milan 1 4 lt05 lt05 1500 3080 11 17 1039
Milan 2 1 lt05 lt05 220 348 lt05 lt05 1014 Milan 2 2 lt05 lt05 200 164 lt05 lt05 1074 Milan 2 3 lt05 lt05 260 280 lt05 lt05 1064 Milan 2 4 lt05 lt05 180 229 lt05 lt05 1072
Milan 3 1 lt50 lt05 79000 23500 2600 1900 1069 Milan 3 2 lt50 lt50 34000 19500 820 2700 1065 Milan 3 3 lt50 lt200 41000 40800 3000 3200 1016 Milan 3 4 lt50 lt05 38000 38800 1100 2730 1033
Milan 4 1 lt5 lt50 25000 27400 1100 2200 1086 Milan 4 2 lt50 lt05 25000 26400 680 2600 1028 Milan 4 3 lt50 lt05 21000 26000 450 800 1036 Milan 4 4 lt50 lt05 27000 30700 800 1620 1005
Milan 5 1 07 21 lt05 lt05 77 115 1048 Milan 5 2 06 27 lt05 lt05 73 102 1047 Milan 5 3 07 17 lt05 lt05 71 113 1060 Milan 5 4 06 16 lt05 lt05 68 106 1059
SpikePE 1 1 lt05 lt05 lt05 lt05 870 818 1103 SpikePE 1 2 lt05 lt05 lt05 lt05 870 1040 1044 SpikePE 1 3 lt05 lt05 lt05 lt05 920 900 1095 SpikePE 1 4 lt05 lt05 lt05 lt05 920 1240 1094
23
Sample site or type
Sample no
Sample replicate
24-DNT (mgkg)
SRI Ref Lab
RDX (mgkg)
SRI Ref Lab
TNT (mgkg)
SRI Ref Lab
SRI Analysis Order a
SpikePE 2 1 lt05 lt05 840 1110 lt05 lt05 1105 SpikePE 2 2 lt05 lt05 760 905 lt05 lt05 1057 SpikePE 2 3 lt05 lt05 880 980 24 lt05 1020 SpikePE 2 4 lt05 lt05 740 1270 lt05 lt05 1063
SpikePE 3 1 lt05 lt05 490 495 110 84 1049 SpikePE 3 2 lt05 lt05 560 450 100 76 1001 SpikePE 3 3 lt05 lt05 470 635 99 100 1058 SpikePE 3 4 lt05 lt05 460 510 100 85 1061
SpikePE 4 1 lt05 lt05 76 91 450 475 1104 SpikePE 4 2 lt05 lt05 97 84 500 485 1096 SpikePE 4 3 lt05 lt05 89 86 450 485 1071 SpikePE 4 4 lt05 lt05 87 91 480 470 1106
SpikePE 5 1 lt05 lt05 4400 4600 2600 2300 1068 SpikePE 5 2 lt5 lt05 4900 4550 2400 2050 1004 SpikePE 5 3 lt5 lt05 4900 7050 2600 4350 1075 SpikePE 5 4 lt05 lt05 4500 4450 2600 2050 1045
SpikePE 6 1 lt5 lt05 2100 2600 4800 5350 1099 SpikePE 6 2 lt5 lt25 2200 2550 4800 5050 1042 SpikePE 6 3 lt5 lt05 2300 3350 4800 6750 1093 SpikePE 6 4 lt05 lt05 2700 2500 5000 5100 1017
Volunteer 1 1 lt500 lt50 lt500 lt50 1900000 1080000 1002 Volunteer 1 2 590 lt25 lt50 lt25 1100000 755000 1091 Volunteer 1 3 600 190 lt50 lt5 1100000 1170000 1089 Volunteer 1 4 670 lt250 lt50 lt250 940000 610000 1015
Volunteer 2 1 300 lt532 lt50 lt532 90000 113000 1085 Volunteer 2 2 290 lt538 lt50 lt538 62000 126000 1051 Volunteer 2 3 350 lt54 lt50 65 83000 262000 1011 Volunteer 2 4 340 452 lt50 lt54 94000 89200 1009
Volunteer 3 1 07 20 lt05 lt05 99 120 1035 Volunteer 3 2 07 30 lt05 lt05 80 103 1032 Volunteer 3 3 06 22 lt05 lt05 77 138 1040 Volunteer 3 4 06 22 lt05 lt05 77 104 1080
aIndicates order of analysis by SRI for example 1001 was analyzed first then 1002 etc
24
Appendix B
Data Quality Objective (DQO) Example
Disclaimer The following hypothetical example serves to demonstrate how the information provided in this report may be used in the data quality objectives (DQO) process This example serves to illustrate the application of quantitative DQOs to a decision process but it cannot attempt to provide a thorough education in this topic (EPA 1996 ASTM 1997a ASTM 1997b) Please refer to other educational or technical resources for further details Additionally because the focus of this report is on the analytical technology this example makes simplifying assumptions (such as the sample is homogeneous and the reference laboratory results represent the true concentration) in the example that may not be valid in the real world
Background and Problem Statement An Army Ammunition Plant that produced TNT was recently decommissioned Past practices had resulted in contamination of four areas around the plant Soils at each site were mixtures of clay silt and organic matter with initial concentrations of about 1500 mgkg of TNT Forty cubic yards of TNT-contaminated soil were loaded into a bioreactor After three months of processing the soil mixture was dewatered and put into drums The simplifying assumption was made that the soil in each drum was homogeneous based on process knowledge In agreement with regulators the treatment goal established for the site was to reduce the soil concentration to lt15 mgkg of TNT Soil with lt15 mgkg of TNT would be returned to the four areas around the plant Those drums containing soil with TNT concentrations 15 mgkg would be stored for additional processing (ie incineration)
The companyrsquos DQO team considered using SRI Instrumentsrsquo Model 8610C gas chromatograph (GC) to measure the TNT concentration in each drum based on the data generated in the ETV verification study The SRI Model 8610C GC is an on-site gas chromatograph equipped with a thermionic ionization detector that allows for the determination of explosives in a soil matrix The plan was to randomly select soil samples from each drum and determine the TNT concentration with the SRI Model 8610C GC The DQO team decided that drums will be disposed by incineration if the TNT concentration is 15 mgkg (ldquohotrdquo) Those drums with TNT concentrations lt15 mgkg will be put into a landfill because incineration of TNTshycontaminated soil is very expensive With regulator agreement the DQO Team determined that a decision rule for disposal would be based on the average concentration of TNT in each drum
General Decision Rule
If the average TNT concentration is less than the action level then the TNT drums are sent to the landfill
If the average TNT concentration is greater than or equal to the action level then the TNT drum is sent to the incinerator
DQO Goals The DQO teamrsquos primary goal was to calculate how many samples would need to be analyzed by the SRI Model 8610C GC in order to confidently make a decision about remediating the processed soil given the uncertainties of the technologyrsquos results Because the team decided that inadvertently sending soil to a landfill that exceeded 15 mgkg of TNT was the worst possible mistake the number of samples measured is primarily related to this false-rejection decision error rate A secondary decision error would be to
25
unnecessarily incinerate soil with TNT concentrations lt15 mgkg This decision would be a false-acceptance decision error Consideration of both the false-rejection decision error and the false-acceptance decision error was used to determine the final sampling plan
EPA required that a sufficient number of samples be measured from each drum so that the false-rejection error rate (FR) for the decision rule was 005 or less if the true soil concentration in a drum was 15 mgkg or greater This DQO goal represents a 5 chance of returning a drum with soil containing 15 mgkg or more of TNT to a landfill
The DQO team did not want to incinerate an excessive number of drums if a drumrsquos TNT soil concentration was lt5 mgkg because of the expense Therefore the DQO team recommended that the false-acceptance error rate (FA) for the decision rule be 010 if the true drum concentration was less than 5 mgkg That is there would be a 10 chance of incinerating a drum if the true TNT concentration for a drum was lt5 mgkg
Permissible FR and FA Error Rates and Critical Decision Points
FR Pr[take drum to landfill] 005 when true TNT concentration = 15 mgkg
FA Pr[take drum to incinerator] 010 when true TNT concentration = 5 mgkg
Use of Technology Performance Information to Implement the Decision Rule Technology performance information is used to evaluate whether a particular analytical technology can produce data of sufficient quality to support the site decision Because the DQO team is considering the use of the SRI Model 8610C GC the performance of this technology (as reported in this ETV report) was used to assess its applicability to this project Two questions arise
1 How many samples are needed from a single drum to permit a valid estimate of the true average concentration of TNT in the drum to the specified certainty Recall that the simplifying assumption was made that the TNT distribution throughout the soil within a single drum is homogeneous thus matrix heterogeneity will not contribute to overall variability The only variability then to be considered in this example is the variability in the SRI Model 8610C GCrsquos analytical method which is determined by precision studies
2 What is the appropriate action level (AL) for using the SRI Model 8610C GC to make decisions in the field After the required number of samples have been collected from a drum and analyzed the results are averaged together to get an estimate of the ldquotruerdquo TNT concentration of the drum When using the SRI Model 8610C GC what is the value (here called ldquothe action level for the decision rulerdquo) to which that average is compared to decide if the drum is ldquohotrdquo or not This method-specific or site-specific action level is derived from evaluations of the methodrsquos accuracy using an appropriate quality control regimen
Determining the Number of Samples With the critical decision points selected the DQO team could then determine the number of samples needed from each drum to calculate the drumrsquos ldquotruerdquo average TNT concentration For a homogeneous matrix the number of samples required depends on the precision of the analytical method
Figure B-1 shows that the standard deviations for the SRI Model 8610C GC versus the average TNT concentration for the reference laboratory Although the fitted line increases with average TNT
26
concentration the linear model is not significantly 9
different than a constant standard deviation over the 8
0 to 50 mgkg concentration range Therefore the 7
precision of the SRI Model 8610C GC can be represented by a pooled standard deviation of 6
31 mgkg within the concentration range of 0 to 5
60 mgkg (see Figure B-1) Note that the pooled 4
standard deviation is calculated by first calculating 3 the average variance then taking the square root This estimate of analytical variability (precision) is
2
used to calculate the number of soil samples 1
required to be analyzed from each drum to achieve 0
the DQOs as determined in the DQO Goals The -1
following formula is provided in EPArsquos Guidance -2
for Data Quality Assessment (EPA 1996) that can be adapted to this example for calculating the number of samples required to meet the FR and FA requirements Figure B-1 Linear model for the standard deviation for
SRI Model 8610C GC versus average TNT (mgkg) result for the reference laboratory with 95 confidence intervals (dashed lines)
Stan
dard
Dev
iatio
n (m
gkg
) -- S
RI 8
610C
GC
Average TNT (mgkg) -- Reference Laboratory
0 10 20 30 40 50 60
(Eq B-1)
where n = number of samples from a drum to be measured S2 = variance for the measurement [eg S2 = (31)2 ] RT = regulatory threshold (eg RT = 15 mgkg) C FA = concentration at which the FA is specified (eg C FA = 5 mgkg) FR = false-rejection decision error rate (eg FR = 005) FA = false-acceptance decision error rate (eg FA = 010) Z1-p = (1-p)th percentile of the standard normal distribution (see EPA 1996 Table A-1 of Appendix A)
Example Z(1-FR) = Z095 = 1645 and Z(1- FA) = Z090 = 1282
Therefore three soil samples from each drum would be analyzed by SRI Model 8610C GC to meet the criteria established by the DQO process To be conservative the number of samples was rounded up to the next integer The TNT results from the three samples are averaged (by taking the arithmetic mean) to produce an SRI Model 8610C GC value for a drumrsquos TNT concentration
Determining the Action Level Now that the number of samples that need to be analyzed from each drum to meet the DQO goals has been determined the action level can be calculated The action level is the decision criterion (or ldquocut-offrdquo value) that will be compared to the unbiased average TNT concentration determined for each drum The AL for the
27
decision rule is calculated based on controlling the FR established in the DQO process Recall that the DQO team set the permissible FR error rate at 5
The formula (EPA 1996) to compute the action level is
(Eq B-2)
10
09
08
To summarize three random samples from each drum are analyzed The three results are averaged to produce the average TNT concentration for the drum which is then compared to the action level (ie AL = 121 mgkg) for the decision rule Therefore the decision rule using the SRI Model 8610C GC to satisfy a 5 FR and a 10 FA is as follows
Prob
[ Tak
e Dr
um to
Inci
nera
tor ]
06
05
03
02
01
00 0 5 10 15 20
False Rejection = 005
True TNT Concentration (mgkg)
07
04
Figure B-2 Decision performance curve to TNT drum example
Decision Rule for FR = 5 and FA = 10
If the average TNT concentration of three random soil samples on a drum is lt121 mgkg then send the drum to the landfill
If the average TNT concentration of three random soil samples on a drum is 121 mgkg then send the drum to the incinerator
The decision performance curve (for more information see EPA 1996 pp 34ndash36) calculates the probability of sending a drum to the incinerator for different values of true TNT soil concentration in a drum Figure B-2 shows that the decision performance curve has the value of Pr[take drum to incinerator] = 095 for true = 15 mgkg This indicates that the decision rule meets the DQO teamrsquos FR of 5 The actual Pr[take drum to incinerator] = 000004 for a true TNT concentration = 5 mgkg which is better than the FA of 10 that the DQO team had originally specified This improved performance is due to rounding up the number of samples to the next integer in the calculation of number of samples required
Alternative FR Parameter Because of random sampling and analysis error some chance always exists that analytical results will not accurately reflect the true nature of a decision unit (such as a drum in this example) Often 95 certainty (a 5 FR) is customary and sufficient to meet stakeholder comfort But suppose that the DQO team wanted to be even more cautious about limiting the possibility that a drum might be sent to a landfill when its true value is 15 mgkg If the DQO team wanted to be 99 certain that a drum was correctly sent to a landfill the
28
following describes how changing the FR requirement from 5 to 1 would affect the decision rule Using FR = 001 the sample size is calculated to be four and the action level is calculated as 114 mgkg The decision performance curve has the value of Pr[take drum to incinerator] = 099 for true = 15 mgkg This indicates that the decision rule meets the DQO teamrsquos FR of 1 The Pr[take drum to incinerator] = 000002 for true = 5 mgkg is better than the FA of 10 that the DQO team had specified This improved performance is due to rounding up the number of samples to the next integer in the calculation of number of samples required The decision rule for the lower FR would be as follows
Decision Rule for FR = 1 and FA = 10
If the average TNT concentration of four random soil samples on a drum is lt114 mgkg then send the drum to the landfill
If the average TNT concentration of four random soil samples on a drum is 114 mgkg then send the drum to the incinerator
Comparison to Sending the Samples Off-Site for Analysis The DQO team wanted to compare the sampling plan using the SRI Model 8610C GC field measurements with a sampling plan using an off-site reference laboratory For the off-site reference laboratory the DQO team assumed a precision of SD = 09 mgkg based on the ETV reference laboratory values They also specified that the FA percentage would be at a TNT concentration of 10 mgkg because the reference laboratory measurements are more precise This specification means that there is only a 10 chance of sending a drum to the incinerator if the true TNT concentration in the drum is 10 mgkg A formula provided in EPArsquos Guidance for Data Quality Assessment (EPA 1996) shows that the number would be n = 2 for the 5 FR percentage and 10 FA percentage The decision rule would be to take two randomly selected samples and send them to the reference laboratory for analysis If the average TNT concentration is less than an action level of 140 mgkg restore the soil to the plant site otherwise send the soil drum to storage In this example the off-site laboratory appears to require fewer samples to be analyzed (two for the off-site laboratory versus three for the SRI Model 8610C GC) Other factors (such as a cost-benefit analysis ability to detect other analytes) would need to be considered before choosing a method for this application
29
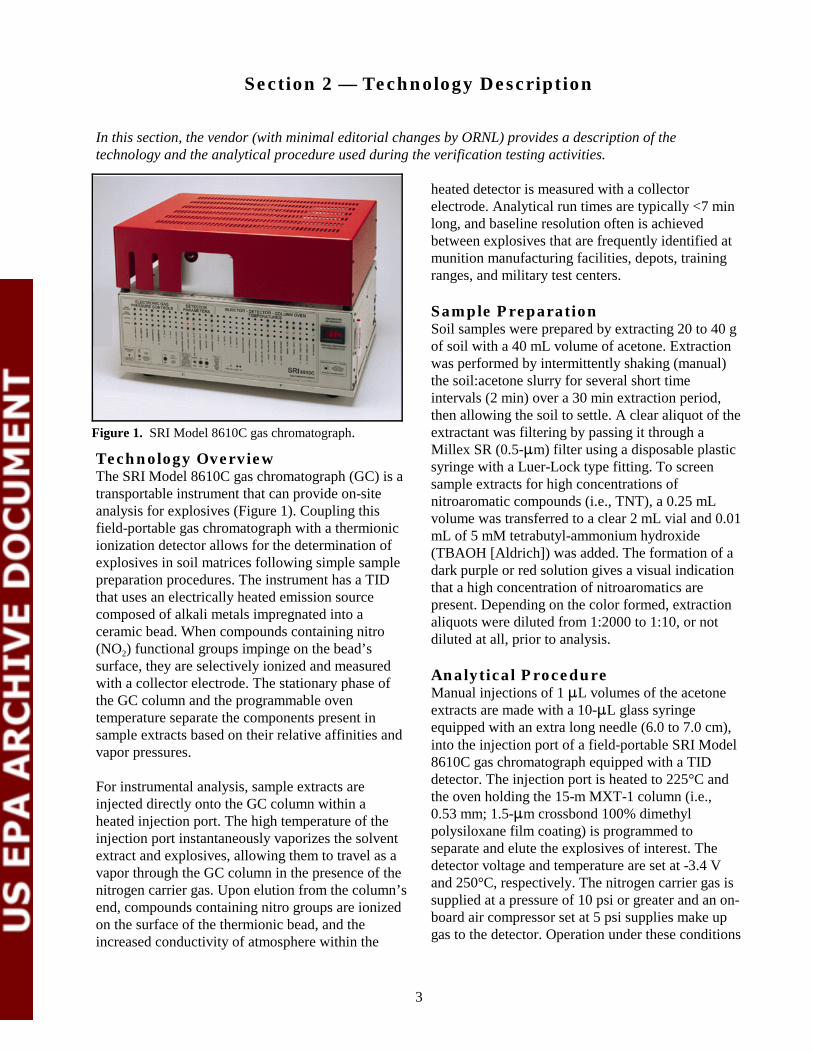
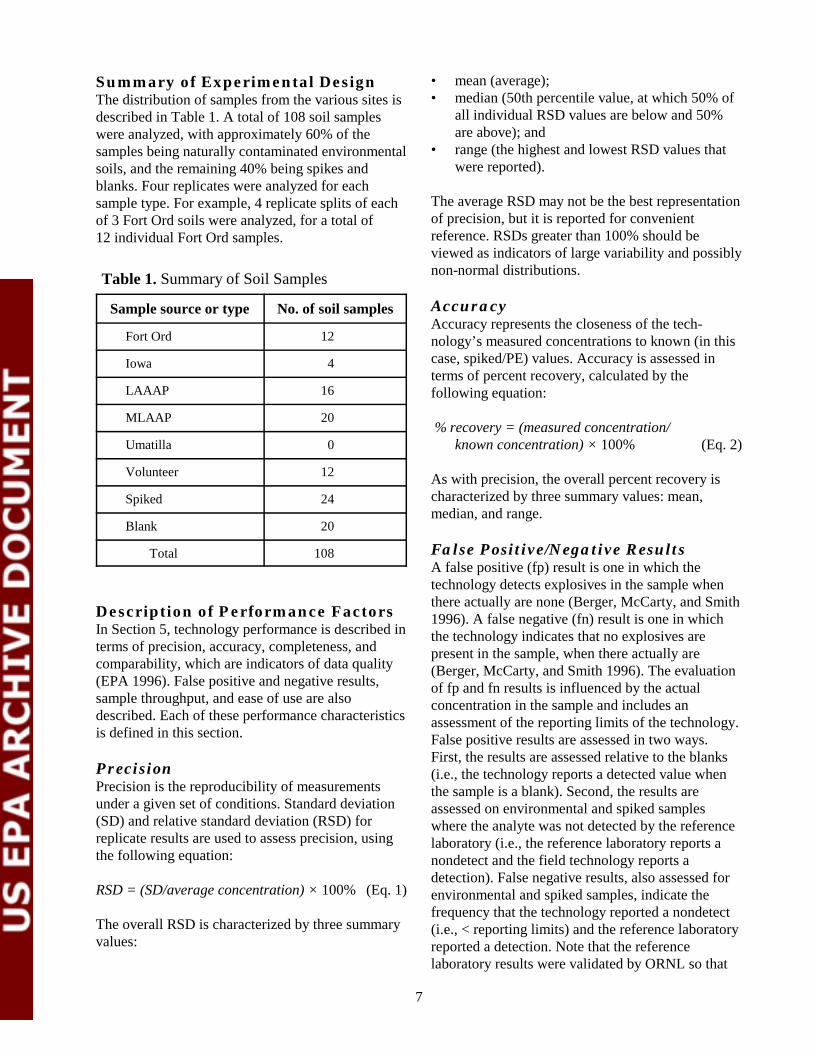
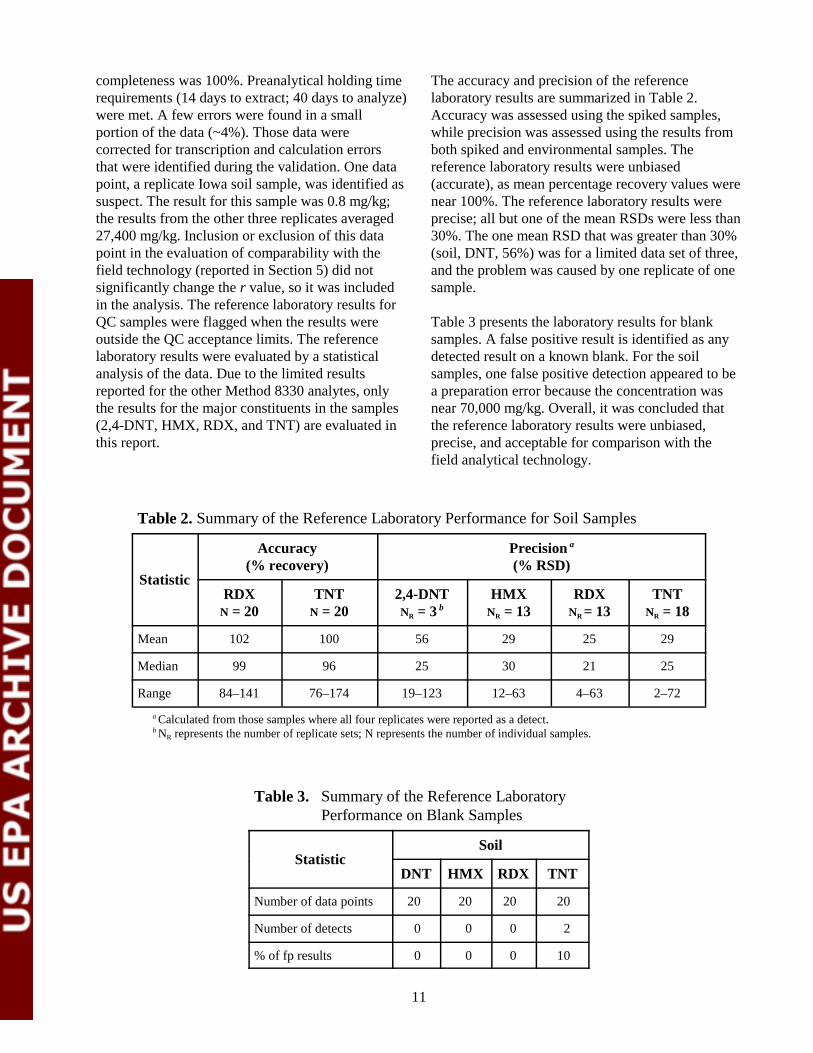
0
5
10
15
20
25
-100
to
-75
-74
to -
51
-50
to -
26
-25
to 0
1 to
25
26 t
o 50
51 t
o 75
76 t
o 10
0
gt 10
0
Range of percent difference values
Num
ber
of s
ampl
es
24-DNT
RDX
TNT
Figure 4 Range of percent difference values for 24-DNT RDX and TNT
the range of costs for analysis of explosivesshycontaminated soil samples using the GCTID and a conventional analytical reference laboratory method The analysis was based on the results and experience gained from this verification test costs are provided by SRI and representative costs provided by the reference analytical laboratories that offered to analyze these samples To account for the variability in cost data and assumptions the economic analysis is presented as a list of cost elements and a range of costs for sample analysis by the GCTID instrument and by the reference laboratory
Several factors affected the cost of analysis Where possible these factors were addressed so that decision makers can complete a site-specific economic analysis to suit their needs The following categories are considered in the estimate
bull sample shipment costs bull labor costs and bull equipment costs
Each of these cost factors is defined and discussed and serves as the basis for the estimated cost ranges presented in Table 10 This analysis assumed that the individuals performing the analyses are fully trained to operate the technology Costs for sample
acquisition and preanalytical sample preparation which are tasks common to both methods were not included in this assessment GCTID Costs The costs associated with using the GCTID instrument included labor equipment and waste disposal costs No sample shipment charges were associated with the cost of operating the instrument because the samples were analyzed on-site
Labor Labor costs included mobilizationdemobilization travel per diem expenses and on-site labor
bull Mobilizationdemobilization This cost element included the time for one person to prepare for and travel to each site This estimate ranged from 0 (if the analyst was on-site) to 5 h at a rate of $50h
bull Travel This element was the cost for the analyst(s) to travel to the site If the analyst is located at the site the cost of commuting to the site would be zero The estimated cost of an analyst traveling to the site for this verification test ($1000) included the cost of airline travel and rental car fees
bull Per diem expenses This cost element included food lodging and incidental expenses The estimate ranged from zero (for a local site) to
16
Table 10 Estimated Analytical Costs for Explosives-Contaminated Samples
Analysis method GCTID Analystmanufacturer SRI Instruments
Sample throughput 3 samplesh
Analysis method Analystmanufacturer
Typical turnaround
EPA SW-486 Method 8330Reference laboratory
21 working days
Cost category Cost ($) Cost category Cost ($)
Sample shipment 0
Labor Mobilizationdemobilization Travel Per diem expenses Rate
0ndash250 0ndash1000 per analyst 0ndash150day per analyst 30ndash75h per analyst
Equipment Mobilizationdemobilization Instrument purchase price Reagentssupplies
0ndash150 8995 variable
Sample shipment Labor Overnight shipping
Labor Mobilizationdemobilization Travel Per diem expenses Rate
Equipment
100ndash200 50ndash150
Included a
Included Included 150ndash188 per sample
Included
aldquoIncludedrdquo indicates that the cost is included in the labor rate
$150day for each analyst bull Rate The cost of the on-site labor was estimated
at a rate of $30ndash75h depending on the required expertise level of the analyst This cost element included the labor involved with the entire analytical process comprising sample preparation sample management analysis and reporting
Equipment Equipment costs included mobilization demobilization rental fees or purchase of equipment and the reagents and other consumable supplies necessary to complete the analysis
bull Mobilizationdemobilization This included the cost of shipping the equipment to the test site If the site is local the cost would be zero For this verification test the cost of shipping equipment and supplies was estimated at $150
bull Instrument purchase At the time of the verification test the SRI Model 8610C gas chromatograph equipped with TID detector heated injector built-in air compressor PeakSimple serial data system and 15-m MXT-1 capillary column has a list price of $8995 It comes with a reusable plastic shipping container that allows the GC to ship via overnight express
services and even meets the size and weight limits for airline baggage As with any instrument the cost on a per-sample basis would decrease as the number of analyses performed increases The instrument can also be rented from SRI for $6746 per day (12-day minimum) or $1799 per month With the purchase of an instrument SRI offers one-half day training at their Torrance California facility on the functional aspects of the instrument If the operator requires additional training in basic gas chromatography SRI has a list of recommendations of qualified people in their manual
bull Reagentssupplies These items are consumable and are purchased on a per sample basis
Reference Laboratory Costs Sample Shipment Sample shipment costs to the reference laboratory included the overnight shipping charges as well as labor charges associated with the various organizations involved in the shipping process
bull Labor This cost element included all of the tasks associated with the shipment of the samples to the reference laboratory Tasks included packing the shipping coolers
17
completing the chain-of-custody documentation and completing the shipping forms The estimate to complete this task ranged from 2 to 4 h at $50h
bull Overnight shipping The overnight express shipping service cost was estimated to be $50 for one 50-lb cooler of samples
Labor and Equipment The labor bids from commercial analytical reference laboratories that offered to perform the reference analysis for this verification test ranged from $150 to $188 per sample The bid was dependent on many factors including the perceived difficulty of the sample matrix the current workload of the laboratory and the competitiveness of the market This rate was a fully loaded analytical cost that included equipment labor waste disposal and report preparation
Cost Assessment Summary An overall cost estimate for use of the GCTID instrument versus use of the reference laboratory was not made because of the extent of variation in the different cost factors as outlined in Table 10 The overall costs for the application of any technology would be based on the number of samples requiring analysis the sample type and the site location and characteristics Decision-making factors such as turnaround time for results must also be weighed against the cost estimate to determine the value of the field technologyrsquos providing immediate answers versus the reference laboratoryrsquos provision of reporting data within 30 days of receipt of samples
Miscellaneous Factors The following are general observations regarding the field operation and performance of the GCTID instrument
bull The system which weighs approximately 75 lb was transportable by one person The instrument comes with a plastic carrying case that can be used to ship the instrument or be checked as baggage on an airplane
bull The instrument appeared to be rugged as the analysts were able to run the instrument during a late afternoon storm that had strong winds
bull The SRI team completely disassembled their work station at the close of each day It took the
team less than an hour each morning to prepare for sample analyses
bull The instrument required 110 V of electrical power for operation
bull The SRI team employed a colorimetric method to screen samples for high concentration of TNT and related nitroaromatic compounds This undoubtedly prevented unnecessary overloading of the instrument and potential downtime
bull Sample preparation including extraction colorimetric screening and dilutions was completed for all 108 samples in 18 h of labor by one analyst (approximately 10 min per sample)
bull Other SW-846 Method 8330 analytes (eg trinitrobenzene tetryl HMX) could potentially be determined by this method but this was not verified in this study
bull Hazardous waste generated during the test included the following which was classified as RCRA waste 02 L of vials with acetone and trace explosives 05 L of syringe filters with spent acetone and trace explosives 03 L of acetone used for rinsing and 43 L of acetone and soil mixtures
Summary of Performance A summary of performance is presented in Table 11 Precision defined as the mean RSD was 15 14 and 23 for 24-DNT RDX and TNT soil sample results respectively Accuracy defined as the mean percent recovery relative to the spiked concentration was 91 and 97 for RDX and TNT soil sample results respectively indicating that the soil results were unbiased Of the 20 blank soil samples SRI reported TNT in five samples (25 false positives) no false positives were reported for 24-DNT or RDX Additionally false positive and false negative results were determined by comparing the GCTID result to the reference laboratory result for the environmental and spiked samples None of the RDX results were reported as false positives but 3 of the 24-DNT and 7 of the TNT results were relative to the reference laboratory results A low percentage of results were also found to be false negatives (0 for 24-DNT 2 for RDX and 4 for TNT) The SRI results were comparable to the reference laboratory results with r values of 085 and 095 for RDX and TNT respectively
18
The verification test found that the GCTID instrument was relatively simple for a trained analyst to operate in the field requiring less than an hour for initial setup The sample throughput of the GCTID was three samples per hour Two operators analyzed samples during the verification test but the
technology can be run by a single trained operator The overall performance of the GCTID for the analysis of 24-DNT RDX and TNT was characterized as unbiased and precise for soil analyses
Table 11 Performance Summary for the GCTID
FeatureParameter Performance summary
Precision Mean RSD 24-DNT 15 RDX 14 TNT 23
Accuracy Mean recovery RDX 91 TNT 97
False positive results on blank samples
24-DNT none RDX none TNT 25
False positive results relative to reference laboratory results
24-DNT 3 RDX none TNT 7
False negative results relative to reference laboratory results
24-DNT none RDX 2 TNT 4
Comparison with reference laboratory results (all data excluding suspect values)
Correlation Absolute median coefficient Slope percent difference
24-DNT 044 033 66 RDX 096 086 19 TNT 095 132 28
Range of percent difference
ndash83 to 216 ndash51 to 275 ndash85 to 475
Completeness 100 of 108 soil samples
Weight 75 lb
Sample throughput (2 operators) 3 samples per hour
Power requirements 110 V
Training requirements One-half day instrument-specific training
Cost Instrument $8995
19
Section 6 mdash Representative Applications
In this section the vendor (with minimal editorial changes by ORNL) provides a list of representative applications in which its technology has been used
The SRI Model 8610C GCTID has been used onshysite for the analysis of soil samples contaminated with explosives that have been obtained from locations used for the open burning and open detonation (OBOD) of obsolete munitions and from a land mine test facility The GCTID analysis of soil samples taken from the OBOD sites established the presence of nitroaromatic nitramine and nitrate ester explosive compounds Reanalysis of the soil sample extracts from the OBOD sites by EPA SWshy846 Method 8095 (EPA 1999) confirmed the on-site GCTID concentrations established for TNB TNT and RDX and qualitatively confirmed the presence of nitroglycerin (NG) and pentaerythritol tetranitrate (PETN) these two compounds were not present in the field calibration standards
To detect explosive residues around buried land mines the GCTID was optimized for the analysis of 24-DNT TNT 2-Am-DNT at concentrations between 0005 and 01 mgkg and for 4-Am-DNT at
concentrations between 005 and 05 mgkg Most of the land mines at this test facility contained TNT as the main charge This on-site capability made it possible to establish whether these four explosives were present in surface soil samples taken above the land mines For a couple of mines where mgkg levels of explosive residues were detected an extensive iterative sampling protocol was performed to delineate the surface boundaries of the explosive-related chemical signature The reanalysis of soil sample extracts from this mine-field site by Method 8095 confirmed the on-site GCTID results for these explosive compounds
Additional applications using the GCTID instrument have been (1) to analyze explosive vapors collected on solid phase microextraction fibers after thermal desorption in the heated inlet and (2) to characterize explosive residues on range scrap following wipe sampling or solvent immersion
20
Section 7 mdash References
ASTM (American Society for Testing and Materials) 1997a Standard Practice for Generation of Environmental Data Related to Waste Management Activities Quality Assurance and Quality Control Planning and Implementation D5283-92
ASTM (American Society for Testing and Materials) 1997b Standard Practice for Generation of Environmental Data Related to Waste Management Activities Development of Data Quality Objectives D5792-95
Berger W H McCarty and R-K Smith 1996 Environmental Laboratory Data Evaluation Genium Publishing Corp Schenectady NY
Draper N R and H Smith 1981 Applied Regression Analysis 2nd ed John Wiley amp Sons NY
EPA (US Environmental Protection Agency) 1994 ldquoMethod 8330 Nitroaromatics and Nitramines by High Performance Liquid Chromatography (HPLC)rdquo In Test Methods for Evaluating Solid Waste Physical Chemical Methods Update II SW-846 US Environmental Protection Agency Washington DC September
EPA (US Environmental Protection Agency) 1996 Guidance for Data Quality Assessment EPA QAG-9 EPA600R-96084 EPA Washington DC July
EPA (US Environmental Protection Agency) 1999 ldquoMethod 8095 Nitroaromatics and Nitramines by GC-ECDrdquo In Test Methods for Evaluating Solid Waste Physical Chemical Methods Update II SW-846 US Environmental Protection Agency Washington DC
Jenkins T F M E Walsh and P G Thorne 1998 Site Characterization for Explosives Contamination at a Military Firing Range Impact Area Special Report 98-9 US Army Cold Regions Research and Engineering Laboratory Hanover NH Available at httpwwwcrrelusacearmymil
Maskarinec M P C K Bayne L H Johnson S K Holladay R A Jenkins and B A Tomkins 1991 Stability of Explosives in Environmental Water and Soil Samples ORNLTM-11770 Oak Ridge National Laboratory Oak Ridge Tenn January
ORNL (Oak Ridge National Laboratory) 1999 Technology Demonstration Plan Evaluation of Explosives Field Analytical Techniques Oak Ridge National Laboratory Oak Ridge Tenn August
ORNL (Oak Ridge National Laboratory) 2000 Technology Verification Test Plan Evaluation of Explosives Field Analytical Techniques Oak Ridge National Laboratory Oak Ridge Tenn August
Specialized Assays Inc 1999 Comprehensive Quality Assurance Plan SAL-QC-Rec 50 January 6
21
Appendix A
GCTID Sample Results Compared withReference Laboratory Results
Sample site or type
Sample no
Sample replicate
24-DNT (mgkg)
SRI Ref Lab
RDX (mgkg)
SRI Ref Lab
TNT (mgkg)
SRI Ref Lab
SRI Analysis Order a
Blank 1 1 lt05 lt05 lt05 lt05 lt05 lt05 1079 Blank 1 2 lt05 lt05 lt05 lt05 lt05 lt05 1076 Blank 1 3 lt05 lt05 lt05 lt05 lt05 lt05 1062 Blank 1 4 lt05 lt05 lt05 lt05 lt05 lt05 1078
Blank 2 1 lt05 lt05 lt05 lt05 lt05 lt05 1070 Blank 2 2 lt05 lt51 lt05 lt51 lt05 709000 1108 Blank 2 3 lt05 lt05 lt05 lt05 lt05 lt05 1038 Blank 2 4 lt05 lt05 lt05 lt05 lt05 lt05 1054
Blank 3 1 lt05 lt05 lt05 lt05 lt05 lt05 1043 Blank 3 2 lt05 lt05 lt05 lt05 lt05 lt05 1052 Blank 3 3 lt05 lt05 lt05 lt05 11 lt05 1008 Blank 3 4 lt05 lt05 lt05 lt05 05 lt05 1102
Blank 4 1 lt05 lt05 lt05 lt05 lt05 09 1024 Blank 4 2 lt05 lt05 lt05 lt05 lt05 lt05 1018 Blank 4 3 lt05 lt05 lt05 lt05 07 lt05 1101 Blank 4 4 lt05 lt05 lt05 lt05 05 lt05 1022
Blank 5 1 lt05 lt05 lt05 lt05 lt05 lt05 1088 Blank 5 2 lt05 lt05 lt05 lt05 lt05 lt05 1046 Blank 5 3 lt05 lt05 lt05 lt05 63 lt05 1006 Blank 5 4 lt05 lt05 lt05 lt05 lt05 lt05 1053
Fort Ord 1 1 lt05 lt05 lt05 06 lt05 lt05 1050 Fort Ord 1 2 lt05 lt05 lt05 lt05 lt05 08 1073 Fort Ord 1 3 lt05 lt05 lt05 lt05 lt05 08 1092 Fort Ord 1 4 lt05 lt05 lt05 05 lt05 lt05 1013
Fort Ord 2 1 lt05 lt05 lt05 lt05 06 08 1034 Fort Ord 2 2 lt05 lt05 lt05 lt05 lt05 21 1031 Fort Ord 2 3 lt05 lt05 lt05 lt05 30 08 1098 Fort Ord 2 4 lt05 lt05 lt05 lt05 05 08 1067
Fort Ord 3 1 lt05 lt05 lt05 lt05 lt05 lt05 1026 Fort Ord 3 2 lt05 lt05 lt05 lt05 lt05 lt05 1084 Fort Ord 3 3 lt05 lt05 lt05 lt05 lt05 lt05 1066 Fort Ord 3 4 lt05 lt05 lt05 lt05 lt05 lt05 1030
Iowa 1 1 110 lt51 lt50 lt51 210000 204000 1077 Iowa 1 2 lt500 lt05 lt500 lt05 310000 08 1003 Iowa 1 3 180 lt532 lt50 lt532 230000 334000 1021 Iowa 1 4 100 lt505 lt50 lt505 220000 283000 1023
22
Sample site or type
Sample no
Sample replicate
24-DNT (mgkg)
SRI Ref Lab
RDX (mgkg)
SRI Ref Lab
TNT (mgkg)
SRI Ref Lab
SRI Analysis Order a
Louisiana 1 1 lt05 lt05 25000 34600 1500 1090 1107 Louisiana 1 2 lt500 lt05 24000 35200 1200 1200 1090 Louisiana 1 3 lt500 lt05 23000 21400 1200 1110 1100 Louisiana 1 4 lt50 lt250 22000 19000 990 1250 1025
Louisiana 2 1 lt5 lt05 14000 11800 660 500 1010 Louisiana 2 2 lt5 lt05 11000 14500 760 510 1027 Louisiana 2 3 lt5 lt05 13000 11700 610 510 1029 Louisiana 2 4 lt5 lt05 12000 3200 630 106 1012
Louisiana 3 1 lt50 lt05 48000 43000 810 2050 1082 Louisiana 3 2 lt50 lt50 35000 35500 890 1700 1041 Louisiana 3 3 55 lt50 34000 46500 450 3000 1055 Louisiana 3 4 lt5 lt05 40000 58500 1500 4000 1037
Louisiana 4 1 140 800 61 120 800 890 1081 Louisiana 4 2 88 114 71 107 840 780 1007 Louisiana 4 3 85 119 69 108 820 815 1056 Louisiana 4 4 72 95 46 77 730 675 1087
Milan 1 1 lt05 lt05 1100 1490 33 27 1097 Milan 1 2 lt05 lt05 1300 1180 93 11 1019 Milan 1 3 lt05 lt05 1100 722 09 14 1083 Milan 1 4 lt05 lt05 1500 3080 11 17 1039
Milan 2 1 lt05 lt05 220 348 lt05 lt05 1014 Milan 2 2 lt05 lt05 200 164 lt05 lt05 1074 Milan 2 3 lt05 lt05 260 280 lt05 lt05 1064 Milan 2 4 lt05 lt05 180 229 lt05 lt05 1072
Milan 3 1 lt50 lt05 79000 23500 2600 1900 1069 Milan 3 2 lt50 lt50 34000 19500 820 2700 1065 Milan 3 3 lt50 lt200 41000 40800 3000 3200 1016 Milan 3 4 lt50 lt05 38000 38800 1100 2730 1033
Milan 4 1 lt5 lt50 25000 27400 1100 2200 1086 Milan 4 2 lt50 lt05 25000 26400 680 2600 1028 Milan 4 3 lt50 lt05 21000 26000 450 800 1036 Milan 4 4 lt50 lt05 27000 30700 800 1620 1005
Milan 5 1 07 21 lt05 lt05 77 115 1048 Milan 5 2 06 27 lt05 lt05 73 102 1047 Milan 5 3 07 17 lt05 lt05 71 113 1060 Milan 5 4 06 16 lt05 lt05 68 106 1059
SpikePE 1 1 lt05 lt05 lt05 lt05 870 818 1103 SpikePE 1 2 lt05 lt05 lt05 lt05 870 1040 1044 SpikePE 1 3 lt05 lt05 lt05 lt05 920 900 1095 SpikePE 1 4 lt05 lt05 lt05 lt05 920 1240 1094
23
Sample site or type
Sample no
Sample replicate
24-DNT (mgkg)
SRI Ref Lab
RDX (mgkg)
SRI Ref Lab
TNT (mgkg)
SRI Ref Lab
SRI Analysis Order a
SpikePE 2 1 lt05 lt05 840 1110 lt05 lt05 1105 SpikePE 2 2 lt05 lt05 760 905 lt05 lt05 1057 SpikePE 2 3 lt05 lt05 880 980 24 lt05 1020 SpikePE 2 4 lt05 lt05 740 1270 lt05 lt05 1063
SpikePE 3 1 lt05 lt05 490 495 110 84 1049 SpikePE 3 2 lt05 lt05 560 450 100 76 1001 SpikePE 3 3 lt05 lt05 470 635 99 100 1058 SpikePE 3 4 lt05 lt05 460 510 100 85 1061
SpikePE 4 1 lt05 lt05 76 91 450 475 1104 SpikePE 4 2 lt05 lt05 97 84 500 485 1096 SpikePE 4 3 lt05 lt05 89 86 450 485 1071 SpikePE 4 4 lt05 lt05 87 91 480 470 1106
SpikePE 5 1 lt05 lt05 4400 4600 2600 2300 1068 SpikePE 5 2 lt5 lt05 4900 4550 2400 2050 1004 SpikePE 5 3 lt5 lt05 4900 7050 2600 4350 1075 SpikePE 5 4 lt05 lt05 4500 4450 2600 2050 1045
SpikePE 6 1 lt5 lt05 2100 2600 4800 5350 1099 SpikePE 6 2 lt5 lt25 2200 2550 4800 5050 1042 SpikePE 6 3 lt5 lt05 2300 3350 4800 6750 1093 SpikePE 6 4 lt05 lt05 2700 2500 5000 5100 1017
Volunteer 1 1 lt500 lt50 lt500 lt50 1900000 1080000 1002 Volunteer 1 2 590 lt25 lt50 lt25 1100000 755000 1091 Volunteer 1 3 600 190 lt50 lt5 1100000 1170000 1089 Volunteer 1 4 670 lt250 lt50 lt250 940000 610000 1015
Volunteer 2 1 300 lt532 lt50 lt532 90000 113000 1085 Volunteer 2 2 290 lt538 lt50 lt538 62000 126000 1051 Volunteer 2 3 350 lt54 lt50 65 83000 262000 1011 Volunteer 2 4 340 452 lt50 lt54 94000 89200 1009
Volunteer 3 1 07 20 lt05 lt05 99 120 1035 Volunteer 3 2 07 30 lt05 lt05 80 103 1032 Volunteer 3 3 06 22 lt05 lt05 77 138 1040 Volunteer 3 4 06 22 lt05 lt05 77 104 1080
aIndicates order of analysis by SRI for example 1001 was analyzed first then 1002 etc
24
Appendix B
Data Quality Objective (DQO) Example
Disclaimer The following hypothetical example serves to demonstrate how the information provided in this report may be used in the data quality objectives (DQO) process This example serves to illustrate the application of quantitative DQOs to a decision process but it cannot attempt to provide a thorough education in this topic (EPA 1996 ASTM 1997a ASTM 1997b) Please refer to other educational or technical resources for further details Additionally because the focus of this report is on the analytical technology this example makes simplifying assumptions (such as the sample is homogeneous and the reference laboratory results represent the true concentration) in the example that may not be valid in the real world
Background and Problem Statement An Army Ammunition Plant that produced TNT was recently decommissioned Past practices had resulted in contamination of four areas around the plant Soils at each site were mixtures of clay silt and organic matter with initial concentrations of about 1500 mgkg of TNT Forty cubic yards of TNT-contaminated soil were loaded into a bioreactor After three months of processing the soil mixture was dewatered and put into drums The simplifying assumption was made that the soil in each drum was homogeneous based on process knowledge In agreement with regulators the treatment goal established for the site was to reduce the soil concentration to lt15 mgkg of TNT Soil with lt15 mgkg of TNT would be returned to the four areas around the plant Those drums containing soil with TNT concentrations 15 mgkg would be stored for additional processing (ie incineration)
The companyrsquos DQO team considered using SRI Instrumentsrsquo Model 8610C gas chromatograph (GC) to measure the TNT concentration in each drum based on the data generated in the ETV verification study The SRI Model 8610C GC is an on-site gas chromatograph equipped with a thermionic ionization detector that allows for the determination of explosives in a soil matrix The plan was to randomly select soil samples from each drum and determine the TNT concentration with the SRI Model 8610C GC The DQO team decided that drums will be disposed by incineration if the TNT concentration is 15 mgkg (ldquohotrdquo) Those drums with TNT concentrations lt15 mgkg will be put into a landfill because incineration of TNTshycontaminated soil is very expensive With regulator agreement the DQO Team determined that a decision rule for disposal would be based on the average concentration of TNT in each drum
General Decision Rule
If the average TNT concentration is less than the action level then the TNT drums are sent to the landfill
If the average TNT concentration is greater than or equal to the action level then the TNT drum is sent to the incinerator
DQO Goals The DQO teamrsquos primary goal was to calculate how many samples would need to be analyzed by the SRI Model 8610C GC in order to confidently make a decision about remediating the processed soil given the uncertainties of the technologyrsquos results Because the team decided that inadvertently sending soil to a landfill that exceeded 15 mgkg of TNT was the worst possible mistake the number of samples measured is primarily related to this false-rejection decision error rate A secondary decision error would be to
25
unnecessarily incinerate soil with TNT concentrations lt15 mgkg This decision would be a false-acceptance decision error Consideration of both the false-rejection decision error and the false-acceptance decision error was used to determine the final sampling plan
EPA required that a sufficient number of samples be measured from each drum so that the false-rejection error rate (FR) for the decision rule was 005 or less if the true soil concentration in a drum was 15 mgkg or greater This DQO goal represents a 5 chance of returning a drum with soil containing 15 mgkg or more of TNT to a landfill
The DQO team did not want to incinerate an excessive number of drums if a drumrsquos TNT soil concentration was lt5 mgkg because of the expense Therefore the DQO team recommended that the false-acceptance error rate (FA) for the decision rule be 010 if the true drum concentration was less than 5 mgkg That is there would be a 10 chance of incinerating a drum if the true TNT concentration for a drum was lt5 mgkg
Permissible FR and FA Error Rates and Critical Decision Points
FR Pr[take drum to landfill] 005 when true TNT concentration = 15 mgkg
FA Pr[take drum to incinerator] 010 when true TNT concentration = 5 mgkg
Use of Technology Performance Information to Implement the Decision Rule Technology performance information is used to evaluate whether a particular analytical technology can produce data of sufficient quality to support the site decision Because the DQO team is considering the use of the SRI Model 8610C GC the performance of this technology (as reported in this ETV report) was used to assess its applicability to this project Two questions arise
1 How many samples are needed from a single drum to permit a valid estimate of the true average concentration of TNT in the drum to the specified certainty Recall that the simplifying assumption was made that the TNT distribution throughout the soil within a single drum is homogeneous thus matrix heterogeneity will not contribute to overall variability The only variability then to be considered in this example is the variability in the SRI Model 8610C GCrsquos analytical method which is determined by precision studies
2 What is the appropriate action level (AL) for using the SRI Model 8610C GC to make decisions in the field After the required number of samples have been collected from a drum and analyzed the results are averaged together to get an estimate of the ldquotruerdquo TNT concentration of the drum When using the SRI Model 8610C GC what is the value (here called ldquothe action level for the decision rulerdquo) to which that average is compared to decide if the drum is ldquohotrdquo or not This method-specific or site-specific action level is derived from evaluations of the methodrsquos accuracy using an appropriate quality control regimen
Determining the Number of Samples With the critical decision points selected the DQO team could then determine the number of samples needed from each drum to calculate the drumrsquos ldquotruerdquo average TNT concentration For a homogeneous matrix the number of samples required depends on the precision of the analytical method
Figure B-1 shows that the standard deviations for the SRI Model 8610C GC versus the average TNT concentration for the reference laboratory Although the fitted line increases with average TNT
26
concentration the linear model is not significantly 9
different than a constant standard deviation over the 8
0 to 50 mgkg concentration range Therefore the 7
precision of the SRI Model 8610C GC can be represented by a pooled standard deviation of 6
31 mgkg within the concentration range of 0 to 5
60 mgkg (see Figure B-1) Note that the pooled 4
standard deviation is calculated by first calculating 3 the average variance then taking the square root This estimate of analytical variability (precision) is
2
used to calculate the number of soil samples 1
required to be analyzed from each drum to achieve 0
the DQOs as determined in the DQO Goals The -1
following formula is provided in EPArsquos Guidance -2
for Data Quality Assessment (EPA 1996) that can be adapted to this example for calculating the number of samples required to meet the FR and FA requirements Figure B-1 Linear model for the standard deviation for
SRI Model 8610C GC versus average TNT (mgkg) result for the reference laboratory with 95 confidence intervals (dashed lines)
Stan
dard
Dev
iatio
n (m
gkg
) -- S
RI 8
610C
GC
Average TNT (mgkg) -- Reference Laboratory
0 10 20 30 40 50 60
(Eq B-1)
where n = number of samples from a drum to be measured S2 = variance for the measurement [eg S2 = (31)2 ] RT = regulatory threshold (eg RT = 15 mgkg) C FA = concentration at which the FA is specified (eg C FA = 5 mgkg) FR = false-rejection decision error rate (eg FR = 005) FA = false-acceptance decision error rate (eg FA = 010) Z1-p = (1-p)th percentile of the standard normal distribution (see EPA 1996 Table A-1 of Appendix A)
Example Z(1-FR) = Z095 = 1645 and Z(1- FA) = Z090 = 1282
Therefore three soil samples from each drum would be analyzed by SRI Model 8610C GC to meet the criteria established by the DQO process To be conservative the number of samples was rounded up to the next integer The TNT results from the three samples are averaged (by taking the arithmetic mean) to produce an SRI Model 8610C GC value for a drumrsquos TNT concentration
Determining the Action Level Now that the number of samples that need to be analyzed from each drum to meet the DQO goals has been determined the action level can be calculated The action level is the decision criterion (or ldquocut-offrdquo value) that will be compared to the unbiased average TNT concentration determined for each drum The AL for the
27
decision rule is calculated based on controlling the FR established in the DQO process Recall that the DQO team set the permissible FR error rate at 5
The formula (EPA 1996) to compute the action level is
(Eq B-2)
10
09
08
To summarize three random samples from each drum are analyzed The three results are averaged to produce the average TNT concentration for the drum which is then compared to the action level (ie AL = 121 mgkg) for the decision rule Therefore the decision rule using the SRI Model 8610C GC to satisfy a 5 FR and a 10 FA is as follows
Prob
[ Tak
e Dr
um to
Inci
nera
tor ]
06
05
03
02
01
00 0 5 10 15 20
False Rejection = 005
True TNT Concentration (mgkg)
07
04
Figure B-2 Decision performance curve to TNT drum example
Decision Rule for FR = 5 and FA = 10
If the average TNT concentration of three random soil samples on a drum is lt121 mgkg then send the drum to the landfill
If the average TNT concentration of three random soil samples on a drum is 121 mgkg then send the drum to the incinerator
The decision performance curve (for more information see EPA 1996 pp 34ndash36) calculates the probability of sending a drum to the incinerator for different values of true TNT soil concentration in a drum Figure B-2 shows that the decision performance curve has the value of Pr[take drum to incinerator] = 095 for true = 15 mgkg This indicates that the decision rule meets the DQO teamrsquos FR of 5 The actual Pr[take drum to incinerator] = 000004 for a true TNT concentration = 5 mgkg which is better than the FA of 10 that the DQO team had originally specified This improved performance is due to rounding up the number of samples to the next integer in the calculation of number of samples required
Alternative FR Parameter Because of random sampling and analysis error some chance always exists that analytical results will not accurately reflect the true nature of a decision unit (such as a drum in this example) Often 95 certainty (a 5 FR) is customary and sufficient to meet stakeholder comfort But suppose that the DQO team wanted to be even more cautious about limiting the possibility that a drum might be sent to a landfill when its true value is 15 mgkg If the DQO team wanted to be 99 certain that a drum was correctly sent to a landfill the
28
following describes how changing the FR requirement from 5 to 1 would affect the decision rule Using FR = 001 the sample size is calculated to be four and the action level is calculated as 114 mgkg The decision performance curve has the value of Pr[take drum to incinerator] = 099 for true = 15 mgkg This indicates that the decision rule meets the DQO teamrsquos FR of 1 The Pr[take drum to incinerator] = 000002 for true = 5 mgkg is better than the FA of 10 that the DQO team had specified This improved performance is due to rounding up the number of samples to the next integer in the calculation of number of samples required The decision rule for the lower FR would be as follows
Decision Rule for FR = 1 and FA = 10
If the average TNT concentration of four random soil samples on a drum is lt114 mgkg then send the drum to the landfill
If the average TNT concentration of four random soil samples on a drum is 114 mgkg then send the drum to the incinerator
Comparison to Sending the Samples Off-Site for Analysis The DQO team wanted to compare the sampling plan using the SRI Model 8610C GC field measurements with a sampling plan using an off-site reference laboratory For the off-site reference laboratory the DQO team assumed a precision of SD = 09 mgkg based on the ETV reference laboratory values They also specified that the FA percentage would be at a TNT concentration of 10 mgkg because the reference laboratory measurements are more precise This specification means that there is only a 10 chance of sending a drum to the incinerator if the true TNT concentration in the drum is 10 mgkg A formula provided in EPArsquos Guidance for Data Quality Assessment (EPA 1996) shows that the number would be n = 2 for the 5 FR percentage and 10 FA percentage The decision rule would be to take two randomly selected samples and send them to the reference laboratory for analysis If the average TNT concentration is less than an action level of 140 mgkg restore the soil to the plant site otherwise send the soil drum to storage In this example the off-site laboratory appears to require fewer samples to be analyzed (two for the off-site laboratory versus three for the SRI Model 8610C GC) Other factors (such as a cost-benefit analysis ability to detect other analytes) would need to be considered before choosing a method for this application
29
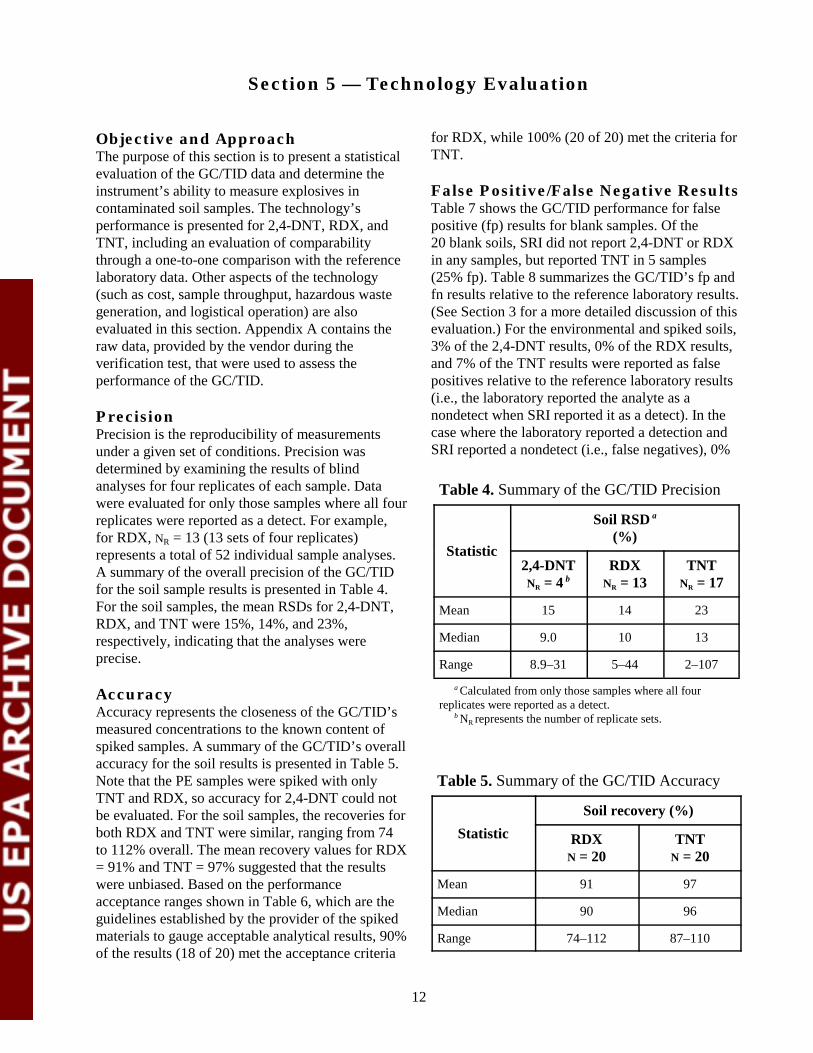
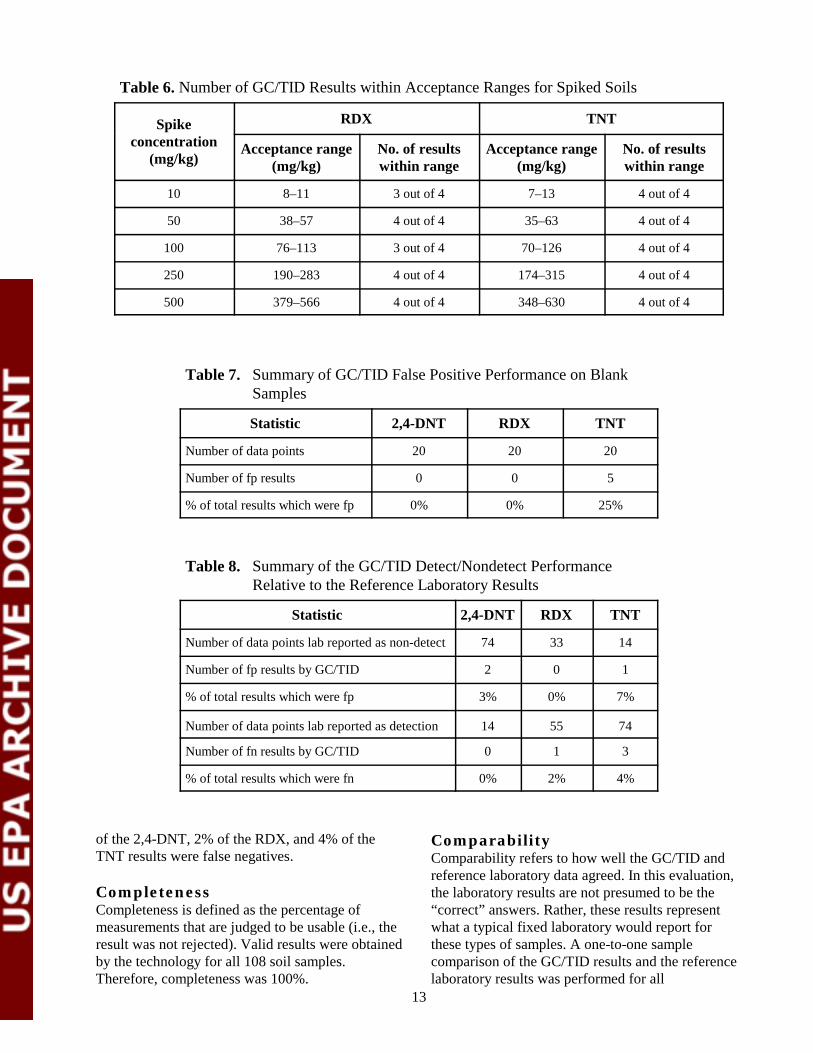
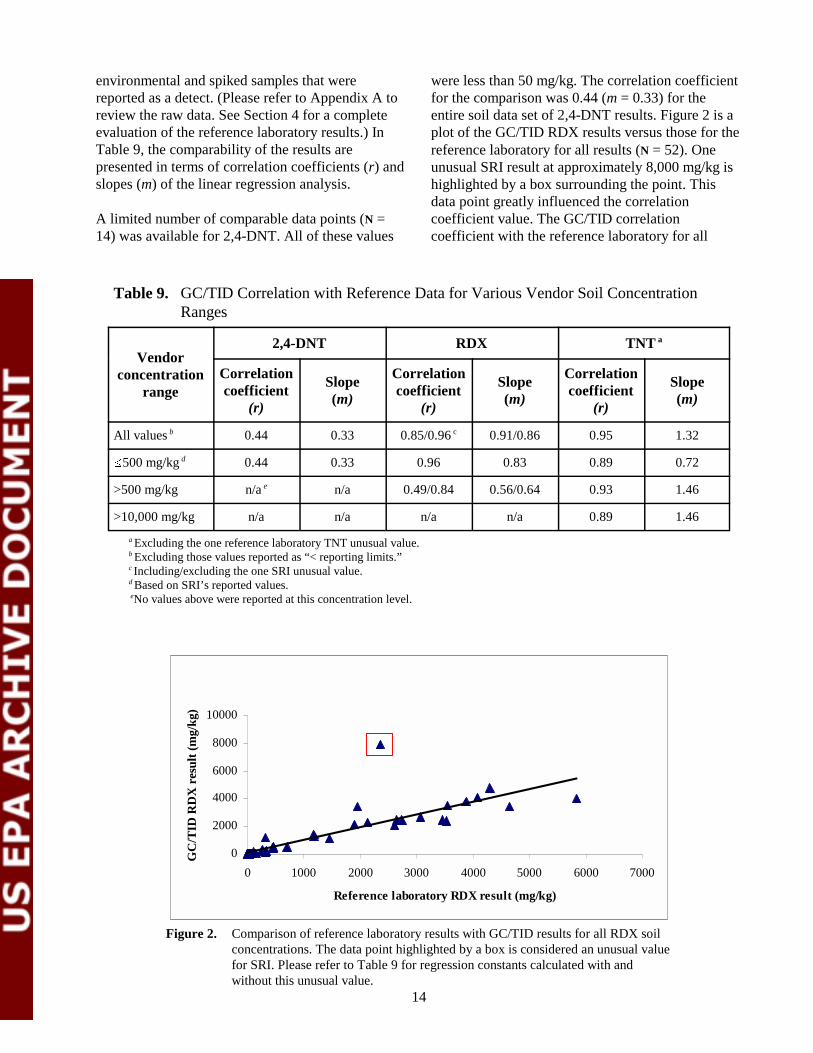
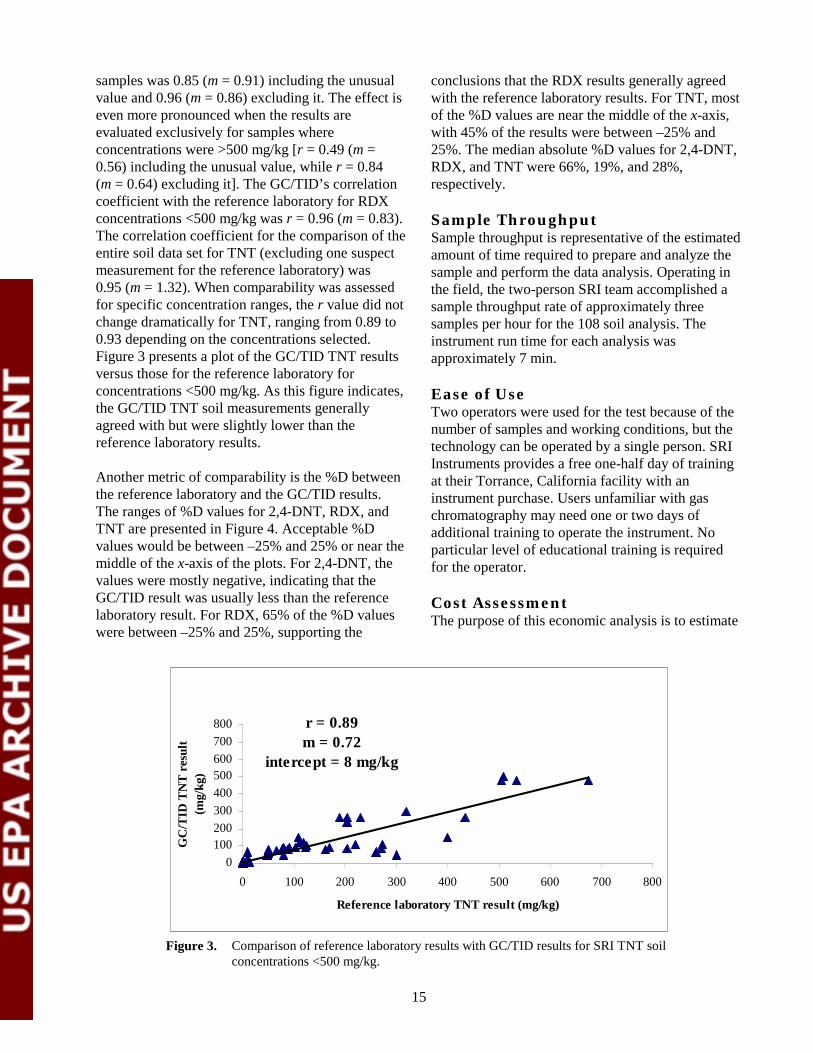
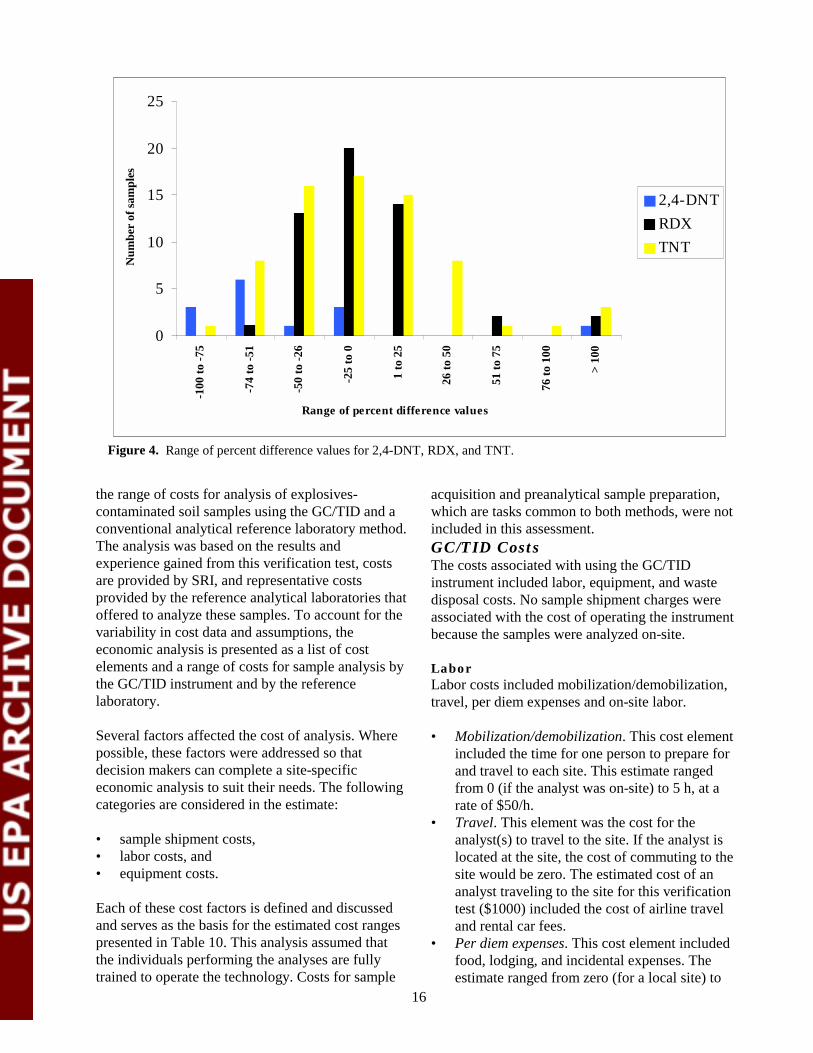
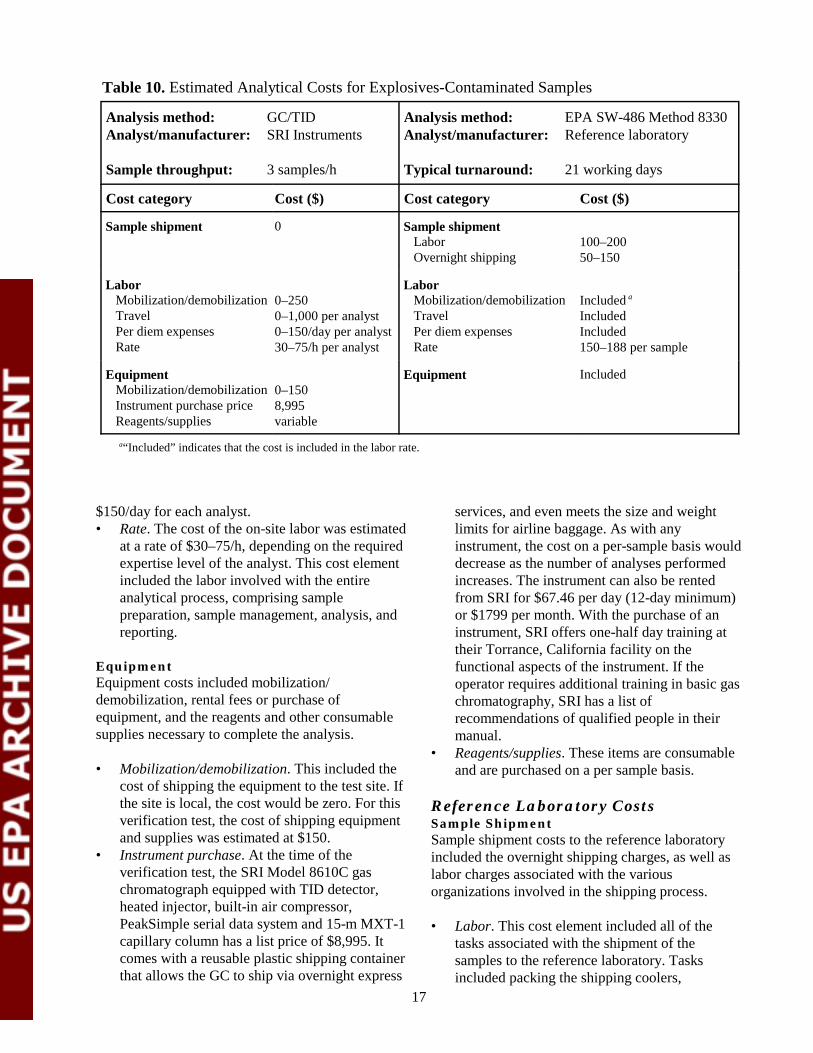
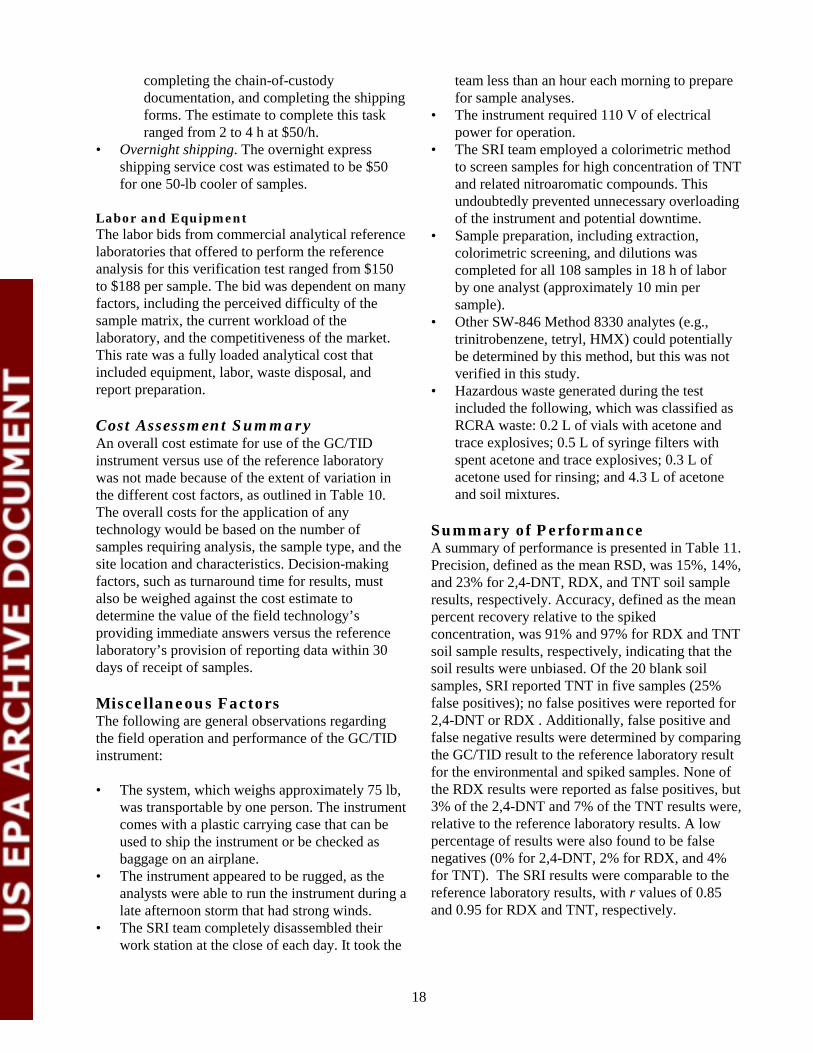
Sample site or type
Sample no
Sample replicate
24-DNT (mgkg)
SRI Ref Lab
RDX (mgkg)
SRI Ref Lab
TNT (mgkg)
SRI Ref Lab
SRI Analysis Order a
Louisiana 1 1 lt05 lt05 25000 34600 1500 1090 1107 Louisiana 1 2 lt500 lt05 24000 35200 1200 1200 1090 Louisiana 1 3 lt500 lt05 23000 21400 1200 1110 1100 Louisiana 1 4 lt50 lt250 22000 19000 990 1250 1025
Louisiana 2 1 lt5 lt05 14000 11800 660 500 1010 Louisiana 2 2 lt5 lt05 11000 14500 760 510 1027 Louisiana 2 3 lt5 lt05 13000 11700 610 510 1029 Louisiana 2 4 lt5 lt05 12000 3200 630 106 1012
Louisiana 3 1 lt50 lt05 48000 43000 810 2050 1082 Louisiana 3 2 lt50 lt50 35000 35500 890 1700 1041 Louisiana 3 3 55 lt50 34000 46500 450 3000 1055 Louisiana 3 4 lt5 lt05 40000 58500 1500 4000 1037
Louisiana 4 1 140 800 61 120 800 890 1081 Louisiana 4 2 88 114 71 107 840 780 1007 Louisiana 4 3 85 119 69 108 820 815 1056 Louisiana 4 4 72 95 46 77 730 675 1087
Milan 1 1 lt05 lt05 1100 1490 33 27 1097 Milan 1 2 lt05 lt05 1300 1180 93 11 1019 Milan 1 3 lt05 lt05 1100 722 09 14 1083 Milan 1 4 lt05 lt05 1500 3080 11 17 1039
Milan 2 1 lt05 lt05 220 348 lt05 lt05 1014 Milan 2 2 lt05 lt05 200 164 lt05 lt05 1074 Milan 2 3 lt05 lt05 260 280 lt05 lt05 1064 Milan 2 4 lt05 lt05 180 229 lt05 lt05 1072
Milan 3 1 lt50 lt05 79000 23500 2600 1900 1069 Milan 3 2 lt50 lt50 34000 19500 820 2700 1065 Milan 3 3 lt50 lt200 41000 40800 3000 3200 1016 Milan 3 4 lt50 lt05 38000 38800 1100 2730 1033
Milan 4 1 lt5 lt50 25000 27400 1100 2200 1086 Milan 4 2 lt50 lt05 25000 26400 680 2600 1028 Milan 4 3 lt50 lt05 21000 26000 450 800 1036 Milan 4 4 lt50 lt05 27000 30700 800 1620 1005
Milan 5 1 07 21 lt05 lt05 77 115 1048 Milan 5 2 06 27 lt05 lt05 73 102 1047 Milan 5 3 07 17 lt05 lt05 71 113 1060 Milan 5 4 06 16 lt05 lt05 68 106 1059
SpikePE 1 1 lt05 lt05 lt05 lt05 870 818 1103 SpikePE 1 2 lt05 lt05 lt05 lt05 870 1040 1044 SpikePE 1 3 lt05 lt05 lt05 lt05 920 900 1095 SpikePE 1 4 lt05 lt05 lt05 lt05 920 1240 1094
23
Sample site or type
Sample no
Sample replicate
24-DNT (mgkg)
SRI Ref Lab
RDX (mgkg)
SRI Ref Lab
TNT (mgkg)
SRI Ref Lab
SRI Analysis Order a
SpikePE 2 1 lt05 lt05 840 1110 lt05 lt05 1105 SpikePE 2 2 lt05 lt05 760 905 lt05 lt05 1057 SpikePE 2 3 lt05 lt05 880 980 24 lt05 1020 SpikePE 2 4 lt05 lt05 740 1270 lt05 lt05 1063
SpikePE 3 1 lt05 lt05 490 495 110 84 1049 SpikePE 3 2 lt05 lt05 560 450 100 76 1001 SpikePE 3 3 lt05 lt05 470 635 99 100 1058 SpikePE 3 4 lt05 lt05 460 510 100 85 1061
SpikePE 4 1 lt05 lt05 76 91 450 475 1104 SpikePE 4 2 lt05 lt05 97 84 500 485 1096 SpikePE 4 3 lt05 lt05 89 86 450 485 1071 SpikePE 4 4 lt05 lt05 87 91 480 470 1106
SpikePE 5 1 lt05 lt05 4400 4600 2600 2300 1068 SpikePE 5 2 lt5 lt05 4900 4550 2400 2050 1004 SpikePE 5 3 lt5 lt05 4900 7050 2600 4350 1075 SpikePE 5 4 lt05 lt05 4500 4450 2600 2050 1045
SpikePE 6 1 lt5 lt05 2100 2600 4800 5350 1099 SpikePE 6 2 lt5 lt25 2200 2550 4800 5050 1042 SpikePE 6 3 lt5 lt05 2300 3350 4800 6750 1093 SpikePE 6 4 lt05 lt05 2700 2500 5000 5100 1017
Volunteer 1 1 lt500 lt50 lt500 lt50 1900000 1080000 1002 Volunteer 1 2 590 lt25 lt50 lt25 1100000 755000 1091 Volunteer 1 3 600 190 lt50 lt5 1100000 1170000 1089 Volunteer 1 4 670 lt250 lt50 lt250 940000 610000 1015
Volunteer 2 1 300 lt532 lt50 lt532 90000 113000 1085 Volunteer 2 2 290 lt538 lt50 lt538 62000 126000 1051 Volunteer 2 3 350 lt54 lt50 65 83000 262000 1011 Volunteer 2 4 340 452 lt50 lt54 94000 89200 1009
Volunteer 3 1 07 20 lt05 lt05 99 120 1035 Volunteer 3 2 07 30 lt05 lt05 80 103 1032 Volunteer 3 3 06 22 lt05 lt05 77 138 1040 Volunteer 3 4 06 22 lt05 lt05 77 104 1080
aIndicates order of analysis by SRI for example 1001 was analyzed first then 1002 etc
24
Appendix B
Data Quality Objective (DQO) Example
Disclaimer The following hypothetical example serves to demonstrate how the information provided in this report may be used in the data quality objectives (DQO) process This example serves to illustrate the application of quantitative DQOs to a decision process but it cannot attempt to provide a thorough education in this topic (EPA 1996 ASTM 1997a ASTM 1997b) Please refer to other educational or technical resources for further details Additionally because the focus of this report is on the analytical technology this example makes simplifying assumptions (such as the sample is homogeneous and the reference laboratory results represent the true concentration) in the example that may not be valid in the real world
Background and Problem Statement An Army Ammunition Plant that produced TNT was recently decommissioned Past practices had resulted in contamination of four areas around the plant Soils at each site were mixtures of clay silt and organic matter with initial concentrations of about 1500 mgkg of TNT Forty cubic yards of TNT-contaminated soil were loaded into a bioreactor After three months of processing the soil mixture was dewatered and put into drums The simplifying assumption was made that the soil in each drum was homogeneous based on process knowledge In agreement with regulators the treatment goal established for the site was to reduce the soil concentration to lt15 mgkg of TNT Soil with lt15 mgkg of TNT would be returned to the four areas around the plant Those drums containing soil with TNT concentrations 15 mgkg would be stored for additional processing (ie incineration)
The companyrsquos DQO team considered using SRI Instrumentsrsquo Model 8610C gas chromatograph (GC) to measure the TNT concentration in each drum based on the data generated in the ETV verification study The SRI Model 8610C GC is an on-site gas chromatograph equipped with a thermionic ionization detector that allows for the determination of explosives in a soil matrix The plan was to randomly select soil samples from each drum and determine the TNT concentration with the SRI Model 8610C GC The DQO team decided that drums will be disposed by incineration if the TNT concentration is 15 mgkg (ldquohotrdquo) Those drums with TNT concentrations lt15 mgkg will be put into a landfill because incineration of TNTshycontaminated soil is very expensive With regulator agreement the DQO Team determined that a decision rule for disposal would be based on the average concentration of TNT in each drum
General Decision Rule
If the average TNT concentration is less than the action level then the TNT drums are sent to the landfill
If the average TNT concentration is greater than or equal to the action level then the TNT drum is sent to the incinerator
DQO Goals The DQO teamrsquos primary goal was to calculate how many samples would need to be analyzed by the SRI Model 8610C GC in order to confidently make a decision about remediating the processed soil given the uncertainties of the technologyrsquos results Because the team decided that inadvertently sending soil to a landfill that exceeded 15 mgkg of TNT was the worst possible mistake the number of samples measured is primarily related to this false-rejection decision error rate A secondary decision error would be to
25
unnecessarily incinerate soil with TNT concentrations lt15 mgkg This decision would be a false-acceptance decision error Consideration of both the false-rejection decision error and the false-acceptance decision error was used to determine the final sampling plan
EPA required that a sufficient number of samples be measured from each drum so that the false-rejection error rate (FR) for the decision rule was 005 or less if the true soil concentration in a drum was 15 mgkg or greater This DQO goal represents a 5 chance of returning a drum with soil containing 15 mgkg or more of TNT to a landfill
The DQO team did not want to incinerate an excessive number of drums if a drumrsquos TNT soil concentration was lt5 mgkg because of the expense Therefore the DQO team recommended that the false-acceptance error rate (FA) for the decision rule be 010 if the true drum concentration was less than 5 mgkg That is there would be a 10 chance of incinerating a drum if the true TNT concentration for a drum was lt5 mgkg
Permissible FR and FA Error Rates and Critical Decision Points
FR Pr[take drum to landfill] 005 when true TNT concentration = 15 mgkg
FA Pr[take drum to incinerator] 010 when true TNT concentration = 5 mgkg
Use of Technology Performance Information to Implement the Decision Rule Technology performance information is used to evaluate whether a particular analytical technology can produce data of sufficient quality to support the site decision Because the DQO team is considering the use of the SRI Model 8610C GC the performance of this technology (as reported in this ETV report) was used to assess its applicability to this project Two questions arise
1 How many samples are needed from a single drum to permit a valid estimate of the true average concentration of TNT in the drum to the specified certainty Recall that the simplifying assumption was made that the TNT distribution throughout the soil within a single drum is homogeneous thus matrix heterogeneity will not contribute to overall variability The only variability then to be considered in this example is the variability in the SRI Model 8610C GCrsquos analytical method which is determined by precision studies
2 What is the appropriate action level (AL) for using the SRI Model 8610C GC to make decisions in the field After the required number of samples have been collected from a drum and analyzed the results are averaged together to get an estimate of the ldquotruerdquo TNT concentration of the drum When using the SRI Model 8610C GC what is the value (here called ldquothe action level for the decision rulerdquo) to which that average is compared to decide if the drum is ldquohotrdquo or not This method-specific or site-specific action level is derived from evaluations of the methodrsquos accuracy using an appropriate quality control regimen
Determining the Number of Samples With the critical decision points selected the DQO team could then determine the number of samples needed from each drum to calculate the drumrsquos ldquotruerdquo average TNT concentration For a homogeneous matrix the number of samples required depends on the precision of the analytical method
Figure B-1 shows that the standard deviations for the SRI Model 8610C GC versus the average TNT concentration for the reference laboratory Although the fitted line increases with average TNT
26
concentration the linear model is not significantly 9
different than a constant standard deviation over the 8
0 to 50 mgkg concentration range Therefore the 7
precision of the SRI Model 8610C GC can be represented by a pooled standard deviation of 6
31 mgkg within the concentration range of 0 to 5
60 mgkg (see Figure B-1) Note that the pooled 4
standard deviation is calculated by first calculating 3 the average variance then taking the square root This estimate of analytical variability (precision) is
2
used to calculate the number of soil samples 1
required to be analyzed from each drum to achieve 0
the DQOs as determined in the DQO Goals The -1
following formula is provided in EPArsquos Guidance -2
for Data Quality Assessment (EPA 1996) that can be adapted to this example for calculating the number of samples required to meet the FR and FA requirements Figure B-1 Linear model for the standard deviation for
SRI Model 8610C GC versus average TNT (mgkg) result for the reference laboratory with 95 confidence intervals (dashed lines)
Stan
dard
Dev
iatio
n (m
gkg
) -- S
RI 8
610C
GC
Average TNT (mgkg) -- Reference Laboratory
0 10 20 30 40 50 60
(Eq B-1)
where n = number of samples from a drum to be measured S2 = variance for the measurement [eg S2 = (31)2 ] RT = regulatory threshold (eg RT = 15 mgkg) C FA = concentration at which the FA is specified (eg C FA = 5 mgkg) FR = false-rejection decision error rate (eg FR = 005) FA = false-acceptance decision error rate (eg FA = 010) Z1-p = (1-p)th percentile of the standard normal distribution (see EPA 1996 Table A-1 of Appendix A)
Example Z(1-FR) = Z095 = 1645 and Z(1- FA) = Z090 = 1282
Therefore three soil samples from each drum would be analyzed by SRI Model 8610C GC to meet the criteria established by the DQO process To be conservative the number of samples was rounded up to the next integer The TNT results from the three samples are averaged (by taking the arithmetic mean) to produce an SRI Model 8610C GC value for a drumrsquos TNT concentration
Determining the Action Level Now that the number of samples that need to be analyzed from each drum to meet the DQO goals has been determined the action level can be calculated The action level is the decision criterion (or ldquocut-offrdquo value) that will be compared to the unbiased average TNT concentration determined for each drum The AL for the
27
decision rule is calculated based on controlling the FR established in the DQO process Recall that the DQO team set the permissible FR error rate at 5
The formula (EPA 1996) to compute the action level is
(Eq B-2)
10
09
08
To summarize three random samples from each drum are analyzed The three results are averaged to produce the average TNT concentration for the drum which is then compared to the action level (ie AL = 121 mgkg) for the decision rule Therefore the decision rule using the SRI Model 8610C GC to satisfy a 5 FR and a 10 FA is as follows
Prob
[ Tak
e Dr
um to
Inci
nera
tor ]
06
05
03
02
01
00 0 5 10 15 20
False Rejection = 005
True TNT Concentration (mgkg)
07
04
Figure B-2 Decision performance curve to TNT drum example
Decision Rule for FR = 5 and FA = 10
If the average TNT concentration of three random soil samples on a drum is lt121 mgkg then send the drum to the landfill
If the average TNT concentration of three random soil samples on a drum is 121 mgkg then send the drum to the incinerator
The decision performance curve (for more information see EPA 1996 pp 34ndash36) calculates the probability of sending a drum to the incinerator for different values of true TNT soil concentration in a drum Figure B-2 shows that the decision performance curve has the value of Pr[take drum to incinerator] = 095 for true = 15 mgkg This indicates that the decision rule meets the DQO teamrsquos FR of 5 The actual Pr[take drum to incinerator] = 000004 for a true TNT concentration = 5 mgkg which is better than the FA of 10 that the DQO team had originally specified This improved performance is due to rounding up the number of samples to the next integer in the calculation of number of samples required
Alternative FR Parameter Because of random sampling and analysis error some chance always exists that analytical results will not accurately reflect the true nature of a decision unit (such as a drum in this example) Often 95 certainty (a 5 FR) is customary and sufficient to meet stakeholder comfort But suppose that the DQO team wanted to be even more cautious about limiting the possibility that a drum might be sent to a landfill when its true value is 15 mgkg If the DQO team wanted to be 99 certain that a drum was correctly sent to a landfill the
28
following describes how changing the FR requirement from 5 to 1 would affect the decision rule Using FR = 001 the sample size is calculated to be four and the action level is calculated as 114 mgkg The decision performance curve has the value of Pr[take drum to incinerator] = 099 for true = 15 mgkg This indicates that the decision rule meets the DQO teamrsquos FR of 1 The Pr[take drum to incinerator] = 000002 for true = 5 mgkg is better than the FA of 10 that the DQO team had specified This improved performance is due to rounding up the number of samples to the next integer in the calculation of number of samples required The decision rule for the lower FR would be as follows
Decision Rule for FR = 1 and FA = 10
If the average TNT concentration of four random soil samples on a drum is lt114 mgkg then send the drum to the landfill
If the average TNT concentration of four random soil samples on a drum is 114 mgkg then send the drum to the incinerator
Comparison to Sending the Samples Off-Site for Analysis The DQO team wanted to compare the sampling plan using the SRI Model 8610C GC field measurements with a sampling plan using an off-site reference laboratory For the off-site reference laboratory the DQO team assumed a precision of SD = 09 mgkg based on the ETV reference laboratory values They also specified that the FA percentage would be at a TNT concentration of 10 mgkg because the reference laboratory measurements are more precise This specification means that there is only a 10 chance of sending a drum to the incinerator if the true TNT concentration in the drum is 10 mgkg A formula provided in EPArsquos Guidance for Data Quality Assessment (EPA 1996) shows that the number would be n = 2 for the 5 FR percentage and 10 FA percentage The decision rule would be to take two randomly selected samples and send them to the reference laboratory for analysis If the average TNT concentration is less than an action level of 140 mgkg restore the soil to the plant site otherwise send the soil drum to storage In this example the off-site laboratory appears to require fewer samples to be analyzed (two for the off-site laboratory versus three for the SRI Model 8610C GC) Other factors (such as a cost-benefit analysis ability to detect other analytes) would need to be considered before choosing a method for this application
29
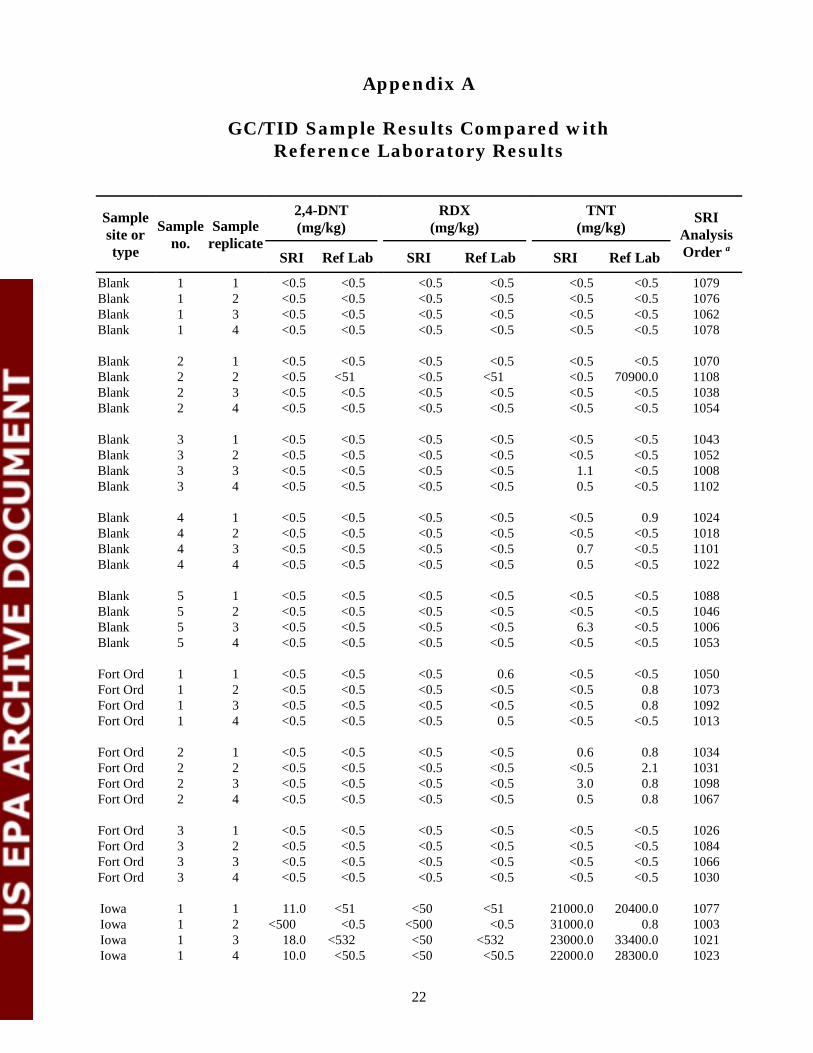
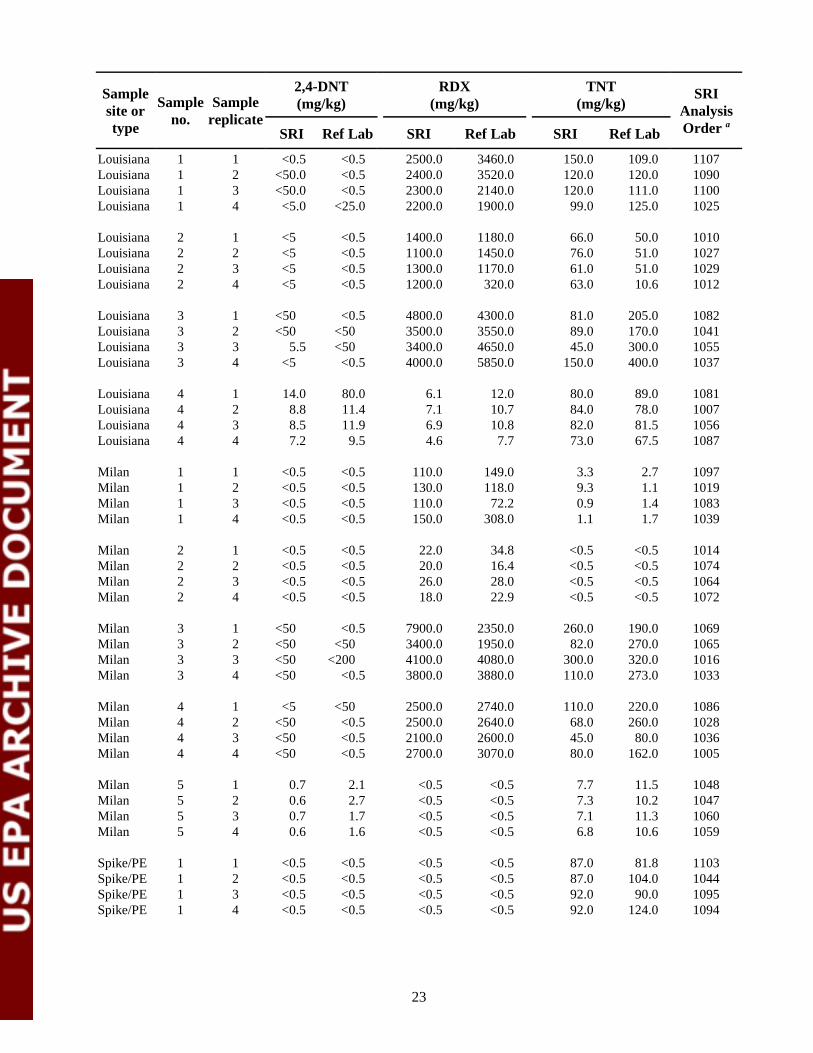
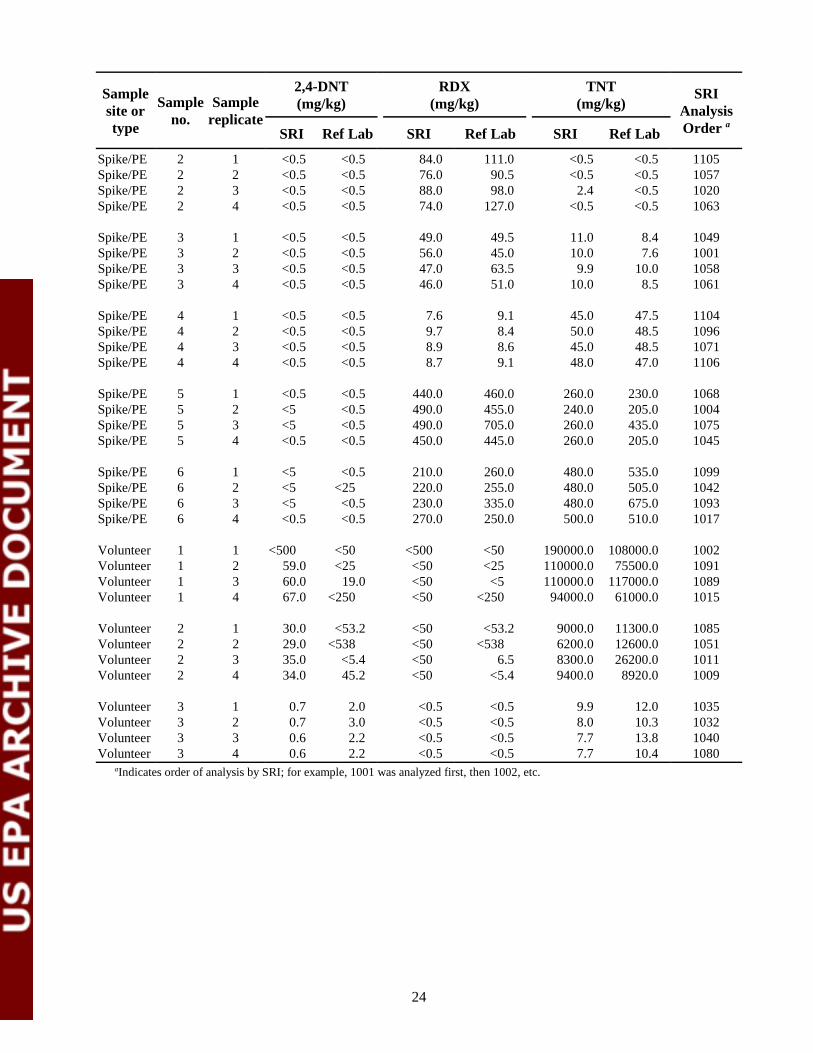