Embed Size (px)
Citation preview
P. 1
MODEC, INC.
2005 HALF-YEAR RESULTSANALYSTS PRESENTATION
August 19, 2005
P. 2
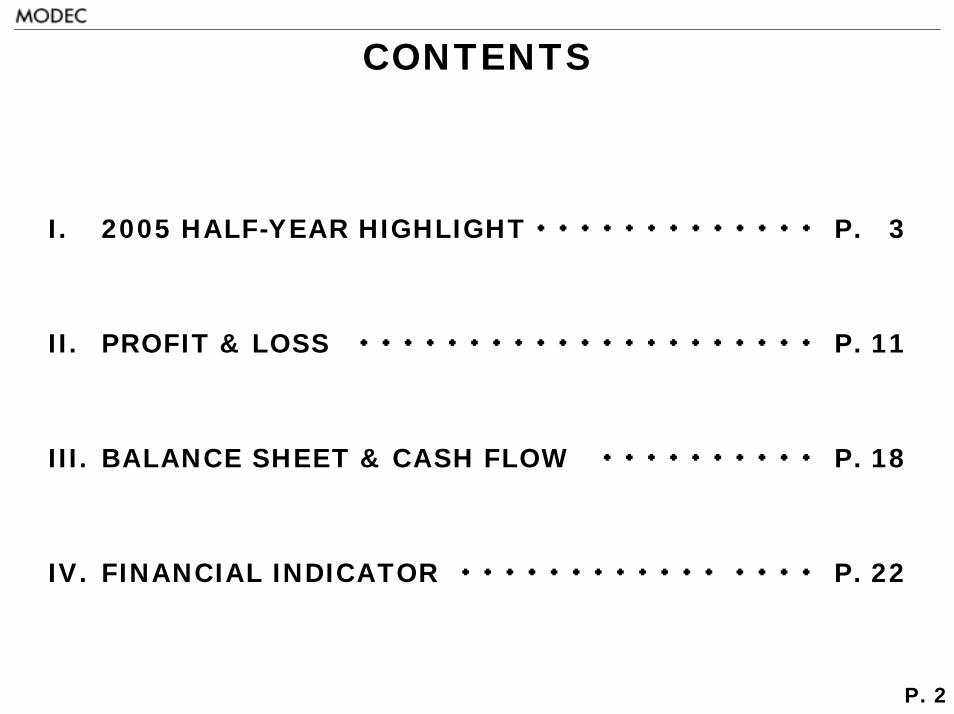
CONTENTS
I. 2005 HALF-YEAR HIGHLIGHT
II. PROFIT & LOSS
III. BALANCE SHEET & CASH FLOW
IV. FINANCIAL INDICATOR
・ ・ ・ ・ ・ ・ ・ ・ ・ ・ ・ ・ ・ P. 3
・ ・ ・ ・ ・ ・ ・ ・ ・ ・ ・ ・ ・ ・ ・ ・ ・ ・ ・ ・ ・ P. 11
・ ・ ・ ・ ・ ・ ・ ・ ・ ・ P. 18
・ ・ ・ ・ ・ ・ ・ ・ ・ ・ ・ ・ ・ ・ ・ ・ P. 22
P. 3
I. 2005 HALF-YEAR HIGHLIGHT
1. NEWLY ORDERED PROJECTS2. CONSTRUCTION WORKS3. PROSPECTIVE PROJECTS- CURRENT PROSPECTIVE PROJECTS- OTHER TOPICS- PROJECT LOCATION- CHARTER and O&M PERIOD
P. 4
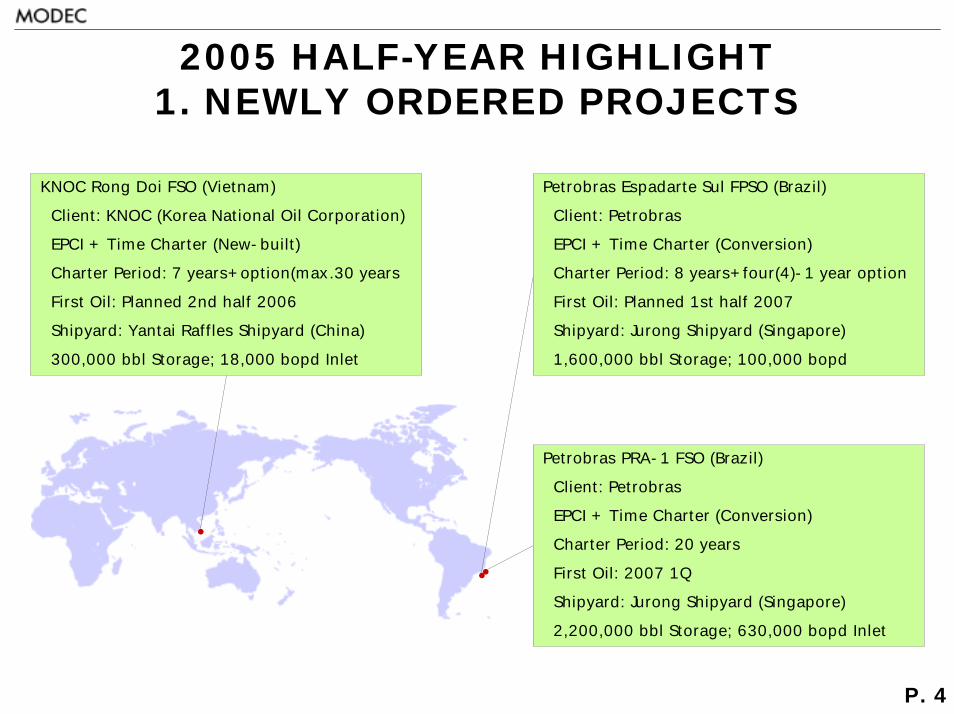
2005 HALF-YEAR HIGHLIGHT1. NEWLY ORDERED PROJECTS
KNOC Rong Doi FSO (Vietnam)
Client: KNOC (Korea National Oil Corporation)
EPCI + Time Charter (New-built)
Charter Period: 7 years+option(max.30 years
First Oil: Planned 2nd half 2006
Shipyard: Yantai Raffles Shipyard (China)
300,000 bbl Storage; 18,000 bopd Inlet
Petrobras Espadarte Sul FPSO (Brazil)
Client: Petrobras
EPCI + Time Charter (Conversion)
Charter Period: 8 years+four(4)-1 year option
First Oil: Planned 1st half 2007
Shipyard: Jurong Shipyard (Singapore)
1,600,000 bbl Storage; 100,000 bopd
Petrobras PRA-1 FSO (Brazil)
Client: Petrobras
EPCI + Time Charter (Conversion)
Charter Period: 20 years
First Oil: 2007 1Q
Shipyard: Jurong Shipyard (Singapore)
2,200,000 bbl Storage; 630,000 bopd Inlet
P. 5
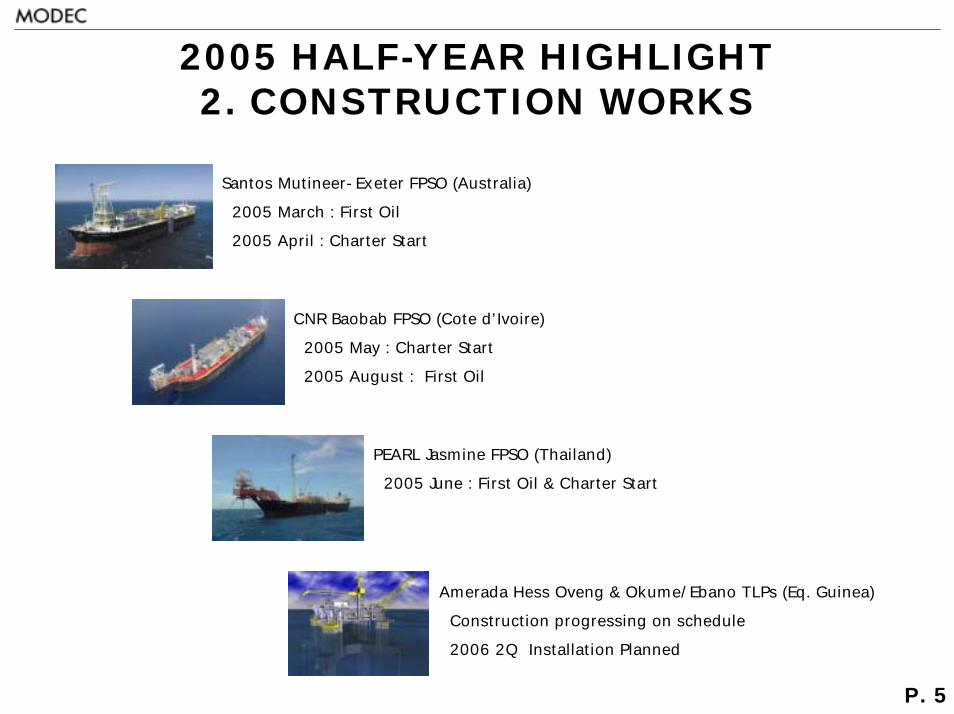
2005 HALF-YEAR HIGHLIGHT 2. CONSTRUCTION WORKS
Santos Mutineer-Exeter FPSO (Australia)
2005 March : First Oil
2005 April : Charter Start
CNR Baobab FPSO (Cote d’Ivoire)
2005 May : Charter Start
2005 August : First Oil
PEARL Jasmine FPSO (Thailand)
2005 June : First Oil & Charter Start
Amerada Hess Oveng & Okume/Ebano TLPs (Eq. Guinea)
Construction progressing on schedule
2006 2Q Installation Planned
P. 6
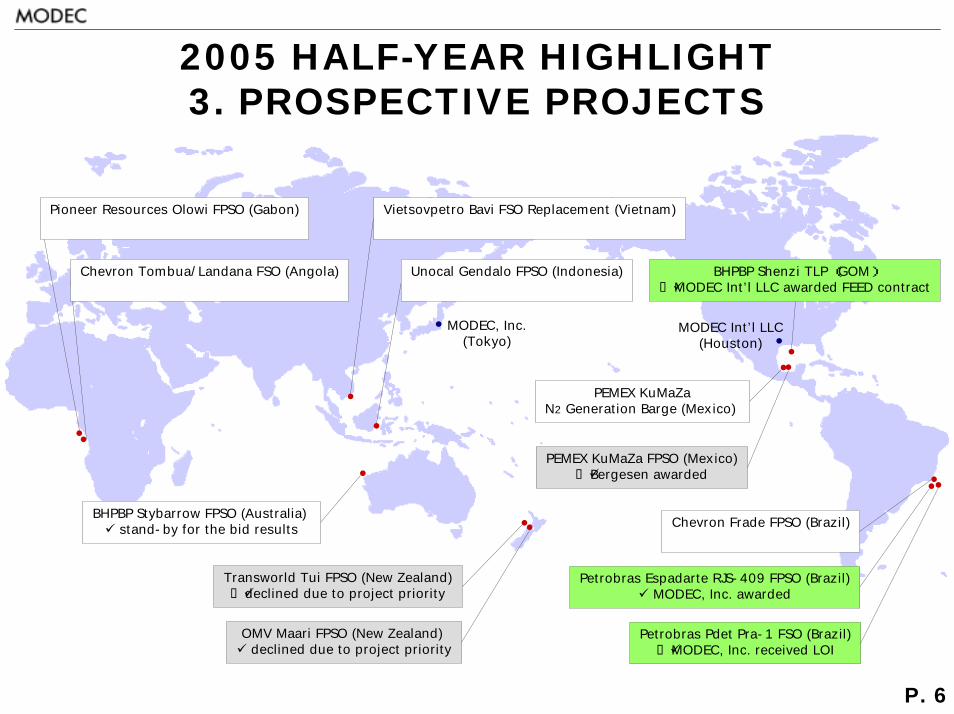
2005 HALF-YEAR HIGHLIGHT 3. PROSPECTIVE PROJECTS
PEMEX KuMaZaN2 Generation Barge (Mexico)
Pioneer Resources Olowi FPSO (Gabon)
Petrobras Espadarte RJS-409 FPSO (Brazil)MODEC, Inc. awarded
OMV Maari FPSO (New Zealand) declined due to project priority
Unocal Gendalo FPSO (Indonesia)
BHPBP Stybarrow FPSO (Australia) stand-by for the bid results
BHPBP Shenzi TLP (GOM)MODEC Int’l LLC awarded FEED contract
Petrobras Pdet Pra-1 FSO (Brazil)MODEC, Inc. received LOI
Transworld Tui FPSO (New Zealand)declined due to project priority
Vietsovpetro Bavi FSO Replacement (Vietnam)
Chevron Frade FPSO (Brazil)
Chevron Tombua/Landana FSO (Angola)
PEMEX KuMaZa FPSO (Mexico)Bergesen awarded
MODEC, Inc.(Tokyo)
MODEC Int’l LLC(Houston)
P. 7
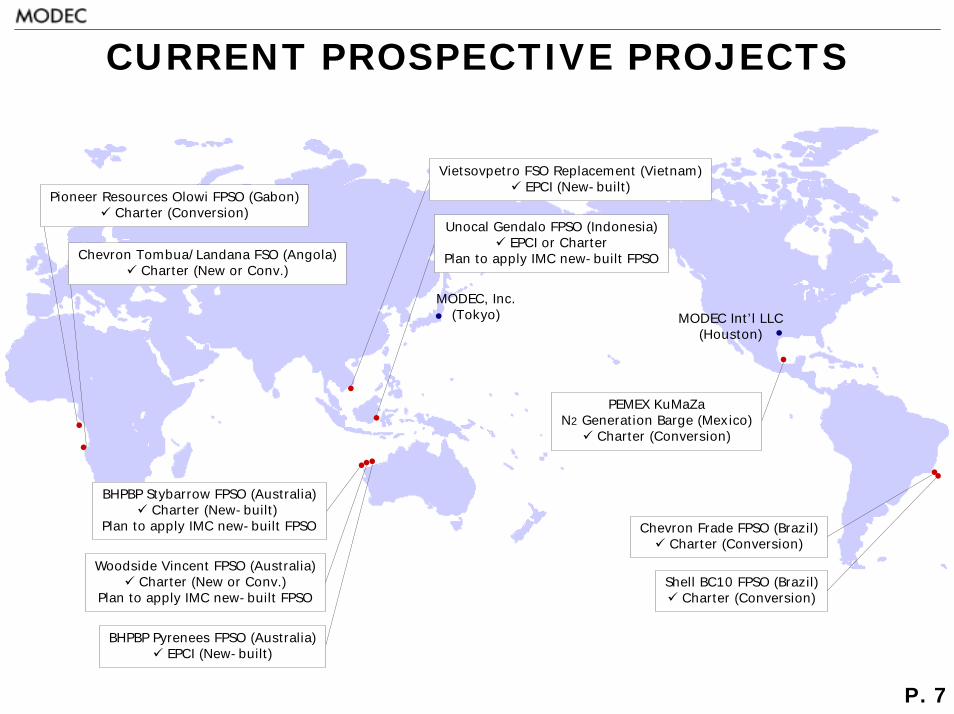
CURRENT PROSPECTIVE PROJECTS
MODEC, Inc.(Tokyo) MODEC Int’l LLC
(Houston)
PEMEX KuMaZaN2 Generation Barge (Mexico)
Charter (Conversion)
Pioneer Resources Olowi FPSO (Gabon)Charter (Conversion)
Unocal Gendalo FPSO (Indonesia)EPCI or Charter
Plan to apply IMC new-built FPSO
BHPBP Stybarrow FPSO (Australia)Charter (New-built)
Plan to apply IMC new-built FPSO Chevron Frade FPSO (Brazil)Charter (Conversion)
Chevron Tombua/Landana FSO (Angola)Charter (New or Conv.)
BHPBP Pyrenees FPSO (Australia)EPCI (New-built)
Woodside Vincent FPSO (Australia)Charter (New or Conv.)
Plan to apply IMC new-built FPSOShell BC10 FPSO (Brazil)
Charter (Conversion)
Vietsovpetro FSO Replacement (Vietnam)EPCI (New-built)
P. 8
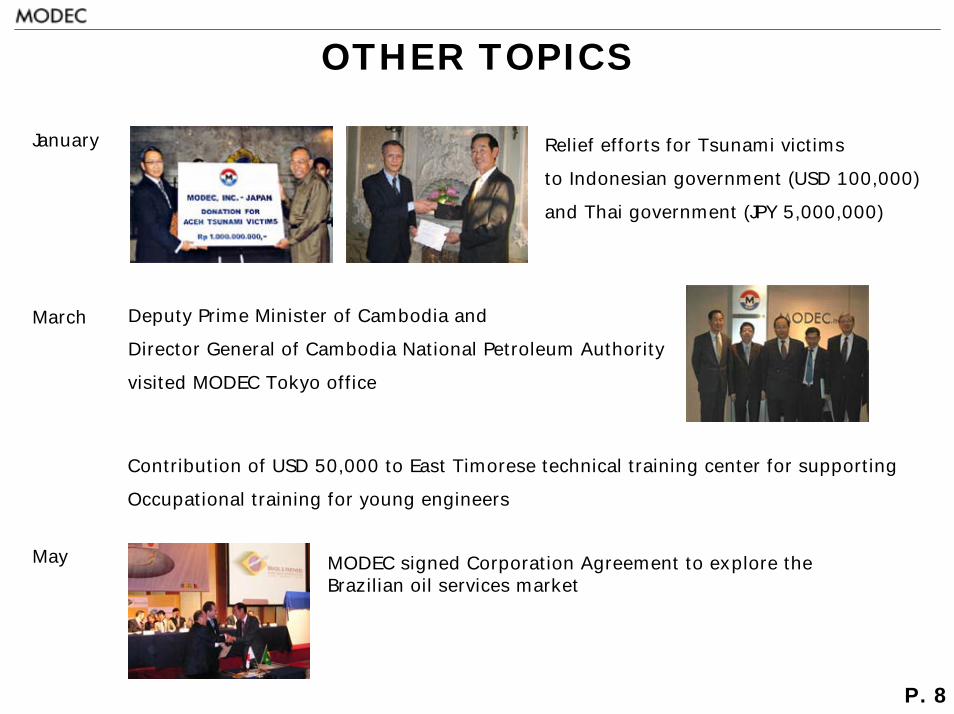
OTHER TOPICS
Relief efforts for Tsunami victims
to Indonesian government (USD 100,000)
and Thai government (JPY 5,000,000)
Contribution of USD 50,000 to East Timorese technical training center for supporting
Occupational training for young engineers
MODEC signed Corporation Agreement to explore the Brazilian oil services market
May
March
January
Deputy Prime Minister of Cambodia andDirector General of Cambodia National Petroleum Authority
visited MODEC Tokyo office
P. 9
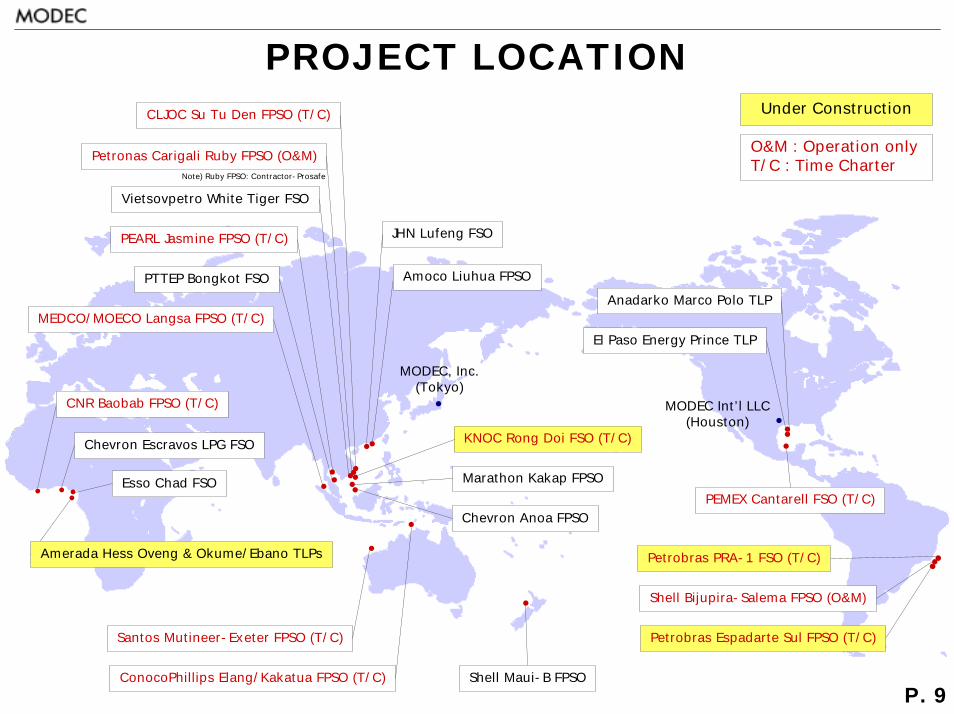
PROJECT LOCATION
PEMEX Cantarell FSO (T/C)
Chevron Escravos LPG FSO
Esso Chad FSO
Shell Bijupira-Salema FPSO (O&M)
Shell Maui-B FPSO
JHN Lufeng FSO
Vietsovpetro White Tiger FSO
PTTEP Bongkot FSO
CLJOC Su Tu Den FPSO (T/C)
Petronas Carigali Ruby FPSO (O&M)
MEDCO/MOECO Langsa FPSO (T/C)
Chevron Anoa FPSO
Marathon Kakap FPSO
El Paso Energy Prince TLP
Anadarko Marco Polo TLP
ConocoPhillips Elang/Kakatua FPSO (T/C)
MODEC, Inc.(Tokyo)
MODEC Int’l LLC(Houston)
CNR Baobab FPSO (T/C)
Santos Mutineer-Exeter FPSO (T/C)
Note) Ruby FPSO: Contractor-Prosafe
Amoco Liuhua FPSO
PEARL Jasmine FPSO (T/C)
Amerada Hess Oveng & Okume/Ebano TLPs
KNOC Rong Doi FSO (T/C)
Petrobras Espadarte Sul FPSO (T/C)
Petrobras PRA-1 FSO (T/C)
Under Construction
O&M : Operation onlyT/C : Time Charter
P. 10
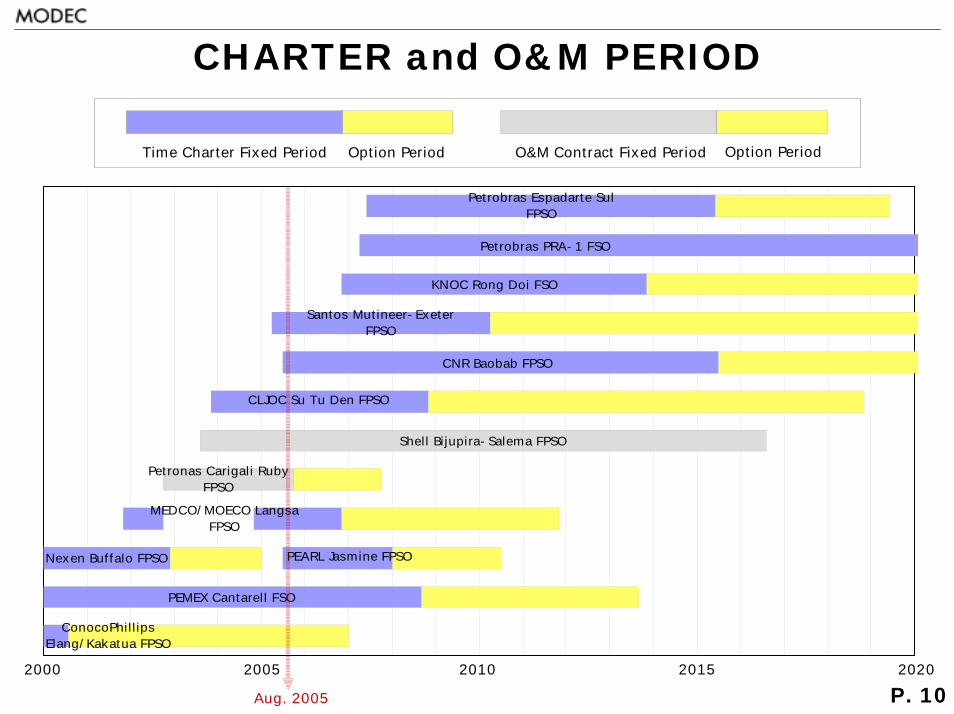
CHARTER and O&M PERIOD
Option PeriodTime Charter Fixed Period O&M Contract Fixed Period Option Period
KNOC Rong Doi FSO
Nexen Buffalo FPSO
PEMEX Cantarell FSO
ConocoPhillipsElang/Kakatua FPSO
Petrobras PRA-1 FSO
MEDCO/MOECO LangsaFPSO
Petronas Carigali RubyFPSO
CLJOC Su Tu Den FPSO
CNR Baobab FPSO
Santos Mutineer-ExeterFPSO
Petrobras Espadarte SulFPSO
Shell Bijupira-Salema FPSO
PEARL Jasmine FPSO
20152005 2010 2020
Aug. 2005
2000
P. 11
II. PROFIT & LOSS
- SALES- SALES by SERVICE TYPES & AREAS- ORDERS by SERVICE TYPES- ORDER BACKLOGS by SERVICE TYPES- ORDINARY INCOME- NET INCOME
P. 12
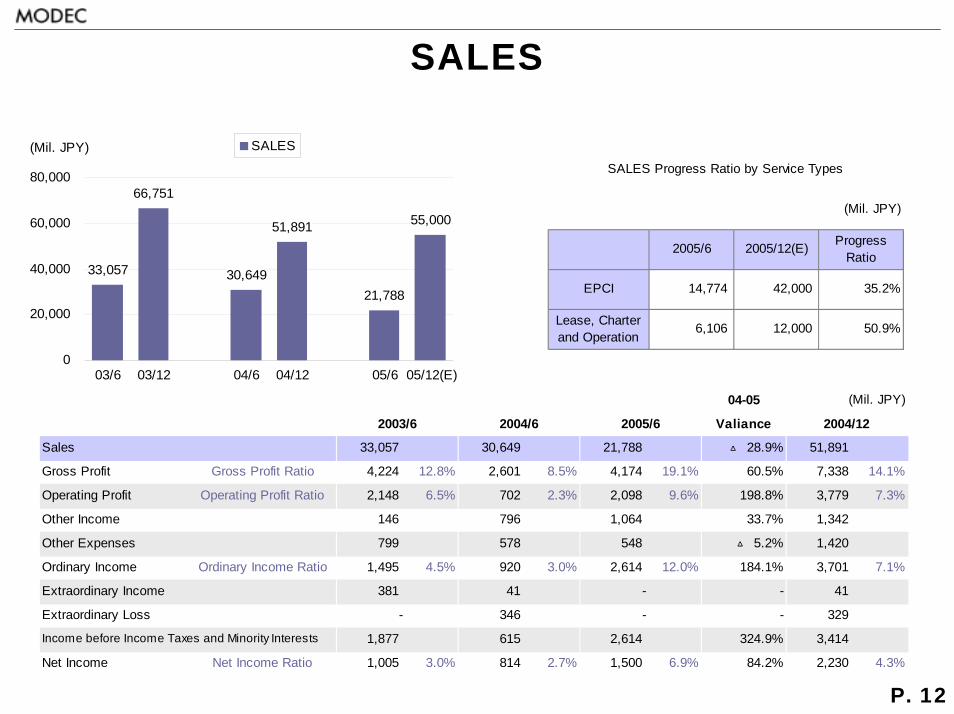
SALES
33,057
66,751
30,649
51,891
21,788
55,000
0
20,000
40,000
60,000
80,000
03/6 03/12 04/6 04/12 05/6 05/12(E)
(Mil. JPY) SALES
(Mil. JPY)
2005/6 2005/12(E) ProgressRatio
EPCI 14,774 42,000 35.2%
Lease, Charterand Operation
6,106 12,000 50.9%
SALES Progress Ratio by Service Types
04-05 (Mil. JPY)
Valiance
Sales 33,057 30,649 21,788 △ 28.9% 51,891
Gross Profit Gross Profit Ratio 4,224 12.8% 2,601 8.5% 4,174 19.1% 60.5% 7,338 14.1%
Operating Profit Operating Profit Ratio 2,148 6.5% 702 2.3% 2,098 9.6% 198.8% 3,779 7.3%
Other Income 146 796 1,064 33.7% 1,342
Other Expenses 799 578 548 △ 5.2% 1,420
Ordinary Income Ordinary Income Ratio 1,495 4.5% 920 3.0% 2,614 12.0% 184.1% 3,701 7.1%
Extraordinary Income 381 41 - - 41
Extraordinary Loss - 346 - - 329
1,877 615 2,614 324.9% 3,414
Net Income Net Income Ratio 1,005 3.0% 814 2.7% 1,500 6.9% 84.2% 2,230 4.3%
Income before Income Taxes and Minority Interests
2004/6 2004/122005/62003/6
P. 13
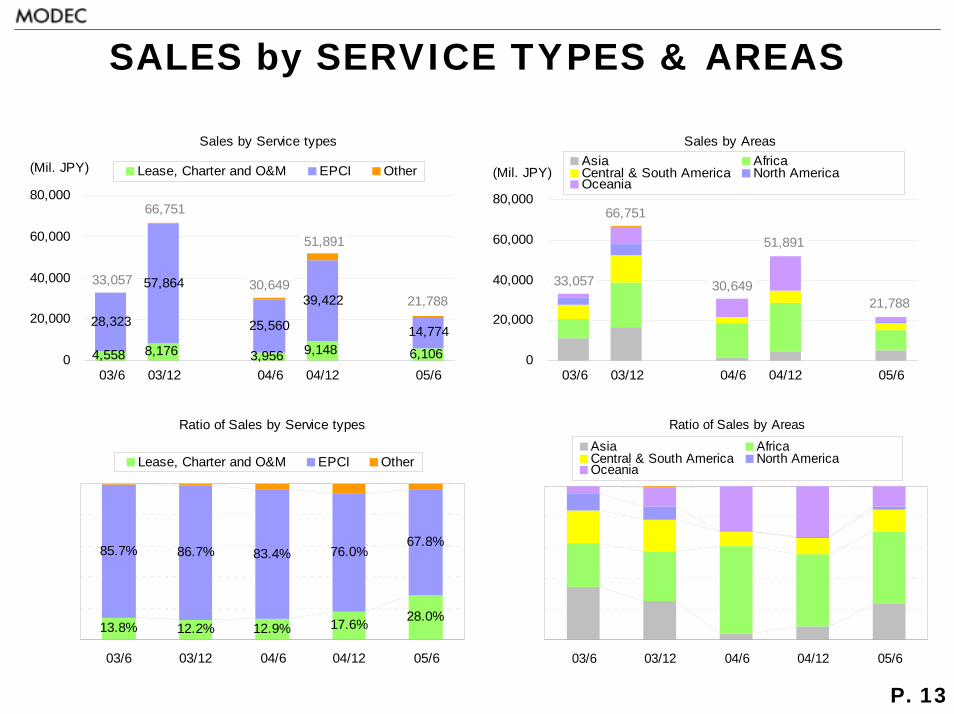
SALES by SERVICE TYPES & AREAS
Sales by Service types
4,558 8,176 3,956 9,148
28,323
57,864
25,560
39,422
14,774
6,1060
20,000
40,000
60,000
80,000
03/6 03/12 04/6 04/12 05/6
(Mil. JPY) Lease, Charter and O&M EPCI Other
51,891
66,751
33,057 30,64921,788
Sales by Areas
0
20,000
40,000
60,000
80,000
03/6 03/12 04/6 04/12 05/6
(Mil. JPY)Asia AfricaCentral & South America North AmericaOceania
51,891
66,751
33,057 30,64921,788
Ratio of Sales by Areas
03/6 03/12 04/6 04/12 05/6
Asia AfricaCentral & South America North AmericaOceania
Ratio of Sales by Service types
28.0%17.6%12.9%12.2%13.8%
67.8%76.0%83.4%86.7%85.7%
03/6 03/12 04/6 04/12 05/6
Lease, Charter and O&M EPCI Other
P. 14
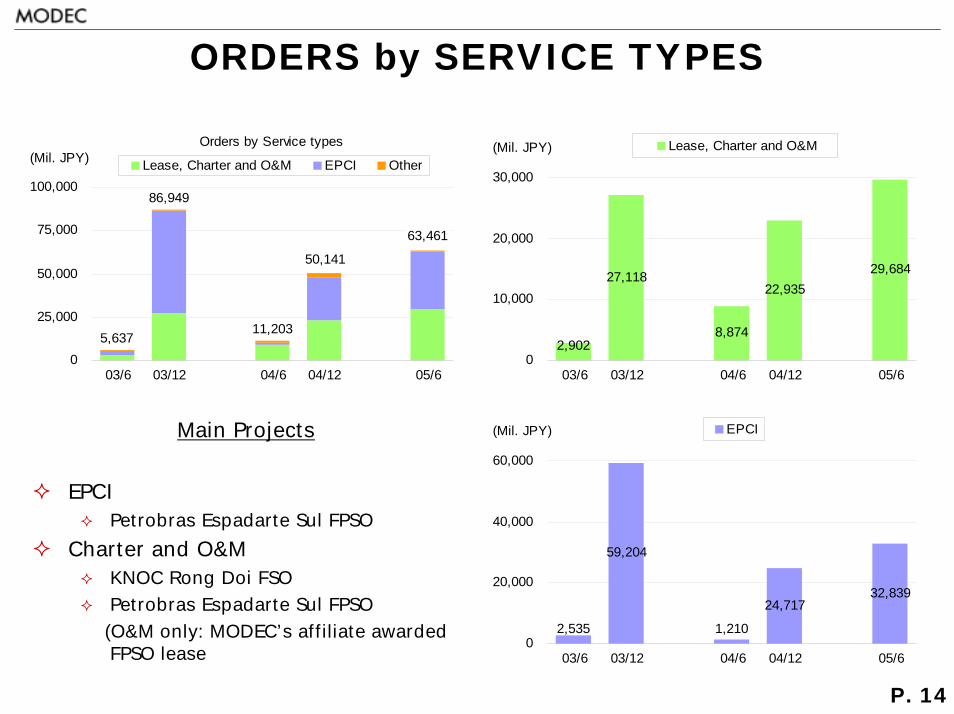
ORDERS by SERVICE TYPES
Orders by Service types
5,637
86,949
11,203
50,141
63,461
0
25,000
50,000
75,000
100,000
03/6 03/12 04/6 04/12 05/6
(Mil. JPY) Lease, Charter and O&M EPCI Other
2,902
27,118
8,874
22,93529,684
0
10,000
20,000
30,000
03/6 03/12 04/6 04/12 05/6
(Mil. JPY) Lease, Charter and O&M
Main Projects
EPCIPetrobras Espadarte Sul FPSO
Charter and O&MKNOC Rong Doi FSOPetrobras Espadarte Sul FPSO
(O&M only: MODEC’s affiliate awarded FPSO lease
2,535
59,204
1,210
24,71732,839
0
20,000
40,000
60,000
03/6 03/12 04/6 04/12 05/6
(Mil. JPY) EPCI
P. 15
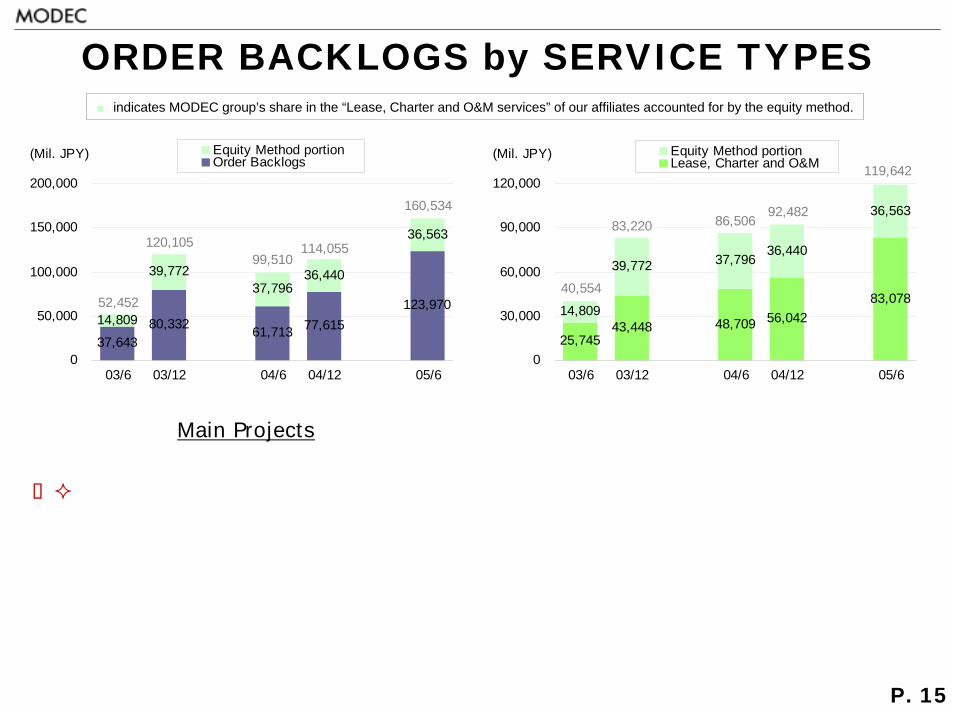
ORDER BACKLOGS by SERVICE TYPES■ indicates MODEC group’s share in the “Lease, Charter and O&M services” of our affiliates accounted for by the equity method.
37,64380,332 61,713 77,615
123,970
39,772 36,440
36,563
14,809
37,796
0
50,000
100,000
150,000
200,000
03/6 03/12 04/6 04/12 05/6
(Mil. JPY) Equity Method portionOrder Backlogs
114,055120,105
52,452
99,510
160,534
25,74543,448 48,709 56,042
83,078
39,77236,440
36,563
14,809
37,796
0
30,000
60,000
90,000
120,000
03/6 03/12 04/6 04/12 05/6
(Mil. JPY) Equity Method portionLease, Charter and O&M
40,554
83,220 86,50692,482
119,642
Main Projects
EPCIAmerada Hess Oveng TLP & Okume/Ebano TLP project
Charter and O&MSantos Mutineer-Exeter FPSOCNR Baobab FPSOShell Bijupira-Salema FPSO
36,765
12,89121,481
11,676
40,807
0
10,000
20,000
30,000
40,000
03/6 03/12 04/6 04/12 05/6
(Mil. JPY) EPCI
P. 16
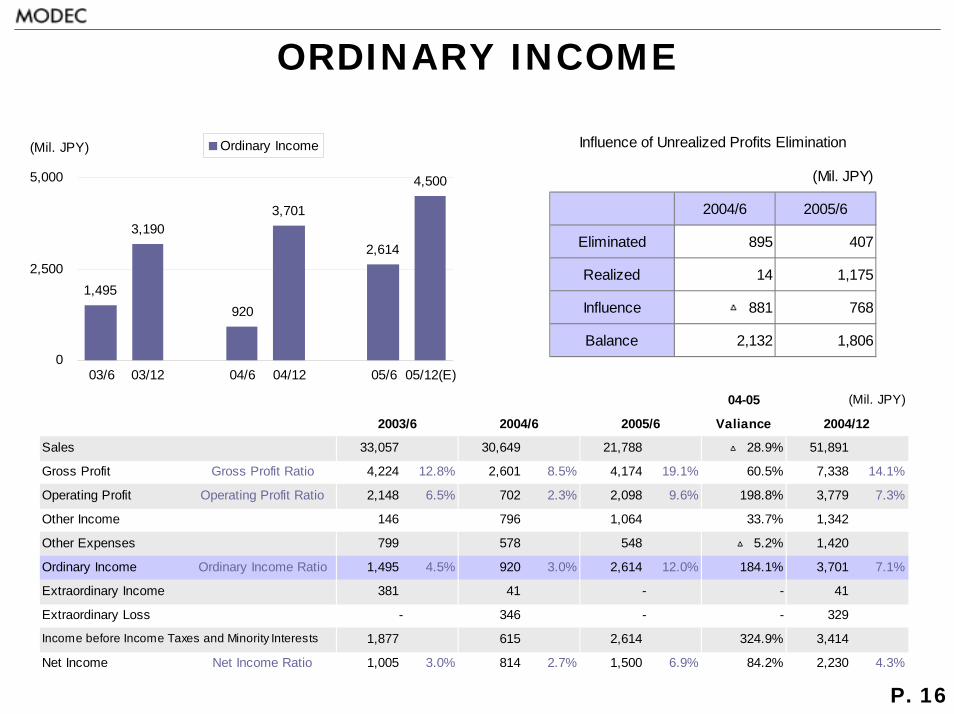
ORDINARY INCOME
1,495
3,190
920
3,701
2,614
4,500
0
2,500
5,000
03/6 03/12 04/6 04/12 05/6 05/12(E)
(Mil. JPY) Ordinary Income
(Mil. JPY)
2004/6 2005/6
Eliminated 895 407
Realized 14 1,175
Influence △ 881 768
Balance 2,132 1,806
Influence of Unrealized Profits Elimination
04-05 (Mil. JPY)
Valiance
Sales 33,057 30,649 21,788 △ 28.9% 51,891
Gross Profit Gross Profit Ratio 4,224 12.8% 2,601 8.5% 4,174 19.1% 60.5% 7,338 14.1%
Operating Profit Operating Profit Ratio 2,148 6.5% 702 2.3% 2,098 9.6% 198.8% 3,779 7.3%
Other Income 146 796 1,064 33.7% 1,342
Other Expenses 799 578 548 △ 5.2% 1,420
Ordinary Income Ordinary Income Ratio 1,495 4.5% 920 3.0% 2,614 12.0% 184.1% 3,701 7.1%
Extraordinary Income 381 41 - - 41
Extraordinary Loss - 346 - - 329
1,877 615 2,614 324.9% 3,414
Net Income Net Income Ratio 1,005 3.0% 814 2.7% 1,500 6.9% 84.2% 2,230 4.3%
Income before Income Taxes and Minority Interests
2004/6 2004/122005/62003/6
P. 17
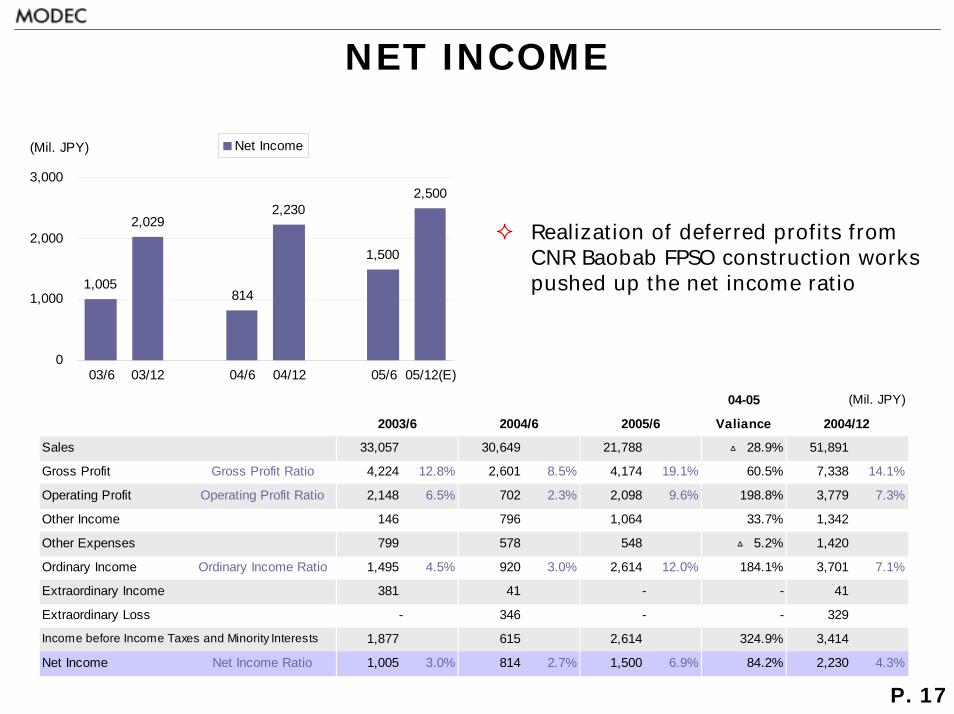
NET INCOME
1,005
2,029
814
2,230
1,500
2,500
0
1,000
2,000
3,000
03/6 03/12 04/6 04/12 05/6 05/12(E)
(Mil. JPY) Net Income
Realization of deferred profits from CNR Baobab FPSO construction works pushed up the net income ratio
04-05 (Mil. JPY)
Valiance
Sales 33,057 30,649 21,788 △ 28.9% 51,891
Gross Profit Gross Profit Ratio 4,224 12.8% 2,601 8.5% 4,174 19.1% 60.5% 7,338 14.1%
Operating Profit Operating Profit Ratio 2,148 6.5% 702 2.3% 2,098 9.6% 198.8% 3,779 7.3%
Other Income 146 796 1,064 33.7% 1,342
Other Expenses 799 578 548 △ 5.2% 1,420
Ordinary Income Ordinary Income Ratio 1,495 4.5% 920 3.0% 2,614 12.0% 184.1% 3,701 7.1%
Extraordinary Income 381 41 - - 41
Extraordinary Loss - 346 - - 329
1,877 615 2,614 324.9% 3,414
Net Income Net Income Ratio 1,005 3.0% 814 2.7% 1,500 6.9% 84.2% 2,230 4.3%
Income before Income Taxes and Minority Interests
2004/6 2004/122005/62003/6

P. 18
III. BALANCE SHEET& CASH FLOW
- ASSETS- LIABILITIES & SHAREHOLDERS’ EQUITY- CASH FLOW
P. 19
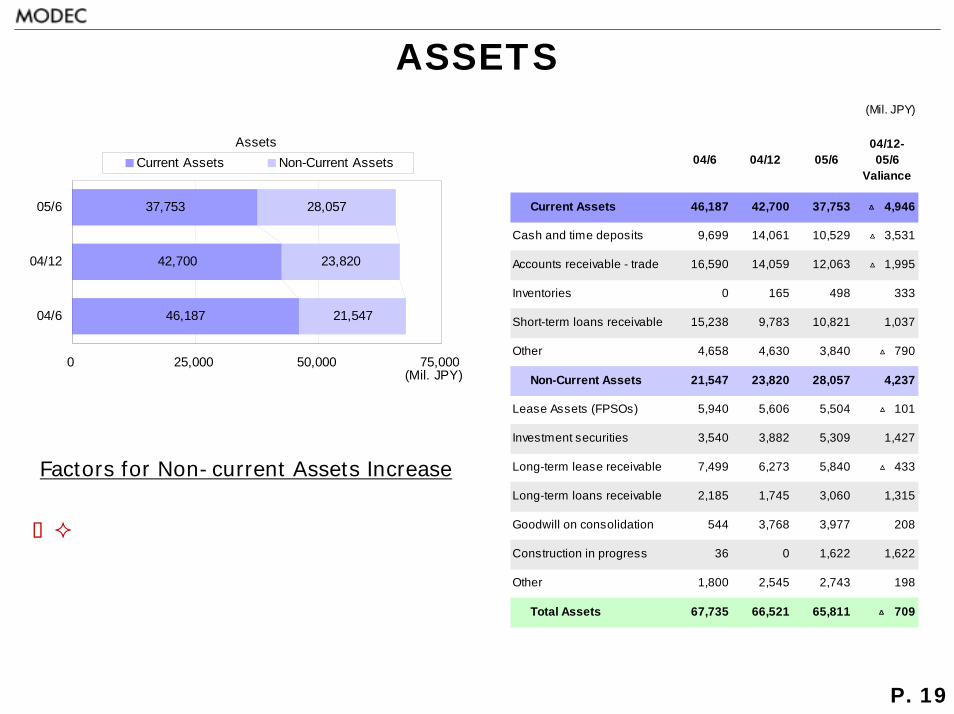
ASSETS(Mil. JPY)
04/6 04/12 05/604/12-05/6
Valiance
Current Assets 46,187 42,700 37,753 △ 4,946
Cash and time deposits 9,699 14,061 10,529 △ 3,531
Accounts receivable - trade 16,590 14,059 12,063 △ 1,995
Inventories 0 165 498 333
Short-term loans receivable 15,238 9,783 10,821 1,037
Other 4,658 4,630 3,840 △ 790
Non-Current Assets 21,547 23,820 28,057 4,237
Lease Assets (FPSOs) 5,940 5,606 5,504 △ 101
Investment securities 3,540 3,882 5,309 1,427
Long-term lease receivable 7,499 6,273 5,840 △ 433
Long-term loans receivable 2,185 1,745 3,060 1,315
Goodwill on consolidation 544 3,768 3,977 208
Construction in progress 36 0 1,622 1,622
Other 1,800 2,545 2,743 198
Total Assets 67,735 66,521 65,811 △ 709
Assets
46,187
42,700
37,753
21,547
23,820
28,057
0 25,000 50,000 75,000
04/6
04/12
05/6
(Mil. JPY)
Current Assets Non-Current Assets
Factors for Non-current Assets Increase
Investments in affiliates (SPC) and Long-term loans receivableConstruction in progress of KNOC Rong Doi FSO project
P. 20
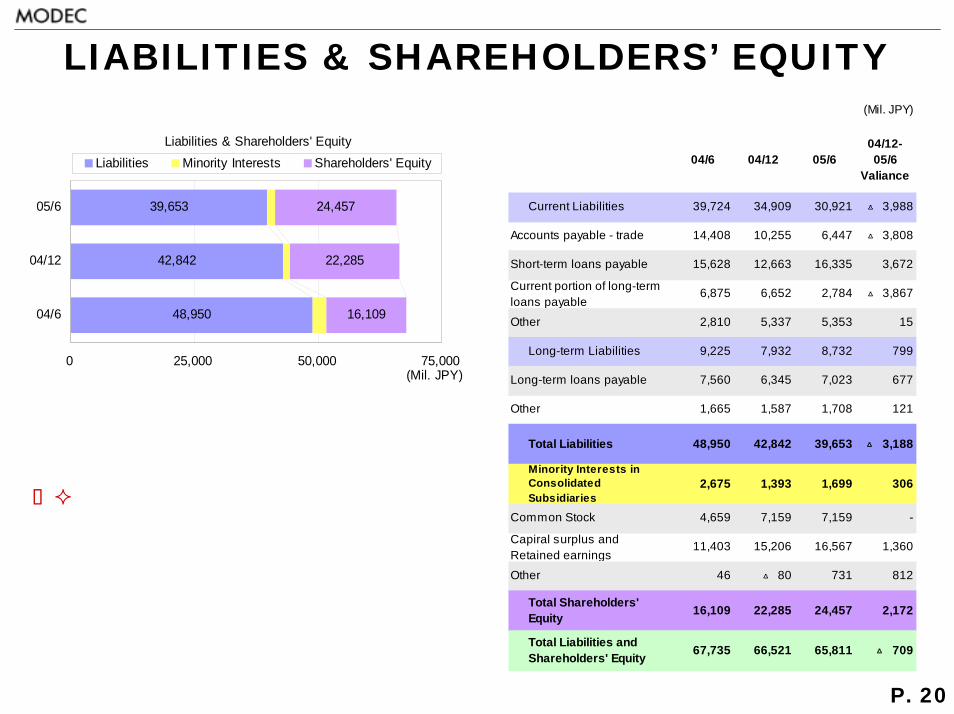
LIABILITIES & SHAREHOLDERS’ EQUITY(Mil. JPY)
04/6 04/12 05/604/12-05/6
Valiance
Current Liabilities 39,724 34,909 30,921 △ 3,988
Accounts payable - trade 14,408 10,255 6,447 △ 3,808
Short-term loans payable 15,628 12,663 16,335 3,672
Current portion of long-termloans payable
6,875 6,652 2,784 △ 3,867
Other 2,810 5,337 5,353 15
Long-term Liabilities 9,225 7,932 8,732 799
Long-term loans payable 7,560 6,345 7,023 677
Other 1,665 1,587 1,708 121
Total Liabilities 48,950 42,842 39,653 △ 3,188
Minority Interests inConsolidatedSubsidiaries
2,675 1,393 1,699 306
Common Stock 4,659 7,159 7,159 -
Capiral surplus andRetained earnings
11,403 15,206 16,567 1,360
Other 46 △ 80 731 812
Total Shareholders'Equity 16,109 22,285 24,457 2,172
Total Liabilities andShareholders' Equity 67,735 66,521 65,811 △ 709
Liabilities & Shareholders' Equity
48,950
42,842
39,653
16,109
22,285
24,457
0 25,000 50,000 75,000
04/6
04/12
05/6
(Mil. JPY)
Liabilities Minority Interests Shareholders' Equity
Liabilities decreased due to payment of accounts payable - trade
P. 21
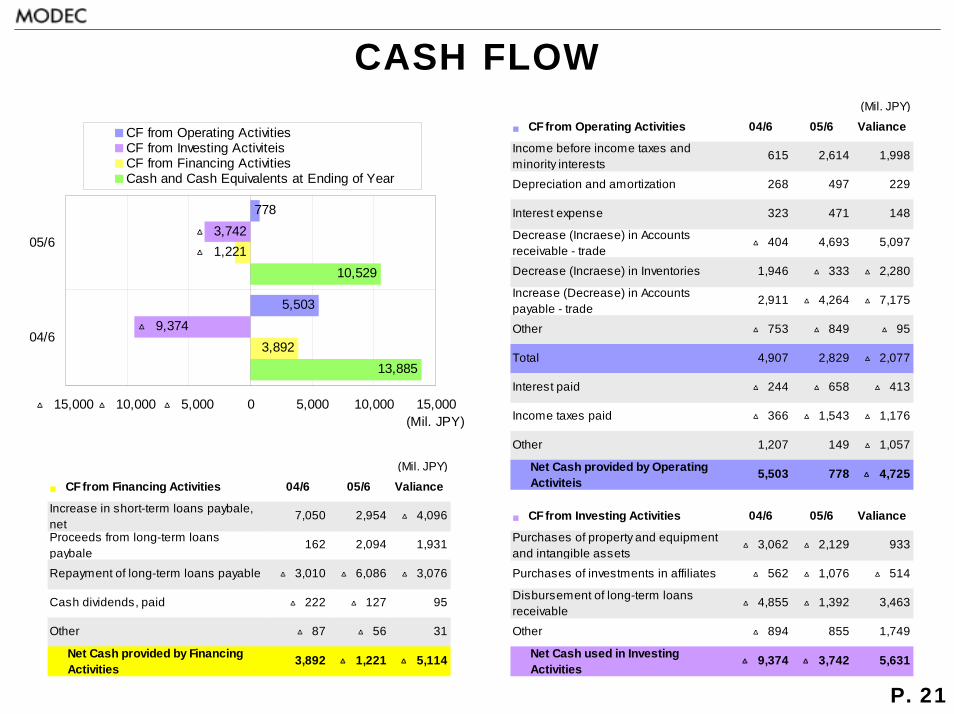
CASH FLOW(Mil. JPY)
■ CF from Operating Activities 04/6 05/6 Valiance
Income before income taxes andminority interests
615 2,614 1,998
Depreciation and amortization 268 497 229
Interest expense 323 471 148
Decrease (Incraese) in Accountsreceivable - trade △ 404 4,693 5,097
Decrease (Incraese) in Inventories 1,946 △ 333 △ 2,280
Increase (Decrease) in Accountspayable - trade
2,911 △ 4,264 △ 7,175
Other △ 753 △ 849 △ 95
Total 4,907 2,829 △ 2,077
Interest paid △ 244 △ 658 △ 413
Income taxes paid △ 366 △ 1,543 △ 1,176
Other 1,207 149 △ 1,057
Net Cash provided by OperatingActiviteis
5,503 778 △ 4,725
■ CF from Investing Activities 04/6 05/6 Valiance
Purchases of property and equipmentand intangible assets △ 3,062 △ 2,129 933
Purchases of investments in affiliates △ 562 △ 1,076 △ 514
Disbursement of long-term loansreceivable △ 4,855 △ 1,392 3,463
Other △ 894 855 1,749
Net Cash used in InvestingActivities △ 9,374 △ 3,742 5,631
13,885
10,529
3,892
△ 1,221
△ 9,374
△ 3,742
5,503
778
△ 15,000 △ 10,000 △ 5,000 0 5,000 10,000 15,000
04/6
05/6
(Mil. JPY)
CF from Operating ActivitiesCF from Investing ActiviteisCF from Financing ActivitiesCash and Cash Equivalents at Ending of Year
(Mil. JPY)
■ CF from Financing Activities 04/6 05/6 Valiance
Increase in short-term loans paybale,net
7,050 2,954 △ 4,096
Proceeds from long-term loanspaybale
162 2,094 1,931
Repayment of long-term loans payable △ 3,010 △ 6,086 △ 3,076
Cash dividends, paid △ 222 △ 127 95
Other △ 87 △ 56 31
Net Cash provided by FinancingActivities
3,892 △ 1,221 △ 5,114
P. 22
IV. FINANCIAL INDICATOR
- FINANCIAL INDICATOR
P. 23
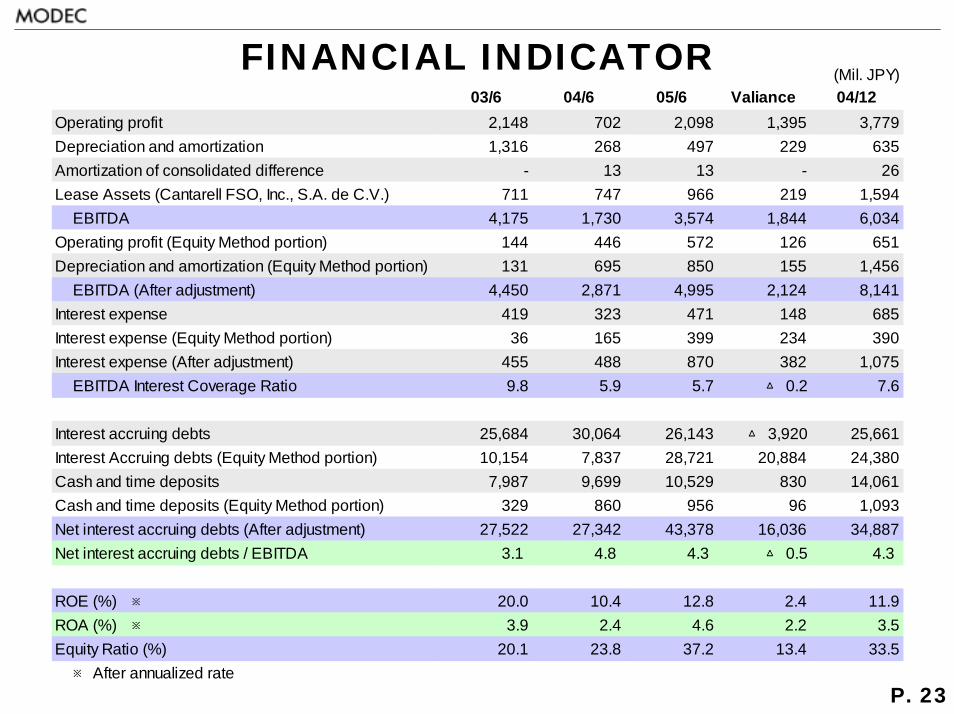
(Mil. JPY)03/6 04/6 05/6 Valiance 04/12
Operating profit 2,148 702 2,098 1,395 3,779Depreciation and amortization 1,316 268 497 229 635Amortization of consolidated difference - 13 13 - 26Lease Assets (Cantarell FSO, Inc., S.A. de C.V.) 711 747 966 219 1,594
EBITDA 4,175 1,730 3,574 1,844 6,034Operating profit (Equity Method portion) 144 446 572 126 651Depreciation and amortization (Equity Method portion) 131 695 850 155 1,456
EBITDA (After adjustment) 4,450 2,871 4,995 2,124 8,141Interest expense 419 323 471 148 685Interest expense (Equity Method portion) 36 165 399 234 390Interest expense (After adjustment) 455 488 870 382 1,075
EBITDA Interest Coverage Ratio 9.8 5.9 5.7 △ 0.2 7.6
Interest accruing debts 25,684 30,064 26,143 △ 3,920 25,661Interest Accruing debts (Equity Method portion) 10,154 7,837 28,721 20,884 24,380Cash and time deposits 7,987 9,699 10,529 830 14,061Cash and time deposits (Equity Method portion) 329 860 956 96 1,093Net interest accruing debts (After adjustment) 27,522 27,342 43,378 16,036 34,887Net interest accruing debts / EBITDA 3.1 4.8 4.3 △ 0.5 4.3
ROE (%) ※ 20.0 10.4 12.8 2.4 11.9ROA (%) ※ 3.9 2.4 4.6 2.2 3.5Equity Ratio (%) 20.1 23.8 37.2 13.4 33.5※ After annualized rate
FINANCIAL INDICATOR