Embed Size (px)
Citation preview
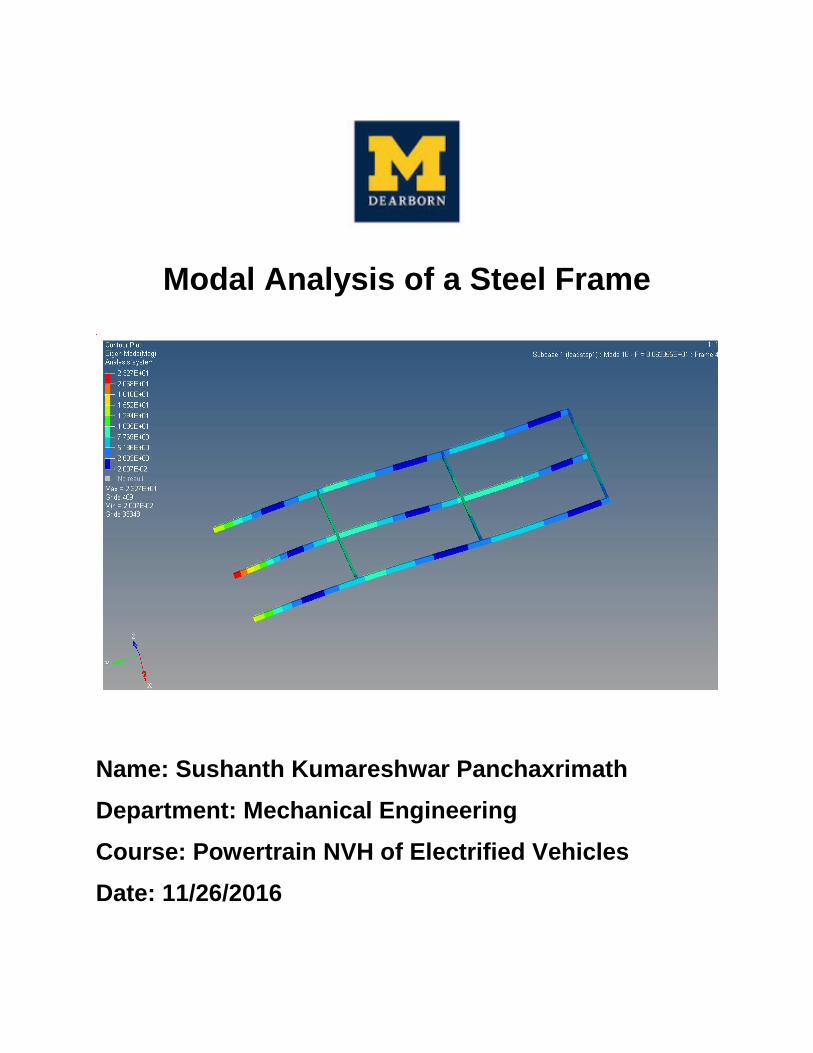
Modal Analysis of a Steel Frame
Name: Sushanth Kumareshwar Panchaxrimath
Department: Mechanical Engineering
Course: Powertrain NVH of Electrified Vehicles
Date: 11/26/2016
SUMMARY
A dynamic modal analysis of a steel frame is conducted
using two CAE tools from Altair HyperWorks, namely
Optistruct and solidThinking Inspire.
The geometry of the steel frame from the given engineering
drawing is constructed using the CAD sketcher tool that
comes pre-built with the Inspire software or using
HyperMesh.
Modal analysis of the steel frame using free-free condition is
performed in both, Optistruct and solidThinking Inspire.
Results obtained using Optistruct and Inspire are compared
with the given experimental modal analysis results.
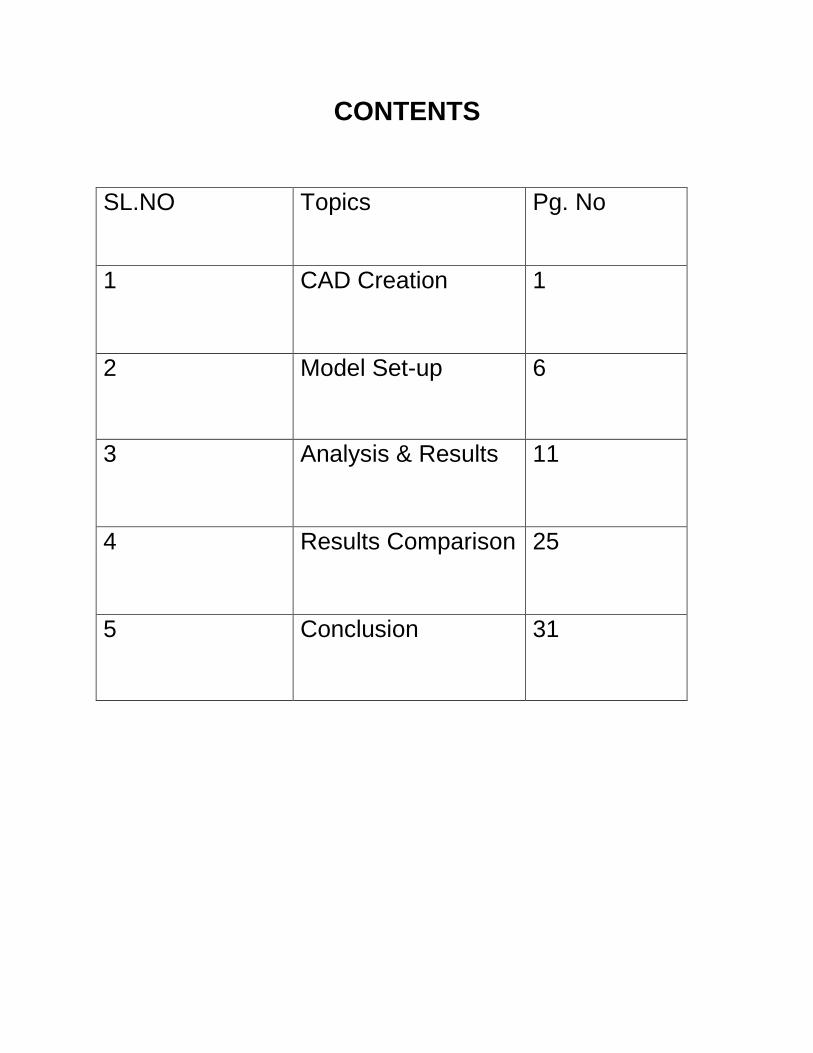
CONTENTS
SL.NO Topics Pg. No
1 CAD Creation 1
2 Model Set-up 6
3 Analysis & Results 11
4 Results Comparison 25
5 Conclusion 31
1 | P a g e
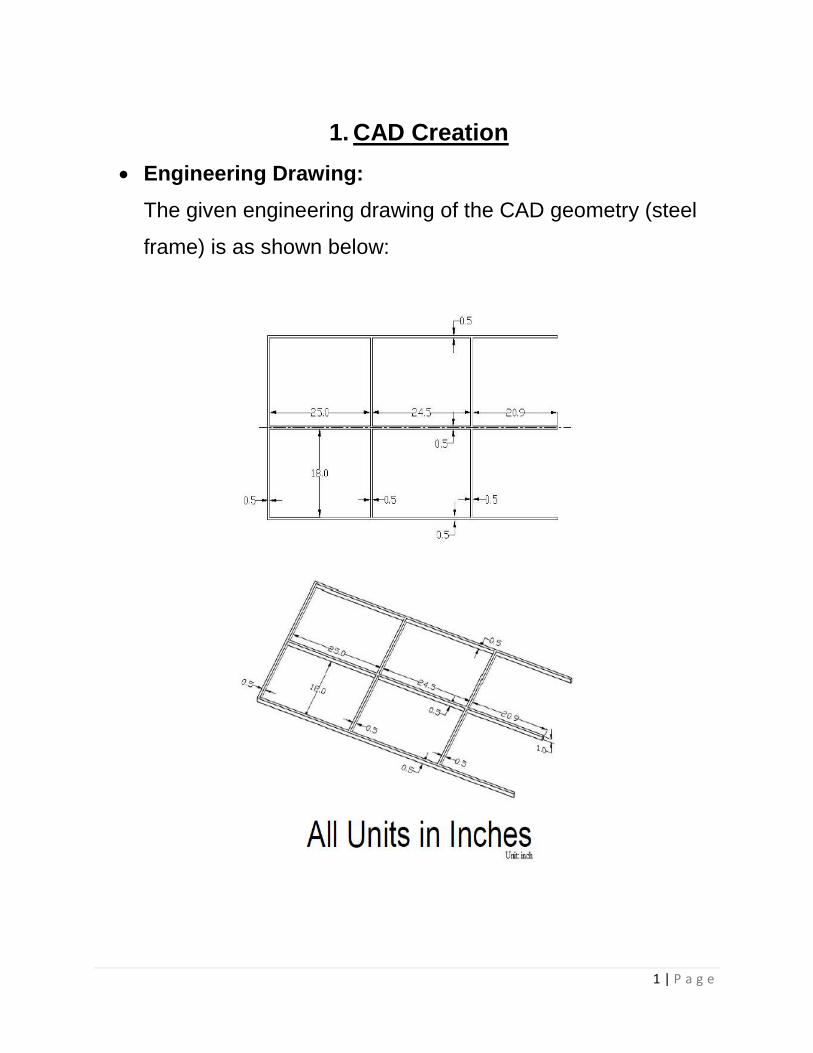
1. CAD Creation
Engineering Drawing:
The given engineering drawing of the CAD geometry (steel
frame) is as shown below:
2 | P a g e
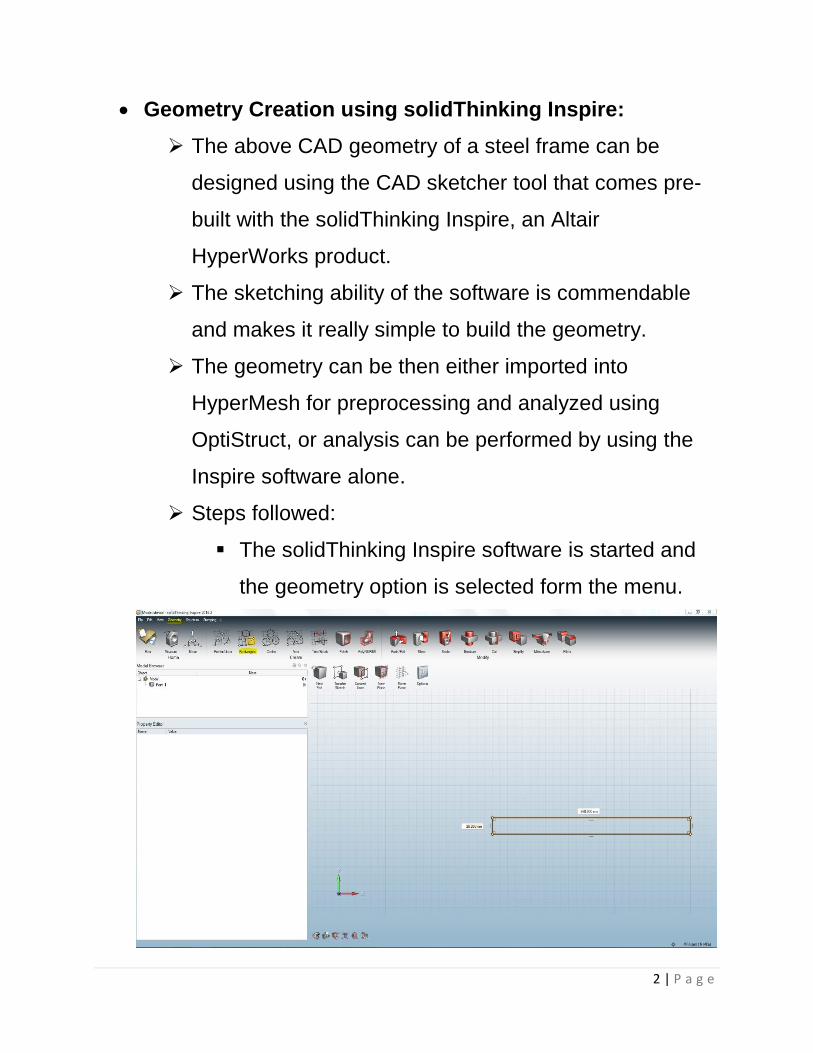
Geometry Creation using solidThinking Inspire:
The above CAD geometry of a steel frame can be
designed using the CAD sketcher tool that comes pre-
built with the solidThinking Inspire, an Altair
HyperWorks product.
The sketching ability of the software is commendable
and makes it really simple to build the geometry.
The geometry can be then either imported into
HyperMesh for preprocessing and analyzed using
OptiStruct, or analysis can be performed by using the
Inspire software alone.
Steps followed:
The solidThinking Inspire software is started and
the geometry option is selected form the menu.
3 | P a g e
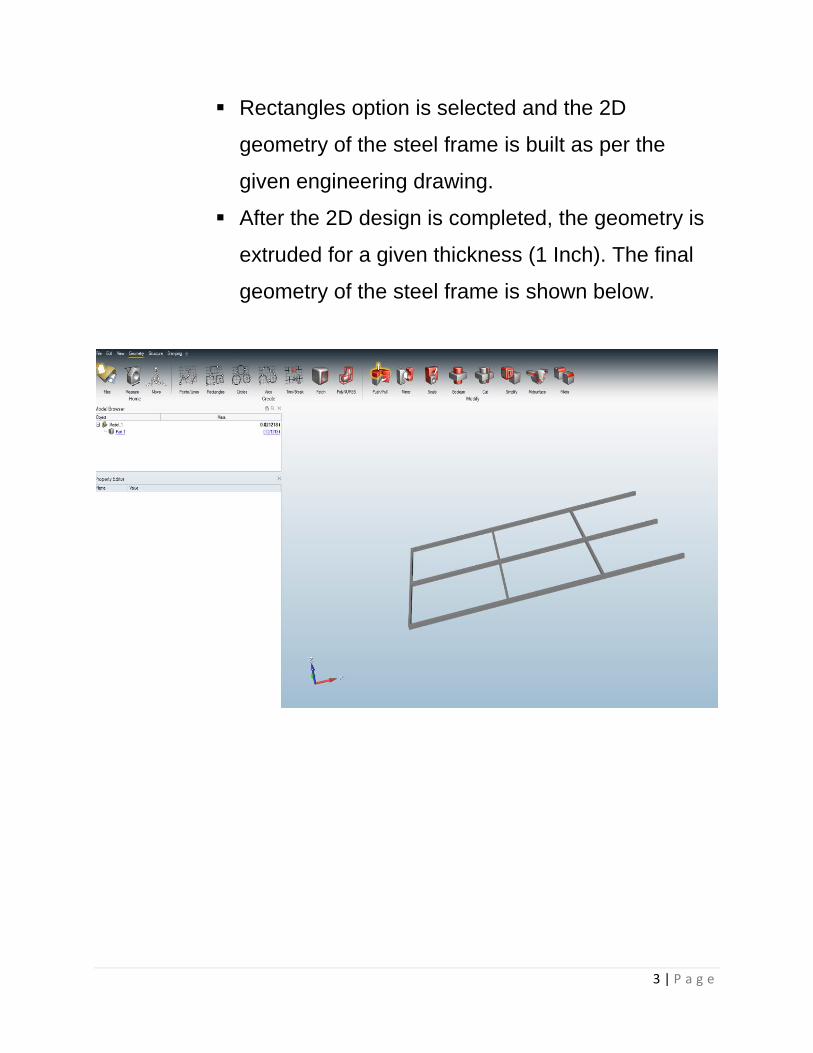
Rectangles option is selected and the 2D
geometry of the steel frame is built as per the
given engineering drawing.
After the 2D design is completed, the geometry is
extruded for a given thickness (1 Inch). The final
geometry of the steel frame is shown below.
4 | P a g e
CAD Creation in HyperMesh
The CAD geometry can either be built from scratch or
imported into HyperMesh software in many ways.
One of the methods is explained below:
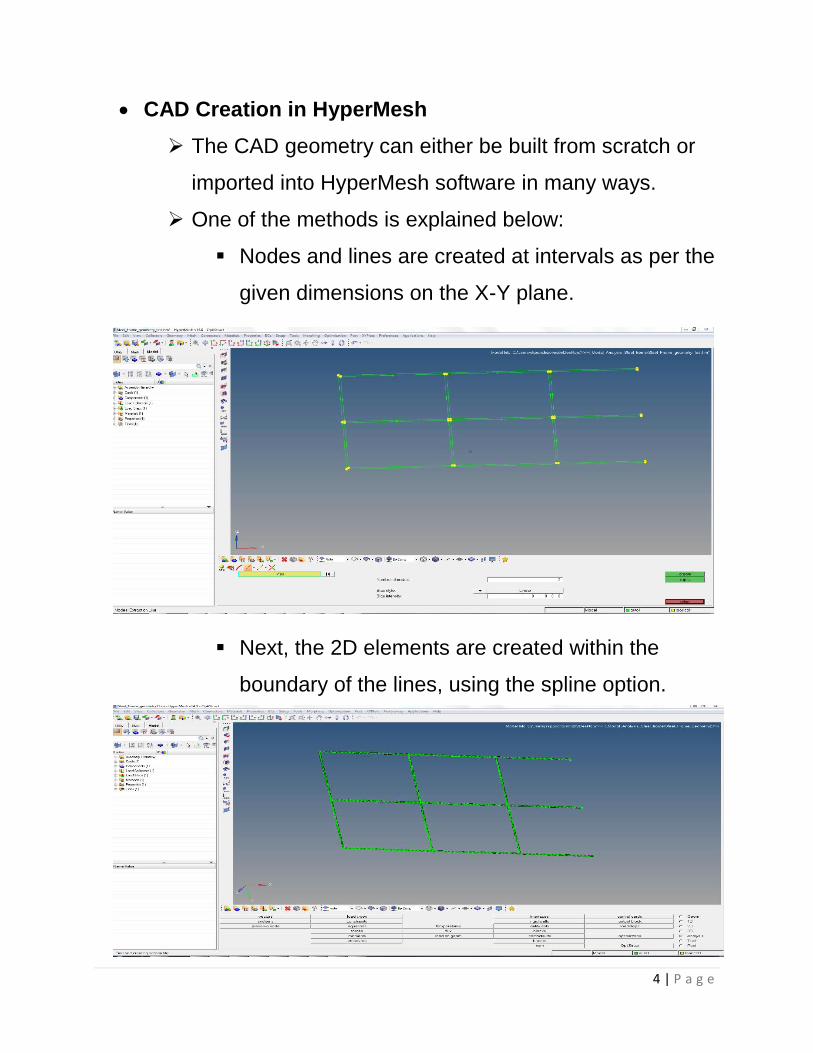
Nodes and lines are created at intervals as per the
given dimensions on the X-Y plane.
Next, the 2D elements are created within the
boundary of the lines, using the spline option.
5 | P a g e
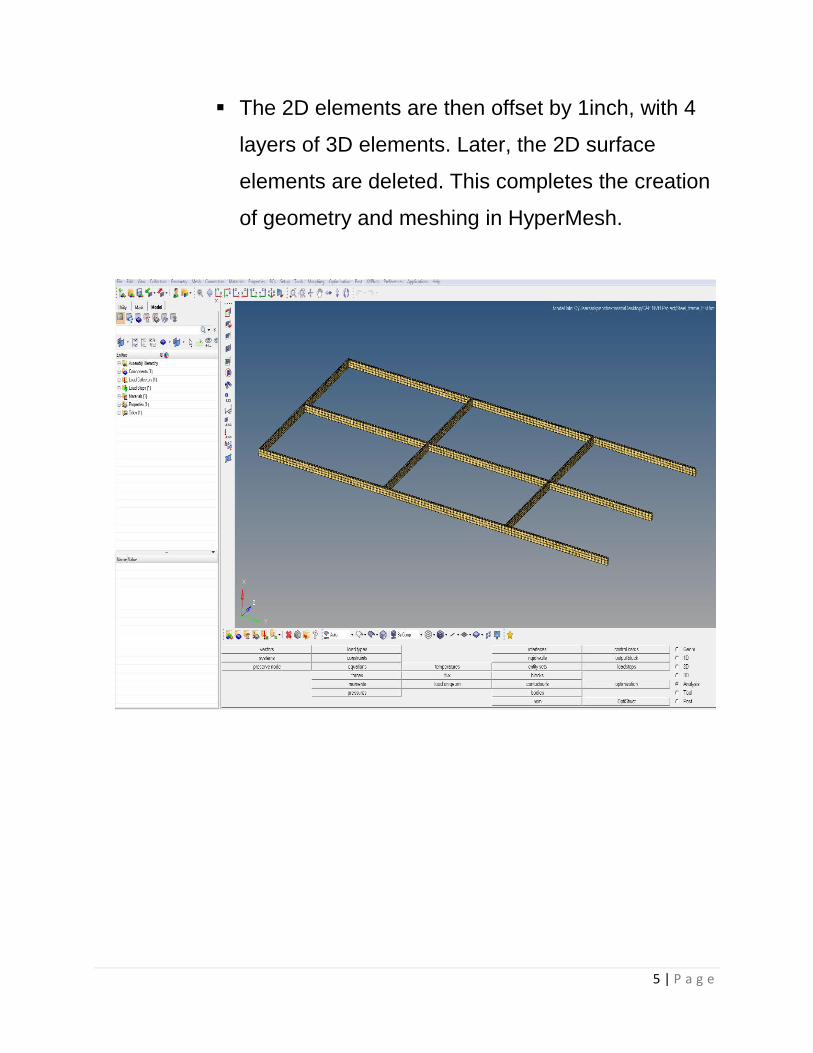
The 2D elements are then offset by 1inch, with 4
layers of 3D elements. Later, the 2D surface
elements are deleted. This completes the creation
of geometry and meshing in HyperMesh.
6 | P a g e
2. Model Set-up
Model Set-up in HyperMesh:
Once the geometry and meshing is done, the material
properties need to be assigned to the model.
Please note, if the geometry is in different units say,
inches and has to be converted to millimeters, the
entire model must be scaled by a factor of 25.4, before
meshing.
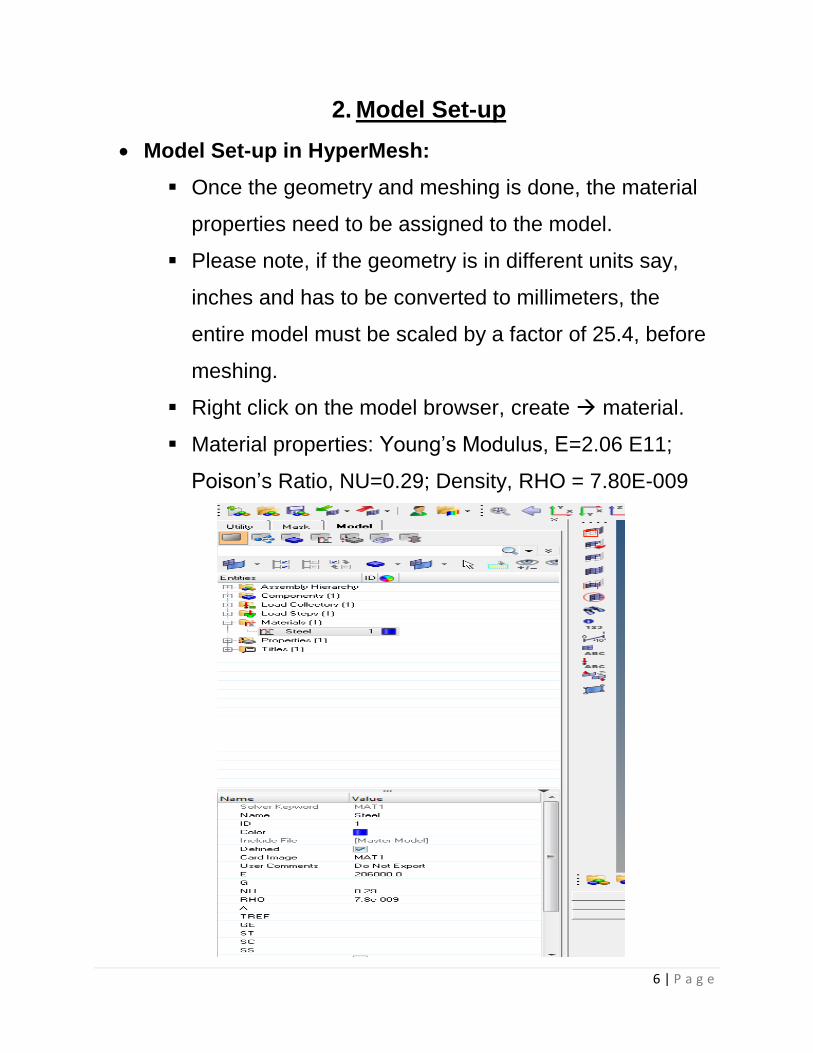
Right click on the model browser, create material.
Material properties: Young’s Modulus, E=2.06 E11;
Poison’s Ratio, NU=0.29; Density, RHO = 7.80E-009
7 | P a g e
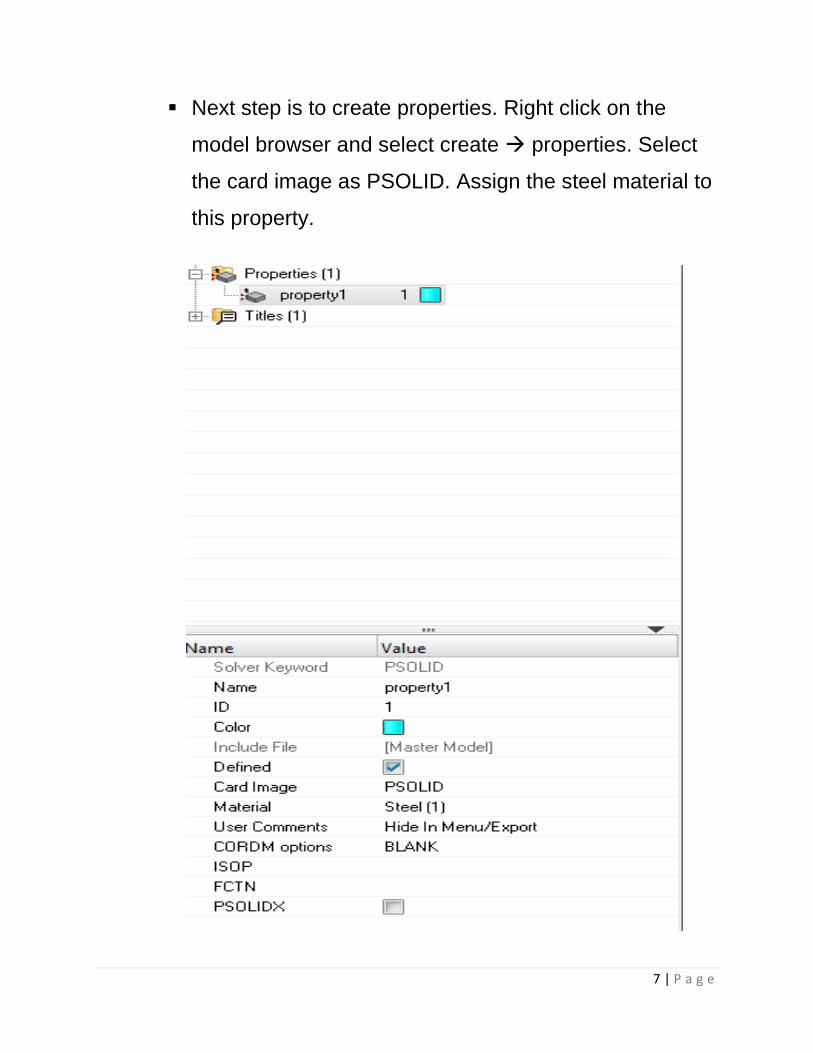
Next step is to create properties. Right click on the
model browser and select create properties. Select
the card image as PSOLID. Assign the steel material to
this property.
8 | P a g e
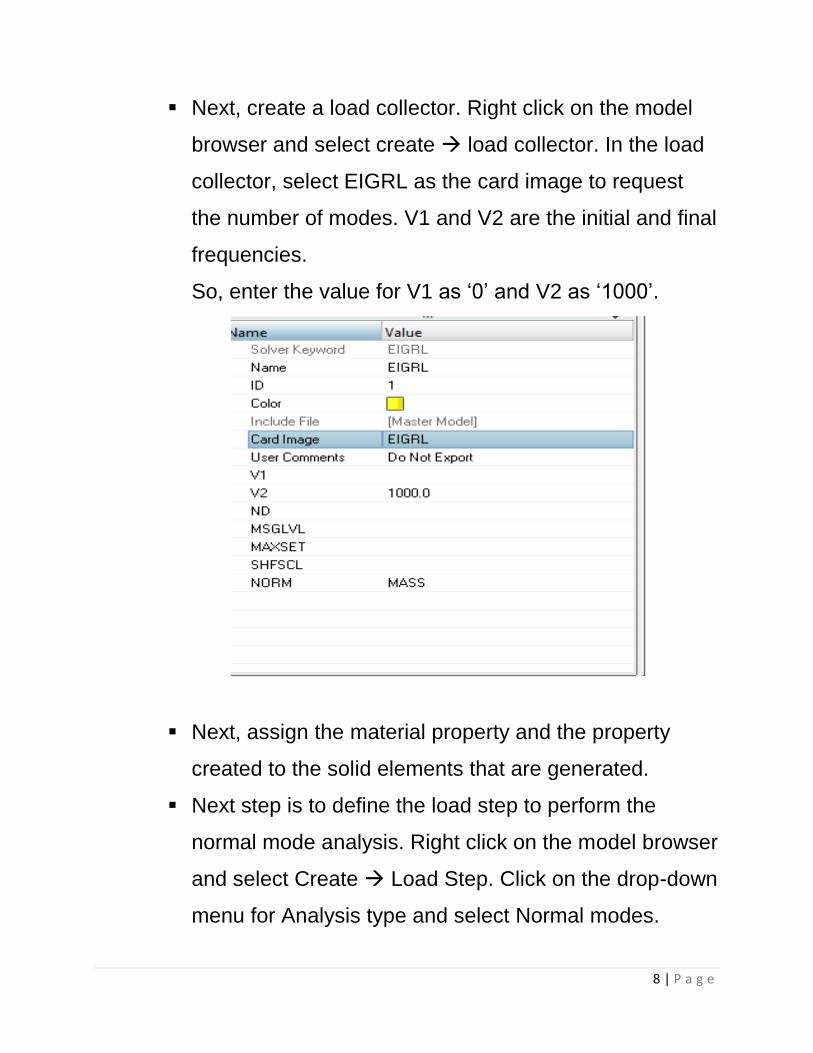
Next, create a load collector. Right click on the model
browser and select create load collector. In the load
collector, select EIGRL as the card image to request
the number of modes. V1 and V2 are the initial and final
frequencies.
So, enter the value for V1 as ‘0’ and V2 as ‘1000’.
Next, assign the material property and the property
created to the solid elements that are generated.
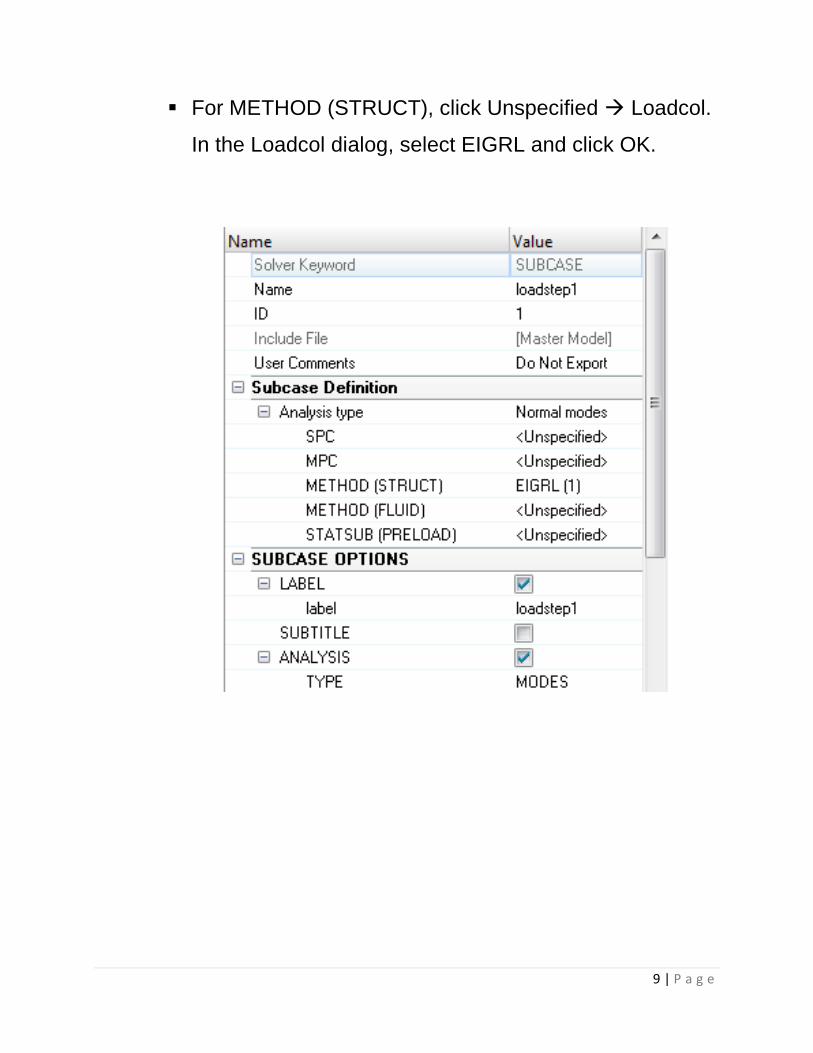
Next step is to define the load step to perform the
normal mode analysis. Right click on the model browser
and select Create Load Step. Click on the drop-down
menu for Analysis type and select Normal modes.
9 | P a g e
For METHOD (STRUCT), click Unspecified Loadcol.
In the Loadcol dialog, select EIGRL and click OK.
10 | P a g e
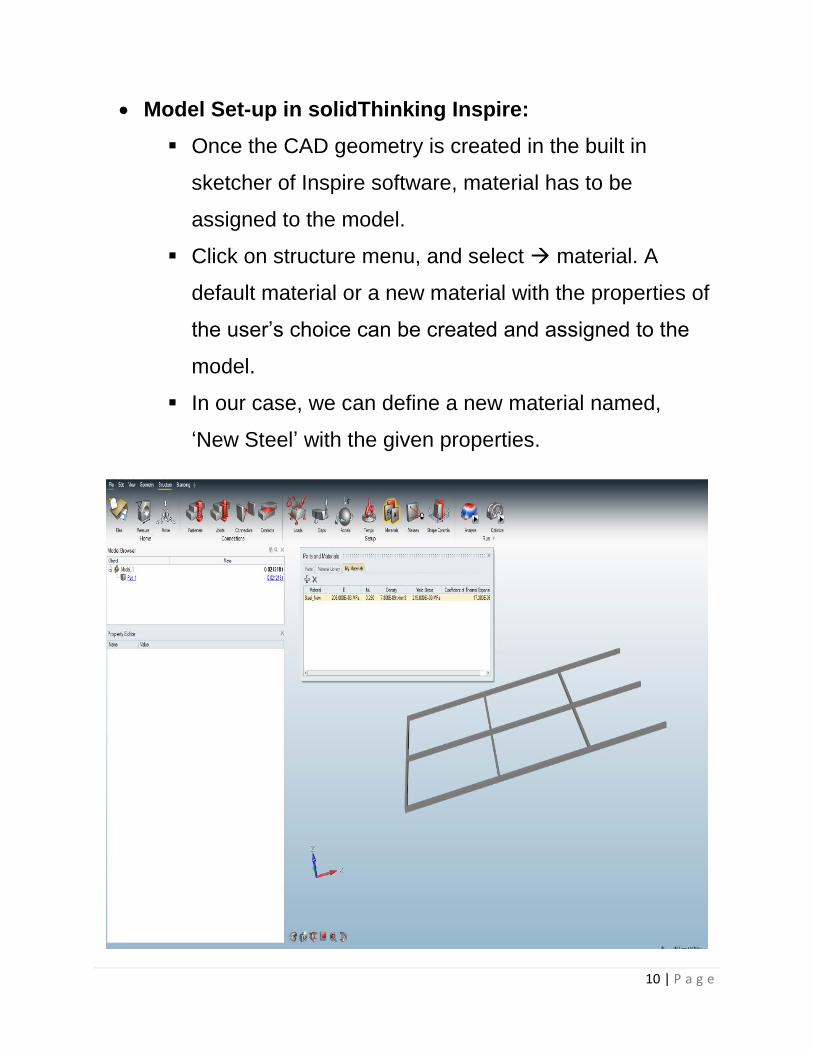
Model Set-up in solidThinking Inspire:
Once the CAD geometry is created in the built in
sketcher of Inspire software, material has to be
assigned to the model.
Click on structure menu, and select material. A
default material or a new material with the properties of
the user’s choice can be created and assigned to the
model.
In our case, we can define a new material named,
‘New Steel’ with the given properties.
11 | P a g e
3. Analysis & Results
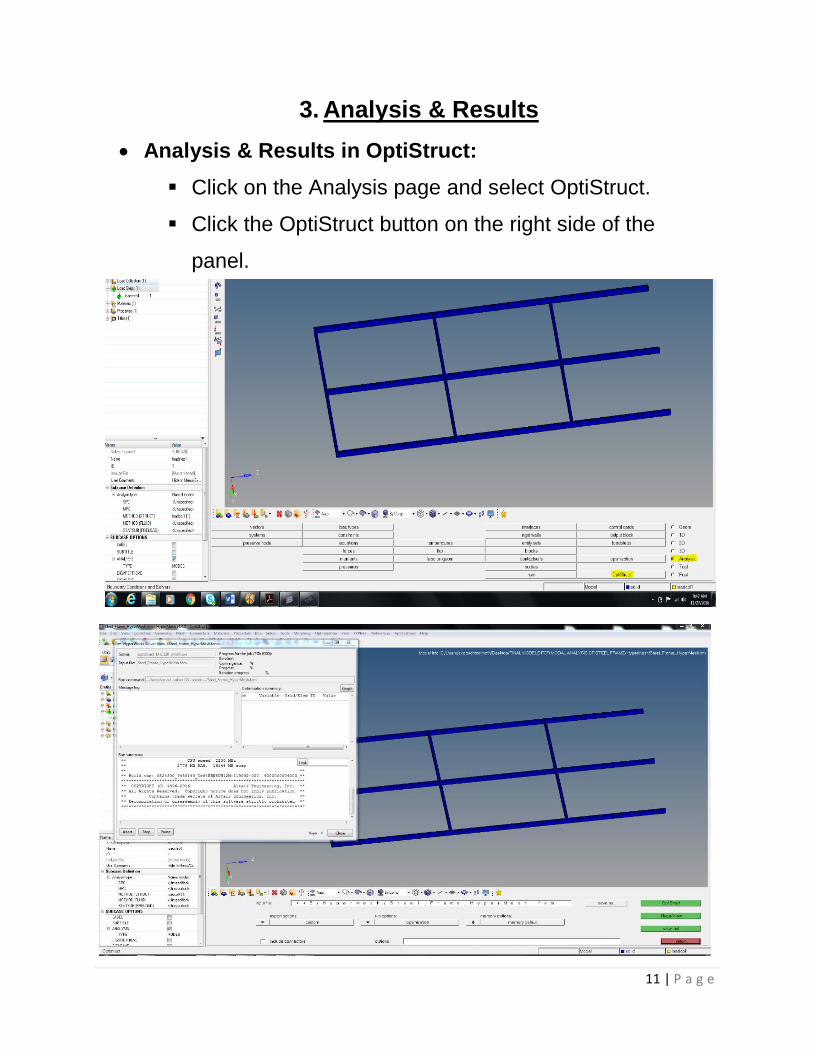
Analysis & Results in OptiStruct:
Click on the Analysis page and select OptiStruct.
Click the OptiStruct button on the right side of the
panel.
12 | P a g e
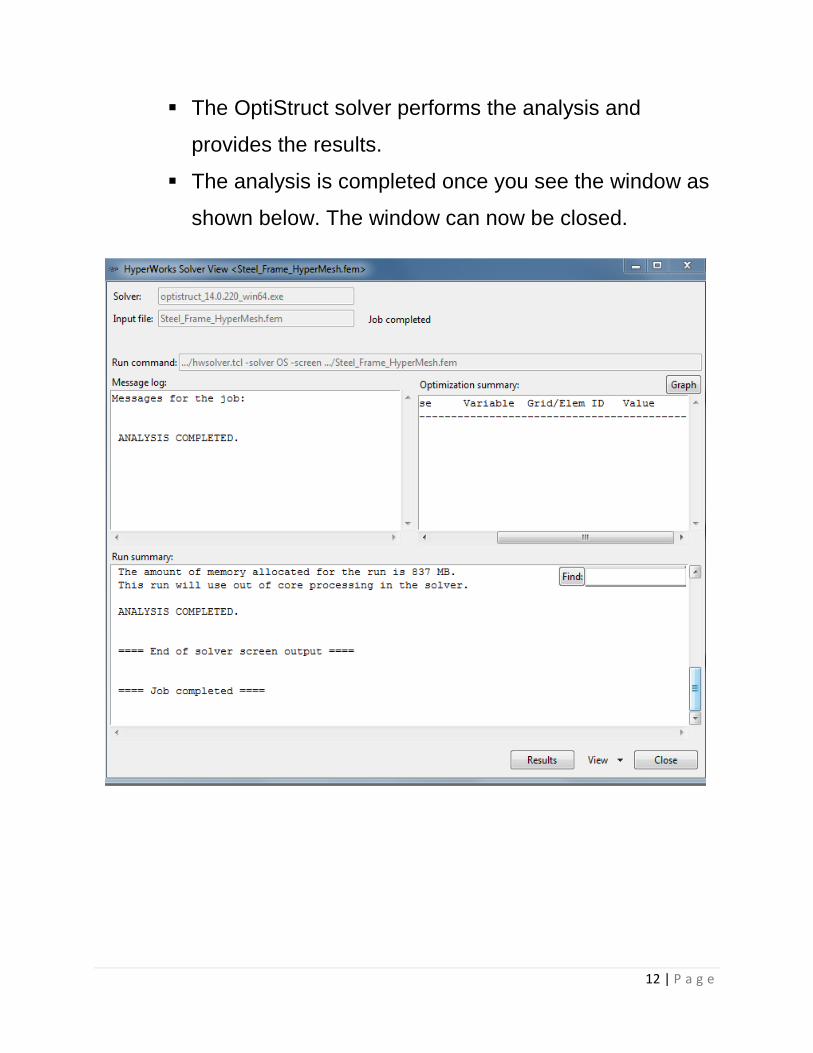
The OptiStruct solver performs the analysis and
provides the results.
The analysis is completed once you see the window as
shown below. The window can now be closed.
13 | P a g e
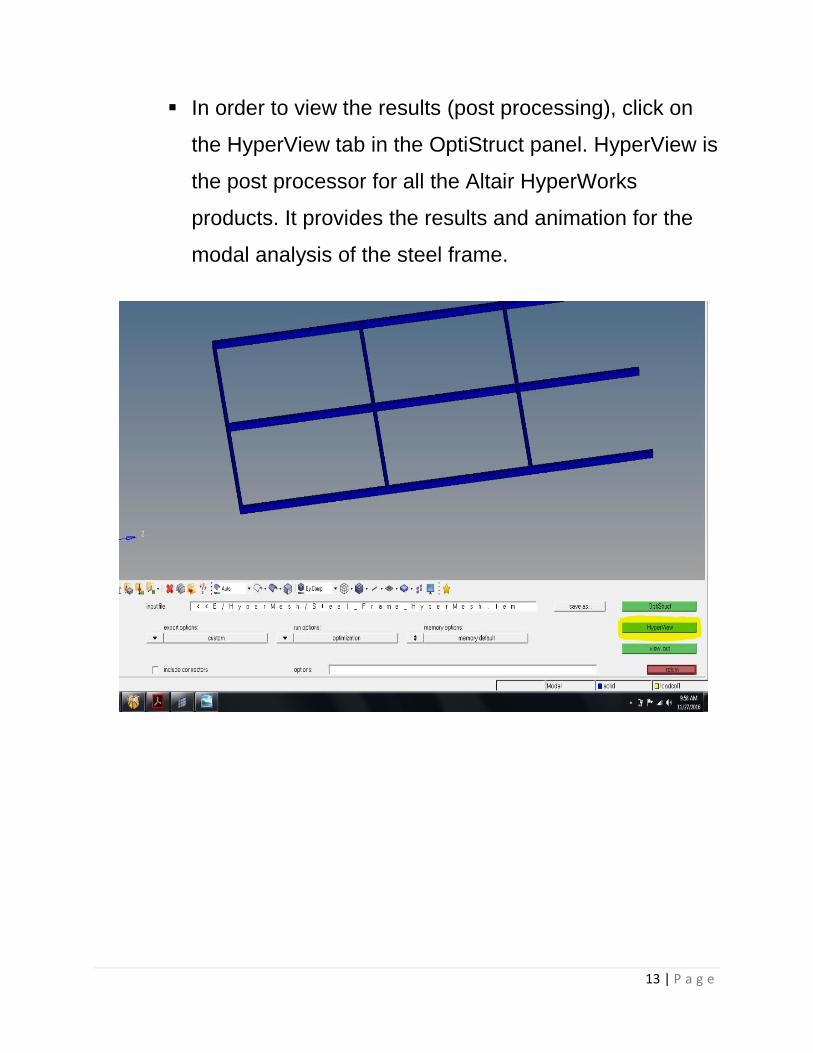
In order to view the results (post processing), click on
the HyperView tab in the OptiStruct panel. HyperView is
the post processor for all the Altair HyperWorks
products. It provides the results and animation for the
modal analysis of the steel frame.
14 | P a g e
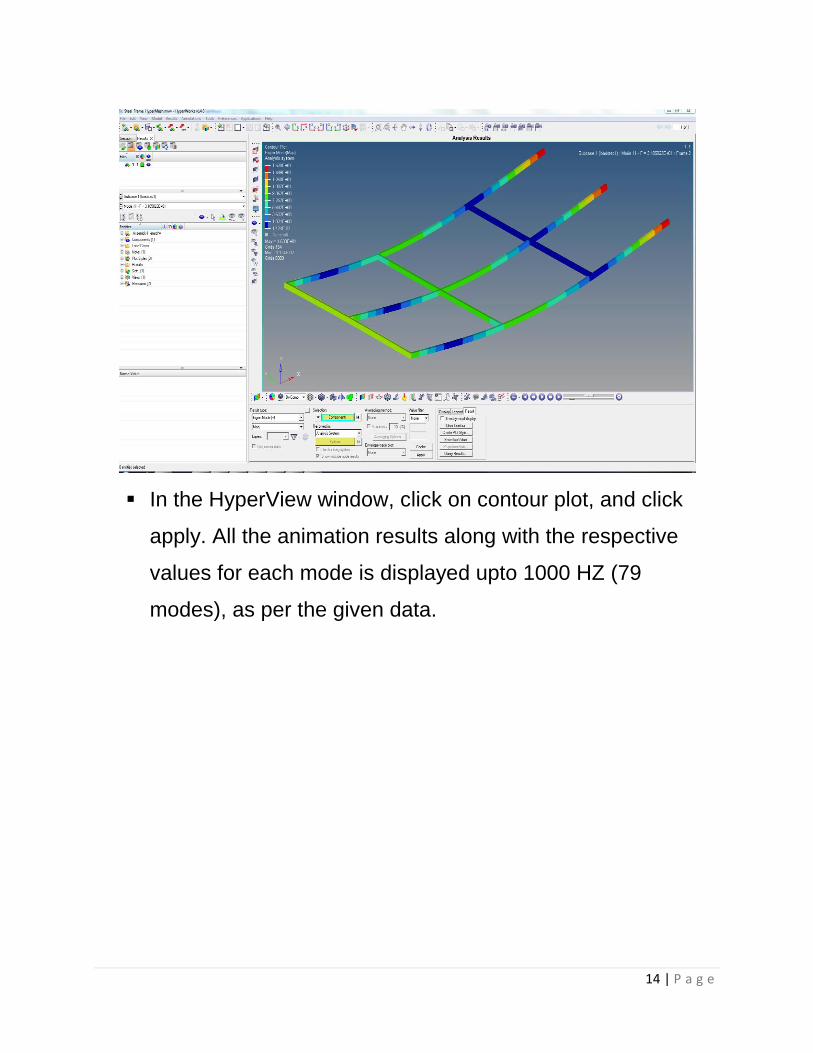
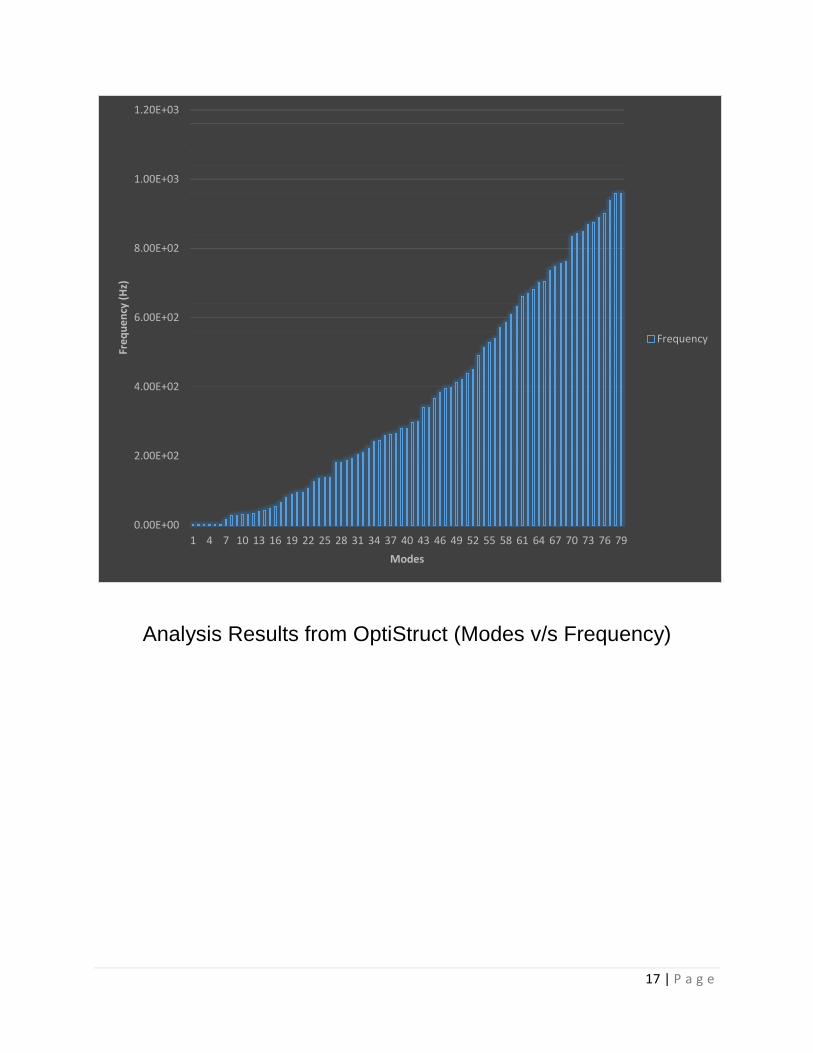
In the HyperView window, click on contour plot, and click
apply. All the animation results along with the respective
values for each mode is displayed upto 1000 HZ (79
modes), as per the given data.
15 | P a g e
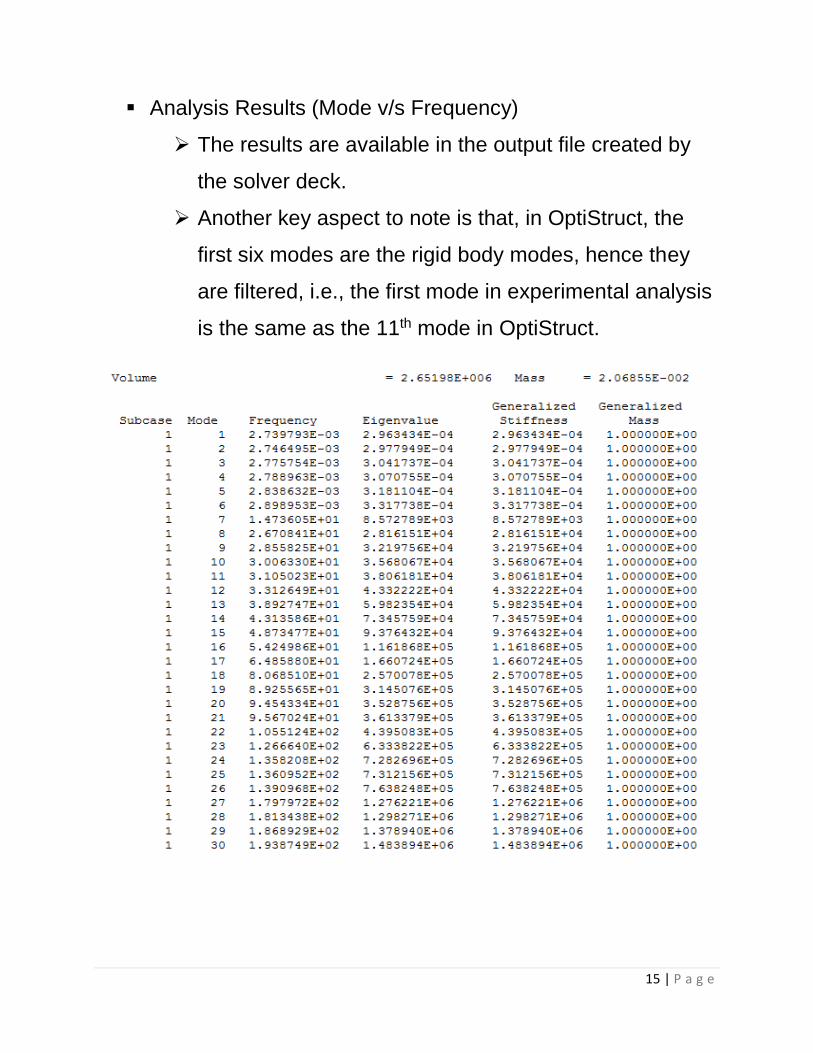
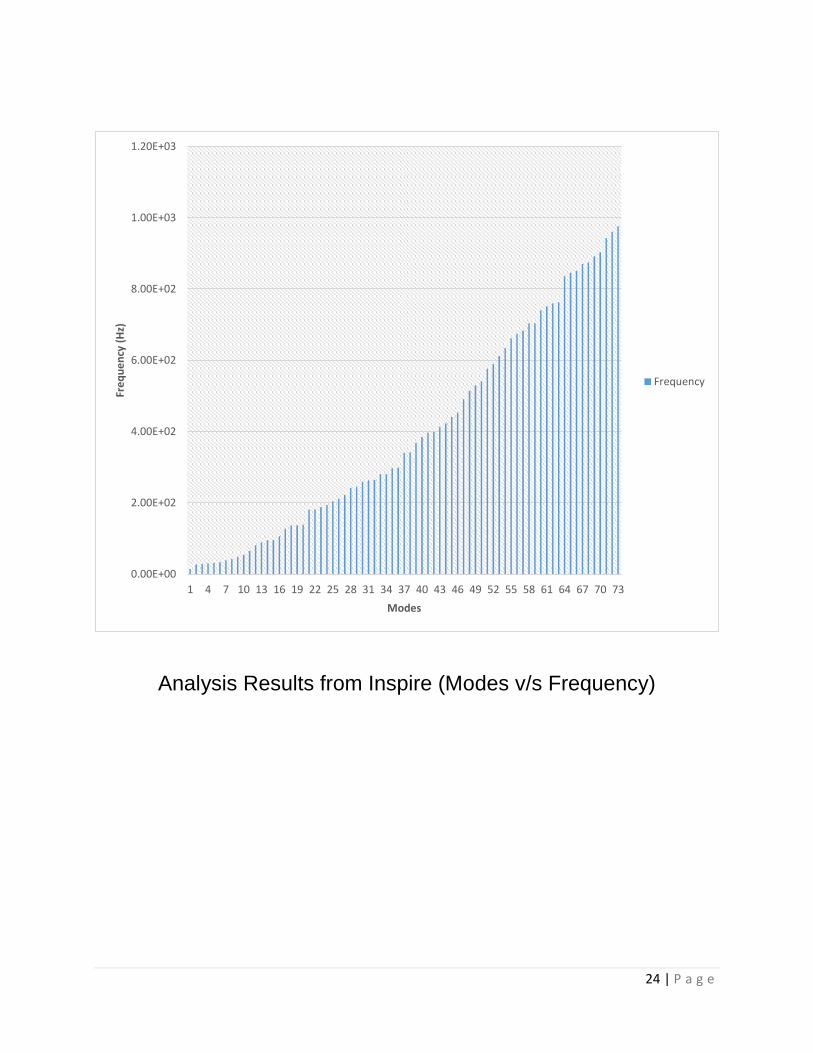
Analysis Results (Mode v/s Frequency)
The results are available in the output file created by
the solver deck.
Another key aspect to note is that, in OptiStruct, the
first six modes are the rigid body modes, hence they
are filtered, i.e., the first mode in experimental analysis
is the same as the 11th mode in OptiStruct.
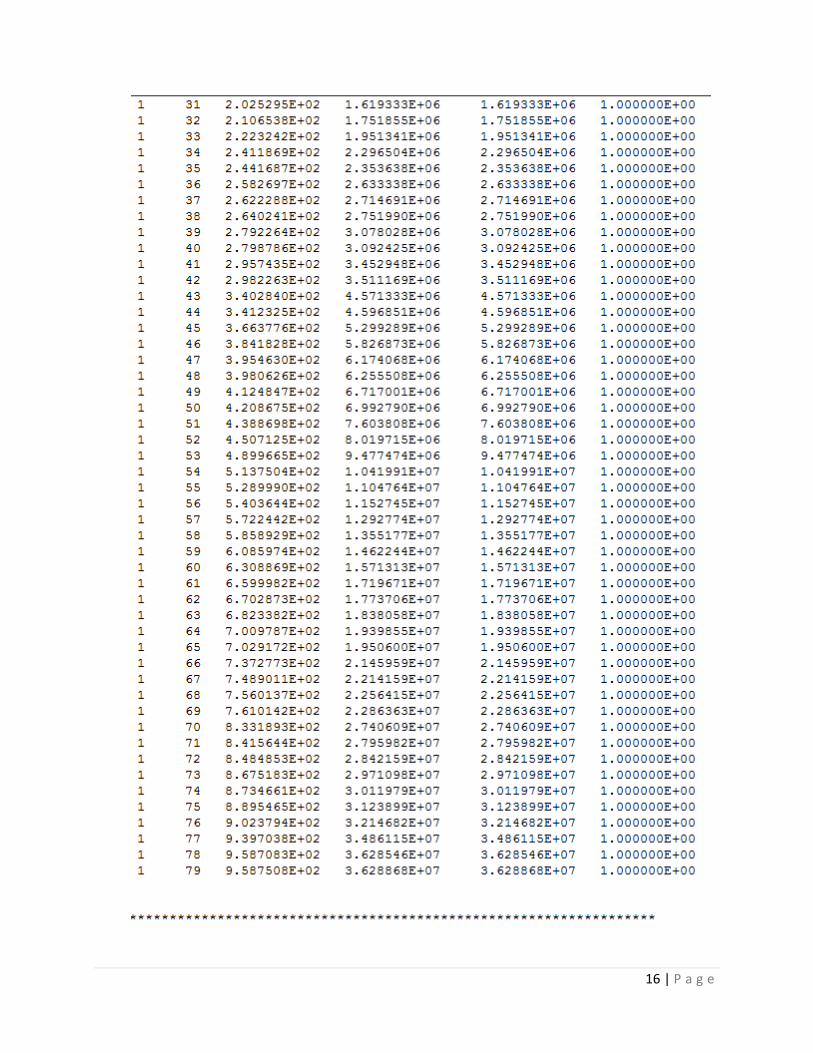
16 | P a g e
17 | P a g e
Analysis Results from OptiStruct (Modes v/s Frequency)
0.00E+00
2.00E+02
4.00E+02
6.00E+02
8.00E+02
1.00E+03
1.20E+03
1 4 7 10 13 16 19 22 25 28 31 34 37 40 43 46 49 52 55 58 61 64 67 70 73 76 79
Fre
qu
en
cy (
Hz)
Modes
Frequency
18 | P a g e
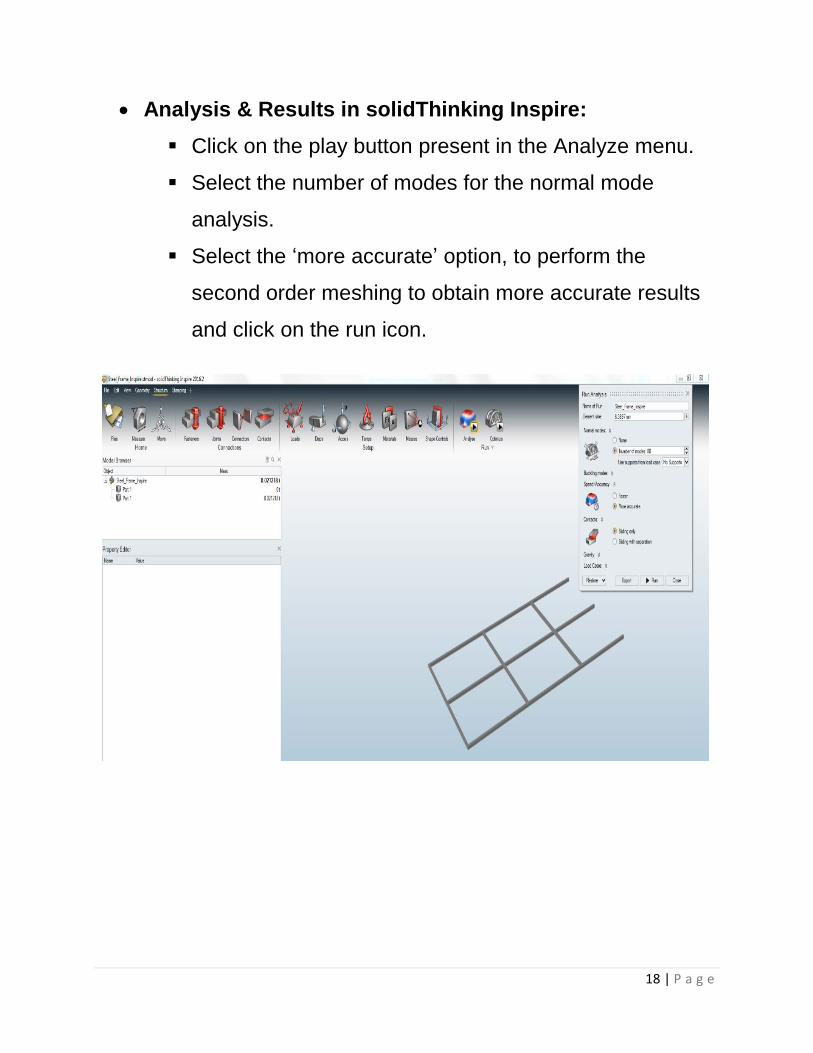
Analysis & Results in solidThinking Inspire:
Click on the play button present in the Analyze menu.
Select the number of modes for the normal mode
analysis.
Select the ‘more accurate’ option, to perform the
second order meshing to obtain more accurate results
and click on the run icon.
19 | P a g e
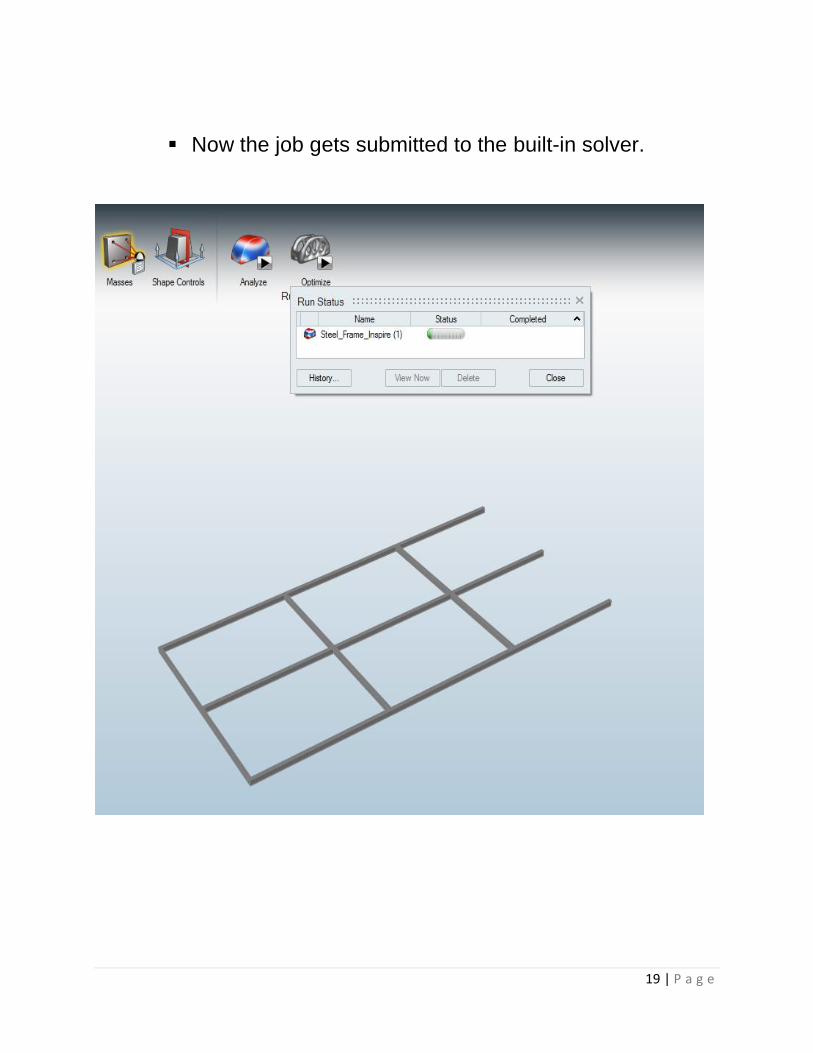
Now the job gets submitted to the built-in solver.
20 | P a g e
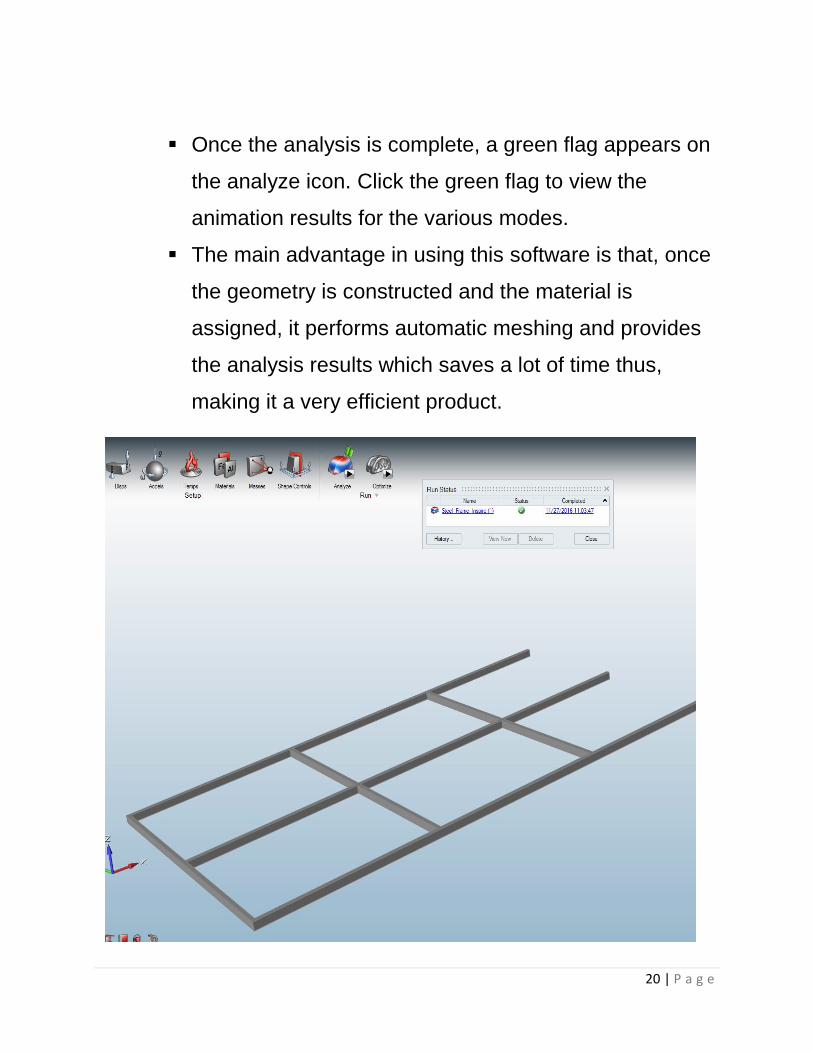
Once the analysis is complete, a green flag appears on
the analyze icon. Click the green flag to view the
animation results for the various modes.
The main advantage in using this software is that, once
the geometry is constructed and the material is
assigned, it performs automatic meshing and provides
the analysis results which saves a lot of time thus,
making it a very efficient product.
21 | P a g e
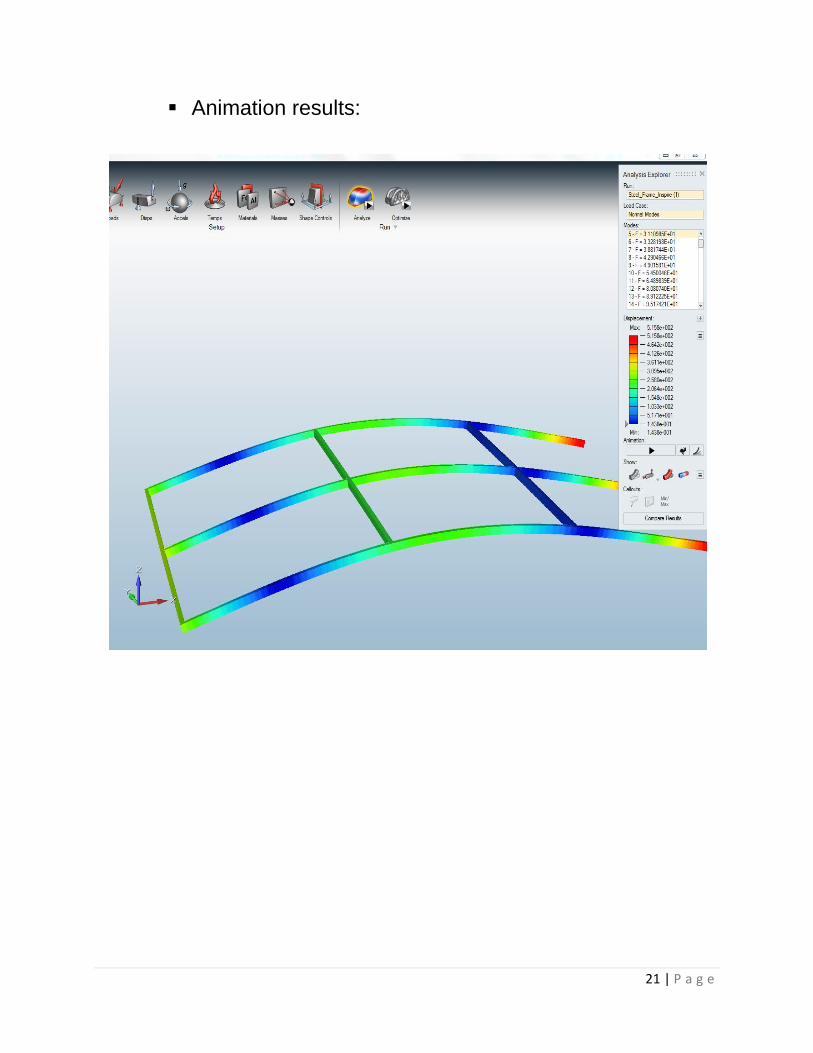
Animation results:
22 | P a g e
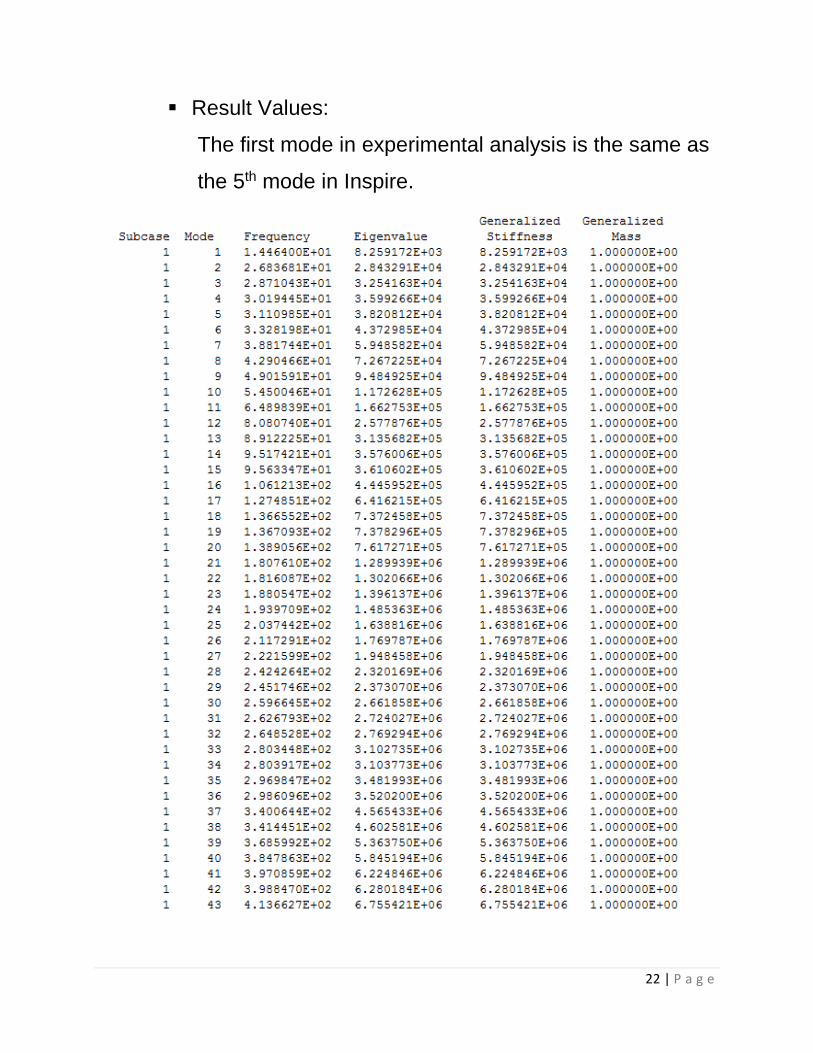
Result Values:
The first mode in experimental analysis is the same as
the 5th mode in Inspire.
23 | P a g e
24 | P a g e
Analysis Results from Inspire (Modes v/s Frequency)
0.00E+00
2.00E+02
4.00E+02
6.00E+02
8.00E+02
1.00E+03
1.20E+03
1 4 7 10 13 16 19 22 25 28 31 34 37 40 43 46 49 52 55 58 61 64 67 70 73
Fre
qu
en
cy (
Hz)
Modes
Frequency
25 | P a g e
4. Results Comparison
OptiStruct and Inspire analysis results, are compared with the
experimental analysis results, for the purpose of validation. This
includes two sub sections, namely, comparison of the numerical
results and the comparison of the animation results (mode
shapes comparison).
Comparison of Numerical results:
Modal Mode Frequency (Hz) OptiStruct Mode Frequency (Hz) Inspire Mode Frequency (Hz)
1 31.9734 11 31.0502 5 31.1098
2 43.7648 14 43.1358 8 42.9046
3 80.3804 18 80.6851 12 80.8074
4 94.9917 20 94.5433 14 95.1742
5 136.9682 24 135.8208 18 136.6552
26 | P a g e
Comparison of Mode Shape Animation Results:
1. Modal Mode 1 v/s OptiStruct Mode 11 v/s Inspire Mode 5
Experimental (given)
OptiStruct Inspire
27 | P a g e
2. Modal Mode 2 v/s OptiStruct Mode 14 v/s Inspire Mode 8
Experimental (given)
OptiStruct Inspire
28 | P a g e
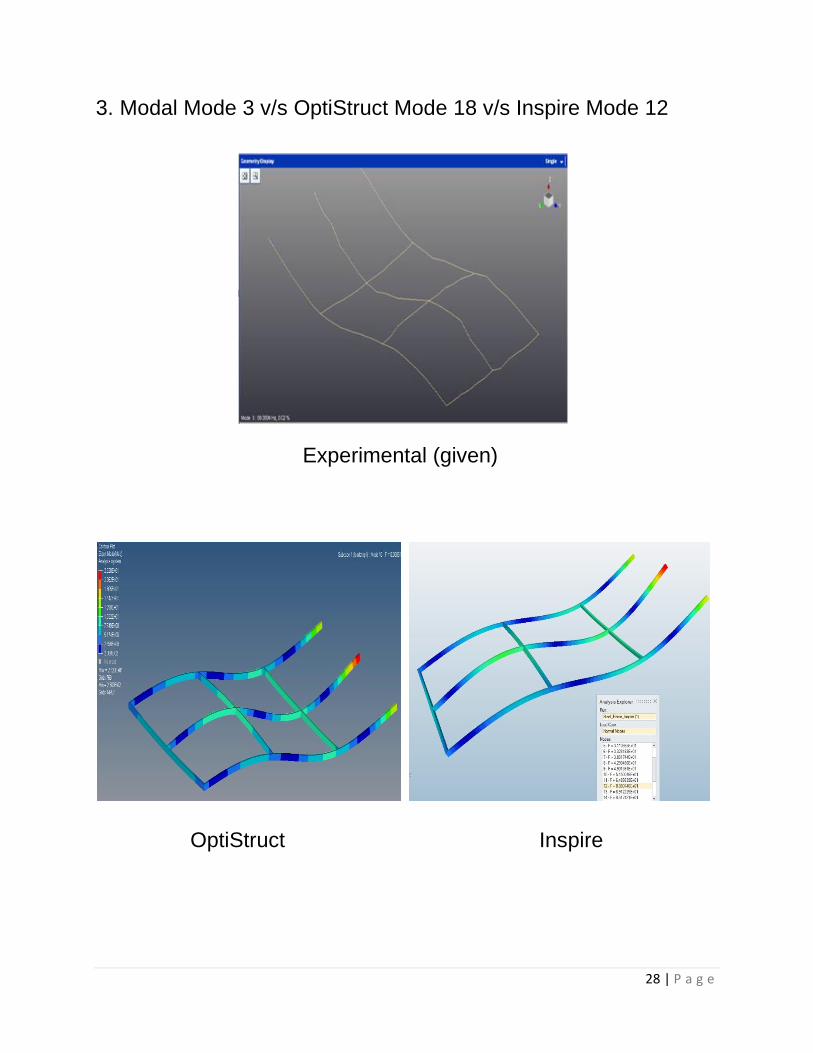
3. Modal Mode 3 v/s OptiStruct Mode 18 v/s Inspire Mode 12
Experimental (given)
OptiStruct Inspire

29 | P a g e
4. Modal Mode 4 v/s OptiStruct Mode 20 v/s Inspire Mode 14
Experimental (given)
OptiStruct Inspire
30 | P a g e
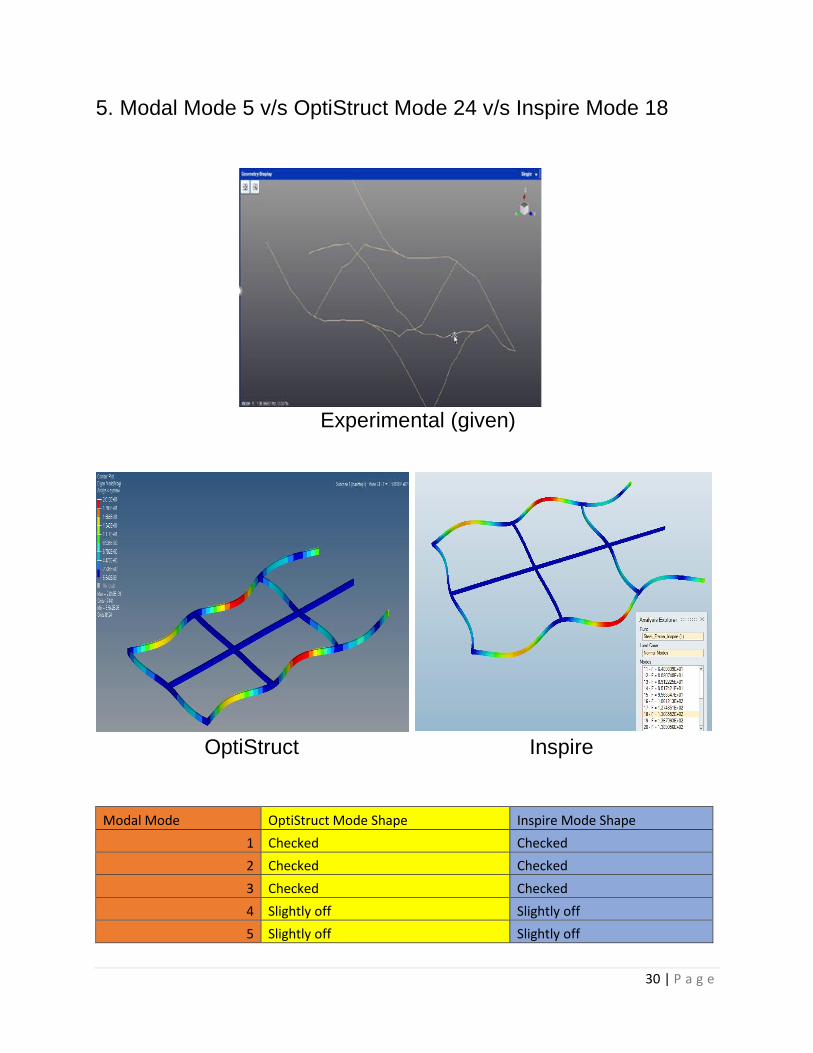
5. Modal Mode 5 v/s OptiStruct Mode 24 v/s Inspire Mode 18
Experimental (given)
OptiStruct Inspire
Modal Mode OptiStruct Mode Shape Inspire Mode Shape
1 Checked Checked
2 Checked Checked
3 Checked Checked
4 Slightly off Slightly off
5 Slightly off Slightly off
31 | P a g e
5. Conclusion
The modal analysis of a steel frame was performed and the
results were compared.
From the analysis, it is observed that the results obtained from
OptiStruct and Inspire CAE tools, match the given experimental
results for the first three modes.
When the experimental results are compared to the CAE
results, a mismatch occurs in the mode shape animation of the
4th and 5th mode,
Hence, it can be observed that as the mode number and
frequency increases, it is difficult to obtain matching results
between the CAE tools and experimental analysis.
Finally, when the pre-processing, analysis setup, simplicity and
post processing is taken into consideration, Altair’s
solidThinking Inspire tool proved to be the most efficient.