Embed Size (px)
Citation preview

Executive Briefing
MobiNEX: The Mobile Network Customer Experience Index, Q4 2015
For the first time, STL Partners quantifies the customer ‘app experience’
on twenty-seven mobile networks in seven countries. Congratulations to
the top three performers – Bouygues, Free and Orange (all in France)
Chris Barraclough, Partner and Chief Strategist, STL Partners
Matt Pooley, Consultant, STL Partners
APRIL 2016
Powered by data from
MobiNEX: The Mobile Network Customer Experience Index, Q4 2015 | APRIL 2016
© STL Partners EXECUTIVE BRIEFING 2
Executive Summary
In response to customers’ growing usage of mobile data and applications, STL Partners has developed
MobiNEX: The Mobile Network Experience Index, which benchmarks mobile operators’ network speed
and reliability by measuring the consumer app experience, and allows individual operators to see how
they are performing in relation to the competition in an objective and quantitative manner.
We assign operators an individual MobiNEX score based on their performance across four measures
that are core drivers of customer app experience: download speed; average latency; error rate; latency
consistency (the percentage of app requests that take longer than 500ms to fulfil). Apteligent has
provided us with the raw data for three out of four of the measures based on billions of requests made
from tens of thousands of applications used by hundreds of millions of users in Q4 2015. We plan to
expand the index to cover other operators and to track performance over time with twice-yearly updates.
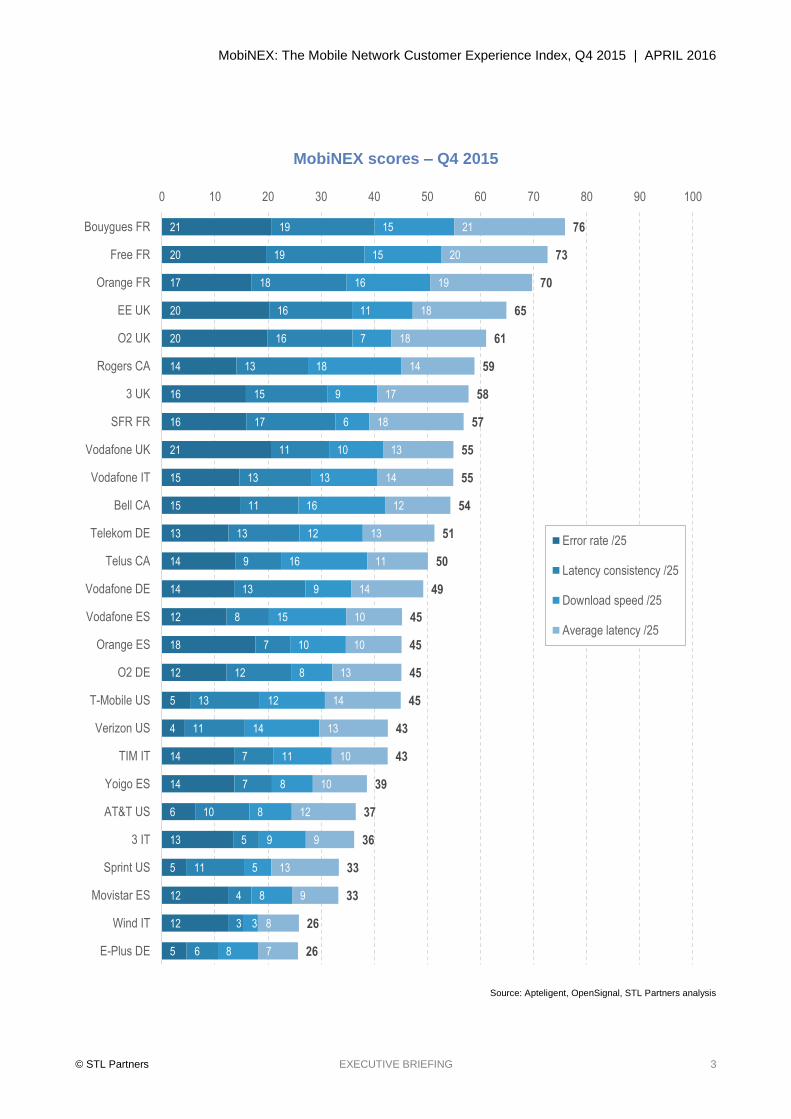
Encouragingly, MobiNEX scores correlate positively with customer satisfaction in the UK and the US
suggesting that a better mobile app experience contributes to customer satisfaction.
The top five performers across twenty-seven operators in seven countries in Europe and North America
(Canada, France, Germany, Italy, Spain, UK, US) were all from France and the UK:
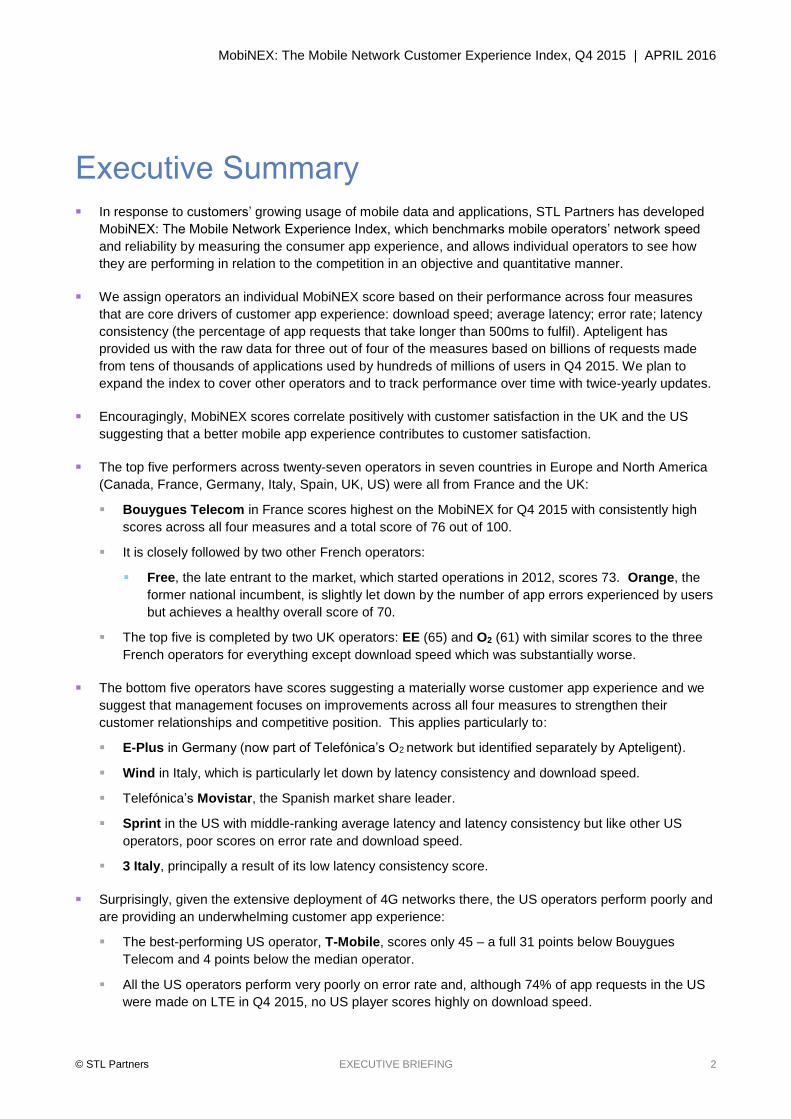
Bouygues Telecom in France scores highest on the MobiNEX for Q4 2015 with consistently high
scores across all four measures and a total score of 76 out of 100.
It is closely followed by two other French operators:
Free, the late entrant to the market, which started operations in 2012, scores 73. Orange, the
former national incumbent, is slightly let down by the number of app errors experienced by users
but achieves a healthy overall score of 70.
The top five is completed by two UK operators: EE (65) and O2 (61) with similar scores to the three
French operators for everything except download speed which was substantially worse.
The bottom five operators have scores suggesting a materially worse customer app experience and we
suggest that management focuses on improvements across all four measures to strengthen their
customer relationships and competitive position. This applies particularly to:
E-Plus in Germany (now part of Telefónica’s O2 network but identified separately by Apteligent).
Wind in Italy, which is particularly let down by latency consistency and download speed.
Telefónica’s Movistar, the Spanish market share leader.
Sprint in the US with middle-ranking average latency and latency consistency but like other US
operators, poor scores on error rate and download speed.
3 Italy, principally a result of its low latency consistency score.
Surprisingly, given the extensive deployment of 4G networks there, the US operators perform poorly and
are providing an underwhelming customer app experience:
The best-performing US operator, T-Mobile, scores only 45 – a full 31 points below Bouygues
Telecom and 4 points below the median operator.
All the US operators perform very poorly on error rate and, although 74% of app requests in the US
were made on LTE in Q4 2015, no US player scores highly on download speed.
MobiNEX: The Mobile Network Customer Experience Index, Q4 2015 | APRIL 2016
© STL Partners EXECUTIVE BRIEFING 3
MobiNEX scores – Q4 2015
Source: Apteligent, OpenSignal, STL Partners analysis
21
20
17
20
20
14
16
16
21
15
15
13
14
14
12
18
12
5
4
14
14
6
13
5
12
12
5
19
19
18
16
16
13
15
17
11
13
11
13
9
13
8
7
12
13
11
7
7
10
5
11
4
3
6
15
15
16
11
7
18
9
6
10
13
16
12
16
9
15
10
8
12
14
11
8
8
9
5
8
3
8
21
20
19
18
18
14
17
18
13
14
12
13
11
14
10
10
13
14
13
10
10
12
9
13
9
8
7
76
73
70
65
61
59
58
57
55
55
54
51
50
49
45
45
45
45
43
43
39
37
36
33
33
26
26
0 10 20 30 40 50 60 70 80 90 100
Bouygues FR
Free FR
Orange FR
EE UK
O2 UK
Rogers CA
3 UK
SFR FR
Vodafone UK
Vodafone IT
Bell CA
Telekom DE
Telus CA
Vodafone DE
Vodafone ES
Orange ES
O2 DE
T-Mobile US
Verizon US
TIM IT
Yoigo ES
AT&T US
3 IT
Sprint US
Movistar ES
Wind IT
E-Plus DE
Error rate /25
Latency consistency /25
Download speed /25
Average latency /25
MobiNEX: The Mobile Network Customer Experience Index, Q4 2015 | APRIL 2016
© STL Partners EXECUTIVE BRIEFING 4
MobiNEX vs Customer Satisfaction
Source: ACSI, NCSI-UK, STL Partners
Verizon US
AT&T US
T-Mobile US
Sprint US
R² = 0.6474
30
35
40
45
50
55
60
65
64 66 68 70 72 74 76
Mob
iNE
X s
core
Customer Satisfaction Score - ACSI
O2 UK
3 UK
Vodafone UK
R² = 0.9423
30
35
40
45
50
55
60
65
64 66 68 70 72 74 76
Mob
iNE
X s
core
Customer Satisfaction Score - NCSI-UK

MobiNEX: The Mobile Network Customer Experience Index, Q4 2015 | APRIL 2016
© STL Partners EXECUTIVE BRIEFING 5
Contents
Introduction ...................................................................................................................................................... 7
Mobile app performance is dependent on more than network speed ................................................... 7
App performance as a measure of customer experience ..................................................................... 7
MobiNEX: The Mobile Network Experience Index ........................................................................................ 8
Methodology and key terms .................................................................................................................. 8
MobiNEX Q4 2015 Results: Top 5, bottom 5, surprises ..................................................................... 10
MobiNEX is correlated with customer satisfaction .............................................................................. 13
Segmenting operators by network customer experience .................................................................... 15
Error rate ........................................................................................................................................................ 18
Quantitative analysis ........................................................................................................................... 18
Key findings ......................................................................................................................................... 19
Latency consistency: Requests with latency over 500ms ........................................................................ 20
Quantitative analysis ........................................................................................................................... 20
Key findings ......................................................................................................................................... 21
Download speed ............................................................................................................................................ 22
Quantitative analysis ........................................................................................................................... 22
Key findings ......................................................................................................................................... 24
Average latency ............................................................................................................................................. 25
Quantitative analysis ........................................................................................................................... 25
Key findings ......................................................................................................................................... 26
Appendix: Source data and methodology .................................................................................................. 27
STL Partners and Telco 2.0: Change the Game ......................................................................................... 29
About Apteligent ............................................................................................................................................ 30

MobiNEX: The Mobile Network Customer Experience Index, Q4 2015 | APRIL 2016
© STL Partners EXECUTIVE BRIEFING 6
Table of Exhibits
Figure 1: MobiNEX – scoring methodology ....................................................................................................... 9
Figure 2: MobiNEX scores – Q4 2015 ............................................................................................................. 11
Figure 3: Customer Satisfaction vs MobiNEX, 2015 ....................................................................................... 14
Figure 4: MobiNEX operator segmentation – network speed vs network reliability ........................................ 16
Figure 5: MobiNEX operator segmentation – with total scores ....................................................................... 17
Figure 6: Major Western markets – error rate per 10,000 requests ................................................................ 18
Figure 7: Major Western markets – average error rate per 10,000 requests .................................................. 19
Figure 8: Major Western operators – percentage of requests with total roundtrip latency greater than 500ms
......................................................................................................................................................................... 20
Figure 9: Major Western markets – average percentage of requests with total roundtrip latency greater than
500ms .............................................................................................................................................................. 21
Figure 10: Major Western operators – average weighted download speed across 3G and 4G networks
(Mbps) .............................................................................................................................................................. 22
Figure 11: Major European markets – average weighted download speed (Mbps) ........................................ 23
Figure 12: Major Western markets – percentage of requests made on 3G and LTE ..................................... 23
Figure 13: Download speed vs Percentage of LTE requests .......................................................................... 24
Figure 14: Major Western operators – average total roundtrip latency (ms) ................................................... 25
Figure 15: Major Western markets – average total roundtrip latency (ms) ..................................................... 26
Figure 18: MobiNEX benchmarks .................................................................................................................... 28

MobiNEX: The Mobile Network Customer Experience Index, Q4 2015 | APRIL 2016
© STL Partners EXECUTIVE BRIEFING 7
Introduction
Mobile app performance is dependent on more than network speed
Download speed has often been seen as the most important factor in network performance. However, for a
website or application to load quickly, users are dependent on two factors: download speed and latency (the
time taken for a packet of data to travel from one point to another). Which factor predominates largely
depends on the design of a given website or app. If the network requests making up a webpage are few, but
large, download speed will have a greater effect on load time. If the requests are many, but small, latency
will be the determining factor.
Owing to the way developers use ‘microservices’ to construct websites and apps, latency has become
increasingly important. In our previous reports, Mobile App Latency in Europe: French Operators Lead;
Italian & Spanish Lag and Lag Kills! How App Latency Wrecks Customer Experience, STL Partners
investigated the impact of latency on customer experience when using mobile networks. Using a very large
data-set provided by mobile app intelligence specialist Apteligent, we benchmarked major European mobile
network operators on three counts: average network latency, the rate of unacceptably high-latency events,
and application error rate.
We concluded that:
There are wide differences between operators and countries in total roundtrip latency, but average
latency is heavily dependent on the local market or geographic location. This may be owing to national or
regional characteristics (e.g. peering arrangements), or because operators compete against each other
nationally, so that operators in a given national market tend to have similar latency characteristics.
There is a strong positive correlation between a network's average latency and the rate of application
errors users experience on the network – when latency goes up, more errors occur. High network
latency therefore has a double whammy impact on customer experience – customers have to wait longer
and applications error-out more often.
This suggests that mobile operators have a significant impact on how well an app runs and how likely it is to
experience an error. Network performance, therefore, is a key driver of mobile customer experience.
App performance as a measure of customer experience
It is clear that mobile customer experience varies widely between networks: in our last report, users of the
worst performing mobile network in Europe experienced an app error rate over twice that of the top
performer. As customers’ understanding of the operators’ role in app performance grows, they may begin to
consider this as a factor when choosing a mobile service provider. It is therefore important for mobile network
operators to know how well they are doing in terms of network performance and diagnose what they can do
to improve the experience for their customers.
MobiNEX: The Mobile Network Customer Experience Index, Q4 2015 | APRIL 2016
© STL Partners EXECUTIVE BRIEFING 8
MobiNEX: The Mobile Network Experience Index
Methodology and key terms
Building on our previous research, STL Partners has developed MobiNEX: The Mobile Network Experience
Index, which benchmarks mobile operators’ network speed and network reliability by measuring customer
app experience. This allows individual operators to see how they are performing in relation to the
competition in a quantitative manner. Operators are assigned an individual NEX score based on their
performance across four measures that STL believes are core drivers of customer app experience.
The four measures comprising MobiNEX are:
1. Error rate: The proportion of requests made by a customer using an application that experience an
error. We assign scores based on the operator’s error rate per 10,000 requests.
2. Latency consistency: The proportion of requests made by the customer using an application that
experience unacceptably high-latency events. We assign scores based on the percentage of requests
made that experience latency of greater than 500 milliseconds.
3. Download speed: The average speed actually experienced by users downloading data from the
internet, in the form of application instructions and content. We assign scores based on the operator’s
average speed, measured in megabits per second (Mbps).
4. Average latency: The average amount of time taken from the customer taking an action on a device
until they receive a response back from the application. Scores are assigned based on an operator’s
average ‘total roundtrip latency’ in milliseconds (ms) – the time it takes from the moment the user takes
an action, such as pressing a button on a mobile device, to receiving a response – in effect, a packet
arriving back and being processed by the application at the device.
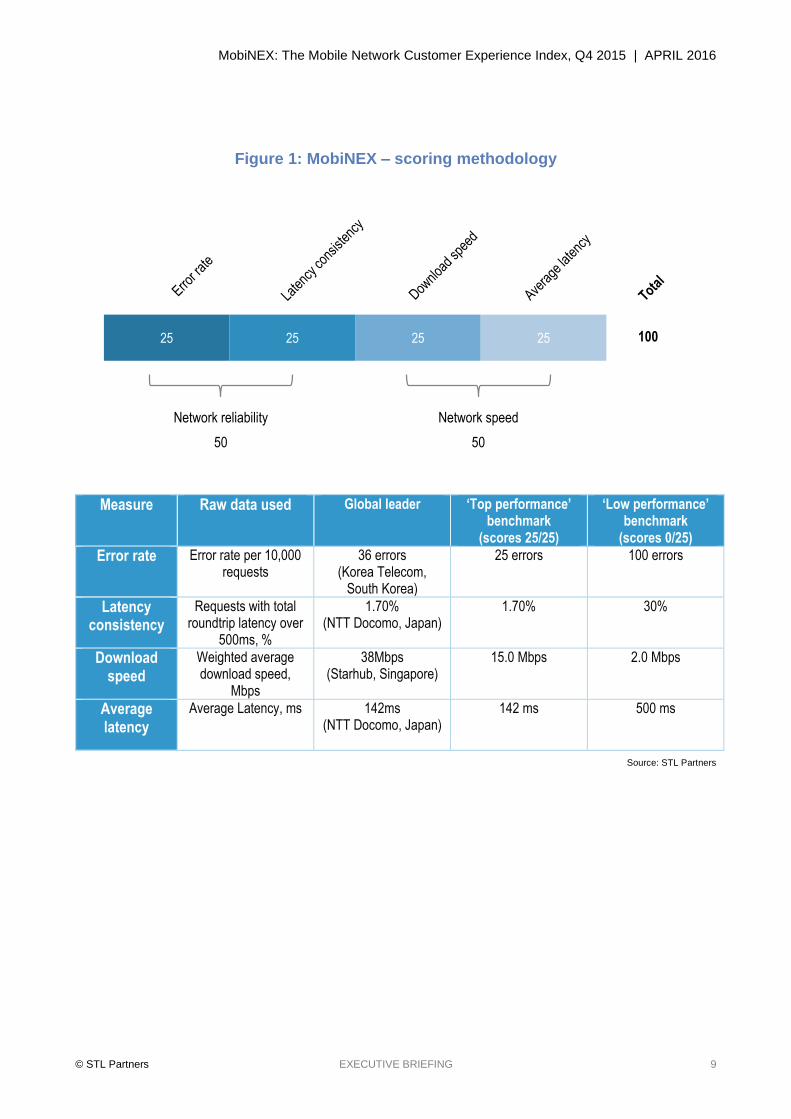
The raw data for each measure, which is analysed in later sections of the report, is converted into an
indexed score out of 25 points and, as shown in Figure 1, can combined to give a total score out of 100.
To assign the scores, STL Partners has identified a ‘top performance’ and ‘low performance’ benchmark, to
which we award 25 and 0 points respectively. The benchmarks have been chosen based on our assessment
of ‘best’ and ‘worst practise’, taking into account data on current ‘world best’ performance for each measure
(usually an operator in South Korea or Japan). We then calculate operator scores relative to the high and
low benchmarks in a linear fashion.
An in-depth explanation of the source data and methodology is available in the Appendix.
MobiNEX: The Mobile Network Customer Experience Index, Q4 2015 | APRIL 2016
© STL Partners EXECUTIVE BRIEFING 9
Figure 1: MobiNEX – scoring methodology
Measure Raw data used Global leader ‘Top performance’ benchmark
(scores 25/25)
‘Low performance’ benchmark
(scores 0/25)
Error rate Error rate per 10,000 requests
36 errors (Korea Telecom,
South Korea)
25 errors 100 errors
Latency consistency
Requests with total roundtrip latency over
500ms, %
1.70% (NTT Docomo, Japan)
1.70% 30%
Download speed
Weighted average download speed,
Mbps
38Mbps (Starhub, Singapore)
15.0 Mbps 2.0 Mbps
Average latency
Average Latency, ms 142ms (NTT Docomo, Japan)
142 ms 500 ms
Source: STL Partners
25 25 25 25
Network speedNetwork reliability
100
5050
MobiNEX: The Mobile Network Customer Experience Index, Q4 2015 | APRIL 2016
© STL Partners EXECUTIVE BRIEFING 10
MobiNEX Q4 2015 Results: Top 5, bottom 5, surprises
The top five operators
Bouygues Telecom in France scores highest on the MobiNEX for Q4 2015 with consistently high
scores across all four measures and a total score of 76 out of 100.
It is closely followed by two other French operators:
Free, the late entrant to the market, which started operations in 2012 and had already reached
nearly 17% market share by the end of 2015, scores 73.
Orange, the former national incumbent which is currently exploring an acquisition of Bouygues, is
slightly let down by the number of app errors experienced by users but achieves a healthy overall
score of 70.
The top five is completed by two UK operators: EE (65) and O2 (61). Both achieve similar error rate
scores to their French counterparts and are only marginally worse for average latency and latency
consistency, but score substantially worse for download speed (especially O2).
The dominance of French and UK operators clearly indicates that network performance is closely linked to
local rather than inter-country competition. This is not surprising: operators invest in response to their local
market, seeking to gain an advantage over or neutralise a disadvantage against players competing for the
same customers. This point explains the wide range of performance of multi-operator groups such as
Vodafone and Telefónica, whose operating companies are spread across the pack (see Figure 2 below).
The bottom five operators
In joint last place, with scores that suggest a materially worse customer experience, are:
E-Plus in Germany (now part of Telefónica’s O2 network but identified separately by Apteligent)
which scores only 26 out of 100 and which suffers from problems on all four measures: a high app
error rate, poor average latency and latency consistency, and slow download speed.
Wind in Italy, which also scores 26 and which is particularly let down by its latency consistency and
its download speed (with scores of 3 out of 25 on each).
Telefónica has the dubious distinction of having a second operating company in the bottom five.
Spanish market share leader Movistar scores only 33, with particularly poor latency consistency
meaning its customers are likely to suffer a ‘laggy’ experience when using apps.
Sprint in the US also scores 33. Average latency and latency consistency is middle-ranking but, like
other US operators, Sprint scores poorly on error rate and download speed.
The bottom five is completed by 3 Italy (36), principally a result of its low latency consistency score.
The wide range of countries represented at the bottom of the table contradicts the notion of local competition
causing operators to cluster together set out above. However, it is important to note that nearly all of the
Italian, Spanish and US operators are in the bottom half of the table such that the gap between Wind,
Movistar, Sprint, 3 and their local peers is not that pronounced. E-Plus is an exception in that the rest of the
German operators cluster in the middle of the ranking table. In other words, E-Plus is at a material
disadvantage to its rivals and Telefónica will need to work hard to address these operational issues as it
integrates the network with O2.

MobiNEX: The Mobile Network Customer Experience Index, Q4 2015 | APRIL 2016
© STL Partners EXECUTIVE BRIEFING 11
Figure 2: MobiNEX scores – Q4 2015
Source: STL Partners
21
20
17
20
20
14
16
16
21
15
15
13
14
14
12
18
12
5
4
14
14
6
13
5
12
12
5
19
19
18
16
16
13
15
17
11
13
11
13
9
13
8
7
12
13
11
7
7
10
5
11
4
3
6
15
15
16
11
7
18
9
6
10
13
16
12
16
9
15
10
8
12
14
11
8
8
9
5
8
3
8
21
20
19
18
18
14
17
18
13
14
12
13
11
14
10
10
13
14
13
10
10
12
9
13
9
8
7
76
73
70
65
61
59
58
57
55
55
54
51
50
49
45
45
45
45
43
43
39
37
36
33
33
26
26
0 10 20 30 40 50 60 70 80 90 100
Bouygues FR
Free FR
Orange FR
EE UK
O2 UK
Rogers CA
3 UK
SFR FR
Vodafone UK
Vodafone IT
Bell CA
Telekom DE
Telus CA
Vodafone DE
Vodafone ES
Orange ES
O2 DE
T-Mobile US
Verizon US
TIM IT
Yoigo ES
AT&T US
3 IT
Sprint US
Movistar ES
Wind IT
E-Plus DE
Error rate /25
Latency consistency /25
Download speed /25
Average latency /25
MobiNEX: The Mobile Network Customer Experience Index, Q4 2015 | APRIL 2016
© STL Partners EXECUTIVE BRIEFING 12
The surprises: operators found where you wouldn’t expect them Analysts and market observers often cite the US as a mobile market that has achieved higher broadband
prices owing to its operators’ network investment. And, as we show later in this report, it has the highest
proportion of customers on 4G networks of the seven markets examined.
It is something of a bombshell, then, to find that US operators score so poorly on the MobiNEX and US
customers appear to be getting a raw deal (especially given the relatively high prices they pay for mobile
broadband):
All four major US mobile operators are in the bottom half of the ranking.
The best-performing US operator, T-Mobile, scores only 45 – a full 31 points below Bouygues Telecom
and 4 points below the median operator.
Verizon and AT&T, the US market leaders, score only 43 and 37 respectively and Sprint, as already
noted, is in the bottom 5 with 33.
All the US operators perform poorly on error rate. This is a real surprise given that many applications
have been developed in the US-based start-ups and established companies and the vast majority are
hosted in the data centres of US internet giants – Amazon and Google being particularly important.
Although 74% of requests in the US are made on LTE, no US player scores highly on download speed.
Sprint, and AT&T perform particularly poorly with 5 and 8 points respectively out of a possible 25.
STL Partners has argued that the price premium enjoyed by US operators has nothing to do with network
quality1 but is a function of the market structure (the dominance of AT&T and Verizon), coupled with strong
growth and relatively benign regulation. Similarly, the French operators – collectively the best-performing
players in the MobiNEX – have suffered substantive price erosion in the recent past in spite of network
investment. STL Partners believes this is a strong argument against the notion of ‘repremiumisation’ – the
ability for operators to extract a price premium through network-based differentiation.
1 In our June 2015 report, Repremiumization: The dangerous self-deception at work in European Telcos.
MobiNEX: The Mobile Network Customer Experience Index, Q4 2015 | APRIL 2016
© STL Partners EXECUTIVE BRIEFING 13
MobiNEX is correlated with customer satisfaction
The MobiNEX produces a broad range of results and STL Partners is confident that it reflects differences in
actual customer experience when using applications on different mobile networks. However, it is only
valuable if it is shown to be linked to customer satisfaction that, in turn, should influence core financial and
operational metrics such as ARPU, churn and net adds.
The difficultly is that there is no universal customer satisfaction metric. Customer satisfaction tends to be
examined within a single national market or industry, and methodologies vary widely. This makes global
comparison tricky. However, because the American Customer Satisfaction Index shares its methodology with
the UK National Customer Satisfaction Index, we have been able to test the strength of relationship between
the MobiNEX and customer satisfaction scores for British and American operators.
The absolute level of satisfaction with operators may vary between the US and UK (as indeed it does) owing
to other factors – cultural differences, relative price levels, and so forth – but our confidence in the validity of
the MobiNEX is increased by its strong positive correlation it has with the ACSI and NCSI-UK data – see
Figure 3 below. While correlation does not imply causation, the strong relationship between our measure of
customer app experience and a standard measure of customer satisfaction in two separate markets is
encouraging.
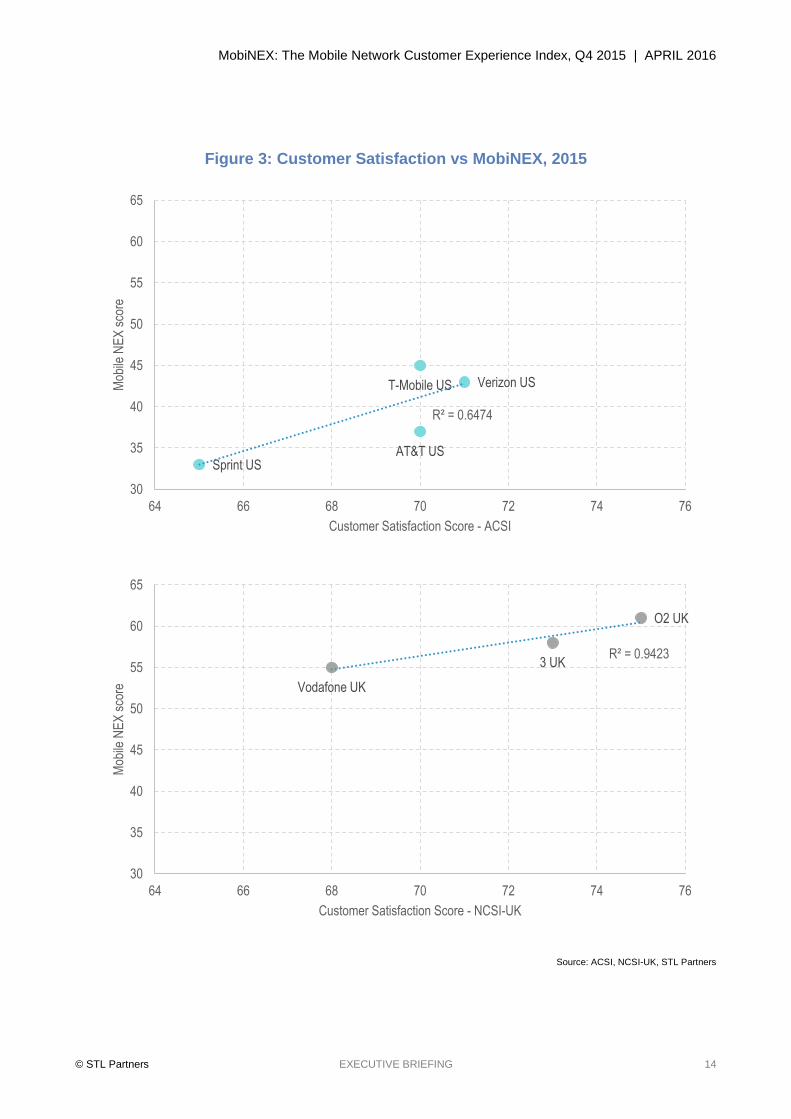
In Figure 3 we have plotted US and UK operators on charts with the same scale to show the relationship
between MobiNEX and customer satisfaction in the two countries. Overall, the UK operators perform better
for both Mobile Network Customer Experience and customer satisfaction but the nature of the linear trend-
line is different. Both markets show an encouraging positive correlation as measured by R2 (the squared
correlation) – the UK with 0.94 and the US with 0.65 (a score of 1.0 denoting a perfect relationship). It is
worth noting that the number of data points in each market is low. The UK only has three pairs owing to the
fact that the NCSI-UK did not capture data for EE in 2015; the US has four data pairs. Nevertheless, this
suggests that MobiNEX is a good predictor of customer satisfaction – in other words the combination of
factors we have chosen – speed + latency + errors – do affect customer experience.
MobiNEX: The Mobile Network Customer Experience Index, Q4 2015 | APRIL 2016
© STL Partners EXECUTIVE BRIEFING 14
Figure 3: Customer Satisfaction vs MobiNEX, 2015
Source: ACSI, NCSI-UK, STL Partners
Verizon US
AT&T US
T-Mobile US
Sprint US
R² = 0.6474
30
35
40
45
50
55
60
65
64 66 68 70 72 74 76
Mob
ile N
EX
sco
re
Customer Satisfaction Score - ACSI
O2 UK
3 UK
Vodafone UK
R² = 0.9423
30
35
40
45
50
55
60
65
64 66 68 70 72 74 76
Mob
ile N
EX
sco
re
Customer Satisfaction Score - NCSI-UK
MobiNEX: The Mobile Network Customer Experience Index, Q4 2015 | APRIL 2016
© STL Partners EXECUTIVE BRIEFING 15
Segmenting operators by network customer experience
Two segmentation dimensions… As explained in the Methodology and key terms section above, STL Partners grouped the four measures
of the MobiNEX into two dimensions, each worth 50 points:
1. Network performance: comprising Download Speed and Average Latency.
2. Network reliability: comprising Error Rate and Latency Consistency.
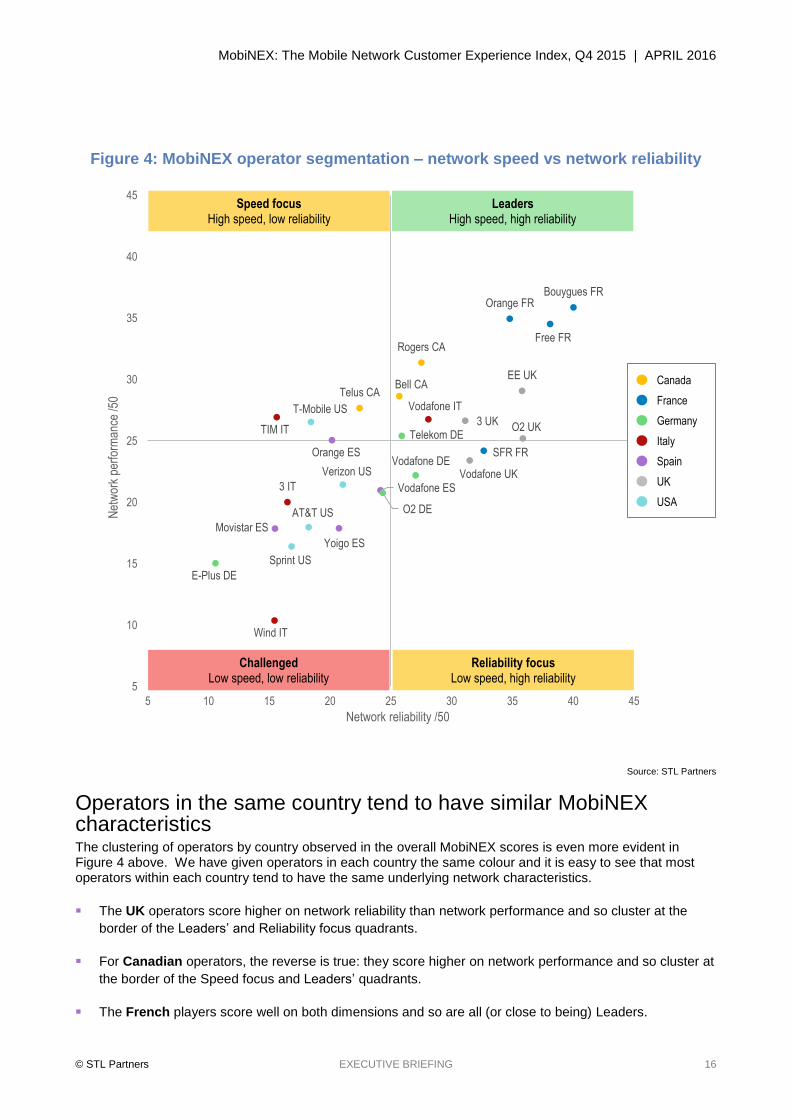
...produce four operator segments We show the distribution of operators along the two dimensions in Figures 4 and 5. This shows that there is a positive correlation between network performance and network reliability – in other words, as network speed increases and latency decreases so the proportion of application errors and requests experiencing latency above 500ms reduces. Intuitively, of course, this makes sense.
Nevertheless, there is a good deal of variation within the overall trend as some operators perform particularly
well on one dimension, compared to the other. For example, Telus (Canada), T-Mobile (US), TIM (Italy), and
Orange (Spain) score well on network performance (high speed, low latency) at the expense of network
reliability (error rate and latency consistency) – we have placed these players into the ‘Speed focus’
segment. Conversely, Vodafone (in both Germany and the UK) and SFR (France) form the ‘Reliability focus’
– those that score proportionally higher on network reliability than network performance.
The remaining twenty operators split evenly between ‘Leaders’ and ‘Challenged’ – with three out of four US
operators found within the latter quadrant.
MobiNEX: The Mobile Network Customer Experience Index, Q4 2015 | APRIL 2016
© STL Partners EXECUTIVE BRIEFING 16
Figure 4: MobiNEX operator segmentation – network speed vs network reliability
Source: STL Partners
Operators in the same country tend to have similar MobiNEX characteristics The clustering of operators by country observed in the overall MobiNEX scores is even more evident in Figure 4 above. We have given operators in each country the same colour and it is easy to see that most operators within each country tend to have the same underlying network characteristics.
The UK operators score higher on network reliability than network performance and so cluster at the
border of the Leaders’ and Reliability focus quadrants.
For Canadian operators, the reverse is true: they score higher on network performance and so cluster at
the border of the Speed focus and Leaders’ quadrants.
The French players score well on both dimensions and so are all (or close to being) Leaders.
Bouygues FR
Free FR
Orange FR
EE UK
O2 UK
Rogers CA
3 UK
SFR FR
Vodafone UK
Vodafone IT
Bell CA
Telekom DE
Telus CA
Vodafone DEOrange ES
Vodafone ES
O2 DE
T-Mobile US
TIM IT
Verizon US
Yoigo ES
3 IT
AT&T US
Movistar ES
Sprint US
Wind IT
E-Plus DE
5
10
15
20
25
30
35
40
45
5 10 15 20 25 30 35 40 45
Net
wor
k pe
rfor
man
ce /5
0
Network reliability /50
ChallengedLow speed, low reliability
Reliability focusLow speed, high reliability
Speed focusHigh speed, low reliability
LeadersHigh speed, high reliability
Canada
France
Germany
Italy
Spain
UK
USA
MobiNEX: The Mobile Network Customer Experience Index, Q4 2015 | APRIL 2016
© STL Partners EXECUTIVE BRIEFING 17
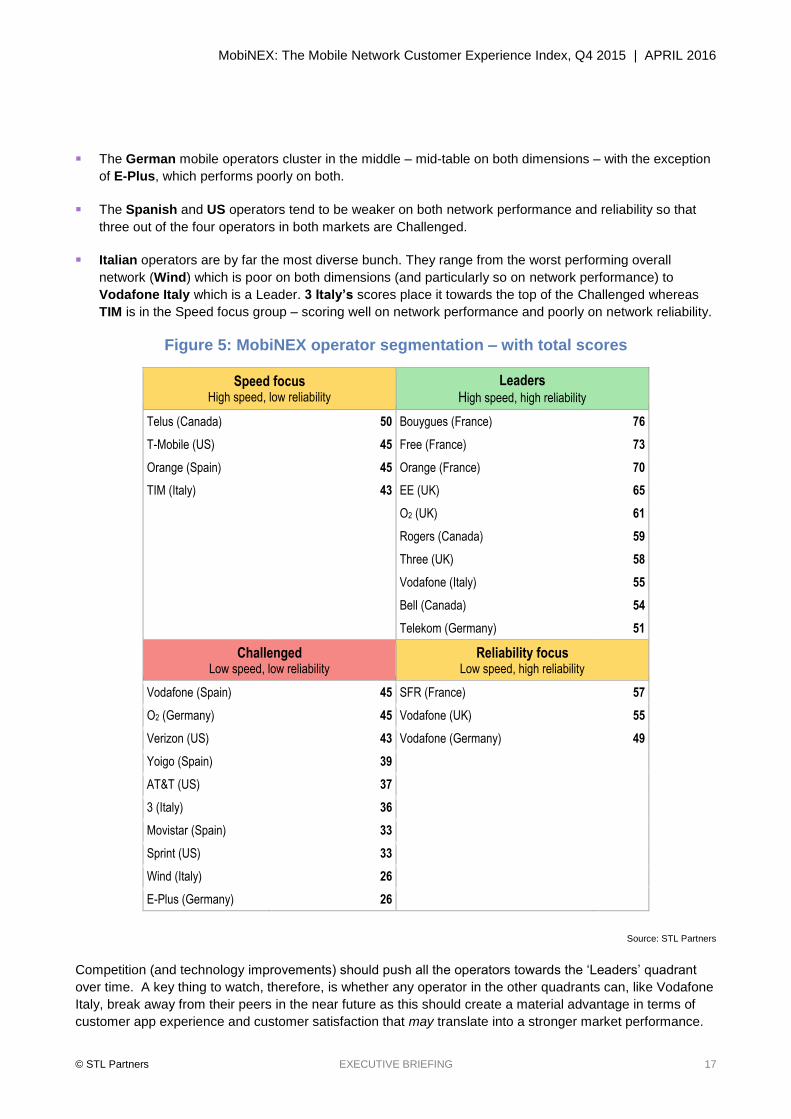
The German mobile operators cluster in the middle – mid-table on both dimensions – with the exception
of E-Plus, which performs poorly on both.
The Spanish and US operators tend to be weaker on both network performance and reliability so that
three out of the four operators in both markets are Challenged.
Italian operators are by far the most diverse bunch. They range from the worst performing overall
network (Wind) which is poor on both dimensions (and particularly so on network performance) to
Vodafone Italy which is a Leader. 3 Italy’s scores place it towards the top of the Challenged whereas
TIM is in the Speed focus group – scoring well on network performance and poorly on network reliability.
Figure 5: MobiNEX operator segmentation – with total scores
Speed focus High speed, low reliability
Leaders High speed, high reliability
Telus (Canada) 50 Bouygues (France) 76
T-Mobile (US) 45 Free (France) 73
Orange (Spain) 45 Orange (France) 70
TIM (Italy) 43 EE (UK) 65
O2 (UK) 61
Rogers (Canada) 59
Three (UK) 58
Vodafone (Italy) 55
Bell (Canada) 54
Telekom (Germany) 51
Challenged Low speed, low reliability
Reliability focus Low speed, high reliability
Vodafone (Spain) 45 SFR (France) 57
O2 (Germany) 45 Vodafone (UK) 55
Verizon (US) 43 Vodafone (Germany) 49
Yoigo (Spain) 39
AT&T (US) 37
3 (Italy) 36
Movistar (Spain) 33
Sprint (US) 33
Wind (Italy) 26
E-Plus (Germany) 26
Source: STL Partners
Competition (and technology improvements) should push all the operators towards the ‘Leaders’ quadrant
over time. A key thing to watch, therefore, is whether any operator in the other quadrants can, like Vodafone
Italy, break away from their peers in the near future as this should create a material advantage in terms of
customer app experience and customer satisfaction that may translate into a stronger market performance.

MobiNEX: The Mobile Network Customer Experience Index, Q4 2015 | APRIL 2016
© STL Partners EXECUTIVE BRIEFING 18
Error rate2
Quantitative analysis
Figure 6: Major Western markets – error rate per 10,000 requests
Source: Apteligent, STL Partners
2 A network reliability measure. The proportion of requests made by a customer using an application that experience an error. We
assign scores based on the operator’s error rate per 10,000 requests.
38
38
39
40
41
47
49
52
53
56
56
58
59
59
59
59
60
62
63
63
63
63
81
84
86
86
87
0 10 20 30 40 50 60 70 80 90 100
Bouygues FR
Vodafone UK
EE UK
O2 UK
Free FR
Orange ES
Orange FR
SFR FR
3 UK
Bell CA
Vodafone IT
Rogers CA
Telus CA
Yoigo ES
TIM IT
Vodafone DE
3 IT
Telekom DE
Wind IT
Movistar ES
O2 DE
Vodafone ES
AT&T US
T-Mobile US
E-Plus DE
Sprint US
Verizon US
Best
performer
Worst
performer

MobiNEX: The Mobile Network Customer Experience Index, Q4 2015 | APRIL 2016
© STL Partners EXECUTIVE BRIEFING 19
Figure 7: Major Western markets – average error rate per 10,000 requests
Source: Apteligent, STL Partners
Key findings
Error rate is indisputably a driver of customer experience: fewer errors make happier customers. And
although an error is not always the fault of the network operator - it could be an app coding issue for
example - different error rates between operators does indeed point to differences in network
performance.
On error rates, the twenty seven operators fall into four distinct tiers:
Bouygues and Free in France, and Vodafone, EE, and O2 in the UK, are far above the other
operators with 41 app errors or fewer per 10,000 requests.
Next comes Orange in Spain and the remaining French and UK players (Orange France, SFR,
and 3UK) all with between 47 and 53 errors per 10,000 requests.
Nearly half of all operators experience between 56 and 63 errors per 10,000 requests:
All the operators in Canada and Italy
All Spanish operators except Orange Spain (better than this)
All German operators except E-Plus (worse than this)
Finally, there is a big gap to the five worst performing players with error rates between 81 and 87: E-
Plus and the US players. As we already noted, the performance of the latter group is surprising
given the prevalence of LTE and the presence of Amazon and Google data centres, which host
many apps, in the US. This suggests there may be a common network-related issue with the US
operators – one that is independent of basic network technology since network errors are high on
both GSM and CDMA networks.
57
45
68
59
58
43
85
0 10 20 30 40 50 60 70 80 90
Canada
France
Germany
Italy
Spain
UK
USA

MobiNEX: The Mobile Network Customer Experience Index, Q4 2015 | APRIL 2016
© STL Partners EXECUTIVE BRIEFING 20
Latency consistency3: Requests with latency over 500ms
Quantitative analysis
Figure 8: Major Western operators – percentage of requests with total roundtrip latency greater than 500ms
Source: Apteligent, STL Partners
3 A network reliability measure. The proportion of requests made by the customer using an application that experience unacceptably
high-latency events. We assign scores based on the percentage of requests made that experience latency of greater than 500ms.
8%
9%
10%
11%
12%
12%
13%
15%
15%
15%
15%
15%
16%
17%
18%
18%
18%
18%
20%
21%
22%
22%
23%
23%
25%
25%
27%
0% 5% 10% 15% 20% 25% 30%
Bouygues FR
Free FR
Orange FR
SFR FR
O2 UK
EE UK
3 UK
Vodafone IT
Rogers CA
Vodafone DE
Telekom DE
T-Mobile US
O2 DE
Verizon US
Bell CA
Vodafone UK
Sprint US
AT&T US
Telus CA
Vodafone ES
TIM IT
Yoigo ES
Orange ES
E-Plus DE
3 IT
Movistar ES
Wind IT
Best
performer
Worst
performer
MobiNEX: The Mobile Network Customer Experience Index, Q4 2015 | APRIL 2016
© STL Partners EXECUTIVE BRIEFING 21
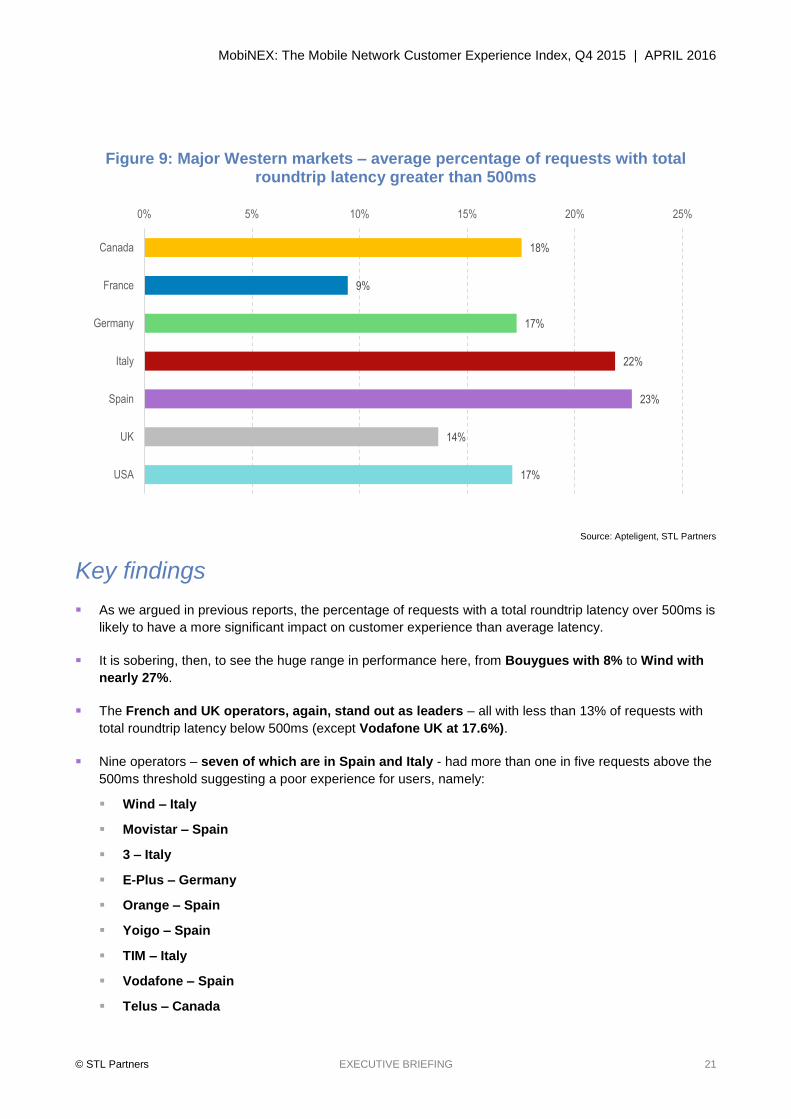
Figure 9: Major Western markets – average percentage of requests with total roundtrip latency greater than 500ms
Source: Apteligent, STL Partners
Key findings
As we argued in previous reports, the percentage of requests with a total roundtrip latency over 500ms is
likely to have a more significant impact on customer experience than average latency.
It is sobering, then, to see the huge range in performance here, from Bouygues with 8% to Wind with
nearly 27%.
The French and UK operators, again, stand out as leaders – all with less than 13% of requests with
total roundtrip latency below 500ms (except Vodafone UK at 17.6%).
Nine operators – seven of which are in Spain and Italy - had more than one in five requests above the
500ms threshold suggesting a poor experience for users, namely:
Wind – Italy
Movistar – Spain
3 – Italy
E-Plus – Germany
Orange – Spain
Yoigo – Spain
TIM – Italy
Vodafone – Spain
Telus – Canada
18%
9%
17%
22%
23%
14%
17%
0% 5% 10% 15% 20% 25%
Canada
France
Germany
Italy
Spain
UK
USA
MobiNEX: The Mobile Network Customer Experience Index, Q4 2015 | APRIL 2016
© STL Partners EXECUTIVE BRIEFING 22
Download speed4
Quantitative analysis
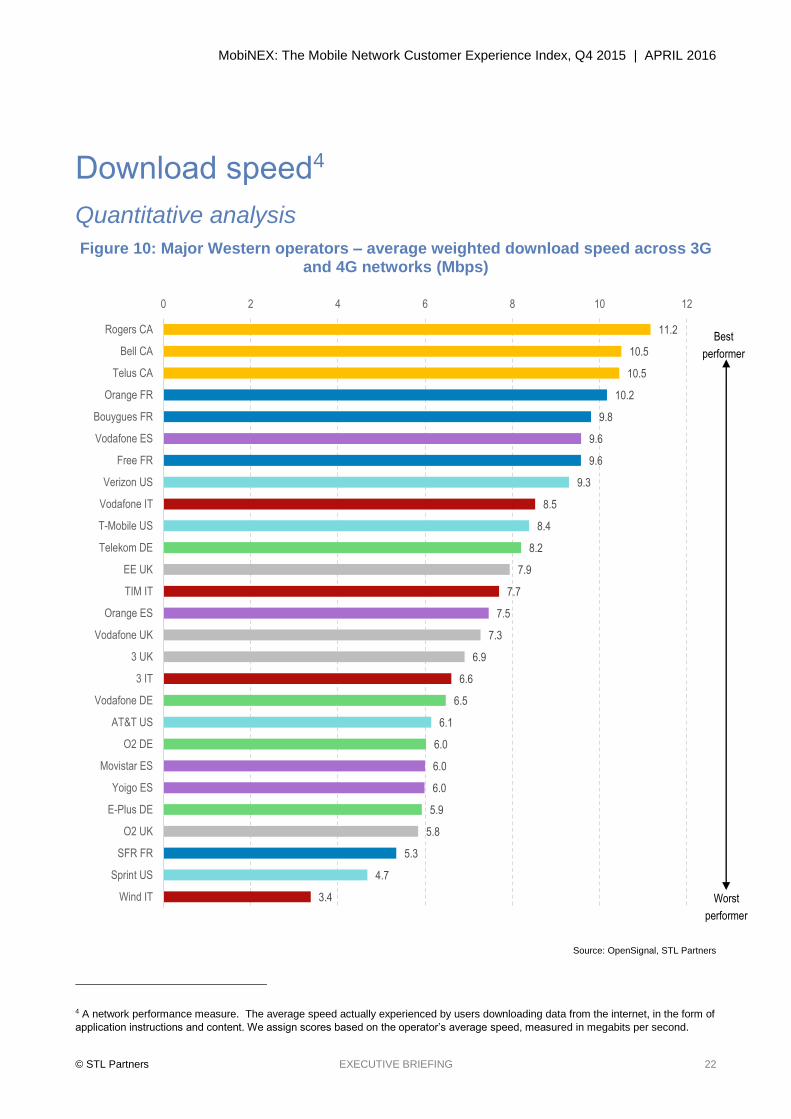
Figure 10: Major Western operators – average weighted download speed across 3G and 4G networks (Mbps)
Source: OpenSignal, STL Partners
4 A network performance measure. The average speed actually experienced by users downloading data from the internet, in the form of
application instructions and content. We assign scores based on the operator’s average speed, measured in megabits per second.
11.2
10.5
10.5
10.2
9.8
9.6
9.6
9.3
8.5
8.4
8.2
7.9
7.7
7.5
7.3
6.9
6.6
6.5
6.1
6.0
6.0
6.0
5.9
5.8
5.3
4.7
3.4
0 2 4 6 8 10 12
Rogers CA
Bell CA
Telus CA
Orange FR
Bouygues FR
Vodafone ES
Free FR
Verizon US
Vodafone IT
T-Mobile US
Telekom DE
EE UK
TIM IT
Orange ES
Vodafone UK
3 UK
3 IT
Vodafone DE
AT&T US
O2 DE
Movistar ES
Yoigo ES
E-Plus DE
O2 UK
SFR FR
Sprint US
Wind IT
Best
performer
Worst
performer
MobiNEX: The Mobile Network Customer Experience Index, Q4 2015 | APRIL 2016
© STL Partners EXECUTIVE BRIEFING 23
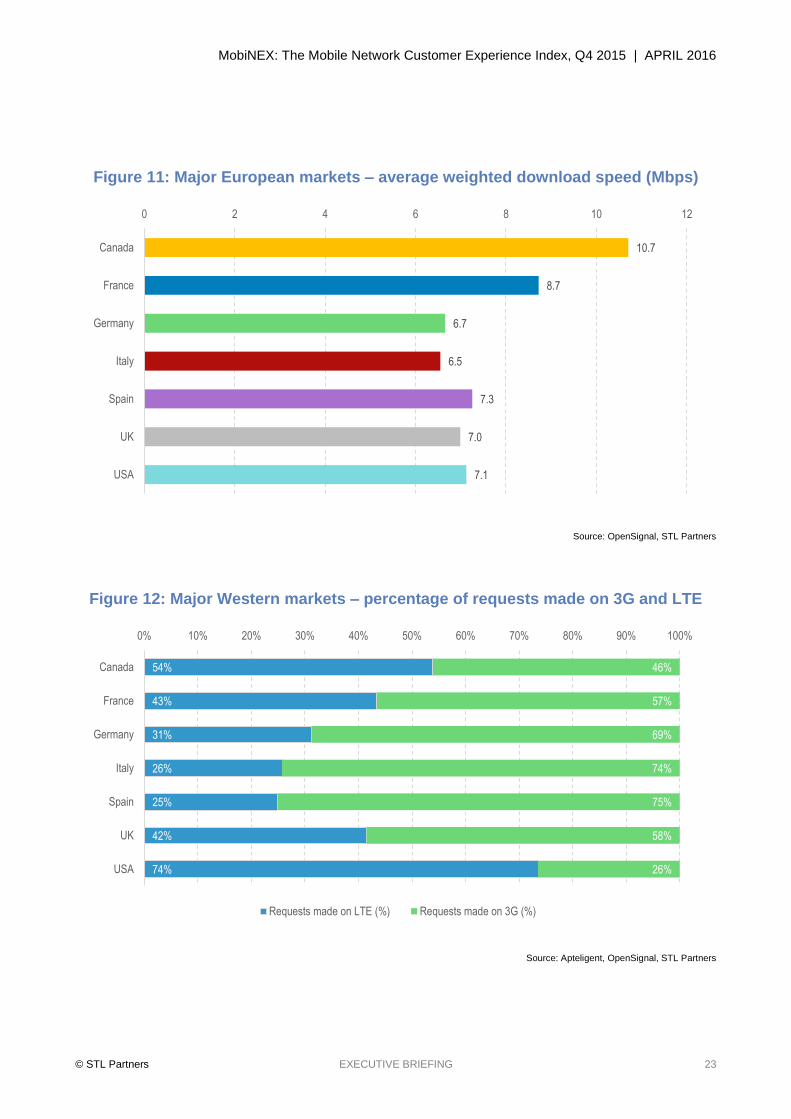
Figure 11: Major European markets – average weighted download speed (Mbps)
Source: OpenSignal, STL Partners
Figure 12: Major Western markets – percentage of requests made on 3G and LTE
Source: Apteligent, OpenSignal, STL Partners
10.7
8.7
6.7
6.5
7.3
7.0
7.1
0 2 4 6 8 10 12
Canada
France
Germany
Italy
Spain
UK
USA
54%
43%
31%
26%
25%
42%
74%
46%
57%
69%
74%
75%
58%
26%
0% 10% 20% 30% 40% 50% 60% 70% 80% 90% 100%
Canada
France
Germany
Italy
Spain
UK
USA
Requests made on LTE (%) Requests made on 3G (%)
MobiNEX: The Mobile Network Customer Experience Index, Q4 2015 | APRIL 2016
© STL Partners EXECUTIVE BRIEFING 24
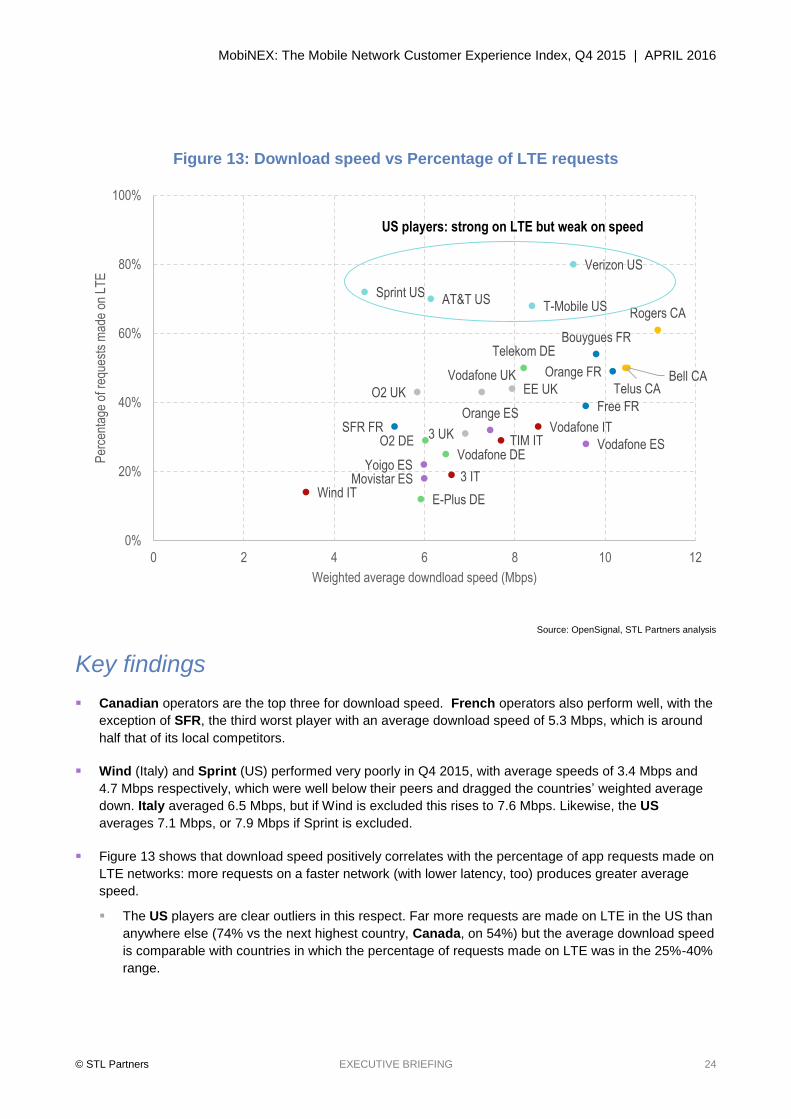
Figure 13: Download speed vs Percentage of LTE requests
Source: OpenSignal, STL Partners analysis
Key findings
Canadian operators are the top three for download speed. French operators also perform well, with the
exception of SFR, the third worst player with an average download speed of 5.3 Mbps, which is around
half that of its local competitors.
Wind (Italy) and Sprint (US) performed very poorly in Q4 2015, with average speeds of 3.4 Mbps and
4.7 Mbps respectively, which were well below their peers and dragged the countries’ weighted average
down. Italy averaged 6.5 Mbps, but if Wind is excluded this rises to 7.6 Mbps. Likewise, the US
averages 7.1 Mbps, or 7.9 Mbps if Sprint is excluded.
Figure 13 shows that download speed positively correlates with the percentage of app requests made on
LTE networks: more requests on a faster network (with lower latency, too) produces greater average
speed.
The US players are clear outliers in this respect. Far more requests are made on LTE in the US than
anywhere else (74% vs the next highest country, Canada, on 54%) but the average download speed
is comparable with countries in which the percentage of requests made on LTE was in the 25%-40%
range.
Bell CA
Rogers CA
Telus CA
Bouygues FR
Free FR
Orange FR
SFR FR
E-Plus DE
O2 DE
Telekom DE
Vodafone DE
3 IT
TIM ITVodafone IT
Wind ITMovistar ES
Orange ES
Vodafone ES
Yoigo ES
3 UK
EE UKO2 UK
Vodafone UK
AT&T USSprint US
T-Mobile US
Verizon US
0%
20%
40%
60%
80%
100%
0 2 4 6 8 10 12
Per
cent
age
of r
eque
sts
mad
e on
LT
E
Weighted average downdload speed (Mbps)
US players: strong on LTE but weak on speed

MobiNEX: The Mobile Network Customer Experience Index, Q4 2015 | APRIL 2016
© STL Partners EXECUTIVE BRIEFING 25
Average latency5
Quantitative analysis
Figure 14: Major Western operators – average total roundtrip latency (ms)
Source: Apteligent, STL Partners
5 A network performance measure. The average amount of time taken from the customer taking an action on a device until they receive
a response back from the application. Scores are assigned based on an operator’s average ‘total roundtrip latency’ in milliseconds
201
214
225
245
246
247
254
296
296
303
305
307
310
313
315
318
324
328
336
350
350
350
354
369
375
389
393
0 50 100 150 200 250 300 350 400 450
Bouygues FR
Free FR
Orange FR
O2 UK
SFR FR
EE UK
3 UK
T-Mobile US
Vodafone IT
Rogers CA
Vodafone DE
Telekom DE
Vodafone UK
O2 DE
Verizon US
Sprint US
Bell CA
AT&T US
Telus CA
TIM IT
Vodafone ES
Orange ES
Yoigo ES
3 IT
Movistar ES
Wind IT
E-Plus DE
Best
performer
Worst
performer
MobiNEX: The Mobile Network Customer Experience Index, Q4 2015 | APRIL 2016
© STL Partners EXECUTIVE BRIEFING 26
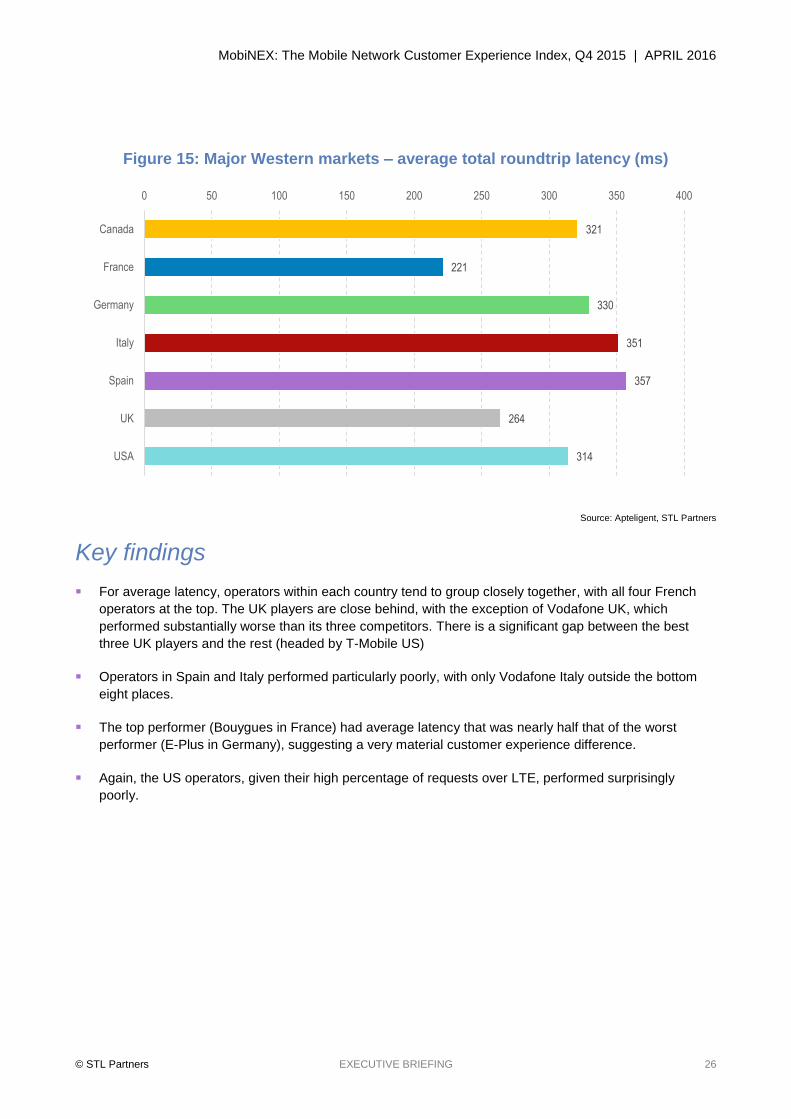
Figure 15: Major Western markets – average total roundtrip latency (ms)
Source: Apteligent, STL Partners
Key findings
For average latency, operators within each country tend to group closely together, with all four French
operators at the top. The UK players are close behind, with the exception of Vodafone UK, which
performed substantially worse than its three competitors. There is a significant gap between the best
three UK players and the rest (headed by T-Mobile US)
Operators in Spain and Italy performed particularly poorly, with only Vodafone Italy outside the bottom
eight places.
The top performer (Bouygues in France) had average latency that was nearly half that of the worst
performer (E-Plus in Germany), suggesting a very material customer experience difference.
Again, the US operators, given their high percentage of requests over LTE, performed surprisingly
poorly.
321
221
330
351
357
264
314
0 50 100 150 200 250 300 350 400
Canada
France
Germany
Italy
Spain
UK
USA
MobiNEX: The Mobile Network Customer Experience Index, Q4 2015 | APRIL 2016
© STL Partners EXECUTIVE BRIEFING 27
Appendix: Source data and methodology
Our partner Apteligent (formerly Crittercism) collects a wide variety of analytics data through code embedded
in thousands of mobile apps used by hundreds of millions of people around the world in their every-day lives
and work. To date, the primary purpose of the data has been to help app developers make better apps. In
our two previous reports, we worked with Apteligent to produce further insights from the data to serve the
global community of mobile operators.
For this report Apteligent has provided a data-set containing information on the performance of twenty-seven
major operators (the top three or four by market share) in seven major Western markets (Canada, France,
Germany, Italy, the United Kingdom, and the United States) over a fourteen-week period beginning on 28th
September 2015. The data-set includes:
1. Average total roundtrip network latency experienced at the application layer6, in milliseconds (ms). which
we use to calculate our “latency” score
2. The percentage of network requests with a roundtrip time of over 500ms7, which we use to calculate our
“latency consistency” score
3. The percentage of requests made over which resulted in application errors, which we use to calculate
our “error rate” score.
In a similar vein, the British company OpenSignal crowdsources data on mobile carrier signal quality from
users of its consumer app. In return for sharing data on signal strength, data upload/download speed and
reliability, app users are pointed towards better signal and WiFi hotspots, and provided with colour-coded
coverage maps. In addition, OpenSignal's NetworkRank service provides data on the comparative
performance of different carriers in specific regions.
From OpenSignal's public information, we have compiled a data-set which includes the following information
for each of the twenty-seven operators:
4. Average download speed experienced on different network types, in megabits per second (Mbps)
5. Time spent on 2G/3G/4G networks. This allows us to calculate a weighted average of the download speed experienced by customers on specific
carriers, which we use to calculate our “download speed” score.
For each of the four measures, STL Partners has identified a “top performance” and “low performance”
benchmark, which is used to assign each operator an indexed score out of twenty-five. Combined, these add
up to a theoretical total score out of 100.
6 A detailed explanation of the value of using actual application latency data is available in Mobile App Latency in Europe: French
Operators Lead; Italian & Spanish Lag, p. 7. 7 500ms was chosen as the cut-off point based on our belief that a delay of more than this is likely to impact mobile users negatively.
For more information see Mobile App Latency in Europe: French Operators Lead; Italian & Spanish Lag, p. 8.

MobiNEX: The Mobile Network Customer Experience Index, Q4 2015 | APRIL 2016
© STL Partners EXECUTIVE BRIEFING 28
Figure 16: MobiNEX benchmarks
Measure Raw data used Global leader ‘Top performance’ benchmark
(scores 25/25)
‘Low performance’ benchmark
(scores 0/25)
Error rate Error rate per 10,000 requests
36 (Korea Telecom,
South Korea)
25 100
Latency consistency
Requests with total roundtrip latency over
500ms, %
1.70% (NTT Docomo,
Japan)
1.70% 30%
Download speed Weighted average download speed,
Mbps
38Mbps (Starhub, Singapore)
15.0 Mbps 2.0 Mbps
Average latency Average Latency, ms 142ms (NTT Docomo,
Japan)
142 ms 500 ms
When assigning the benchmarks, we looked at the performance of the best (usually in South Korea or
Japan) and worst operators across the globe as well as identifying a theoretical ‘best practise’ in which all
but the most demanding customers would be satisfied. For example, for “download speed”, we chose 15
Mbps as warranting a top score of 25 rather than the 38 Mbps achieved by Starhub in Singapore:
MobiNEX: The Mobile Network Customer Experience Index, Q4 2015 | APRIL 2016
© STL Partners EXECUTIVE BRIEFING 29
STL Partners and Telco 2.0: Change the Game
STL Partners delivers original and strategic research, consulting and advisory services for telecoms,
technology and media businesses that seek transformational success in the digital economy. It:
Helps clients create opportunities, make new connections, deal with threats, and drive strategy, plans
and effective actions.
Specialises in changing business models, driving innovation and growth, and is the team behind ‘Telco
2.0’ – the leading visionary benchmark for success in Telecoms.
Key practice areas include: Transformation; Disruptive Strategies in Communications, Content and
Commerce; Cloud and Enterprise ICT; and Future Networks.
To get involved, please call +44 (0) 247 5003 or email [email protected] to engage with us through:
STL Partners Research, which includes the Telco 2.0 Executive Briefing Service, in-depth streams on
the key practice areas, and the widely read Telco 2.0 industry blog and newsletter
Bespoke Consulting and analytical services, typically helping clients evaluate opportunities, develop new
propositions and business models, and develop ‘go to market’ strategies.
Expert and interactive support for specific engagements with key market contacts and new connections.
MobiNEX: The Mobile Network Customer Experience Index, Q4 2015 | APRIL 2016
© STL Partners EXECUTIVE BRIEFING 30
About Apteligent
Founded in 2011, Apteligent helps organizations improve, optimize, and monetize their mobile apps – by
delivering real Mobile App Intelligence. Delivering real-time insights from both operational and end-user
behavioral data, Apteligent is incorporated into >23,000 apps with over 100 billion monthly app launches
across 120 countries, spanning industries and use cases. Trusted by 3 of the top 5 credit card issuers, 3 of
the top 5 media companies, 3 of the top 5 retailers, and 2 of the top 3 hotel chains with the success of their
strategic mobile app initiatives, Apteligent fully supports iOS, Android, Windows 10, and Hybrid app
platforms across all popular devices.
Apteligent has become one of the primary sources for impartial, real-time statistical data on the mobile eco-
system including device performance, carrier network performance, OS/App crash and error rates and a
wealth of additional data. Working with some of the leading analyst and media firms, Apteligent data has
been cited in reports by Business Insider, CNN, Fox News, Le Figaro, and Yahoo News, among other
notable news organizations. With Network Operations Centers in both the US and Germany (for EU
subscribers), Apteligent fully adheres to the strict EU privacy standards – all user data is kept fully
anonymous and is never sold for advertising or other commercial use.
For more information on Apteligent Mobile App Intelligence please visit www.apteligent.com
For more information on Apteligent data and statistics please visit www.data.apteligent.com


![Customer Retention [Infographic] Customer Experience](https://img.pdfslide.us/doc/110x75/55b6dceebb61eb0c598b46c8/customer-retention-infographic-customer-experience.jpg)