Embed Size (px)
Citation preview
Mobility Patterns through Mobile Appfor Public Transport Users
José Gonçalo Simões Rodrigues
Thesis to obtain the Master of Science Degree in
Information Systems and Computer Engineering
Supervisor: Prof. Alberto Manuel Ramos da Cunha
Examination Committee
Chairperson: Prof. Miguel Nuno Dias Alves Pupo CorreiaSupervisor: Prof. Alberto Manuel Ramos da Cunha
Member of the Committee: Prof. Miguel Filipe Leitão Pardal
May 2018

ii

Special thanks are given to Ana Maximo for ensuring that this work was realized trough its
entirety.
iii

iv

Acknowledgments
The author would like to complement for the participation and help in developing this work, Ana
Maximo, Miguel Guerra, Pedro Arvela, Andre Aparicio, as well as Engenheiro Joao Almeida
for his input during development of the work, Professor Miguel Pardal for giving special insight
into possible improvements to the initial concept of the work, and Professor Alberto Cunha for
helping guide and develop this work.
v

vi
Resumo
Na atualidade dos sistema de transportes estes sao cada vez mais dependentes da capacidade de
oferecer uma experiencia rapida e fluida aos seus utilizadores de uma forma eficaz e nao restritiva.
Para fornecer este genero de experiencia e necessario observar e obter informacao que seja capaz
de facilitar a interacao entre o utilizador e o operador de transportes. De forma a facilitar esta
transmisao de informacao, este trabalho ira demonstrar na forma de uma aplicacao escrita para o
sistema Android que e possıvel criar um sistema capaz de obter informacao baseada em padroes
de mobilidade de um utilizador de transportes publicos, com o intuito de ajudar a melhorar o
processo de interaccao entre o operador e o utilizador. Esta solucao ira focar-se em oferecer um
sistema de baixo custo para os operadores, de facil implementacao nos sistemas pre-existentes,
e que facilite a obtencao da informacao por parte dos seus utilizadores.
Palavras-chave: Padroes de Mobilidade, Sistemas de Transporte, Transparencia, Nao
Intrusivo, Smartphone
vii

viii
Abstract
Today’s transportation systems rely more and more on the ability to offer a quick and nonre-
strictive experience to their users. To allow for such an experience the need to make available
relevant information to be utilized to facilitate the interaction of user and operator, must to be
observed. In order to facilitate this transaction of information, this work will shows in the form
of an Android application, that it is possible to create a system capable of gathering information
about the mobility patterns of a public transportation user with the intent of improving the de-
cision making process both users and operators make when interacting. This solution will focus
on offering a low cost system to operators that is easy to implement on their existing systems,
and seamless in the form it gathers information from the users.
Keywords: Mobility Patterns, Transportation System, Seamless, Transparent, Smart-
phone
ix

x
Contents
Acknowledgments . . . . . . . . . . . . . . . . . . . . . . . . . . . . . . . . . . . . . . . v
Resumo . . . . . . . . . . . . . . . . . . . . . . . . . . . . . . . . . . . . . . . . . . . . vii
Abstract . . . . . . . . . . . . . . . . . . . . . . . . . . . . . . . . . . . . . . . . . . . . ix
List of Tables . . . . . . . . . . . . . . . . . . . . . . . . . . . . . . . . . . . . . . . . . xv
List of Figures . . . . . . . . . . . . . . . . . . . . . . . . . . . . . . . . . . . . . . . . xvii
Acronyms . . . . . . . . . . . . . . . . . . . . . . . . . . . . . . . . . . . . . . . . . . . xix
Glossary . . . . . . . . . . . . . . . . . . . . . . . . . . . . . . . . . . . . . . . . . . . . 1
1 Introduction 1
1.1 Motivation . . . . . . . . . . . . . . . . . . . . . . . . . . . . . . . . . . . . . . . 2
1.2 Concept Overview . . . . . . . . . . . . . . . . . . . . . . . . . . . . . . . . . . . 3
1.3 Objectives . . . . . . . . . . . . . . . . . . . . . . . . . . . . . . . . . . . . . . . . 4
1.3.1 Requirements . . . . . . . . . . . . . . . . . . . . . . . . . . . . . . . . . . 4
1.4 Thesis Outline . . . . . . . . . . . . . . . . . . . . . . . . . . . . . . . . . . . . . 5
2 State of the Art 7
2.1 Tracking . . . . . . . . . . . . . . . . . . . . . . . . . . . . . . . . . . . . . . . . . 7
2.1.1 Tracking Methods . . . . . . . . . . . . . . . . . . . . . . . . . . . . . . . 8
2.1.2 Tracking Technologies . . . . . . . . . . . . . . . . . . . . . . . . . . . . . 8
2.1.3 Tracking Auxiliaries . . . . . . . . . . . . . . . . . . . . . . . . . . . . . . 12
2.2 Related Work . . . . . . . . . . . . . . . . . . . . . . . . . . . . . . . . . . . . . . 13
2.2.1 Mobility Agents: Guiding and tracking public transportation users . . . . 13
2.2.2 Learning and inferring transportation routines . . . . . . . . . . . . . . . 14
2.2.3 Performance evaluation of UHF RFID technologies for real-time passenger
recognition in intelligent public transportation systems . . . . . . . . . . . 14
2.2.4 Exploring ticketing approaches using mobile technologies: QR Codes,
NFC and BLE . . . . . . . . . . . . . . . . . . . . . . . . . . . . . . . . . 15
xi
2.2.5 Understanding individual and collective mobility patterns from smart card
records: A case study in Shenzhen . . . . . . . . . . . . . . . . . . . . . . 16
2.2.6 IoT Middleware for Precision Agriculture - Agricultural Labor Monitoring
for Specialty Crops . . . . . . . . . . . . . . . . . . . . . . . . . . . . . . . 16
2.2.7 Using Mobile Phones to Determine Transportation Modes . . . . . . . . . 17
2.2.8 My Mobile Assistant . . . . . . . . . . . . . . . . . . . . . . . . . . . . . . 17
2.2.9 Predicting the Location of Mobile Users: A Machine Learning Approach . 18
2.2.10 Considerations . . . . . . . . . . . . . . . . . . . . . . . . . . . . . . . . . 18
2.3 Summary . . . . . . . . . . . . . . . . . . . . . . . . . . . . . . . . . . . . . . . . 20
3 Architecture 21
3.1 Use Case . . . . . . . . . . . . . . . . . . . . . . . . . . . . . . . . . . . . . . . . 21
3.2 Architecture Overview . . . . . . . . . . . . . . . . . . . . . . . . . . . . . . . . . 24
3.2.1 Data Gathering . . . . . . . . . . . . . . . . . . . . . . . . . . . . . . . . . 25
3.2.2 Mobility Patterns (MP) Determination . . . . . . . . . . . . . . . . . . . . 28
3.2.3 MP Visualization . . . . . . . . . . . . . . . . . . . . . . . . . . . . . . . . 30
3.3 Manager . . . . . . . . . . . . . . . . . . . . . . . . . . . . . . . . . . . . . . . . . 30
3.4 Summary . . . . . . . . . . . . . . . . . . . . . . . . . . . . . . . . . . . . . . . . 31
4 Implementation 33
4.1 Data Gathering . . . . . . . . . . . . . . . . . . . . . . . . . . . . . . . . . . . . . 33
4.2 Data Annotation . . . . . . . . . . . . . . . . . . . . . . . . . . . . . . . . . . . . 34
4.3 Mobility Pattern Modules . . . . . . . . . . . . . . . . . . . . . . . . . . . . . . . 36
4.3.1 Activity Module . . . . . . . . . . . . . . . . . . . . . . . . . . . . . . . . 36
4.3.2 Location Module . . . . . . . . . . . . . . . . . . . . . . . . . . . . . . . . 37
4.3.3 WiFi Module . . . . . . . . . . . . . . . . . . . . . . . . . . . . . . . . . . 38
4.3.4 Bluetooth Module . . . . . . . . . . . . . . . . . . . . . . . . . . . . . . . 38
4.4 Data Processing . . . . . . . . . . . . . . . . . . . . . . . . . . . . . . . . . . . . 39
4.5 Database . . . . . . . . . . . . . . . . . . . . . . . . . . . . . . . . . . . . . . . . 40
4.6 Accumulator . . . . . . . . . . . . . . . . . . . . . . . . . . . . . . . . . . . . . . 41
4.6.1 Accumulator Implementation . . . . . . . . . . . . . . . . . . . . . . . . . 42
4.7 Personal Assistant of a TransporTation Environment Reflecting Natural-use (PATTERN)
Manager . . . . . . . . . . . . . . . . . . . . . . . . . . . . . . . . . . . . . . . . . 42
4.8 Data Analysis . . . . . . . . . . . . . . . . . . . . . . . . . . . . . . . . . . . . . . 43
4.9 Data Visualization . . . . . . . . . . . . . . . . . . . . . . . . . . . . . . . . . . . 44
xii
4.10 Difficulties Faced . . . . . . . . . . . . . . . . . . . . . . . . . . . . . . . . . . . . 45
4.11 Limitations . . . . . . . . . . . . . . . . . . . . . . . . . . . . . . . . . . . . . . . 46
4.12 Summary . . . . . . . . . . . . . . . . . . . . . . . . . . . . . . . . . . . . . . . . 48
5 Evaluation 49
5.1 Evaluation Methodology . . . . . . . . . . . . . . . . . . . . . . . . . . . . . . . . 49
5.2 Test Methodology . . . . . . . . . . . . . . . . . . . . . . . . . . . . . . . . . . . 51
5.2.1 Data Tagging Tests . . . . . . . . . . . . . . . . . . . . . . . . . . . . . . . 51
5.2.2 Data Analysis Tests . . . . . . . . . . . . . . . . . . . . . . . . . . . . . . 51
5.3 Observed Results . . . . . . . . . . . . . . . . . . . . . . . . . . . . . . . . . . . . 53
5.3.1 Battery Performance . . . . . . . . . . . . . . . . . . . . . . . . . . . . . . 53
5.3.2 Accuracy of gathered Data . . . . . . . . . . . . . . . . . . . . . . . . . . 54
5.3.3 Test Device and Environment . . . . . . . . . . . . . . . . . . . . . . . . . 55
5.3.4 Test Limitations . . . . . . . . . . . . . . . . . . . . . . . . . . . . . . . . 56
5.4 Summary . . . . . . . . . . . . . . . . . . . . . . . . . . . . . . . . . . . . . . . . 56
6 Conclusions 59
6.1 Achievements . . . . . . . . . . . . . . . . . . . . . . . . . . . . . . . . . . . . . . 59
6.2 Future Work . . . . . . . . . . . . . . . . . . . . . . . . . . . . . . . . . . . . . . 60
Bibliography 61
A Additional Figures 67
A.1 Weka Generated Decision Tree . . . . . . . . . . . . . . . . . . . . . . . . . . . . 67
A.2 High Accuracy Journey Capture Example . . . . . . . . . . . . . . . . . . . . . . 68
A.3 Battery Saving Journey Capture Example . . . . . . . . . . . . . . . . . . . . . . 69
B Sample Files 71
B.1 JSON Data Tag Sample File . . . . . . . . . . . . . . . . . . . . . . . . . . . . . 71
B.2 Sample Database export file #1 . . . . . . . . . . . . . . . . . . . . . . . . . . . . 75
B.3 Sample Database export file 2 . . . . . . . . . . . . . . . . . . . . . . . . . . . . . 76
xiii

xiv
List of Tables
2.1 General Technology Breakdown. Location Acquisition Resolution (LAR) is mea-
sured in meters (m). . . . . . . . . . . . . . . . . . . . . . . . . . . . . . . . . . . 19
4.1 Data Tagging UAC’s . . . . . . . . . . . . . . . . . . . . . . . . . . . . . . . . . . 35
4.2 Captured User Activities . . . . . . . . . . . . . . . . . . . . . . . . . . . . . . . . 36
4.3 Decision Tree Inputs . . . . . . . . . . . . . . . . . . . . . . . . . . . . . . . . . . 40
4.4 Decision Tree Outputs . . . . . . . . . . . . . . . . . . . . . . . . . . . . . . . . . 40
4.5 Database organization . . . . . . . . . . . . . . . . . . . . . . . . . . . . . . . . . 41
4.6 Target Operator Domain Information . . . . . . . . . . . . . . . . . . . . . . . . 41
5.1 Result Classification Table . . . . . . . . . . . . . . . . . . . . . . . . . . . . . . . 49
5.2 Test Device Specifications (OnePlus 3T) . . . . . . . . . . . . . . . . . . . . . . . 56
5.3 Test details . . . . . . . . . . . . . . . . . . . . . . . . . . . . . . . . . . . . . . . 56
xv

xvi
List of Figures
3.1 Transport Environment Interaction . . . . . . . . . . . . . . . . . . . . . . . . . . 22
3.2 Transport interaction use case . . . . . . . . . . . . . . . . . . . . . . . . . . . . . 24
3.3 Application System Layers . . . . . . . . . . . . . . . . . . . . . . . . . . . . . . . 25
3.4 Data Flow . . . . . . . . . . . . . . . . . . . . . . . . . . . . . . . . . . . . . . . . 28
3.5 Example of a generated decision tree . . . . . . . . . . . . . . . . . . . . . . . . . 29
3.6 Representation of mobility pattern visualization . . . . . . . . . . . . . . . . . . . 30
3.7 Manager Data Interaction . . . . . . . . . . . . . . . . . . . . . . . . . . . . . . . 31
4.1 Internal Module Interactions . . . . . . . . . . . . . . . . . . . . . . . . . . . . . 34
4.2 Data Collection and Tag Screenshot . . . . . . . . . . . . . . . . . . . . . . . . . 35
4.3 Tagged Data Process . . . . . . . . . . . . . . . . . . . . . . . . . . . . . . . . . . 39
4.4 Data Analysis Interaction . . . . . . . . . . . . . . . . . . . . . . . . . . . . . . . 44
4.5 Data Visualization Construction . . . . . . . . . . . . . . . . . . . . . . . . . . . 44
4.6 Final Decision Tree . . . . . . . . . . . . . . . . . . . . . . . . . . . . . . . . . . . 45
5.1 Battery Autonomy per Portion of Journey completed . . . . . . . . . . . . . . . . 53
5.2 Battery Drain per Minute . . . . . . . . . . . . . . . . . . . . . . . . . . . . . . . 54
A.1 Weka Generated Decision Tree . . . . . . . . . . . . . . . . . . . . . . . . . . . . 67
A.2 Journey High Accuracy Policy . . . . . . . . . . . . . . . . . . . . . . . . . . . . 68
A.3 Journey Battery Saving Policy . . . . . . . . . . . . . . . . . . . . . . . . . . . . 69
xvii

xviii
Acronyms
BB BlueTooth Beacon
BLE BlueTooth Low Energy
BT BlueTooth
CARD4B Card4B Systems, S.A.
CS Crowd Sensing
CV Computer Vision
DG Data Gathering
DM Data Mining
DR Dead Reckoning
EM Electromagnetic
GPS Global Positioning System
GSM Global System for Mobile Communications
LAR Location Acquisition Resolution
ML Machine Learning
MP Mobility Patterns
MPM Mobility Pattern Module
NFC Near-Field Communication
PATTERN Personal Assistant of a TransporTation Environment Reflecting Natural-use
PTS Public Transportation System
xix
PTSN Public Transportation System (PTS) Network
QR Quick Response
RFID Radio-Frequency Identification
UAC User Activity Context
WiFi Wireless Fidelity
WiFi−AP Wireless Fidelity (WiFi) - Access Point
WiFi−D WiFi - Direct
xx
Chapter 1
Introduction
Due to user expectations on the value of a reliable and effective Public Transportation environ-
ment, a major necessity always exists to ensure the optimization of resources available to the
operator of a PTS. This factor can prove to be the defining difference that helps users choose
with what PTS they will engage with. In order to improve on this optimization of resources, an
operator needs to make informed decisions on how to accomplish this resource management.
While the traditional methods that are employed to obtain information about resource use
in a PTS often rely on first-hand accounts from the PTS workers, or from user feedback to
inform the decision making of the PTS operator, such means of communication may prove not
to have a sufficiently quick response time for the PTS operator to react in real-time to this in-
formation. This concern is not limited to the PTS domain, as some large tech companies, often
employ real-time user tracking in order to improve user interaction, and increase their margin
of profit [Goo16].
User tracking can be used to follow this principle and help PTS operators improve on their
service. The form in which users are engaging with their transportation yields important results
that an operator can use to improve how and when their resources are being deployed, and
attract more users.
With this in mind, this work will show how a reliable low cost system can facilitate the exchange
of information concerning user engagement and interaction with the PTS, between users and
operators, in which said solution is both as invisible to the user as possible, and as close to
real-time data acquisition as possible in order for the operator to understand how its resources
are being used.
1
1.1 Motivation
As a general trend the number of public transportation users has been increasing at a constant
rate in the European Union, and is expected that this growth will not slow down in the near
future [UIT16].
With this increase in trips PTSs are expected to handle the demanding requirements users im-
pose on the offer of wide reaching and on-schedule transportation [PBM+06]. To answer this
need made by the users of PTSs, one methodology that can be employed is to ensure that the
service maintains or improves upon its current resource management capabilities, in order to
assure transportation is both available and on time to the growing number of users.
In comparison, research into other areas of a PTS operation has been done to try and im-
prove on the ability to offer a more streamlined and fast experience to users (such as attempting
to improve user authentication when entering a PTS). While these could partially mitigate
the requirement of user tracking by directly improving on the usability the user experiences,
they do not help an operator to better understand how to manage their own resources, and
will at best mitigate the underlying problem of resource management. An example of such an
optimization is the improvement in how user authentication can be realized to offer a more user
friendly approach via the utilization of a smartphone as the authentication method rather than
the traditional ”tokens” associated with public transportation [CLCG15, Par15].
By analyzing the currently available spectrum of technological advances in PTS (further detailed
in Section 2.2), an understanding arrives that most improvements have not tried to analyze user
tracking and the patterns they generate to optimize the operation of a PTS and by consequence
improve the experience of users.
As such, in order to facilitate and empower the ability for a PTS operator to manage their
resources based on data, there exists a need for a solution that facilitates the exchange of in-
formation about how users interact with a PTS. In order to accomplish this, the tracking of a
users mobility pattern needs to be realized. The acquisition of these patterns, representing how
a user interacts with their mobility, increase the ease that an operator has in modulating their
resources via an informed decision making process and ultimately help to meet the requirements
users expect.
At the same time by also making this information available to the user, allowing for an empow-
erment of how users choose to interact with the PTS by having access to this information.
2
1.2 Concept Overview
A great deal of attention should be given by the operator to the mobility pattern their users
generate. In an effort to better understand these patterns, the following information should be
kept in mind:
Mobility Patterns (MP)
Are sets of data that directly represent the patterns of movements realized by individuals,
generated on a given trip from a point A to a point B during an interval of time.
These patterns can be highly reflective of the habits a user has in his respective mobility periods
during normal daily activities. While studies [GHB08] have shown that human MP are somewhat
reliable over a sufficiently large time, when analyzing various trajectories, some variations can
be detected that relate to variables in the transportation environment that affect a trip, such as
price, time, average delay, and unexpected events.
These deviations however do not have a significant impact in the long term perspective of a MP
[GHB08].
Human MP, can then be used to greatly help improve upon existing systems or infrastructures
by taking into consideration the natural movements and paths taken by the general population,
creating a system that works with human MP in mind, instead of forcing its design on people.
Data Analysis
While retaining MP information about a PTS enables a level of insight into how the PTS is
used, it does not by itself allow for a fully informed change on how to better adapt the PTS
by the operator. For this goal, the collected data must be analyzed to determine optimization
opportunities.
As such, there is a need to facilitate the retrieval of MP information in order to fuel this decision
making process. This aspect will not be the focus of this work, but does represent an important
part on any future work based on this project.
PTS Network (PTSN)
A PTSN is a network consisting of various public transportation systems. These reflect a num-
ber of possible transportation formats, and possible trajectories a PTS user can realize. While
most PTSN operators do in fact only employ one type of transportation, it should still be kept
in consideration that users do not.
3
It should also be noted that in some PTSN there is a form of ticketing system implemented capa-
ble of denying the service to any potentially unintended user. However this work does not take
into account possible forms to implement (or augment if already present) said systems, and will
instead only consider utilizing any possible form of user authentication currently implemented,
as a tool to better understand the MP generated by users.
1.3 Objectives
The developed work took place at Card4B Systems, S.A. (CARD4B) from 2016 to 2018, in order
to formulate a solution for seamless user tracking in a PTSN. With the creation of a simplified
prototype built as an Android application, that is minimal in its impact on the preexisting
infrastructure used by a PTSN operator, and the user, therefore showcasing the potential of the
developed work.
The main objective is to prove that through the use of the proposed system, the operator is
allowed a more seamless ability to easily inspect their user’s mobility patterns in a way that is
seamless to the users of said PTSN. In parallel, the developed work also intends to allow a user
to keep track of their mobility patterns inside a PTS, so they might become more informed in
how they choose to interact with their own mobility.
1.3.1 Requirements
As explained in the previous sections detailing the objectives and motivations for this work, the
requirements can be defined as a set of functional requirements:
• A form of detecting when a user starts using a PTSN.
• A form of detecting what trajectory a user has realized.
• Detecting when a user has initialized and terminated an interaction with the PTSN.
And technological requirements:
• The use of an Android system module that will serve as the main form of tracking a PTSN
user’s mobility.
• The acquisition of information that enables the extraction of relevant information from
the data captured by the application.
4

1.4 Thesis Outline
The rest of this document is organized as follows.
Chapter 2 focuses on analyzing the current state of technologies and previously realized works
that relate to the acquisition or tracking of users in a urban environment, or understanding of
current user activity while interacting with his environment (such as if the user is standing still,
or in a vehicle).
Chapter 3 details the characteristics of the target environment, how a user interacts with the
environment, and lastly how the architecture of the developed work is organized in a form that
allows the accomplishment of the established goals (mentioned in section 1.3).
Chapter 4 explains how the implementation of the prototype application was realized so as to
showcase the solution detailed in Chapter 3, as well as the difficulties faced during development,
and limitations during development.
Chapter 5 explains how the developed work was evaluated, and presents the obtained results,
in the form of a series of tests conducted with the developed prototype.
Lastly Chapter 6, offers a brief explanation of how the developed work performed in contrast
to the originally established objectives, as well as how future work could be developed in order
to further improve the work established in this document.
5

6
Chapter 2
State of the Art
In this chapter, the technologies and works that influenced the developed work are detailed.
First in section 2.1 an analysis of current tracking approaches is detailed.
Section 2.1.2 focuses on analyzing the available technologies that relate to the developed work.
In section 2.2 a collection of previously published related works is detailed, that were crucial to
better understand the use of tracking technologies as well as their performance.
Lastly in section 2.2.10 gives a brief explanation on how all these topics relate to each other and
to the developed work.
2.1 Tracking
At the time of this work, tracking technologies are used by large corporations such as Facebook,
Microsoft, or Google, while most are social media providers in some form, all attempt to improve
user experience by having context of user activities and locations.
For the principle of tracking users to improve the usability of a service, an operator’s ability
to effectively and efficiently make use of mobility patterns is essential to improve any public
transportation service as previously stated in Section 1.1. Following this rationale, allowing for
a method to track users without an explicit action on their part is an important factor in this
improvement.
As such what follows is an analysis of any current technology previously studied or currently
used that is thought to be relevant in accomplishing the previously mentioned goals.
7
2.1.1 Tracking Methods
Triangulation
Triangulation systems rely on a well known signal source with characteristics that allow an easy
and quick calculation of the distance between the signal source, and the receiver via the signal
strength, response time, and angle of arrival. [AHS03]
Such systems are limited due the natural form in which the Electromagnetic (EM) spectrum
works, meaning that deriving from possible signal reflection, signal refraction, obstacles that
weaken signal strength or even block a path to the receiver, might create false determinations
of the acquired location [AHS03].
Fingerprint
Fingerprint location systems work based on the concept of matching a signal pattern to a well
know signal map [KK04].
This signal map is created by sampling the signal on a given position during a sample time. To
obtain a location a search is made to match the current signal as perceived in the device to the
signal map, deducing the location to be the one that more closely matches the map, for example
Google Location Services will utilizes fingerprinting methods to help in the acquisition of user
location.
Fingerprint tracking suffers from the need to keep the signal map updated. In a real-life situation,
the signal map will not remain static as changes in the environment may alter in some form how
the signal propagates (such as changes in furniture, people density, traffic). This interference
would result in the acquisition of an invalid location. As such there is a need to update the
map so that it stays up to date. Making this need for map updates another requirement for any
system that uses a form of fingerprinting. Having to contend with the need to create and keep
a signal map of the intended tracking locations can be an expensive and arduous task, directly
related to the frequency of change in the environment.
2.1.2 Tracking Technologies
Global Positioning System (GPS)
GPS is a tracking technology that makes use of a network of satellites (in an orbit at approx-
imately 20,000 kilometers from the surface of the Earth) to deduce the location of a capable
receiver [Her96].
The use of GPS has been growing recently to the point where recent studies for public trans-
8
portation tracking [MBP+04] and practical uses on smartphone applications have been made
[Int16].
GPS itself offers the greatest facility in calculating an accurate position when a clear line of sight
to the satellite network is possible, such a scenario results in a precision range of approximately
5 to 15 meters (varying as a result of the ability to obtain a clear signal or not) [Mon14]. While
such a discrepancy for a worse case scenario can hinder efforts for pinpoint user location, GPS
is still a valid and widespread mean of tracking.
The greatest hindrance GPS possesses is in the form of battery drain on the receiver, as the
GPS module will be draining a considerable amount of power constantly independently of the
current operation mode (connected, signal acquisition, or even while on idle mode) [CH10].
This power drain can be minimized using techniques to enhance the form in which the GPS
module is used, thus minimizing the potential drain on the smart-phone [FH14a].
Global System for Mobile Communications (GSM)
GSM is a standard used to describe cellphone communication [Rah93].
Some studies have tried to varying levels of success to utilize GSM as a form of tracking, such
a case was realized by utilizing signal towers as a form of tracking a user location via signal
triangulation [KGS06]. In this instance the GSM signal tower (having a well-known position,
and area of service) is used to designate an area currently occupied by the receptor. This
system rather than offering point-to-point location tracking capabilities, offers a zone-tracking
capability. As such this type of tracking is more appropriate for zone-tracking where pinpoint
accuracy is not needed.
In a different case, the use of a fingerprint method (described in section 2.1.1) was utilized, by
making use of maps formulated from signal strength variation across a region and deducing a
location by matching a device’s readings to the signal map [IY12].
Tracking by use of GSM exclusively has shown that such systems are either highly susceptible to
signal strength variation and base-station distribution, or require the creation of signal-strength
maps that are expensive to create and maintain (in part) due to the large areas covered by the
GSM signal [CSC+06].
GSM has also been used in conjunction with GPS to create a more accurate system that is less
prone to error derived from the signal fluctuation that might be observed in any of the two
technologies [THR07]. This pairing aimed at utilizing both technologies strength to mitigate
their respective weaknesses on a PTSN.
While GSM can have a need for auxiliary technologies for tracking, it possesses a low use of
9
battery in smartphones having only considerable battery drain when actually transmitting data
[CH10].
WiFi
WiFi is a technology utilized for wireless communication between two or more devices by means
of a Wireless LAN working on the EM spectrum. WiFi signal is transmitted using a WiFi -
Access Point (WiFi-AP) that is also responsible for managing the network to all devices trying
to, or already connected with it. Solutions based on WiFi are well studied:
• The use of fingerprint methodology has been studied to a high level of success using WiFi,
deriving from the compatible natural architecture of a WiFi Network, and the normal
distribution of WiFi signal in indoor locations [LDGZ12].
• Triangulation has seen tentative uses and studies, but deriving from the natural form
in which WiFi reflects on day-to-day materials, the results are less accurate than those
measured with other techniques [AHS03].
• Fingerprint and triangulation have also been used together in an effort to surpass systems
that make exclusive use of either [SLYP13].
• Hybrid systems have been studied to various ranges of success, such systems use WiFi and
some other technology to help mitigate WiFi’s weaknesses, but usually do not see much
real use, derived from the need to augment the existing WiFi infrastructure in some form
[APBC08].
Another form of WiFi to consider is WiFi - Direct (WiFi-D). This type of WiFi does not
require an WiFi-AP to establish connections, and enables devices to directly connect to one or
more other devices [CMGSS13]. On the account of battery use, WiFi has been shown to have
an intensive drain while the module is on, requiring good management not to drain a device’s
power supply [CH10].
Computer Vision (CV)
CV is the field responsible for how a computer is capable of interpreting and extracting infor-
mation from an image [FP02].
CV has been shown to be capable of tracking individuals by pairing a detected face in a pho-
to/video to the location where the recording took place. One such use of CV was not to match a
user with a face, but to analyze a video feed to detect users entering and exiting a bus [CCCW08].
10
While this system is not capable of associating a user to said event, it is a demonstration of how
the technology can be used for detecting MPs.
It should be noted that CV can be utilized on a smartphone for an indoor positioning system
requiring active user interaction to utilize such a system [KWM11].
When considering the use of CV in mobile devices it should not be forgotten that camera usage
is among one of the most power intensive tasks a smartphone can realize, as it utilizes a power
intensive module (camera) and possibly the display present in the device [CH10].
BlueTooth (BT)
BT is a wireless technology standard utilized for medium to short range wireless communication
between two devices [Bis01].
BT has been frequently studied as a solution to the acquisition of a users location [FH14b].
Much as WiFi, BT location technologies derive into two possible solutions, fingerprinting and
triangulation.
It should be noted that both solutions of fingerprint and triangulation require the creation (in
some form) of a network of BT signal sources of well-known fixed coordinates, as BT does not
share the network layout made available by the use of WiFi-APs.
However in contrast to WiFi (that has a noticeable power drain on smartphone battery), Blue-
Tooth Low Energy (BLE) [GOP12] is a form of the BT protocol that aims at low power con-
sumption [SHNN12].
The use of BT is also characterized by the heavy signal interference that multiple emissions can
have on data dissemination [FH14c].
Dead Reckoning (DR)
DR is an inertial tracking system. It utilizes the natural motion of its intended user to deduce
direction of movement, speed, and distance traveled [LJ96].
Such systems require the use of an accelerometer and a magnetometer, both widely spread on
smartphones, of which neither is responsible for a noticeable battery drain [CH10].
Tracking systems using DR have been created to track user activity [AB12], and even to track
users’ positions relative to themselves (how much they have walked and in what direction)
[Hen03].
11
2.1.3 Tracking Auxiliaries
While not responsible or capable of tracking users, the following paragraphs enunciate various
technologies capable of augmenting the previously stated technologies and methods.
BlueTooth Beacon (BB)
BB are small devices capable of holding limited information, no more than a few bytes repre-
senting their own identification [Poi16]. These beacons are designed to operate unattended for
long periods of time ranging from one month to three years. Thanks to these characteristics,
BB’s can complement tracking via BT, by operating as stationed signal emitters.
Near-Field Communication (NFC)
NFC is a protocol that enables devices to communicate while at short ranges from each other,
and is a continuation of Radio-Frequency Identification (RFID) [CMMG12].
NFC has been used on event-based tracking systems, these systems require the user to explicitly
”state” their location in the form of an action (such as using a NFC enabled device to authenti-
cate themselves at an environment’s entry point) [Par15]. On benchmarks, NFC has been shown
to consume low levels of battery power [CH10].
Wearables
Wearables are a form of mobile devices that are directly worn by their users (smartwatch, and
smartband are two examples of such devices). While these devices are not capable of complex
computation, they are usually paired with a smart-phone to bolster their small range of sensors
(where the most common sensors are an accelerometer and BT sensor, but not the only ones
present among wearable devices).
Due to their low processing capabilities and normal pairing with a smartphone, these devices
usually have high battery longevity.
Crowd Sensing
Crowd Sensing is the concept where by taking advantage of the mass dispersal of smartphones
into the general population [Cen16] applications can be employed that will measure certain
information criteria, such as average population density on a public zone, from a population of
users rather than from a single user [GWY+15]. This use of ”volunteer sensors” to effectively
create an array of sensors that can generate a set of data that reflects the target criteria. This
12
allows for a better understanding of the form in which a population rather than a user manifests
itself in this targeted criteria.
Context Aware Detection
Context Aware Detection is the concept of utilizing the variance in certain sensors or meta-
sensors in a device to formulate the current context the device and its user might be experiencing
[RWRC14].
This concept has been utilized to create applications that can deduce locations of importance
to its users by analyzing the available sensors in an effort to determine the current context of
user activity and suggest possible locations of interest to the user [GSB02].
Machine Learning (ML)
ML is the concept of creating programs capable of learning how to accomplish a task without
the need to explicitly program the capability to deal with said task [Bis06].
This concept has been utilized to identify patterns in large and complex data sets, in the effort
of obtaining usable information, in a process named Data Mining [HPK11]. Machine Learning
can also be employed to analyze sets of data in an effort to understand complex situations, such
as the location of mobile users [AAH+09].
2.2 Related Work
2.2.1 Mobility Agents: Guiding and tracking public transportation users
[RI06] focuses on how to better allow those affected in some form by a disability to have some
increase in their mobility back. In this effort the created system allows for caregivers to manage
and track possible transportation options (in the developed prototype restricted to a bus system).
The work relies on GPS (to obtain a position) and GSM (to communicate), and makes reference
to three components: server, caregiver client, traveler client. The system itself does not directly
match a traveler to a bus, and simply shows their respective locations to be the same, leaving
such a conclusion to the caregiver, who can see this information in real-time.
This work also shows the use of a ”city radar” that could map points-of-interest to a user, this is
realized via a radar like screen on their mobile device, where the information to be displayed is
acquired by crawling agents that seek for relevant information on the web regarding the general
area the system is being used on.
13
While this work is among the first of its kind, it proved to be a successful implementation of
how a user can have some improvement in their use of a PTSN, as the work allows for a less
restrained interaction between a previously constrained user and a PTSN operator, granting a
greater general level of usability to the users of the PTSN.
2.2.2 Learning and inferring transportation routines
[LPFK07] focuses on the creation of a system capable of learning a given user MP, in order
to allow for improvements on the users day-to-day life. Entirely reliant on the concept of
MP, the developed system makes use of the following concepts: “goal”, “trip segment”, and
“transportation mode”, in order to divide a normal A to B trip movement.
This separation is done by establishing a goal as the location where the user spends a large
amount of time, a trip segment as a segment of a given trip, and a transportation mode as the
mean of transportation a user used at a given segment.
This system makes use of the GPS signal to derive both location and velocity of a user (the later
being determined considering the time and distance from between each sampling), to determine
what mode of transportation a user is on (none, car, foot), and partitions the whole trip into
segments that represent each mode of transportation.
To correctly deduce the criteria stated above, the system makes use of a learning mechanism
via ML means, that will from a baseline (established from a gathered knowledge base), improve
on its ability to accurately realize the MP of its user.
The prototype developed by the authors demonstrated that it is possible to obtain a MP using
a smartphone, but the application was restricted due to the over-reliance in GPS, resulting
in sometimes incorrect MP acquisition, unless more complicated machine learning mechanisms
where to be employed.
2.2.3 Performance evaluation of UHF RFID technologies for real-time pas-
senger recognition in intelligent public transportation systems
[OTTL10] is based on the concept of user tracking on the entry-exit event users experience when
making use of a transport, by making use of RFID tags (a precursor and parallel to NFC) .
This performance evaluation shows that it is possible to utilize RFID enabled cards to properly
register on a RFID reader, even in an environment that could be described as prone to generate
reading errors (multiple RFID readings in a short interval of time).
14
2.2.4 Exploring ticketing approaches using mobile technologies: QR Codes,
NFC and BLE
[CLCG15], by taking into consideration the form in which a PTSN operator grants users access
to the transports in their network, this work proposes that the current ticketing experience based
on ”token” authentication can be improved by the use of mobile technologies. As such this work
suggests and analyses three possible means of utilizing mobile technologies to improve on the
current ticketing experience a PTSN user undergoes, focusing on offering alternatives that do
not require the acquisition the currently used physical ”tokens”, and that may minimize user
interaction to authenticate themselves. The explored mobile technologies are Quick Response
(QR) codes, NFC and BT.
When considering the amount of interaction a user has to undergo with current ”token” based
authentication, the three considered applications for each of the mentioned technologies were
found to have the following impact on user interaction (presented bellow from cheapest to most
costly to implement by an operator):
• The QR method was deemed the cheaper mean, but required the most user interaction as
the user has to point a smartphone at a QR code in order to acquire a valid ”token” to
use on the PTSN, an action that could possibly face problems in this reading operation.
• The NFC method was deemed a good cost compromise, but still required the user to
perform a single interaction in order to authenticate themselves, where before the user
had used a ”ticket”, now the user would use their smartphone as the ”token”.
• The BT method was deemed the most expensive as the PTSN operator needs to acquire
sufficient BB to employ full coverage, this method however was the only one to require
no interaction from the user, as the user can simply enter or exit the transport and the
BT service would acquire and authenticate them automatically, requiring no ”token” to
be presented.
All three methods were tested to show if they were feasible to implement in a real system, the
results showed that all were capable of accomplishing the task of authentication required to
validate user while on a transport, while not relying on the acquisition of a physical ”token”.
Of particular interest are the shown characteristics of each method:
• QR codes performed the worse in poor visibility conditions, but this poor performance
could be in part reduced by larger QR codes, and the use of external light sources (smart-
phone flashlight).
15
• BT proved to be poor in determining distances, but showed no problem detecting ”beacon
zones”, thus allowing for a seamless experience to the user only affected by the rapidity in
which the system detected the zone.
• NFC was the most reliable but still required an unobstructed sensor-to-reader path to
obtain the best results.
This work shows how existing methods for user authentication can be augmented or replaced
with smartphone aware substitutes that allow for a more user friendly experience, while also
making possible the tracking of users in a PTSN by use of the proposed applications for each
technology.
2.2.5 Understanding individual and collective mobility patterns from smart
card records: A case study in Shenzhen
[LHB+09] proposes that by utilizing only preexisting means such as RFID smartcards, it is
possible to attain the MP associated with use of a PTSN.
While creating a solution restricted to a metro system (an environment where entry and exits are
tightly controlled), this work exposes the readiness in which anonymous MPs can be extracted
when employing proper Data Mining (DM) methods. The work also shows that it is possible
to optimize a PTSN based on discoveries of critical points in the PTSN found by exploring
the acquired data. Such a critical point can be for example the discovery of bottlenecks and
underused portions of the PTS that might have not been found even when taking into account
the underlying ”culture” present in the studied metro system use (ex: start/end of workday in
the city of Shenzhen).
2.2.6 IoT Middleware for Precision Agriculture - Agricultural Labor Moni-
toring for Specialty Crops
[dBC16] proposes a system for tracking worker activity in specialized crops. The solution involves
the extensive use of DR to acquire the worker activity and position, utilizing GPS only to
compensate for the errors DR tracking accumulates over time. To better meet the tracking
objective, machine learning algorithms were used to analyze the data yielded by the DR sensors
(present in the worker’s smartphone), to ascertain with more accuracy the current activity of
the worker.
16
This system proves that it is possible to build a system primarily reliant on DR to track user
activity by matching sensor readings with ’learned’ patterns from the DR sensors, where this
tracking of activity is in effect creating a mobility pattern for worker activity on the crop.
2.2.7 Using Mobile Phones to Determine Transportation Modes
[RMB+10] focuses on the idea of utilizing embedded sensors in a smartphone, such as an
acellerometer and GPS sensor to deduce the current transportation mode of a user, therefore
extracting information about how users behave in terms of their mobility, much the same way
as the work mentioned in section 2.2.6 focused on retrieving information about how workers
engaged with their working activities. To accomplish this DR means are utilized to understand
the current context of mobility that an individual is experiencing, as well as fluctuations in GPS
signal strength to understand if a user as entered/exited a certain environment. However this
solution suffered greatly from battery drain that constantly sampling GPS impairs.
To balance this aspect the use of GSM signal variation to help the system understand if the user
is indoor or not is made, this technique alleviates on the need to constantly sample GPS signal,
but did not lower the consumption problem sufficiently to solve the problem of power demand.
As such the use of other auxiliary lower power sensors that would allow for a lower sampling of
GPS is mentioned as an aspect of future work.
The developed system still showed the ability to discern if a user was stationary, walking, run-
ning, biking or on a motorized vehicle with an accuracy of 93.6%, proving that the acquisition
of an individual current mobility context is possible to obtain without the use of dedicated
equipment, and in a form that does not require user interaction.
2.2.8 My Mobile Assistant
[Net13] focuses on a solution to track user mobility patterns during the daily commute to and
from work. The work was realized With the objective of providing the user a form of tracking
their own activities, as well as allowing for payment operations to be realized from a centralized
application in order to further improve the usability of a PTSN.
While this system offers a considerable range of features to the user (tracking, path suggestion,
ticketing), it is of particular interest the form of tracking employed. This tracking utilizes a mix
of GPS and DR methods, described in the work as ”Mobility Pattern and Position Services”.
This is a core functionality of the application, and works by utilizing a module that can express
17
the current activity the user is experiencing as a variety of states plus an unknown activity that
is the broad generalization of all possible activities not recognized by the system.
While the prototype developed showed promise in capturing the MP of a user, the system still
required user input on some contexts where generated readings proved to create ambiguous
situations for the system, requiring manual intervention by the user to clear such a situation.
2.2.9 Predicting the Location of Mobile Users: A Machine Learning Ap-
proach
[AAH+09] focuses on analyzing the validity of applying ML mechanisms to the detection and
prediction of the location of mobile users. It demonstrated the ability to correctly determine
the location of users, when using a large enough pool of information and the correct context
(such as the temporal context, or activity context), enabling the various ML mechanisms can
be further enhanced.
2.2.10 Considerations
By taking into consideration both technologies and related studies mentioned in the sections
above, the foundation on which this work will have to rely on in order to understand how
individuals utilize the transportation made available by a given PTSN can start to form.
By analyzing the two forms of position acquisition triangulation and fingerprinting, both are
shown to yield positive results among the referenced works, but consideration should be put on
the major deterrents each present:
• The requirement fingerprinting has to survey the designated area of tracking, in order to
keep the signal map updated.
• The dependency fingerprinting has on a static environment to obtain the best possible
results.
• Signal interference in the form of refraction, reflection or obstruction that triangulation
has to account for.
Factors that when taken into account with the fact the proposed work is targeting a shifting
public environment, that can be divided into two types of zones:
• public urban environment such as streets, tunnels, buildings, where signal strength and
propagation are ever changing.
18
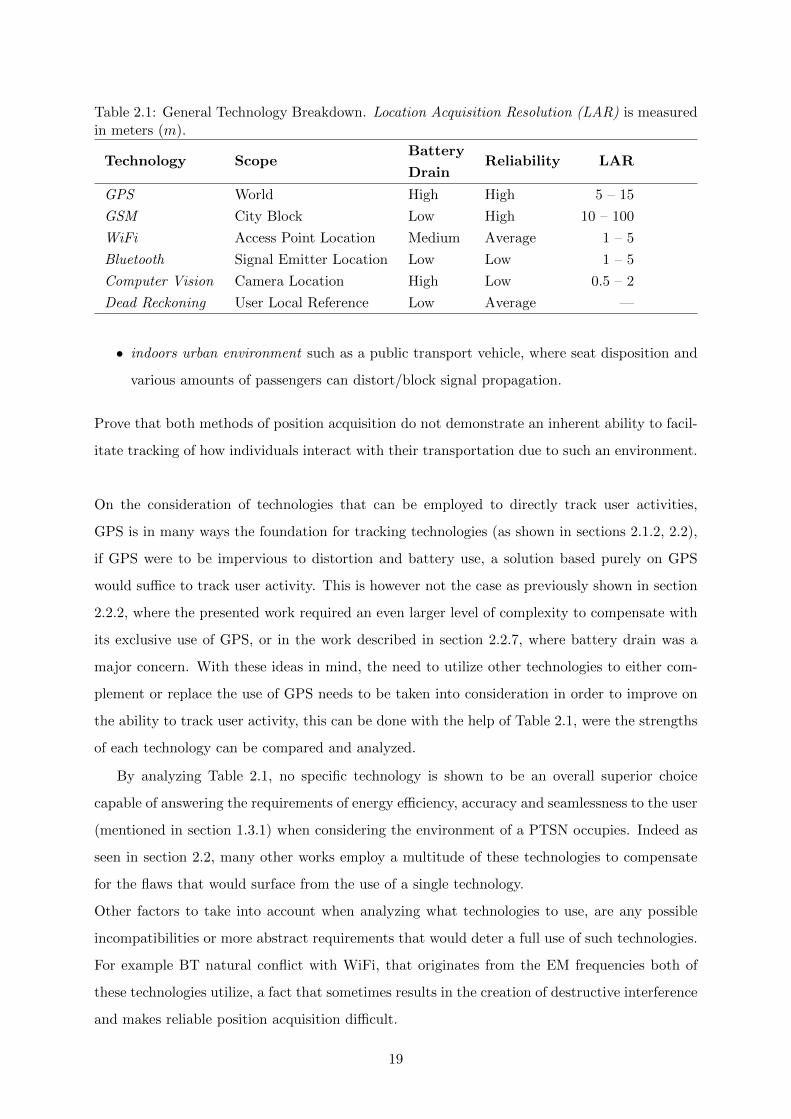
Table 2.1: General Technology Breakdown. Location Acquisition Resolution (LAR) is measuredin meters (m).
Technology ScopeBattery
DrainReliability LAR
GPS World High High 5 – 15
GSM City Block Low High 10 – 100
WiFi Access Point Location Medium Average 1 – 5
Bluetooth Signal Emitter Location Low Low 1 – 5
Computer Vision Camera Location High Low 0.5 – 2
Dead Reckoning User Local Reference Low Average —
• indoors urban environment such as a public transport vehicle, where seat disposition and
various amounts of passengers can distort/block signal propagation.
Prove that both methods of position acquisition do not demonstrate an inherent ability to facil-
itate tracking of how individuals interact with their transportation due to such an environment.
On the consideration of technologies that can be employed to directly track user activities,
GPS is in many ways the foundation for tracking technologies (as shown in sections 2.1.2, 2.2),
if GPS were to be impervious to distortion and battery use, a solution based purely on GPS
would suffice to track user activity. This is however not the case as previously shown in section
2.2.2, where the presented work required an even larger level of complexity to compensate with
its exclusive use of GPS, or in the work described in section 2.2.7, where battery drain was a
major concern. With these ideas in mind, the need to utilize other technologies to either com-
plement or replace the use of GPS needs to be taken into consideration in order to improve on
the ability to track user activity, this can be done with the help of Table 2.1, were the strengths
of each technology can be compared and analyzed.
By analyzing Table 2.1, no specific technology is shown to be an overall superior choice
capable of answering the requirements of energy efficiency, accuracy and seamlessness to the user
(mentioned in section 1.3.1) when considering the environment of a PTSN occupies. Indeed as
seen in section 2.2, many other works employ a multitude of these technologies to compensate
for the flaws that would surface from the use of a single technology.
Other factors to take into account when analyzing what technologies to use, are any possible
incompatibilities or more abstract requirements that would deter a full use of such technologies.
For example BT natural conflict with WiFi, that originates from the EM frequencies both of
these technologies utilize, a fact that sometimes results in the creation of destructive interference
and makes reliable position acquisition difficult.
19
To answer these inevitable flaws that the combination of two or more technologies presents,
the concept of tracking auxiliaries as mentioned above (in section 2.1.3) was introduced. These
technologies cannot in themselves track a user’s position, but can serve as a means to better
know what is the activity the user is performing, thus helping to better understand how any
acquired coordinates relate to the current user activity, and so making possible a high fidelity
MP model that both has into account the location and activity of a user among a given trip, to
better understand how a user is interacting with the PTSN.
As stated before the accumulation of various activities and locations from various sensors, the
complexity of the system increases, in order to facilitate the approach, ML means will be applied
to the captured data in an effort to diminish the need for explicit programming while also
reducing the possibility of missing key aspects of data relationships that might not be at first
recognized.
2.3 Summary
By exploring aforementioned sections, the following principles can be established:
• The exclusive use of a single tracking method does not guarantee effective tracking in an
urban environment
• Various technologies already present on the modern smartphone can be used to help or
directly track a user
• Previous work has established the viability in using smartphones as a means to track users
and their activities
• The combination of the studied technologies and approaches realized by previous work,
could be combined into offering better performance
These concepts are kept in mind in the form by witch the next chapter 3 will structure the
architecture designed to meet the previously specified objectives (seen in section 1.3).
20
Chapter 3
Architecture
In this chapter, the details of the environment targeted by the developed work are explained, as
well as how a user will interact with the transportation systems in the scope of this work.
Following this explanation, the architecture utilized by the developed work is detailed in Section
3.2, focusing on how data is gathered (Section 3.2.1), the current state of the user is determined
(Section 3.2.2), how information can be visualized (Section 3.2.3) and how all these aspects are
managed (Section 3.3).
3.1 Use Case
As specified in previous chapters, the main goal of the proposed work is to allow the correct
acquisition of how a user interacts with a given PTSN. To ensure that the proposed architecture
enables the accomplishment of this goal, the typical environment and interaction a user has with
a PTS must first be analyzed, specifically the interactions a user takes when entering and existing
a bus at the various available stations. A simple example is that of a user awaiting for a bug
near a station (entry point), entering the bus, and after traveling for a given amount of time,
exiting the transport at a given stop (exit point).
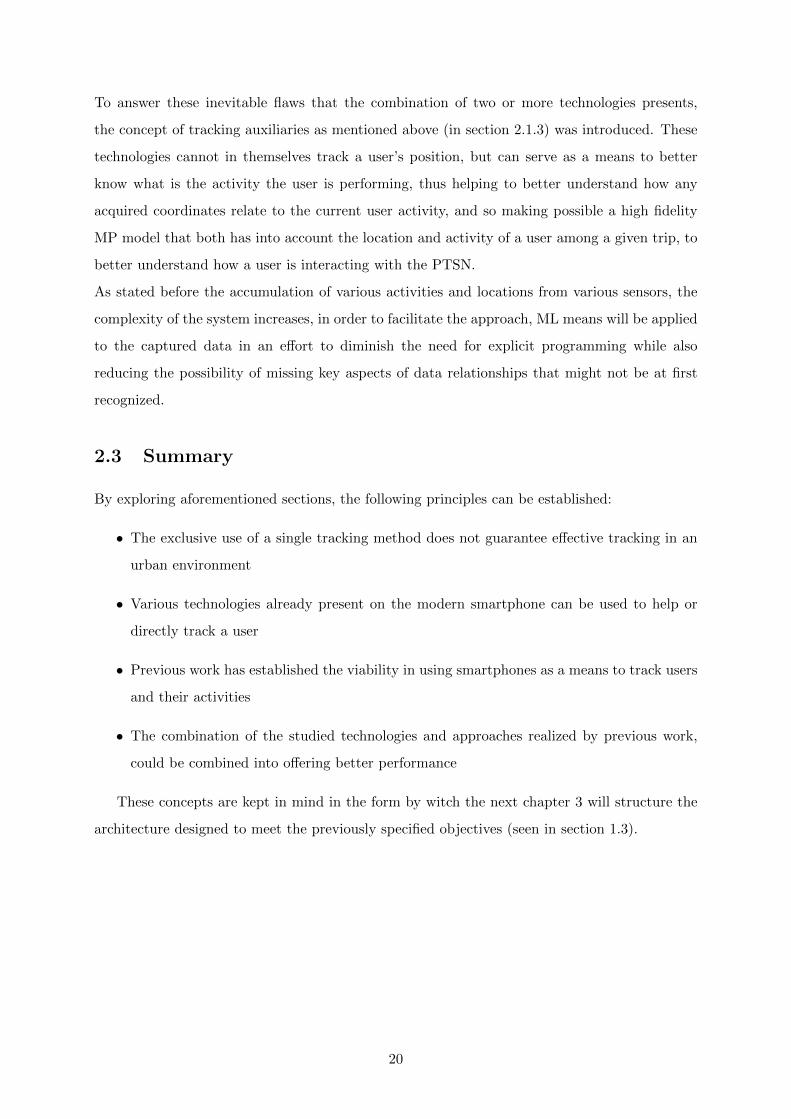
As seen in Figure 3.1 the environments where the proposed solution will be employed are
classified as either:
Outside Environment: An abstract environment that corresponds to all possible environ-
ments not associated with a transport network (such as a home, or work space).
Transport Environment: An environment that encapsulates the domain of the targeted
PTSN. This environment can be scoped as: the city of Lisbon, with all stops and vehicles
maintained by a given Operator.
21
Figure 3.1: Transport Environment Interaction
With the Transport Environment being the main environment where the developed work takes
place, it can be further classified to have discrete locations that help restrain the scope that the
proposed architecture must have:
Entry Point: These are the locations where the user enters a target transport. These locations
can require the user to perform an action that validates their use of the service as legitimate,
often by some form of ticketing practices.
Exit Point: These are the locations where the user exits a target transport. These locations
can require the user to perform an action that validates the use of the service as having been
legitimate.
In Transit: This is a general classification of the location a user is in while utilizing a transport,
and describes the spatial dislocation of the user while making use of the PTSN It can be further
sub-classified as either being in motion or stopped (such as awaiting for traffic to move).
While this classification of the Transportation Environment, helps to understand what the scope
of the developed work must encompass, users may in themselves have many states representing
their current activity in a PTSN, in effect representing the context of the user in a PTSN.
This context might be of greater relevance the more in-depth they are, as the added detail can
help in understanding the mobility patterns a user maintains. However in order to accomplish
the proposed goals (listed in section 1.3), the developed work will focus only on the following
22

contexts of user activity:
a) Walking - Considered to be when the user is in the Outside Environment or Transport
Environment, moving on foot to a given destination.
b) Awaiting transport - Considered to be when a user is awaiting at a point of entry for a
transport.
c) In target transport - When the user is considered to be in transit (and utilizing a transport
of the targeted operator).
d) In transport - When the user is considered to be in some form of use of a vehicle while on
the Outside Environment.
e) Other - Considered to be any possible activity either not targeted by the solution, while
on the outside environment, or situations where proper context attribution is ambiguous.
With this classification of the domain, a final analysis of the form in which a user will interact
with the targeted PTSN can be exemplified in Figure 3.2 where:
• UC1: Represents any context where the user is interacting with the outside environment
(either walking or using another transport, corresponding with points a), d) and e)).
• UC2: Represents the context where a user is awaiting for a transport in an entry point
(such as awaiting for a bus at a bus station, corresponding with point b)).
• UC3: Represents the context where a user is utilizing a target transport, effectively going
from a given point A to B (such as when the user is on a bus, corresponding with point
c)).
• UC4: Represents the context where a user might pass near an entry/exit point but not
enter or exit the transport, these might happen multiple times or not at all during a
journey.
• UC5: Represents the context where a user will exit the transport, for some transportation
systems this case might not be verified.
23
Figure 3.2: Transport interaction use case
3.2 Architecture Overview
Having into consideration the previously mentioned technologies (as seen in Section 2.1.2), re-
lated works (described in Section 2.2) and environment characteristics (described in Section
3.1), the proposed architecture for the mobile application follows a model that facilitates the
collection of a user’s MP. This is realized in order to grant both user and operator the ability
to improve their actions when taking into consideration said MP.
It should be noted that the data acquired on the mobile application will be stored in a lo-
cal database that allows further analysis, but it is not in the scope of this work to delve into
how this is realized, or on how to create a data aware application of the collected MPs. Instead
this project focuses on the creation of the data accumulation service and how to display the
acquired data in the form of a MP, to the user and operator in an easy to understand format.
As the architecture itself has to reflect the possibility of future integration with other applica-
tions (as mentioned in Section 1.3.1), the system also has available a manager that allows for
external applications to interact with the system. The proposed architecture has a modular
system in mind that is capable of addressing multiple PTSN but does not specialize into any
specific PTS that could restrict the ability of the proposed work to be implemented into other
preexisting systems utilized by an operator.
24
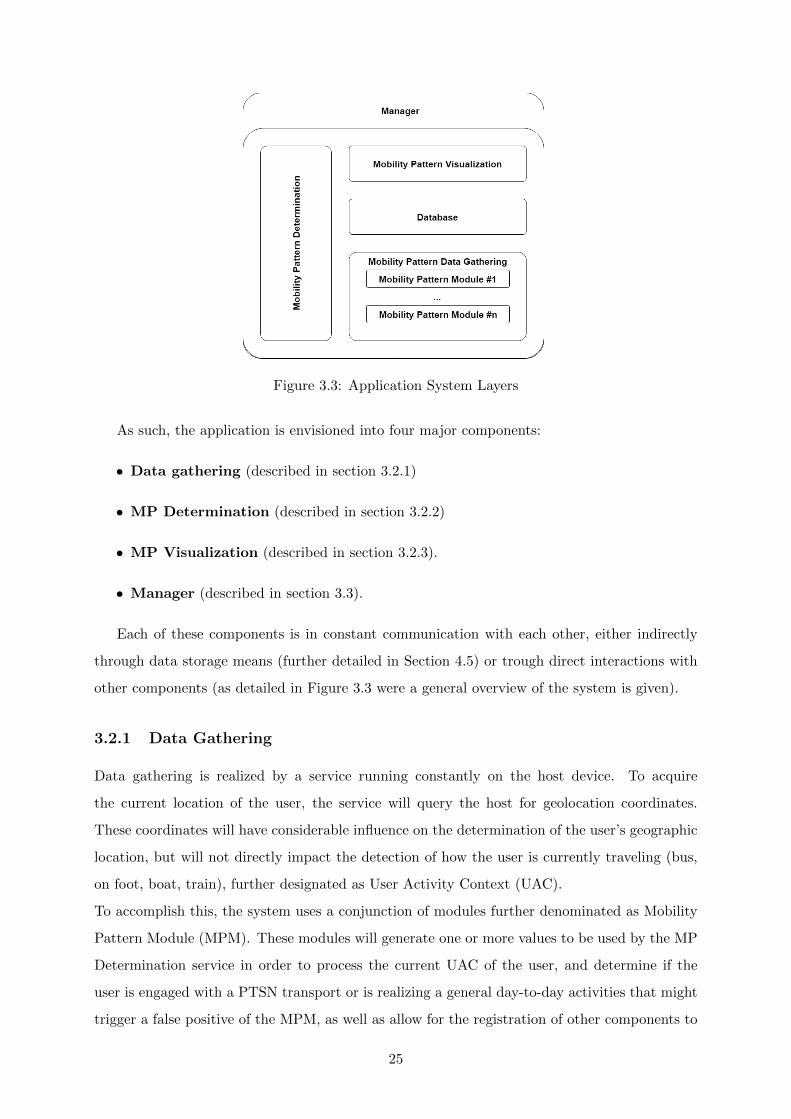
Figure 3.3: Application System Layers
As such, the application is envisioned into four major components:
• Data gathering (described in section 3.2.1)
• MP Determination (described in section 3.2.2)
• MP Visualization (described in section 3.2.3).
• Manager (described in section 3.3).
Each of these components is in constant communication with each other, either indirectly
through data storage means (further detailed in Section 4.5) or trough direct interactions with
other components (as detailed in Figure 3.3 were a general overview of the system is given).
3.2.1 Data Gathering
Data gathering is realized by a service running constantly on the host device. To acquire
the current location of the user, the service will query the host for geolocation coordinates.
These coordinates will have considerable influence on the determination of the user’s geographic
location, but will not directly impact the detection of how the user is currently traveling (bus,
on foot, boat, train), further designated as User Activity Context (UAC).
To accomplish this, the system uses a conjunction of modules further denominated as Mobility
Pattern Module (MPM). These modules will generate one or more values to be used by the MP
Determination service in order to process the current UAC of the user, and determine if the
user is engaged with a PTSN transport or is realizing a general day-to-day activities that might
trigger a false positive of the MPM, as well as allow for the registration of other components to
25
specific events in the internal workings of the module (such as problems faced during execution,
or perceived data from their sensors).
With this in mind, certain basic MPM’s can be envisioned as part of the system independently
of the targeted PTSN:
BB Module. This module utilizes the signal from a series of BB previously distributed among
the targeted transports of a PTSN. These beacons serve as auxiliaries to detect the current
UAC. Deriving from the detection of the signal, the module indicates that the user is in the
vicinity of a target transport. To accomplish this area detection, the beacons themselves are
transmitting a single data structure on the same frequency (effectively masking their collective
signals into a single ”agglomerate” beacon), that identifies both the type of transportation and
the ID associated with the transport itself.
WiFi Module. This module utilizes the presence of free WiFi-AP offered by some PTSNs to
help determine if the user is indeed inside the transport or merely near it. This differentiation
can in part be calculated by the sharp difference in signal strength during key events (such as
walking inside a bus, or walking out of a bus). These key events where the WiFi signal suffers a
distinct increase or decrease in strength due to the natural form WiFi waves reflect and refract
inside a closed environment, can then be said to signal a UAC change.
Location Module. The coordinates obtained from GPS will be the main driving force in un-
derstanding the current location of a user, as well as their speed. GPS signal strength variations
can be utilized to understand when a user enters or exits a transport, as GPS signal will weaken
and strengthen when respectively entering and exiting a building/closed environment (a similar
approach to the MPM mentioned above).
NFC Module. As with BB, NFC does not allow for user location on a coordinate system, but
rather on an event activity tracking, possible due to the use of NFC as a means to authenticate
users. As such this module utilizes user authentication events that signal a change in UAC. These
authentications represent that a user has initialized or ended a trip in a PTSN utilizing NFC
authentication. It should however be kept in mind that due to the various forms in which NFC is
used as an authentication method, this module needs to take into consideration that some PTSNs
might use a single point of NFC authentication versus two points (user authentication happens
only when entering or exiting the network, versus when entering and exiting the network).
26
GSM Module. This module utilizes GSM signal strength variations to help differentiate
changes to the UAC. This form of detection works the same way as the GPS and WiFi modules
do. With the major advantage of using a resource that the host smartphone systems have readily
available during most normal operations, ensuring the ability to analyze the available signal.
DR Module. DR by itself by itself can detect when a user is walking, approximately of how
far he has walked, and the general direction of movement based on a geomagnetic reference
point. These features of DR are exploited by understanding that a UAC can generally be
understood as (but not limited to) standing, walking, sitting inside a transport. Thus this
ability can help the system differentiate if a user is walking outside a transport, moving to his
seat inside the transport, sitting inside a transport, or outside. This differentiation is based on
the natural motions that a person makes, and when taking into consideration the amount of
research previously realized into DR, this module allows for a detection of a UAC with added
precision. This precision of what a user is doing in or out of a PTSN transport makes this
module play an important role in the ability the system has to determine a UAC.
Wearable Module. Most wearables do not have integrated GPS, GSM antennas, or other
forms of wireless protocols, besides BT. This lack of sensors allows for the possibility to use
wearables in a MPM, as readings from these devices are not sufficiently different to help the
system, as the close proximity the wearable has with the paired device would result in a near
identical reading. However the near universal presence of an accelerometer in wearable devices
allows for the use of DR algorithms. This allows for a more robust DR module that can more
accurately detect activities such as standing, walking, or sitting, and differentiate if these actions
are being realized while inside a motorized transport or out, to a greater level of accuracy.
Crowd Sensing (CS) Module. This module is intended as an assurance module, as its only
purpose is to help the service determine the accuracy of its modules. To do this, this module
utilizes WiFi-D to probe for other users running this system, and acquires from them relevant
module calculations to take into consideration when deciding the local UAC. It should still be
of consideration that said module needs to have a small impact on the general calculation, as
the possibility that two users in close proximity do not share the same UAC exists.
While the mentioned modules employ the various technologies analyzed in Section 2, for the
developed prototype only the following were developed: BB Module, WiFi Module, Location
Module, and DR Module.
27
3.2.2 MP Determination
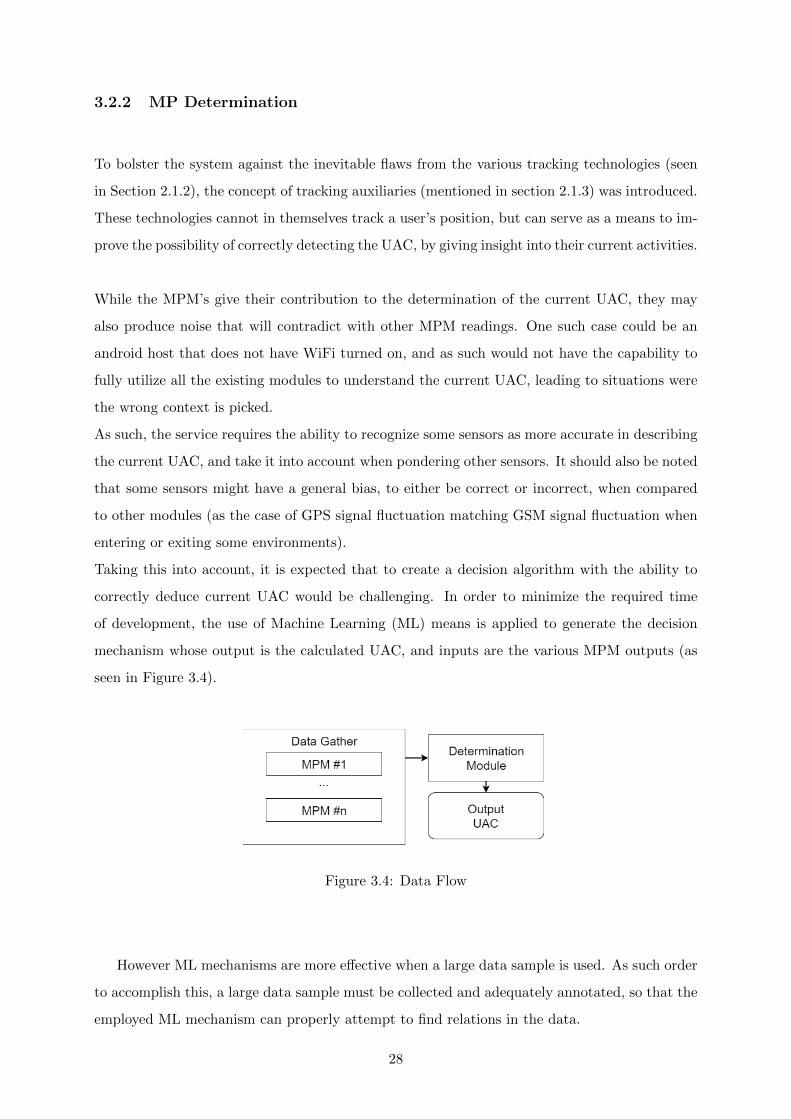
To bolster the system against the inevitable flaws from the various tracking technologies (seen
in Section 2.1.2), the concept of tracking auxiliaries (mentioned in section 2.1.3) was introduced.
These technologies cannot in themselves track a user’s position, but can serve as a means to im-
prove the possibility of correctly detecting the UAC, by giving insight into their current activities.
While the MPM’s give their contribution to the determination of the current UAC, they may
also produce noise that will contradict with other MPM readings. One such case could be an
android host that does not have WiFi turned on, and as such would not have the capability to
fully utilize all the existing modules to understand the current UAC, leading to situations were
the wrong context is picked.
As such, the service requires the ability to recognize some sensors as more accurate in describing
the current UAC, and take it into account when pondering other sensors. It should also be noted
that some sensors might have a general bias, to either be correct or incorrect, when compared
to other modules (as the case of GPS signal fluctuation matching GSM signal fluctuation when
entering or exiting some environments).
Taking this into account, it is expected that to create a decision algorithm with the ability to
correctly deduce current UAC would be challenging. In order to minimize the required time
of development, the use of Machine Learning (ML) means is applied to generate the decision
mechanism whose output is the calculated UAC, and inputs are the various MPM outputs (as
seen in Figure 3.4).
Figure 3.4: Data Flow
However ML mechanisms are more effective when a large data sample is used. As such order
to accomplish this, a large data sample must be collected and adequately annotated, so that the
employed ML mechanism can properly attempt to find relations in the data.
28
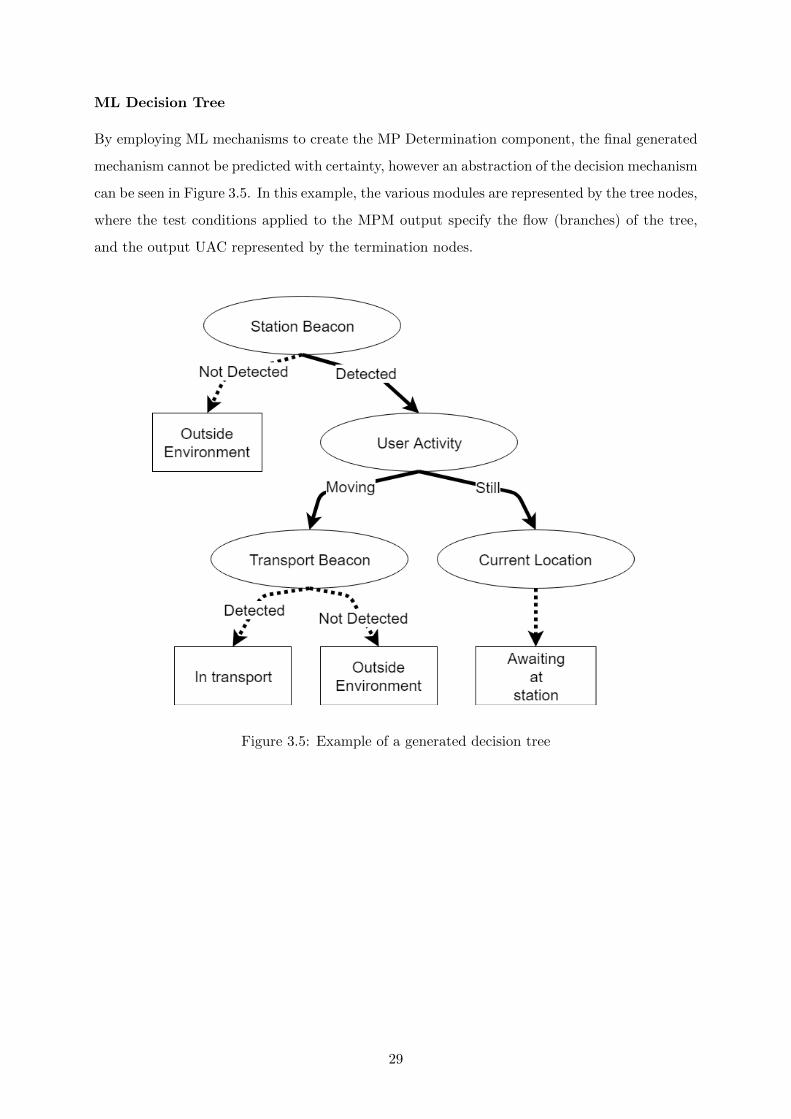
ML Decision Tree
By employing ML mechanisms to create the MP Determination component, the final generated
mechanism cannot be predicted with certainty, however an abstraction of the decision mechanism
can be seen in Figure 3.5. In this example, the various modules are represented by the tree nodes,
where the test conditions applied to the MPM output specify the flow (branches) of the tree,
and the output UAC represented by the termination nodes.
Figure 3.5: Example of a generated decision tree
29
3.2.3 MP Visualization
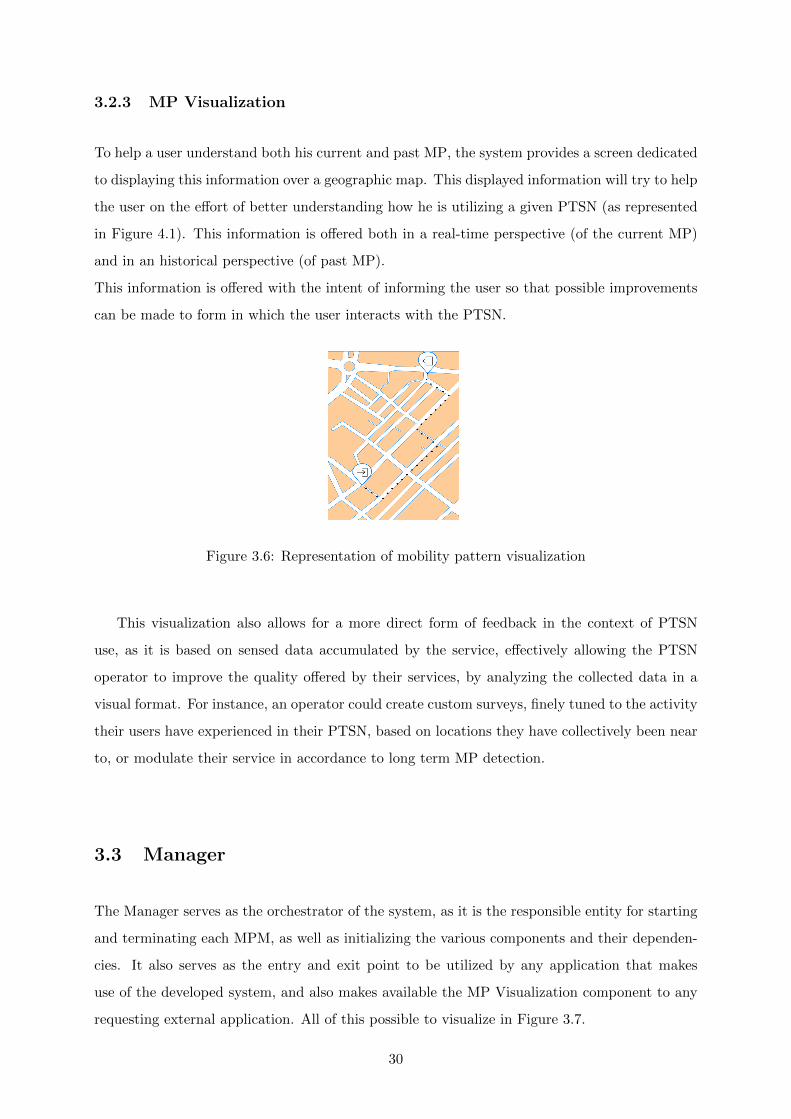
To help a user understand both his current and past MP, the system provides a screen dedicated
to displaying this information over a geographic map. This displayed information will try to help
the user on the effort of better understanding how he is utilizing a given PTSN (as represented
in Figure 4.1). This information is offered both in a real-time perspective (of the current MP)
and in an historical perspective (of past MP).
This information is offered with the intent of informing the user so that possible improvements
can be made to form in which the user interacts with the PTSN.
Figure 3.6: Representation of mobility pattern visualization
This visualization also allows for a more direct form of feedback in the context of PTSN
use, as it is based on sensed data accumulated by the service, effectively allowing the PTSN
operator to improve the quality offered by their services, by analyzing the collected data in a
visual format. For instance, an operator could create custom surveys, finely tuned to the activity
their users have experienced in their PTSN, based on locations they have collectively been near
to, or modulate their service in accordance to long term MP detection.
3.3 Manager
The Manager serves as the orchestrator of the system, as it is the responsible entity for starting
and terminating each MPM, as well as initializing the various components and their dependen-
cies. It also serves as the entry and exit point to be utilized by any application that makes
use of the developed system, and also makes available the MP Visualization component to any
requesting external application. All of this possible to visualize in Figure 3.7.
30
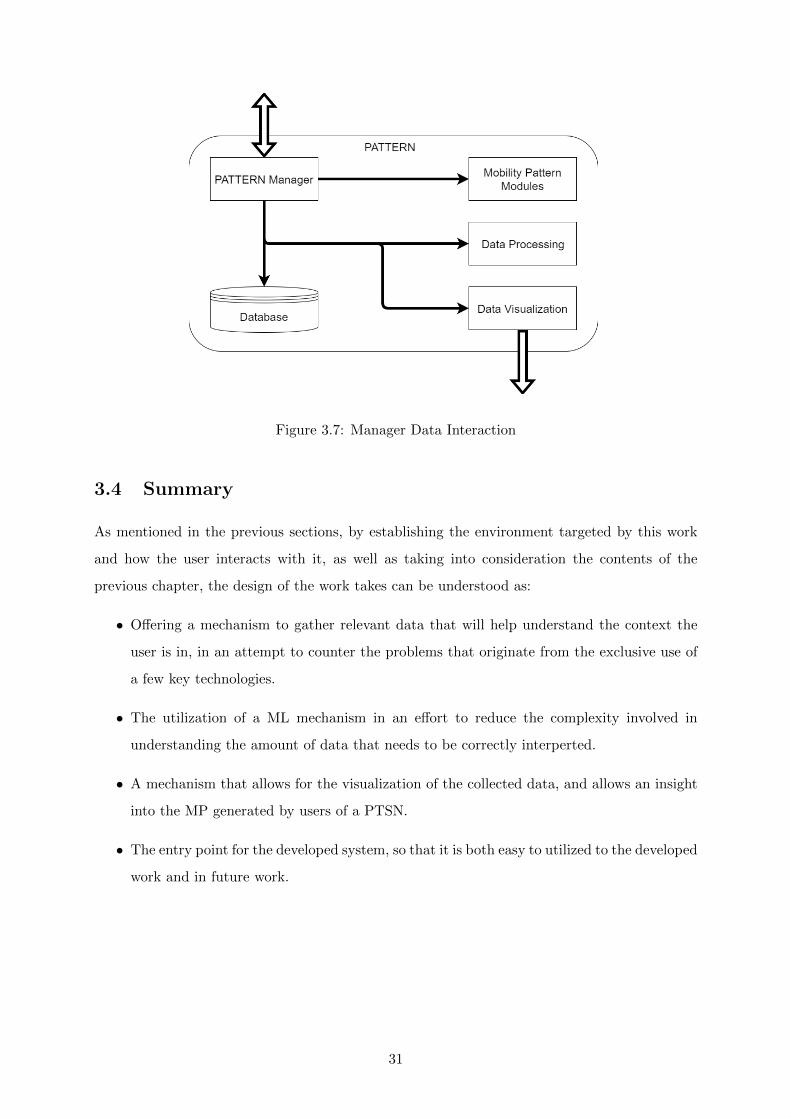
Figure 3.7: Manager Data Interaction
3.4 Summary
As mentioned in the previous sections, by establishing the environment targeted by this work
and how the user interacts with it, as well as taking into consideration the contents of the
previous chapter, the design of the work takes can be understood as:
• Offering a mechanism to gather relevant data that will help understand the context the
user is in, in an attempt to counter the problems that originate from the exclusive use of
a few key technologies.
• The utilization of a ML mechanism in an effort to reduce the complexity involved in
understanding the amount of data that needs to be correctly interperted.
• A mechanism that allows for the visualization of the collected data, and allows an insight
into the MP generated by users of a PTSN.
• The entry point for the developed system, so that it is both easy to utilized to the developed
work and in future work.
31

32
Chapter 4
Implementation
The following chapter describes how the implementation of the previously described system in
Section 3.2, in the form of the PATTERN application prototype is realized. In Sections 4.1 to
4.9, the prototype implementation as well realization of the specified architecture (Section 3.2)
are specified and analyzed, followed by the main difficulties faced during the development of the
prototype in Section 4.10, and a description of the features that were not possible to implement
is offered in Section 4.11.
4.1 Data Gathering
The need to implement a system capable of real time determination of the current UAC being
experienced by the user, and the decision to opt for a ML driven solution, requires the capture
of data from the various MPM working on the target PTSN environment, in order for the ML
mechanism to have a correct knowledge base to work with. For this requirement to be met, the
development of a more complex Data Gather Module is required, one that has the capability to
support the ML mechanism (detailed in Section 4.4) need for a large data set to be analyzed in
order to properly construct a decision tree. While the specified architecture favored a form of
direct pooling the multiple MPM for new Data, the implemented prototype utilizes a form of
indirect data relations trough the utilization of a common database (further detailed in Section
4.5) and a central access point that facilitates MPM output manipulation (as detailed in Figure
4.1).
In order to effectively collect data so that the MP determination module can be properly con-
structed by the chosen ML mechanism (detailed in Section 4.8), each of the proposed MPM is
provided with the extra capability to collect data without feeding the Determination component
of PATTERN (as seen in Figure 4.1). In this form, every MPM is capable of operating in:
33
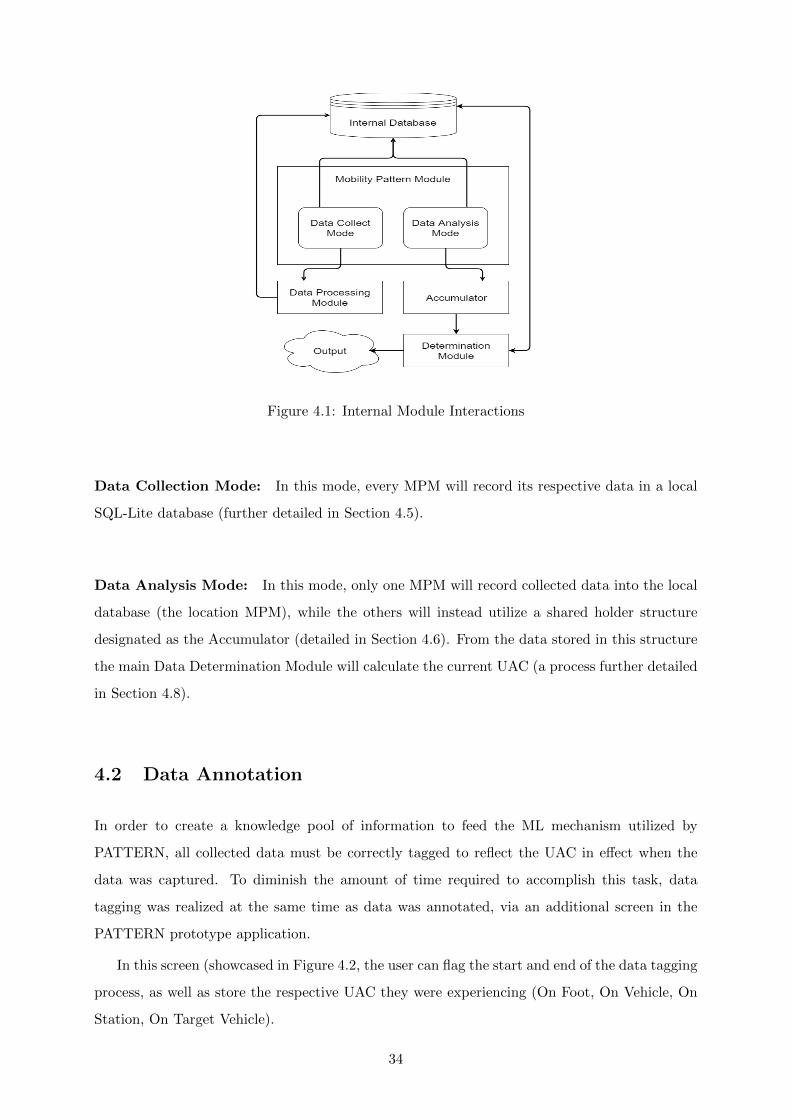
Figure 4.1: Internal Module Interactions
Data Collection Mode: In this mode, every MPM will record its respective data in a local
SQL-Lite database (further detailed in Section 4.5).
Data Analysis Mode: In this mode, only one MPM will record collected data into the local
database (the location MPM), while the others will instead utilize a shared holder structure
designated as the Accumulator (detailed in Section 4.6). From the data stored in this structure
the main Data Determination Module will calculate the current UAC (a process further detailed
in Section 4.8).
4.2 Data Annotation
In order to create a knowledge pool of information to feed the ML mechanism utilized by
PATTERN, all collected data must be correctly tagged to reflect the UAC in effect when the
data was captured. To diminish the amount of time required to accomplish this task, data
tagging was realized at the same time as data was annotated, via an additional screen in the
PATTERN prototype application.
In this screen (showcased in Figure 4.2, the user can flag the start and end of the data tagging
process, as well as store the respective UAC they were experiencing (On Foot, On Vehicle, On
Station, On Target Vehicle).
34
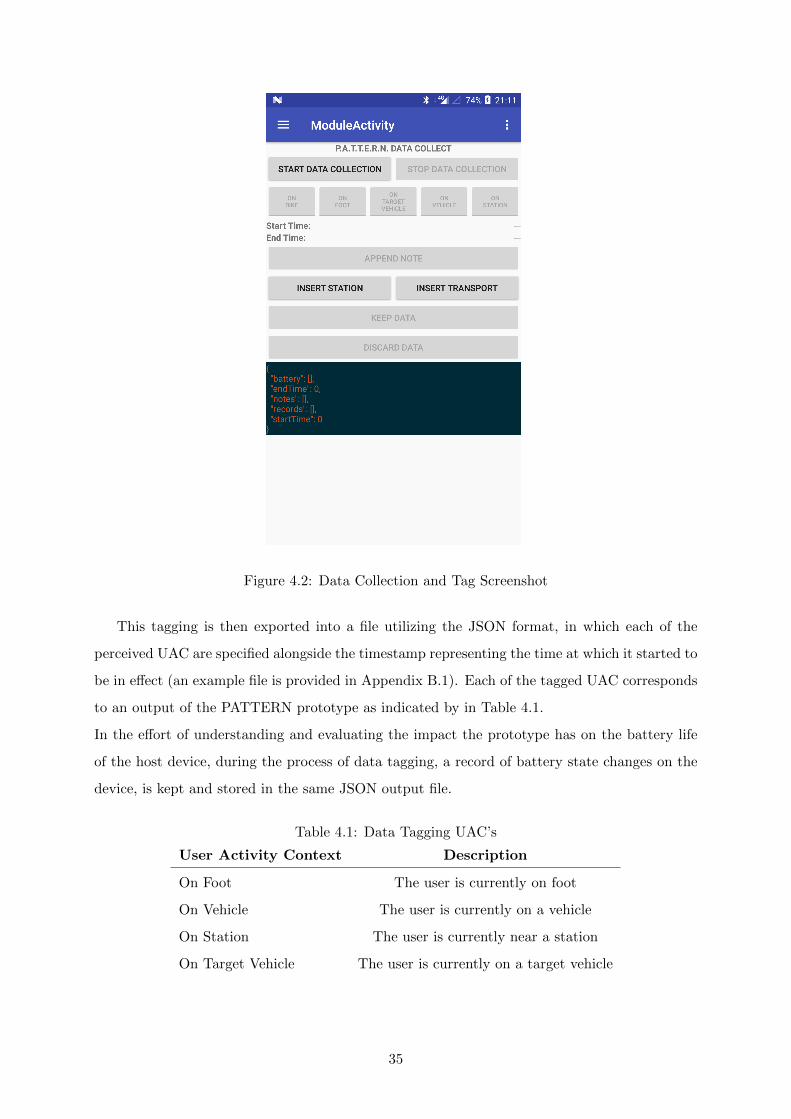
Figure 4.2: Data Collection and Tag Screenshot
This tagging is then exported into a file utilizing the JSON format, in which each of the
perceived UAC are specified alongside the timestamp representing the time at which it started to
be in effect (an example file is provided in Appendix B.1). Each of the tagged UAC corresponds
to an output of the PATTERN prototype as indicated by in Table 4.1.
In the effort of understanding and evaluating the impact the prototype has on the battery life
of the host device, during the process of data tagging, a record of battery state changes on the
device, is kept and stored in the same JSON output file.
Table 4.1: Data Tagging UAC’s
User Activity Context Description
On Foot The user is currently on foot
On Vehicle The user is currently on a vehicle
On Station The user is currently near a station
On Target Vehicle The user is currently on a target vehicle
35
4.3 Mobility Pattern Modules
Having into consideration all the the proposed modules envisioned for the prototype (as described
in Section 3.2.1). The following sections provide a description about each of the implemented
modules, and how they integrate into the prototype.
4.3.1 Activity Module
This module was implemented by making use of a native Android API for activity recognition
developed by Google and supported for Android SDK of levels 7 and above [Goo17], where a
list of probabilities is returned, reflecting the calculated percentage that a user is experiencing
a given UAC based on various sensors present in the Android device, such as the accelerometer,
magnetometer and gyroscope. The use of this library allowed for the easy implementation and
detection of the following user activity states: On foot, On bike, On Vehicle, Running, Walk-
ing, Still, Unknown (further detailed in Table 4.2), as the chosen Google API also employs ML
mechanisms to understand the various activities detected, via the aforementioned sensors and
by applying a DR approach to the analyzed data.
However as these results sometimes suffered from a high variation in probability in a short
amount of time, the Activity Module of the prototype utilizes only measurements from the
average of up to 10 previously reported results from the library (a value acquired during exper-
imentation with the module in an attempt to verify what number of records should be used to
average the results), in an attempt to stabilize the sometimes highly fluctuating reported UAC
probabilities.
In effect this module is a more advanced form of the specified DR MPM.
Table 4.2: Captured User Activities
User Activity Context Description
On Foot The user is traveling on foot
On Vehicle The user is traveling on a vehicle
On Bike The user is traveling on a bike
Running The user is running
Walking The user is walking
Still The user is still or sitting
Unknown The user is engaged in an unknown activity
This module feeds the Determination Module with a broad perceived current UAC, where
36
activities other than on foot, or on vehicle, are abstracted into a single abstract activity named
”Other”, as such the inputs for the Determination module are On foot, On Vehicle, Other.
4.3.2 Location Module
This module relies on the capture of the user’s geo-location, via the utilization of the native
capabilities of the Android platform. To acquire the location, one of three providers can be
chosen:
a) GPS provider - This provider will utilize only locations from the GPS module present in
the Android device, and while offering the most accuracy is also the most power intensive.
b) Network provider - This provider will utilize only locations obtained from employing
triangulation means on the perceived GSM signal by the Android device.
c) Fused Provider - This provider will utilize both GPS and GSM means, as well as WiFi
and BT signals to identify landmarks that facilitate the acquisition of location. Further-
more this provider has in account the energy and location policies of the device.
While the first two providers a) and b) will make available geo-referenced coordinates, based
on direct sensor input, the third provider c) is offered via the utilization of Google Play Ser-
vices, offered to consumer devices running the Android OS. This provider will try to acquire the
location based on what current device external sensors are active, as such this provider allows
for the Location Module to assume the location requirements from both WiFi MPM and BT
MPM.
The prototype relies uses provider c) (the Fused provider), but will fallback to one of the other
two, if the provider is not available or if the the user has not activated Google Play Service
Location permissions on the device. It should be noted that in the event of the not utilizing
the GPS data, the available coordinates might prove to not be sufficiently accurate to establish
with confidence the proximity to certain points of interest (such as a station), as well as other
problems detailed in Section 4.10. The coordinates received by this module are stored in the
local database independent of the current MPM mode and processed to make available two types
of inputs for the Decision Making component of PATTERN:
Near station: This input is a Boolean value, reflecting if the user is indeed near a station or
not (where the deliminator of proximity is a radius of 10 meters from the known coordinates of
a station).
37
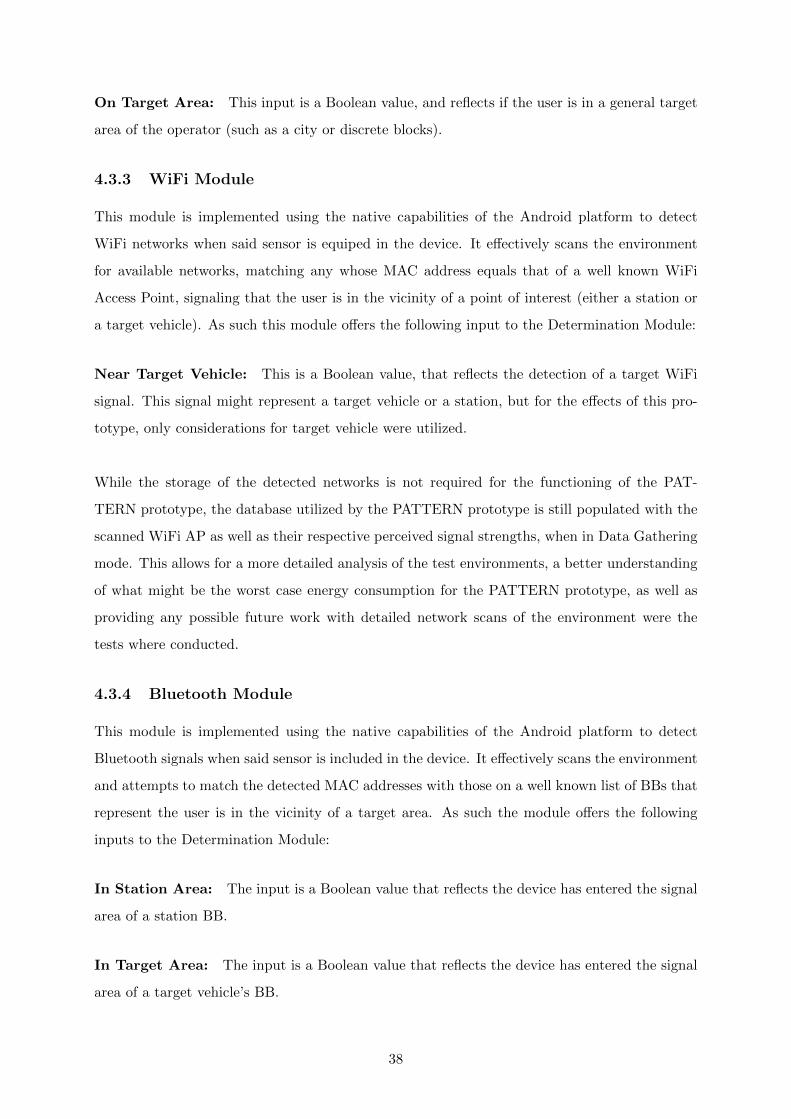
On Target Area: This input is a Boolean value, and reflects if the user is in a general target
area of the operator (such as a city or discrete blocks).
4.3.3 WiFi Module
This module is implemented using the native capabilities of the Android platform to detect
WiFi networks when said sensor is equiped in the device. It effectively scans the environment
for available networks, matching any whose MAC address equals that of a well known WiFi
Access Point, signaling that the user is in the vicinity of a point of interest (either a station or
a target vehicle). As such this module offers the following input to the Determination Module:
Near Target Vehicle: This is a Boolean value, that reflects the detection of a target WiFi
signal. This signal might represent a target vehicle or a station, but for the effects of this pro-
totype, only considerations for target vehicle were utilized.
While the storage of the detected networks is not required for the functioning of the PAT-
TERN prototype, the database utilized by the PATTERN prototype is still populated with the
scanned WiFi AP as well as their respective perceived signal strengths, when in Data Gathering
mode. This allows for a more detailed analysis of the test environments, a better understanding
of what might be the worst case energy consumption for the PATTERN prototype, as well as
providing any possible future work with detailed network scans of the environment were the
tests where conducted.
4.3.4 Bluetooth Module
This module is implemented using the native capabilities of the Android platform to detect
Bluetooth signals when said sensor is included in the device. It effectively scans the environment
and attempts to match the detected MAC addresses with those on a well known list of BBs that
represent the user is in the vicinity of a target area. As such the module offers the following
inputs to the Determination Module:
In Station Area: The input is a Boolean value that reflects the device has entered the signal
area of a station BB.
In Target Area: The input is a Boolean value that reflects the device has entered the signal
area of a target vehicle’s BB.
38
While the storage of the detected Bluetooth signals is not required for the functioning of the
PATTERN prototype, the database utilized by the PATTERN prototype is still populated with
the scanned Bluetooth signals when the prototype is in Data Gathering mode, this allows for a
more detailed analysis of the test environments, a better understanding of what might be the
worst case energy consumption for the PATTERN system, and was implemented in an attempt
to discern if the detection of key Bluetooth devices was possible when facing an environment
such as a bus.
To validate this assumption, some tests were realized, where a colleague was inside an approach-
ing bus, while his personal android phone had the Bluetooth module turned on, and the module
was able to record the presence of said device once inside a crowded bus.
4.4 Data Processing
To utilize ML mechanisms PATTERN makes use of Weka [oW17], chosen as it is a publicly
available program, free for academic use, and facilitates the visualization of the gathered data.
It also provides the ability to generate a decision tree based on the analyzed data. Weka is fed
by the collected and tagged data obtained while the prototype was running in Data Gathering
mode. This data was previously formatted by the prototype into a recognizable format by Weka,
allowing the program to attempt to understand how the inputs relate to the observed UAC (this
process if further detailed ahead, but can be exemplified in Figure 4.3).
Figure 4.3: Tagged Data Process
To generate this data file, the local database is utilized to acquire the collected output data
from the various MPM, and match it with the UAC tagged during collection in the JSON
39
file. This process is performed by a thread running in parallel to the system, triggered by the
PATTERN Manager (further described in Section 4.7), and will export the file to the external
memory of the device. The generated file (an example is provided in Appendix B.1) contains
a description of each attribute (input) and relations of said attributes to the desired output
(essentially describing how the collected data matches to a given reported UAC). These inputs
and are described in Table 4.3, and the outputs are detailed in Table 4.4.
Table 4.3: Decision Tree Inputs
Input Origin
OnFoot Activity Module
OnVehicle Activity Module
DetectedStation WiFi and Bluetooth Modules
NearStation Location Module
DetectedVehicle WiFi and Bluetooth Modules
InArea Location Module
After processing the data, the Weka program can be commanded to output a decision tree
(as exemplified in Appendix A.1), which is easily imported into the prototype, by creating a
Java class that matches the generated decision tree via a series of logical tests.
Table 4.4: Decision Tree Outputs
Output Description
Foot The user is on foot
Vehicle The user is on a vehicle
Target Vehicle The user is on a target vehicle
Station The user near a station
Other Any other possible UAC
4.5 Database
The choice of utilizing a SQLite database was made by taking into account the native support
that Android gives to the utilization of this database specification, as well as the availability of
a management library that facilitates the use of this type of database [Gra17].
The internal database utilized by the PATTERN prototype application, is specified in Table 4.5
40
Table 4.5: Database organization
Table Identifier Description Origin
Location Timestamp List of captured Geo-reference coordinates Location Module
Activity Timestamp List of captured user contexts Activity Module
Wifi MAC List of all captured WiFi networks WiFi Module
Bluetooth MAC List of all captured Bluetooth devices Bluetooth Module
Witnesses Generated List of all seen WiFi and Bluetooth by timestamp BT and WiFi Module
UAC Timestamp List of UAC outputed by the decision tree PATTERN
Journey Generated List of all undertaken journeys PATTERN Manager
In addition to storing the captured data from the various MPM, the PTSN domain infor-
mation is stored in the local database, as described in Table 4.6
Table 4.6: Target Operator Domain Information
Table Identifier Description
Station Generated Describes a unique station, and corresponding BT or WiFi IDs
Vehicle Generated Describes a unique vehicle and corresponding BT or WiFi IDs
BluetoothTarget Generated Describes a target Bluetooth MAC address
WiFiTarget Generated Describes a target WiFi MAC address
4.6 Accumulator
The accumulator allows for a quicker access to the various MPM outputs as it is mantained
directly in memory, in essence it functions with much of the same intent as the database pre-
viously described in Section 4.5, however being a structure kept entirely in memory, it will not
preserve any values that are stored by its structures after the application is closed, as well as
have a faster I/O than any database that requires some form of file access.
The use of the accumulator over the local database is to provide a unique access point where
the Data Analysis task can query for information to feed into the decision tree, without the need
to manage the acquisition of data directly from the MPM. The use of a volatile structure also
ensures that most of the captured information is discarded when the application terminates,
diminishing the amount of data tracked outside of the strictly necessary.
The only four exceptions to this volatile nature is the captured location of the user, the recorded
target vehicle detected, stations passed by, and the output of the decision tree. These exceptions
41
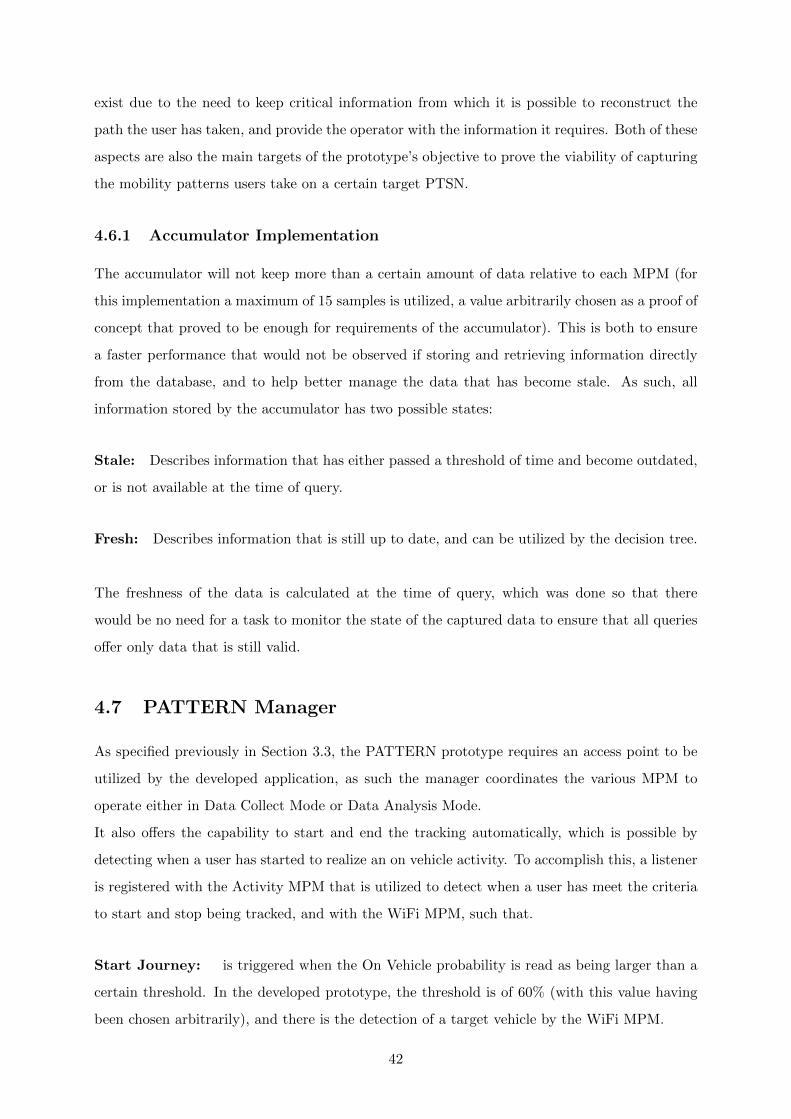
exist due to the need to keep critical information from which it is possible to reconstruct the
path the user has taken, and provide the operator with the information it requires. Both of these
aspects are also the main targets of the prototype’s objective to prove the viability of capturing
the mobility patterns users take on a certain target PTSN.
4.6.1 Accumulator Implementation
The accumulator will not keep more than a certain amount of data relative to each MPM (for
this implementation a maximum of 15 samples is utilized, a value arbitrarily chosen as a proof of
concept that proved to be enough for requirements of the accumulator). This is both to ensure
a faster performance that would not be observed if storing and retrieving information directly
from the database, and to help better manage the data that has become stale. As such, all
information stored by the accumulator has two possible states:
Stale: Describes information that has either passed a threshold of time and become outdated,
or is not available at the time of query.
Fresh: Describes information that is still up to date, and can be utilized by the decision tree.
The freshness of the data is calculated at the time of query, which was done so that there
would be no need for a task to monitor the state of the captured data to ensure that all queries
offer only data that is still valid.
4.7 PATTERN Manager
As specified previously in Section 3.3, the PATTERN prototype requires an access point to be
utilized by the developed application, as such the manager coordinates the various MPM to
operate either in Data Collect Mode or Data Analysis Mode.
It also offers the capability to start and end the tracking automatically, which is possible by
detecting when a user has started to realize an on vehicle activity. To accomplish this, a listener
is registered with the Activity MPM that is utilized to detect when a user has meet the criteria
to start and stop being tracked, and with the WiFi MPM, such that.
Start Journey: is triggered when the On Vehicle probability is read as being larger than a
certain threshold. In the developed prototype, the threshold is of 60% (with this value having
been chosen arbitrarily), and there is the detection of a target vehicle by the WiFi MPM.
42
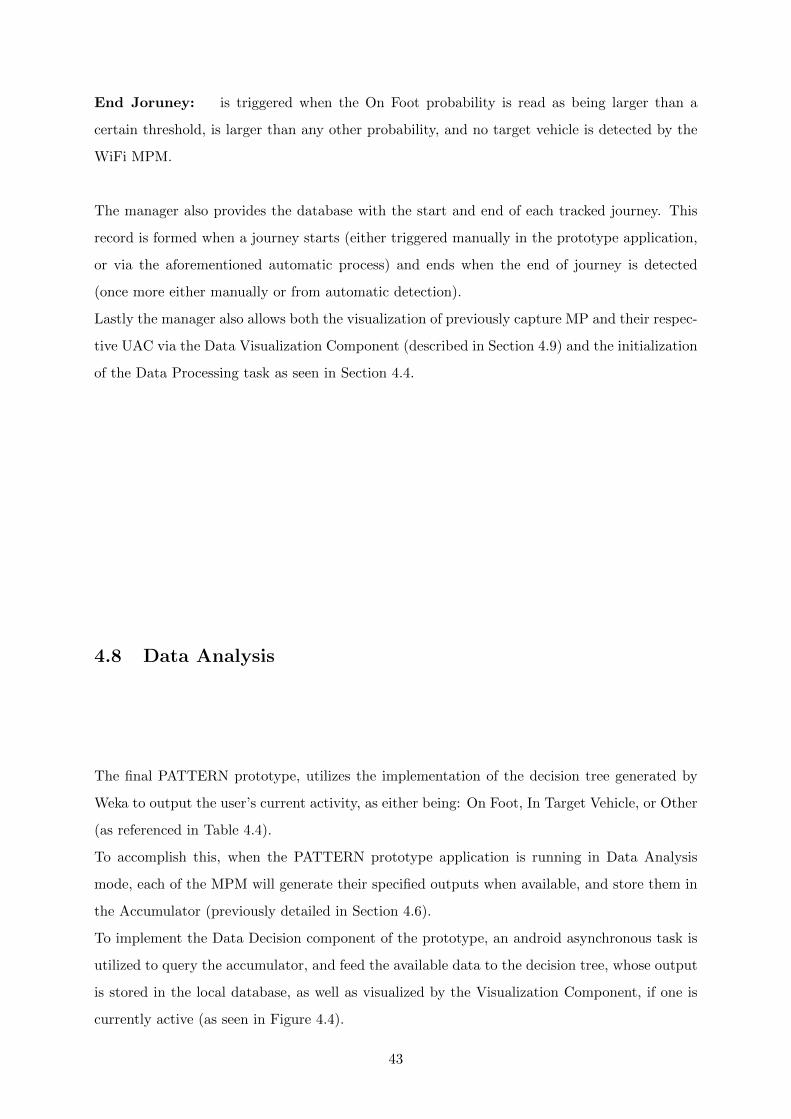
End Joruney: is triggered when the On Foot probability is read as being larger than a
certain threshold, is larger than any other probability, and no target vehicle is detected by the
WiFi MPM.
The manager also provides the database with the start and end of each tracked journey. This
record is formed when a journey starts (either triggered manually in the prototype application,
or via the aforementioned automatic process) and ends when the end of journey is detected
(once more either manually or from automatic detection).
Lastly the manager also allows both the visualization of previously capture MP and their respec-
tive UAC via the Data Visualization Component (described in Section 4.9) and the initialization
of the Data Processing task as seen in Section 4.4.
4.8 Data Analysis
The final PATTERN prototype, utilizes the implementation of the decision tree generated by
Weka to output the user’s current activity, as either being: On Foot, In Target Vehicle, or Other
(as referenced in Table 4.4).
To accomplish this, when the PATTERN prototype application is running in Data Analysis
mode, each of the MPM will generate their specified outputs when available, and store them in
the Accumulator (previously detailed in Section 4.6).
To implement the Data Decision component of the prototype, an android asynchronous task is
utilized to query the accumulator, and feed the available data to the decision tree, whose output
is stored in the local database, as well as visualized by the Visualization Component, if one is
currently active (as seen in Figure 4.4).
43
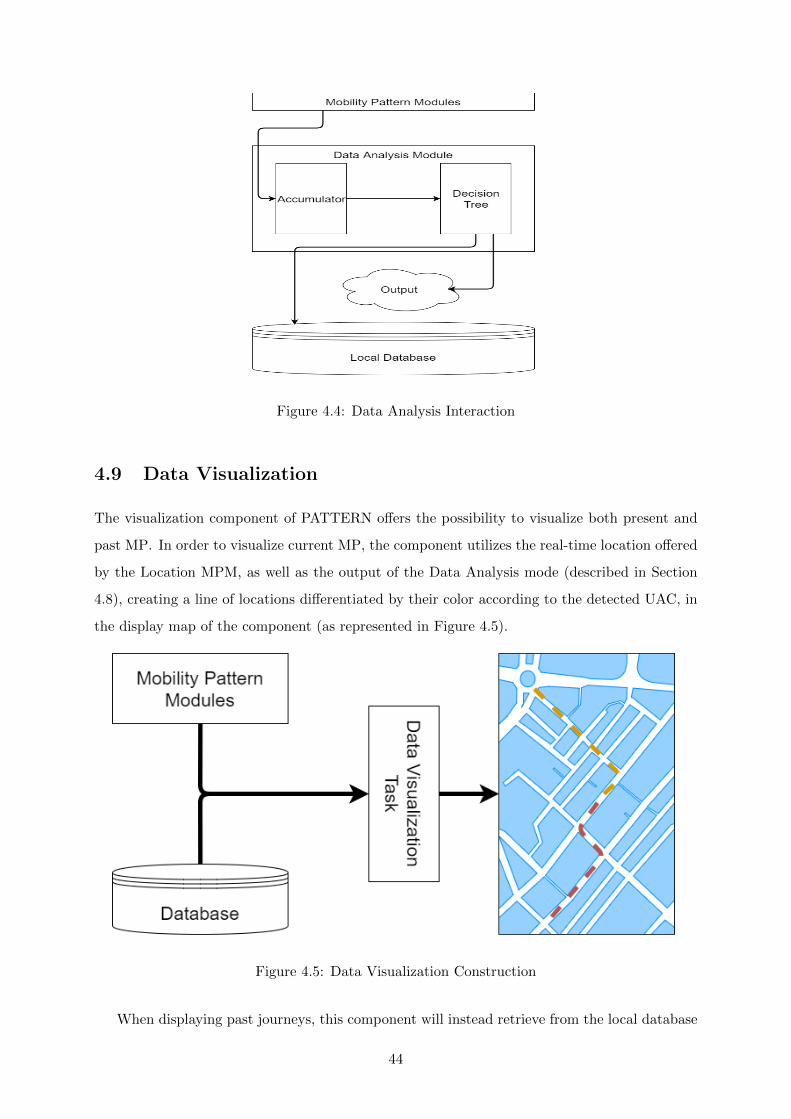
Figure 4.4: Data Analysis Interaction
4.9 Data Visualization
The visualization component of PATTERN offers the possibility to visualize both present and
past MP. In order to visualize current MP, the component utilizes the real-time location offered
by the Location MPM, as well as the output of the Data Analysis mode (described in Section
4.8), creating a line of locations differentiated by their color according to the detected UAC, in
the display map of the component (as represented in Figure 4.5).
Figure 4.5: Data Visualization Construction
When displaying past journeys, this component will instead retrieve from the local database
44
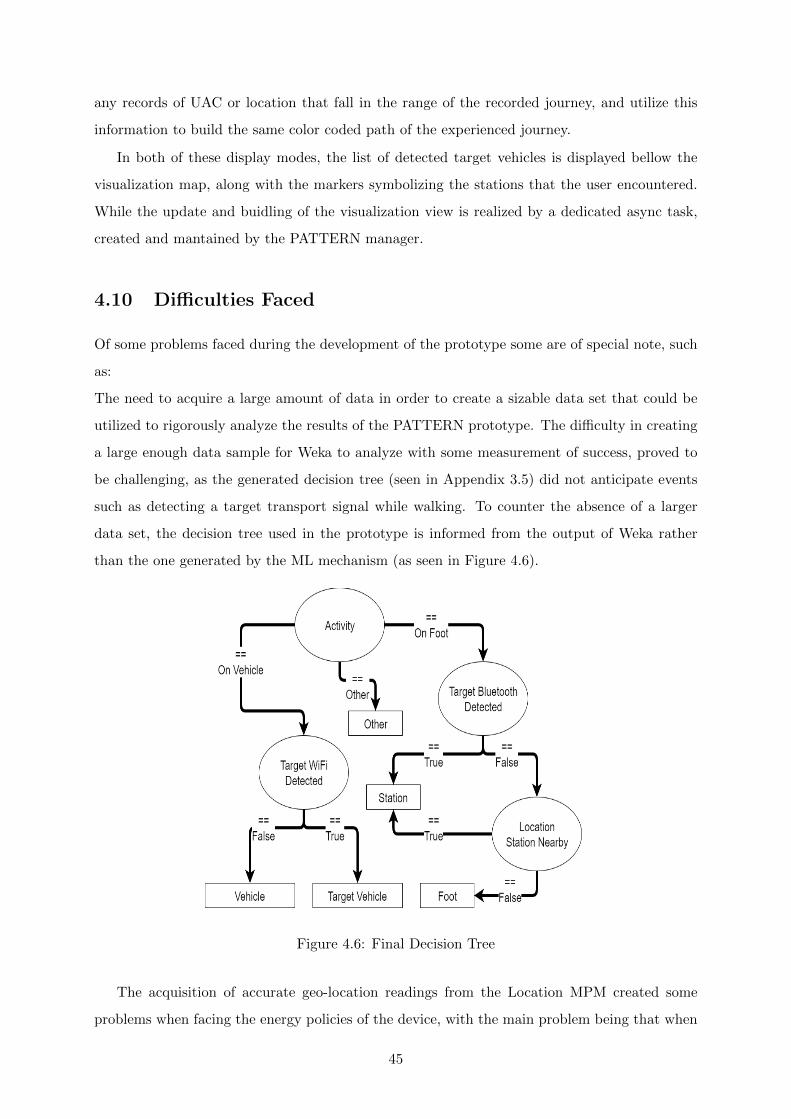
any records of UAC or location that fall in the range of the recorded journey, and utilize this
information to build the same color coded path of the experienced journey.
In both of these display modes, the list of detected target vehicles is displayed bellow the
visualization map, along with the markers symbolizing the stations that the user encountered.
While the update and buidling of the visualization view is realized by a dedicated async task,
created and mantained by the PATTERN manager.
4.10 Difficulties Faced
Of some problems faced during the development of the prototype some are of special note, such
as:
The need to acquire a large amount of data in order to create a sizable data set that could be
utilized to rigorously analyze the results of the PATTERN prototype. The difficulty in creating
a large enough data sample for Weka to analyze with some measurement of success, proved to
be challenging, as the generated decision tree (seen in Appendix 3.5) did not anticipate events
such as detecting a target transport signal while walking. To counter the absence of a larger
data set, the decision tree used in the prototype is informed from the output of Weka rather
than the one generated by the ML mechanism (as seen in Figure 4.6).
Figure 4.6: Final Decision Tree
The acquisition of accurate geo-location readings from the Location MPM created some
problems when facing the energy policies of the device, with the main problem being that when
45
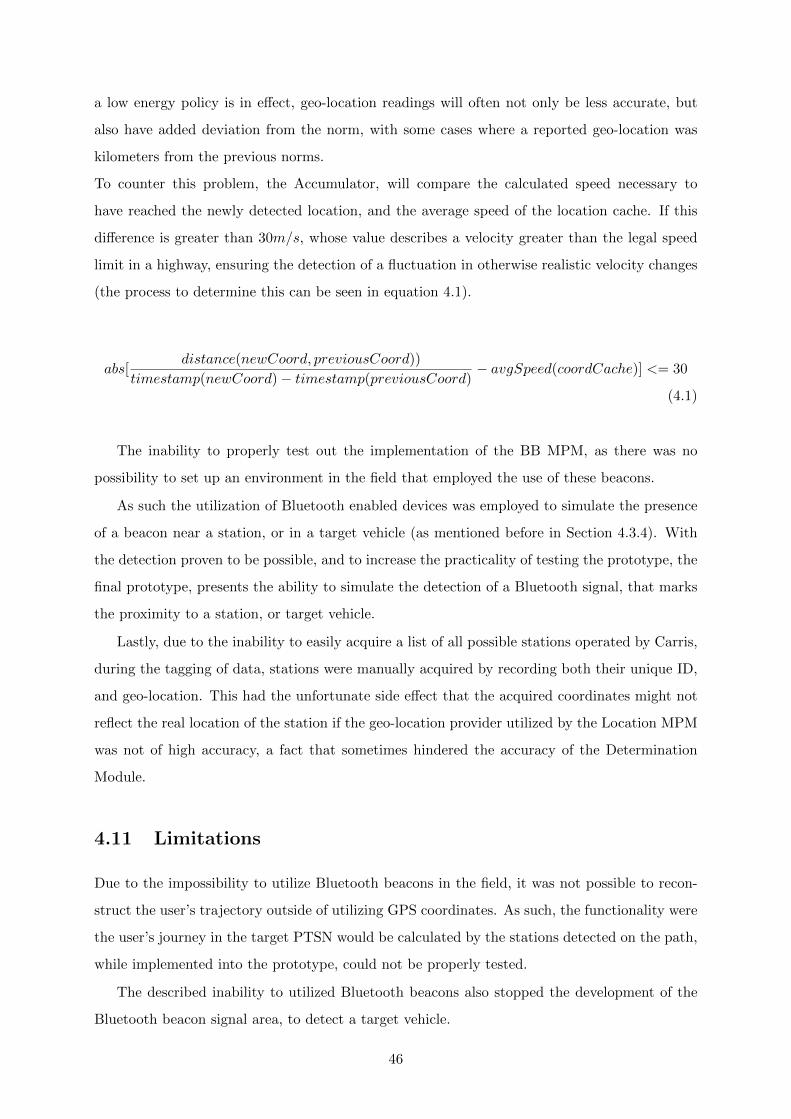
a low energy policy is in effect, geo-location readings will often not only be less accurate, but
also have added deviation from the norm, with some cases where a reported geo-location was
kilometers from the previous norms.
To counter this problem, the Accumulator, will compare the calculated speed necessary to
have reached the newly detected location, and the average speed of the location cache. If this
difference is greater than 30m/s, whose value describes a velocity greater than the legal speed
limit in a highway, ensuring the detection of a fluctuation in otherwise realistic velocity changes
(the process to determine this can be seen in equation 4.1).
abs[distance(newCoord, previousCoord))
timestamp(newCoord)− timestamp(previousCoord)− avgSpeed(coordCache)] <= 30
(4.1)
The inability to properly test out the implementation of the BB MPM, as there was no
possibility to set up an environment in the field that employed the use of these beacons.
As such the utilization of Bluetooth enabled devices was employed to simulate the presence
of a beacon near a station, or in a target vehicle (as mentioned before in Section 4.3.4). With
the detection proven to be possible, and to increase the practicality of testing the prototype, the
final prototype, presents the ability to simulate the detection of a Bluetooth signal, that marks
the proximity to a station, or target vehicle.
Lastly, due to the inability to easily acquire a list of all possible stations operated by Carris,
during the tagging of data, stations were manually acquired by recording both their unique ID,
and geo-location. This had the unfortunate side effect that the acquired coordinates might not
reflect the real location of the station if the geo-location provider utilized by the Location MPM
was not of high accuracy, a fact that sometimes hindered the accuracy of the Determination
Module.
4.11 Limitations
Due to the impossibility to utilize Bluetooth beacons in the field, it was not possible to recon-
struct the user’s trajectory outside of utilizing GPS coordinates. As such, the functionality were
the user’s journey in the target PTSN would be calculated by the stations detected on the path,
while implemented into the prototype, could not be properly tested.
The described inability to utilized Bluetooth beacons also stopped the development of the
Bluetooth beacon signal area, to detect a target vehicle.
46
Furthermore, while the strength of detected WiFi Signals was captured while data was
gathered, this information is not utilized in any form by the developed PATTERN prototype,
due to lack of a large enough pool of information that could make an impact in the Determination
Module of the prototype. This is the same for the Location MPM capability to detect UAC
changes from the perceived strength of the detected GPS or GSM signal.
Finally from the reduced amount of gathered data, the outputs of the various MPMs had to
be changed from direct data readings (such as signal strength, or activity probability) to more
absolute inputs (such as Boolean values) in an effort to ensure a more effective final output,
but as mentioned in Section 4.10, even this did not ensure a good enough tree to encompass all
possible situations.
47
4.12 Summary
With the specified information from previous chapters serving as a guideline for the implemen-
tation of the PATTERN prototype, the development of the specified modules and components
was accomplished with the following details:
• The Data Gather component was modified so that all MPM possess two modes of work,
one to gather data for the Weka to analyze, and another to feed the Determination Module.
• To facilitate the composition of the file to serve as input to Weka, a special Data Tag screen
was developed to be used by the prototype, where the Data Collection process could also
tag the data in real time.
• A dedicated process was created to analyse the collected data into the correct format
utilized by Weka.
• Some of the envisioned MPM were condensed into others, due to the utilized libraries
capabilities.
• A new data data aggregate structure was developed to facilitate internal data exchanges
and privacy of the analyzed data.
• The Determination Module could not be created only with the generated tree by Weka
and had to be inspired by it instead.
• The Visualization Module allows a user to inspect past and current MP.
With this developed work, the following chapter will detail how it performed according to
the initial objectives.
48
Chapter 5
Evaluation
5.1 Evaluation Methodology
The necessity to accurately measure the current user activity via the utilized decision tree plays
a major factor in determining the ability of the prototype to meet the purposed goals (specified
in Section 1.3). This means that both the decision tree and all modules need to have a certain
amount of fidelity to the reality they are trying to represent.
In essence, both the decision tree and the various MPMs that gather data need to reflect
with a high degree of accuracy on what the user is truly experiencing during his activities.
As such, a statistical analysis was realized on both in order to understand how accurate the
implementation of the system as a whole is, and on what level of fidelity each module can re-
port. To accurately represent the fidelity of the system, results will be classified according to
Table 5.1.
In order to accomplish the intended targets of accuracy and fidelity, the prototype was tested
in normal use case scenarios (such as testing while a user is on a target bus, or on daily activities),
and on a module basis (testing each module capability to generate results that reflect the real
UAC of the user). Both of these tests were realized in two different environments:
• A controlled environment (were external variables such as signal interference, and physical
obstacles can be controlled) that tested the concept of the system.
Table 5.1: Result Classification Table
Result Type Description
Correct — Component correctly deduced an answer.
Incorrect — Component incorrectly deduced an answer.
49
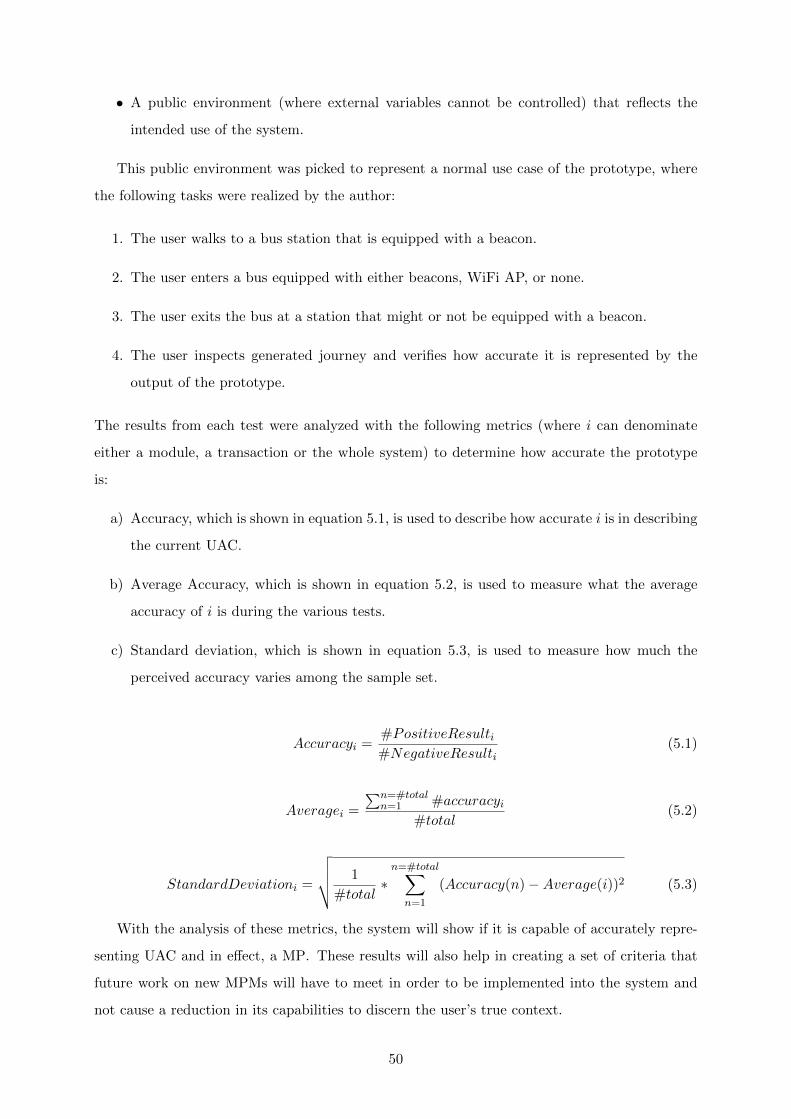
• A public environment (where external variables cannot be controlled) that reflects the
intended use of the system.
This public environment was picked to represent a normal use case of the prototype, where
the following tasks were realized by the author:
1. The user walks to a bus station that is equipped with a beacon.
2. The user enters a bus equipped with either beacons, WiFi AP, or none.
3. The user exits the bus at a station that might or not be equipped with a beacon.
4. The user inspects generated journey and verifies how accurate it is represented by the
output of the prototype.
The results from each test were analyzed with the following metrics (where i can denominate
either a module, a transaction or the whole system) to determine how accurate the prototype
is:
a) Accuracy, which is shown in equation 5.1, is used to describe how accurate i is in describing
the current UAC.
b) Average Accuracy, which is shown in equation 5.2, is used to measure what the average
accuracy of i is during the various tests.
c) Standard deviation, which is shown in equation 5.3, is used to measure how much the
perceived accuracy varies among the sample set.
Accuracyi =#PositiveResulti#NegativeResulti
(5.1)
Averagei =
∑n=#totaln=1 #accuracyi
#total(5.2)
StandardDeviationi =
√√√√ 1
#total∗n=#total∑
n=1
(Accuracy(n)−Average(i))2 (5.3)
With the analysis of these metrics, the system will show if it is capable of accurately repre-
senting UAC and in effect, a MP. These results will also help in creating a set of criteria that
future work on new MPMs will have to meet in order to be implemented into the system and
not cause a reduction in its capabilities to discern the user’s true context.
50
5.2 Test Methodology
During the development of the prototype several tests took place (whose results are detailed
further ahead in Section 5.3), according to the methodology mentioned in Section 5.1.
These tests were further classified as either Data Tagging Tests, or Data Analysis Tests.
The first ones intended to verify the behaviour each implemented MPM has in accomplishing
their intended function. On the other hand, the second ones intended to observe the behaviour
and performance of the prototype in achieving the initially proposed goals of this work.
5.2.1 Data Tagging Tests
Data Tagging Tests can be described as simple unitary tests on each of the developed MPM,
that took place in order to verify both their functionality and performance.
The tests in themselves can be separated into the categories mentioned in Section 5.1, as
either realized while on day-to-day activities, where the various modules inner workings were
observed, or controlled tests to ensure the correct behaviour of the MPM in question (with the
results of both types of tests detailed in Section 5.3.2).
Additionally, to specifically test the ability of correctly detecting a BT and WiFi signal, the
following specific tests took place:
WiFi Signal Test: In this test, a vehicle with WiFi capabilities was approached, boarded,
and exited, while monitoring the PATTERN WiFi MPM, with the module correctly detecting
the network moments before entry, during the trip, and moments before ending the trip (these
results can be analyzed in annex B.2 where an example of the captured database is shown)
Bluetooth Signal Test: In this test, a vehicle were a colleague was previously traveling on,
was utilized to test the ability of the PATTERN BT MPM to detect a target BT signal. The
colleague had with him a BT enabled android device, with an open channel, and the BT MPM
was capable of detecting the network while inside the vehicle (this result can be verified in
Appendix B.3 where an example of the captured database is shown).
5.2.2 Data Analysis Tests
These tests can be described as variations on the described use case for the PATTERN prototype
(as previously described in Section 3.1).
The accomplished tests can be classified into one of the following categories:
51
No Target Vehicle: During this type of test, the prototype was executing while in the
area of interest of the designated operator, but no target vehicles were engaged to accomplish a
journey (e.g.: utilizing a Uber vehicle to travel).
Target Vehicle: During this type of test, the prototype was executing while in the area
of interest of the designated operator, and the utilization of a target vehicle was realized to
accomplish a journey (e.g.: utilizing a Carris bus to travel).
Out of Area: During this type of test, the prototype was executing while outside the area of
interest of the designated operator, with no regard for what transportation method was utilized
in order to accomplish a journey (e.g.: traveling by boat to the target area).
As mentioned before in Section 4.10, it was not easy to simulate the utilization of BB in the
target transports. Adding to this due to the small number of vehicles equipped with WiFi
encountered during the realization of the tests, a simulation of detecting a target WiFi or BT
signal was employed, with care to simulate the observed results on the case described in the
previously mentioned Bluetooth Signal Test.
52
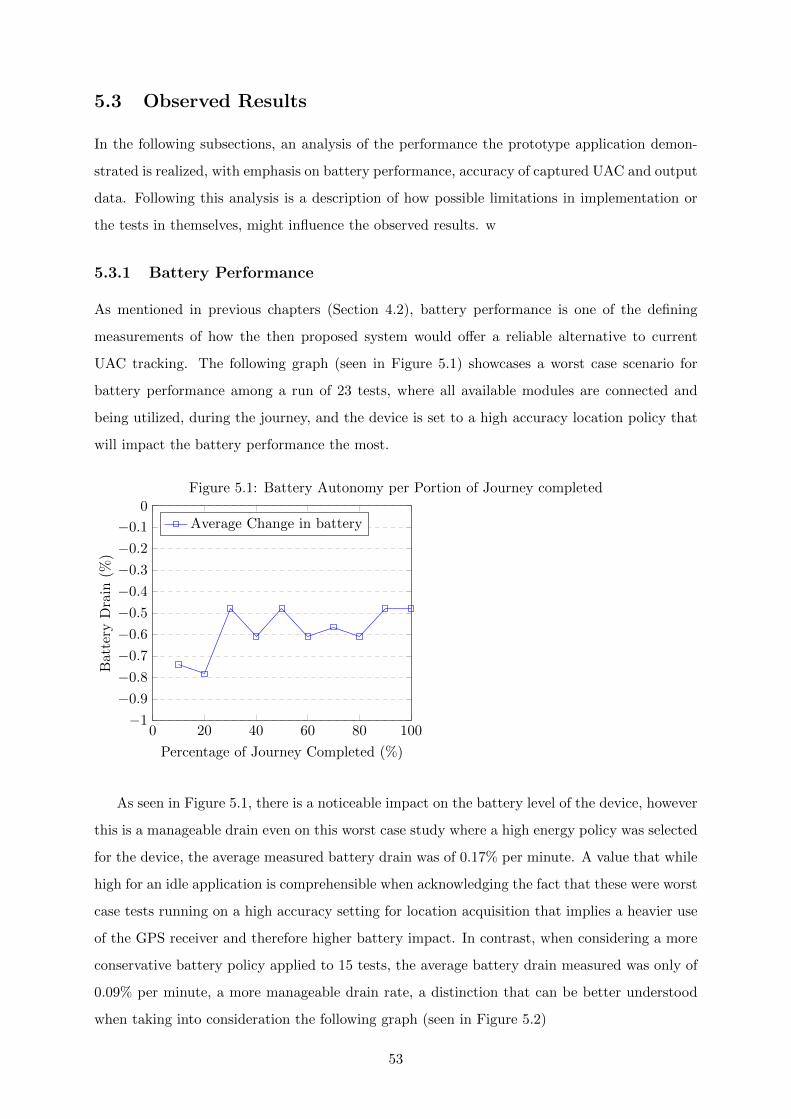
5.3 Observed Results
In the following subsections, an analysis of the performance the prototype application demon-
strated is realized, with emphasis on battery performance, accuracy of captured UAC and output
data. Following this analysis is a description of how possible limitations in implementation or
the tests in themselves, might influence the observed results. w
5.3.1 Battery Performance
As mentioned in previous chapters (Section 4.2), battery performance is one of the defining
measurements of how the then proposed system would offer a reliable alternative to current
UAC tracking. The following graph (seen in Figure 5.1) showcases a worst case scenario for
battery performance among a run of 23 tests, where all available modules are connected and
being utilized, during the journey, and the device is set to a high accuracy location policy that
will impact the battery performance the most.
Figure 5.1: Battery Autonomy per Portion of Journey completed
0 20 40 60 80 100
0
−0.1
−0.2
−0.3
−0.4
−0.5
−0.6
−0.7
−0.8
−0.9
−1
Percentage of Journey Completed (%)
Bat
tery
Dra
in(%
)
Average Change in battery
As seen in Figure 5.1, there is a noticeable impact on the battery level of the device, however
this is a manageable drain even on this worst case study where a high energy policy was selected
for the device, the average measured battery drain was of 0.17% per minute. A value that while
high for an idle application is comprehensible when acknowledging the fact that these were worst
case tests running on a high accuracy setting for location acquisition that implies a heavier use
of the GPS receiver and therefore higher battery impact. In contrast, when considering a more
conservative battery policy applied to 15 tests, the average battery drain measured was only of
0.09% per minute, a more manageable drain rate, a distinction that can be better understood
when taking into consideration the following graph (seen in Figure 5.2)
53
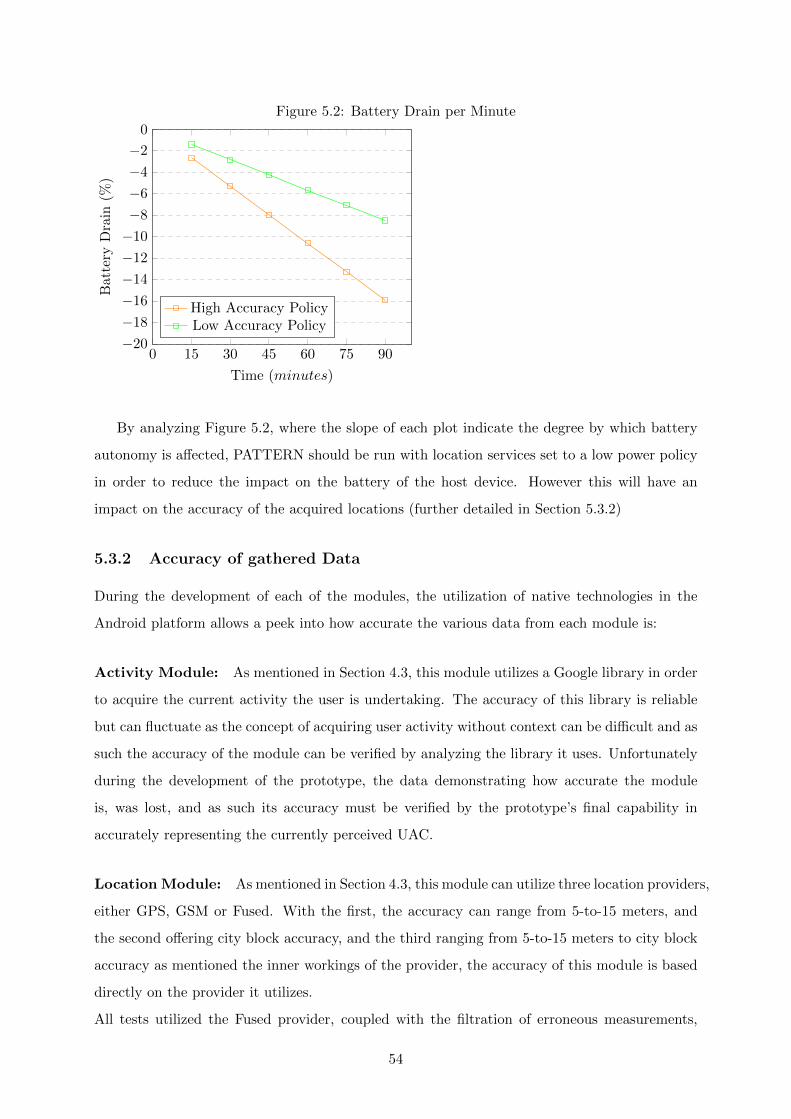
Figure 5.2: Battery Drain per Minute
0 15 30 45 60 75 90
0
−2
−4
−6
−8
−10
−12
−14
−16
−18
−20
Time (minutes)
Batt
ery
Dra
in(%
)
High Accuracy PolicyLow Accuracy Policy
By analyzing Figure 5.2, where the slope of each plot indicate the degree by which battery
autonomy is affected, PATTERN should be run with location services set to a low power policy
in order to reduce the impact on the battery of the host device. However this will have an
impact on the accuracy of the acquired locations (further detailed in Section 5.3.2)
5.3.2 Accuracy of gathered Data
During the development of each of the modules, the utilization of native technologies in the
Android platform allows a peek into how accurate the various data from each module is:
Activity Module: As mentioned in Section 4.3, this module utilizes a Google library in order
to acquire the current activity the user is undertaking. The accuracy of this library is reliable
but can fluctuate as the concept of acquiring user activity without context can be difficult and as
such the accuracy of the module can be verified by analyzing the library it uses. Unfortunately
during the development of the prototype, the data demonstrating how accurate the module
is, was lost, and as such its accuracy must be verified by the prototype’s final capability in
accurately representing the currently perceived UAC.
Location Module: As mentioned in Section 4.3, this module can utilize three location providers,
either GPS, GSM or Fused. With the first, the accuracy can range from 5-to-15 meters, and
the second offering city block accuracy, and the third ranging from 5-to-15 meters to city block
accuracy as mentioned the inner workings of the provider, the accuracy of this module is based
directly on the provider it utilizes.
All tests utilized the Fused provider, coupled with the filtration of erroneous measurements,
54
with the device policy only affecting the level of resolution of the captured path undertook in
the journey (as seen in Appendix A.2 and Appendix A.3, were respectively examples of worst
case calculated paths can be seen for a high and low device location policy).
WiFi Module: As this module utilizes the native android library for WiFi interaction, the
accuracy of the acquired data can be verified in publicly available studies, and falls outside
the scope of this project to delve into the accuracy of the WiFi sensor each Android device is
equipped with.
BT Module: As this module utilizes the native android library for BT interaction, the accu-
racy of the acquired data can be verified in publicly available studies, and falls outside the scope
of this project.
Finally for the main mechanism of the prototype, during the testing phase of the application, a
record was kept of how often the prototype correctly and incorrectly outputted the current UAC
during a journey, with the prototype being able to correctly indicate the correct UAC 93.42%
of the time with a standard deviation of 0.077%. This result was obtained by analyzing a set of
38 tests (23 with the device location policy set on High, and 15 with the device location policy
set on battery saving), with the lowest measured accuracy of 98.05% and the best measured at
87.60% (respectively in journeys that took 1h10m and 34m and both with a the location policy
set to high).
These results allow for the affirmation that the prototype does indeed prove capable of cor-
rectly calculating the current UAC, as well as track the location of the user with a high degree
of accuracy.
5.3.3 Test Device and Environment
All the mentioned tests and development took place while utilizing a OnePlus 3T android smart-
phone, whose specifications can be seen in Table 5.2.
55
Table 5.2: Test Device Specifications (OnePlus 3T)
Component Specification
OS 7.1.1 (Nougat)
CPU Qualcomm MSM8996 Snapdragon 821
RAM 6 GB
Battery Li-Ion 3400 mAh battery
The testing environment was spread across 4 Operators with only one being targeted (Carris),
a total of 38 journeys were realized, distributed among various lines, as seen in Table 5.3.
Table 5.3: Test details
Operator Line Total Trips
Carris 735 12
Carris 714 8
Carris 728 6
Vimeca 15 1
Metro Green 4
Metro Blue 4
TCB 14 2
TCB 7 1
5.3.4 Test Limitations
As indicated previously, the nature of the utilized data to effectively obtain the user’s activity is
prone to some errors, which are derived from the inherent inconsistency of some of the modules
as previously specified (in Section 5.3.2).
It should also be noted that the results displayed in Section 5.3.1, do not take into account a
control sample of journeys (where the use of battery was tightly regulated, to ensure a baseline
measurement) which were undertaken without the PATTERN prototype running. While this
does render the information somewhat inaccurate, as a worst case analysis it is still valid.
5.4 Summary
With the evaluation methodology utilized, it was possible to understand the power consumption
of the developed prototype, and accuracy in correctly capturing the UAC of a user.
While the battery consumption is dependent on the device policy for location acquisition, it
56

demonstrates that in a worst case scenario, while not being a desired power utilization rate, it is
still manageable. When a more conservative policy is utilized, the drain is much more realistic
for a tracking system that intends on being seamless to the user, as well as having almost no
noticeable impact on the geographic tagging of a user’s path.
The results should also be taken into consideration on the limitations faced during the testing,
such as inability to ignore screen drain in its entirety, and difficulties in analyzing the Mobility
MPM accuracy in its performance.
57

58
Chapter 6
Conclusions
This chapter, follows a short analysis of how the obtained results figure into the realized im-
plementation, the utilized architecture, and how this correlates with the accomplishment of the
initially proposed goals.
6.1 Achievements
As seen in Section 5.3.2 the developed prototype proved to be able to have a high degree of
accuracy in acquiring the current User Activity Contexts, while also observing a low cost in
power when considering the location policy in use by the host device, proving that it is possible
to create a system that does not require the addition of new infrastructure by the operator in
order to effectively track user Mobility Pattern.
Even when taking into account the failure in fully testing the utilization of Bluetooth bea-
cons and WiFi Access Point integration into the prototype, the developed solution still proved
to be effective in acquiring the correct locations and activities of the user. Additionally the
capability to easily implement and use the proposed design is evident, in particular when con-
sidering that some components (all of the implemented MPM and the Accumulator) are already
being utilized by CARD4B in other projects.
However due to the lack of a larger data sample, the goal of developing a system capable of
correctly determining Mobility Pattern with help of Machine Learning Techniques proved to be
ineffective, while still showcasing the viability of applying Machine Learning to the solution as
the incorrect output tree was still a good basis to work out the correct decision tree.
59
6.2 Future Work
As mentioned in Section 4.11, the lack of some features derived from the inability to utilize Blue-
tooth beacons during development to fully test the ability to acquire a state of proximity to a
given station or vehicle. This means that the developed prototype is still reliant on geo-location
acquisition to properly function, and as such this feature is left for future work.
Furthermore, the ability to track the user on the PTSN can still benefit from added capabili-
ties, such as the utilization of added methods (via machine learning or new context detection
mechanisms) to further understand when a station is nearby without the utilization of GPS
location or explicit Bluetooth beacons, possibly by sampling the physical locations of stations
for ”long term” landmark features (such as WiFi Access Points), and utilizing the presence of
these landmarks to understand the context of being near a station.
60
Bibliography
[AAH+09] Theodoros Anagnostopoulos, Christos Anagnostopoulos, Stathes Hadjiefthymiades,
Miltos Kyriakakos, and Alexandros Kalousis. Predicting the location of mobile
users: a machine learning approach. In Proceedings of the 2009 international con-
ference on Pervasive services, pages 65–72. ACM, 2009.
[AB12] Kerem Altun and Billur Barshan. Pedestrian dead reckoning employing simultane-
ous activity recognition cues. Measurement Science and Technology, 23(2):025103,
2012.
[AHS03] S. Siddiqi A. Howard and G.S. Sukhatme. An experimental study of localization
using wireless ethernet. In Proceedings of the International Conference on Field
and Service Robotics, July 2003.
[APBC08] Sofıa Aparicio, Javier Perez, Ana M Bernardos, and Jose R Casar. A fusion method
based on bluetooth and wlan technologies for indoor location. In Multisensor Fu-
sion and Integration for Intelligent Systems, 2008. MFI 2008. IEEE International
Conference on, pages 487–491. IEEE, 2008.
[Bis01] Chatschik Bisdikian. An overview of the bluetooth wireless technology. IEEE
Communications magazine, 39(12):86–94, 2001.
[Bis06] Christopher M Bishop. Pattern recognition and machine learning. Springer, 2006.
[CCCW08] Chao-Ho Chen, Yin-Chan Chang, Tsong-Yi Chen, and Da-Jinn Wang. People
counting system for getting in/out of a bus based on video processing. In 2008
Eighth International Conference on Intelligent Systems Design and Applications,
volume 3, pages 565–569. IEEE, 2008.
[Cen16] Pew Research Center. Smartphone ownership and internet usage continues to climb
in emerging economies - http://www.pewglobal.org/2016/02/22/smartphone-
61
ownership-and-internet-usage-continues-to-climb-in-emerging-economies, 2016.
[Online; accessed 01-May-2017].
[CH10] Aaron Carroll and Gernot Heiser. An analysis of power consumption in a smart-
phone. In USENIX annual technical conference, volume 14. Boston, MA, 2010.
[CLCG15] Rui Couto, Joao Leal, Pedro Maurıcio Costa, and Teresa Galvao. Exploring tick-
eting approaches using mobile technologies: Qr codes, nfc and ble. In 2015 IEEE
18th International Conference on Intelligent Transportation Systems, pages 7–12.
IEEE, 2015.
[CMGSS13] Daniel Camps-Mur, Andres Garcia-Saavedra, and Pablo Serrano. Device-to-device
communications with wi-fi direct: overview and experimentation. IEEE wireless
communications, 20(3):96–104, 2013.
[CMMG12] Kevin Curran, Amanda Millar, and Conor Mc Garvey. Near field communication.
International Journal of Electrical and Computer Engineering, 2(3):371, 2012.
[CSC+06] Mike Y Chen, Timothy Sohn, Dmitri Chmelev, Dirk Haehnel, Jeffrey Hightower,
Jeff Hughes, Anthony LaMarca, Fred Potter, Ian Smith, and Alex Varshavsky. Prac-
tical metropolitan-scale positioning for gsm phones. In International Conference
on Ubiquitous Computing, pages 225–242. Springer, 2006.
[dBC16] Jose Miguel Nobre de Brito Camacho. Iot middleware for precision agriculture. Mas-
ter’s thesis, Instituto Superior Tecnico, Universidade de Lisboa, November 2016.
[FH14a] Ramsey Faragher and R Harle. An analysis of the accuracy of bluetooth low energy
for indoor positioning applications. In Proceedings of the 27th International Tech-
nical Meeting of The Satellite Division of the Institute of Navigation (ION GNSS+
2014), Tampa, FL, USA, volume 812, 2014.
[FH14b] Ramsey Faragher and R Harle. An analysis of the accuracy of bluetooth low energy
for indoor positioning applications. In Proceedings of the 27th International Tech-
nical Meeting of The Satellite Division of the Institute of Navigation (ION GNSS+
2014), Tampa, FL, USA, volume 812, 2014.
[FH14c] Ramsey Faragher and R Harle. An analysis of the accuracy of bluetooth low energy
for indoor positioning applications. In Proceedings of the 27th International Tech-
nical Meeting of The Satellite Division of the Institute of Navigation (ION GNSS+
2014), Tampa, FL, USA, volume 812, 2014.
62
[FP02] David A. Forsyth and Jean Ponce. Computer Vision: A Modern Approach. Prentice
Hall Professional Technical Reference, 2002.
[GHB08] Marta C Gonzalez, Cesar A Hidalgo, and Albert-Laszlo Barabasi. Understanding
individual human mobility patterns. Nature, 453(7196):779–782, 2008.
[Goo16] Google. Google analytics solutions - https://www.google.com/analytics/analytics/,
2016. [Online; accessed 01-May-2017].
[Goo17] Google. Google play services - api and skd levels -
https://developers.google.com/android/guides/setup, 2017. [Online; accessed
01-May-2017].
[GOP12] Carles Gomez, Joaquim Oller, and Josep Paradells. Overview and evaluation
of bluetooth low energy: An emerging low-power wireless technology. Sensors,
12(9):11734–11753, 2012.
[Gra17] Watson Gray. OrmLite lightweight java orm supports android and sqlite -
http://ormlite.com, 2017. [Online; accessed 01-May-2017].
[GSB02] Hans W Gellersen, Albercht Schmidt, and Michael Beigl. Multi-sensor context-
awareness in mobile devices and smart artifacts. Mobile Networks and Applications,
7(5):341–351, 2002.
[GWY+15] Bin Guo, Zhu Wang, Zhiwen Yu, Yu Wang, Neil Y Yen, Runhe Huang, and Xingshe
Zhou. Mobile crowd sensing and computing: The review of an emerging human-
powered sensing paradigm. ACM Computing Surveys (CSUR), 48(1):7, 2015.
[Hen03] CliffRandell ChrisDjiallis HenkMuller. Personal position measurement using dead
reckoning. In Proceedings of the Seventh IEEE International Symposium on Wear-
able Computers (ISWC’03), volume 1530, pages 17–00, 2003.
[Her96] Thomas A Herring. The global positioning system. Scientific American, 274(2),
1996.
[HPK11] Jiawei Han, Jian Pei, and Micheline Kamber. Data mining: concepts and techniques.
Elsevier, 2011.
[Int16] Clever Way Mobile International. Tcb – transportes colectivos do barreiro -
http://cleverwaymobile.com/?project=2398, 2016. [Online; accessed 01-May-2017].
63
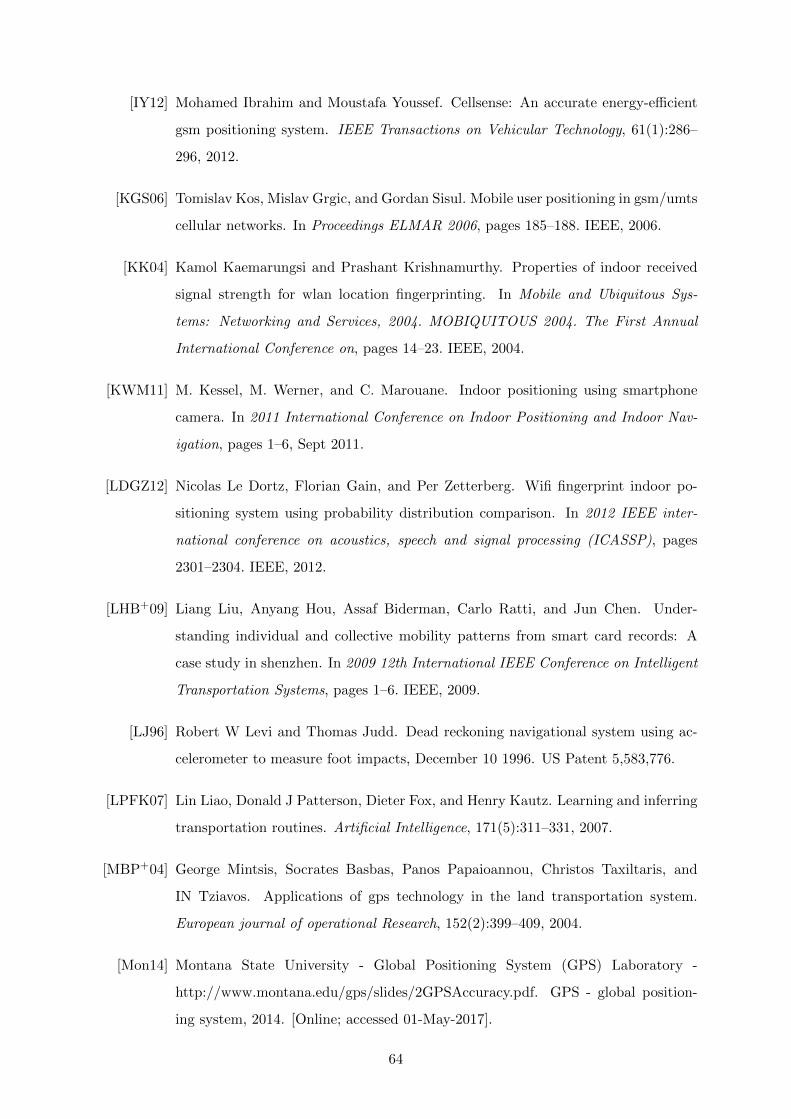
[IY12] Mohamed Ibrahim and Moustafa Youssef. Cellsense: An accurate energy-efficient
gsm positioning system. IEEE Transactions on Vehicular Technology, 61(1):286–
296, 2012.
[KGS06] Tomislav Kos, Mislav Grgic, and Gordan Sisul. Mobile user positioning in gsm/umts
cellular networks. In Proceedings ELMAR 2006, pages 185–188. IEEE, 2006.
[KK04] Kamol Kaemarungsi and Prashant Krishnamurthy. Properties of indoor received
signal strength for wlan location fingerprinting. In Mobile and Ubiquitous Sys-
tems: Networking and Services, 2004. MOBIQUITOUS 2004. The First Annual
International Conference on, pages 14–23. IEEE, 2004.
[KWM11] M. Kessel, M. Werner, and C. Marouane. Indoor positioning using smartphone
camera. In 2011 International Conference on Indoor Positioning and Indoor Nav-
igation, pages 1–6, Sept 2011.
[LDGZ12] Nicolas Le Dortz, Florian Gain, and Per Zetterberg. Wifi fingerprint indoor po-
sitioning system using probability distribution comparison. In 2012 IEEE inter-
national conference on acoustics, speech and signal processing (ICASSP), pages
2301–2304. IEEE, 2012.
[LHB+09] Liang Liu, Anyang Hou, Assaf Biderman, Carlo Ratti, and Jun Chen. Under-
standing individual and collective mobility patterns from smart card records: A
case study in shenzhen. In 2009 12th International IEEE Conference on Intelligent
Transportation Systems, pages 1–6. IEEE, 2009.
[LJ96] Robert W Levi and Thomas Judd. Dead reckoning navigational system using ac-
celerometer to measure foot impacts, December 10 1996. US Patent 5,583,776.
[LPFK07] Lin Liao, Donald J Patterson, Dieter Fox, and Henry Kautz. Learning and inferring
transportation routines. Artificial Intelligence, 171(5):311–331, 2007.
[MBP+04] George Mintsis, Socrates Basbas, Panos Papaioannou, Christos Taxiltaris, and
IN Tziavos. Applications of gps technology in the land transportation system.
European journal of operational Research, 152(2):399–409, 2004.
[Mon14] Montana State University - Global Positioning System (GPS) Laboratory -
http://www.montana.edu/gps/slides/2GPSAccuracy.pdf. GPS - global position-
ing system, 2014. [Online; accessed 01-May-2017].
64
[Net13] Miguel Rosa Neto. My mobile assistant -
https://fenix.tecnico.ulisboa.pt/cursos/meec/dissertacao/2353642445242, 2013.
[Online; accessed 01-May-2017].
[OTTL10] Christian Oberli, Miguel Torres-Torriti, and Dan Landau. Performance evalua-
tion of uhf rfid technologies for real-time passenger recognition in intelligent public
transportation systems. IEEE transactions on intelligent transportation systems,
11(3):748–753, 2010.
[oW17] University of Waikato. Weka 3: data mining software in java -
https://www.cs.waikato.ac.nz/ml/weka/, 2017. [Online; accessed 01-May-2017].
[Par15] Ricardo Emanuel Maia Paradela. Emulacao de tıtulo de transporte
seguro em telemovel android - https://fenix.tecnico.ulisboa.pt/cursos/meic-
a/dissertacao/1972678479052913, 2015. [Online; accessed 01-May-2017].
[PBM+06] Neil Paulley, Richard Balcombe, Roger Mackett, Helena Titheridge, John Preston,
Mark Wardman, Jeremy Shires, and Peter White. The demand for public transport:
The effects of fares, quality of service, income and car ownership. Transport Policy,
13(4):295–306, 2006.
[Poi16] Pointr Labs. Beacons: Everything you need to know. -
http://www.pointrlabs.com/blog/beacons-everything-you-need-to-know/, 2016.
[Online; accessed 01-May-2017].
[Rah93] Moe Rahnema. Overview of the gsm system and protocol architecture. IEEE
Communications magazine, 31(4):92–100, 1993.
[RI06] Alexander Repenning and Andri Ioannidou. Mobility agents: guiding and tracking
public transportation users. In Proceedings of the working conference on Advanced
visual interfaces, pages 127–134. ACM, 2006.
[RMB+10] Sasank Reddy, Min Mun, Jeff Burke, Deborah Estrin, Mark Hansen, and Mani
Srivastava. Using mobile phones to determine transportation modes. ACM Trans-
actions on Sensor Networks (TOSN), 6(2):13, 2010.
[RWRC14] Nirupam Roy, He Wang, and Romit Roy Choudhury. I am a smartphone and i can
tell my user’s walking direction. In Proceedings of the 12th annual international
conference on Mobile systems, applications, and services, pages 329–342. ACM,
2014.
65
[SHNN12] Matti Siekkinen, Markus Hiienkari, Jukka K Nurminen, and Johanna Nieminen.
How low energy is bluetooth low energy? comparative measurements with zig-
bee/802.15. 4. In Wireless Communications and Networking Conference Workshops
(WCNCW), 2012 IEEE, pages 232–237. IEEE, 2012.
[SLYP13] Jungmin So, Joo-Yub Lee, Cheal-Hwan Yoon, and Hyunjae Park. An improved
location estimation method for wifi fingerprint-based indoor localization. Interna-
tional Journal of Software Engineering and Its Applications, 7(3):77–86, 2013.
[THR07] Stephen Teang Soo Thong, Chua Tien Han, and Tharek Abdul Rahman. Intelligent
fleet management system with concurrent gps & gsm real-time positioning technol-
ogy. In 2007 7th International Conference on ITS Telecommunications, pages 1–6.
IEEE, 2007.
[UIT16] UITP. Statistics Brief local public transport in the european
union - http://www.uitp.org/sites/default/files/cck-focus-papers-
files/uitpstatisticsptineudef0.pdf, 2016. [Online; accessed01−May − 2017].
66
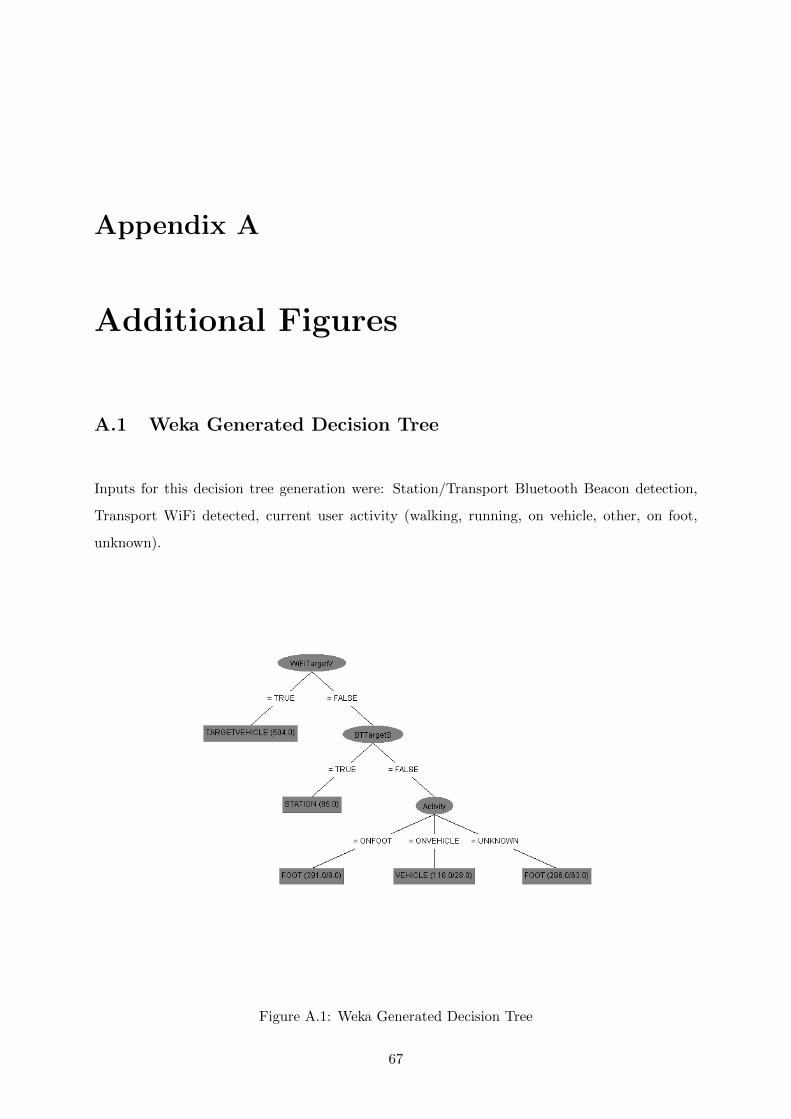
Appendix A
Additional Figures
A.1 Weka Generated Decision Tree
Inputs for this decision tree generation were: Station/Transport Bluetooth Beacon detection,
Transport WiFi detected, current user activity (walking, running, on vehicle, other, on foot,
unknown).
Figure A.1: Weka Generated Decision Tree
67
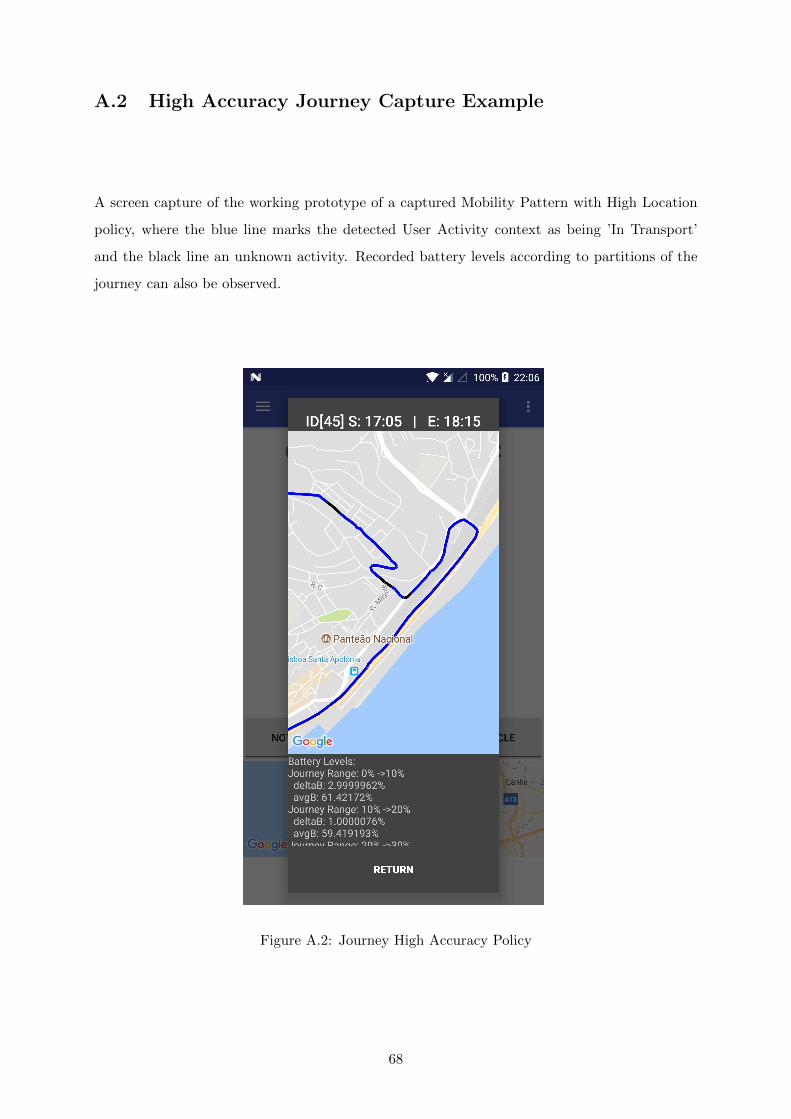
A.2 High Accuracy Journey Capture Example
A screen capture of the working prototype of a captured Mobility Pattern with High Location
policy, where the blue line marks the detected User Activity context as being ’In Transport’
and the black line an unknown activity. Recorded battery levels according to partitions of the
journey can also be observed.
Figure A.2: Journey High Accuracy Policy
68
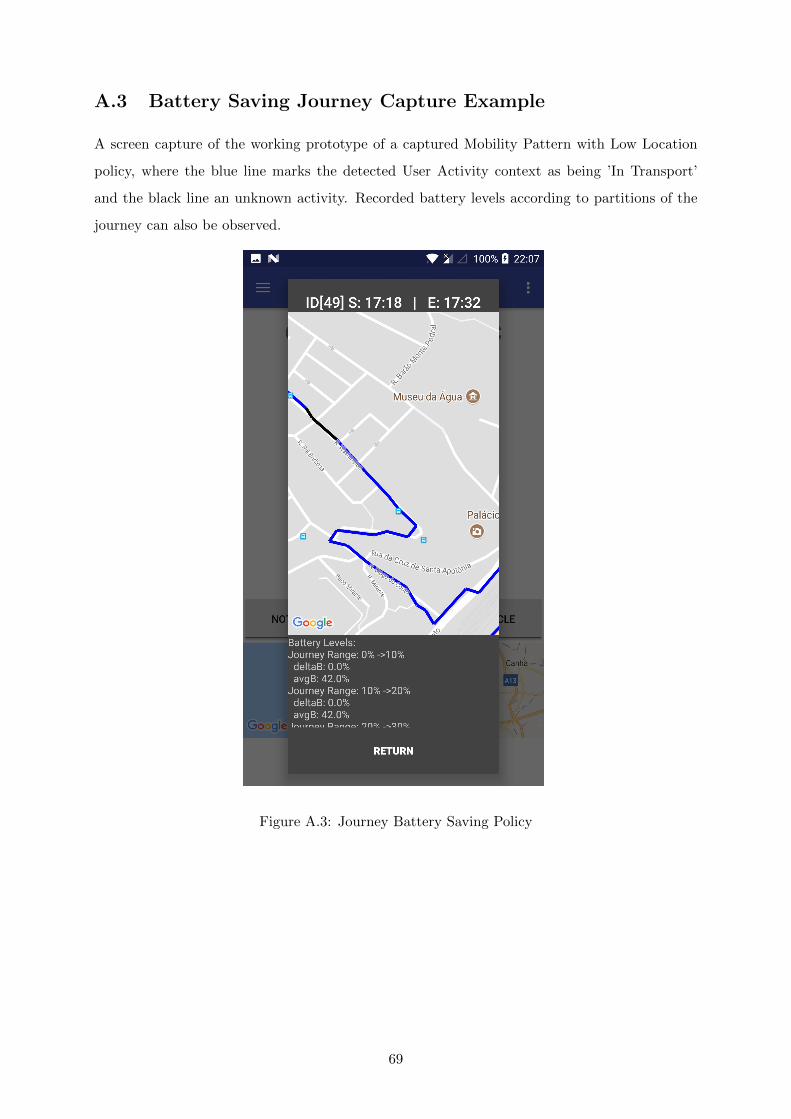
A.3 Battery Saving Journey Capture Example
A screen capture of the working prototype of a captured Mobility Pattern with Low Location
policy, where the blue line marks the detected User Activity context as being ’In Transport’
and the black line an unknown activity. Recorded battery levels according to partitions of the
journey can also be observed.
Figure A.3: Journey Battery Saving Policy
69

70
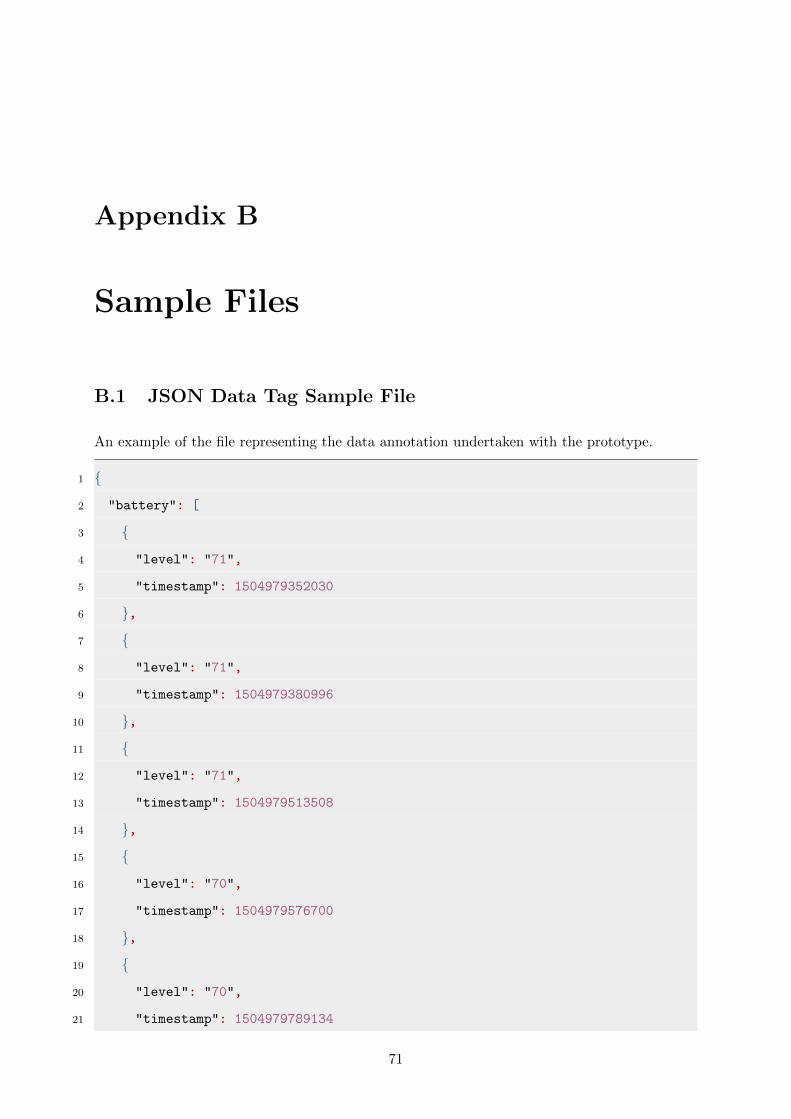
Appendix B
Sample Files
B.1 JSON Data Tag Sample File
An example of the file representing the data annotation undertaken with the prototype.
1 {
2 "battery": [
3 {
4 "level": "71",
5 "timestamp": 1504979352030
6 },
7 {
8 "level": "71",
9 "timestamp": 1504979380996
10 },
11 {
12 "level": "71",
13 "timestamp": 1504979513508
14 },
15 {
16 "level": "70",
17 "timestamp": 1504979576700
18 },
19 {
20 "level": "70",
21 "timestamp": 1504979789134
71
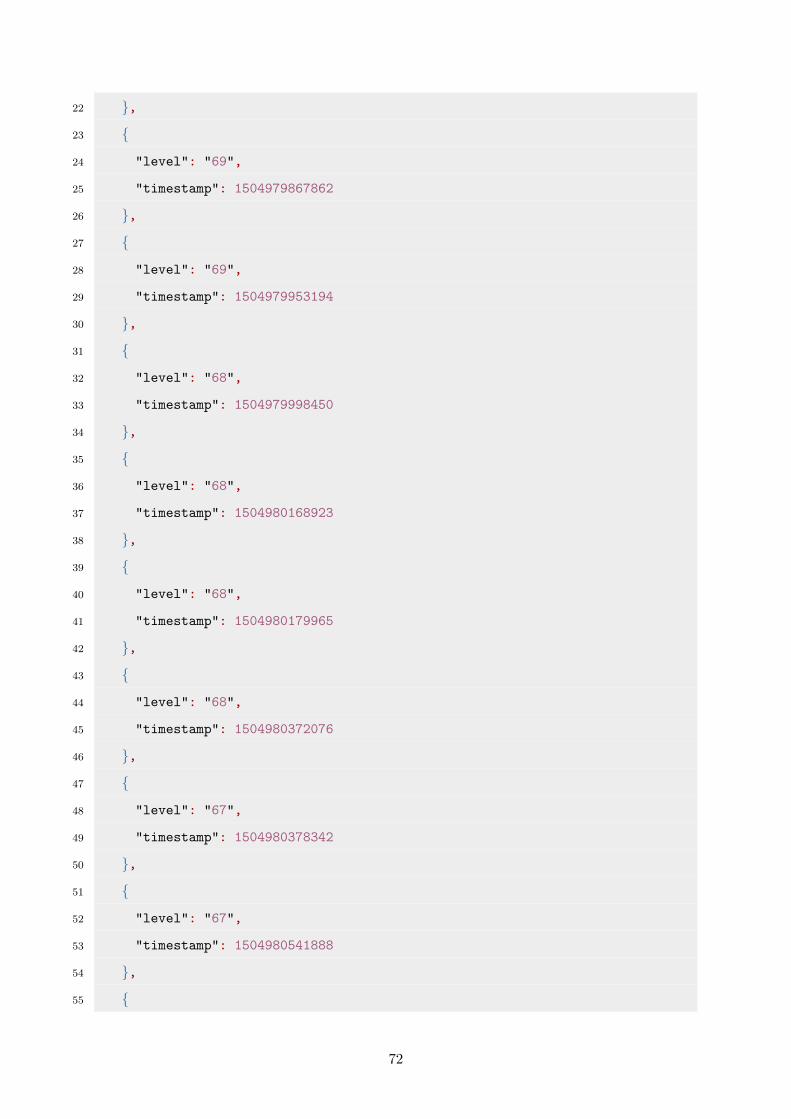
22 },
23 {
24 "level": "69",
25 "timestamp": 1504979867862
26 },
27 {
28 "level": "69",
29 "timestamp": 1504979953194
30 },
31 {
32 "level": "68",
33 "timestamp": 1504979998450
34 },
35 {
36 "level": "68",
37 "timestamp": 1504980168923
38 },
39 {
40 "level": "68",
41 "timestamp": 1504980179965
42 },
43 {
44 "level": "68",
45 "timestamp": 1504980372076
46 },
47 {
48 "level": "67",
49 "timestamp": 1504980378342
50 },
51 {
52 "level": "67",
53 "timestamp": 1504980541888
54 },
55 {
72
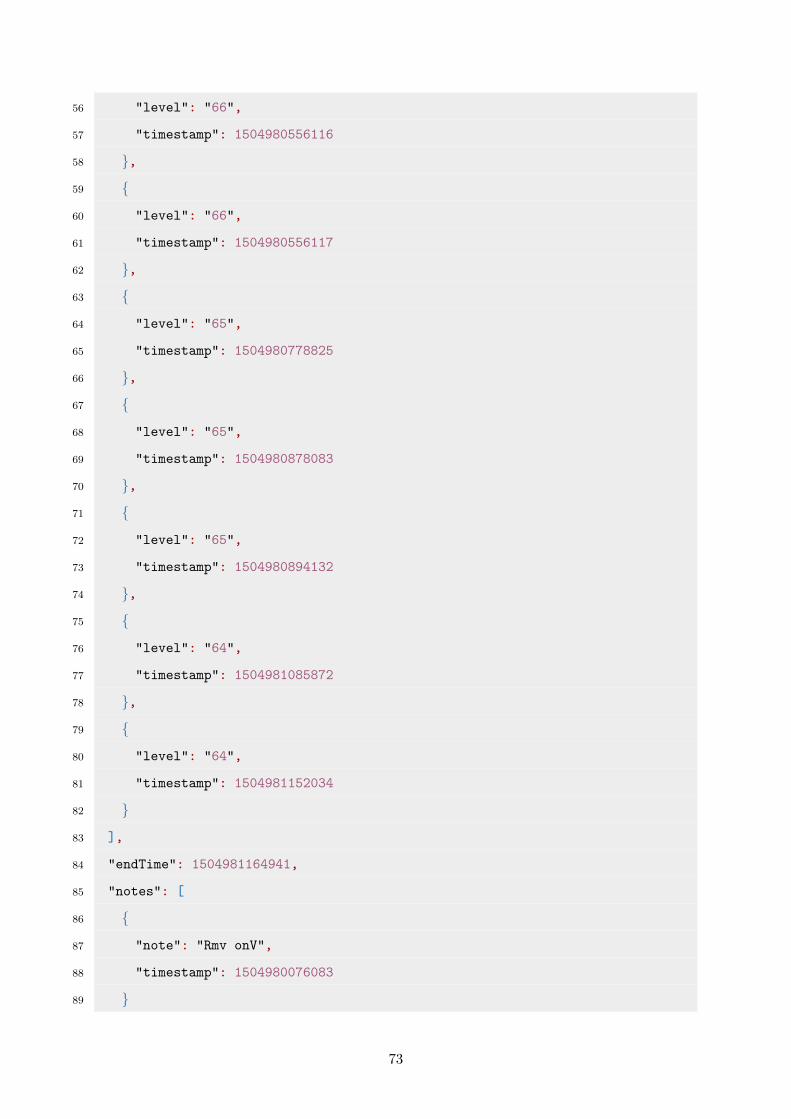
56 "level": "66",
57 "timestamp": 1504980556116
58 },
59 {
60 "level": "66",
61 "timestamp": 1504980556117
62 },
63 {
64 "level": "65",
65 "timestamp": 1504980778825
66 },
67 {
68 "level": "65",
69 "timestamp": 1504980878083
70 },
71 {
72 "level": "65",
73 "timestamp": 1504980894132
74 },
75 {
76 "level": "64",
77 "timestamp": 1504981085872
78 },
79 {
80 "level": "64",
81 "timestamp": 1504981152034
82 }
83 ],
84 "endTime": 1504981164941,
85 "notes": [
86 {
87 "note": "Rmv onV",
88 "timestamp": 1504980076083
89 }
73
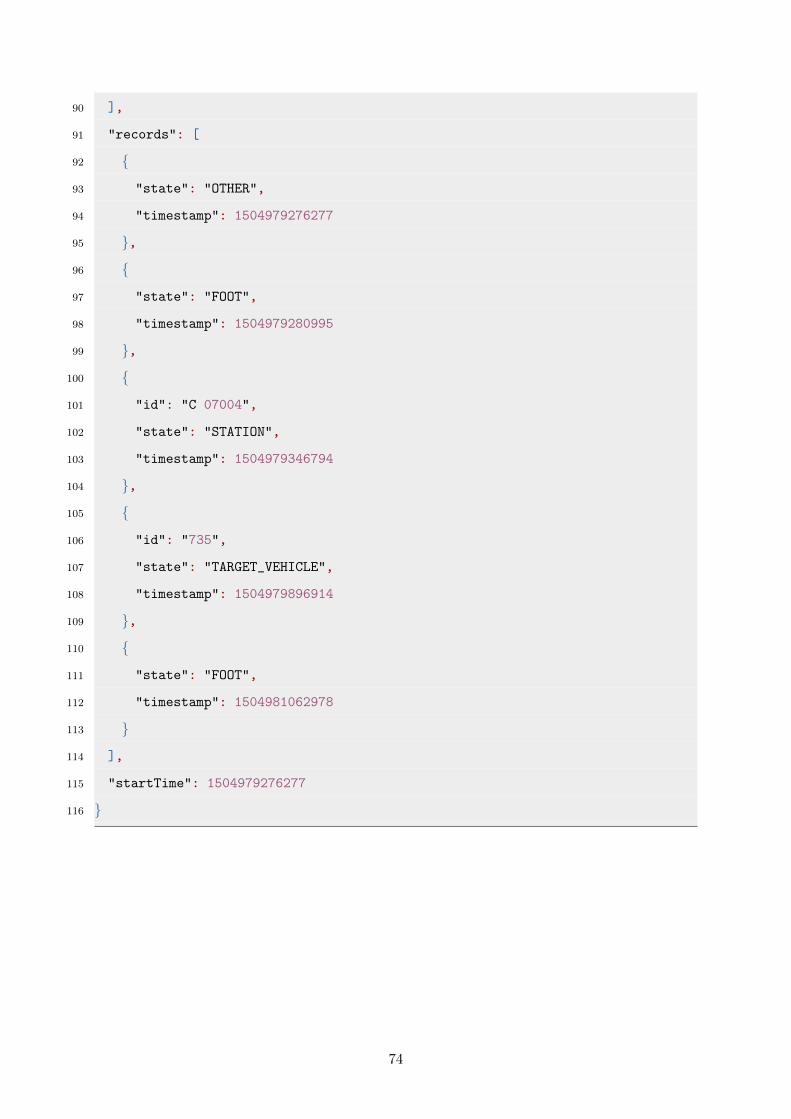
90 ],
91 "records": [
92 {
93 "state": "OTHER",
94 "timestamp": 1504979276277
95 },
96 {
97 "state": "FOOT",
98 "timestamp": 1504979280995
99 },
100 {
101 "id": "C 07004",
102 "state": "STATION",
103 "timestamp": 1504979346794
104 },
105 {
106 "id": "735",
107 "state": "TARGET_VEHICLE",
108 "timestamp": 1504979896914
109 },
110 {
111 "state": "FOOT",
112 "timestamp": 1504981062978
113 }
114 ],
115 "startTime": 1504979276277
116 }
74
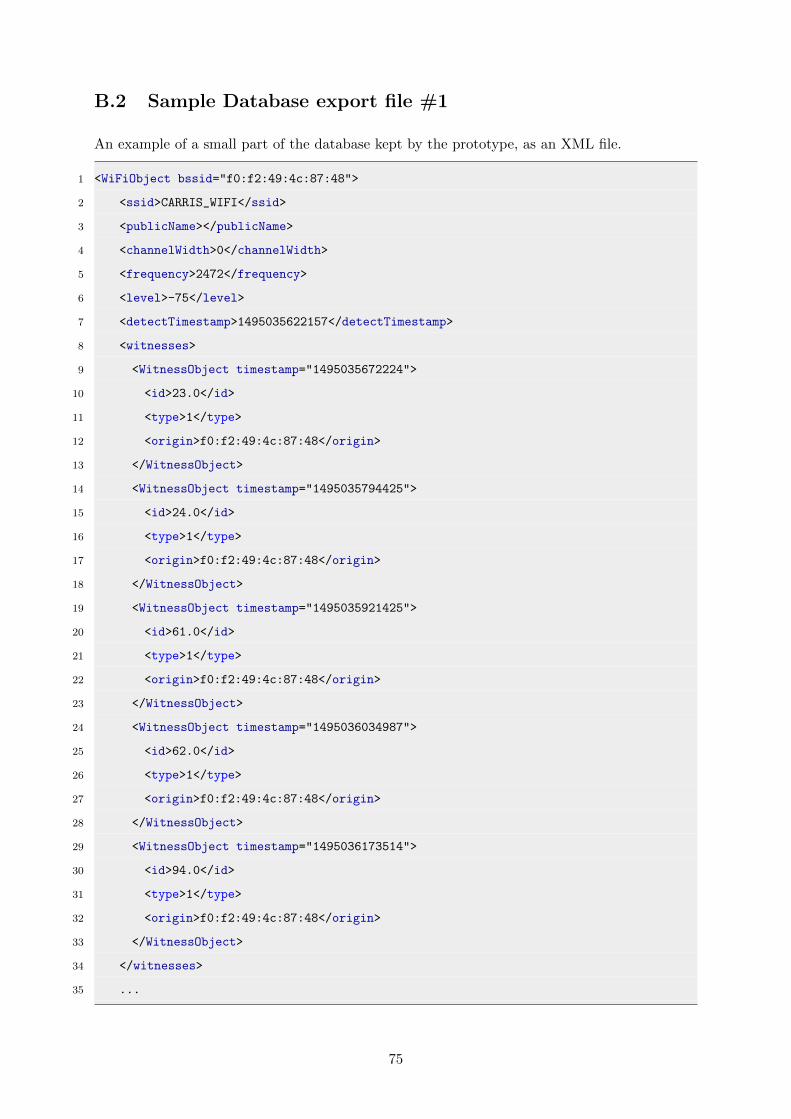
B.2 Sample Database export file #1
An example of a small part of the database kept by the prototype, as an XML file.
1 <WiFiObject bssid="f0:f2:49:4c:87:48">
2 <ssid>CARRIS_WIFI</ssid>
3 <publicName></publicName>
4 <channelWidth>0</channelWidth>
5 <frequency>2472</frequency>
6 <level>-75</level>
7 <detectTimestamp>1495035622157</detectTimestamp>
8 <witnesses>
9 <WitnessObject timestamp="1495035672224">
10 <id>23.0</id>
11 <type>1</type>
12 <origin>f0:f2:49:4c:87:48</origin>
13 </WitnessObject>
14 <WitnessObject timestamp="1495035794425">
15 <id>24.0</id>
16 <type>1</type>
17 <origin>f0:f2:49:4c:87:48</origin>
18 </WitnessObject>
19 <WitnessObject timestamp="1495035921425">
20 <id>61.0</id>
21 <type>1</type>
22 <origin>f0:f2:49:4c:87:48</origin>
23 </WitnessObject>
24 <WitnessObject timestamp="1495036034987">
25 <id>62.0</id>
26 <type>1</type>
27 <origin>f0:f2:49:4c:87:48</origin>
28 </WitnessObject>
29 <WitnessObject timestamp="1495036173514">
30 <id>94.0</id>
31 <type>1</type>
32 <origin>f0:f2:49:4c:87:48</origin>
33 </WitnessObject>
34 </witnesses>
35 ...
75
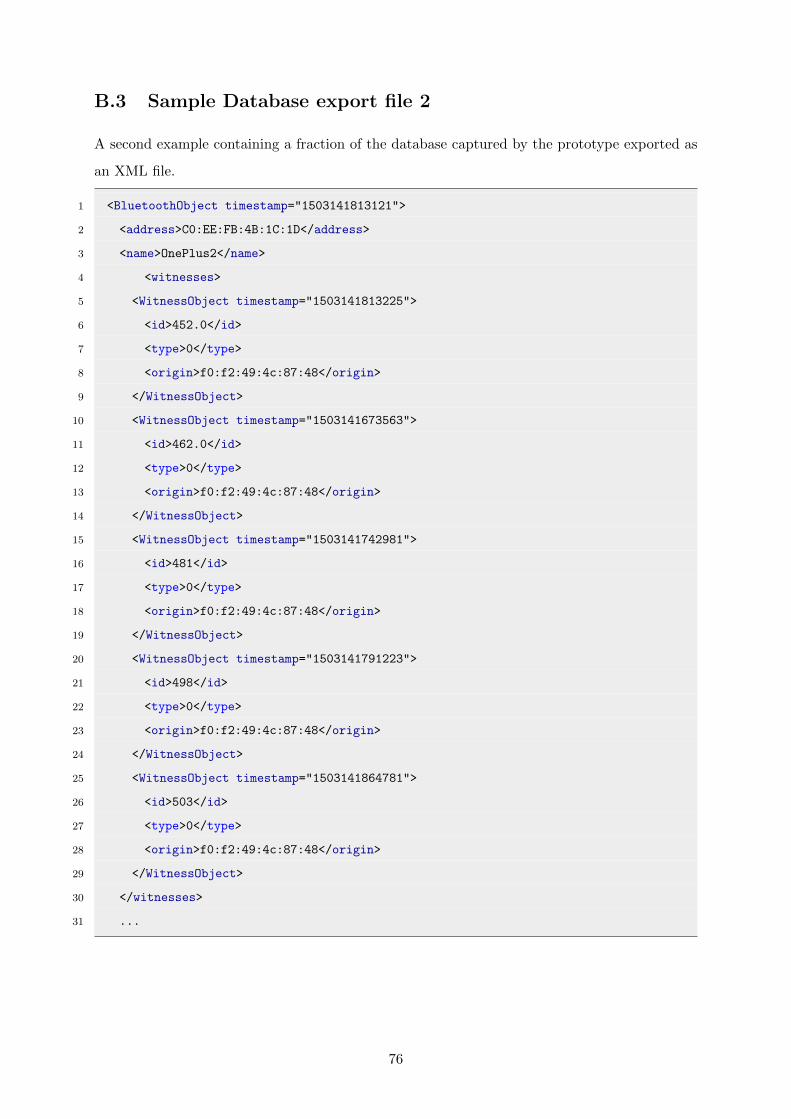
B.3 Sample Database export file 2
A second example containing a fraction of the database captured by the prototype exported as
an XML file.
1 <BluetoothObject timestamp="1503141813121">
2 <address>C0:EE:FB:4B:1C:1D</address>
3 <name>OnePlus2</name>
4 <witnesses>
5 <WitnessObject timestamp="1503141813225">
6 <id>452.0</id>
7 <type>0</type>
8 <origin>f0:f2:49:4c:87:48</origin>
9 </WitnessObject>
10 <WitnessObject timestamp="1503141673563">
11 <id>462.0</id>
12 <type>0</type>
13 <origin>f0:f2:49:4c:87:48</origin>
14 </WitnessObject>
15 <WitnessObject timestamp="1503141742981">
16 <id>481</id>
17 <type>0</type>
18 <origin>f0:f2:49:4c:87:48</origin>
19 </WitnessObject>
20 <WitnessObject timestamp="1503141791223">
21 <id>498</id>
22 <type>0</type>
23 <origin>f0:f2:49:4c:87:48</origin>
24 </WitnessObject>
25 <WitnessObject timestamp="1503141864781">
26 <id>503</id>
27 <type>0</type>
28 <origin>f0:f2:49:4c:87:48</origin>
29 </WitnessObject>
30 </witnesses>
31 ...
76


![assets.unitpac.com.br · Beenoculus, Community Connector da Singularity University Curitiba Chapter e Advisor do Circuit Launch Education Program no Vale do Silício [USA]. Engenheiro](https://img.pdfslide.us/doc/110x75/6017ebba1f57b9147775592c/beenoculus-community-connector-da-singularity-university-curitiba-chapter-e-advisor.jpg)
![Mess[age] - WordPress.com · “Oracle ”, Robert ... ao indivíduo. A colaboração entre áreas distintas, o artista engenheiro e a introdução da máquina no meio artístico](https://img.pdfslide.us/doc/110x75/5c63ba2e09d3f2ad198baddd/message-oracle-robert-ao-individuo-a-colaboracao-entre-areas.jpg)