Embed Size (px)
Citation preview

Mobility Mindset of Millennials in Small Urban and Rural Areas: Technical Memorandum
Survey Findings - Lifestyle
by
Natalie Villwock-Witte, Ph.D., P.E. Assistant Research Professor/Research Engineer
and
Karalyn Clouser
Research Associate
Western Transportation Institute College of Engineering
Montana State University
A report prepared for the
Minnesota Department of Transportation (MnDOT) Montana Department of Transportation (MDT)
Washington Department of Transportation (WashDOT) Wisconsin Department of Transportation (WisDOT) Small Urban and Rural Livability Center (SURLC)
September 26, 2016

Mobility Mindset of Millennials in Small Urban & Rural Areas Table of Contents
Western Transportation Institute Page ii
TABLE OF CONTENTS Introduction ......................................................................................................................................1 Discussion ........................................................................................................................................2
Question 4 – Student Status .................................................................................................... 3 Question 5 – Days of Travel to School ................................................................................... 7 Question 6 – One-Way Travel Distance to School ............................................................... 11 Question 7 – Employment Status .......................................................................................... 13 Question 8 – Number of Jobs................................................................................................ 20 Question 9 through Question 32 – Employment................................................................... 21 Question 34 – Social Media .................................................................................................. 24 Question 37 – Agreement: Connect, Variety, Cost, Distance, Online Shopping, Walkability............................................................................................................................................... 35 Question 46 – Number of Vehicles ....................................................................................... 53 Question 47 – Vehicle Ownership Status ............................................................................. 57 Question 48 – Describe: New, Sociable, Price, Technology, Independence, Authenticity, and Environment ................................................................................................................... 59 Question 49 – Household Internet ........................................................................................ 75 Question 51 – Moving .......................................................................................................... 78 Question 52 – Number in Household.................................................................................... 81 Question 53 – Children in Household ................................................................................... 82 Question 54 – Living Situation ............................................................................................. 83
Lifestyle Question Conclusions .....................................................................................................87 References ......................................................................................................................................90

Mobility Mindset of Millennials in Small Urban & Rural Areas List of Tables
Western Transportation Institute Page iii
LIST OF TABLES TABLE 1: Millennial Generation Student Status ........................................................................... 4 TABLE 2: Millennial Generation, Percentage of Student Status Aggregated ................................ 5 TABLE 3: Millennials Students Taking Online Courses ............................................................... 8 TABLE 4: Millennial Students, All, Distance Traveled ............................................................... 12 TABLE 5: Generation X Students, All, Distance Traveled .......................................................... 12 TABLE 6: Millennials, Employment Status ................................................................................. 14 TABLE 7: Generation X, Employment Status ............................................................................. 14 TABLE 8: Baby Boomers, Employment Status ........................................................................... 15 TABLE 9: Depression & War Babies, Employment Status ......................................................... 15 TABLE 10: Survey Respondents with Three Jobs; Min., Avg., and Max of Number of Days
Worked in Average Week ..................................................................................................... 23 TABLE 11: Survey Respondents with Three Jobs; Min., Avg., and Max of Number of Hours
Worked in Average Week ..................................................................................................... 23 TABLE 12: Millennial Survey Respondents, Household Internet ............................................... 76 TABLE 13: Urban vs. Rural Percentage of Survey Respondents Moving Within 1 Year, By
Generation ............................................................................................................................. 79 TABLE 14: Urban vs. Rural Percentage of Survey Respondents Moving in 1 to 2 Years, By
Generation ............................................................................................................................. 79 TABLE 15: Urban vs. Rural Percentage of Survey Respondents Moving 2 to 3 Years By
Generation ............................................................................................................................. 80 TABLE 16: Urban vs. Rural Percentage of Survey Respondents Moving 4 or More Years By
Generation ............................................................................................................................. 80

Mobility Mindset of Millennials in Small Urban & Rural Areas List of Figures
Western Transportation Institute Page iv
LIST OF FIGURES FIGURE 1: Number of Student Millennial Respondents by Area Type ........................................ 5 FIGURE 2: Percentage of Student Millennial Respondent by Area Type and State...................... 6 FIGURE 3: Days of Travel to School, Percentage of Millennials & Generation X ....................... 9 FIGURE 4: Days of Travel to School, Percentage of Millennials Students ................................. 10 FIGURE 5: Days of Travel to School, Percentage of Generation X Students ............................. 11 FIGURE 6: Percentage of All Survey Respondents Self-Identifying as Disabled by Area Type 16 FIGURE 7: Survey Respondents Identifying as “Retired” by Generation and Area Type .......... 17 FIGURE 8: Percentage of Employed Survey Respondents by Generation and Area Type ......... 18 FIGURE 9: Percentage of Unemployed Survey Respondents by Generation and Area Type ..... 19 FIGURE 10: Survey Respondents Identifying as Stay-at-Home Parents by Generation and Area
Type ...................................................................................................................................... 20 FIGURE 11: Number of Jobs Held by Millennial Respondents by Area Type............................ 21 FIGURE 12: Frequency of Use of Twitter Across Generations ................................................... 25 FIGURE 13: Urban vs. Rural Frequent Twitter Users by Generation .......................................... 26 FIGURE 14: Frequency of Facebook Use Across Generations .................................................... 27 FIGURE 15: Urban vs. Rural Frequent Facebook Users by Generation ...................................... 28 FIGURE 16: Urban vs. Rural Frequent LinkedIn Users by Generation ....................................... 29 FIGURE 17: Urban vs. Rural Frequent Tumblr Users by Generation ......................................... 30 FIGURE 18: Urban vs. Rural Frequent Instagram Users by Generation ..................................... 31 FIGURE 19: Urban vs. Rural Frequent Snapchat Users by Generation ....................................... 32 FIGURE 20: Urban vs. Rural Frequent MySpace Users by Generation ...................................... 33 FIGURE 21: Urban vs. Rural Frequent Flickr Users by Generation ............................................ 34 FIGURE 22: Percentage of Survey Respondents Across Generations, Preference for
Connectivity .......................................................................................................................... 36 FIGURE 23: Urban vs. Rural Percentage of Millennial Survey Respondents, Preference for
Connectivity .......................................................................................................................... 37 FIGURE 24: Percentage of Survey Respondents Across Generations, Variety of Transportation
Options .................................................................................................................................. 38 FIGURE 25: Urban vs. Rural Percentage of Millennial Survey Respondents, Variety of
Transportation Options ......................................................................................................... 39 FIGURE 26: Percentage of Survey Respondents Across Generations, Influence of Cost on Travel
............................................................................................................................................... 40 FIGURE 27: Urban vs. Rural Percentage of Millennial Survey Respondents, Influence of Cost
on Travel ............................................................................................................................... 41 FIGURE 28: Percentage of Survey Respondents Across Generations, Influence of Distance to
Work on Travel ..................................................................................................................... 42 FIGURE 29: Urban vs. Rural Percentage of Millennial Survey Respondents, Influence of
Distance to Work and Travel ................................................................................................ 43 FIGURE 30: Percentage of Survey Respondents Across Generations, Distance to Shopping
Influences Travel .................................................................................................................. 44 FIGURE 31: Urban vs. Rural Percentage of Millennial Survey Respondents, Distance to
Shopping Influences Travel .................................................................................................. 45

Mobility Mindset of Millennials in Small Urban & Rural Areas List of Figures
Western Transportation Institute Page v
FIGURE 32: Percentage of Survey Respondents Across Generations, Distance to Recreation Influences Travel .................................................................................................................. 46
FIGURE 33: Urban vs. Rural Percentage of Millennial Survey Respondents, Distance to Recreation Influences Travel ................................................................................................ 47
FIGURE 34: Percentage of Survey Respondents Across Generations, Preference for Online Shopping ............................................................................................................................... 48
FIGURE 35: Urban vs. Rural Percentage of Millennial Survey Respondents, Preference for Shopping Online ................................................................................................................... 49
FIGURE 36: Urban vs. Rural Percentage of Generation X Survey Respondents, Preference for Shopping Online ................................................................................................................... 50
FIGURE 37: Urban vs. Rural Percentage of Baby Boomer Survey Respondents, Preference for Shopping Online ................................................................................................................... 51
FIGURE 38: Percentage of Survey Respondents Across Generations, Walkability .................... 52 FIGURE 39: Urban vs. Rural Percentage of Millennial Survey Respondents, Walkability ........ 53 FIGURE 40: Percentage of Survey Respondents, by Generation, Number of Operable Vehicles
in Household ......................................................................................................................... 54 FIGURE 41: Percentage of Zero Operable Vehicle Millennial Households by State .................. 55 FIGURE 42: Percentage of Zero Operable Vehicle Millennial Households by State and Area
Type ...................................................................................................................................... 56 FIGURE 43: Proportion of Zero Vehicle Ownership Across Generations by Area Type............ 57 FIGURE 44: Vehicle Ownership by Generation .......................................................................... 58 FIGURE 45: Urban vs. Rural Millennial Vehicle Ownership ...................................................... 59 FIGURE 46: Percentage of Survey Respondents Across Generations, Preference for New &
Different ................................................................................................................................ 60 FIGURE 47: Urban vs. Rural Percentage of Millennial Survey Respondents, New & Different 61 FIGURE 48: Percentage of Survey Respondents Across Generations who Self-identified as
Sociable ................................................................................................................................. 62 FIGURE 49: Urban vs. Rural Percentage of Millennial Survey Respondents who Self-Identified
as Sociable ............................................................................................................................ 63 FIGURE 50: Percentage of Survey Respondents Across Generations Preferring Quality, Not
Price ...................................................................................................................................... 64 FIGURE 51: Urban vs. Rural Percentage of Millennial Survey Respondents, Preference for
Quality Over Price ................................................................................................................ 65 FIGURE 52: Percentage of Survey Respondents Across Generations Preferring New Technology
............................................................................................................................................... 66 FIGURE 53: Urban vs. Rural Percentage of Millennial Survey Respondents, Preference for New
Technology ........................................................................................................................... 67 FIGURE 54: Percentage of Survey Respondents Across Generations Valuing Independence .... 68 FIGURE 55: Urban vs. Rural Percentage of Millennial Survey Respondents, Independence ..... 69 FIGURE 56: Urban vs. Rural Percentage of Baby Boomer Survey Respondents, Independence 70 FIGURE 57: Percentage of Survey Respondents Across Generations Preferring Local/Authentic
People & Places .................................................................................................................... 71 FIGURE 58: Urban vs. Rural Percentage of Millennial Survey Respondents, Local/Authentic
People & Places .................................................................................................................... 72 FIGURE 59: Urban vs. Rural Percentage of Baby Boomer Survey Respondents, Local/Authentic
People & Places .................................................................................................................... 73

Mobility Mindset of Millennials in Small Urban & Rural Areas List of Figures
Western Transportation Institute Page vi
FIGURE 60: Percentage of Survey Respondents Across Generations, Concern for the Environment .......................................................................................................................... 74
FIGURE 61: Urban vs. Rural Percentage of Millennial Survey Respondents, Concern for the Environment .......................................................................................................................... 75
FIGURE 62: Availability of Household Internet by Area Type and State for Millennials .......... 77 FIGURE 63: Presence of Household Internet by Area Type and Generation .............................. 78 FIGURE 64: All Survey Respondents, Number in Household (1 through 10) ............................ 81 FIGURE 65: Millennial Survey Respondents, Number in Household (1 through 10) ................. 82 FIGURE 66: Millennials without Children by Area Type............................................................ 83 FIGURE 67: Living Situation for Millennial Survey Respondents .............................................. 84 FIGURE 68: Urban vs. Rural Living Situation for Millennial Survey Respondents ................... 85 FIGURE 69: Living Situation Across Generations ...................................................................... 86
Mobility Mindset of Millennials in Small Urban & Rural Areas Introduction
Western Transportation Institute Page 1
INTRODUCTION The Millennial Generation, Americans born between the years of 1982 and 2000, are now the largest generational cohort in the United States, surpassing the Baby Boomer generation in 2010. The Millennial Generation is entering the most “productive” period of its life cycle, and research available to date has concluded that Millennials have significantly different lifestyle and transportation trends than previous generations (e.g. Generation X and Baby Boomers), which is leading to a re-evaluation of transportation planning and policy. However, the research to date has primarily focused on Millennials in urban areas. Little research has been performed to understand whether or not Millennials residing in rural areas have the same mobility and livability mindset as those in urban areas. Therefore, this research intends to fill that gap.
A survey, consisting of 60 total questions, was conducted using Survey Sampling Incorporated’s (SSI) respondents. The survey was deployed in three phases:
1. Via the internet from October 22, 2015 through November 9, 2015,
2. Via telephone from November 13, 2015 through December 15, 2015, and
3. Via the internet from December 16, 2015 through December 23, 2015.
During each phase of deployment, SSI collected 1,441; 1,188; and 74 surveys, respectively. The final number of observations retained is 2,519. This results in a total of approximately 297,500 cells of data (several questions had multiple parts to them). The Millennial generation and rural environments, which were represented by non-metropolitan statistical areas, were purposefully oversampled.
Survey responses were received from five different generations:
• Millennials (ages 18 to 32 in 2015)
• Generation X (ages 33 to 50 in 2015)
• Baby Boomers (ages 51 to 69 in 2015)
• Depression & War Babies (ages 70 to 85 in 2015)
• Silent Generation. (older than 85 in 2015) Three technical memos were developed on the topics of: 1) demographics, 2) lifestyle, and 3) transportation based on the questions that were developed for the survey. This technical memo will discuss lifestyle preferences of survey respondents.

Mobility Mindset of Millennials in Small Urban & Rural Areas Discussion
Western Transportation Institute Page 2
DISCUSSION Thirty-nine of the sixty questions from the survey, all relating to the lifestyle preferences of a survey respondent, will be discussed in this technical memo. They include:
• Question 4 – Student Status
• Question 5 – Days of Travel to School
• Question 6 – One-Way Travel Distance to School
• Question 7 – Employment Status
• Question 8 – Number of Jobs
• Question 9 through Question 32 – Employment Related Questions
• Question 34 – Social Media
• Question 37 – Agreement: Connect, Variety, Cost, Distance, and Walkability
• Question 46 – Number of Vehicles
• Question 47 – Vehicle Ownership Status
• Question 48 – Describe: New, Sociable, Price, Technology, Independence, Authenticity, Environment
• Question 49 – Household Internet
• Question 51 – Moving
• Question 52 – Number in Household
• Question 53 – Children in Household
• Question 54 – Living Situation The subsections that follow discuss the results for each question. Consistent with the classifications used in the Demographics technical memo, the area types “Big, dense city,” “Big-city suburb,” “Lower-density city,” and “Suburb of lower-density city” are grouped as urban. “Small city,” “Small town,” and “Outlying rural area” are grouped as rural.

Mobility Mindset of Millennials in Small Urban & Rural Areas Discussion
Western Transportation Institute Page 3
Question 4 – Student Status All survey respondents were asked whether or not they were a student. The results associated with the Millennial generation are presented first. Millennials 385 Millennials reported being students. 1130 Millennials (74.6%) indicated that they were not presently students. Of the 1130 that were not presently students, 505 (45%) had either an Associate’s Degree or higher. This means that 890 Millennials (58.7%) have a degree or are pursuing a degree. (Note: Three respondents did not indicate explicitly Yes or No whether or not they were a student.) TABLE 1 presents the number of Millennial survey respondents who indicated whether or not they are currently a student.

Mobility Mindset of Millennials in Small Urban & Rural Areas Discussion
Western Transportation Institute Page 4
TABLE 1: Millennial Generation Student Status
State
Student
Big, D
ense City
Big-C
ity Suburb
Lower-D
ensity C
ity
Suburb of
Lower-D
ensity C
ity
Small C
ity
Small Tow
n
Outlying
Rural
Area
No R
esponse
TOTA
L
Minnesota Yes 12 27 8 14 10 20 12 1 104
No 19 53 21 28 34 65 51 2 273
NR 0 0 0 0 0 0 0 0 0
% 38.7 33.8 27.6 33.3 22.7 23.5 19.0 33.3 27.6
Montana Yes 2 3 10 5 28 11 20 0 79
No 1 9 28 7 87 74 95 0 301
NR 0 0 0 1 0 0 0 0 1
% 66.7 25.0 26.3 38.5 24.3 12.9 17.4 0 20.7
Washington Yes 7 16 4 15 15 32 10 1 100
No 23 47 17 35 20 60 74 1 277
NR 0 1 0 0 1 0 0 0 2
% 23.3 25.0 19.0 30.0 41.7 34.8 11.9 50.0 26.4
Wisconsin Yes 8 11 13 14 25 20 6 2 99
No 11 38 30 24 67 58 49 2 279
NR 0 0 0 0 0 0 0 0 0
% 42.1 22.4 30.2 36.8 27.2 25.6 10.9 0.50 26.2
NR = Survey respondents did not indicate whether or not they were a student % = Percentage of Student Respondents When subdividing the data by area type as shown in TABLE 1, the number of survey respondents for each category becomes small. Therefore, it is useful to compare the aggregated urban and rural classifications. Considering that Montana is one of the lowest density states in all of the United States, it is not surprising that there are very few observations from Montana

Mobility Mindset of Millennials in Small Urban & Rural Areas Discussion
Western Transportation Institute Page 5
that would fit the “urban” definition (20 for Montana vs. 61, 42, and 46 for Minnesota, Washington, and Wisconsin, respectively). TABLE 2 presents the more aggregated data.
TABLE 2: Millennial Generation, Percentage of Student Status Aggregated
State Urban Rural TOTAL
Minnesota 33.5 21.9 27.6
Montana 30.3 18.7 20.7
Washington 25.5 26.9 26.4
Wisconsin 30.9 26.2 26.2
Average 30.1 23.4 25.2
TABLE 2 shows that Millennials living in urban areas in three of the four states (Minnesota, Montana, Wisconsin) are more likely to be students than Millennials in rural areas. This difference is most prominent for Montana, but this is likely indicative of the small sample size of respondents indicating that they reside in an urban area. On average, about 25% of the Millennial survey respondents are currently students. FIGURE 1 presents the number of Millennial students in each area type, by state.
FIGURE 1: Number of Student Millennial Respondents by Area Type
Mobility Mindset of Millennials in Small Urban & Rural Areas Discussion
Western Transportation Institute Page 6
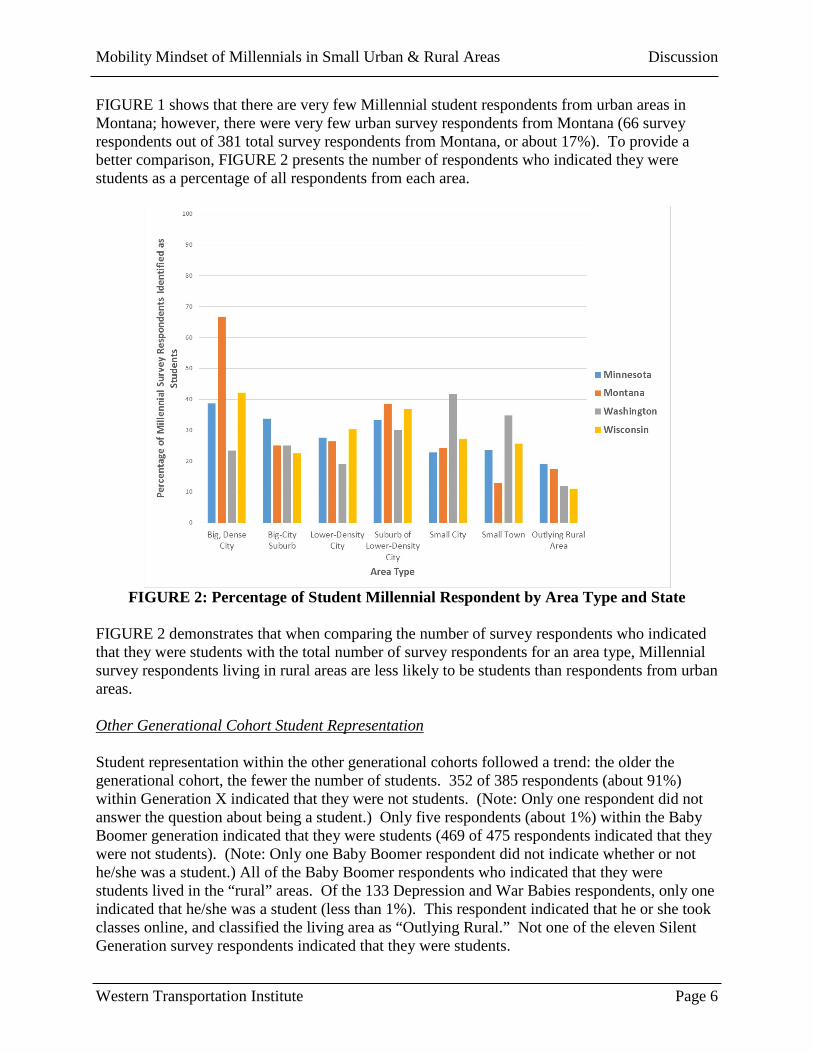
FIGURE 1 shows that there are very few Millennial student respondents from urban areas in Montana; however, there were very few urban survey respondents from Montana (66 survey respondents out of 381 total survey respondents from Montana, or about 17%). To provide a better comparison, FIGURE 2 presents the number of respondents who indicated they were students as a percentage of all respondents from each area.
FIGURE 2: Percentage of Student Millennial Respondent by Area Type and State
FIGURE 2 demonstrates that when comparing the number of survey respondents who indicated that they were students with the total number of survey respondents for an area type, Millennial survey respondents living in rural areas are less likely to be students than respondents from urban areas. Other Generational Cohort Student Representation Student representation within the other generational cohorts followed a trend: the older the generational cohort, the fewer the number of students. 352 of 385 respondents (about 91%) within Generation X indicated that they were not students. (Note: Only one respondent did not answer the question about being a student.) Only five respondents (about 1%) within the Baby Boomer generation indicated that they were students (469 of 475 respondents indicated that they were not students). (Note: Only one Baby Boomer respondent did not indicate whether or not he/she was a student.) All of the Baby Boomer respondents who indicated that they were students lived in the “rural” areas. Of the 133 Depression and War Babies respondents, only one indicated that he/she was a student (less than 1%). This respondent indicated that he or she took classes online, and classified the living area as “Outlying Rural.” Not one of the eleven Silent Generation survey respondents indicated that they were students.

Mobility Mindset of Millennials in Small Urban & Rural Areas Discussion
Western Transportation Institute Page 7
Question 5 – Days of Travel to School Question 5 asked, “How many days a week do you typically travel to school?” Respondents could choose from the following possible responses:
• 0; I take classes online. • 1 • 2 • 3 • 4 • 5 • 6 • 7
Online Students As indicated in Question 5, not only did we ask whether or not a survey respondent was a student, we also included an option for the survey respondent to indicate if he or she took courses online. A transformational component of the “Information Age” is that one can connect virtually to friends, family, and education. The ability to take courses online allows a person to omit a trip, which is important to consider when identifying mobility needs. TABLE 3 shows the distribution of online students between urban and rural areas.

Mobility Mindset of Millennials in Small Urban & Rural Areas Discussion
Western Transportation Institute Page 8
TABLE 3: Millennials Students Taking Online Courses
State
Online
Urban Rural
No R
esponse
TOTA
L
Big, D
ense City
Big-C
ity Suburb
Lower-D
ensity C
ity
Suburb of
Lower-D
ensity C
ity
Small C
ity
Small Tow
n
Outlying
Rural
Area
Minnesota Number 1 5 1 3 4 7 5 1 27
% 37.0 59.3 - 26.0
Montana Number 0 0 0 2 4 3 5 0 14
% 14.3 85.7 - 17.7
Washington Number 2 3 1 2 6 8 2 0 24
% 33.3 66.7 - 24.0
Wisconsin Number 1 2 4 2 6 8 3 1 27
% 33.3 63.0 - 27.3
TOTAL Number 4 10 6 9 20 26 15 2 92
% 31.5 66.3 - 24.1
The percentage of “urban” Millennial respondents who take courses online remains fairly consistent among all states except for Montana, which is again likely due to Montana’s rural nature. As expected, a large portion of Millennial survey respondents who indicated that they are taking courses online are those in more “rural” areas (about two-thirds). Days of Travel to School A comparison between the Millennials and Generation X shows that more Generation X survey respondents indicated that they take classes online (FIGURE 3). In addition, there seem to be fewer Generation X survey respondents that are 5-day-a-week students, which would imply that they may not be full-time students.

Mobility Mindset of Millennials in Small Urban & Rural Areas Discussion
Western Transportation Institute Page 9
FIGURE 3: Days of Travel to School, Percentage of Millennials & Generation X
Looking only at the Millennial students, the results show that significantly more rural Millennial students make use of online offerings as compared to urban Millennial students (FIGURE 4 and TABLE 3). This would imply that online education offerings are significantly important to rural Millennials.

Mobility Mindset of Millennials in Small Urban & Rural Areas Discussion
Western Transportation Institute Page 10
FIGURE 4: Days of Travel to School, Percentage of Millennials Students
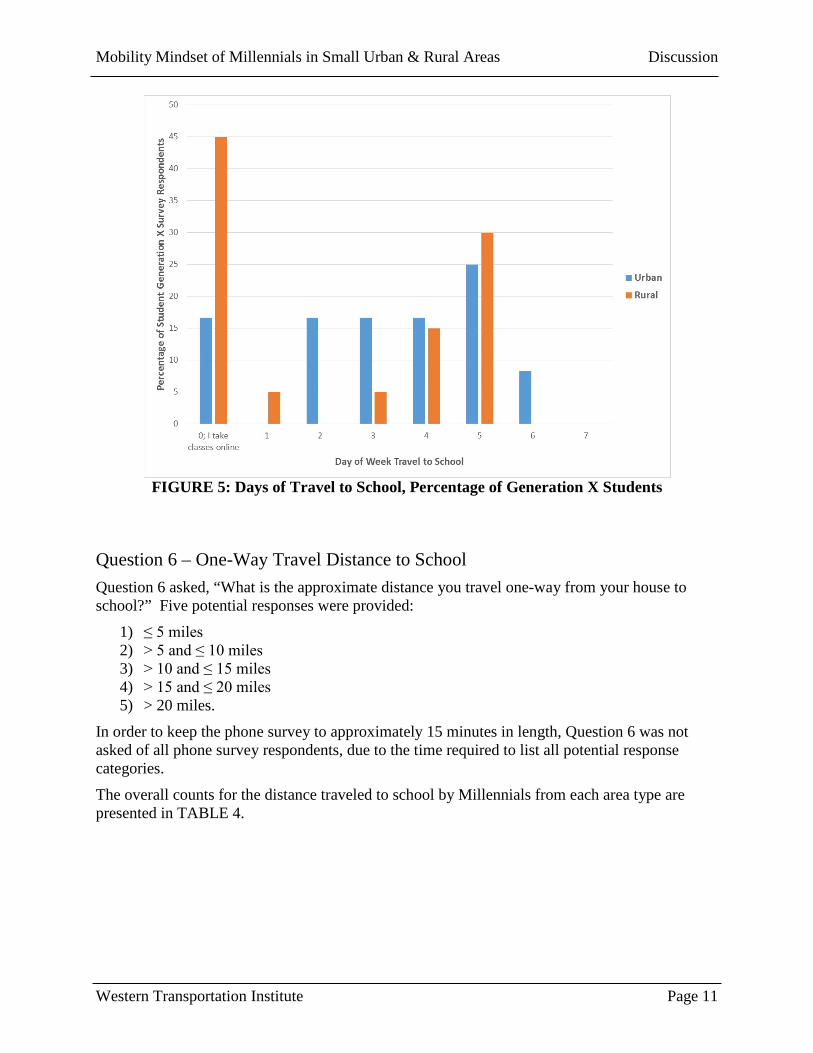
While there are significantly fewer Generation X students than Millennials, the results for Generation X with regard to urban vs. rural online students are similar: a larger percentage of rural Generation X students report being online students when compared with their urban counterparts (FIGURE 5).
Mobility Mindset of Millennials in Small Urban & Rural Areas Discussion
Western Transportation Institute Page 11
FIGURE 5: Days of Travel to School, Percentage of Generation X Students
Question 6 – One-Way Travel Distance to School Question 6 asked, “What is the approximate distance you travel one-way from your house to school?” Five potential responses were provided:
1) ≤ 5 miles 2) > 5 and ≤ 10 miles 3) > 10 and ≤ 15 miles 4) > 15 and ≤ 20 miles 5) > 20 miles.
In order to keep the phone survey to approximately 15 minutes in length, Question 6 was not asked of all phone survey respondents, due to the time required to list all potential response categories.
The overall counts for the distance traveled to school by Millennials from each area type are presented in TABLE 4.

Mobility Mindset of Millennials in Small Urban & Rural Areas Discussion
Western Transportation Institute Page 12
TABLE 4: Millennial Students, All, Distance Traveled
Distance to School Categories
Big, Dense City
Big-City Suburb
Lower-Density
City
Suburb of Lower-
Density City
Small City
Small Tow
n
Outlying Rural
Area
No Response
TOTAL
≤ 5 mi 10 11 13 6 8 14 2 1 65> 5 mi & ≤ 10 miles 5 11 2 10 9 7 0 1 45> 10 mi & ≤ 15 miles 0 8 1 6 2 2 0 0 19> 15 mi & ≤ 20 miles 2 7 0 1 2 2 1 0 15> 20 miles 0 1 2 5 5 6 5 0 24Online 4 10 6 9 20 26 15 2 92Not Available (phone) 8 9 11 11 32 26 25 0 122TOTAL 29 57 35 48 78 83 48 4 382
TABLE 4 shows that the majority of Millennial survey respondents live in close proximity to their school (less than or equal to 10 miles). TABLE 4 shows that no Millennial students in outlying rural areas travel the medium distances (5 to 10 miles, 10 to 15 miles) to attend school. It also shows that a large majority of Millennials in urban areas live in close proximity to their school. Therefore, it could be theorized that Millennials move to urban areas to pursue their education. The question then becomes, do they move away from the city after completing their degree or after having children? TABLE 5 shows the reported distances traveled to school by the thirty-one Generation X students.
TABLE 5: Generation X Students, All, Distance Traveled
Distance to School Categories
Big, Dense City
Big-City Suburb
Lower-Density
City
Suburb of Lower-
Density City
Small City
Small Tow
n
Outlying Rural
Area
No Response
TOTAL
≤ 5 mi 1 0 1 0 2 0 0 0 4> 5 mi & ≤ 10 miles 1 2 0 0 1 0 0 0 4> 10 mi & ≤ 15 miles 2 2 0 1 3 1 0 0 9> 15 mi & ≤ 20 miles 0 0 0 0 1 1 0 0 2> 20 miles 0 0 0 0 0 0 0 0 0Not Applicable 1 0 0 1 3 4 2 0 11Not Available (phone) 0 0 0 0 0 0 1 0 1TOTAL 5 4 1 2 10 6 3 0 31
Mobility Mindset of Millennials in Small Urban & Rural Areas Discussion
Western Transportation Institute Page 13
TABLE 5 shows that a large portion of Generation X respondents who were not taking classes online traveled between 10 and 15 miles to go to school. Only one Baby Boomer respondent indicated traveling a distance (less than 5 miles) to attend school. The other four Baby Boomer survey respondents indicated that they took classes online.
Question 7 – Employment Status
Question 7 asked, “What is your employment status?” Five potential responses were provided:
1) Employed 2) Unemployed 3) Retired 4) Stay-at-home parent 5) Other (please specify).
Some respondents that were employed part-time chose “Other.” During the development of the survey, it was discussed whether or not “Full-Time” and “Part-Time” should be listed. “Employed” was chosen because subsequent questions asked survey respondents information regarding the number of hours they work in a week at each place of employment if “Employed” was chosen.
Survey respondents were asked about their employment status because some research shows that Millennials face a higher rate of unemployment as compared with previous generations at this same point in their lifecycle. In addition, employment is highly correlated with vehicle miles traveled, at least historically. More recently, the “Information Technology” age has paved the way for individuals to work from home. For the Millennial, Generation X, Baby Boomer, and Depression & War Babies generations, TABLE 6, TABLE 7, TABLE 8, and TABLE 9, respectively, show the percentage of survey respondents who indicated that they were 1) retired, 2) employed, 3) unemployed, or 4) a stay-at-home parent.

Mobility Mindset of Millennials in Small Urban & Rural Areas Discussion
Western Transportation Institute Page 14
TABLE 6: Millennials, Employment Status
Employment Status
Big, Dense City
Big-City Suburb
Lower-Density City
Suburb of Lower-
Density City
Small City
Small Tow
n
Outlying Rural Area
Retired 1.2 0.0 0.0 0.0 0.7 0.9 1.6
Employed 72.3 72.7 71.8 67.8 68.3 59.1 69.1
Unemployed 16.9 14.1 13.7 12.6 15.7 16.2 11.0
Stay-at-home-parent 8.4 10.7 13.0 16.8 13.2 19.1 15.5
TABLE 7: Generation X, Employment Status
Employment Status
Big, Dense City
Big-City Suburb
Lower-Density City
Suburb of Lower-
Density City
Small City
Small Tow
n
Outlying Rural Area
Retired 3.8 0.0 3.0 2.7 1.4 6.9 2.4
Employed 65.4 79.7 51.5 56.8 66.2 59.7 68.2
Unemployed 3.8 8.5 12.1 16.2 9.9 9.7 5.9
Stay-at-home-parent 7.7 8.5 30.3 18.9 12.7 16.7 18.8

Mobility Mindset of Millennials in Small Urban & Rural Areas Discussion
Western Transportation Institute Page 15
TABLE 8: Baby Boomers, Employment Status
Employment Status
Big, Dense City
Big-City Suburb
Lower-Density City
Suburb of Lower-
Density City
Small City
Small Tow
n
Outlying Rural Area
Retired 40.0 45.5 26.1 30.4 35.1 40.0 34.6
Employed 44.0 39.4 60.9 47.8 45.9 48.2 50.9
Unemployed 4.0 0.0 4.3 4.3 6.8 3.6 5.0
Stay-at-home-parent 0.0 9.1 0.0 8.7 5.4 0.9 2.5
TABLE 9: Depression & War Babies, Employment Status
Employment Status
Big, Dense City
Big-City Suburb
Lower-Density City
Suburb of Lower-
Density City
Small City
Small Tow
n
Outlying Rural Area
Retired 75.0 90.9 100.0 66.7 86.7 96.7 81.1
Employed 25.0 9.1 0.0 11.1 6.7 0.0 15.1
Unemployed 0.0 0.0 0.0 11.1 0.0 0.0 0.0
Stay-at-home-parent 0.0 0.0 0.0 0.0 6.7 3.3 3.8
As expected, the older generations indicated a greater level of retirement, mostly represented within the Baby Boomer and Depression & War Baby generations. In addition, a large percentage of Millennials and Generation X respondents indicated that they are stay-at-home-parents with only a small percentage of survey respondents indicating as such in the two older generations. Finally, while survey respondents within Generation X and less so within the Baby Boomer generation reported being unemployed, the highest percentage of survey respondents across all area types that indicated that they are unemployed was found within the Millennial generation. The next few sections discuss additional findings from the responses regarding employment status, including an anomaly observed in the “other” data regarding respondents who self-
Mobility Mindset of Millennials in Small Urban & Rural Areas Discussion
Western Transportation Institute Page 16
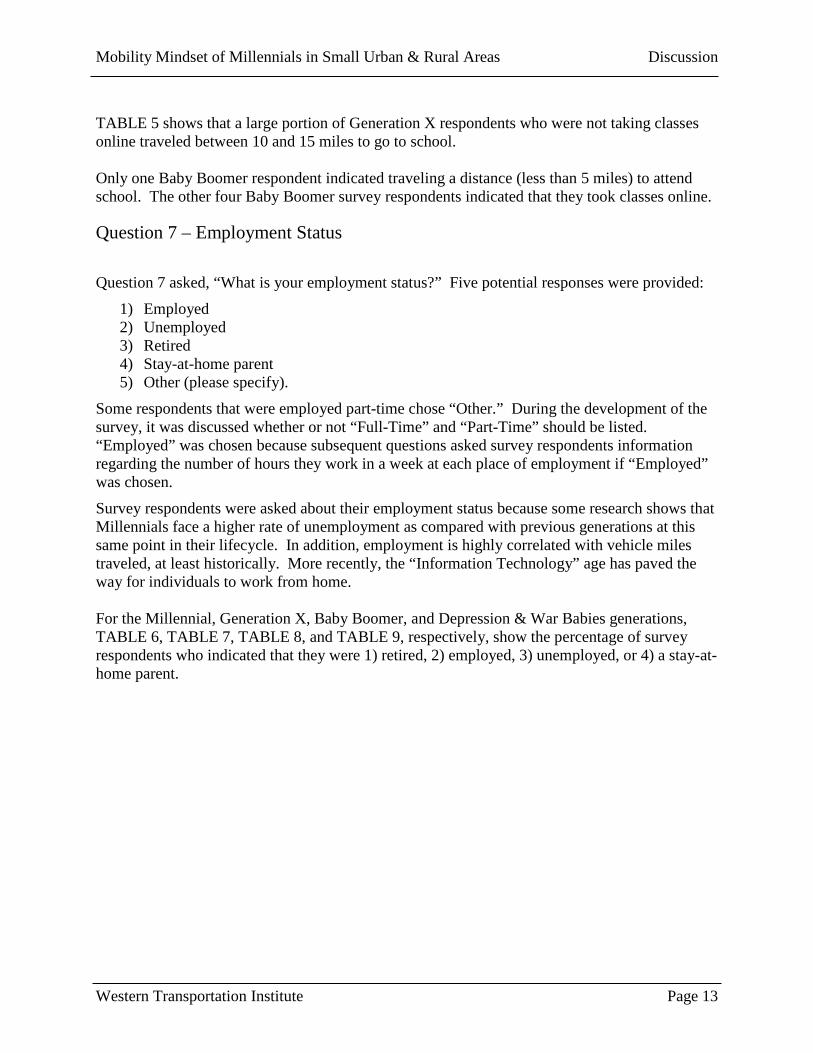
identified as “disabled,” followed by more details related to retired, employed and unemployed respondents. Respondents Indicating a Disability One answer that was not included as an employment status category, but that was consistently listed by respondents under “Other” was “Disabled.” Across all area types, 1.6% of survey respondents self-identified as “Disabled.” This means that some of the other respondents may also consider themselves as “Disabled;” however, because this response option was not provided, they may not have identified themselves as “Disabled.” A recommendation for future studies would be to include a “Disabled” category, but allow a survey respondent to choose this and other categories (e.g. they do not need to be mutually exclusive). FIGURE 6 shows where self-reported disabled survey respondents, across all generations, are residing. (Note: For FIGURE 6, the y-axis does not range from 0 to 100 to allow the reader to better understand the difference between each area category. The reader should note that the overall percentage of self-reported disabled is still quite small.)
FIGURE 6: Percentage of All Survey Respondents Self-Identifying as Disabled by Area
Type FIGURE 6 suggests that the majority of self-reported disabled respondents live in “Big, Dense City,” “Suburb of Lower-Density City,” and “Small Town.” “Big-City Suburb” appears to have the fewest self-identified disabled survey respondents. An additional analysis of this data can be found in Transportation Preferences, Lifestyle Characteristics of Self-Identified Disabled Survey Respondents (Villwock-Witte, 2017).

Mobility Mindset of Millennials in Small Urban & Rural Areas Discussion
Western Transportation Institute Page 17
Retired Survey Respondents As expected, most Silent Generation survey respondents indicated that they were “Retired.” Therefore, this provides confidence in the data-set obtained. In addition, approximately 36% of respondents from the Baby Boomer generation indicated that they were “Retired.” If we assume that the percentage of survey respondents from the Depression & War Babies generation is representative of the Baby Boomer generation at the same stage in their lives where approximately 85% of respondents identify as “Retired,” then we can project that approximately 49% of the Baby Boomer generation should be retiring within the next ten years (e.g. 85% minus 36% is 49%). FIGURE 7 shows the percentage of survey respondents by generation and area type that indicated that they were “Retired.” It is interesting to note that the pattern of reported retirees for Depression & War Babies is similar to that of Baby Boomers.
FIGURE 7: Survey Respondents Identifying as “Retired” by Generation and Area Type
Employed Survey Respondents An average of sixty-nine percent of the Millennial survey respondents across all area types indicated that they were employed. This is slightly greater than the average percentage of Generation X survey respondents across all area types (64%) who indicated that they were employed. The survey did not ask respondents about their type of employment. As such, it is unclear if the jobs that Millennials hold are in their area of education, or if they are non-permanent positions. FIGURE 8 shows that Millennials report a slightly higher percentage of employment in urban areas as compared with rural areas.

Mobility Mindset of Millennials in Small Urban & Rural Areas Discussion
Western Transportation Institute Page 18
FIGURE 8: Percentage of Employed Survey Respondents by Generation and Area Type
Unemployed Survey Respondents Averaged across all area types, 14.3%, 9.4% and 4.0% of Millennials, Generation X, and Baby Boomers identified themselves as unemployed, respectively. Therefore, the two youngest generations, the Millennials and Generation X, have a significantly higher level of unemployment as compared to the Baby Boomer generation (see also FIGURE 9). Considering the current percentage of the Baby Boomer generation that indicated that it was retired (36%), there is the potential that as more Baby Boomers retire, the Millennials and Generation X would be able to fill these positions.

Mobility Mindset of Millennials in Small Urban & Rural Areas Discussion
Western Transportation Institute Page 19
FIGURE 9: Percentage of Unemployed Survey Respondents by Generation and Area Type It is interesting to note that the largest percentage of Millennials who identified themselves as unemployed live in a “Big, Dense City” (FIGURE 9). These findings could possibly also show that those Millennials who identified as unemployed were also students. The “Outlying Rural Areas” show the lowest level of Millennial unemployment. Generation X survey respondents who indicated that they were unemployed had the highest representation within a “Suburb of Lower-Density City.” It is also notable that no Baby Boomers identified themselves as unemployed in the “Big-City Suburb.” Survey respondents who were employed and unemployed, respectively, were grouped into urban and rural categories as described previously. When comparing urban and rural survey respondents who indicated that they were unemployed, it was found that the percentage of survey respondents was equal. However, when comparing the average across urban and rural area types for Millennial survey respondents indicating that they are employed, more urban Millennial survey respondents than rural Millennial survey respondents reported being employed (71% to 66%). Considering this and the fact that from a life-cycle perspective, Millennials are moving into their “productive” years when they want to make a good living with the hopes of eventually retiring, it appears as if the availability for employment is higher in the urban areas as compared with the rural areas, which could be part of the interest by Millennials in living in urban areas. Literature has discussed the changes in the family dynamic. One of the choices identified for survey respondents was “stay-at-home-parent.” It should be noted that “parent” was used instead of “mom,” as societal changes now permit either parent to choose whether or not to stay home

Mobility Mindset of Millennials in Small Urban & Rural Areas Discussion
Western Transportation Institute Page 20
with children. FIGURE 10 shows the percentage of survey respondents across the Millennial, Generation X and Baby Boomer generations identifying as stay-at-home-parents.
FIGURE 10: Survey Respondents Identifying as Stay-at-Home Parents by Generation and
Area Type FIGURE 10 shows that for the Millennial and Generation X survey respondents, few stay-at-home parents are represented in the more urbanized areas (Big, Dense City and Big-City Suburb). This is to be expected as housing size and living costs in the urban environment usually require that both parents are working, or those with families typically move out of the urban environment when planning for a family. In addition, a significantly larger percentage of Generation X survey respondents from “Lower-Density Cities” (about 18%) as compared with Millennials indicated that they were stay-at-home parents.”
Question 8 – Number of Jobs Question 8 asked, “How many jobs do you currently hold?” Four response options were provided:
1) 1 2) 2 3) 3 4) Other (please specify)
FIGURE 11 shows the percentage of Millennials indicating that they had one, two, or three jobs across the various area types.

Mobility Mindset of Millennials in Small Urban & Rural Areas Discussion
Western Transportation Institute Page 21
FIGURE 11: Number of Jobs Held by Millennial Respondents by Area Type
There appears to be a slightly greater likelihood that someone living in a rural area has more than one job. This could potentially indicate that the pay associated with a single job in a rural environment is lower, thereby requiring a Millennial living in this area to work more than one job to live the quality of life desired.
Question 9 through Question 32 – Employment As a follow-up to question 8 (“How many jobs do you currently hold?”), questions 9 through 32 asked a series of questions regarding each of the respondent’s jobs. The follow-up questions asked for details including days of work, hours at job, and distance to job. This sections summarizes the responses for these 24 questions. 1,541 survey respondents reported having one or more jobs. 1,277 (83%), 217 (14%), 36 (2%), and 11 (1%) of these survey respondents reported working one, two, or three jobs, or chose “other,” respectively. One Job Of those reporting that they worked one job, 852, 221, 195, 8 and 1 of the 1,277 survey respondents were Millennials, Generation X, Baby Boomers, Depression & War Babies, and Silent Generation, respectively. This represented 56%, 57%, 41%, 6%, and 9% of the samples of each of these generations, respectively (e.g., 852 of 1515).

Mobility Mindset of Millennials in Small Urban & Rural Areas Discussion
Western Transportation Institute Page 22
Twenty-nine of the 1,277 survey respondents with one job did not provide information about the number of days that they work. One survey respondent indicated that he or she traveled to work zero days a week; this would imply working from home. Of the remaining 1,247 survey respondents who indicated that they worked 1 job each week, they reported working a minimum, average, and maximum of 1, 5, and 7 days a week.
Thirty of the 1,277 survey respondents with one job did not provide information about the number of days that they traveled to work. Survey respondents reported traveling to work anywhere from one to seven days a week.
Thirty-five of the 1,277 survey respondents with one job did not provide information about the number of hours that they worked in an average week. Of the remaining survey respondents, they indicated working a minimum, average, and maximum of 2, 38, and 100 hours in an average week, respectively.
A large number of telephone survey respondents were not asked how far they traveled to work. Therefore, they contributed to the 559 survey respondents for which information was unavailable. Of those that provided information, the average fell between two categories 1) greater than 5 and less than 10 miles and 2) greater than 10 and less than 15 miles.
Two Jobs Of those reporting that they worked two jobs, 152, 30, 31, and 4 of the 217 survey respondents were Millennials, Generation X, Baby Boomers, and Depression & War Babies, respectively. This represented 10%, 8%, 7%, and 3% of the samples of each of these generations, respectively.
One survey respondent did not provide information about the number of days in a week worked at his or her first job. For their first job, respondents reported working anywhere between 1 and 7 days in a week, with 5 being the average. These survey respondents reported that they worked anywhere from 1 to 80 hours in a week, typically averaging 37 hours (one additional survey respondent had to be removed from this category due to missing information).
Two additional survey respondents did not provide information about the number of days in a week that they work at their second job. Of the remaining survey respondents, for their second job, they reported a minimum of 1 and a maximum of 7 days a week, with 3 days the average. One survey respondent indicated working 168 hours in a week. It is assumed that this could potentially reflect an on-call type of employment, although it is unclear. In addition, one survey respondent indicated typically working 0 hours at the second job. This observation was also removed. The minimum, average and maximum of the final sample was then 1, 17, and 80 hours, respectively.
Three Jobs Of those reporting that they worked three jobs, 23, 6, 6, and 1 of the 36 survey respondents were Millennials, Generation X, Baby Boomers, and Depression & War Babies, respectively. This represented 2%, 2%, 1%, and 0.8% of the samples of each of these generations, respectively.

Mobility Mindset of Millennials in Small Urban & Rural Areas Discussion
Western Transportation Institute Page 23
TABLE 10: Survey Respondents with Three Jobs; Min., Avg., and Max of Number of Days Worked in Average Week
Minimum Average Maximum
Job 1 1 4.8 7
Job 2 1 3.5 7
Job 3 1 2.7 7
TABLE 11: Survey Respondents with Three Jobs; Min., Avg., and Max of Number of Hours Worked in Average Week
Minimum Average Maximum
Job 1 5 38 80
Job 2 3 17.2 90
Job 3 1 13 63
Not every telephone survey respondent was asked to provide information regarding the distance to their job. Therefore, there is limited information and it will not be reported here.
Mobility Mindset of Millennials in Small Urban & Rural Areas Discussion
Western Transportation Institute Page 24
Question 34 – Social Media Question 34 asked, “Please indicate how frequently you use the following social media.” Eight social media types were listed:
1) Twitter, 2) Facebook, 3) LinkedIn, 4) Tumblr, 5) Instagram, 6) Snapchat, 7) MySpace, and 8) Flickr.
Survey respondents were asked to rank their use of each by selecting one of four options: 1) Frequently, 2) Sometimes, 3) Rarely or 4) Never.
Some telephone survey respondents were only asked to rank five of the eight social media: Facebook, Flicker, Instagram, Twitter, and Tumblr. All survey respondents were asked about these five types of social media because state departments of transportation indicated that these social media may be more commonly used by them to convey travel information to road users.
It should be highlighted that survey respondents were asked to select their level of use for each social media type. Therefore, a survey respondent can indicate that they “Frequently” use one type of social media and “Never” use another type.
The following discussion focuses on survey respondents indicating that they “Frequently” use the type of social media discussed.
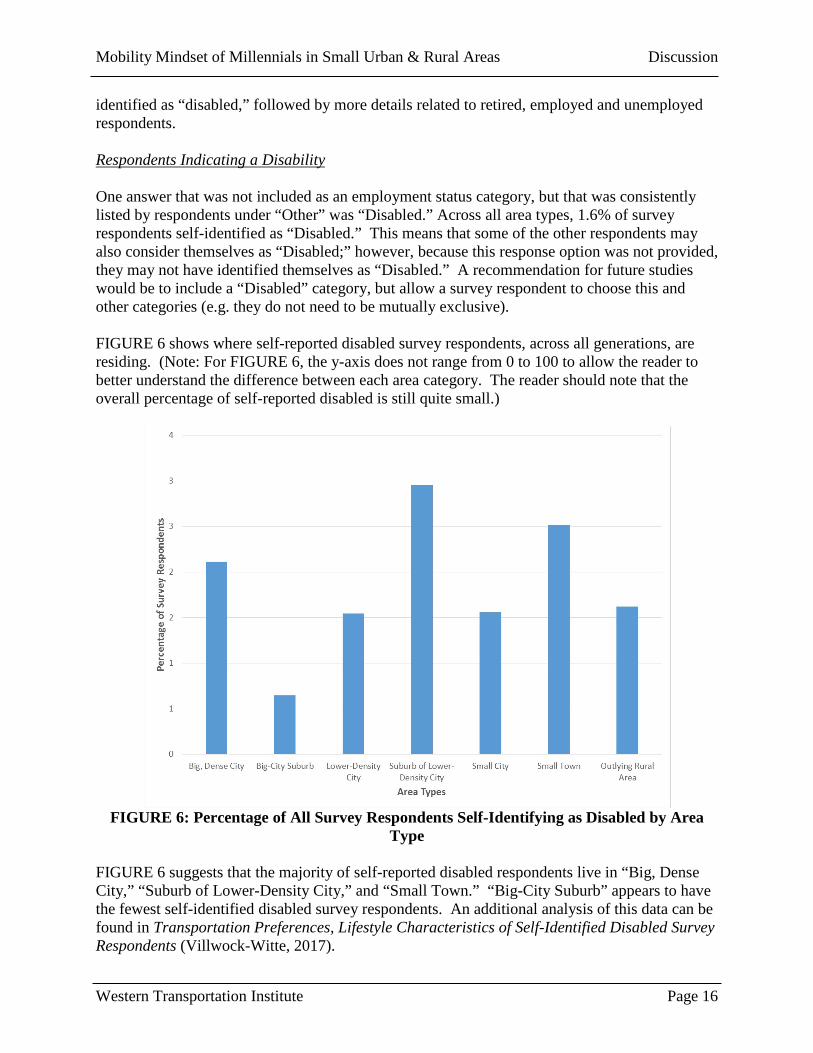
Twitter All survey respondents were asked about their use of Twitter. Millennials reported using Twitter most frequently, although the percentage of survey respondents indicating frequent use was small at less than 15% (FIGURE 12).

Mobility Mindset of Millennials in Small Urban & Rural Areas Discussion
Western Transportation Institute Page 25
FIGURE 12: Frequency of Use of Twitter Across Generations
For all generations, more urban than rural survey respondents indicated that they used Twitter frequently (FIGURE 13). Baby Boomers had the lowest percentage of survey respondents indicating that they used this social media source.

Mobility Mindset of Millennials in Small Urban & Rural Areas Discussion
Western Transportation Institute Page 26
FIGURE 13: Urban vs. Rural Frequent Twitter Users by Generation
Facebook All survey respondents were asked about their use of Facebook. FIGURE 14 shows that the use of Facebook by Millennials and Generation X is similar, with many “Frequent” users. In contrast, a significant percentage of Baby Boomers reported not using Facebook.

Mobility Mindset of Millennials in Small Urban & Rural Areas Discussion
Western Transportation Institute Page 27
FIGURE 14: Frequency of Facebook Use Across Generations
Facebook was used “Frequently” by a significantly larger percentage of survey respondents as compared with Twitter (e.g., ~70% vs. ~20% of urban Millennials) (FIGURE 13 and FIGURE 15). Facebook was reported as being “Frequently” used by more Millennial and Generation X survey respondents when compared with Baby Boomers (FIGURE 15). Fewer rural Millennial and Baby Boomer survey respondents reported using Facebook “Frequently” as compared with their urban counterparts. Generation X reported the opposite of the Millennial and Baby Boomers, as slightly more rural survey respondents in this generational cohort indicated that they used Facebook “Frequently” as compared with their urban counterparts.

Mobility Mindset of Millennials in Small Urban & Rural Areas Discussion
Western Transportation Institute Page 28
FIGURE 15: Urban vs. Rural Frequent Facebook Users by Generation
LinkedIn 800 survey respondents (of 2519) were not asked regarding their frequency of use of LinkedIn; percentages in the subsequent discussion are only based on those survey respondents who were presented with this question. Compared to Twitter (FIGURE 13), fewer survey respondents indicated that they made use of LinkedIn (FIGURE 16). Because the percentage of survey respondents indicating that they use this form of social media is small, it is even harder to compare usage between the urban and rural survey respondents; however, it appears that urban survey respondents report using LinkedIn more frequently than rural survey respondents (FIGURE 16).

Mobility Mindset of Millennials in Small Urban & Rural Areas Discussion
Western Transportation Institute Page 29
FIGURE 16: Urban vs. Rural Frequent LinkedIn Users by Generation
Tumblr All survey respondents were asked about their use of Tumblr. Overall, a similar percentage of survey respondents reported using Tumblr and LinkedIn (FIGURE 17 and FIGURE 16). However, almost no Baby Boomer survey respondents indicated that they used Tumblr, which is unlike LinkedIn, which had a very small percentage of users among Baby Boomers. Twitter and Tumblr had similar trends in that more urban survey respondents made use of these types of social media when compared with rural survey respondents, and more Millennials made use of the social media as compared with Generation X and Baby Boomers.

Mobility Mindset of Millennials in Small Urban & Rural Areas Discussion
Western Transportation Institute Page 30
FIGURE 17: Urban vs. Rural Frequent Tumblr Users by Generation
Instagram All survey respondents were asked about their use of Instagram. Like Twitter and Tumblr, urban survey respondents reported using Instagram more than rural survey respondents (FIGURE 13, FIGURE 17, and FIGURE 18). In addition, similar to Twitter and Tumblr, from Millennial to Generation X to Baby Boomers, the use of Instagram decreased (FIGURE 18).
Mobility Mindset of Millennials in Small Urban & Rural Areas Discussion
Western Transportation Institute Page 31
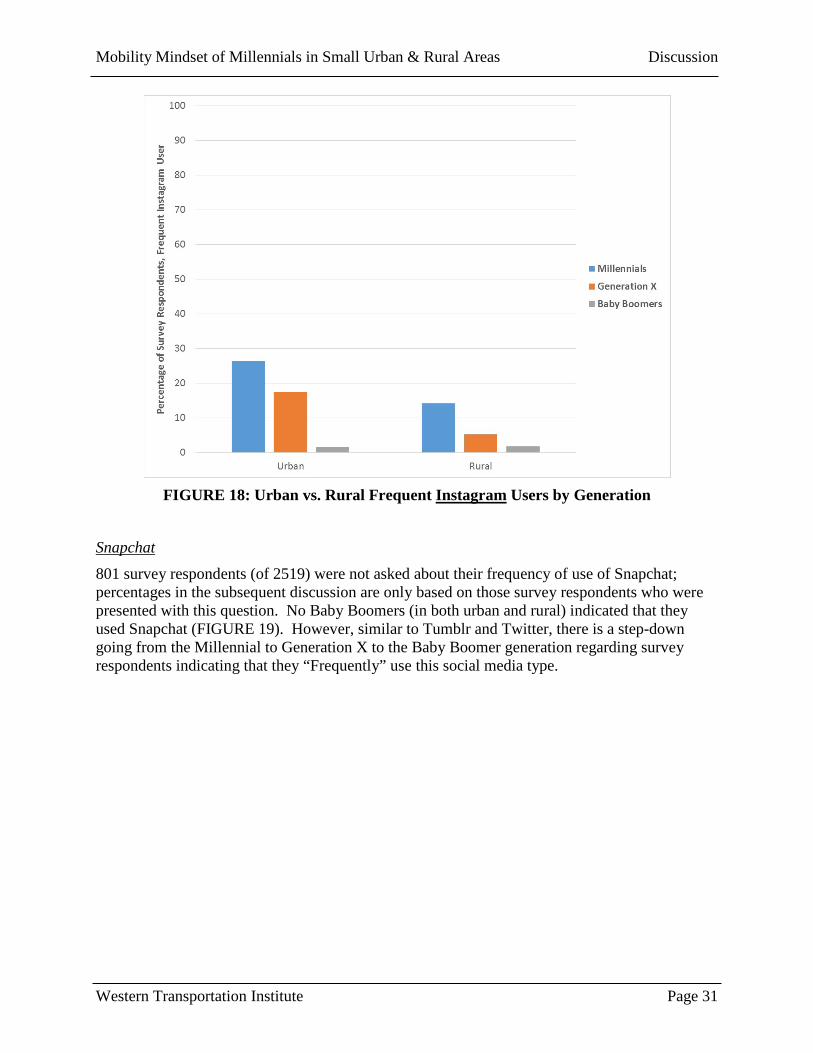
FIGURE 18: Urban vs. Rural Frequent Instagram Users by Generation
Snapchat 801 survey respondents (of 2519) were not asked about their frequency of use of Snapchat; percentages in the subsequent discussion are only based on those survey respondents who were presented with this question. No Baby Boomers (in both urban and rural) indicated that they used Snapchat (FIGURE 19). However, similar to Tumblr and Twitter, there is a step-down going from the Millennial to Generation X to the Baby Boomer generation regarding survey respondents indicating that they “Frequently” use this social media type.

Mobility Mindset of Millennials in Small Urban & Rural Areas Discussion
Western Transportation Institute Page 32
FIGURE 19: Urban vs. Rural Frequent Snapchat Users by Generation
MySpace 783 survey respondents (of 2519) were not asked about their frequency of use of MySpace; percentages in the subsequent discussion are only based on those survey respondents who were presented with this question. Almost no rural survey respondents indicated that they use MySpace “Frequently.” Of the urban survey respondents, although there were extremely few, Generation X had the largest percentage of survey respondents who indicated that they used MySpace “Frequently.”

Mobility Mindset of Millennials in Small Urban & Rural Areas Discussion
Western Transportation Institute Page 33
FIGURE 20: Urban vs. Rural Frequent MySpace Users by Generation
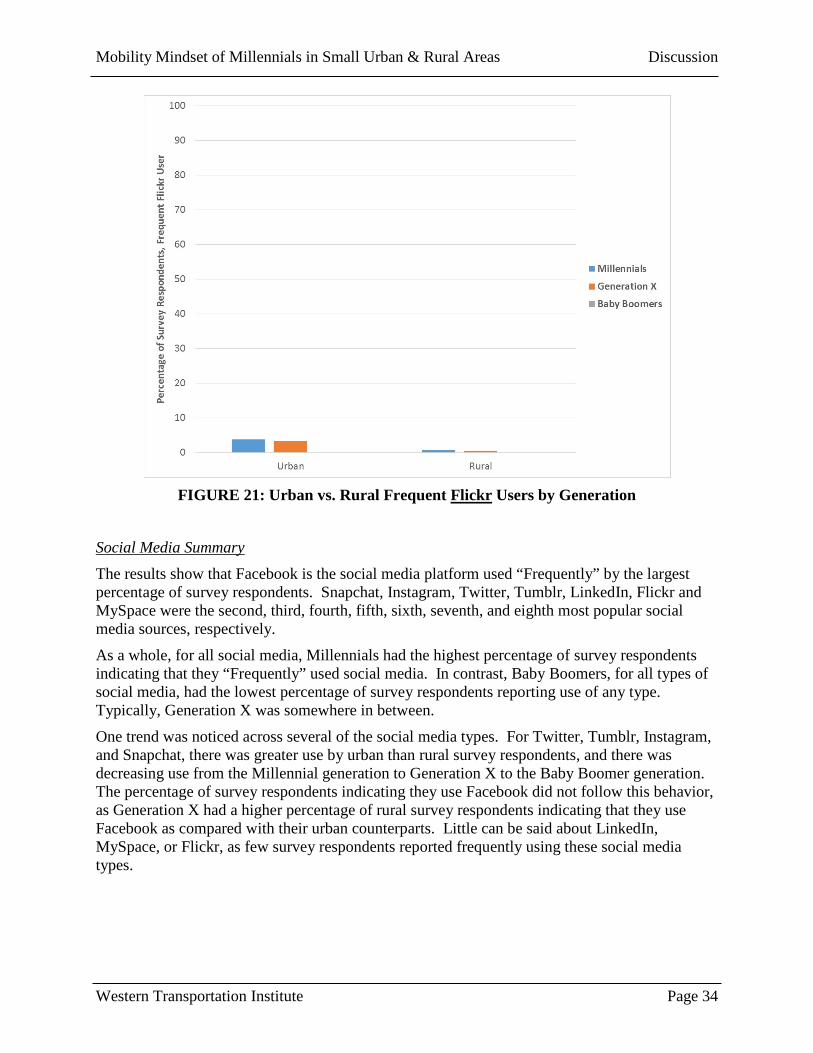
Flickr All survey respondents were asked about their use of Flickr. Overall, very few survey respondents indicated that they made use of this type of social media (FIGURE 21). Similar to the responses for Snapchat, there were no Baby Boomer survey respondents indicating that they “Frequently” use this type of social media.
Mobility Mindset of Millennials in Small Urban & Rural Areas Discussion
Western Transportation Institute Page 34
FIGURE 21: Urban vs. Rural Frequent Flickr Users by Generation
Social Media Summary The results show that Facebook is the social media platform used “Frequently” by the largest percentage of survey respondents. Snapchat, Instagram, Twitter, Tumblr, LinkedIn, Flickr and MySpace were the second, third, fourth, fifth, sixth, seventh, and eighth most popular social media sources, respectively.
As a whole, for all social media, Millennials had the highest percentage of survey respondents indicating that they “Frequently” used social media. In contrast, Baby Boomers, for all types of social media, had the lowest percentage of survey respondents reporting use of any type. Typically, Generation X was somewhere in between.
One trend was noticed across several of the social media types. For Twitter, Tumblr, Instagram, and Snapchat, there was greater use by urban than rural survey respondents, and there was decreasing use from the Millennial generation to Generation X to the Baby Boomer generation. The percentage of survey respondents indicating they use Facebook did not follow this behavior, as Generation X had a higher percentage of rural survey respondents indicating that they use Facebook as compared with their urban counterparts. Little can be said about LinkedIn, MySpace, or Flickr, as few survey respondents reported frequently using these social media types.

Mobility Mindset of Millennials in Small Urban & Rural Areas Discussion
Western Transportation Institute Page 35
Question 37 – Agreement: Connect, Variety, Cost, Distance, Online Shopping, Walkability Question 37 asked, “Please indicate your level of agreement with the following statements.” Five levels of agreement were provided: Strongly Agree, Agree, Neutral, Disagree and Strongly Disagree. The following eight statements were provided:
1) It is important for me to stay connected to the internet/phone while traveling on a daily basis.
2) I feel that I have a variety of transportation options in my community that allow me to get to where I need to go.
3) Cost influences how I travel (e.g., by bus, train, or car). 4) Distance to work influences how I travel (e.g., by bus, train, car). 5) Distance to shopping influences how I travel (e.g. by bus, train car). 6) Distance to recreational activities (e.g., running, walking, viewing movies, etc.)
influences how I travel (e.g. by bus, train, car). 7) I prefer to shop online as compared to shopping in person. 8) The area where I live is walkable (retail stores and restaurants are within a comfortable
walking distance).
The following sections discuss the results for each of the statements for Question 37.
Connected to Internet/Phone FIGURE 22 shows the percentage of survey respondents indicating Strongly Agree, Agree, Neutral, Disagree, and Strongly Disagree for the statement “It is important for me to stay connected to the internet/phone while traveling on a daily basis.”

Mobility Mindset of Millennials in Small Urban & Rural Areas Discussion
Western Transportation Institute Page 36
FIGURE 22: Percentage of Survey Respondents Across Generations, Preference for
Connectivity FIGURE 22 shows that the Millennial and Generation X generations by far prefer to stay connected as compared with the Baby Boomer generation. Considering only the Millennial generation, there appears to be a more significant preference by urban Millennials as compared with rural Millennials for staying connected (FIGURE 23).

Mobility Mindset of Millennials in Small Urban & Rural Areas Discussion
Western Transportation Institute Page 37
FIGURE 23: Urban vs. Rural Percentage of Millennial Survey Respondents, Preference for
Connectivity Transportation Options 785 survey respondents were not asked this question. FIGURE 24 shows the percentage of survey respondents indicating Strongly Agree, Agree, Neutral, Disagree, and Strongly Disagree for the statement “I feel that I have a variety of transportation options in my community that allow me to get to where I need to go.”

Mobility Mindset of Millennials in Small Urban & Rural Areas Discussion
Western Transportation Institute Page 38
FIGURE 24: Percentage of Survey Respondents Across Generations, Variety of
Transportation Options FIGURE 24 shows that the Millennial and Generation X generations by far believe that they have a variety of transportation options. The Baby Boomers seem to have a more negative perception. Considering that the Baby Boomer generation has shown a preference for having an automobile in other questions, this could hint that Baby Boomers might be interested in considering other modes, but that they do not believe there is an adequate level of service. Considering only the Millennial generation, urban Millennials indicate that they feel they have sufficient transportation options as compared with rural Millennials (FIGURE 25). This could potentially explain in part why Millennials are moving to urban areas – more transportation options.

Mobility Mindset of Millennials in Small Urban & Rural Areas Discussion
Western Transportation Institute Page 39
FIGURE 25: Urban vs. Rural Percentage of Millennial Survey Respondents, Variety of
Transportation Options
Cost Influences FIGURE 26 shows the percentage of survey respondents indicating Strongly Agree, Agree, Neutral, Disagree, and Strongly Disagree for the statement “Cost influences how I travel.”

Mobility Mindset of Millennials in Small Urban & Rural Areas Discussion
Western Transportation Institute Page 40
FIGURE 26: Percentage of Survey Respondents Across Generations, Influence of Cost on
Travel FIGURE 26 shows that the Millennial generation puts the greatest value on cost, with each successive generation less-so. However, the difference between Millennial and Generation X generations is not that large. Considering only the Millennial generation, urban Millennials report a greater importance on the cost of the transportation mode as compared with the rural Millennials (FIGURE 27). This could potentially reflect the higher cost of living typical in an urban area, thereby limiting the amount of money available to spend on transportation or discretionary purchases.

Mobility Mindset of Millennials in Small Urban & Rural Areas Discussion
Western Transportation Institute Page 41
FIGURE 27: Urban vs. Rural Percentage of Millennial Survey Respondents, Influence of
Cost on Travel
Distance to Work FIGURE 28 shows the percentage of survey respondents indicating Strongly Agree, Agree, Neutral, Disagree, and Strongly Disagree for the statement “Distance to work influences how I travel.”
Mobility Mindset of Millennials in Small Urban & Rural Areas Discussion
Western Transportation Institute Page 42
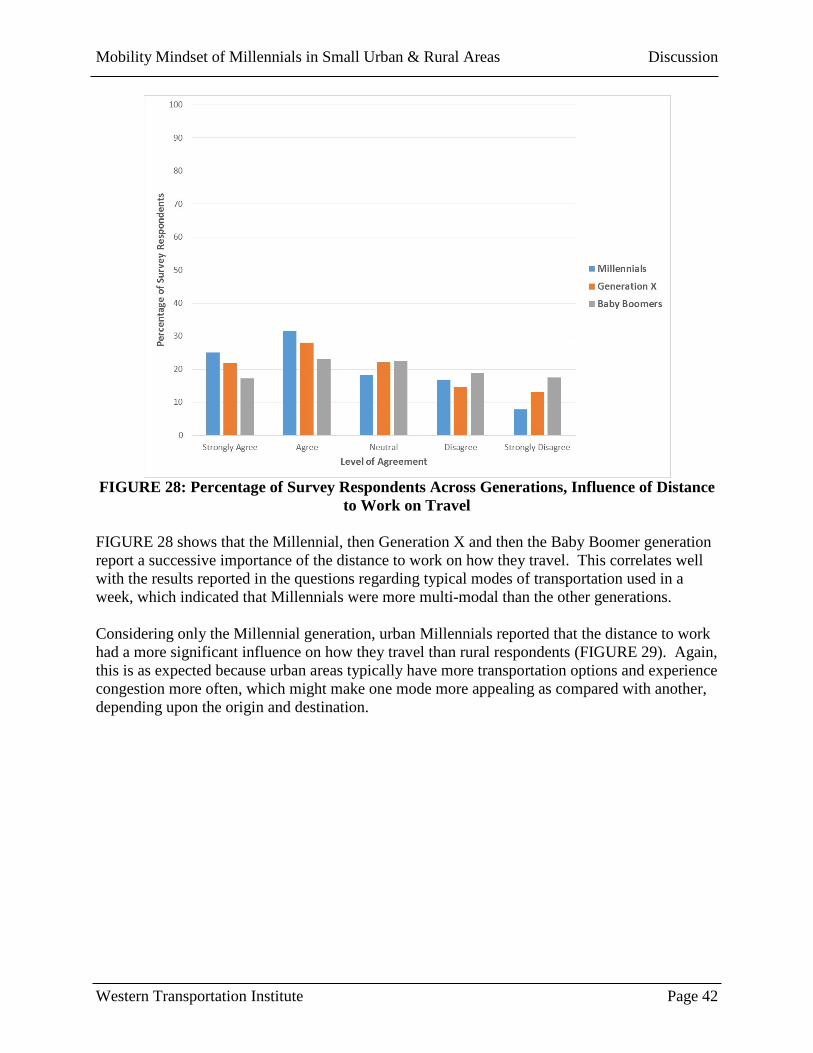
FIGURE 28: Percentage of Survey Respondents Across Generations, Influence of Distance
to Work on Travel FIGURE 28 shows that the Millennial, then Generation X and then the Baby Boomer generation report a successive importance of the distance to work on how they travel. This correlates well with the results reported in the questions regarding typical modes of transportation used in a week, which indicated that Millennials were more multi-modal than the other generations. Considering only the Millennial generation, urban Millennials reported that the distance to work had a more significant influence on how they travel than rural respondents (FIGURE 29). Again, this is as expected because urban areas typically have more transportation options and experience congestion more often, which might make one mode more appealing as compared with another, depending upon the origin and destination.

Mobility Mindset of Millennials in Small Urban & Rural Areas Discussion
Western Transportation Institute Page 43
FIGURE 29: Urban vs. Rural Percentage of Millennial Survey Respondents, Influence of
Distance to Work and Travel
Distance to Shopping FIGURE 30 shows the percentage of survey respondents indicating Strongly Agree, Agree, Neutral, Disagree, and Strongly Disagree for the statement “Distance to shopping influences how I travel.”

Mobility Mindset of Millennials in Small Urban & Rural Areas Discussion
Western Transportation Institute Page 44
FIGURE 30: Percentage of Survey Respondents Across Generations, Distance to Shopping
Influences Travel FIGURE 30 shows the level of agreement is pretty consistent across generations, although the Baby Boomer survey respondents were a little less strong in their agreement, in that more chose “Agree” as compared with “Strongly Agree.” Considering only the Millennial generation, it appears that distance to shopping has more of an influence on the urban Millennial generation survey respondents than the rural Millennials (FIGURE 31).
Mobility Mindset of Millennials in Small Urban & Rural Areas Discussion
Western Transportation Institute Page 45
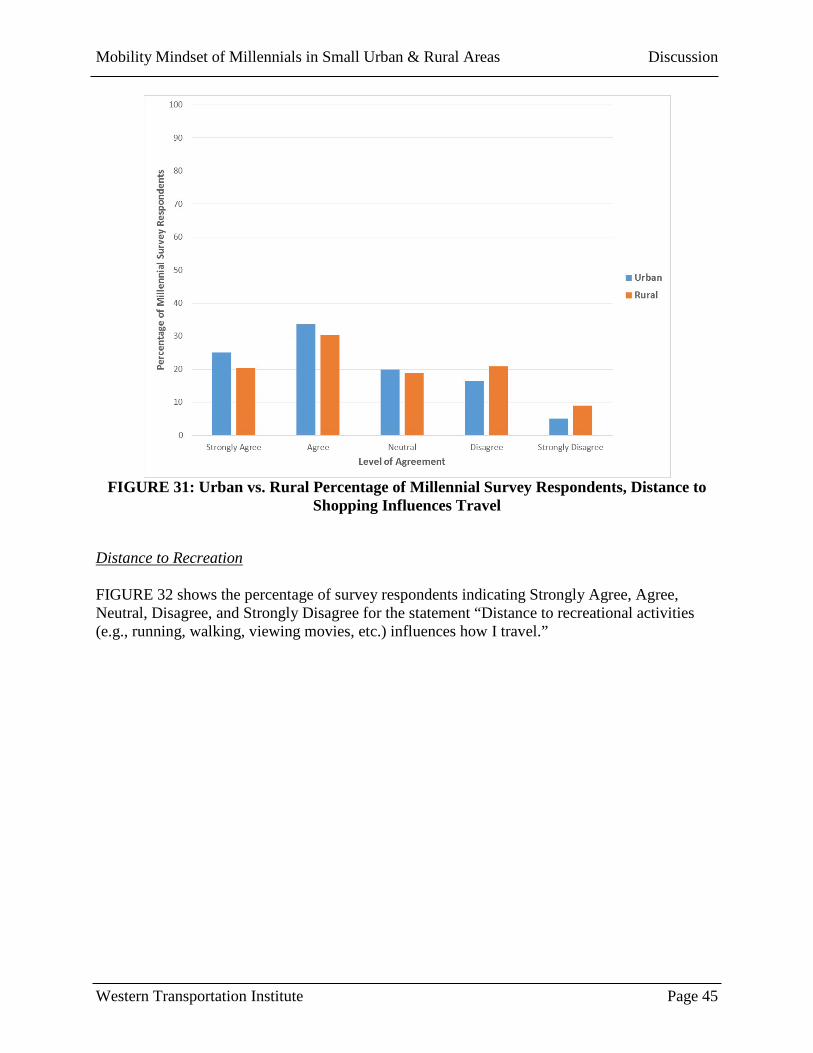
FIGURE 31: Urban vs. Rural Percentage of Millennial Survey Respondents, Distance to
Shopping Influences Travel
Distance to Recreation FIGURE 32 shows the percentage of survey respondents indicating Strongly Agree, Agree, Neutral, Disagree, and Strongly Disagree for the statement “Distance to recreational activities (e.g., running, walking, viewing movies, etc.) influences how I travel.”

Mobility Mindset of Millennials in Small Urban & Rural Areas Discussion
Western Transportation Institute Page 46
FIGURE 32: Percentage of Survey Respondents Across Generations, Distance to
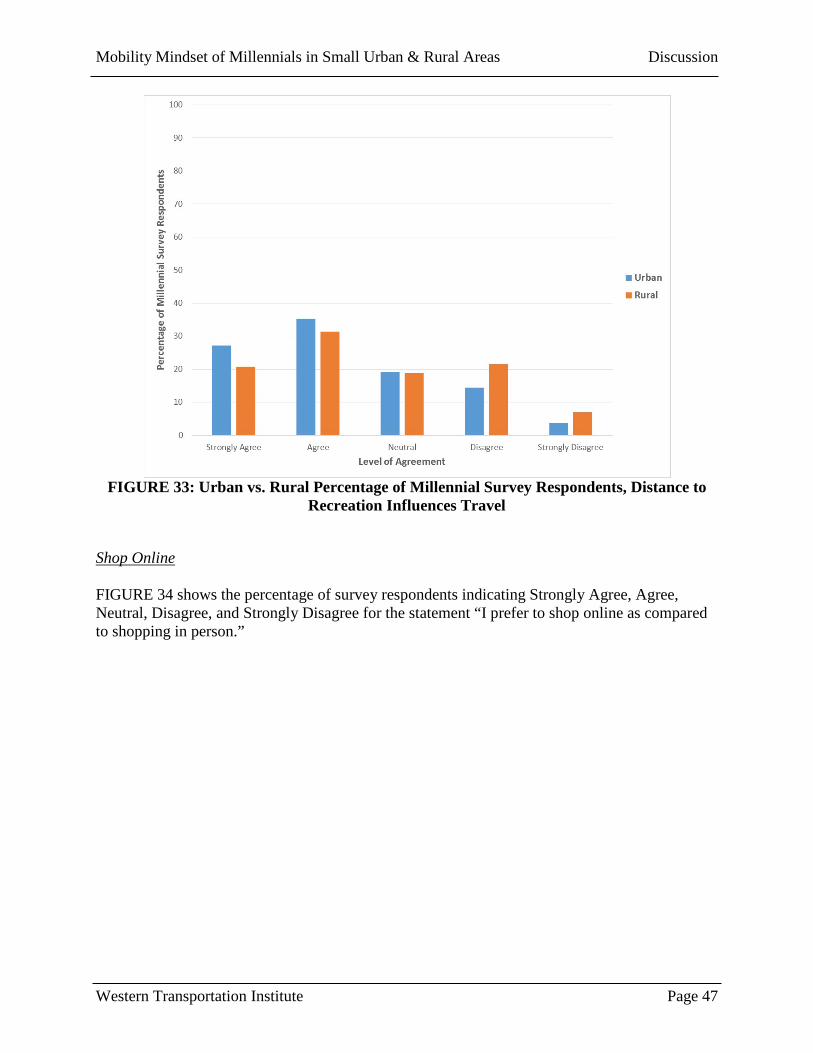
Recreation Influences Travel FIGURE 32 suggests that the distance to recreation influences the younger generations more than it does the Baby Boomer generations. This could potentially imply that younger generations might consider using alternative modes (public transportation, biking, walking, etc.) to a recreational activity if available and reasonably convenient. Considering only the Millennial generation, there appears to be more consideration by the urban Millennials as compared to their rural counterparts regarding the distance to the recreational activity and how they travel to get there (FIGURE 33).
Mobility Mindset of Millennials in Small Urban & Rural Areas Discussion
Western Transportation Institute Page 47
FIGURE 33: Urban vs. Rural Percentage of Millennial Survey Respondents, Distance to
Recreation Influences Travel
Shop Online FIGURE 34 shows the percentage of survey respondents indicating Strongly Agree, Agree, Neutral, Disagree, and Strongly Disagree for the statement “I prefer to shop online as compared to shopping in person.”

Mobility Mindset of Millennials in Small Urban & Rural Areas Discussion
Western Transportation Institute Page 48
FIGURE 34: Percentage of Survey Respondents Across Generations, Preference for Online
Shopping FIGURE 34 shows that Generation X seems to have the greatest interest in shopping online whereas the Baby Boomer generation shows the least interest. Considering only the Millennial generation, there appears to be a more significant preference by urban Millennials as compared with rural Millennials for shopping online (FIGURE 35). This is a bit unexpected, as it would be suspected that rural Millennials might have a greater preference for shopping online because it would increase their access to shopping options, as discussed in the literature review by Zhou and Wang (2014). However, as discussed in the technical memorandum on demographics, urban Millennials appear to have a higher level of education and typically reported greater annual income levels, which according to the findings from Zhou and Wang correlate with a greater propensity to shop online (Zhou & Wang, 2014).

Mobility Mindset of Millennials in Small Urban & Rural Areas Discussion
Western Transportation Institute Page 49
FIGURE 35: Urban vs. Rural Percentage of Millennial Survey Respondents, Preference for
Shopping Online
Investigating further, Generation X and the Baby Boomer generations were analyzed by rural and urban groupings (FIGURE 36 & FIGURE 37).

Mobility Mindset of Millennials in Small Urban & Rural Areas Discussion
Western Transportation Institute Page 50
FIGURE 36: Urban vs. Rural Percentage of Generation X Survey Respondents, Preference
for Shopping Online

Mobility Mindset of Millennials in Small Urban & Rural Areas Discussion
Western Transportation Institute Page 51
FIGURE 37: Urban vs. Rural Percentage of Baby Boomer Survey Respondents, Preference
for Shopping Online
The expectation that rural survey respondents would prefer to shop online in order to access a wider variety of goods seems to hold for Generation X and the Baby Boomer generation (FIGURE 36 & FIGURE 37). This could potentially reflect the fact that these two generations have more discretionary income (see technical memorandum on demographics (Villwock-Witte & Clouser, 2016)), which Zhou and Wang (Zhou & Wang, 2014) identified as being correlated with an increased likelihood to shop.
Walkable FIGURE 38 shows the percentage of survey respondents indicating Strongly Agree, Agree, Neutral, Disagree, and Strongly Disagree for the statement “The area where I live is walkable.”

Mobility Mindset of Millennials in Small Urban & Rural Areas Discussion
Western Transportation Institute Page 52
FIGURE 38: Percentage of Survey Respondents Across Generations, Walkability
FIGURE 38 shows that while overall, survey respondents did not strongly agree that their area is walkable, more Millennial survey respondents agreed with the statement as compared with Baby Boomers. In addition, in other walking-related questions, Baby Boomers seemed to express an interest in walking. Therefore, it would appear that Baby Boomers might have an interest in creating more walkable environments; more research is needed to better understand the Baby Boomer’s interest in a walkable environment, particularly related to the cost of creating such an environment and whether or not Baby Boomers are willing to spend the money to do so. Considering only the Millennial generation, far more urban Millennials indicated that their environment was walkable as compared with rural Millennials (FIGURE 39). However, Question 44 asked if more sidewalks should be provided and many rural Millennials indicated that more sidewalks did not fit the context of their communities (Question 45). Therefore, while it seems that rural Millennials realize that their environment is not walkable, they do not necessarily want more walking infrastructure to be implemented. This issue should be investigated in greater detail through further research to draw definitive conclusions.

Mobility Mindset of Millennials in Small Urban & Rural Areas Discussion
Western Transportation Institute Page 53
FIGURE 39: Urban vs. Rural Percentage of Millennial Survey Respondents, Walkability
Question 46 – Number of Vehicles Question 46 asked, “How many operable vehicle(s) are available for use (e.g. you own, lease or have permission to borrow them) in your household?”
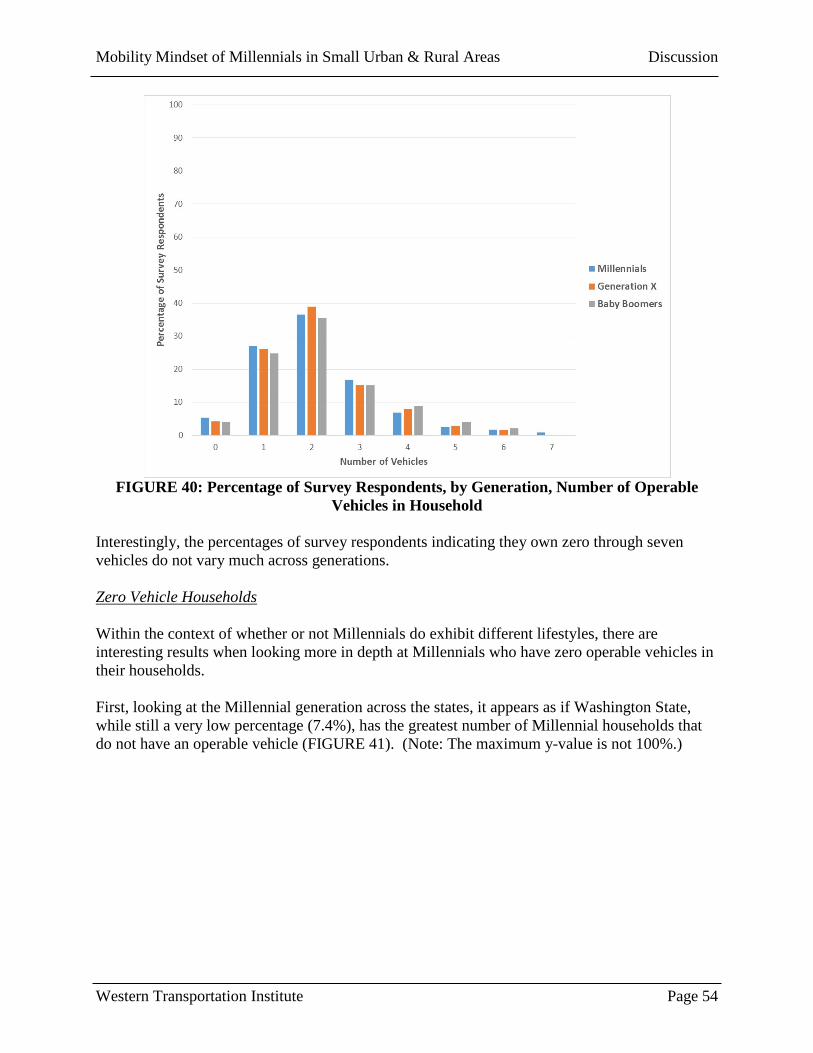
Overall, Number of Vehicles, Results Respondents indicated they had anywhere from 0 to 30 vehicles. FIGURE 40 shows the percentage of survey respondents reporting owning zero to seven vehicles in their household. FIGURE 40 shows that the majority of survey respondents have households with two operable vehicles, with a rapidly decreasing percentage as the number of operable vehicles in a household approaches seven.
Mobility Mindset of Millennials in Small Urban & Rural Areas Discussion
Western Transportation Institute Page 54
FIGURE 40: Percentage of Survey Respondents, by Generation, Number of Operable
Vehicles in Household Interestingly, the percentages of survey respondents indicating they own zero through seven vehicles do not vary much across generations. Zero Vehicle Households Within the context of whether or not Millennials do exhibit different lifestyles, there are interesting results when looking more in depth at Millennials who have zero operable vehicles in their households. First, looking at the Millennial generation across the states, it appears as if Washington State, while still a very low percentage (7.4%), has the greatest number of Millennial households that do not have an operable vehicle (FIGURE 41). (Note: The maximum y-value is not 100%.)

Mobility Mindset of Millennials in Small Urban & Rural Areas Discussion
Western Transportation Institute Page 55
FIGURE 41: Percentage of Zero Operable Vehicle Millennial Households by State
This could either indicate that there are more transportation options within the state that allow one to choose a mode other than a vehicle to get around, or it could provide an indication that there are more Millennial households that cannot afford a vehicle. FIGURE 42 categorizes the zero vehicle households by area type.

Mobility Mindset of Millennials in Small Urban & Rural Areas Discussion
Western Transportation Institute Page 56
FIGURE 42: Percentage of Zero Operable Vehicle Millennial Households by State and
Area Type FIGURE 42 shows that Millennials in “Big, Dense Cities” have the largest percentage of survey respondents indicating that they do not own a vehicle. (Note: Montana has few survey respondents that identified as living in a “Big, Dense City.”) Four other interesting anomalies include 1) the high percentage of Montana survey respondents in the “Suburb of Lower-Density City,” 2) the high percentage of Washington State survey respondents in “Small City,” 3) the high percentage of Washington State survey respondents in “Small Town,” and 4) the high percentage of Wisconsin survey respondents in “Outlying Rural Area.” These anomalies could reflect that there are either alternative forms of transportation available to the survey respondents or that they cannot afford a vehicle.

Mobility Mindset of Millennials in Small Urban & Rural Areas Discussion
Western Transportation Institute Page 57
FIGURE 43: Proportion of Zero Vehicle Ownership Across Generations by Area Type
FIGURE 43 presents some results as expected: across generations, the greatest percentage of survey respondents who indicated that they have zero operable vehicles live in “Big, Dense Cities.” In addition, Millennials are represented in every area type. However, there is the potential that individuals who fall within the Generation X and Baby Boomer generations also have more households with zero operable vehicles that were not identified by this survey, considering that each respective generational cohort only had about one-fifth the total number of surveys as compared with Millennials. Therefore, before definitively concluding that there is in fact a difference, it would be of value to draw a larger sample from these generational cohorts. However, this does confirm that there are Millennials in a variety of area types that do not have vehicles. Another point of interest is that it is clear that rural areas and large urban areas have the greatest representation of survey respondents with zero operable vehicles, whereas suburb areas, which typically are lower density, have the smallest representation of survey respondents without a vehicle. The only interesting anomaly within these results is for the Depression & War Babies generation, where there is a spike in the percentage of survey respondents living in this area type (e.g. “Big-City Suburb”) without a vehicle. Considering the age of this group, it might reflect their dependence upon someone else to provide their transportation.
Question 47 – Vehicle Ownership Status Question 47 asked, “Which of the following best describes your vehicle ownership status or plans?” Seven potential answers were presented to respondents:
1) I currently own a vehicle. 2) I currently lease a vehicle.

Mobility Mindset of Millennials in Small Urban & Rural Areas Discussion
Western Transportation Institute Page 58
3) I have regular access to a vehicle that someone else in my household owns. 4) I have regular access to a vehicle that someone else in my household leases. 5) I don’t currently own a vehicle, but I have plans to buy one in the next 1-2 years. 6) I don’t currently own a vehicle, but I have plans to lease one in the next 1-2 years. 7) I don’t currently own a vehicle and have no plans to lease or buy one in the immediate
future.
804 survey respondents were not asked this question, due to time limitations during the deployment of the telephone survey. Survey respondents were only allowed to choose one of the 7 options. FIGURE 44 shows that the majority of survey respondents, across all generations, own a vehicle.
FIGURE 44: Vehicle Ownership by Generation
While the Millennial generation appears to have the lowest percentage of survey respondents who do not own a vehicle, it also has the largest percentage of survey respondents reporting that they 1) have regular access to a vehicle that someone else owns or 2) have plans to buy a vehicle in the near future. Interestingly enough, Millennials have the lowest percentage of survey respondents indicating that they do not currently own a vehicle and do not plan to lease or purchase one. The greater reported interest in owning a vehicle and lower reported interest reported in no plans to own one would seem to contradict the literature that indicates that Millennials “prefer” public transportation.

Mobility Mindset of Millennials in Small Urban & Rural Areas Discussion
Western Transportation Institute Page 59
While relatively consistent, there is some indication that rural Millennials are more dependent upon a vehicle than urban Millennials (FIGURE 45).
FIGURE 45: Urban vs. Rural Millennial Vehicle Ownership
This finding is particularly evident in the categories of “I currently lease a vehicle,” “I don’t currently own a vehicle but have plans to buy one in the next 1 to 2 years,” and “I don’t currently own a vehicle and have no plans to lease or buy one in the immediate future.” The first two categories possibly represent survey respondents who currently lack the finances to afford a vehicle, but who have an interest in owning one. Rural Millennials showed a greater preference for these categories as compared with their urban counterparts. The third category provides an indication of wanting to use modes other than a vehicle for transportation, and for this category, there is greater interest from urban Millennials than rural Millennials. Therefore, again, there is a hint that urban Millennials have a different mobility mindset and financial resources as compared with rural Millennials.
Question 48 – Describe: New, Sociable, Price, Technology, Independence, Authenticity, and Environment Question 48 asked, “How well does each statement below describe you?” Three potential responses were provided for each statement: “Describes me very well,” “Describes me somewhat well,” and “Does not describe me.” The statements were:
1) I like doing things that are new and different. 2) I consider myself to be very sociable. 3) I buy based on quality, not price.

Mobility Mindset of Millennials in Small Urban & Rural Areas Discussion
Western Transportation Institute Page 60
4) I prefer products that offer the latest in new technology. 5) I value my independence above all else. 6) I seek out places and people that are local/authentic. 7) I care about the environment.
The following sections describe the results for each statement. New & Different 805 survey respondents were not asked this question due to time constraints. FIGURE 46 shows the percentage of survey respondents indicating “Describes me very well, Describes me somewhat well, or Does not describe me” for the statement “I like doing things that are new and different.”
FIGURE 46: Percentage of Survey Respondents Across Generations, Preference for New &
Different FIGURE 46 shows that overall, Millennials are more likely to indicate “Describes me very well,” with the percentage decreasing with each successive generation. The opposite is true for those who said, “Does not describe me.” Considering only the Millennial generation, there does not appear to be much of a difference between those in urban and rural areas (FIGURE 47).

Mobility Mindset of Millennials in Small Urban & Rural Areas Discussion
Western Transportation Institute Page 61
FIGURE 47: Urban vs. Rural Percentage of Millennial Survey Respondents, New &
Different Sociable Personality 805 survey respondents were not asked this question due to time constraints. FIGURE 48 shows the percentage of survey respondents indicating “Describes me very well,” “Describes me somewhat well,” or “Does not describe me” for the statement, “I consider myself to be very sociable.”

Mobility Mindset of Millennials in Small Urban & Rural Areas Discussion
Western Transportation Institute Page 62
FIGURE 48: Percentage of Survey Respondents Across Generations who Self-identified as
Sociable There are different interpretations of sociability. Millennials may consider this using social media to keep in touch with their friends. Baby Boomers may consider this getting together with their friends for dinner. The only real difference among responses across generations is for Generation X in the “Describes me somewhat well” category. However, it is unclear what this means. Therefore, it would appear that for the most part, the responses are consistent across the generations. FIGURE 49 compares the responses of urban and rural Millennials, regarding how sociable they consider themselves to be.

Mobility Mindset of Millennials in Small Urban & Rural Areas Discussion
Western Transportation Institute Page 63
FIGURE 49: Urban vs. Rural Percentage of Millennial Survey Respondents who Self-
Identified as Sociable There does not appear to be any significant differences in the responses when comparing urban and rural Millennials. Quality, Not Price 805 survey respondents were not asked this question due to time constraints. FIGURE 50 shows the percentage of survey respondents indicating “Describes me very well,” “Describes me somewhat well,” or “Does not describe me” for the statement “I buy based on quality, not price.”

Mobility Mindset of Millennials in Small Urban & Rural Areas Discussion
Western Transportation Institute Page 64
FIGURE 50: Percentage of Survey Respondents Across Generations Preferring Quality,
Not Price FIGURE 50 shows that overall, Millennials are more likely to indicate “Describes me very well,” with the percentage decreasing with each successive generation. The opposite is true for those who said, “Does not describe me.” Considering only the Millennial generation, there appears to be a slight emphasis on quality over price by urban respondents as compared with rural respondents (FIGURE 51).

Mobility Mindset of Millennials in Small Urban & Rural Areas Discussion
Western Transportation Institute Page 65
FIGURE 51: Urban vs. Rural Percentage of Millennial Survey Respondents, Preference for
Quality Over Price New Technology 805 survey respondents were not asked this question due to time constraints. FIGURE 52 shows the percentage of survey respondents indicating “Describes me very well,” “Describes me somewhat well,” “Does not describe me” for the statement “I prefer products that offer the latest in new technology.”

Mobility Mindset of Millennials in Small Urban & Rural Areas Discussion
Western Transportation Institute Page 66
FIGURE 52: Percentage of Survey Respondents Across Generations Preferring New
Technology FIGURE 52 shows that overall, Millennials are more likely to indicate “Describes me very well,” with the percentage decreasing with each successive generation. The opposite is true for those who said, “Does not describe me.” Considering only the Millennial generation, rural survey respondents had a slightly greater percentage indicating “Describes me very well” (FIGURE 53). However, there was also a greater percentage of rural Millennial survey respondents indicating “Does not describe me.” Fewer rural Millennial survey respondents chose the indecisive “Describes me somewhat well,” accounting for the larger percentages in the other two categories. In all, however, there seems to be little difference.

Mobility Mindset of Millennials in Small Urban & Rural Areas Discussion
Western Transportation Institute Page 67
FIGURE 53: Urban vs. Rural Percentage of Millennial Survey Respondents, Preference for
New Technology Independence 804 survey respondents were not asked this question due to time constraints. FIGURE 54 shows the percentage of survey respondents indicating “Describes me very well,” “Describes me somewhat well,” or “Does not describe me” for the statement “I value my independence above all else.”

Mobility Mindset of Millennials in Small Urban & Rural Areas Discussion
Western Transportation Institute Page 68
FIGURE 54: Percentage of Survey Respondents Across Generations, Independence
FIGURE 54 shows that overall, unexpectedly, a greater percentage of Baby Boomer survey respondents indicated “Describes me very well.” They also had a slightly greater percentage that said “Does not describe me,” and the fewest indicating “Describes me somewhat well.” In that sense, Baby Boomers are clearly more decisive in their response. A preference for the private automobile is often associated with independence, which more Baby Boomers were shown to prefer. In addition, some of the living situations that Millennials have shown to prefer (see subsequent Question 54) are associated with a higher level of dependence (e.g. living at home). Therefore, collectively considering these results, it makes sense that Baby Boomers show a higher preference for independence. Considering only the Millennial generation, rural survey respondents had a slightly greater percentage of both “Describes me very well” and “Does not describe me” responses (FIGURE 55). Fewer rural Millennial survey respondents chose the indecisive “Describes me somewhat well,” accounting for the larger percentages in the other two categories. Therefore, it would appear that the rural Millennial survey respondents are more definitive in their view of independence as compared with urban Millennial survey respondents. Again, overall the differences are small.

Mobility Mindset of Millennials in Small Urban & Rural Areas Discussion
Western Transportation Institute Page 69
FIGURE 55: Urban vs. Rural Percentage of Millennial Survey Respondents, Independence Considering that the Baby Boomers showed an anomaly as compared with the other two younger generations when it comes to their affirmation for independence, researchers took a closer look at the responses from this generation. FIGURE 56 shows that the urban Baby Boomers are contributing to the higher representation of “Describes me very well” responses, and the rural Baby Boomers are contributing to the higher representation in the “Does not describe me” category. The reader should note that only approximately seventy percent of the entire sample of Baby Boomers was asked this question.

Mobility Mindset of Millennials in Small Urban & Rural Areas Discussion
Western Transportation Institute Page 70
FIGURE 56: Urban vs. Rural Percentage of Baby Boomer Survey Respondents,
Independence Local/Authentic Experiences 803 survey respondents were not asked this question due to time constraints. FIGURE 57 shows the percentage of survey respondents indicating “Describes me very well,” “Describes me somewhat well,” or “Does not describe me” for the statement “I seek out places and people that are local/authentic.”

Mobility Mindset of Millennials in Small Urban & Rural Areas Discussion
Western Transportation Institute Page 71
FIGURE 57: Percentage of Survey Respondents Across Generations Preferring
Local/Authentic People & Places FIGURE 57 shows that while all three generations exhibit a similar percentage for “Describes me very well,” a greater percentage of Baby Boomer survey respondents chose “Does not describe me” as compared with “Describes me somewhat well.” Considering only the Millennial generation, the results show that rural Millennials value “local/authentic” less than urban Millennials, as a greater percentage of rural Millennials chose “Does not describe me” (FIGURE 58). In addition, slightly fewer rural Millennials chose “Describes me very well.”

Mobility Mindset of Millennials in Small Urban & Rural Areas Discussion
Western Transportation Institute Page 72
FIGURE 58: Urban vs. Rural Percentage of Millennial Survey Respondents,
Local/Authentic People & Places Considering that the Baby Boomer generation stood out when looking at the overall results, the results for the Baby Boomer generation were further considered, with regard to urban and rural respondents (FIGURE 59).

Mobility Mindset of Millennials in Small Urban & Rural Areas Discussion
Western Transportation Institute Page 73
FIGURE 59: Urban vs. Rural Percentage of Baby Boomer Survey Respondents,
Local/Authentic People & Places The results show that the Baby Boomers have exactly the opposite results when compared with the Millennials. FIGURE 59 shows that rural Baby Boomers value local/authenticity more than urban Baby Boomers. In addition, urban Baby Boomers have a higher percentage of “Does not describe me” responses. Again, approximately seventy percent of the entire Baby Boomer sample was asked this question. Concern for the Environment 805 survey respondents were not asked this question due to time constraints. FIGURE 60 shows the percentage of survey respondents indicating “Describes me very well,” “Describes me somewhat well,” “Does not describe me” for the statement “I care about the environment.”

Mobility Mindset of Millennials in Small Urban & Rural Areas Discussion
Western Transportation Institute Page 74
FIGURE 60: Percentage of Survey Respondents Across Generations, Concern for the
Environment FIGURE 60 shows that overall, Millennials are more likely to indicate “Describes me very well,” with the percentage decreasing with each successive generation. The opposite is true for those who said, “Does not describe me.” Considering only the Millennial generation, the results are consistent across all response categories (FIGURE 61). Therefore, there appears to be no difference between urban and rural Millennials in their value of the environment.

Mobility Mindset of Millennials in Small Urban & Rural Areas Discussion
Western Transportation Institute Page 75
FIGURE 61: Urban vs. Rural Percentage of Millennial Survey Respondents, Concern for
the Environment As a whole, there was little difference observed when comparing urban and rural Millennials who were asked these level of agreement questions. For the questions about 1) new and different, 2) quality versus price, 3) new technology, and 4) valuation of environment, Millennials reported a greater level of importance with each generation successively valuing the question at hand at a lower level. Different patterns were seen for 1) view of how sociable one is, 2) valuation of independence, and 3) valuation of local/authenticity. The literature has called the Millennial generation the “social generation” (The Nielsen Company, 2014). The results from this study do not seem to indicate that Millennials view themselves as more social than the other generations. They also do not appear to view themselves as independent as reported (Twenge J. M., 2006). Finally, they did not seem to report valuing local/authentic experiences significantly differently than other generations.
Question 49 – Household Internet Question 49 asked, “Do you have internet available in your household?” This question was posed to respondents as the internet has become a primary means with which state agencies disseminate travel information. Survey responses were obtained by both online and telephone, therefore, respondents could still participate in the survey via telephone, or they could potentially provide a survey response as an online respondent if they used another source of internet, such as the local library.

Mobility Mindset of Millennials in Small Urban & Rural Areas Discussion
Western Transportation Institute Page 76
Millennials The majority of Millennial respondents, an average of 94%, have household internet access. Respondents from urban areas reported a higher likelihood of having internet at home (TABLE 12).
TABLE 12: Millennial Survey Respondents, Household Internet
Big, Dense City
Big-City Suburb
Lower-Density
City
Suburb of Lower-
Density City
Small City
Small Tow
n
Outlying Rural
Area
Yes 76 198 126 139 272 327 288 3 1429No 4 7 5 3 14 10 26 1 70
No Response 3 0 0 1 1 3 3 5 16
TOTAL 83 205 131 143 287 340 317 9 1515
Urban Rural
Internet
No Response
TOTAL
The availability of internet at one’s house was consistent across the states, as shown in FIGURE 62. In almost all categories, about 90% or more of survey respondents indicated that they have household internet. The one anomaly was Wisconsin survey respondents in the “Big, Dense City” category, in which less than 80% of respondents reported having household internet access. It is unclear why this is the case. One potential explanation was that these survey respondents may be students who have access to internet via their educational institution.

Mobility Mindset of Millennials in Small Urban & Rural Areas Discussion
Western Transportation Institute Page 77
FIGURE 62: Availability of Household Internet by Area Type and State for Millennials
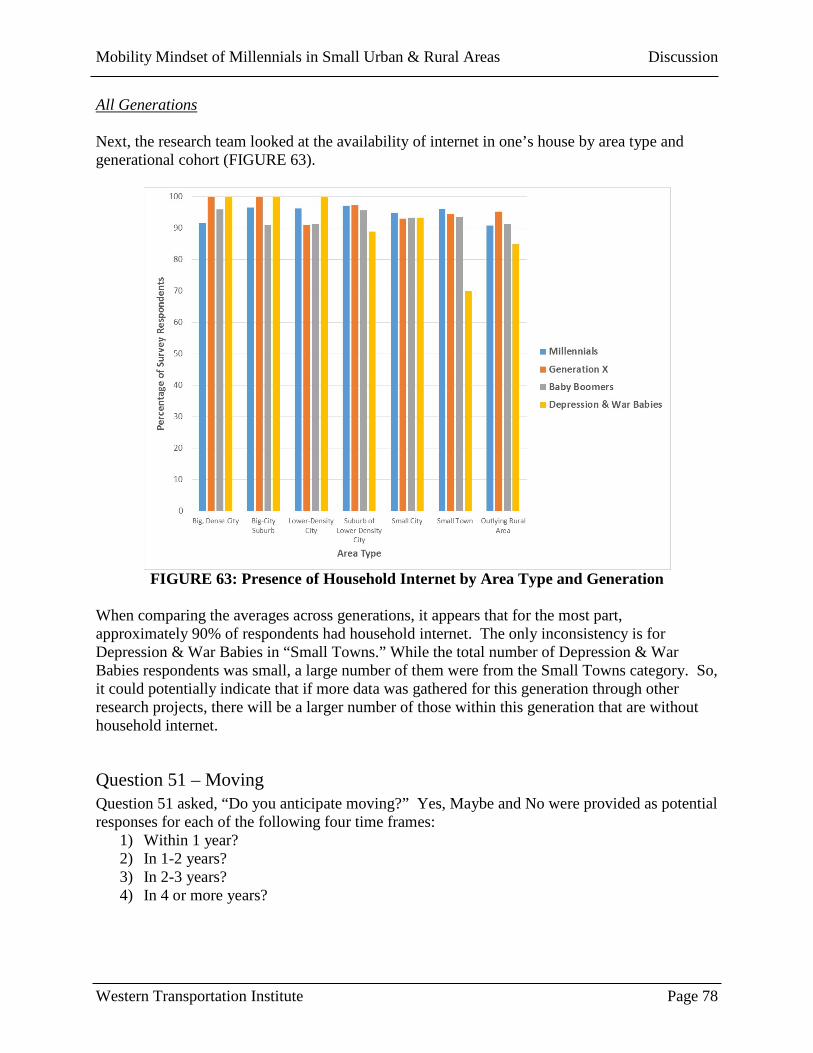
Mobility Mindset of Millennials in Small Urban & Rural Areas Discussion
Western Transportation Institute Page 78
All Generations Next, the research team looked at the availability of internet in one’s house by area type and generational cohort (FIGURE 63).
FIGURE 63: Presence of Household Internet by Area Type and Generation
When comparing the averages across generations, it appears that for the most part, approximately 90% of respondents had household internet. The only inconsistency is for Depression & War Babies in “Small Towns.” While the total number of Depression & War Babies respondents was small, a large number of them were from the Small Towns category. So, it could potentially indicate that if more data was gathered for this generation through other research projects, there will be a larger number of those within this generation that are without household internet.
Question 51 – Moving Question 51 asked, “Do you anticipate moving?” Yes, Maybe and No were provided as potential responses for each of the following four time frames:
1) Within 1 year? 2) In 1-2 years? 3) In 2-3 years? 4) In 4 or more years?

Mobility Mindset of Millennials in Small Urban & Rural Areas Discussion
Western Transportation Institute Page 79
Due to time limitations for phone surveys, not all survey respondents were asked about their expectation for moving. Therefore, the discussion below only draws on the information from survey respondents who provided a response to the question. Within 1 Year Millennials in urban areas indicated a greater likelihood of moving as compared with Millennials in rural areas (TABLE 13). In addition, Millennials were more likely to indicate that they were planning on moving within a year as compared to Generation X. However, the Millennial generation and Generation X had similar percentages of survey respondents indicating that they were planning on moving within a year as compared to the Baby Boomer and Depression & War Babies generations. TABLE 13: Urban vs. Rural Percentage of Survey Respondents Moving Within 1 Year, By
Generation Generation Urban RuralMillennial 27 21Generation X 17 12Baby Boomers 4 4Depression & War Babies 6 3
TABLE 13 shows that the respondents from urban areas are more likely to consider moving as compared to those survey respondents in rural areas, across almost all generations, with the Baby Boomers being the exception. While it could just indicate that those in urban areas are moving to other residences in urban areas, it is also possible that some urban Millennials may be considering moving to less urban areas in the near future. 1-2 Years Fewer Millennials expect to move within 1 to 2 years as compared to within the year (TABLE 14 vs. TABLE 13). This would reflect their interest in moving to a location after school or maybe for a new work opportunity with the hope of then being able to remain at that location. Interestingly, the responses for this time frame had a greater percentage of rural Millennials when compared with urban Millennials indicating that they anticipate moving (TABLE 14). TABLE 14: Urban vs. Rural Percentage of Survey Respondents Moving in 1 to 2 Years, By
Generation Generation Urban RuralMillennial 20 23Generation X 15 6Baby Boomers 5 2Depression & War Babies 10 4
However, as seen for the more immediate future (within 1 year), Millennials still have the greatest percentage of survey respondents who anticipate moving.

Mobility Mindset of Millennials in Small Urban & Rural Areas Discussion
Western Transportation Institute Page 80
2-3 Years Within the timeframe of two to three years, urban survey respondents reported a greater expectation of moving across all generations, with the exception of the Depression & War Baby survey respondents (TABLE 15). However, the percentages within each generation were relatively similar, with the exception of Generation X.
TABLE 15: Urban vs. Rural Percentage of Survey Respondents Moving 2 to 3 Years By Generation
Generation Urban RuralMillennial 21 20Generation X 16 9Baby Boomers 3 2Depression & War Babies 3 4
4 or More Years For the Four or More Years category, Generation X showed the biggest difference between responses from urban and rural respondents. The Millennial and Baby Boomer generations, had close or exactly the same percentage of survey respondents in the urban and rural categories indicating that they anticipate moving in 4 or more years.
TABLE 16: Urban vs. Rural Percentage of Survey Respondents Moving 4 or More Years By Generation
Generation Urban RuralMillennial 28 27Generation X 20 10Baby Boomers 7 7Depression & War Babies 0 7
Moving Summary For the first three categories (within 1 year, 1 to 2 years, 2 to 3 years), approximately 20% of both urban and rural Millennials indicated that they anticipated moving (with the exception of urban Millennials within a 1 year, which was slightly greater than the others). This percentage jumped to just under 30% when asked about a longer time frame, 4 years or more. This time frame was presented as a response option in order to compare it with a 3 to 4 year time frame, because many students often take 4 years to complete their education. Generation X showed similar results. For the first three moving categories, about 16% of respondents in urban areas and 9% in rural areas on average indicated that they anticipated moving. For the long-term category, a 4% increase was seen for urban Generation X survey respondents, as compared with only a 1% increase for rural Generation X survey respondents.
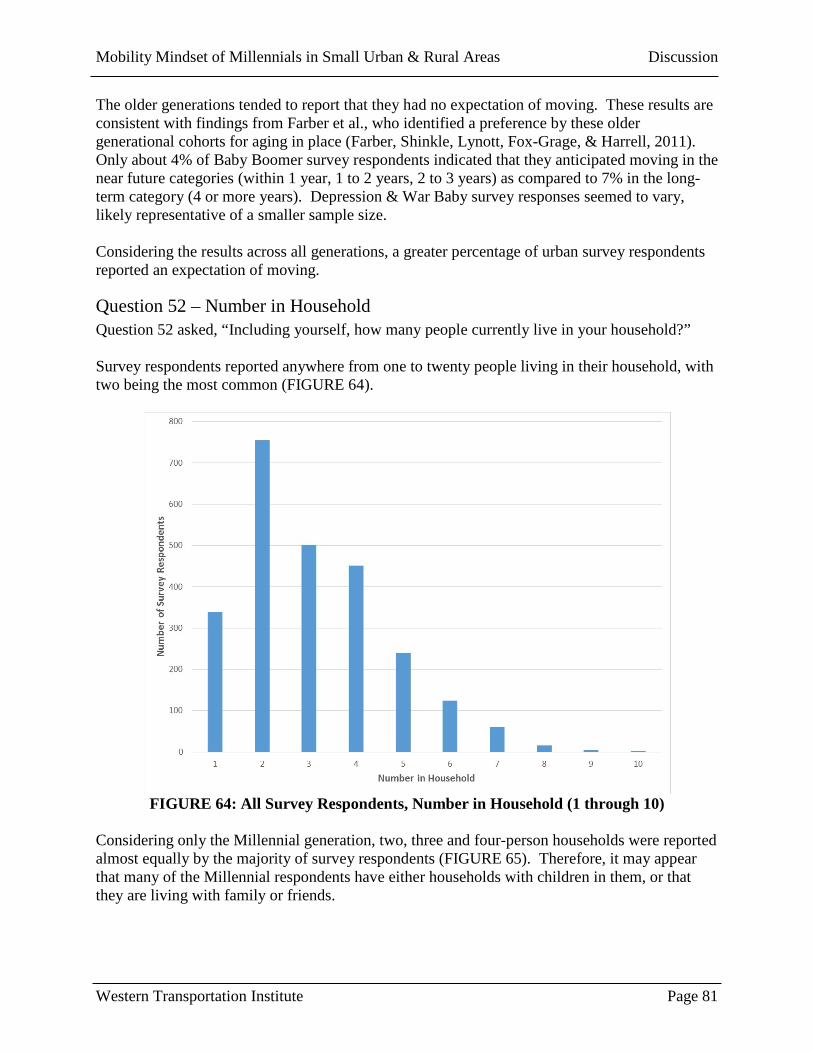
Mobility Mindset of Millennials in Small Urban & Rural Areas Discussion
Western Transportation Institute Page 81
The older generations tended to report that they had no expectation of moving. These results are consistent with findings from Farber et al., who identified a preference by these older generational cohorts for aging in place (Farber, Shinkle, Lynott, Fox-Grage, & Harrell, 2011). Only about 4% of Baby Boomer survey respondents indicated that they anticipated moving in the near future categories (within 1 year, 1 to 2 years, 2 to 3 years) as compared to 7% in the long-term category (4 or more years). Depression & War Baby survey responses seemed to vary, likely representative of a smaller sample size. Considering the results across all generations, a greater percentage of urban survey respondents reported an expectation of moving.
Question 52 – Number in Household Question 52 asked, “Including yourself, how many people currently live in your household?” Survey respondents reported anywhere from one to twenty people living in their household, with two being the most common (FIGURE 64).
FIGURE 64: All Survey Respondents, Number in Household (1 through 10)
Considering only the Millennial generation, two, three and four-person households were reported almost equally by the majority of survey respondents (FIGURE 65). Therefore, it may appear that many of the Millennial respondents have either households with children in them, or that they are living with family or friends.

Mobility Mindset of Millennials in Small Urban & Rural Areas Discussion
Western Transportation Institute Page 82
FIGURE 65: Millennial Survey Respondents, Number in Household (1 through 10)
Question 53 – Children in Household Question 53 asked, “How many children under the age of 18 live in your household?” FIGURE 66 shows the percentage of Millennial survey respondents indicating that they do not have children under the age of 18 living in their household.

Mobility Mindset of Millennials in Small Urban & Rural Areas Discussion
Western Transportation Institute Page 83
FIGURE 66: Millennials without Children by Area Type
Not surprisingly, Millennials that live in large, urban areas have the largest percentage of households without children 18 years old or younger. In addition, rural areas seem to have a slightly lower percentage of survey respondents who indicate that their household does not have children under the age of 18. The average across all area types is just over 50%.
Question 54 – Living Situation Question 54 asked, “Which of the following best describes your current living situation? Five potential responses were provided to a survey respondent:
1) Married and living with my spouse, 2) Living with a significant other or partner, 3) Living with parents or other family members, 4) Living with roommates or friends, and 5) Living alone.
This section first shows results for the Millennial generation. Subsequently, the Millennial generation is compared with three other generations.

Mobility Mindset of Millennials in Small Urban & Rural Areas Discussion
Western Transportation Institute Page 84
Millennials Almost forty percent of Millennial survey respondents indicated that they were married (FIGURE 67). Considering that a lot of the literature reports that Millennials are marrying later ((Martin, 2012) and (The Council of Economic Advisers, 2014)), the researchers and stakeholders were surprised by the percentage of Millennials who reported being married.
FIGURE 67: Living Situation for Millennial Survey Respondents
A significant percentage of Millennials (nearly 30%) also reported living with parents or family. When comparing the living situation of urban vs. rural Millennials, the results are fairly consistent, except for the category of “Living with Roommates.” There is a larger percentage of survey respondents from urban areas who indicated that they were living with roommates as compared to rural areas.

Mobility Mindset of Millennials in Small Urban & Rural Areas Discussion
Western Transportation Institute Page 85
FIGURE 68: Urban vs. Rural Living Situation for Millennial Survey Respondents
Generation Comparison Researchers also compared the living arrangements of the Millennial generation to those of previous generations (FIGURE 69). (Note: There are only 133 observations for the Silent Generation as compared with 1515, 385 and 475 for the Millennial, Generation X, and Baby Boomer generations, although the results are consistent with expectations.)

Mobility Mindset of Millennials in Small Urban & Rural Areas Discussion
Western Transportation Institute Page 86
FIGURE 69: Living Situation Across Generations
Not surprisingly, and as reported in many of the literature review sources, there is a significantly smaller percentage of Millennial survey respondents who indicated that they were married when compared with the other generations. However, some of this could be attributed to where Millennial survey respondents are in their “life cycle.” Also consistent with the literature (Nielsen, 2014), there is a spike for the Millennial generation survey respondents who are living with their parents or family, and also for those who are living with roommates. One other interesting thing to note is for the Depression & War Baby generation, a large percentage of respondents reported living alone. Considering that mobility may be limited for this generational cohort, which may also limit social interaction, there is a need to ensure that transportation options are available to this generational cohort to enable them to live life to the fullest.
Mobility Mindset of Millennials in Small Urban & Rural Areas Conclusions
Western Transportation Institute Page 87
LIFESTYLE QUESTION CONCLUSIONS This section presents a summary of the responses to the survey questions regarding lifestyle perspectives.
Approximately a quarter of the Millennial survey respondents indicated that they were presently a student. Just under sixty percent of all Millennial survey respondents were either in school or they had an Associate’s Degree or higher. A greater percentage of urban Millennials were found to be students than rural Millennials, hinting that there is greater accessibility to education for those Millennials residing in urban areas.
Both rural Millennials and rural Generation X survey respondents were found to make use of online courses more often than their urban counterparts. In addition, based on the number of days that they traveled to school, it would appear that there are more full-time Millennial students as compared with Generation X.
The majority of Millennial student survey respondents indicated that they traveled less than 5 miles to school. In contrast, the majority of Generation X survey respondents who indicated that they were students reported traveling between 10 and 15 miles to school. This could reflect either Generation X’s current stage in life (they are more likely to be raising children) or it could reflect where they chose to live (they may live in the suburbs, which are further from education centers).
Millennial survey respondents reported the highest level of unemployment as compared with the other generations. However, it is interesting to note that the greater percentages were in “Big, Dense Cities” and the lowest were in “Outlying Rural Areas.” Some of those in “Big, Dense Cities” may presently be students. The older generations (Baby Boomers and Depression & War Baby generations) reported higher levels of retirement when compared with the younger generations (Millennials and Generation X generations). In addition, the younger generations had a larger percentage of survey respondents reporting that they were a stay-at-home parent. While urban and rural Millennial survey respondents reported consistent levels of unemployment, a higher percentage of urban Millennial survey respondents reported being employed (the difference between the latter is likely accounted for by other employment categories, like stay-at-home parent). Therefore, urban Millennials likely have more opportunities for employment as compared with their rural counterparts. It may also be that more Millennials living in an urban area may need to work as a result of the higher cost of living typical in large cities.
When asked about the number of jobs held, it would appear that there is a slightly greater number of rural Millennials who hold more than one job. This could reflect that more jobs in rural environments pay less, thereby possibly providing incentive or the need for a person living in a rural environment to take on more than one job. There may be fewer “good paying” jobs in these environments, which make them sought after. In contrast, those jobs available in urban environments may be better paying, but the cost of living may also be greater.
With regard to social media, the type reported as being “Frequently” used by the greatest percentage of survey respondents was Facebook. Generation X and the Millennial generation reported greater use of social media as compared with the Baby Boomer generation, with Millennials typically reporting that they used social media the most. In addition, generally, urban survey respondents reported using social media more than rural survey respondents.

Mobility Mindset of Millennials in Small Urban & Rural Areas Conclusions
Western Transportation Institute Page 88
Millennials and Generation X indicated a greater preference to stay connected as compared with the Baby Boomer generation. It was interesting that a slightly greater percentage of Generation X survey respondents indicated a need to be connected as compared with Millennials. This could reflect either their ability to do so based on likely more financial resources, or it could reflect the demands of work or a family. In addition, urban Millennials as compared with rural Millennials showed a stronger preference to stay connected.
Millennials followed by Generation X and then the Baby Boomers show a greater consideration for the influence of cost on the way in which they travel. In addition, urban Millennials reported putting a higher valuation on the cost as compared with their rural counterparts.
Generation X reported a slightly greater preference for shopping online as compared with Millennials, although both of the younger generations reported more of an interest when compared with the Baby Boomers. This likely reflects more of an interest by the younger generation for digital offerings and also likely reflects that Generation X probably has more “discretionary” income when compared with Millennials.
When survey respondents were asked whether or not they felt that their environment was walkable, Millennials, followed by Generation X and then the Baby Boomer generation indicated decreasing levels of support regarding how walkable their environment was. The responses from the Baby Boomer generation indicated that they felt that their environment was not very walkable. The question then is: are Millennials moving to locations where the environment is more walkable? When looking only at the Millennial survey respondents, urban, as compared with rural Millennials showed a higher level of support when reporting how walkable their neighborhood is. Therefore, similar to when asked about transportation choices, it seems that Millennials may be moving to urban areas because they provide more walkable environments. In the Tech Memo on transportation, Millennials showed a keen interest for being able to walk in their living environments.
The majority of survey respondents who reported households without vehicles were in large urban areas. This result reflects either the high cost of vehicle ownership in these locations or the availability of several modes of transportation, thereby negating the need to own a vehicle.
When asked about vehicle ownership, the majority of survey respondents indicated that they owned a vehicle. Of those who did not currently own a vehicle, Millennials had the smallest representation when comparing generations among those who did not currently own a vehicle and were not planning on purchasing one. In contrast, they had a greater representation for the category that indicated that they were planning on purchasing a vehicle in the next year or two. Therefore, this would imply that a vehicle is a very desirable mode of transportation, but that many Millennials cannot currently afford one. In addition, Millennials in rural areas seemed to have a greater interest in owning or leasing a vehicle in the future as compared with their urban counterparts.
More than 90% of survey respondents reported having household internet. However, there were a few anomalies. One in particular pertained to Millennials in “Big, Dense Cities” in Wisconsin. These survey respondents reported having household internet significantly less often (just under 80%) than all other categories.
Overall, Millennials reported an expectation for moving more than the other generations. In addition, interestingly enough, urban respondents seemed to indicate that they anticipated
Mobility Mindset of Millennials in Small Urban & Rural Areas Conclusions
Western Transportation Institute Page 89
moving more so than rural survey respondents. The latter could reflect that many urban survey respondents are renters, and at the end of a lease, the respondents choose to move. Does this mean that rural respondents are “stuck,” or do they like their lifestyles in that they do not have an interest in moving? Are the survey respondents in urban environments planning to move only to other urban environments? Or, are they considering moving back to more rural or suburban environments? Some of these questions could be answered by conducting focus groups with candidates fitting the characteristics for which more questions remain.
When looking at the overall sample, the majority of survey respondents indicated that there were living in households with two people. However, when looking only at the Millennial sample, households with 2, 3 and 4 members were almost equally as common. In the subsequent question, there seems to be a slightly greater percentage of urban Millennials who reported households without children as compared with their rural counterparts, which might imply that more Millennials are living with friends or family. This seems to align with the responses by Millennials for their living situation response, as about 50% of the entire sample reported either 1) living with a significant other or partner, 2) living with parents or family, or 3) living with roommates.

Mobility Mindset of Millennials in Small Urban & Rural Areas References
Western Transportation Institute Page 90
REFERENCES Breakaway Research Group. (2015). U.S. Bicycling Participation Benchmarking Study Report.
PeopleForBikes. Farber, N., Shinkle, D., Lynott, J., Fox-Grage, W., & Harrell, R. (2011). Aging in Place: A State
Survey of Livability Policies and Practices. Washington, D.C.: AARP. Howden, L. M. (2011, May). Age and Sex Composition: 2010. Retrieved June 30, 2016, from
http://www.census.gov/prod/cen2010/briefs/c2010br-03.pdf Lachman, L. M., & Brett, D. L. (2011). Generation Y: America's New Housing Wave.
Washington, D.C.: Urban Land Institute. Martin, J. (2012). Generation Y Urban Revolution. Southeastern Institute of Research. Nielsen. (2014, March 4). Millennials Prefer Cities to Suburbs, Subways to Driveways.
Retrieved September 9, 2014, from Nielsen: http://www.nielsen.com/us/en/insights/news/2014/millennials-prefer-cities-to-suburbs-subways-to-driveways.html
Pew Research Center. (2010). Millennials, A Portrait of Generation Next, Confident. Connected. Open to Change. Retrieved February 7, 2015
Population Statistics and Demographics. (n.d.). Retrieved from Asian Nation: http://www.asian-nation.org/population.shtml
The Council of Economic Advisers. (2014). 15 Economic Facts about Millennials. The Nielsen Company. (2014). Millennials-Breaking the Myths. Twenge, J. M. (2006). Generation Me: Why Today's Young Americans Are More Confident,
Assertive, Entitled - and More Miserable Than Ever Before. New York: Simon & Schuster, Inc.
Twenge, J. M., Campbell, S. M., Hoffman, B. J., & Lance, C. E. (2010). Generational Differences in Work Values: Leisure and Extrinsic Values Increasing, Social and Intrinsic Values Decreasing. Journal of Management, 36(5).
U.S. Census Bureau. (2011, March 24). 2010 Census Shows America's Diversity. Retrieved from United States Census Bureau: https://www.census.gov/newsroom/releases/archives/2010_census/cb11-cn125.html
United States Census Bureau. (n.d.). Quick Facts United States. Retrieved June 29, 2016, from U.S. Census Bureau: https://www.census.gov/quickfacts/table/PST045215/00
Villwock-Witte, N. M. (2017). Transportation Preferences, Lifestyle Characteristics of Self-Identified Disabled Survey Respondents. Washington DC: Submitted to the 2017 Transportation Research Board Annual Meeting.
Villwock-Witte, N., & Clouser, K. (2016). Mobility Mindset of Millennials in Small Urban and Rural Areas: Technical Memorandum, Survey Findings - Demographics. Bozeman: Western Transportation Institute at Montana State University.
Zhou, Y., & Wang, X. (2014). Explore the relationship between online shopping and shopping trips: An analysis with the 2009 NHTS data. Transportation Research Part A, 70, 1-9.