Embed Size (px)
Citation preview
A technical memorandum to
Mobility Measurement in Urban Transportation (MMUT)
FHWA Pooled Fund Study
Submitted by the
TEXAS A&M TRANSPORTATION INSTITUTE
Author:
Gretchen Stoeltje
December 2016
TECHNICAL MEMORANDUM
Practices for Prioritizing Operational Improvements with Capacity Projects
Task 4 ‐ Synthesis Development (Synthesis #1 of 3)
(FY 2017)

2
[This page intentionally left blank.]
3
EXECUTIVE SUMMARY
In an era of constrained transportation funding sources, population growth, and environmental
fragility, transportation providers are looking at ways of meeting transportation demand other
than by expanding roadway capacity. One such area of focus is operational improvements,
projects that can help to maximize the performance of the existing transportation system (1).
This technical memorandum discusses the methods, tools, formulas, or policies that some
practitioners use to allow operational improvements to compete with capacity and other
projects in the project prioritization and selection process.
KEY POINTS
The following are the key highlights of this synthesis:
Developing a regional vision and a set of goals can help align transportation projects with
overall regional development and guide the project selection process.
Scoring projects according to a shared set of regionally defined performance measures can
help to quantify the value of projects and provide an objective system of comparison.
Performance measures that can help decision makers weigh operational improvement
projects against capacity expansion projects include:
o Return on investment.
o Geographic distribution of benefits throughout a region.
Tools that visualize the performance measurement and prioritization process can provide
transparency of the process and accessibility to users.
INTRODUCTION
According to the Federal Highway Administration, transportation planning has traditionally not
incorporated system management and operations solutions, even though those solutions
address at least 60 percent of the causes of roadway congestion. Inadequate capacity is only
the cause of 40 percent of congestion. Traffic incidents, for instance, are responsible for
25 percent of congestion. Implementing more efficient incident clearance practices could have
a dramatic effect on congestion. Increasing management and operational improvement
strategies could also result in (1):
Safer travel: Freeway ramp metering reduces crashes by 15–50 percent.
More free time: Traffic signal retiming decreases delay on roads by 13–94 percent.
Transit signal priority reduces transit delay by 30–40 percent.
Cleaner air and less wasted fuel: Georgia’s traffic incident management program
reduced annual fuel consumption by 6.83 million gallons/year.
4
Cost‐effective solutions: Typical benefit‐cost ratios for traffic signal
retiming/optimization are 17:1 to 62:1, for work zone management systems benefit‐cost
ratios are 2:1 to 42:1, and for bus rapid transit benefit‐cost ratios are 2:1 to 10:1.
Improved Livability: Management and operations strategies such as enhanced transit
service, traveler information, and traffic incident management promote safe, reliable,
economical, and balanced transportation choices while addressing regional mobility
needs.
OPERATIONAL IMPROVEMENT STRATEGIES
Though the agency experiences and processes reviewed for this memorandum do not name or
group these strategies in exactly the same way, the following is a representative list of
strategies in use today by the entities reviewed:
Access management.
Advanced parking management systems.
Congestion pricing.
Dynamic shoulder lanes.
Freeway and intersection geometric design changes.
Freeway entrance ramp metering.
Freight management.
Hard shoulder running.
Incident management.
Integrated Corridor Management.
Lane specific signaling.
Managed Lanes.
Reversible lanes.
Road weather management.
Short auxiliary lane additions.
Special event management.
Traffic Management Centers.
Traffic signal coordination.
Traffic signal modifications to ease merging and exiting traffic.
Transit signal priority.
Travel demand management.
Traveler information systems (variable message signs, dynamic signing, dynamic speed
signs).
Work zone management.
5
INCLUDING OPERATIONAL IMPROVEMENT STRATEGIES INTO PROJECT SELECTION AND
PRIORITIZATION PROCESSES
Different entities structure their processes differently according to the nature and character of
their respective regions. However, the reviewed entities do have in common a systematic
approach, typically beginning with a big picture, region‐wide, long‐term, and general vision that
includes more areas of public interest than transportation. That vision is usually supported by
more specific goals, and progress toward it measured by a set of performance measures
designed to embody the values of the regional goals. Transportation projects are categorized by
project type and evaluated against the performance measures. Once scored, projects are
ranked and assigned a score.
Where entities tend to differ in their processes is how they distinguish operational
improvement projects from other project types, and where they plug them into the evaluation
process. Below are four case studies describing the processes of the following transportation
agencies:
Metropolitan Council of the Twin Cities (Minneapolis, MN).
Puget Sound Regional Council (PSRC) (Seattle, WA).
Metropolitan Transportation Commission (San Francisco, CA).
San Diego Council of Governments (SANDAG) (San Diego, CA).
Case Study: Metropolitan Council of the Twin Cities (Minneapolis, MN)
Through the process of updating their 2030 Transportation Policy Plan, the Metropolitan
Council of the Twin Cities in Minnesota, the region’s metropolitan planning organization,
conducted a needs analysis on the region’s principal arterials and “A” minor arterials to
determine what would be necessary to accommodate the coming growth to the region.
The analysis produced a number of conclusions reflecting the reality that, using today’s design
assumptions for principal arterials, the region will never have the financial ability to meet the
projected transportation demand with major highway expansion projects. Instead, the region
should focus investment on lower‐cost/high‐benefit projects that provide alternatives to
congestion, rather than attempting to reduce it solely with new capacity projects (2).
These conclusions led to the development of a new project selection process that allows for the
programming of operational improvements and expansion projects. The process consists of
four different strategies, beginning with lower‐cost projects that preserve and improve existing
infrastructure, to high‐cost projects for expanding capacity. Programmers begin by matching
needs with active traffic management (ATM) solutions first, then move on in an iterative
fashion, through the other sets of solutions, typically reserving new capacity solutions, in
particular managed lane projects like MnPASS, for select corridors where there are significant
6
congestion and safety issues along with the need for transit advantages (3, 4). MnDOT’s four
different strategies follow:
1. Active Traffic Management. Operational improvements to help manage the effects of
congestion, including:
Variable message signs (traveler information systems).
Freeway ramp metering.
Dynamic signing.
Dynamic shoulder lanes.
Reversible lanes.
Dynamic speed signs.
Lane specific signaling.
2. Spot mobility improvements. Lower cost, high‐benefit projects that improve traffic flow and
provide bottleneck relief at spot locations. These projects include:
Freeway and intersection geometric design changes.
Short auxiliary lane additions.
Traffic signal modifications to ease merging and exiting traffic.
3. Priced managed lanes. Priced managed lane projects provide a predictable, congestion‐free
travel option for transit users, those who ride in carpools, or those who are willing to pay. In
the Twin Cities, this system is called MnPASS, which currently operates on I‐394 and I‐35W.
4. Strategic capacity enhancements.
New interchanges.
Non‐priced managed lanes.
Limited general‐purpose lanes that may be needed to address corridor congestion
and/or provide lane continuity for existing facility or to complete an unfinished segment
of the Metropolitan Highway System (4).
Case Study: The Puget Sound Regional Council (Seattle, WA)
The PSRC’s Vision 2040 plan is a strategy for accommodating the region’s expected growth by
2040, calling for an integrated, long‐range approach to maintaining a healthy region. Vision
2040 provides broad policy direction and includes a comprehensive growth strategy that
focuses on growth in metropolitan areas of the region. Transportation 2040 (T2040) is the
region’s long range transportation plan that supports the goals outlined in Vision 2040 and
provides guidance on implementation of the transportation policy component of VISION 2040.
Adopted in 2010 and updated in 2014, T2040 clarifies that transportation investment needs far
exceed current revenues. To address this situation, the plan provides a financial strategy and
also calls for a framework, Transportation 2040 Prioritization, to ensure the prioritization of
transportation projects that most effectively implement the policy direction included in VISION
7
2040. Transportation 2040 Prioritization was completed as a major component of the 2014
update and is now in use (5).
Having recently begun a number of large‐scale projects in the region, and recognizing the need
for lower‐cost solutions to manage system performance, PSRC expects to place more emphasis
on operational improvement projects that improve efficiency, rather than ones that expand
capacity. PSRC operational improvement strategies include:
1. Integrated Corridor Management.
2. Active Traffic Management (ATM) techniques such as hard shoulder running, adaptive
signal control, transit signal priority.
3. Traffic Management Centers.
4. Monitoring and detection devices such as closed circuit television cameras.
5. Traveler information services, including real time transit arrival information and remote
transit traveler support.
These operational strategies are folded into one of Transportation 2040 Prioritization’s four
categories of transportation investment types:
Regional system expansion.
Local projects.
Programmatic.
State of good repair.
Projects in the Regional System Expansion category include investments in highways, arterials,
transit, and bicycle/pedestrian facilities. Investments in transit and ferry capital costs fall into
this category as well. These projects, which consist of both capacity expansion and operational
improvement projects, are evaluated against nine prioritization measures developed in VISION
2040, and given a numerical score that reflects how well it supports the measures. Each
measure is worth a maximum of 10 points, meaning that the highest score a project can
achieve is 90 (6).
Once projects are scored, they are grouped into one of four categories of infrastructure type
and their scores ranked in a Scorecard Report. Both capacity expansion projects and
operational improvement projects are placed into these categories, which include:
Arterials.
Bicycle/pedestrian.
Highways.
Transit.
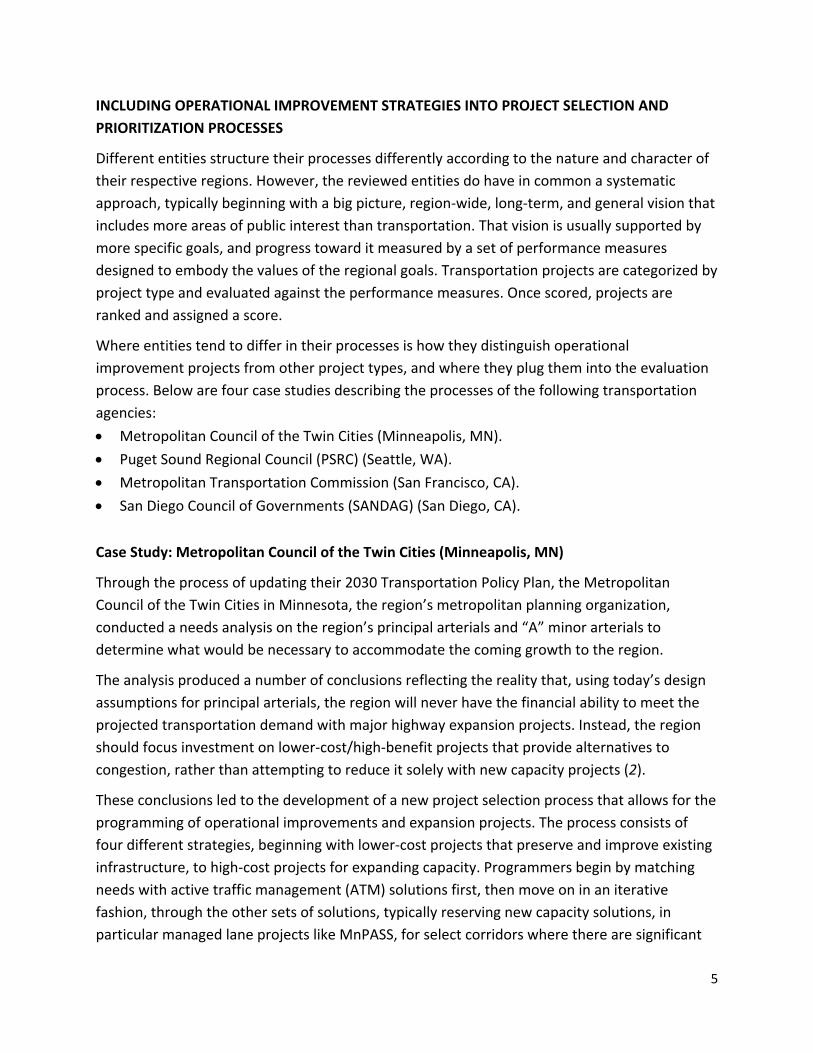
The scorecard report shows benefit scores for each of the nine measures, project costs, and
whether they are in the approved, candidate, or unprogrammed section of Transportation
2040. Regional System Expansion projects are also evaluated on the basis of the geographic

8
distribution of their costs and benefits throughout the region. See Figure 1 for an example
scorecard.
9
Figure 1: Scorecard from PSRC’s Transportation 2040 Prioritization Showing the Project Type, Location, Performance with Nine
Performance Measures, Overall Score, and Status (Planned or Not Programmed) for Projects in the Arterials Category (7).
10
Case Study: Metropolitan Transportation Commission (San Francisco, CA)
Plan Bay Area 2040 is the long‐range transportation plan of the Metropolitan Transportation
Commission (MTC), the Bay Area’s metropolitan planning organization. Slated for adoption in
2017, Plan Bay Area 2040 acknowledges that simply adding additional roadway capacity as a
solution to the region’s increased congestion is no longer an option as it may have been a few
decades ago, both because of the increased cost of capacity expansion projects and the aged
condition of the system. The plan therefore provides for a range of project types that include
expansion, efficiency, and state of good repair. Projects that are not yet fully funded and
competing for discretionary funds are grouped into six investment strategies, all of which are
evaluated by the same metrics (8).
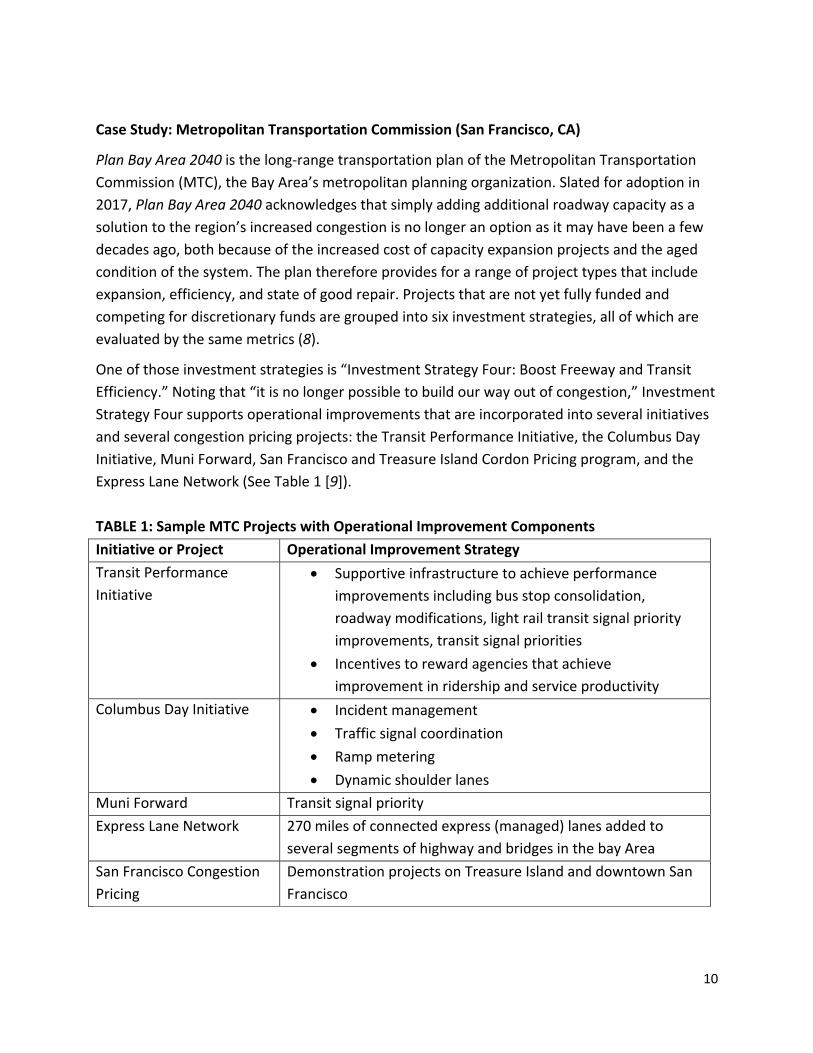
One of those investment strategies is “Investment Strategy Four: Boost Freeway and Transit
Efficiency.” Noting that “it is no longer possible to build our way out of congestion,” Investment
Strategy Four supports operational improvements that are incorporated into several initiatives
and several congestion pricing projects: the Transit Performance Initiative, the Columbus Day
Initiative, Muni Forward, San Francisco and Treasure Island Cordon Pricing program, and the
Express Lane Network (See Table 1 [9]).
TABLE 1: Sample MTC Projects with Operational Improvement Components
Initiative or Project Operational Improvement Strategy
Transit Performance
Initiative
Supportive infrastructure to achieve performance
improvements including bus stop consolidation,
roadway modifications, light rail transit signal priority
improvements, transit signal priorities
Incentives to reward agencies that achieve
improvement in ridership and service productivity
Columbus Day Initiative Incident management
Traffic signal coordination
Ramp metering
Dynamic shoulder lanes
Muni Forward Transit signal priority
Express Lane Network 270 miles of connected express (managed) lanes added to
several segments of highway and bridges in the bay Area
San Francisco Congestion
Pricing
Demonstration projects on Treasure Island and downtown San
Francisco

11
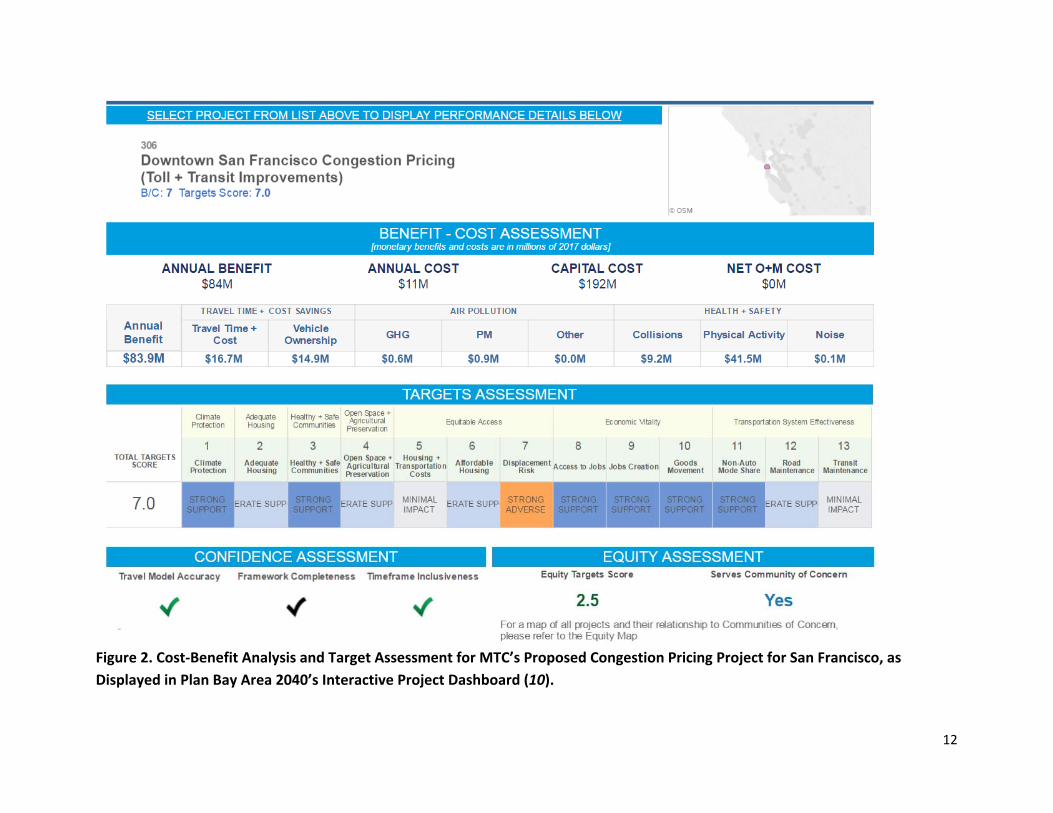
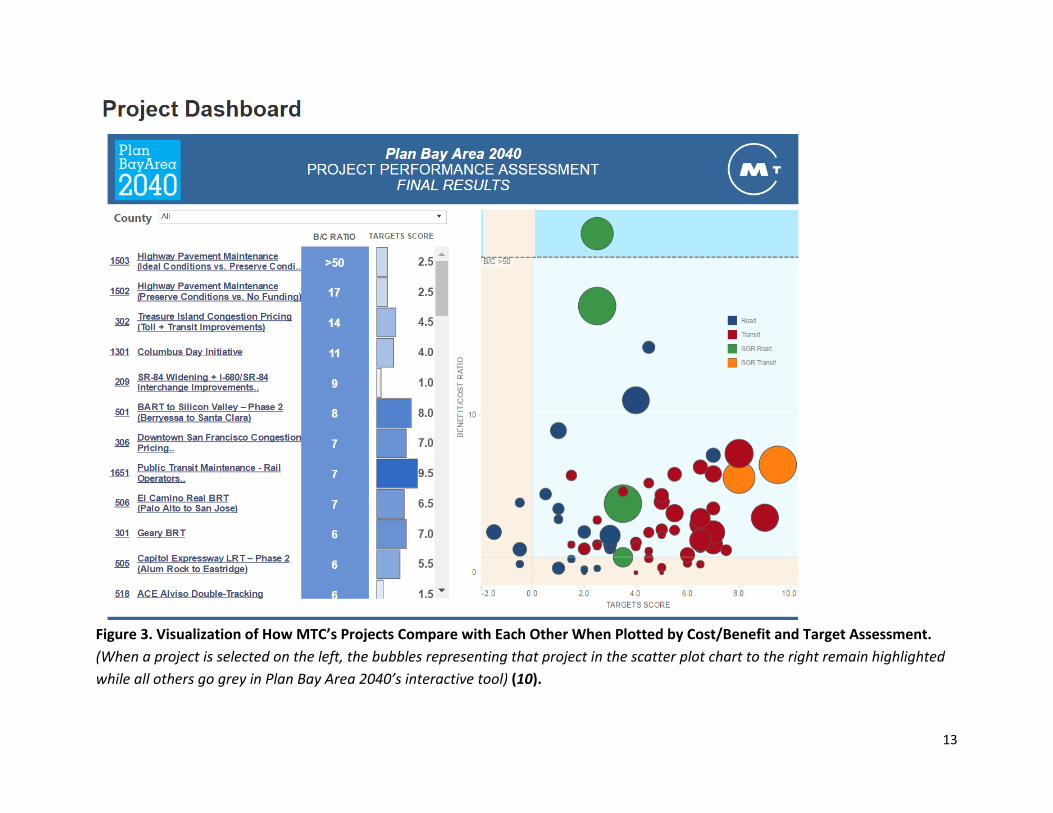
These projects, along with all other projects under review, are first put through a cost/benefit
analysis that evaluates the dollar value of a project. Next, each project is measured, on a 5
point scale of −1 to +1, against a set of 13 performance targets. Evaluated together, the cost
benefit value and the target score show the overall value of projects as measured against the
goals of Plan Bay Area 2040 (10). See Figures 2 and 3.
12
Figure 2. Cost‐Benefit Analysis and Target Assessment for MTC’s Proposed Congestion Pricing Project for San Francisco, as
Displayed in Plan Bay Area 2040’s Interactive Project Dashboard (10).
13
Figure 3. Visualization of How MTC’s Projects Compare with Each Other When Plotted by Cost/Benefit and Target Assessment.
(When a project is selected on the left, the bubbles representing that project in the scatter plot chart to the right remain highlighted
while all others go grey in Plan Bay Area 2040’s interactive tool) (10).
14
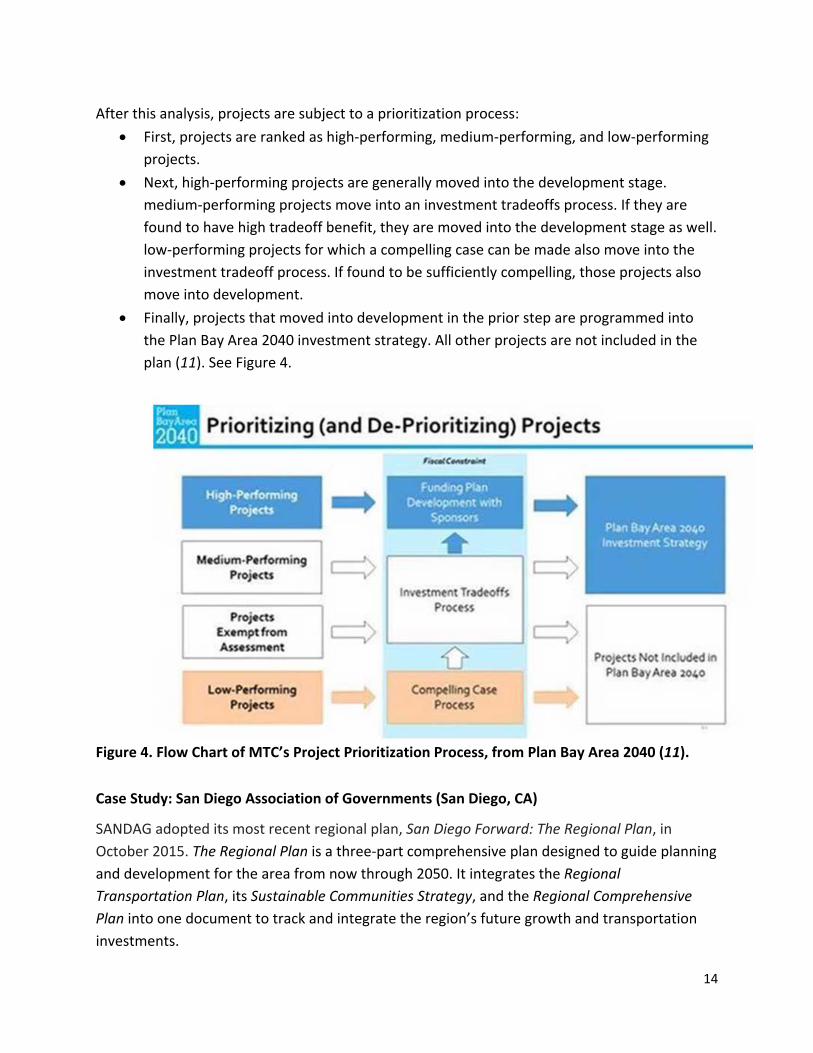
After this analysis, projects are subject to a prioritization process:
First, projects are ranked as high‐performing, medium‐performing, and low‐performing
projects.
Next, high‐performing projects are generally moved into the development stage.
medium‐performing projects move into an investment tradeoffs process. If they are
found to have high tradeoff benefit, they are moved into the development stage as well.
low‐performing projects for which a compelling case can be made also move into the
investment tradeoff process. If found to be sufficiently compelling, those projects also
move into development.
Finally, projects that moved into development in the prior step are programmed into
the Plan Bay Area 2040 investment strategy. All other projects are not included in the
plan (11). See Figure 4.
Figure 4. Flow Chart of MTC’s Project Prioritization Process, from Plan Bay Area 2040 (11).
Case Study: San Diego Association of Governments (San Diego, CA)
SANDAG adopted its most recent regional plan, San Diego Forward: The Regional Plan, in
October 2015. The Regional Plan is a three‐part comprehensive plan designed to guide planning
and development for the area from now through 2050. It integrates the Regional
Transportation Plan, its Sustainable Communities Strategy, and the Regional Comprehensive
Plan into one document to track and integrate the region’s future growth and transportation
investments.
15
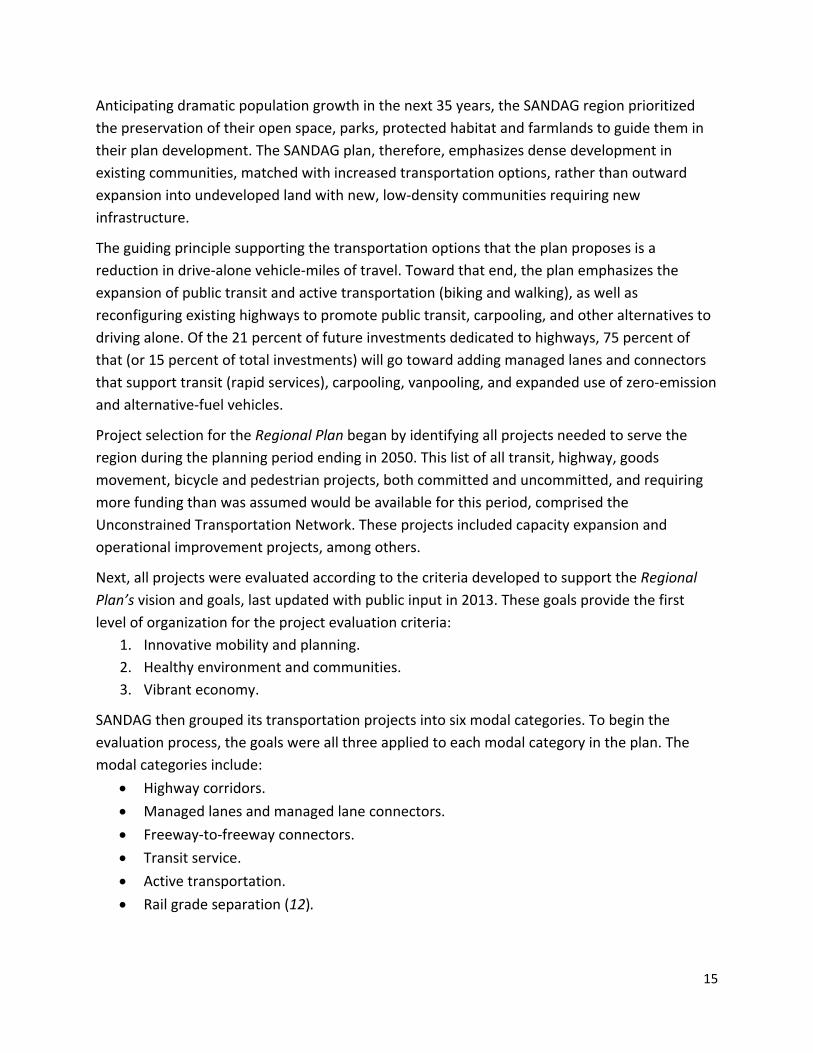
Anticipating dramatic population growth in the next 35 years, the SANDAG region prioritized
the preservation of their open space, parks, protected habitat and farmlands to guide them in
their plan development. The SANDAG plan, therefore, emphasizes dense development in
existing communities, matched with increased transportation options, rather than outward
expansion into undeveloped land with new, low‐density communities requiring new
infrastructure.
The guiding principle supporting the transportation options that the plan proposes is a
reduction in drive‐alone vehicle‐miles of travel. Toward that end, the plan emphasizes the
expansion of public transit and active transportation (biking and walking), as well as
reconfiguring existing highways to promote public transit, carpooling, and other alternatives to
driving alone. Of the 21 percent of future investments dedicated to highways, 75 percent of
that (or 15 percent of total investments) will go toward adding managed lanes and connectors
that support transit (rapid services), carpooling, vanpooling, and expanded use of zero‐emission
and alternative‐fuel vehicles.
Project selection for the Regional Plan began by identifying all projects needed to serve the
region during the planning period ending in 2050. This list of all transit, highway, goods
movement, bicycle and pedestrian projects, both committed and uncommitted, and requiring
more funding than was assumed would be available for this period, comprised the
Unconstrained Transportation Network. These projects included capacity expansion and
operational improvement projects, among others.
Next, all projects were evaluated according to the criteria developed to support the Regional
Plan’s vision and goals, last updated with public input in 2013. These goals provide the first
level of organization for the project evaluation criteria:
1. Innovative mobility and planning.
2. Healthy environment and communities.
3. Vibrant economy.
SANDAG then grouped its transportation projects into six modal categories. To begin the
evaluation process, the goals were all three applied to each modal category in the plan. The
modal categories include:
Highway corridors.
Managed lanes and managed lane connectors.
Freeway‐to‐freeway connectors.
Transit service.
Active transportation.
Rail grade separation (12).
16
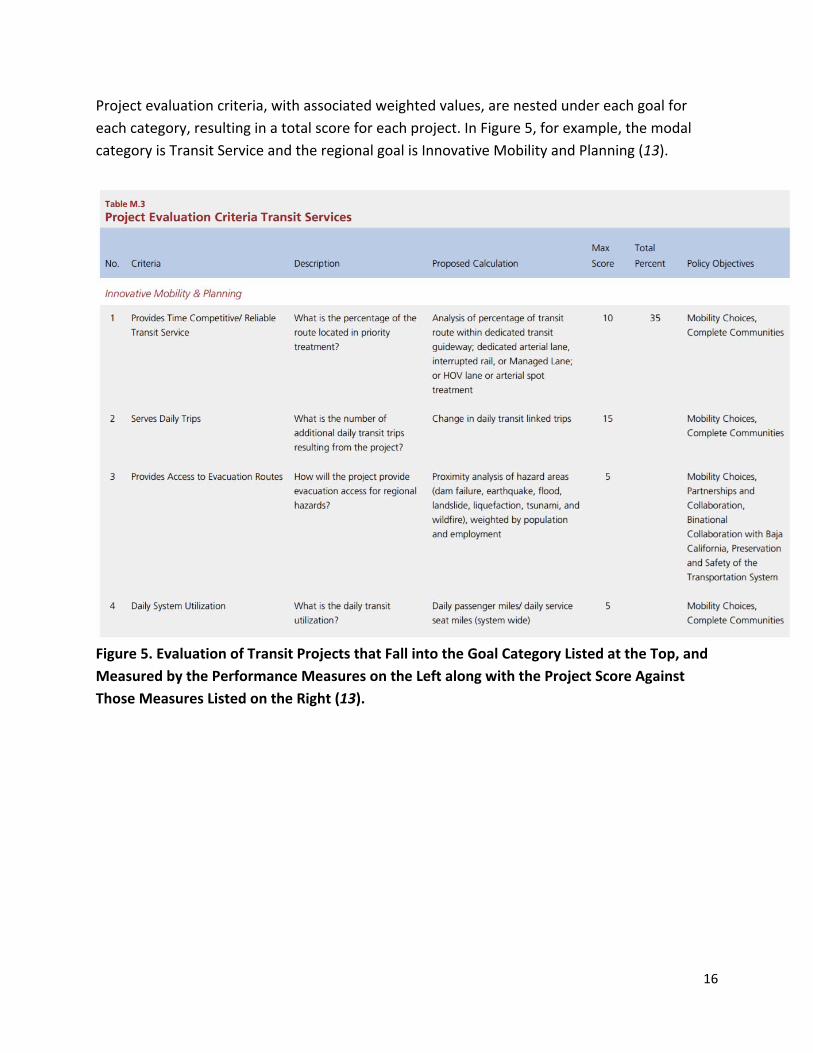
Project evaluation criteria, with associated weighted values, are nested under each goal for
each category, resulting in a total score for each project. In Figure 5, for example, the modal
category is Transit Service and the regional goal is Innovative Mobility and Planning (13).
Figure 5. Evaluation of Transit Projects that Fall into the Goal Category Listed at the Top, and
Measured by the Performance Measures on the Left along with the Project Score Against
Those Measures Listed on the Right (13).
17
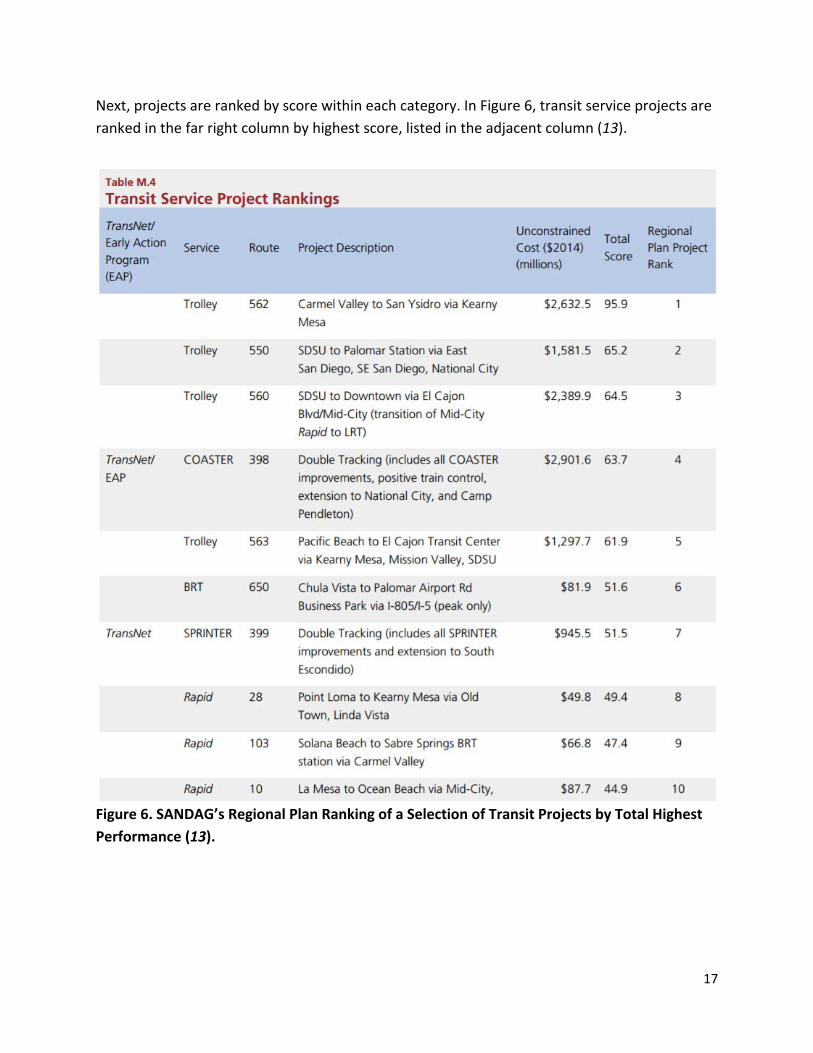
Next, projects are ranked by score within each category. In Figure 6, transit service projects are
ranked in the far right column by highest score, listed in the adjacent column (13).
Figure 6. SANDAG’s Regional Plan Ranking of a Selection of Transit Projects by Total Highest
Performance (13).
18
Highest ranking projects are then brought together in a series of network scenarios that could
be implemented with the projected available funding for the planning period. While not all
projects from the Unconstrained Transportation Network end up in the highest ranked
scenarios, SANDAG continues to pursue additional funding while focusing available funding on
priority projects.
Finally, all scenarios were subjected to a second set of performance measures, developed
through extensive public engagement processes, designed to assess how well the scenarios
support the region’s citizens by providing safe and healthy transportation systems. Through a
second public engagement period, a final or preferred scenario was assembled and accepted
(12).
CONCLUSIONS
A combination of solid cost/benefit analysis, performance measures defined at the regional
level and with public input, and transparency in reporting characterize programs that are
successful in incorporating operational improvement strategies into their transportation plans.
Strategies that support goals related to objectives besides traditional transportation goals, like
air quality or the preservation of open space, can quickly convey the value of an improvement
to a lay public. This is all the more true if those goals were developed with a high level of public
input, and if those strategies and their performance scores are made accessible to the public.
REFERENCES
1. USDOT, FHWA, “Getting the Most from Your Transportation System Investments: Operating
for Peak Performance,” http://ops.fhwa.dot.gov/publications/fhwahop10030/index.htm,
last visited 9/27/16.
2. Minnesota Department of Transportation/Metropolitan Council, “Principal Arterial Study
For the Twin Cities Metropolitan Area Summary and Conclusions,” Publication No. 35‐08‐
043, June 2008.
3. Metropolitan Council/Parsons Brinkerhoff, “Metropolitan Highway System Investment
Study Final Report,” September 2010.
4. Email from Paul Czech, Planning Director, System Planning, Minnesota Department of
Transportation, September 2016, on file with author.
5. Puget Sound Regional Council, “Transportation 2040 Update, Appendix P: Prioritization,”
May 29, 2014.
6. Interview with Gary Simonson, Associate Planner, Puget Sound Reginal Council, October
2016, on file with author.
19
7. Puget Sound Regional Council, “Transportation 2040 Update, Appendix P: Prioritization,
Attachment E Scorecard Report,”
http://www.psrc.org/assets/9403/PrioritizationScorecard20130807.pdf, last visited Nov. 14,
2016.
8. Metropolitan Transportation Commission/Association of Bay Area Governments, “Plan Bay
Area, Regional Transportation Plan and Sustainable Communities Strategy for the San
Francisco Bay Area 2013–2040,” adopted July 18, 2013,
http://mtc.ca.gov/sites/default/files/0‐Introduction.pdf, last visited Nov. 14, 2016.
9. Metropolitan Transportation Commission/Association of Bay Area Governments, “Plan Bay
Area, Regional Transportation Plan and Sustainable Communities Strategy for the San
Francisco Bay Area 2013–2040, Chapter 4: Investments” adopted July 18, 2013,
http://mtc.ca.gov/sites/default/files/4‐Investments.pdf, last visited Nov. 14, 2016.
10. Metropolitan Transportation Commission/Association of Bay Area Governments, “Plan Bay
Area, Regional Transportation Plan and Sustainable Communities Strategy for the San
Francisco Bay Area 2013–2040, interactive Performance Assessment Dashboard” adopted
July 18, 2013, http://data.mtc.ca.gov/performance/dashboard, last.
11. Email from Dave Vautin, Senior Planner/Analyst, Metropolitan Transportation Commission,
October 2016, on file with author.
12. San Diego Association of Governments, “San Diego Forward: The Regional Plan,” adopted
October 2015, http://www.sdforward.com/pdfs/RP_final/The%20Plan%20‐
%20combined.pdf.
13. San Diego Association of Governments, “San Diego Forward: The Regional Plan, Appendix
M,” adopted October 2015, http://www.sdforward.com/pdfs/RP_final/AppendixM‐
TransportationProjectEvaluationCriteriaandRankings.pdf.


![[Archived] Iowa ACTT - Maximizing Mobility · to the FHWA Division Office. Include details on the project corridor, timeline and goals. ... (Caltrans), gave a presentation on “Why](https://img.pdfslide.us/doc/110x75/5fd537a74298631c97279e45/archived-iowa-actt-maximizing-mobility-to-the-fhwa-division-office-include.jpg)