Embed Size (px)
Citation preview

2010 Annual Report
Mobility in Motion
A L E T T E R F R O M T H E C E O
Dear Fellow Shareholder,
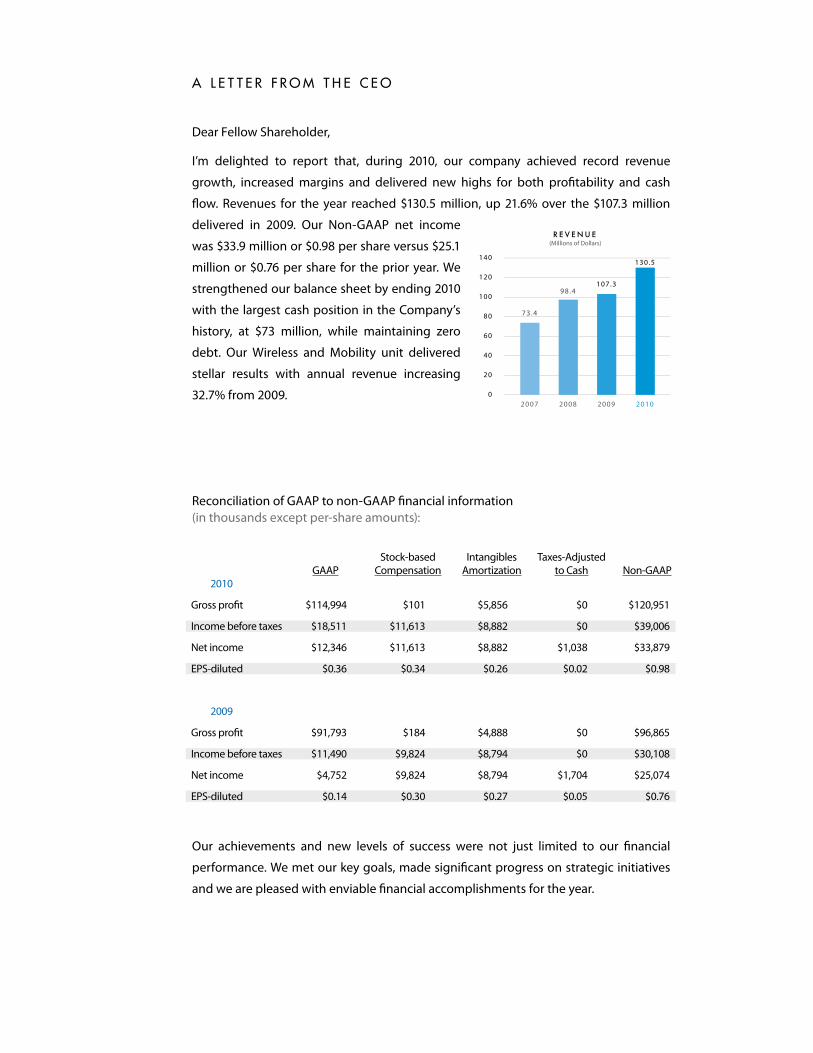
I’m delighted to report that, during 2010, our company achieved record revenue
growth, increased margins and delivered new highs for both profitability and cash
flow. Revenues for the year reached $130.5 million, up 21.6% over the $107.3 million
delivered in 2009. Our Non-GAAP net income
was $33.9 million or $0.98 per share versus $25.1
million or $0.76 per share for the prior year. We
strengthened our balance sheet by ending 2010
with the largest cash position in the Company’s
history, at $73 million, while maintaining zero
debt. Our Wireless and Mobility unit delivered
stellar results with annual revenue increasing
32.7% from 2009.
Reconciliation of GAAP to non-GAAP financial information (in thousands except per-share amounts):
Our achievements and new levels of success were not just limited to our financial
performance. We met our key goals, made significant progress on strategic initiatives
and we are pleased with enviable financial accomplishments for the year.
Stock-based Intangibles Taxes-Adjusted GAAP Compensation Amortization to Cash Non-GAAP 2010
Gross profit $114,994 $101 $5,856 $0 $120,951
Income before taxes $18,511 $11,613 $8,882 $0 $39,006
Net income $12,346 $11,613 $8,882 $1,038 $33,879
EPS-diluted $0.36 $0.34 $0.26 $0.02 $0.98
2009
Gross profit $91,793 $184 $4,888 $0 $96,865
Income before taxes $11,490 $9,824 $8,794 $0 $30,108
Net income $4,752 $9,824 $8,794 $1,704 $25,074
EPS-diluted $0.14 $0.30 $0.27 $0.05 $0.76

A W i R E L E s s i n d u s T R y i n T R A n s i T i O n
We serve a dynamic industry that is undergoing a number of significant transitions. Many mobile operators are actively rolling out higher-speed 4G services while grappling with some of the most exciting and breathtaking, fast-paced product and technology innovations the world has ever seen. New smartphones, tablet computers, machine-to-machine connectivity and an increasing number of connected consumer devices are driving demand for more bandwidth and mobile data services. The economic challenge of balancing network capacity with the demand for broadband data is impacting carriers and consumers alike. The introduction of new products and services and the need to support the mix of the old and the latest networks, combined with competitive pressures driving an accelerating need to get products to market faster, has created levels of complexity that are dramatically impacting our customers. We have the technology to reduce that complexity and help our customers better compete. New innovations to support better experiences, lower costs and faster time to market will drive our Company’s future success.
C A R v i n g A n E W PAT H
As the industry and technology evolves, so does our strategy. The market opportunity to support the proliferation of connected devices and the complex mesh of networks, service plans and disparate standards calls for transformative approaches. We are carving a new path in the field of connectivity software with our Secure On-Device API, or SODA™. We apply a standardized way of solving the complex problem of connecting dissimilar devices with a common approach. We help lower costs and increase velocity to market for new devices and services. Our Company is recognized as the leading provider of connectivity-related software and we are uniquely positioned to deliver this type of solution to better serve the industry. Our complete line of mobility and connectivity solutions continues to evolve and support our customers as they seek better ways to manage wireless modems, mobile hotspots and improve utilization of networks with seamless WiFi and mobile network handover. We are making smarter software, improving personalization through policy control and delivering a better-connected experience.
F O C u s i n g O n g L O b A L E x PA n s i O n
Over the past five years, Smith Micro has succeeded in becoming the clear market leader in North America with our core connectivity and mobility business. Our carrier customers in this geographic market were early to promote the value of 3G mobile broadband services and many are now leading the way into the 4G revolution. While we continue to cultivate relationships within our primary markets, we spent much of 2010 building a sales infrastructure and gearing up for the acquisition of new customers

in exciting markets outside of North America. Throughout Europe, Asia Pacific and Latin America, we have begun to develop relationships with tier-one mobile operators who see the value in our software platforms and solutions. They appreciate our demonstrated thought leadership and the expertise we’ve built while serving some of the world’s largest carriers. We are pleased to report that we are enjoying early successes in these new markets, as we are fortunate to call several large mobile service providers new Smith Micro customers. Moving forward, we are committed to making the continued investments needed to attract new business throughout the world and to turn Smith Micro into a truly global solutions provider.
2 011 A n d b E yO n d – P R i O R i T i z i n g O P P O R T u n i T i E s
Our accomplishments in 2010 were exceptional. The financial results were strong, the product innovation designed to spur on future success was outstanding, and the maturation and development of the team to lead us ahead has been remarkable. Our Intellectual Property portfolio and technology foundation is strong. The groundwork has been laid to meet the challenges and capitalize on opportunities to serve this industry in transition. There will be much work ahead to deliver solutions that help our customers with their evolving networks and business models. We have demonstrated that adapting to change and supporting our customers through transitions in their businesses is embedded in our DNA and critical to our ability to grow. We expect the adoption of some of our new product strategies to coincide with our customers’ rollout of 4G networks, such as LTE (Long Term Evolution) and WiMAX. While our market and our company are in transition, I remain confident and excited about Smith Micro in 2011.
I look forward to serving our customers and the shareholders and appreciate the continued confidence you’ve shown in us.
Best Regards,
William W. Smith, Jr. Chairman, President and Chief Executive Officer

B O A R D O F D I R E C T O R S
William W. Smith, Jr.
Chairman, President &
Chief Executive Officer
Thomas G. Campbell
Director
Samuel Gulko
Director
Ted L. Hoffman
Director
William C. Keiper
Director
James Straight
Director
O F F I C E R S & S E N I O R M A N A G E M E N T
Von Cameron
Executive Vice President,
Worldwide Sales
Rick Carpenter
Vice President & General Manager,
Wireless & Mobility
Robert E. Elliott
Chief Marketing Officer
Chris Lippincott
Senior Vice President,
Global Operations
Thomas P. Matthews
Chief Strategy Officer &
Senior Vice President,
Corporate Development
Andrew C. Schmidt
Vice President &
Chief Financial Officer
David P. Sperling
Chief Technology Officer
Steven M. Yasbek
Chief Accounting Officer
C O N TA C T I N F O R M AT I O N
Corporate Headquarters
51 Columbia
Aliso Viejo, CA 92656
(949) 362-5800
Transfer Agent & Registrar
Mellon Investor Services LLC
480 Washington Blvd
Jersey City, NJ 07310
(800) 356-2017
www.melloninvestor.com
Legal Counsel
Reed Smith
Los Angeles, CA 90071
Auditors
SingerLewak
Los Angeles, CA 90024
A D D I T I O N A l I N F O R M AT I O N
Smith Micro maintains an investor relations program. If you have any questions or would like
additional information concerning the operations or financial statements, please contact:
Charles Messman or Todd Kehrli
MKR Group, Inc.
12198 Ventura Blvd., Suite 200
Los Angeles, CA 91604
(323) 468-2300

Smith Micro Software, Inc. • 51 Columbia, Aliso Viejo, California 92656 USA • +1 949 362 5800 • www.smithmicro.com • NASDAQ: SMSI

UNITED STATES
SECURITIES AND EXCHANGE COMMISSION Washington, D.C. 20549
FORM 10-K ______________
[ X ] ANNUAL REPORT PURSUANT TO SECTION 13 OR 15(d) OF THE SECURITIES EXCHANGE ACT OF 1934
For the fiscal year ended December 31, 2010 [ ] TRANSITION REPORT PURSUANT TO SECTION 13 OR 15(d) OF THE SECURITIES EXCHANGE
ACT OF 1934 For the transition period from __________ to __________
Commission File Number 0-26536
SMITH MICRO SOFTWARE, INC. (Exact name of registrant as specified in its charter)
_____________________
Delaware (State or other jurisdiction of incorporation or organization)
33-0029027 (I.R.S. Employer Identification Number)
51 Columbia, Aliso Viejo, CA (Address of principal executive offices)
92656
(Zip Code)
Registrant's telephone number, including area code: (949) 362-5800
Common Stock, $.001 par value (Title of each class)
The NASDAQ Stock Market LLC
(NASDAQ Global Market) (Name of each exchange on which registered)
_____________________
Securities registered pursuant to Section 12(b) of the Act: Common Stock, $.001 par value Securities registered pursuant to Section 12(g) of the Act: None
Indicate by check mark if the registrant is a well-known seasoned issuer, as defined in Rule 405 of the Securities Act.
YES[ ] NO [ X ]
Indicate by check mark if the registrant is not required to file reports pursuant to Section 13 or 15(d) of the Securities Exchange Act of 1934 YES [ ] NO [X ] Indicate by check mark whether the registrant (1) has filed all reports required to be filed by Section 13 or 15(d) of the Securities Exchange Act of 1934 during the preceding 12 months (or for such shorter period that the registrant was required to file such reports), and (2) has been subject to such filing requirements for the past 90 days. YES [X] NO [ ] Indicate by check mark whether the registrant has submitted electronically and posted on its corporate Web site, if any, every Interactive Data File required to be submitted and posted pursuant to Rule 405 of Regulation S-T during the preceding 12 months (or for such shorter period that the registrant was required to submit and post such files). Yes ¨ No ¨ Indicate by check mark if disclosure of delinquent filers pursuant to Item 405 of Regulation S-K is not contained herein, and will not be contained, to the best of registrant's knowledge, in definitive proxy or information statements incorporated by reference in Part III of this Form 10-K or any amendment to this Form 10-K [ ]. Indicate by check mark if whether the registrant is a large accelerated filer, an accelerated filer, or a non-accelerated filer. See definition of “accelerated filer and large accelerated filer” in Rule 12b-2 of the Exchange Act. (Check one):
Large accelerated filer [ ] Accelerated filer [X ] Non-accelerated filer [ ] (Do not check if a smaller reporting company) Smaller reporting company [ ]
Indicate by check mark whether the registrant is a shell company (as defined in Rule 12b-2 of the Act). YES[ ] NO [ X ] As of June 30, 2010, the last business day of the registrant’s most recently completed second quarter, the aggregate market value of the common stock of the registrant held by non-affiliates was $289,135,326 based upon the closing sale price of such stock as reported on the Nasdaq Global Market on that date. For purposes of such calculation, only executive officers, board members, and beneficial owners of more than 10% of the registrant’s outstanding common stock are deemed to be affiliates. As of February 18, 2011, there were 34,971,796 shares of common stock outstanding.
DOCUMENTS INCORPORATED BY REFERENCE Portions of the registrant’s Proxy Statement for the 2011 Annual Meeting of Stockholders to be filed under the Securities Exchange Act of 1934 are incorporated by reference in Part III of this report.
SMITH MICRO SOFTWARE, INC. 2010 ANNUAL REPORT ON FORM 10-K

2
TABLE OF CONTENTS
PART I ......................................................................................................................................................... 4 ITEM 1. BUSINESS ............................................................................................................................. 4 ITEM 1A. RISK FACTORS ............................................................................................................... 10 ITEM 1B. UNRESOLVED STAFF COMMENTS ............................................................................ 16 ITEM 2. PROPERTIES ...................................................................................................................... 16 ITEM 3. LEGAL PROCEEDINGS .................................................................................................... 17 ITEM 4. RESERVED ......................................................................................................................... 17
PART II ...................................................................................................................................................... 18 ITEM 5. MARKET FOR REGISTRANT’S COMMON EQUITY, RELATED STOCKHOLDER MATTERS AND ISSUER PURCHASES OF EQUITY SECURITIES ........................................... 18 ITEM 6. SELECTED CONSOLIDATED FINANCIAL DATA ........................................................ 20 ITEM 7. MANAGEMENT'S DISCUSSION AND ANALYSIS OF FINANCIAL CONDITION AND RESULTS OF OPERATIONS .......................................................................................................... 21 ITEM 7A. QUANTITATIVE AND QUALITATIVE DISCLOSURES ABOUT MARKET RISK .. 30 ITEM 8. FINANCIAL STATEMENTS AND SUPPLEMENTARY DATA ..................................... 31 ITEM 9. CHANGES IN AND DISAGREEMENTS WITH ACCOUNTANTS ON ACCOUNTING AND FINANCIAL DISCLOSURE .................................................................................................. 31 ITEM 9A. CONTROLS AND PROCEDURES .................................................................................. 31 ITEM 9B. OTHER INFORMATION ................................................................................................. 32
PART III .................................................................................................................................................... 33 ITEM 10. DIRECTORS, EXECUTIVE OFFICERS AND CORPORATE GOVERNANCE ............ 33 ITEM 11. EXECUTIVE COMPENSATION ..................................................................................... 35 ITEM 12. SECURITY OWNERSHIP OF CERTAIN BENEFICIAL OWNERS AND MANAGEMENT AND RELATED STOCKHOLDER MATTERS ................................................ 35 ITEM 13. CERTAIN RELATIONSHIPS AND RELATED TRANSACTIONS, AND DIRECTOR INDEPENDENCE ............................................................................................................................ 35 ITEM 14. PRINCIPAL ACCOUNTING FEES AND SERVICES ..................................................... 36
PART IV .................................................................................................................................................... 37 ITEM 15. EXHIBITS AND FINANCIAL STATEMENT SCHEDULES ......................................... 37 SIGNATURES .................................................................................................................................. 40

3
SPECIAL NOTE REGARDING FORWARD LOOKING STATEMENTS
In this document, the terms “Smith Micro,” “Company,” “we,” “us,” and “our” refer to Smith Micro Software, Inc. and, where appropriate, its subsidiaries.
This report contains forward-looking statements regarding Smith Micro which include, but are not limited to, statements concerning projected revenues, expenses, gross profit and income, the competitive factors affecting our business, market acceptance of products, customer concentration, the success and timing of new product introductions and the protection of our intellectual property. These forward-looking statements are based on our current expectations, estimates and projections about our industry, management's beliefs, and certain assumptions made by us. Words such as “anticipates,” “expects,” “intends,” “plans,” “predicts,” “potential,” “believes,” “seeks,” “estimates,” “should,” “may,” “will” and variations of these words or similar expressions are intended to identify forward-looking statements. Forward-looking statements also include the assumptions underlying or relating to any of the foregoing statements. These statements are not guarantees of future performance and are subject to risks, uncertainties and assumptions that are difficult to predict. Therefore, our actual results could differ materially and adversely from those expressed or implied in any forward-looking statements as a result of various factors. Such factors include, but are not limited to, the following:
• the continued economic slowdown and uncertainty and its effects on capital expenditures by our customers and their end users;
• our ability to predict consumer needs, introduce new products, gain broad market acceptance for such products and ramp up manufacturing in a timely manner;
• changes in demand for our products from our customers and their end-users;
• the intensity of the competition and our ability to successfully compete;
• the pace at which the market for new products develop;
• the response of competitors, many of whom are bigger and better financed than us;
• our ability to successfully execute our business plan and control costs and expenses;
• our ability to protect our intellectual property and our ability to not infringe on the rights of others; and
• those additional factors which are listed under the section “1A. Risk Factors” beginning on page 10 of this report.
The forward-looking statements contained in this report are made on the basis of the views and assumptions of management regarding future events and business performance as of the date this report is filed with the Securities and Exchange Commission (the “SEC”). We do not undertake any obligation to update these statements to reflect events or circumstances occurring after the date this report is filed.

4
PART I
Item 1. BUSINESS
General Smith Micro Software, Inc. designs, develops and markets software products and services primarily for the mobile computing and communications industries. The Company is focused on developing connectivity, communications, and content management solutions for a converging world of wireless and wired networks. The Company’s portfolio of wireless software products and services includes a wide range of software solutions including our QuickLink® family of products. We provide mobile voice and data connectivity across 3G, 4G and Wi-Fi networks. Our mobile communications portfolio includes solutions for Push-To-Talk, Visual Voicemail, mobile device management and video. We also offer user-friendly solutions for the management of mobile content, contacts and calendar data.
Our patented compression technologies are utilized within various Smith Micro products including our line of Personal Computer (“PC”) and Smartphone compression products and our managed file-transfer solution.
We sell our products and services to many of the world’s leading mobile network operators, original equipment manufacturers (“OEM”), device manufacturers and enterprise businesses, as well as directly to consumers. The proliferation of broadband mobile wireless technologies is providing new opportunities for our products and services on a global basis. When these broadband wireless technologies—EVDO, UMTS/HSPA, Wi-Fi, LTE and WiMAX—are combined with new devices such as mobile phones, Personal Computers, Smartphones, Netbooks, and tablets and emerging Machine-to-Machine (“M2M”) devices, opportunities emerge for new communications software products. Our core technologies are designed to address these emerging mobile connectivity and convergence opportunities.
Our innovative line of productivity and graphics products are distributed through a variety of consumer channels worldwide, our online stores, and third-party wholesalers, retailers and value-added resellers. We offer products that operate on Windows, Mac, UNIX, Linux, iOS, Android, Windows Mobile, Symbian and Java platforms.
The underlying design concept common to all of our products is our ability to improve the customer’s experience. This philosophy is based on the combination of solid engineering and exceptional design that reinforces our brand’s competitive differentiation. We have over 25 years of experience in design, creation and custom engineering services for software products.
We continue to invest significantly in our leading-edge technologies. Our research and development investments for the years ending December 31, 2010, 2009 and 2008 were $42.8 million, $36.5 million and $30.8 million, respectively. Our research and development expenses consist primarily of personnel costs required to conduct our software development efforts.
We were incorporated in California in November 1983, and we reincorporated in Delaware in June 1995. Our principal executive offices are located at 51 Columbia, Aliso Viejo, California 92656. Our telephone number is (949) 362-5800. Our website address is www.smithmicro.com. We make our SEC filings available on the Investor Relations page of our website. Information contained on our website is not part of this Annual Report on Form 10-K.
Business Segments Our operations are organized into two business segments: Wireless and Productivity & Graphics. We do not separately allocate operating expenses, nor do we allocate specific assets to these groups. Therefore, segment information reported includes only revenues and cost of revenues. See Note 6 of Notes to Consolidated Financial Statements for financial information related to our business segments.

5
Wireless The Wireless Group’s primary focus is to develop mobile connectivity, mobile information management and mobile security solutions. QuickLink® Mobile, the group’s leading product, provides mobile users the ability to easily connect a notebook or other wireless device to wireless wide area networks (“WWANs”) and wireless local area networks (“WLANs”) or Wi-Fi hotspots. Many of the world’s largest mobile operators and service providers including AT&T, Bell Canada, Bouygues, Clear, Comcast, Orange, Sprint, Time Warner, T-Mobile USA, Verizon Wireless, Vodafone and others rely on QuickLink® Mobile technology to help their subscribers easily connect to their wireless networks every day. One of the reasons more mobile operators rely on our connection management solution for their subscribers is our patented technology to seamlessly switch a wireless device between WWANs and WLANs.
We provide services to leading device manufacturers such as HTC, Motorola and Nokia.
In addition to marketing products to wireless carriers and device manufacturers, the Wireless Group also delivers wireless mobility solutions designed to address security and mobility needs of enterprises rapidly becoming more reliant on remote access to many types of wireless networks. In addition to addressing the need for robust security, the QuickLink® Mobility suite allows persistent connectivity for the user operating on WWANs, corporate Local Area Networks (“LAN’s”) and Wi-Fi networks. The applications support most IP services and interoperate with approximately 200 carriers worldwide, as well as hundreds of the popular broadband mobile devices and embedded WWAN PC notebooks.
As a result of network and device proliferation, there is an emerging need for smarter connectivity. Our latest solutions to emerge utilize our unique blend of Smith Micro DNA spanning connectivity, communications and content management that can be combined in virtually limitless combinations to create unique, strategic customer solutions.
Smith Micro continues to introduce solutions for mobile device communications. These include synchronization, back-up and restore of critical user data, push-to-talk software and visual voicemail services. This portfolio serves wireless carriers and device manufacturers with mobile handset software, as well as hosted software-as-a-service solutions. These products are designed to work across a broad spectrum of handset operating systems and platforms, including a rich array of feature phones and today's most popular Smartphones.
Wireless carriers and mobile device manufacturers incorporate our products into their branded product and service offerings, selling directly to their market segments. Our technologies are utilized in many major wireless networks to facilitate data communications via mobile devices, media solutions and device management. Our primary products for connection management are QuickLink® Mobile and QuickLink® Mobility. For managing the media on mobile devices, we have QuickLink® Media. Our Device Management Suite provides intelligent, automated mobile device provisioning and configuration. Rounding out our wireless portfolio, we also offer Push-To-Talk, Visual Voicemail, and mobile video solutions.
Productivity & Graphics The Productivity & Graphics Group focuses on developing a variety of software for the consumer, prosumer, and professional markets. Our solutions span compression, graphics and utilities. This group also republishes and markets third party software titles that complement our existing line of products. All of these products are available through direct sales on the Smith Micro websites (smithmicro.com, mysmithmicro.com and contentparadise.com), on partner websites, direct through customer service order desks, on-line resellers and through traditional retail outlets.
The lead product line in this area is StuffIt®, driven by its patented and patent-pending image compression, with a focus on our innovative “lossless” JPEG compression technology. StuffIt® provides superior lossless compression, encryption and archiving. We have enhanced this industry-leading product’s feature set with new, online file transfer capabilities.
In addition to compression technology, the Company is focused on growing its line of graphic titles, in particular Poser®, Anime Studio™ and Manga Studio™.
Industry Background Smith Micro offers products in the following technology and communications related markets:

6
Wireless and mobility – In order to capitalize on the emerging adoption trends for mobile Internet services and connectivity to global networks, mobile operators and service providers are introducing a wide array of data services and new mobile devices. Traditional mobile phone devices, Smartphones, laptops, tablet devices, Netbooks and other wirelessly connected devices are being deployed at escalating rates. Wireless data access service plans for these multimedia-enabled devices are being adopted at such a fast pace that global infrastructure for wireless networks is rapidly being updated to support higher speeds and greater capacity. The burgeoning demand for pervasive connectivity is driven by a need to access information anytime and from anywhere. In addition to this trend, there is an evolving and changing pattern of media being consumed “on-demand” from multiple different device types, including handheld terminals. Creating software that can enable capabilities to meet this demand for wireless access via 3G, 4G and Wi-Fi, in a way that enhances the user’s enjoyment of their online experience, represents the primary opportunity and area of focus for Smith Micro.
Smith Micro offers a variety of products that fit into our primary area of focus which enables connectivity to networks, devices, information and data. Providing software that connects devices in a simple and secure way to wireless networks using our QuickLink® Mobile family of products for mobile operators continues to expand. Wireless carriers are facing increased complexity in trying to serve customers’ connectivity needs as they move from 3G networks to beginning to support new higher speed technologies such as HSPA+, LTE and WiMAX network protocols which enable new capacity and higher speeds for the wireless subscribers. The increase in the amount of data traffic on the carrier networks is being fueled by new subscriber growth and higher bandwidth applications, such as video services. These developments, along with mobile devices that combine multiple radio chip-sets including Wi-Fi, 3G and 4G, are creating an increased interest in software that can support intelligent connectivity and service continuity across these differing network technologies. The QuickLink® Mobile family of connectivity software has been designed to help mobile operators meet the challenges of serving their subscriber base in this evolving and increasingly complex world of broadband wireless access.
These rapid changes in wireless technology including higher speed networks, improved intelligent connected devices and increasing demands for access to digital content and critical information, is fueling the evolution of a new connected digital lifestyle. Software that simplifies the complexity associated with serving this digital lifestyle and managing access to data from many sources, from any network type and via multiple devices is in demand for both the service providers and their end-user customers. As wireless carriers continue to seek new ways to offer premium services that allow their subscribers to better access the information, data and communications services that are becoming so vital to the way they lead their lives, Smith Micro’s portfolio of connectivity software, content delivery, device management and messaging solutions are addressing this demand.
Productivity and graphic software – Smith Micro also offers a secondary line of software that centers on serving the growing demand for improved graphic related products for 2D and 3D design. The Company’s products include Poser®, a 3D figure design and animation program, Manga Studio™, the number one selling Manga software worldwide and Anime Studio™, a complete solution for creating 2D movies, cartoons, anime or cut-out animations and is ideal for animators of any caliber. Many of the animations that people create with Anime Studio™ can be seen on social networking websites and YouTube. In addition to the graphics products, the growing prevalence and complexity of personal computers and mobile device operating systems require increasingly sophisticated diagnostic and utility software solutions to improve the consumer’s overall computing and mobile experience. Consumers demand products that can enhance PC performance, protect against spam, spyware, and computer hacking and remove malicious code. Businesses rely on cross-platform solutions that can quickly identify and repair a broad range of computer-related problems. The Company’s software solution for Windows and Mac platforms performs diagnostics, maximizes performance and helps to protect consumer’s online identity.
Products and Services Our primary products consist of the following:
Product Groups
Products Description
Wireless QuickLink® Mobile Centralized connection management application to control, customize and automate wireless connections of all types.
QuickLink® Mobility A mobile VPN and connection management solution delivering network “session persistence.”
QuickLink® Media Media and content management solution to synchronize and manage access to digital content from mobile devices, personal computers and the Cloud.
SendStuffNow™ Secure Cloud-based large file delivery solution. Device Management Suite Provides intelligent, automated mobile device provisioning and
configuration.

7
Push-To-Talk A data service that uses a mobile Internet connection to send and receive “walkie-talkie” style calls.
Visual Voicemail Voicemail is delivered directly to your mobile phone and stored in a visual inbox and also includes voicemail translation to text.
Vidio™ Video content delivery and optimization system for streaming to personal computers, tablets and mobile devices.
Productivity & Graphics
StuffIt Deluxe® Patented, lossless compression solution for documents and media. CheckIt® Diagnostics & CheckIt® Netbook Suite
A diagnosis and troubleshooting solution for many hardware and system problems.
Poser® A solution for creating 3D character art and animations. Anime Studio™ An animation tool for professionals and digital artists. Manga Studio™ A solution for creating manga and comic art.
Marketing and Sales Strategy Our primary focus is on developing the next mobile software experience through our Smith Micro DNA mobile platform for wireless operators and enterprises. Because of our broad product offerings, we are able to capitalize on technology synergies across our portfolio and quickly bring to market solutions that resonate with our target customers.
We continue to develop innovative, enabling technology and infrastructure products that facilitate the usage of wireless data and other premium mobile services, thereby providing our customers with additional revenue opportunities and differentiated services that encourage customer loyalty.
A core strategy is our ability to enable our wireless carrier and device manufacturer customers to introduce new products to their markets that generate revenue more quickly. Our industry knowledge and our research are used to help determine the next market opportunities for our customers in the mobile market.
Our sales strategy is as follows:
Leverage Carrier and OEM Relationships. We continue to capitalize on our strong relationships with the world’s leading wireless carriers and mobile device manufacturers. For example, our carrier customers serve as a valuable distribution channel, providing access to millions of end-users and also providing market feedback for future product offerings.
Focus on Multiple High-Growth Markets. We continue to focus on wireless connectivity, communications and content management. Within these markets, we see ongoing enhancement of networks and services by wireless carriers and an increasing availability of rich media and application-oriented Smartphones. This represents a remarkable alignment between our product portfolio and market opportunity.
Expand our Customer Base. In addition to introducing new products to new customers, we intend to grow our domestic and international business through cross-selling our portfolio of products to our current customer base.
Selectively Pursue Acquisitions of Complementary Products and Services. In line with the Company’s strategy, we will continue to pursue selected acquisition opportunities in an effort to expand our product and technological abilities, enter complementary markets and extend our geographic reach. In the past, we have used acquisitions to enhance our technology features and customer base, and to extend our product offerings into new markets.
Smith Micro is expanding its ability to serve wireless carriers, OEMs and enterprise customers in Europe and Asia through international sales and support offices based in Sweden, the United Kingdom, Australia and Hong Kong.
Our three largest customers are in the Wireless segment and each exceeded 10% of revenues for fiscal year 2010. Verizon Wireless, Sprint and AT&T accounted for 66.3% of our revenues in fiscal 2010. In 2009, our four largest customers (Verizon Wireless, Dell, Sprint and AT&T) accounted for 65.7% of our revenues. In 2008, our three largest customers (Verizon Wireless, AT&T and Sprint) accounted for 48.1% of our revenues. Our major customers could reduce their orders of our products in favor of a competitor's product or for any other reason. The loss of any of our major customers or decisions by a significant customer to substantially reduce purchases could have a material adverse effect on our business.
Sales to Verizon Wireless and their affiliates amounted to 40.1%, 32.8%, and 32.0% of the Company’s revenues for fiscal years 2010, 2009 and 2008, respectively. We have a master software and license distribution agreement with

8
Verizon Wireless whereas Smith Micro grants them non-exclusive licenses to reproduce and have produced, market, and distribute the software, in object form only, to distributors, re-sellers, OEM customers of Verizon Wireless and end users. The license term for end users continues in perpetuity unless otherwise stated in subsequent amendments. The master agreement commenced in December 2000 and has been consistently extended through subsequent amendments. They can cancel the agreement at any time. Products and services sold to Verizon include per unit license fees for connectivity and security and VZAccess manager software, engineering design and development fees, customization and adaptation fees and website hosting. The master agreement and subsequent amendments are detailed in Exhibit 10.4 in this document.
Integration Initiatives Smith Micro is committed to the integration of recent acquisitions for engineering, sales and marketing within the Company. The Company continues to drive greater productivity, flexibility and cost savings by integrating its own business processes and functions, thereby eliminating redundancies.
Customer Service and Technical Support We provide technical support and customer service through our online knowledge base, via email and by telephone. OEM customers generally provide their own primary customer support functions and rely on us for support to their own technical support personnel.
Product Development The software industry, particularly the wireless market, is characterized by rapid and frequent changes in technology and user needs. We work closely with industry groups and customers, both current and potential, to help us anticipate changes in technology and determine future customer needs. Software functionality depends upon the capabilities of the hardware. Accordingly, we maintain engineering relationships with various hardware manufacturers and we develop our software in tandem with their product development. Our engineering relationships with manufacturers, as well as with our major customers, are central to our product development efforts. We remain focused on the development and expansion of our technology, particularly in the wireless space. Research and development expenditures amounted to $42.8 million, $36.5 million, and $30.8 million for the years ended December 31, 2010, 2009 and 2008, respectively.
Manufacturing Although we primarily deliver our software via electronic downloads, we do deliver our software in several other forms. We offer a package or kit that may include CD-ROM(s), a cable and certain other documentation or marketing material. We also permit selected OEM customers to duplicate our products on their own CD-ROM’s, USB devices, or embedded devices, and pay a royalty based on usage. Some OEM business requires that we provide a CD, which includes a soft copy of a user guide. Finally, we grant licenses to certain OEM customers that enable those customers to preload a copy of our software onto a personal computer. With the enterprise sales program, we offer site licenses under which a corporate user is allowed to distribute copies of the software to users within their corporate sites.
Our product development group produces a product master for each product that is then duplicated and packaged into products by the manufacturing organization. All product components are purchased by our personnel in our Aliso Viejo, California facility. Our manufacturing is subcontracted to outside vendors and includes the replication of CD-ROM’s and the printing of documentation materials. Assembly of the final package is completed by our Aliso Viejo, California facility.
Competition The markets in which we operate are highly competitive and subject to rapid changes in technology. Rapidly changing technology combined with relatively low barriers to entry in the mobile software market is constantly creating new opportunities, and we expect new competitors to enter the market. We also believe that competition from established and emerging software companies will continue to intensify as the emerging mobile, wireless and

9
Internet markets evolve. We compete with other software vendors for the attention of customers as well as in our efforts to acquire technology and qualified personnel.
We believe that the principal competitive factors affecting the mobile software market include product features, usability, quality, price, customer service and effective sales and marketing efforts. Although we believe that our products currently compete favorably with respect to these factors, there can be no assurance that we can maintain our competitive position against current and potential competitors. We believe that the market for our software products has been and will continue to be characterized by significant price competition. A material reduction in the price of our products could negatively affect our profitability.
Many existing and potential OEM customers have technological capabilities to develop products that compete directly with our products. These customers may discontinue the purchase of our products. Our future performance is substantially dependent upon the extent to which existing OEM customers elect to purchase communications software from us rather than design and develop their own software. Because our customers are not contractually obligated to purchase any of our products, they may cease to rely, or fail to expand their reliance on us as a source for communications software in the future.
Proprietary Rights and Licenses Our success and ability to compete is dependent upon our software code base, our programming methodologies and other intellectual properties. To protect our proprietary technology, we rely on a combination of trade secrets, nondisclosure agreements, patents, copyright and trademark law that may afford only limited protection. As of December 31, 2010, we owned 42 issued U.S. patents and have 52 U.S. patent applications that are currently pending. These patents are intended to provide generalized protection of our intellectual property technology base and we will continue to apply for various patents and trademarks in the future as we deem necessary to protect our intellectual property technology base.
We seek to avoid unauthorized use and disclosure of our proprietary intellectual property by requiring employees and consultants with access to our proprietary information to execute confidentiality agreements with us and by restricting access to our source code. The deterrent steps that we have taken to protect our proprietary technology may not be adequate to deter misappropriation of our proprietary information or prevent the successful assertion of any adverse claim against us relating to software or intellectual property utilized by us. In addition, we may not be able to detect unauthorized use of our intellectual property rights or take effective steps to enforce those rights.
In selling our products, we primarily rely on “shrink wrap” licenses that are not signed by licensees and may be unenforceable under the laws of certain jurisdictions. In addition, the laws of some foreign countries do not protect our proprietary rights to as great an extent as do the laws of the United States. Accordingly, the means we use currently to protect our proprietary rights and intellectual property rights may not be adequate. Moreover, our competitors may independently develop competitive technology similar to ours. We also license technology on a non-exclusive basis from several companies for inclusion in our products and anticipate that we will continue to do so in the future. If we are unable to continue to license these technologies or to license other necessary technologies for inclusion in our products, or such third party technologies become subject to claims directed to or against the third party technologies used by us, or if we experience substantial increases in royalty payments under these third party licenses, our business could be materially and adversely affected.
Employees As of December 31, 2010, we had a total of 549 employees within the following departments: 370 in engineering, 115 in sales and marketing, 41 in management and administration, 13 in customer support and 10 in manufacturing. We utilize temporary labor to assist during peak periods of manufacturing volume. We believe that our future success will depend in large part upon our continuing ability to attract and retain highly skilled managerial, sales, marketing, customer support, research and development personnel and consulting staff. Like other software companies, we face intense competition for such personnel, and we have at times experienced and continue to experience difficulty in recruiting qualified personnel. There can be no assurance that we will be successful in attracting, assimilating and retaining other qualified personnel in the future. We are not subject to any collective bargaining agreement and we believe that our relationships with our employees are good.

10
Item 1A. RISK FACTORS Our future operating results are highly uncertain. Before deciding to invest in our common stock or to maintain or increase your investment, you should carefully consider the risks described below, in addition to the other information contained in this report and in our other filings with the SEC, including our reports on Forms 10-K, 10-Q and 8-K. The risks and uncertainties described below are not the only ones we face. Additional risks and uncertainties not presently known to us or that we currently deem immaterial may also affect our business operations. If any of these risks actually occur, that could seriously harm our business, financial condition or results of operations. In that event, the market price for our common stock could decline and you may lose all or part of your investment.
Our operating results may be adversely impacted by the continued worldwide economic slowdown and uncertainties in the marketplace.
Since the second half of 2008, economic conditions worldwide and in the United States have experienced a general deterioration, resulting in slower economic activity and a highly uncertain recovery, decreased consumer confidence and retail spending, reduced corporate profits and capital spending, and generally adverse business conditions. These conditions make it difficult for our wireless carrier and OEM customers and their end users to accurately forecast and plan future business activities and capital expenditures, which could cause them to slow spending on our products and services. Furthermore, during challenging economic times our customers may face issues gaining timely access to sufficient credit, which could result in an impairment of their ability to make timely payments to us. We cannot predict the timing, strength or duration of the current economic slowdown or the emerging economic recovery, or to what extent they will continue to affect us. If the economy, consumer spending or the markets in which we operate do not continue at their present levels or deteriorate, we may need to record charges related to restructuring costs and the impairment of goodwill and other long-lived assets, and our business, financial condition and results of operations will likely be materially and adversely affected.
Our quarterly revenues and operating results are difficult to predict and could fall below analyst or investor expectations, which could cause the price of our common stock to fall.
Our quarterly revenues and operating results have fluctuated significantly in the past and may continue to vary from quarter to quarter due to a number of factors, many of which are not within our control. If our operating results do not meet the expectations of securities analysts or investors, our stock price may decline. Fluctuations in our operating results may be due to a number of factors, including the following:
• the gain or loss of a key customer; • the size and timing of orders from and shipments to our major customers; • the size and timing of any return product requests for our products; • our ability to maintain or increase gross margins; • variations in our sales channels or the mix of our product sales; • our ability to anticipate market needs and to identify, develop, complete, introduce, market and produce new
products and technologies in a timely manner to address those needs; • the availability and pricing of competing products and technologies and the resulting effect on sales and
pricing of our products; • acquisitions; • the effect of new and emerging technologies; • the timing of acceptance of new mobile services by users of our customers’ services; • deferrals of orders by our customers in anticipation of new products, applications, product enhancements or
operating systems; and • general economic and market conditions.
We have difficulty predicting the volume and timing of orders. In any given quarter, our sales have involved, and we expect will continue to involve, large financial commitments from a relatively small number of customers. As a result, the cancellation or deferral of even a small number of orders would reduce our revenues, which would adversely affect our quarterly financial performance. Also, we have often booked a large amount of our sales in the

11
last month of the quarter and often in the last week of that month. Accordingly, delays in the closing of sales near the end of a quarter could cause quarterly revenues to fall substantially short of anticipated levels. Significant sales may also occur earlier than expected, which could cause operating results for later quarters to compare unfavorably with operating results from earlier quarters.
A large portion of our operating expenses, including rent, depreciation and amortization is fixed and difficult to reduce or change. Accordingly, if our total revenue does not meet our expectations, we may not be able to adjust our expenses quickly enough to compensate for the shortfall in revenue. In that event, our business, financial condition and results of operations would be materially and adversely affected.
Due to all of the foregoing factors, and the other risks discussed in this report, you should not rely on quarter-to-quarter comparisons of our operating results as an indication of future performance.
Our total revenues currently depend on a small number of products and customers, so our operating results are vulnerable to unexpected shifts in demand.
A substantial majority of our total revenue is derived from sales of our wireless connectivity and security software products. Although our strategy is to continue to introduce new products, these efforts may not reduce the extent to which our total revenues are dependent on a small number of products in these market sectors. Rapid shifts in the markets for these products and consumer habits, changes in demand by end-users and changes in underlying technology present both opportunities and risks for our business. Factors which could affect our business include the rate of adoption of the 4G networking standard by wireless carriers and handset manufacturers, and changes in consumer demand for PC networking due to the adoption of Smartphones and tablet computing. If our products fail to remain current with and useful to new and emerging markets, our business, financial condition and results of operations would be materially and adversely affected.
We also derive a significant portion of our revenues from a few vertical markets, such as wireless carriers and handset manufacturers. In order to sustain and grow our business, we must continue to sell our software products into these vertical markets. Shifts in the dynamics of these vertical markets, such as new product introductions by our competitors, could seriously harm our results of operations, financial condition and prospects. To increase our sales outside our core vertical markets, for example to large enterprises, requires us to devote time and resources to hire and train sales employees familiar with those industries. Even if we are successful in hiring and training sales teams, customers in other vertical markets may not need or sufficiently value our current products or new product introductions.
In addition, because we sell primarily to large carriers and OEMs, there are a limited number of actual and potential customers for our products, resulting in customer concentration for sales of our products and services. For the year ended December 31, 2010, one customer, Verizon Wireless, comprised 40.1% of our total revenues. Two other customers (Sprint and AT&T) individually comprised of at least 10% of our total revenues. Because of our customer concentration, our largest customers may have significant pricing power over us. Furthermore, a substantial decrease in sales to any of our largest customers could materially affect our revenues and profitability. Additionally, these customers are not the end-users of our products. If any of these customers’ efforts to market their products which incorporate our software are unsuccessful in the marketplace, our revenues and profitability could be adversely affected.
Competition within our target markets is intense and includes numerous established competitors and new entrants, which could negatively affect our revenues and results of operations.
We operate in markets that are extremely competitive and subject to rapid changes in technology. A number of established software companies, such as Microsoft Corporation, Google Inc. and Apple Inc. pose a significant competitive threat to us because their handset operating systems may include some capabilities now provided by certain of our OEM and retail software products. If handset manufacturers and carriers are satisfied relying on the capabilities of systems using Windows, Android or iPhone OS, or other hardware or operating systems, sales of our products are likely to decline. In addition, because there are low barriers to entry into the software markets in which we participate and may participate in the future, we expect significant competition from both established and emerging software companies in the future, both domestic and international. In fact, our growth opportunities in new product markets could be limited to the extent established and emerging software companies enter or have entered those markets. Furthermore, our existing and potential OEM customers may acquire or develop products that compete directly with our products.
Many of our other current and prospective competitors have significantly greater financial, marketing, service, support, technical and other resources than we do. As a result, they may be able to adapt more quickly than we to

12
new or emerging technologies and changes in customer requirements or to devote greater resources to the promotion and sale of their products. Announcements of competing products by competitors could result in the cancellation of orders by customers in anticipation of the introduction of such new products. In addition, some of our competitors currently make complementary products that are sold separately. Such competitors could decide to enhance their competitive position by bundling their products to attract customers seeking integrated, cost-effective software applications. Some competitors have a retail emphasis and offer OEM products with a reduced set of features. The opportunity for retail upgrade sales may induce these and other competitors to make OEM products available at their own cost or even at a loss. We also expect competition to increase as a result of software industry consolidations, which may lead to the creation of additional large and well-financed competitors. Increased competition is likely to result in price reductions, fewer customer orders, reduced margins and loss of market share.
Acquisitions of companies or technologies may disrupt our business and divert management attention and cause our current operations to suffer.
We have historically made targeted acquisitions of smaller companies with important technology and expect to continue to do so in the future. As part of any acquisition, we will be required to assimilate the operations, products and personnel of the acquired businesses and train, retain and motivate key personnel from the acquired businesses. We may not be able to maintain uniform standards, controls, procedures and policies if we fail in these efforts. Similarly, acquisitions may cause disruptions in our operations and divert management’s attention from our company’s day-to-day operations, which could impair our relationships with our current employees, customers and strategic partners. Acquisitions may also subject us to liabilities and risks that are not known or identifiable at the time of the acquisition.
We may also have to incur debt or issue equity securities in order to finance future acquisitions. Our financial condition could be harmed to the extent we incur substantial debt or use significant amounts of our cash resources in acquisitions. The issuance of equity securities for any acquisition could be substantially dilutive to our existing stockholders. In addition, we expect our profitability could be adversely affected because of acquisition-related accounting costs, write offs, amortization expenses, and charges related to acquired intangible assets. In consummating acquisitions, we are also subject to risks of entering geographic and business markets in which we have had limited or no prior experience. If we are unable to fully integrate acquired businesses, products or technologies within existing operations, we may not receive the intended benefits of acquisitions.
We are entering new, emerging markets in which we have limited experience; if these markets do not develop or we are unable to otherwise succeed in them, our revenues will suffer and the price of our common stock will likely decline.
Our recent and planned product introductions to support new higher speed networking and 4G technologies such as HSPA+, LTE and WiMAX network protocols have allowed us to enter new markets. A viable market for these products may not develop or be sustainable, and we may face intense competition in these markets. In addition, our success in these markets depends on our carrier customers’ ability to successfully introduce new mobile services enabled by our products and our ability to broaden our carrier customer base, which we believe will be difficult and time-consuming. If the expected benefits from entering new markets do not materialize our revenues will suffer and the price of our common stock would likely decline. In addition, to the extent we enter new markets through acquisitions of companies or technologies, our financial condition could be harmed or our stockholders could suffer dilution without a corresponding benefit to our company if we do not realize expected benefits of entering such new markets.
If the adoption of and investments in new technologies and services grows more slowly than anticipated in our product planning and development, our operating results, financial condition and prospects may be negatively affected.
If the adoption of and investments in new networking and 4G technologies and services does not grow or grows more slowly than anticipated, we will not obtain the anticipated returns from our planning and development investments. For example, our Device Management Suite of products allows our customers to update mobile devices from a home office and incorporates technology that provides a mechanism to allow for efficient firmware updates for mobile devices. In addition, we have introduced new high-speed networking and 4G products, but the pace of the market introduction of such technologies is uncertain. Future sales and any future profits from these and related products are substantially dependent upon the acceptance and use of these new technologies, and on the continued adoption and use of mobile data services by end-users.

13
Many of our customers and other communications service providers have made and continue to make major investments in next generation networks that are intended to support more complex applications. If communications service providers delay their deployment of networks or fail to deploy such networks successfully, demand for our products could decline, which would adversely affect our revenues. Also, to the extent we devote substantial resources and incur significant expenses to enable our products to be interoperable with new networks that have failed or have been delayed or not deployed, our operating results, financial condition and prospects may be negatively affected.
Our growth depends in part on our customers’ ability and willingness to promote services and attract and retain new customers or achieve other goals outside of our control.
We sell our products for use on handheld devices primarily through our carrier customers. Losing the support of these customers may limit our ability to compete in existing and potential markets and could negatively affect our revenues. In addition, the success of these customers and their ability and willingness to market services supported by our products are critical to our future success. Our ability to generate revenues from sales of our software is also constrained by our carrier customers’ ability to attract and retain customers. We have no input into or influence upon their marketing efforts and sales and customer retention activities. If our carrier customers, particularly our largest customer, Verizon Wireless, fail to maintain or grow demand for their services, revenues or revenue growth from our products designed for use on mobile devices will decline and our results of operations will suffer.
Our operating income may continue to change due to shifts in our sales mix and increased spending on our research and development and infrastructure.
Our operating income can change quarter to quarter and year to year due to a change in our sales mix and the timing of our continued investments in research and development and infrastructure. Operating income as a percentage of revenues has ranged from 2.8% in 2008 to 10.4% in 2009 to 14.1% in 2010. We continue to invest in research and development which is the lifeline of our technology portfolio. In addition we continue to invest in our infrastructure with facility expansions in Aliso Viejo, California and a new engineering design and data center in Pittsburgh, Pennsylvania. The timing of these additional expenses can vary significantly quarter to quarter and even from year to year.
Our products may contain undetected software defects, which could negatively affect our revenues.
Our software products are complex and may contain undetected defects. In the past, we have discovered software defects in certain of our products and have experienced delayed or lost revenues during the period it took to correct these problems. Although we and our OEM customers test our products, it is possible that errors may be found or occur in our new or existing products after we have commenced commercial shipment of those products. Defects, whether actual or perceived, could result in adverse publicity, loss of revenues, product returns, a delay in market acceptance of our products, loss of competitive position or claims against us by customers. Any such problems could be costly to remedy and could cause interruptions, delays, or cessation of our product sales, which could cause us to lose existing or prospective customers and could negatively affect our results of operations. In addition, some of our software contains open source components that are licensed under the GNU General Public License and similar open source licenses. These components may contain undetected defects or incompatibilities, may cause us to lose control over the development of portions of our software code, and may expose us to claims of infringement if these components are, or incorporate, infringing materials, the licenses are not enforceable or are modified to become incompatible with other open source licenses, or exposure to misappropriation claims if these components include unauthorized materials from a third party.
Technology and customer needs change rapidly in our market, which could render our products obsolete and negatively affect our business, financial condition and results of operations.
Our success depends on our ability to anticipate and adapt to changes in technology and industry standards. We will also need to continue to develop and introduce new and enhanced products to meet our target markets’ changing demands, keep up with evolving industry standards, including changes in the Microsoft and Google operating systems with which our products are designed to be compatible, and to promote those products successfully. The communications and utilities software markets in which we operate are characterized by rapid technological change, changing customer needs, frequent new product introductions, evolving industry standards and short product life cycles. Any of these factors could render our existing products obsolete and unmarketable. In addition, new products and product enhancements can require long development and testing periods as a result of the complexities inherent in today’s computing environments and the performance demanded by customers and called for by evolving
14
wireless networking technologies. If our target markets do not develop as we anticipate, our products do not gain widespread acceptance in these markets, or we are unable to develop new versions of our software products that can operate on future wireless networks and PC and mobile device operating systems and interoperate with other popular applications, our business, financial condition and results of operations could be materially and adversely affected.
Regulations affecting our customers and us and future regulations, to which they or we may become subject to, may harm our business.
Certain of our customers in the communications industry are subject to regulation by the Federal Communications Commission, which could have an indirect effect on our business. In addition, the United States telecommunications industry has been subject to continuing deregulation since 1984. We cannot predict when, or upon what terms and conditions, further regulation or deregulation might occur or the effect regulation or deregulation may have on demand for our products from customers in the communications industry. Demand for our products may be indirectly affected by regulations imposed upon potential users of those products, which may increase our costs and expenses.
We may be unable to adequately protect our intellectual property and other proprietary rights, which could negatively impact our revenues.
Our success is dependent upon our software code base, our programming methodologies and other intellectual properties and proprietary rights. In order to protect our proprietary technology, we rely on a combination of trade secrets, nondisclosure agreements, patents, and copyright and trademark law. We currently own U.S. trademark registrations for certain of our trademarks and U.S. patents for certain of our technologies. However, these measures afford us only limited protection. Furthermore, we rely primarily on “shrink wrap” licenses that are not signed by the end user and, therefore, may be unenforceable under the laws of certain jurisdictions. Accordingly, it is possible that third parties may copy or otherwise obtain our rights without our authorization. It is also possible that third parties may independently develop technologies similar to ours. It may be difficult for us to detect unauthorized use of our intellectual property and proprietary rights.
We may be subject to claims of intellectual property infringement as the number of trademarks, patents, copyrights and other intellectual property rights asserted by companies in our industry grows and the coverage of these patents and other rights and the functionality of software products increasingly overlap. From time to time, we have received communications from third parties asserting that our trade name or features, content, or trademarks of certain of our products infringe upon intellectual property rights held by such third parties. We have also received correspondence from third parties separately asserting that our products may infringe on certain patents held by each of the parties. Although we are not aware that any of our products infringe on the proprietary rights of others, third parties may claim infringement by us with respect to our current or future products. Additionally, our customer agreements require that we indemnify our customers for infringement claims made by third parties involving our intellectual property embedded in their products. Infringement claims, whether with or without merit, could result in time-consuming and costly litigation, divert the attention of our management, cause product shipment delays or require us to enter into royalty or licensing agreements with third parties. If we are required to enter into royalty or licensing agreements, they may not be on terms that are acceptable to us. Unfavorable royalty or licensing agreements could seriously impair our ability to market our products.
If we are unable to retain key personnel, the loss of their services could materially and adversely affect our business, financial condition and results of operations.
Our future performance depends in significant part upon the continued service of our senior management and other key technical and consulting personnel. We do not have employment agreements with our key employees that govern the length of their service. The loss of the services of our key employees would materially and adversely affect our business, financial condition and results of operations. Our future success also depends on our ability to continue to attract, retain and motivate qualified personnel, particularly highly skilled engineers involved in the ongoing research and development required to develop and enhance our products. Competition for these employees remains high and employee retention is a common problem in our industry. Our inability to attract and retain the highly trained technical personnel that are essential to our product development, marketing, service and support teams may limit the rate at which we can generate revenue, develop new products or product enhancements and generally would have an adverse effect on our business, financial condition and results of operations.

15
If we fail to continue to establish and maintain strategic relationships with mobile device manufacturers, market acceptance of our products and our profitability, may suffer.
Most of our strategic relationships with mobile device manufacturers are not subject to written contract, but rather are in the form of informal working relationships. We believe these relationships are valuable to our success. In particular, these relationships provide us with insights into product development and emerging technologies, which allows us to keep abreast of, or anticipate, market trends and helps us serve our current and prospective customers. Because these relationships are not typically governed by written agreements, there is no obligation for many of our partners to continue working with us. If we are unable to maintain our existing strategic relationships with mobile device manufacturers or if we fail to enter into additional strategic relationships or the parties with whom we have strategic relationships favor one of our competitors, our ability to provide products that meet our current and prospective customers’ needs could be compromised and our reputation and future revenue prospects could suffer. For example, if our software does not function well with a popular mobile device because we have not maintained a relationship with its manufacturer, carriers seeking to provide that device to their respective customers could choose a competitor’s software over ours or develop their own. Even if we succeed in establishing these relationships, they may not result in additional customers or revenues.
We may raise additional capital through the issuance of additional equity or convertible debt securities or by borrowing money, in order to meet our capital needs. Additional funds may not be available on terms acceptable to us to allow us to meet our capital needs.
We believe that the cash, cash equivalents and short-term investments on hand and the cash we expect to generate from operations will be sufficient to meet our capital needs for at least the next twelve months. However, it is possible that we may need or choose to obtain additional financing to fund our activities in the future. We could raise these funds by selling more stock to the public or to selected investors, or by borrowing money. We may not be able to obtain additional funds on favorable terms, or at all. If adequate funds are not available, we may be required to curtail our operations or other business activities significantly or to obtain funds through arrangements with strategic partners or others that may require us to relinquish rights to certain technologies or potential markets.
We have on file with the SEC a shelf Form S-3 to sell from time to time up to 4,000,000 shares of our common stock in one or more offerings in amounts, at prices and on the terms that we will determine at the time of offering. In addition, we have on file with the SEC a shelf Form S-4 to sell from time to time up to 1,000,000 shares of our common stock in connection with our future acquisitions of other businesses, assets or securities. If we raise additional funds by issuing additional equity or convertible debt securities (whether in a public offering or private placement), the ownership percentages of existing stockholders would be reduced. In addition, the equity or debt securities that we issue may have rights, preferences or privileges senior to those of the holders of our common stock. We currently have no established line of credit or other business borrowing facility in place.
It is possible that our future capital requirements may vary materially from those now planned. The amount of capital that we will need in the future will depend on many factors, including:
• the market acceptance of our products; • the levels of promotion and advertising that will be required to launch our products and achieve and maintain
a competitive position in the marketplace; • our business, product, capital expenditure and research and development plans and product and technology
roadmaps; • the levels of inventory and accounts receivable that we maintain; • capital improvements to new and existing facilities; • technological advances; • our competitors’ response to our products; and • our relationships with suppliers and customers.
In addition, we may raise additional capital to accommodate planned growth, hiring, infrastructure and facility needs or to consummate acquisitions of other businesses, products or technologies.
16
Our business, financial condition and operating results could be adversely affected as a result of legal, business and economic risks specific to international operations.
In recent years, our revenues derived from sales to customers outside the U.S. have not been material. Our revenues derived from such sales can vary from quarter to quarter and from year to year. We also frequently ship products to our domestic customers’ international manufacturing divisions and subcontractors. In the future, we may expand these international business activities. International operations are subject to many inherent risks, including:
• general political, social and economic instability; • trade restrictions; • the imposition of governmental controls; • exposure to different legal standards, particularly with respect to intellectual property; • burdens of complying with a variety of foreign laws; • import and export license requirements and restrictions of the United States and any other country in which
we operate; • unexpected changes in regulatory requirements; • foreign technical standards; • changes in tariffs; • difficulties in staffing and managing international operations; • difficulties in securing and servicing international customers; • difficulties in collecting receivables from foreign entities; • fluctuations in currency exchange rates and any imposition of currency exchange controls; and • potentially adverse tax consequences.
These conditions may increase our cost of doing business. Moreover, as our customers are adversely affected by these conditions, our business with them may be disrupted and our results of operations could be adversely affected.
Item 1B. UNRESOLVED STAFF COMMENTS None.
Item 2. PROPERTIES Our corporate headquarters, including our principal administrative, sales and marketing, customer support and research and development facility, is located in Aliso Viejo, California, where we currently lease and occupy approximately 52,700 square feet of space pursuant to leases that expire on May 31, 2016 and January 31, 2022.
We lease approximately 55,600 square feet in Pittsburgh, Pennsylvania under a lease that expires December 31, 2021. We lease approximately 21,000 square feet in Mountain View, California under a lease that expires February 28, 2014. We lease approximately 14,400 square feet in Chicago, Illinois under a lease that expires August 31, 2012. We lease approximately 15,300 square feet in Watsonville, California under a lease that expires September 30, 2018. We lease approximately 7,700 square feet in Herndon, Virginia under a lease that expires May 31, 2011. We lease approximately 4,200 square feet in Austin, Texas under a lease that expires June 30, 2011.
Internationally, we lease space in Stockholm, Sweden; Belgrade, Serbia; Oslo, Norway; and Vancouver, Canada. These leases are for one to three-year terms.
We believe that suitable additional or alternative space will be available in the future on commercially reasonable terms as needed.

17
Item 3. LEGAL PROCEEDINGS From time to time we may be party to litigation incidental to our business, none of which is expected to have a material adverse effect on us.
Item 4. RESERVED
18
PART II
Item 5. MARKET FOR REGISTRANTʼS COMMON EQUITY, RELATED STOCKHOLDER MATTERS AND ISSUER PURCHASES OF EQUITY SECURITIES
Market Information Our common stock is traded on the NASDAQ Global Market under the symbol “SMSI.” The high and low sale prices for our common stock as reported by NASDAQ are set forth below for the periods indicated.
High Low
YEAR ENDED DECEMBER 31, 2010:First Quarter $9.59 $7.37Second Quarter 11.20 8.51 Third Quarter 10.63 7.61 Fourth Quarter 16.35 9.74
YEAR ENDED DECEMBER 31, 2009:First Quarter $6.17 $3.64Second Quarter 10.62 5.19 Third Quarter 12.87 8.96 Fourth Quarter 12.37 6.26
On February 18, 2011, the closing sale price for our common stock as reported by NASDAQ was $9.17.
For information regarding Securities Authorized for Issuance under Equity Compensation Plans, please refer to Item 12.
Stock Performance Graph The following graph and information compares the cumulative total stockholder return on our common stock against the cumulative total return of the S&P Midcap 400 Index and the S&P Midcap Applications Software Index (Peer Group) for the same period.
The graph covers the period from December 31, 2005 through December 31, 2010. The graph assumes that $100 was invested in our common stock on December 31, 2005, and in each index, and that all dividends were reinvested. No cash dividends have been declared on our common stock. Stockholder returns over the indicated period should not be considered indicative of future stockholder returns.

19
12/05 12/06 12/07 12/08 12/09 12/10 Smith Micro Software, Inc. 100.00 242.56 144.79 95.04 156.41 269.06 S&P Midcap 400 100.00 110.32 119.12 75.96 104.36 132.16 S&P MidCap Application Software 100.00 115.74 121.75 76.56 113.21 158.72
Holders As of February 18, 2011, there were approximately 234 holders of record of our common stock based on information provided by our transfer agent.
Dividends We have never paid any cash dividends on our common stock and we have no current plans to do so.
Recent Sales of Unregistered Securities None.
$0
$50
$100
$150
$200
$250
$300
12/05 12/06 12/07 12/08 12/09 12/10
COMPARISON OF 5 YEAR CUMULATIVE TOTAL RETURN* Among Smith Micro Software, Inc., the S&P Midcap 400 Index
and S&P MidCap Application Software
Smith Micro Software, Inc. S&P Midcap 400 S&P MidCap Application Software
*$100 invested on 12/31/05 in stock or index, including reinvestment of dividends. Fiscal year ending December 31. Copyright© 2011 S&P, a division of The McGraw-Hill Companies Inc. All rights reserved.

20
Purchases of Equity Securities by the Company None.
Item 6. SELECTED CONSOLIDATED FINANCIAL DATA The following selected consolidated financial data should be read in conjunction with “Management’s Discussion and Analysis of Financial Condition and Results of Operations” and our consolidated financial statements and the related notes thereto appearing elsewhere in this Annual Report. The following selected consolidated statement of operations data for the years ended December 31, 2010, 2009 and 2008, and the consolidated balance sheet data at December 31, 2010 and 2009, have been derived from audited consolidated financial statements included elsewhere in this Annual Report. The consolidated statement of operations data presented below for the years ended December 31, 2007 and 2006, and the consolidated balance sheet data at December 31, 2008, 2007 and 2006 are derived from audited consolidated financial statements that are not included in this Annual Report.
2010 2009 2008 2007 2006Consolidated Statement of Operations Data (in thousands, except per share data):Revenues 130,501$ 107,279$ 98,424$ 73,377$ 54,469$
Cost of revenues 15,507 15,486 20,108 20,644 20,259 Gross profit 114,994 91,793 78,316 52,733 34,210 Operating expenses: Selling and marketing 29,708 24,999 24,814 18,394 9,057 Research and development 42,759 36,530 30,811 14,772 7,899 General and administrative 24,146 19,155 19,990 15,318 8,467 Total operating expenses 96,613 80,684 75,615 48,484 25,423 Operating income 18,381 11,109 2,701 4,249 8,787 Interest and other income 130 381 739 4,254 1,403 Income before taxes 18,511 11,490 3,440 8,503 10,190 Income tax expense 6,165 6,738 4,172 5,342 1,234 Net income (loss) 12,346$ 4,752$ (732)$ 3,161$ 8,956$
Net income (loss) per share: Basic 0.36$ 0.15$ (0.02)$ 0.11$ 0.38$ Diluted 0.36$ 0.14$ (0.02)$ 0.10$ 0.35$
Weighted average shares: Basic 34,204 32,438 30,978 29,768 23,753 Diluted 34,615 32,897 30,978 30,998 25,330
2010 2009 2008 2007 2006Consolidated Balance Sheet Data (in thousands):Total assets 234,892$ 205,934$ 176,995$ 162,421$ 131,026$ Total liabilities 16,627 17,955 11,591 7,907 4,969 Accumulated earnings (deficit) 16,538 4,192 (560) 172 (2,989) Total stockholders' equity 218,265$ 187,979$ 165,404$ 154,514$ 126,057$
Year Ended December 31,
As of December 31,

21
Item 7. MANAGEMENT'S DISCUSSION AND ANALYSIS OF FINANCIAL CONDITION AND RESULTS OF OPERATIONS The following discussion of our financial condition and results of operations should be read in conjunction with our consolidated financial statements and the related notes and other financial information appearing elsewhere in this Annual Report. Readers are also urged to carefully review and consider the various disclosures made by us which attempt to advise interested parties of the factors which affect our business, including without limitation the disclosures made in Item 1A of Part I of this Annual Report under the caption “Risk Factors.”
Risk factors that could cause actual results to differ from those contained in the forward-looking statements include but are not limited to: the duration and depth of the current economic slowdown and its effects on the capital expenditures by our customers and their end users; our dependence upon a single customer for a significant portion of our revenues; potential fluctuations in quarterly results; deriving revenues from a small number of products; failure to successfully compete; failure to successfully integrate acquisitions; entry into new markets; failure of our customers to adopt new technologies; dependence upon relationships with carrier customers; declines in operating income; undetected software defects; changes in technology; delays or failure in deliveries from component suppliers; failure of our products to achieve broad acceptance; failure to protect intellectual property; exposure to intellectual property claims; and loss of key personnel.
Introduction and Overview Smith Micro Software, Inc. designs, develops and markets software products and services primarily for the mobile computing and communications industries. The Company is focused on developing connectivity, communications, and content management solutions for a converging world of wireless and wired networks. The Company’s portfolio of wireless software products and services includes a wide range of software solutions including our QuickLink® family of products. We provide mobile voice and data connectivity across 3G, 4G and Wi-Fi networks. Our mobile communications portfolio includes solutions for Push-To-Talk, Visual Voicemail, mobile device management and video. We also offer user-friendly solutions for the management of mobile content, contacts and calendar data.
Our patented compression technologies are utilized within various Smith Micro products including our line of Personal Computer (“PC”) and Smartphone compression products and our managed file-transfer solution.
We sell our products and services to many of the world’s leading mobile network operators, original equipment manufacturers (“OEM”), device manufacturers and enterprise businesses, as well as directly to consumers. The proliferation of broadband mobile wireless technologies is providing new opportunities for our products and services on a global basis. When these broadband wireless technologies—EVDO, UMTS/HSPA, Wi-Fi, LTE and WiMAX—are combined with new devices such as mobile phones, Personal Computers, Smartphones, Netbooks, and tablets and emerging Machine-to-Machine (“M2M”) devices, opportunities emerge for new communications software products. Our core technologies are designed to address these emerging mobile connectivity and convergence opportunities.
Our innovative line of productivity and graphics products are distributed through a variety of consumer channels worldwide, our online stores, and third-party wholesalers, retailers and value-added resellers. We offer products that operate on Windows, Mac, UNIX, Linux, iOS, Android, Windows Mobile, Symbian and Java platforms.
The underlying design concept common to all of our products is our ability to improve the customer’s experience. This philosophy is based on the combination of solid engineering and exceptional design that reinforces our brand’s competitive differentiation. We have over 25 years of experience in design, creation and custom engineering services for software products.
We continue to invest in research and development and have built one of the industry’s leading wireless product lines. We believe that we are well positioned to capitalize on market opportunities as we leverage the strength of our technology capabilities with our growing global reach and expanding product lines.
For the year ended December 31, 2010, three customers, each accounting for over 10% of revenues, made up 66.3% of revenues and 78% of accounts receivable. For the year ended December 31, 2009, four customers, each accounting for over 10% of revenues, made up 65.7% of revenues and 75% of accounts receivable. For the year ended December 31, 2008, one customer accounted for 32.0% of revenues and 21% of accounts receivable.

22
Results of Operations The following table sets forth certain consolidated statement of operating data as a percentage of total revenues for the periods indicated:
2010 2009 2008
Revenues 100.0% 100.0% 100.0%
Cost of revenues 11.9% 14.4% 20.4%Gross profit 88.1% 85.6% 79.6%Operating expenses: Selling and marketing 22.8% 23.3% 25.2% Research and development 32.8% 34.0% 31.3% General and administrative 18.4% 17.9% 20.3%Total operating expenses 74.0% 75.2% 76.8%Operating income 14.1% 10.4% 2.8%Interest and other income 0.1% 0.3% 0.7%Income before taxes 14.2% 10.7% 3.5%Income tax expense 4.7% 6.3% 4.2%Net income (loss) 9.5% 4.4% -0.7%
Year Ended December 31,
Revenues and Expense Components The following is a description of the primary components of our revenues and expenses: Revenues. Revenues are net of sales returns and allowances. Our operations are organized into two business segments:
• Wireless, which includes our connectivity and security management, mobile VPN, media and content management, device management, Push-To-Talk, Visual Voicemail, contact and calendar syncing and video content delivery and optimization solutions; and
• Productivity & Graphics, which includes retail and direct sales of our compression and broad consumer-based software.
The following table shows the revenues generated by each business segment (in thousands):
2008Wireless 118,684$ 89,420$ 73,219$ Productivity & Graphics 11,399 17,014 23,925 Corporate/Other 418 845 1,280 Total revenues 130,501 107,279 98,424 Cost of revenues 15,507 15,486 20,108 Gross profit 114,994$ 91,793$ 78,316$
2010 2009Year Ended December 31,
“Corporate/Other” refers to the consulting portion of our services sector which has been de-emphasized and is no longer considered a strategic element of our future plans. Cost of revenues. Cost of revenues consists of direct product costs, royalties, and the amortization of purchased intangibles and capitalized software. Selling and marketing. Selling and marketing expenses consist primarily of personnel costs, advertising costs, sales commissions, trade show expenses, and the amortization of certain purchased intangibles. These expenses vary significantly from quarter to quarter based on the timing of trade shows and product introductions.

23
Research and development. Research and development expenses consist primarily of personnel and equipment costs required to conduct our software development efforts and the amortization of acquired intangibles. General and administrative. General and administrative expenses consist primarily of personnel costs, professional services and fees paid for external service providers, space and occupancy costs, and legal and other public company costs.
Interest and other income. Interest and other income are directly related to our average cash and short term investment balances during the period and vary among periods. Our other excess cash is invested in short term marketable equity and debt securities classified as cash equivalents.
Income tax expense. The Company accounts for income taxes as required by Financial Accounting Standards Board (“FASB”) Accounting Standards Codification (“ASC”) Topic No. 740, Income Taxes. This statement requires the recognition of deferred tax assets and liabilities for the future consequences of events that have been recognized in the Company’s financial statements or tax returns. Measurement of the deferred items is based on enacted tax laws. In the event the future consequences of differences between financial reporting bases and tax bases of the Company’s assets and liabilities result in a deferred tax asset, we are required to evaluate the probability of being able to realize the future benefits indicated by such asset. A valuation allowance related to a deferred tax asset is recorded when it is more likely than not that some portion or the entire deferred tax asset will not be realized. Based on our evaluation, we believe all of the deferred tax assets at December 31, 2010 are likely to be realized.
In July 2006, the FASB clarified the accounting for uncertainty in income taxes recognized in the financial statements. A tax benefit from an uncertain tax position may be recognized when it is more likely than not that the position will be sustained upon examination, including resolutions of any related appeals or litigation process, based on the technical merits.
Income tax positions must meet a more likely-than-not recognition threshold at the effective date to be recognized upon the adoption of new FASB guidance, and in subsequent periods. The interpretation also provides guidance on measurement, derecognition, classification, interest and penalties, accounting in interim periods, disclosure and transition. We adopted this FASB guidance effective January 1, 2007. Based on our evaluation, we have concluded that there are no significant uncertain tax positions requiring recognition on our financial statements.
Year Ended December 31, 2010 Compared to the Year Ended December 31, 2009 Revenues. Revenues of $130.5 million for fiscal year 2010 increased $23.2 million, or 21.6%, from $107.3 million for fiscal year 2009. Wireless revenues of $118.7 million increased $29.3 million, or 32.7%, primarily due to new connectivity and security product licenses of $16.5 million, increased visual voicemail and push-to-talk revenues of $8.4 million and new device solutions and multimedia revenues of $4.4 million. Productivity & Graphics sales decreased $5.6 million, or 33.0%, primarily due to unfavorable consumer spending trends. Corporate/Other sales decreased $0.5 million as we have de-emphasized this business. Cost of revenues. Cost of revenues of $15.5 million for fiscal year 2010 was essentially unchanged from fiscal year 2009. Direct product costs decreased $0.9 million primarily due to a shift in product mix and overhead cost reductions. The change in product mix was due to a decrease in sales of lower margin productivity and graphics products and an increase in sales of higher margin OEM license products. Amortization of intangibles increased from $4.9 million to $5.9 million, or $1.0 million, primarily due to the Core Mobility acquisition which closed in the fourth quarter of 2009. Stock-based compensation expense decreased from $0.2 million to $0.1 million, or $0.1 million. Gross profit. Gross profit of $115.0 million or 88.1% of revenues for fiscal year 2010 increased $23.2 million, or 25.3%, from $91.8 million, or 85.6% of revenues for fiscal year 2009. The 2.5 percentage point increase in gross profit was primarily due to improved product margins of 2.4 points as a result of the change in product mix mentioned above and overhead cost reductions and lower amortization of intangibles expense as a percentage of revenues of 0.1 points. Selling and marketing. Selling and marketing expenses of $29.7 million for fiscal year 2010 increased $4.7 million, or 18.8%, from $25.0 million for fiscal year 2009. This increase was primarily due to costs associated with headcount increases of $3.5 million, increased travel of $0.6 million and advertising and media relations related to our new product launches of $0.5 million. Stock-based compensation increased from $2.8 million to $3.1 million, or $0.3 million. Amortization of intangibles due to our acquisitions increased from $2.7 million to $3.0 million, or $0.3 million. These cost increases were partially offset by lower third party commissions on our reduced Productivity & Graphics revenues of $0.3 million and other expense decreases of $0.2 million. Research and development. Research and development expenses of $42.7 million for fiscal year 2010 increased $6.2 million, or 17.1%, from $36.5 million for fiscal year 2009. This increase was primarily due to increased personnel and recruiting costs associated with acquired and new hired headcount of $6.8 million, increased travel of $0.4

24
million and other expenses increasing by $0.1 million. These increases were partially offset by lower amortization of purchased technologies which decreased from $1.2 million to $0.1 million, or $1.1 million. Stock-based compensation remained flat year over year at $2.7 million. General and administrative. General and administrative expenses of $24.1 million for fiscal year 2010 increased $5.0 million, or 26.1%, from $19.1 million for fiscal year 2009. This increase was primarily due to an increase in space and occupancy costs as a result of our acquisition of Core Mobility and the expansion of our corporate headquarters campus of $1.9 million, acquired and new headcount of $1.1 million and increased depreciation of $0.5 million. Stock-based compensation increased from $4.1 million to $5.6 million, or $1.5 million. Interest and other income. Interest and other income of $0.1 million for fiscal year 2010 decreased $0.3 million from $0.4 million for fiscal year 2009. This decrease was due to lower interest and investment income realized from our short-term investments. Income tax expense. We recorded income tax expense for fiscal year 2010 in the amount of $6.2 million as a result of our pre-tax operating profit for the period and the relatively large amount of incentive stock option expense which is not deductible for tax purposes. The provision for income taxes was $6.7 million for fiscal year 2009. The lower effective tax rate in fiscal year 2010 as compared to fiscal year 2009 was primarily due to increased federal tax credits and higher disqualifying disposition deductions due to the exercise of stock options. We have federal and state net operating loss carryforwards of approximately $0.6 million and $7.3 million respectively, at December 31, 2010. Cash basis income taxes related to 2010 are estimated to be $5.1 million.
Year Ended December 31, 2009 Compared to the Year Ended December 31, 2008 Revenues. Revenues of $107.3 million for fiscal year 2009 increased $8.9 million, or 9.0%, from $98.4 million for fiscal year 2008. Wireless revenues of $89.4 million increased $16.2 million, or 22.1%, primarily due to new connectivity and security product OEM licenses of $24.4 million. These increases were partially offset by a $8.2 million decrease in revenues primarily due to a change in how our multimedia products were merchandised by our primary music customers, which changed from higher revenue, lower margin music kits (including software, cable and ear buds) to downloadable software or a software-only CD, resulting in lower revenue per unit but a much higher margin per unit. The first generation music product has now been phased out. Productivity & Graphics sales decreased $6.9 million, or 28.9%, primarily due to the continued consumer economic downturn. Corporate/Other sales decreased $0.4 million as we have de-emphasized this business. Cost of revenues. Cost of revenues of $15.5 million for fiscal year 2009 decreased $4.6 million, or 23.0%, from $20.1 million for fiscal year 2008. Direct product costs decreased $5.5 million primarily due to a shift in product mix and overhead cost reductions. The product mix was due to a decrease in sales of lower margin multimedia and productivity and graphics products and an increase of sales of higher margin OEM license products. Amortization of intangibles increased from $3.7 million to $4.9 million, or $1.2 million, primarily due to several small acquisitions made in the fourth quarter of 2008 resulting in amortization expense of $0.9 million and our acquisition of Core Mobility resulting in amortization expense of $0.3 million. Stock-based compensation expense decreased from $0.4 million to $0.1 million, or $0.3 million. Gross profit. Gross profit of $91.8 million or 85.6% of revenues for fiscal year 2009 increased $13.5 million, or 17.2%, from $78.3 million, or 79.6% of revenues for fiscal year 2008. The 6.0 percentage point increase in gross profit was primarily due to improved product margins of 6.5 points as a result of the change in product mix mentioned above and overhead cost reductions and lower stock-based compensation expense as a percentage of revenues of 0.3 points. These items were partially offset by higher amortization of intangibles due to several small acquisitions of 0.8 points. Selling and marketing. Selling and marketing expenses of $25.0 million for fiscal year 2009 increased $0.2 million, or 0.7%, from $24.8 million for fiscal year 2008. This increase was primarily due to costs associated with headcount increases of $1.1 million and higher amortization of intangibles due to our acquisitions which increased from $2.4 million to $2.7 million, or $0.3 million. These increases were partially offset by lower stock-based compensation which decreased from $3.7 million to $2.8 million, or $0.9 million, and reduced spending in all other areas of $0.3 million. Research and development. Research and development expenses of $36.5 million for fiscal year 2009 increased $5.7 million, or 18.6%, from $30.8 million for fiscal year 2008. This increase was primarily due to increased personnel and recruiting costs associated with acquired and new hired headcount of $6.1 million and other related expense increases of $0.3 million. These increases were partially offset by lower stock-based compensation which decreased from $3.4 million to $2.7 million, or $0.7 million. Amortization of purchased technologies remained flat year-over-year at $1.2 million. General and administrative. General and administrative expenses of $19.2 million for fiscal year 2009 decreased $0.8 million, or 4.2%, from $20.0 million for fiscal year 2008. This decrease was primarily due to lower stock-based compensation which decreased from $5.5 million to $4.1 million, or $1.4 million and reduced spending in all other

25
areas of $0.9 million. These decreases were partially offset by a $1.5 million increase in building rent, infrastructure and depreciation associated with our acquisitions and office expansions. Interest and other income. Interest and other income of $0.4 million for fiscal year 2009 decreased $0.3 million from $0.7 million for fiscal year 2008. This decrease was due to lower interest and investment income realized from our short-term investments. Income tax expense. We recorded income tax expense for fiscal year 2009 in the amount of $6.7 million as a result of our pre-tax operating profit for the period and the relatively large amount of incentive stock option expense which is not deductible for tax purposes. The provision for income taxes was $4.2 million for fiscal year 2008 as a result of our pre-tax operating profit for the period and the relatively large amount of incentive stock option expense which is not deductible for tax purposes. We began fiscal year 2009 with a net operating loss carryforward of approximately $1.2 million for Federal and $6.3 million for States. Cash basis income taxes related to 2009 were $3.3 million.
Liquidity and Capital Resources At December 31, 2010, we had $72.6 million in cash and cash equivalents and short-term investments and $94.6 million of working capital. On October 26, 2009, we acquired Core Mobility, Inc. (“Core Mobility”) for $10 million in cash ($6.9 million upon closing and $3.1 million held back as security against possible indemnification obligations but subsequently paid during 2010) and 700,000 shares of Smith Micro common stock.
On January 4, 2008, we acquired the Mobile Solutions Group of PCTEL at a cost of $60.9 million in cash which included $1.2 million of acquisition costs.
We currently anticipate that capital expenditures will not vary significantly from recent periods. We believe that our existing cash, cash equivalents, and short-term investment balances and cash flow from operations will be sufficient to finance our working capital and capital expenditure requirements through at least the next twelve months. We may require additional funds to support our working capital requirements or for other purposes and may seek to raise additional funds through public or private equity or debt financing or from other sources. If additional financing is needed, we cannot assure that such financing will be available to us at commercially reasonable terms or at all.
Operating Activities In 2010, net cash provided by operations was $24.7 million primarily due to our net income adjusted for depreciation, amortization, non-cash stock-based compensation, and inventory and accounts receivable reserves of $33.2 million, an increase of deferred tax liabilities net of $0.8 million, and a decrease in prepaid expenses of $0.3 million. These increases were partially offset by an increase of accounts receivable due to our increased revenue of $6.5 million, an increase in income tax receivable of $1.9 million and an increase of all other net assets of $1.2 million. In 2009, net cash provided by operations was $18.5 million primarily due to our net income adjusted for depreciation, amortization, non-cash stock-based compensation, and inventory and accounts receivable reserves of $25.8 million and a decrease in deferred income tax assets of $0.9 million. These increases were partially offset by an increase of accounts receivable due to our increased revenue of $6.0 million and an increase of all other net assets of $2.2 million. In 2008, net cash provided by operations was $16.4 million primarily due to our net loss adjusted for depreciation, amortization, non-cash stock-based compensation, and inventory and accounts receivable reserves of $21.2 million and a decrease in deferred income tax assets of $2.0 million. These increases were partially offset by an increase of accounts receivable due to our increased revenue of $6.6 million and an increase of all other net assets of $0.2 million.
Investing Activities In 2010, we used cash of $30.3 million for investing activities to purchase short-term investments of $23.4 million, capital expenditures which primarily were for leasehold improvements and to expand our datacenter of $6.3 million, and for the acquisition of Avot Media of $0.6 million. In 2009, we used cash of $20.4 million for investing activities to purchase short-term investments of $8.7 million, acquire Core Mobility for $6.9 million, and for capital expenditures which primarily were leasehold improvements, computers, and upgrading our data centers and business systems of $4.8 million.
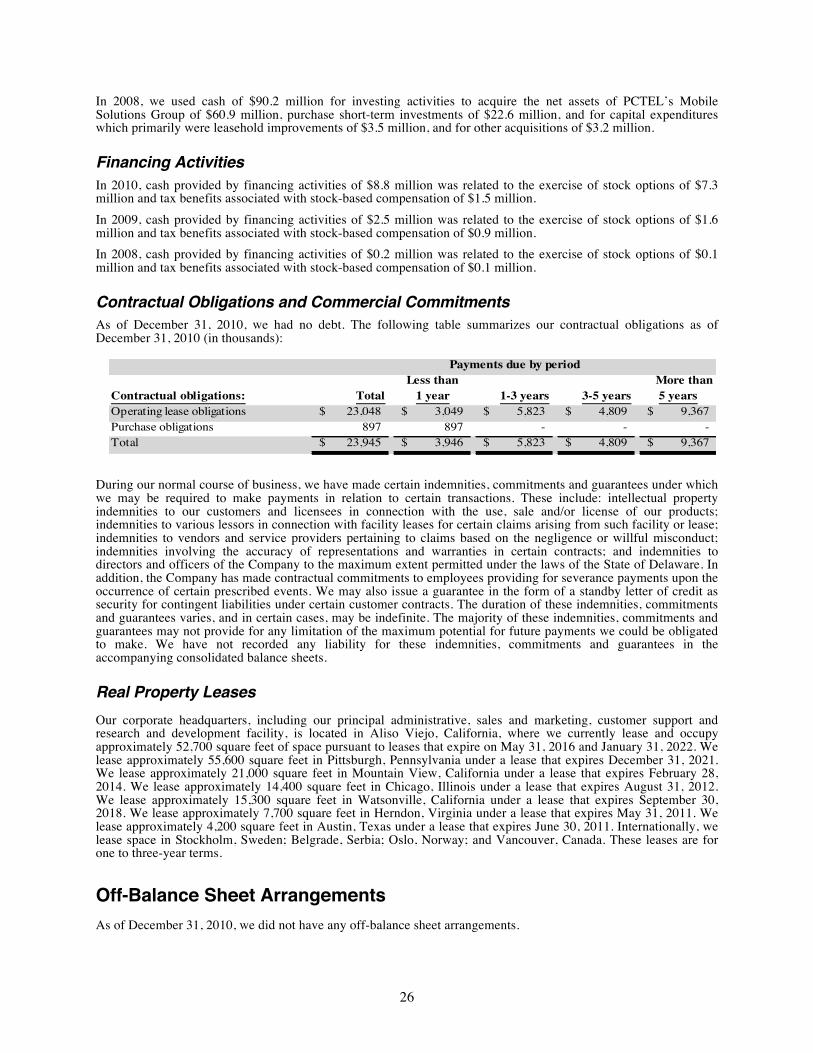
26
In 2008, we used cash of $90.2 million for investing activities to acquire the net assets of PCTEL’s Mobile Solutions Group of $60.9 million, purchase short-term investments of $22.6 million, and for capital expenditures which primarily were leasehold improvements of $3.5 million, and for other acquisitions of $3.2 million.
Financing Activities In 2010, cash provided by financing activities of $8.8 million was related to the exercise of stock options of $7.3 million and tax benefits associated with stock-based compensation of $1.5 million. In 2009, cash provided by financing activities of $2.5 million was related to the exercise of stock options of $1.6 million and tax benefits associated with stock-based compensation of $0.9 million. In 2008, cash provided by financing activities of $0.2 million was related to the exercise of stock options of $0.1 million and tax benefits associated with stock-based compensation of $0.1 million.
Contractual Obligations and Commercial Commitments As of December 31, 2010, we had no debt. The following table summarizes our contractual obligations as of December 31, 2010 (in thousands):
Less than More thanContractual obligations: Total 1 year 1-3 years 3-5 years 5 yearsOperating lease obligations 23,048$ 3,049$ 5,823$ 4,809$ 9,367$ Purchase obligations 897 897 - - -Total 23,945$ 3,946$ 5,823$ 4,809$ 9,367$
Payments due by period
During our normal course of business, we have made certain indemnities, commitments and guarantees under which we may be required to make payments in relation to certain transactions. These include: intellectual property indemnities to our customers and licensees in connection with the use, sale and/or license of our products; indemnities to various lessors in connection with facility leases for certain claims arising from such facility or lease; indemnities to vendors and service providers pertaining to claims based on the negligence or willful misconduct; indemnities involving the accuracy of representations and warranties in certain contracts; and indemnities to directors and officers of the Company to the maximum extent permitted under the laws of the State of Delaware. In addition, the Company has made contractual commitments to employees providing for severance payments upon the occurrence of certain prescribed events. We may also issue a guarantee in the form of a standby letter of credit as security for contingent liabilities under certain customer contracts. The duration of these indemnities, commitments and guarantees varies, and in certain cases, may be indefinite. The majority of these indemnities, commitments and guarantees may not provide for any limitation of the maximum potential for future payments we could be obligated to make. We have not recorded any liability for these indemnities, commitments and guarantees in the accompanying consolidated balance sheets.
Real Property Leases Our corporate headquarters, including our principal administrative, sales and marketing, customer support and research and development facility, is located in Aliso Viejo, California, where we currently lease and occupy approximately 52,700 square feet of space pursuant to leases that expire on May 31, 2016 and January 31, 2022. We lease approximately 55,600 square feet in Pittsburgh, Pennsylvania under a lease that expires December 31, 2021. We lease approximately 21,000 square feet in Mountain View, California under a lease that expires February 28, 2014. We lease approximately 14,400 square feet in Chicago, Illinois under a lease that expires August 31, 2012. We lease approximately 15,300 square feet in Watsonville, California under a lease that expires September 30, 2018. We lease approximately 7,700 square feet in Herndon, Virginia under a lease that expires May 31, 2011. We lease approximately 4,200 square feet in Austin, Texas under a lease that expires June 30, 2011. Internationally, we lease space in Stockholm, Sweden; Belgrade, Serbia; Oslo, Norway; and Vancouver, Canada. These leases are for one to three-year terms.
Off-Balance Sheet Arrangements As of December 31, 2010, we did not have any off-balance sheet arrangements.

27
Critical Accounting Policies and Estimates Our discussion and analysis of results of operations, financial condition and liquidity are based upon our consolidated financial statements, which have been prepared in accordance with accounting principles generally accepted in the United States of America. The preparation of these financial statements requires us to make estimates and judgments that affect the reported amounts of assets and liabilities and disclosure of contingent assets and liabilities at the date of the financial statements and the reported amounts of revenues and expenses during the reporting period. We base our estimates on historical experience and on various other assumptions that are believed to be reasonable under the circumstances. Actual results may materially differ from these estimates under different assumptions or conditions. On an on-going basis, we review our estimates to ensure that the estimates appropriately reflect changes in our business or new information as it becomes available.
We believe the following critical accounting policies affect our more significant estimates and assumptions used in the preparation of our consolidated financial statements:
Revenue Recognition We currently report our net revenues under two operating groups: Wireless and Productivity & Graphics. Within each of these groups software revenue is recognized based on the customer and contract type. We recognize revenue when persuasive evidence of an arrangement exists, delivery has occurred, the price is fixed and determinable, and collectability is probable as required by FASB ASC Topic No. 985-605, Software-Revenue Recognition. We recognize revenues from sales of our software to OEM customers or end users as completed products are shipped and titles passes; or from royalties generated as authorized customers duplicate our software, if the other requirements are met. If the requirements are not met at the date of shipment, revenue is not recognized until these elements are known or resolved. Returns from OEM customers are limited to defective goods or goods shipped in error. Historically, OEM customer returns have not exceeded the very nominal estimates and reserves. For Productivity & Graphics sales, management reviews available retail channel information and makes a determination of a return provision for sales made to distributors and retailers based on current channel inventory levels and historical return patterns. Certain sales to distributors or retailers are made on a consignment basis. Revenue for consignment sales are not recognized until sell through to the final customer is established. Within the Productivity & Graphics group certain revenues are booked net of revenue sharing payments. We have a few multiple element agreements for which we have contracted to provide a perpetual license for use of proprietary software, to provide non-recurring engineering, and in some cases to provide software maintenance (post contract support). For multiple element agreements, vendor specific objective evidence of fair value for all contract elements is reviewed and the timing of the individual element revenue streams is determined and recognized as required. Sales directly to end-users are recognized upon shipment. End users have a thirty day right of return, but such returns are reasonably estimable and have historically been immaterial. We also provide technical support to our customers. Such costs have historically been insignificant.
Sales Incentives For our Productivity & Graphics sales, the cost of sales incentives the Company offers without charge to customers that can be used in, or that are exercisable by a customer as a result of, a single exchange transaction is accounted for as a reduction of revenue as required by FASB ASC Topic No. 985-605, Software-Revenue Recognition. We use historical redemption rates to estimate the cost of customer incentives. Total sales incentives were $2.0 million, $1.2 million, and $0.8 million for the years ended December 31, 2010, 2009 and 2008, respectively.
Accounts Receivable and Allowance for Doubtful Accounts We sell our products worldwide. We perform ongoing credit evaluations of our customers and adjust credit limits based upon payment history, the customer’s current credit worthiness and various other factors, as determined by our review of their current credit information. We continuously monitor collections and payments from our customers. We estimate credit losses and maintain an allowance for doubtful accounts reserve based upon these estimates. While such credit losses have historically been within our estimated reserves, we cannot guarantee that we will continue to experience the same credit loss rates that we have in the past. If not, this could have an adverse effect on our consolidated financial statements.
Internal Software Development Costs Development costs incurred in the research and development of new software products and enhancements to existing software products are expensed as incurred until technological feasibility has been established. The Company considers technological feasibility to be established when all planning, designing, coding and testing has been completed according to design specifications. After technological feasibility is established, any additional costs

28
are capitalized. Through December 31, 2010, software has been substantially completed concurrently with the establishment of technological feasibility; accordingly, no costs have been capitalized to date.
In-Process Research and Development In 2009, we capitalized $1.0 million of IPR&D costs related to our acquisition of Core Mobility in accordance with accounting standards that became effective in 2009. This IPR&D project was completed during the fourth quarter of 2010. As such, amortization has commenced and will continue over its estimated useful life. The fair value of the IPR&D was determined using the discounted cash flow approach. The expected future cash flows were estimated and discounted to their net present values at an appropriate risk-adjusted rate of return. Significant factors considered in the calculation of the rate of return were the weighted average cost of capital and return on assets, as well as the risks inherent in the development process, including the likelihood of achieving technological success and market acceptance. Future cash flows were estimated based on forecasted revenue and costs, taking into account the expected product life cycle, market penetration and growth rates.
Capitalized Software and Amortization We capitalize internally developed software and software purchased from third parties if the related software product under development has reached technological feasibility or if there are alternative future uses for the purchased software as required by FASB ASC Topic No. 985-20, Software-Costs of Software to be Sold, Leased, or Marketed. These costs are amortized on a product-by-product basis, typically over an estimated life of five to seven years, using the larger of the amount calculated using the straight-line method or the amount calculated using the ratio between current period gross revenues and the total of current period gross revenues and estimated future gross revenues. At each balance sheet date, we evaluate on a product-by-product basis the unamortized capitalized cost of computer software compared to the net realizable value of that product. The amount by which the unamortized capitalized costs of a computer software product exceed its net realizable value is written off.
Intangible Assets and Amortization Amortization expense related to other intangibles acquired in previous acquisitions is calculated on a straight line basis over various useful lives.
Impairment or Disposal of Long Lived Assets Long-lived assets to be held are reviewed for events or changes in circumstances which indicate that their carrying value may not be recoverable. They are tested for recoverability using undiscounted cash flows to determine whether or not impairment to such value has occurred as required by FASB ASC Topic No. 360, Property, Plant, and Equipment. The Company has determined that there was no impairment at December 31, 2010.
Valuation of Goodwill and Intangible Assets The Company accounts for goodwill and intangible assets as required by FASB ASC Topic No. 350, Intangibles-Goodwill and Other. This statement requires us to periodically assess the impairment of our goodwill and intangible assets, which requires us to make assumptions and judgments regarding the carrying value of these assets. These assets are considered to be impaired if we determine that their carrying value may not be recoverable based upon our assessment of the following events or changes in circumstances:
• a determination that the carrying value of such assets cannot be recovered through undiscounted cash flows; • loss of legal ownership or title to the assets; • significant changes in our strategic business objectives and utilization of the assets; or • the impact of significant negative industry or economic trends.
If the intangible assets are considered to be impaired, the impairment we recognize is the amount by which the carrying value of the intangible assets exceeds the fair value of the intangible assets. In addition, we base the useful lives and the related amortization expense on our estimate of the useful life of the intangible assets. Due to the numerous variables associated with our judgments and assumptions relating to the carrying value of our intangible assets and the effects of changes in circumstances affecting these valuations, both the precision and reliability of the resulting estimates are subject to uncertainty, and as additional information becomes known, we may change our estimate, in which case, the likelihood of a material change in our reported results would increase. The Company has not recognized any impairment loss through December 31, 2010.

29
In accordance with FASB ASC Topic No. 350, Intangibles-Goodwill and Other, we review the recoverability of the carrying value of goodwill at least annually or whenever events or circumstances indicate a potential impairment. Our annual impairment testing date is December 31. Recoverability of goodwill is determined by comparing the estimated fair value of our reporting units to the carrying value of the underlying net assets in the reporting units. If the estimated fair value of a reporting unit is determined to be less than the fair value of its net assets, goodwill is deemed impaired and an impairment loss is recognized to the extent that the carrying value of goodwill exceeds the difference between the estimated fair value of the reporting unit and the fair value of its other assets and liabilities. We determined that we did not have any impairment of goodwill at December 31, 2010, 2009 or 2008. Estimates of reporting unit fair value are based upon market capitalization and therefore are volatile being sensitive to market fluctuations. To the extent that our market capitalization decreases significantly or the allocation of value to our reporting units change, we could be required to write off some or all of our goodwill.
Income Taxes We account for income taxes as required by FASB ASC Topic No. 740, Income Taxes. This statement requires the recognition of deferred tax assets and liabilities for the future consequences of events that have been recognized in our financial statements or tax returns. The measurement of the deferred items is based on enacted tax laws. In the event the future consequences of differences between financial reporting bases and the tax bases of our assets and liabilities result in a deferred tax asset, we are required to evaluate the probability of being able to realize the future benefits indicated by such asset. A valuation allowance related to a deferred tax asset is recorded when it is more likely than not that some portion or the entire deferred tax asset will not be realized. The Company’s net deferred tax assets were not reduced by a tax valuation allowance at December 31, 2010. Management evaluated the positive and negative evidence in determining the realizability of the net deferred tax assets at December 31, 2010 and concluded it is more likely than not that the Company should realize its net deferred tax assets through future operating results and the reversal of taxable temporary differences. In July 2006, the FASB clarified the accounting for uncertainty in income taxes recognized in the financial statements. A tax benefit from an uncertain tax position may be recognized when it is more likely than not that the position will be sustained upon examination, including resolutions of any related appeals or litigation process, based on the technical merits. Income tax positions must meet a more likely-than-not recognition threshold at the effective date to be recognized upon the adoption of new FASB guidance, and in subsequent periods. The interpretation also provides guidance on measurement, derecognition, classification, interest and penalties, accounting in interim periods, disclosure and transition. We adopted this FASB guidance effective January 1, 2007. Based on our evaluation, we have concluded that there are no significant uncertain tax positions requiring recognition on our financial statements.
Stock-Based Compensation The Company accounts for all stock-based payment awards made to employees and directors based on their fair values and recognized as compensation expense over the vesting period using the straight-line method over the requisite service period for each award as required by FASB ASC Topic No. 718, Compensation-Stock Compensation.
Recent Accounting Pronouncements In February 2010, the FASB issued Accounting Standards Update (“ASU”) No. 2010-09, Subsequent Events (Topic 855): Amendments to Certain Recognition and Disclosure Requirements. This guidance states that an entity that is an SEC filer is required to evaluate subsequent events through the date that the financial statements are issued. As such, an entity that is an SEC filer is not required to disclose the date through which subsequent events have been evaluated. This change alleviates potential conflicts between Subtopic 855-10 and the SEC’s requirements. The guidance has become effective for the interim or annual reporting periods after June 15, 2010. The Company adopted this guidance on its effective date and it did not have an impact on its consolidated results of operations and financial condition. In January 2010, the FASB issued ASU No. 2010-06, Fair Value Measurements and Disclosures (Topic 820): Improving Disclosures about Fair Value Measurements. This guidance amends the disclosure requirements related to recurring and nonrecurring fair value measurements and requires new disclosures on the transfers of assets and liabilities between Level 1 (quoted prices in active market for identical assets or liabilities) and Level 2 (significant other observable inputs) of the fair value measurement hierarchy, including the reasons and the timing of the transfers. Additionally, the guidance requires a roll forward of activities on purchases, sales, issuance and settlements of the assets and liabilities measured using significant unobservable inputs (Level 3 fair value measurements). The guidance has become effective for the reporting period beginning January 1, 2010, except for the disclosure on the roll forward activities for Level 3 fair value measurements, which will become effective for the reporting period beginning January 1, 2011. The Company adopted this guidance on its effective date and since it
30
currently only has Level 1 assets and liabilities, it did not have an impact on its consolidated results of operations and financial condition. In December 2009, the FASB issued ASU No. 2009-17, Consolidations (Topic 810): Improvements to Financial Reporting by Enterprises Involved with Variable Interest Entities. This new guidance addresses (1) the effects on certain provisions of Financial Accounting Standards Board Interpretation (“FIN”) No. 46 (revised December 2003), Consolidation of Variable Interest Entities, as a result of the elimination of the qualifying special-purpose entity concept in SFAS No. 166, Accounting for Transfers of Financial Assets, and (2) constituent concerns about the application of certain key provisions of FIN No. 46(R), including those in which the accounting and disclosures under the Interpretation do not always provide timely and useful information about an enterprise’s involvement in a variable interest entity. This Statement shall be effective as of the beginning of each reporting entity’s first annual reporting period that begins after November 15, 2009, for interim periods within that first annual reporting period, and for interim and annual reporting periods thereafter. Earlier application is prohibited. The Company adopted ASU No. 2009-17 this year and its adoption did not have an impact on its consolidated results of operations and financial condition. In December 2009, the FASB issued ASU No. 2009-16, Transfers and Servicing (Topic 860): Accounting for Transfers of Financial Assets. This guidance was issued to improve the relevance, representational faithfulness, and comparability of the information that a reporting entity provides in its financial statements about a transfer of financial assets; the effects of a transfer on its financial position, financial performance, and cash flows; and a transferor’s continuing involvement, if any, in transferred financial assets. This Statement must be applied as of the beginning of each reporting entity’s first annual reporting period that begins after November 15, 2009, for interim periods within that first annual reporting period and for interim and annual reporting periods thereafter. Earlier application is prohibited. This Statement must be applied to transfers occurring on or after the effective date. The Company adopted ASU No. 2009-16 this year and its adoption did not have an impact on its consolidated results of operations and financial condition. In October 2009, the FASB issued ASU No. 2009-14, Software (Topic 985): Certain Revenue Arrangements That Include Software Elements (a consensus of the FASB Emerging Issues Task Force). This new guidance amends the scope of existing software revenue recognition accounting. Tangible products containing software components and non-software components that function together to deliver the product’s essential functionality would be scoped out of the accounting guidance on software and accounted for based on other appropriate revenue recognition guidance. For the Company, this guidance is effective for all new or materially modified arrangements entered into on or after January 1, 2011 with earlier application permitted as of the beginning of a fiscal year. Full retrospective application of the new guidance is optional. This guidance must be adopted in the same period that the company adopts the amended accounting for arrangements with multiple deliverables described in the preceding paragraph. The Company is currently assessing its implementation of this new guidance, but does not expect a material impact on the consolidated financial statements. In October 2009, the FASB issued ASU No. 2009-13, Revenue Recognition (Topic 605): Multiple-Deliverable Revenue Arrangements. ASU No. 2009-13 amends revenue recognition guidance for arrangements with multiple deliverables. The new guidance eliminates the residual method of revenue recognition and allows the use of management’s best estimate of selling price for individual elements of an arrangement when vendor specific objective evidence (“VSOE”), vendor objective evidence (“VOE”) or third-party evidence (“TPE”) is unavailable. For the Company, this guidance is effective for all new or materially modified arrangements entered into on or after January 1, 2011 with earlier application permitted as of the beginning of a fiscal year. Full retrospective application of the new guidance is optional. The Company is currently assessing its implementation of this new guidance, but does not expect a material impact on the consolidated financial statements.
Item 7A. QUANTITATIVE AND QUALITATIVE DISCLOSURES ABOUT MARKET RISK
Interest Rate Risk Our financial instruments include cash and cash equivalents, and short-term investments. At December 31, 2010, the carrying values of our financial instruments approximated fair values based on current market prices and rates.

31
Foreign Currency Risk While a majority of our business is denominated in U.S. dollars, we do occasionally invoice in foreign currencies. For the three years ended December 31, 2010, 2009 and 2008, our revenues denominated in foreign currencies were $1.7 million, $1.6 million, and $1.8 million, respectively. Fluctuations in the rate of exchange between the U.S. dollar and certain other currencies may affect our results of operations and period-to-period comparisons of our operating results. We do not currently engage in hedging or similar transactions to reduce these risks. The operational expenses of our foreign entities reduce the currency exposure we have because our foreign currency revenues are offset in part by expenses payable in foreign currencies. As such, we do not believe we have a material exposure to foreign currency rate fluctuations at this time.
Item 8. FINANCIAL STATEMENTS AND SUPPLEMENTARY DATA Our consolidated financial statements and schedule appear in a separate section of this Annual Report on Form 10-K beginning on page F-1 and S-1, respectively.
Item 9. CHANGES IN AND DISAGREEMENTS WITH ACCOUNTANTS ON ACCOUNTING AND FINANCIAL DISCLOSURE None.
Item 9A. CONTROLS AND PROCEDURES
Evaluation of Disclosure Controls and Procedures We conducted an evaluation under the supervision and with the participation of our management, including our Chief Executive Officer and Chief Financial Officer, of the effectiveness of the design and operation of our disclosure controls and procedures (as defined in Rules 13a-15(e) under the Securities Exchange Act of 1934 (“Exchange Act”)) as of December 31, 2010. Based upon that evaluation, our Chief Executive Officer and Chief Financial Officer have determined that as of December 31, 2010, our disclosure controls and procedures were effective to ensure that the information required to be disclosed in our Exchange Act reports is recorded, processed, summarized and reported within the time periods specified in the Securities and Exchange Commission’s rules and forms, and that such information is accumulated and communicated to our management, including our Chief Executive Officer and Chief Financial Officer, as appropriate, to allow timely decisions regarding required disclosure. In designing and evaluating the disclosure controls and procedures, our management recognizes that any controls and procedures, no matter how well designed and operated, can provide only reasonable assurance of achieving the desired control objectives, and our management necessarily is required to apply its judgment in evaluating the cost-benefit relationship of possible controls and procedures.
Managementʼs Responsibility for Financial Statements Our management is responsible for the integrity and objectivity of all information presented in this report. The consolidated financial statements were prepared in conformity with accounting principles generally accepted in the United States of America and include amounts based on management’s best estimates and judgments. Management believes the consolidated financial statements fairly reflect the form and substance of transactions and that the financial statements fairly represent the Company’s financial position and results of operations for the periods and as of the dates stated therein.
The Audit Committee of the Board of Directors, which is composed solely of independent directors, meets regularly with our independent registered public accounting firm, SingerLewak LLP, and representatives of management to review accounting, financial reporting, internal control and audit matters, as well as the nature and extent of the audit effort. The Audit Committee is responsible for the engagement of the independent auditors. The independent auditors have free access to the Audit Committee.
32
Changes in Internal Control over Financial Reporting There have been no changes in our internal controls over financial reporting during the quarter ended December 31, 2010 that have materially affected, or is reasonably likely to materially affect, our internal controls over financial reporting.
Report of Management on Internal Control Over Financial Reporting Our management, including the Chief Executive Officer and Chief Financial Officer, is responsible for establishing and maintaining adequate internal control over financial reporting (as defined in Rules 13a-15(f) and 15d-15(f) under the Securities Exchange Act of 1934).
Our management, including the Chief Executive Officer and Chief Financial Officer, assessed the effectiveness of our internal control over financial reporting as of December 31, 2010. Management based this assessment on criteria for effective internal control over financial reporting described in “Internal Control—Integrated Framework” issued by the Committee of Sponsoring Organizations of the Treadway Commission.
Based on this assessment, management determined that, as of December 31, 2010, we maintained effective internal control over financial reporting.
SingerLewak LLP, an independent registered public accounting firm, who audited the consolidated financial statements included in this Annual Report on Form 10-K, has also audited the effectiveness of our internal control over financial reporting as stated in its report appearing elsewhere in this Annual Report on Form 10-K.
Item 9B. OTHER INFORMATION None.

33
PART III
Item 10. DIRECTORS, EXECUTIVE OFFICERS AND CORPORATE GOVERNANCE The following table sets forth certain information regarding our executive officers and certain key officers as of February 18, 2011:
Name Age Position William W. Smith, Jr. 63 Chairman of the Board, President and Chief Executive Officer Andrew C. Schmidt 49 Vice President and Chief Financial Officer Von Cameron 47 Executive Vice President – Worldwide Sales Rick Carpenter 48 Vice President and General Manager - Wireless Robert E. Elliott 59 Vice President and Chief Marketing Officer Jonathan Kahn 53 Executive Vice President – Productivity & Graphics Chris G. Lippincott 39 Vice President – Worldwide Operations Thomas P Matthews 53 Senior Vice President and Chief Strategy Officer David P. Sperling 42 Vice President and Chief Technology Officer Steven M. Yasbek 57 Chief Accounting Officer
Mr. Smith co-founded Smith Micro and has served as the Chairman of the Board, President and Chief Executive Officer since inception in 1982. Mr. Smith was employed by Rockwell International Corporation in a variety of technical and management positions from 1975 to 1984. Mr. Smith served with Xerox Data Systems from 1972 to 1975 and RCA Computer Systems Division from 1969 to 1972 in mainframe sales and pre-sale technical roles. Mr. Smith received a B.A. in Business Administration from Grove City College.
Mr. Schmidt joined the Company in June 2005 and serves as the Company’s Chief Financial Officer. Prior to joining Smith Micro, Mr. Schmidt was the Chief Financial Officer of Genius Products, Inc., a publicly traded entertainment company from August 2004 to June 2005. From April 2003 to June 2004, he was Vice President (Finance) and acting Chief Accounting Officer of Peregrine Systems, Inc., a publicly held provider of enterprise level software then in Chapter 11 reorganization. From July 2000 to January 2003, he was Executive Vice President and Chief Financial Officer of Mad Catz Interactive, Inc., a publicly traded provider of console video game accessories. He holds a B.B.A. in Finance from the University of Texas and an M.S. in Accountancy from San Diego State University.
Mr. Cameron joined the Company in April of 2008 as the Executive Vice President of Worldwide Sales. Mr. Cameron has held executive management positions with Openwave, Oracle, FoxT and Booz Allen & Hamilton. Mr. Cameron served proudly in the United States Air Force and earned his B.S. in Math–Operations Research from the United States Air Force Academy in Colorado, Springs, CO and an M.B.A. from Golden Gate University in San Francisco, California.
Mr. Carpenter joined the Company in May of 2009 as the Vice President of Engineering for the Company’s Connectivity & Security Business Unit and currently serves as the Vice President and General Manager of the Wireless Business Unit. Prior to joining Smith Micro, Mr. Carpenter served as a Vice President of Engineering at NextWave Wireless where he was responsible for WiMAX chipset development. From 2000 to 2005, he was Director of Software Engineering for CDMA products at AirPrime, which was ultimately acquired by Sierra Wireless. Mr. Carpenter has also held engineering management positions at Motorola and DENSO Wireless and started his professional career in May of 1986. He holds a BS in Computer Science from the University of Texas, Permian Basin and studied Masters-level Computer Science & Engineering at the University of Texas Arlington.
Mr. Elliott joined the Company in May of 1999 and soon after was appointed General Manager of Smith Micro's Mac Division, then later as Vice President of Corporate Marketing and Chief Marketing Officer, which he has held to date. An experienced technology and marketing leader with over fifteen years of executive level experience managing business units in the information technology industry, he has held executive level positions with Informix Software, DataStorm Technologies and QuarterDeck Corporation. Mr. Elliott is a graduate of Northwood University, Midland, Michigan.

34
Mr. Kahn joined the Company with the acquisition of Allume Systems, Inc. in July 2005. Prior to the acquisition, Mr. Kahn was President of the company. Mr. Kahn was one of the co-founders of Aladdin Systems, Inc. which later became Allume Systems. Mr. Kahn was Chairman, President and Chief Executive Officer of Monterey Bay Tech, Inc (OTC BB:MBYI), a public company from 1999 to May 2005 until its merger with SecureLogic Inc. Mr. Kahn is a member of the Digital River Advisory Board and is a graduate of the University of Rhode Island with a B.A. in Economics. Mr. Kahn assumed the position as Executive Vice President – Productivity & Graphics in late 2009.
Mr. Lippincott joined the Company in February of 1993. From 1993 to 2000, Mr. Lippincott held various sales positions within the company including Director of OEM Sales, Director of Retail Sales and Vice President of Enterprise Sales. In 2000, Mr. Lippincott began serving as General Manager of the company’s Internet Solutions Division, until 2004 when he accepted the role of Vice President, Worldwide Operations. Mr. Lippincott attended the University of California, Berkeley studying Business Administration. Mr. Matthews joined the Company in February 2007 with the acquisition of Ecutel Systems where he served as the President and CEO of this leading provider of Mobile VPN and wireless security software. As President and CEO of Inciscent, he created and launched "SkyBox Mail," the first wireless e-mail application to allow users to open and view their file attachments on handheld mobile devices. Mr. Matthews has served in several executive roles at Metrocall, the nation's second largest wireless messaging operator, as Senior Vice President of Corporate and Business Development, Senior Vice President of Operations and President at Metrocall.net where he was responsible for corporate strategy, M&A, operations, sales and marketing. Prior to this, Mr. Matthews served as the General Manager for Smith Micro's Connectivity and Security division, the Company's largest business unit. Mr. Matthews earned a degree in Electronic Communications from Western Illinois University.
Mr. Sperling joined the Company in April 1989 and has been the Director of Software Engineering since April 1992. He assumed the Chief Technology Officer position in September 1999. Mr. Sperling began his professional career as a software engineer with us and he currently has two patents and three patents pending for various telephony and Internet technologies. Mr. Sperling holds a B.S. degree in Computer Science and an MBA from the University of California, Irvine.
Mr. Yasbek joined the Company in May of 2008 as the Chief Accounting Officer. Mr. Yasbek has held executive finance and information technology positions with REMEC, Paradigm Wireless Systems, Intellisys Group, Pacific Scientific Company, Symbol Technologies, TRW, and most recently as Chief Financial Officer of Alphatec Spine. He holds a B.S. in Accounting and M.B.A from Loyola Marymount University, and is a Certified Public Accountant.
Officers are elected by, and serve at the discretion of, the Board of Directors.
For information about our Directors, please see the section titled “Directors and Executive Officers” appearing in our Proxy Statement for our 2011 Annual Meeting of Stockholders, which is hereby incorporated by reference.
The section titled “Corporate Governance” appearing in our Proxy Statement for our 2011 Annual Meeting of Stockholders is hereby incorporated by reference.
Audit Committee; Audit Committee Financial Expert Our Board of Directors has a standing Audit Committee. The members of the Audit Committee are Messrs. Campbell, Gulko and Keiper. Our Board has determined that Mr. Gulko, Chairman of the Audit Committee, is an audit committee financial expert as defined by Item 401(h) of Regulation S-K and that each member of the Audit Committee is independent within the meaning of Nasdaq Marketplace Rule 4200(a)(15).
Section 16(a) Beneficial Ownership Reporting Compliance Section 16(a) of the Exchange Act requires certain of the company’s executive officers, as well as its directors and persons who own more than ten percent (10%) of a registered class of the Company’s equity securities to file reports of ownership and changes in ownership with the Securities and Exchange Commission.
Based solely on its review of the copies of such forms received by the Company, or written representations from certain reporting persons, the Company believes that all filing requirements applicable to our executive officers, directors and more than 10% stockholders were met in a timely manner in 2010.

35
Code of Ethics We have adopted a Code of Ethics that applies to all of our employees, including our principal executive officer, our principal financial officer, and all members of our finance department performing similar functions. Our Code of Ethics was filed as Exhibit 14 to the Annual Report on Form 10-K for the year ended December 31, 2003 which was filed on March 25, 2004. In the event of an amendment to, or a waiver from, certain provisions of our Code of Ethics, we intend, to the extent possible, to satisfy Form 8-K disclosure requirements by disclosing this information on our website at www.smithmicro.com.
Item 11. EXECUTIVE COMPENSATION The section titled “Executive Compensation and Related Information” appearing in our Proxy Statement for our 2011 Annual Meeting of Stockholders is hereby incorporated by reference.
Item 12. SECURITY OWNERSHIP OF CERTAIN BENEFICIAL OWNERS AND MANAGEMENT AND RELATED STOCKHOLDER MATTERS The section titled “Ownership of Securities and Related Stockholder Matters” appearing in our Proxy Statement for our 2011 Annual Meeting of Stockholders is hereby incorporated by reference.
Securities Authorized for Issuance Under An Equity Compensation Plan The following table provides information as of December 31, 2010 with respect to the shares of common stock that may be issued under our existing equity compensation plans:
(in thousands, except per share amounts)Number of shares to be issued upon exercise of
outstanding options
Weighted average exercise price of
outstanding options
Number of shares remaining available for future issuance
Equity compensation plan approved by shareholders (1) 2,706 $11.69 1,466
Equity compensation plan not approved by shareholders - - -
Total 2,706 $11.69 1,466
(1) The number of shares to be issued upon exercise includes options granted under both the 1995 Stock Option/Stock Issuance Plan and the 2005 Stock Option/Stock Issuance Plan. The number of shares remaining available for future issuance consists only of the 2005 Plan.
Item 13. CERTAIN RELATIONSHIPS AND RELATED TRANSACTIONS, AND DIRECTOR INDEPENDENCE The section titled “Related Party Transactions” and “Director Independence” appearing in our Proxy Statement for our 2011 Annual Meeting of Stockholders is incorporated herein by reference.

36
Item 14. PRINCIPAL ACCOUNTING FEES AND SERVICES The section titled “Ratification of Appointment of Independent Registered Public Accounting Firm – Principal Accountant Fees and Services” appearing in our Proxy Statement for our 2011 Annual Meeting of Stockholders is incorporated herein by reference.
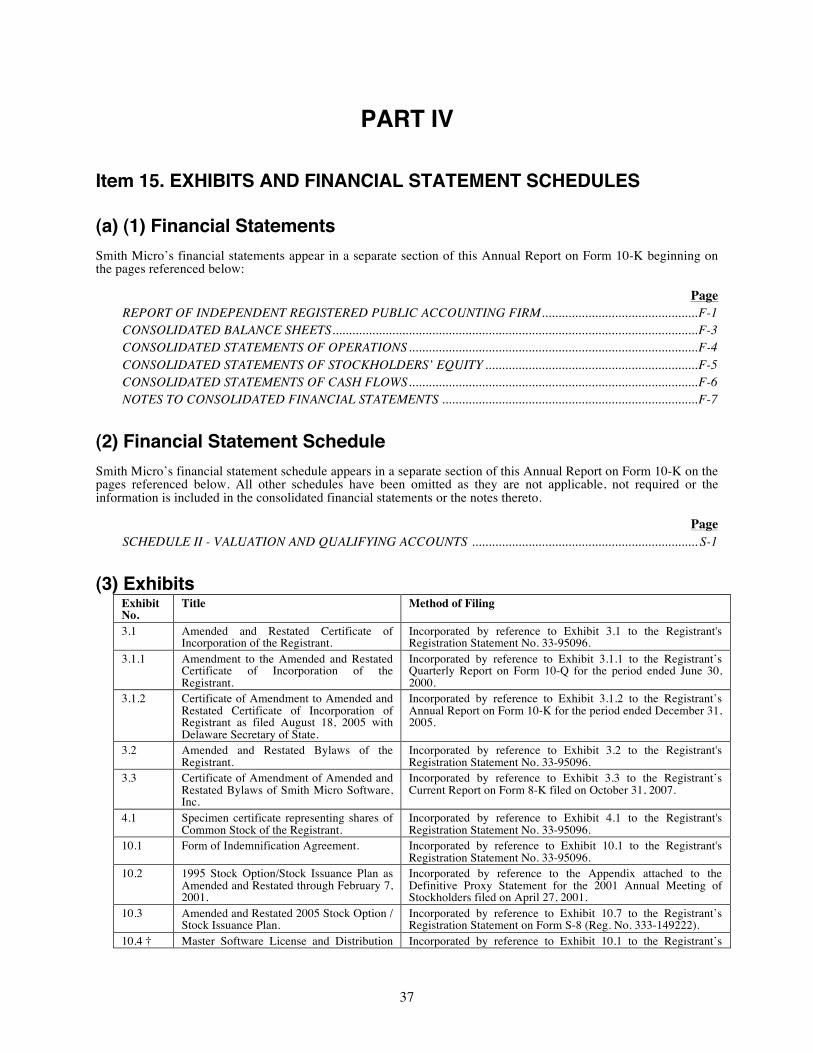
37
PART IV
Item 15. EXHIBITS AND FINANCIAL STATEMENT SCHEDULES
(a) (1) Financial Statements Smith Micro’s financial statements appear in a separate section of this Annual Report on Form 10-K beginning on the pages referenced below:
Page REPORT OF INDEPENDENT REGISTERED PUBLIC ACCOUNTING FIRM ............................................... F-1 CONSOLIDATED BALANCE SHEETS .............................................................................................................. F-3 CONSOLIDATED STATEMENTS OF OPERATIONS ....................................................................................... F-4 CONSOLIDATED STATEMENTS OF STOCKHOLDERS’ EQUITY ................................................................ F-5 CONSOLIDATED STATEMENTS OF CASH FLOWS ....................................................................................... F-6 NOTES TO CONSOLIDATED FINANCIAL STATEMENTS ............................................................................. F-7
(2) Financial Statement Schedule Smith Micro’s financial statement schedule appears in a separate section of this Annual Report on Form 10-K on the pages referenced below. All other schedules have been omitted as they are not applicable, not required or the information is included in the consolidated financial statements or the notes thereto.
Page SCHEDULE II - VALUATION AND QUALIFYING ACCOUNTS .................................................................... S-1
(3) Exhibits Exhibit No.
Title Method of Filing
3.1 Amended and Restated Certificate of Incorporation of the Registrant.
Incorporated by reference to Exhibit 3.1 to the Registrant's Registration Statement No. 33-95096.
3.1.1 Amendment to the Amended and Restated Certificate of Incorporation of the Registrant.
Incorporated by reference to Exhibit 3.1.1 to the Registrant’s Quarterly Report on Form 10-Q for the period ended June 30, 2000.
3.1.2 Certificate of Amendment to Amended and Restated Certificate of Incorporation of Registrant as filed August 18, 2005 with Delaware Secretary of State.
Incorporated by reference to Exhibit 3.1.2 to the Registrant’s Annual Report on Form 10-K for the period ended December 31, 2005.
3.2 Amended and Restated Bylaws of the Registrant.
Incorporated by reference to Exhibit 3.2 to the Registrant's Registration Statement No. 33-95096.
3.3 Certificate of Amendment of Amended and Restated Bylaws of Smith Micro Software, Inc.
Incorporated by reference to Exhibit 3.3 to the Registrant’s Current Report on Form 8-K filed on October 31, 2007.
4.1 Specimen certificate representing shares of Common Stock of the Registrant.
Incorporated by reference to Exhibit 4.1 to the Registrant's Registration Statement No. 33-95096.
10.1 Form of Indemnification Agreement. Incorporated by reference to Exhibit 10.1 to the Registrant's Registration Statement No. 33-95096.
10.2 1995 Stock Option/Stock Issuance Plan as Amended and Restated through February 7, 2001.
Incorporated by reference to the Appendix attached to the Definitive Proxy Statement for the 2001 Annual Meeting of Stockholders filed on April 27, 2001.
10.3 Amended and Restated 2005 Stock Option / Stock Issuance Plan.
Incorporated by reference to Exhibit 10.7 to the Registrant’s Registration Statement on Form S-8 (Reg. No. 333-149222).
10.4 † Master Software License and Distribution Incorporated by reference to Exhibit 10.1 to the Registrant’s

38
Exhibit No.
Title Method of Filing
Agreement (Contract No. 220-00-0134) effective as of December 1, 2000, between Cellco Partnership (d/b/a Verizon Wireless) and the Registrant.
Quarterly Report on Form 10-Q for the quarter ended June 30, 2003.
10.4.1† Amendment of Master Software License and Distribution Agreement (Contract No. 220-00-0134).
Incorporated by reference to Exhibit 10.1.1 to the Registrant’s Quarterly Report on Form 10-Q for the quarter ended June 30, 2003.
10.4.2†
Amendment No. 2 to the Master Software License and Distribution Agreement (Contract No. 220-00-0134).
Incorporated by reference to Exhibit 10.1.2 to the Registrant’s Quarterly Report on Form 10-Q for the quarter ended June 30, 2003.
10.4.3†
Amendment No. 6 to the Master Software License and Distribution Agreement (Contract No. 220-00-0134).
Incorporated by reference to Exhibit 10.4.3 to the Registrant’s Annual Report on Form 10-K for the year ended December 31, 2009.
10.4.4†
Amendment No. 7 to the Master Software License and Distribution Agreement (Contract No. 220-00-0134).
Incorporated by reference to Exhibit 10.4.4 to the Registrant’s Annual Report on Form 10-K for the year ended December 31, 2009.
10.4.5†
Amendment No. 9 to the Master Software License and Distribution Agreement (Contract No. 220-00-0134).
Incorporated by reference to Exhibit 10.4.5 to the Registrant’s Annual Report on Form 10-K for the year ended December 31, 2009.
10.5 Letter Agreement, dated June 13, 2005, by and between Smith Micro Software, Inc. and Andrew Schmidt.
Incorporated by reference to Exhibit 10.5 to the Registrant’s Current Report on Form 8-K filed on November 30, 2006.
10.6 Employment Agreement dated April 9, 1999 by and between Smith Micro Software, Inc. and William Wyand.
Incorporated by reference to Exhibit 10.6 to the Registrant’s Current Report on Form 8-K filed on November 30, 2006.
10.7 Executive Employment Agreement dated July 1, 2005 by and between Smith Micro Software, Inc. and Jonathan Kahn.
Incorporated by reference to Exhibit 10.9 to the Registrant’s Annual Report on Form 10-K/A for the year ended December 31, 2007, filed on April 29, 2008.
10.8 Summary of oral agreement dated June 2005 by and between William W. Smith, Jr. and the Registrant.
Incorporated by reference to Exhibit 10.10 to the Registrant’s Quarterly Report on Form 10-Q for the quarter ended June 30, 2009.
10.9
Amended & Restated Employee Stock Purchase Plan.
Incorporated by reference to Exhibit 10.11 to the Registrant’s Registration Statement on Form S-8 (No. 333-169671) filed on September 30, 2010.
14.1 Code of Ethics. Incorporated by reference to Exhibit 14.1 to the Registrant’s Annual Report on Form 10-K for the year ended December 31, 2003.
14.1.1 Attachment 1 to Code of Ethics. Incorporated by reference to Exhibit 14.1 to the Registrant’s Annual Report on Form 10-K for the year ended December 31, 2003.
21.1 Subsidiaries. Filed herewith. 23.1 Consent of Independent Registered Public
Accounting Firm. Filed herewith.
31.1 Certification of the Chief Executive Officer pursuant to Section 302 of the Sarbanes-Oxley Act of 2002.
Filed herewith.
31.2 Certification of the Chief Financial Officer pursuant to Section 302 of the Sarbanes-Oxley Act of 2002.
Filed herewith.
32.1 Certifications of the Chief Executive Officer and the Chief Financial Officer pursuant to Section 906 of the Sarbanes-Oxley Act of 2002.
Furnished herewith.
† Confidential treatment has been granted with respect to certain confidential portions of this exhibit pursuant to Rule 24b-2 under the Securities Exchange Act of 1934, which confidential portions have been omitted from the exhibit and filed separately with the Securities and Exchange Commission.
(b) Exhibits

39
The exhibits filed as part of this report are listed above in Item 15(a) (3) of this Form 10-K. (c) Financial Statement Schedule The Financial Statement Schedule required by Regulation S-X and Item 8 of this Form are listed above in Item 15(a)(2) of this Form 10-K.

40
SIGNATURES Pursuant to the requirements of Section 13 or 15(d) of the Securities Exchange Act of 1934, the registrant has duly caused this report to be signed on its behalf by the undersigned thereunto duly authorized.
SMITH MICRO SOFTWARE, INC.
Date: February 25, 2011 By:/s/ William W. Smith, Jr. William W. Smith, Jr. Chairman of the Board, President and Chief Executive Officer (Principal Executive Officer) Date: February 25, 2011 By:/s/ Andrew C. Schmidt Andrew C. Schmidt, Vice President and Chief Financial Officer (Principal Financial and Accounting Officer)
Pursuant to the requirements of the Securities Exchange Act of 1934, this report has been signed below by the following persons on behalf of the registrant and in the capacities and on the dates indicated.
Signature Title Date /s/ William W. Smith, Jr. William W. Smith, Jr.
Chairman of the Board, President and Chief Executive Officer (Principal Executive Officer)
February 25, 2011
/s/ Andrew C. Schmidt Andrew C. Schmidt
Vice President and Chief Financial Officer (Principal Financial and Accounting Officer)
February 25, 2011
/s/ Thomas G. Campbell Thomas G. Campbell
Director February 25, 2011
/s/ Samuel Gulko Samuel Gulko
Director February 25, 2011
/s/ Ted L. Hoffman Ted L. Hoffman
Director February 25, 2011
/s/ William C. Keiper William C. Keiper
Director February 25, 2011
/s/ James Straight James Straight
Director February 25, 2011

F-1
REPORT OF INDEPENDENT REGISTERED PUBLIC ACCOUNTING FIRM
To the Board of Directors and Stockholders Smith Micro Software, Inc.
We have audited the accompanying consolidated balance sheets of Smith Micro Software, Inc. and subsidiaries (collectively, the “Company”) as of December 31, 2010 and 2009, and the related consolidated statements of operations, stockholders’ equity and cash flows for each of the three years in the period ended December 31, 2010. Our audits also included the financial statement schedule of the Company listed in Item 15(a)(2). These financial statements and financial statement schedule are the responsibility of the Company’s management. Our responsibility is to express an opinion on these financial statements based on our audits.
We conducted our audits in accordance with the standards of the Public Company Accounting Oversight Board (United States). Those standards require that we plan and perform the audit to obtain reasonable assurance about whether the financial statements are free of material misstatement. An audit includes examining, on a test basis, evidence supporting the amounts and disclosures in the financial statements. An audit also includes assessing the accounting principles used and significant estimates made by management, as well as evaluating the overall financial statement presentation. We believe that our audits provide a reasonable basis for our opinion.
In our opinion, the consolidated financial statements referred to above present fairly, in all material respects, the financial position of the Company as of December 31, 2010 and 2009, and the results of their operations and their cash flows for each of the three years in the period ended December 31, 2010, in conformity with U. S. generally accepted accounting principles. Also, in our opinion, the related financial statement schedule, when considered in relation to the basic consolidated financial statements taken as a whole, presents fairly, in all material respects, the information set forth therein.
We also have audited, in accordance with the standards of the Public Company Accounting Oversight Board (United States), the Company’s internal control over financial reporting as of December 31, 2010, based on criteria established in Internal Control — Integrated Framework issued by the Committee of Sponsoring Organizations of the Treadway Commission and our report dated February 25, 2011 expressed an unqualified opinion on the effectiveness of the Company’s internal control over financial reporting.
/s/ SINGERLEWAK LLP Los Angeles, California February 25, 2011

F-2
REPORT OF INDEPENDENT REGISTERED PUBLIC ACCOUNTING FIRM
To the Board of Directors and Stockholders Smith Micro Software, Inc.
We have audited Smith Micro Software Inc. and subsidiaries’ (collectively, the “Company”) internal control over financial reporting as of December 31, 2010, based on criteria established in Internal Control—Integrated Framework issued by the Committee of Sponsoring Organizations of the Treadway Commission. The Company’s management is responsible for maintaining effective internal control over financial reporting and for its assessment of the effectiveness of internal control over financial reporting included in the accompanying “Report of Management on Internal Control over Financial Reporting.” Our responsibility is to express an opinion on the Company's internal control over financial reporting based on our audit.
We conducted our audit in accordance with the standards of the Public Company Accounting Oversight Board (United States). Those standards require that we plan and perform the audit to obtain reasonable assurance about whether effective internal control over financial reporting was maintained in all material respects. Our audit included obtaining an understanding of internal control over financial reporting, assessing the risk that a material weakness exists, and testing and evaluating the design and operating effectiveness of internal control based on the assessed risk. Our audit also included performing such other procedures as we considered necessary in the circumstances. We believe that our audit provides a reasonable basis for our opinion.
A company's internal control over financial reporting is a process designed to provide reasonable assurance regarding the reliability of financial reporting and the preparation of financial statements for external purposes in accordance with generally accepted accounting principles. A company's internal control over financial reporting includes those policies and procedures that (a) pertain to the maintenance of records that, in reasonable detail, accurately and fairly reflect the transactions and dispositions of the assets of the company; (b) provide reasonable assurance that transactions are recorded as necessary to permit preparation of financial statements in accordance with generally accepted accounting principles, and that receipts and expenditures of the company are being made only in accordance with authorizations of management and directors of the company; and (c) provide reasonable assurance regarding prevention or timely detection of unauthorized acquisition, use, or disposition of the company's assets that could have a material effect on the financial statements.
Because of its inherent limitations, internal control over financial reporting may not prevent or detect misstatements. Also, projections of any evaluation of effectiveness to future periods are subject to the risk that controls may become inadequate because of changes in conditions, or that the degree of compliance with the policies or procedures may deteriorate.
In our opinion, the Company maintained, in all material respects, effective internal control over financial reporting as of December 31, 2010, based on criteria established in Internal Control—Integrated Framework issued by the Committee of Sponsoring Organizations of the Treadway Commission.
We have also audited, in accordance with the standards of the Public Company Accounting Oversight Board (United States), the consolidated balance sheets as of December 31, 2010 and 2009, and the related consolidated statements of operations, stockholders’ equity, and cash flows, and the financial statement schedule, for each of the three years in the period ended December 31, 2010 of the Company, and our report dated February 25, 2011 expressed an unqualified opinion.
/s/ SINGERLEWAK LLP Los Angeles, California February 25, 2011

F-3
SMITH MICRO SOFTWARE, INC. CONSOLIDATED BALANCE SHEETS
(in thousands, except share and par value data)
See accompanying notes to the consolidated financial statements.
December 31,2010 2009
AssetsCurrent assets: Cash and cash equivalents 17,856$ 14,577$ Short-term investments 54,694 31,284 Accounts receivable, net of allowances for doubtful accounts and other adjustments of $855 (2010) and $1,045 (2009) 29,812 24,147 Income tax receivable 2,872 980 Inventories, net of reserves for excess and obsolete inventory of $558 (2010) and $1,221 (2009) 370 406 Prepaid expenses and other current assets 1,167 1,506 Deferred tax asset 2,565 2,696 Total current assets 109,336 75,596 Equipment and improvements, net 11,623 8,193 Goodwill 94,231 94,320 Intangible assets, net 19,459 27,662 Other assets 243 163 Total assets 234,892$ 205,934$
Liabilities and Stockholders' Equity Current liabilities: Accounts payable 4,592$ 4,215$ Accrued liabilities 8,444 11,359 Deferred revenue 1,667 1,317 Total current liabilities 14,703 16,891 Non-current liabilities: Deferred rent and other long term liabilities 197 70 Deferred tax liability 1,727 994 Total non-current liabilities 1,924 1,064 Commitments and contingencies (Note 5)Stockholders' equity: Preferred stock, par value $0.001 per share; 5,000,000 shares authorized; none issued or outstanding - - Common stock, par value $0.001 per share; 50,000,000 shares authorized; 34,971,108 and 33,380,496 shares issued and outstanding at December 31, 2010 and December 31, 2009, respectively 35 33 Additional paid-in capital 201,702 183,756 Accumulated other comprehensive loss (10) (2) Accumulated earnings 16,538 4,192 Total stockholders’ equity 218,265 187,979 Total liabilities and stockholders' equity 234,892$ 205,934$

F-4
SMITH MICRO SOFTWARE, INC. CONSOLIDATED STATEMENTS OF OPERATIONS
(in thousands, except per share amount)
2010 2009 2008
Revenues 130,501$ 107,279$ 98,424$ Cost of revenues 15,507 15,486 20,108 Gross profit 114,994 91,793 78,316 Operating expenses: Selling and marketing 29,708 24,999 24,814 Research and development 42,759 36,530 30,811 General and administrative 24,146 19,155 19,990 Total operating expenses 96,613 80,684 75,615 Operating income 18,381 11,109 2,701 Interest and other income 130 381 739 Income before taxes 18,511 11,490 3,440 Income tax expense 6,165 6,738 4,172 Net income (loss) 12,346$ 4,752$ (732)$
Net income (loss) per share: Basic 0.36$ 0.15$ (0.02)$ Diluted 0.36$ 0.14$ (0.02)$
Weighted average shares outstanding: Basic 34,204 32,438 30,978 Diluted 34,615 32,897 30,978
Year ended December 31,
See accompanying notes to the consolidated financial statements.
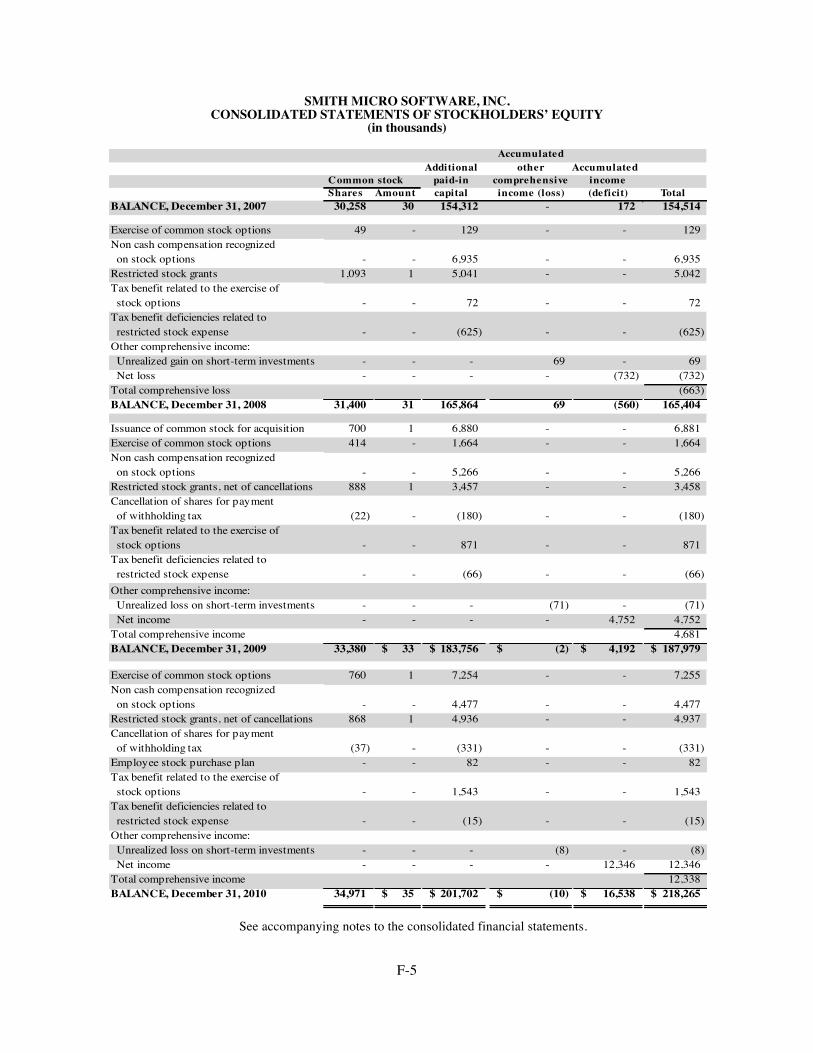
F-5
SMITH MICRO SOFTWARE, INC. CONSOLIDATED STATEMENTS OF STOCKHOLDERS’ EQUITY
(in thousands)
AccumulatedAdditional other Accumulated
paid-in comprehensive incomeShares Amount capital income (loss) (deficit) Total
BALANCE, December 31, 2007 30,258 30 154,312 - 172 154,514
Exercise of common stock options 49 - 129 - - 129Non cash compensation recognized on stock options - - 6,935 - - 6,935Restricted stock grants 1,093 1 5,041 - - 5,042Tax benefit related to the exercise of stock options - - 72 - - 72Tax benefit deficiencies related to restricted stock expense - - (625) - - (625)Other comprehensive income: Unrealized gain on short-term investments - - - 69 - 69 Net loss - - - - (732) (732)Total comprehensive loss (663)BALANCE, December 31, 2008 31,400 31 165,864 69 (560) 165,404
Issuance of common stock for acquisition 700 1 6,880 - - 6,881Exercise of common stock options 414 - 1,664 - - 1,664Non cash compensation recognized on stock options - - 5,266 - - 5,266Restricted stock grants, net of cancellations 888 1 3,457 - - 3,458Cancellation of shares for payment of withholding tax (22) - (180) - - (180)Tax benefit related to the exercise of stock options - - 871 - - 871Tax benefit deficiencies related to restricted stock expense - - (66) - - (66)Other comprehensive income: Unrealized loss on short-term investments - - - (71) - (71) Net income - - - - 4,752 4,752Total comprehensive income 4,681BALANCE, December 31, 2009 33,380 33$ 183,756$ (2)$ 4,192$ 187,979$
Exercise of common stock options 760 1 7,254 - - 7,255Non cash compensation recognized on stock options - - 4,477 - - 4,477Restricted stock grants, net of cancellations 868 1 4,936 - - 4,937Cancellation of shares for payment of withholding tax (37) - (331) - - (331)Employee stock purchase plan - - 82 - - 82Tax benefit related to the exercise of stock options - - 1,543 - - 1,543Tax benefit deficiencies related to restricted stock expense - - (15) - - (15)Other comprehensive income: Unrealized loss on short-term investments - - - (8) - (8) Net income - - - - 12,346 12,346Total comprehensive income 12,338BALANCE, December 31, 2010 34,971 35$ 201,702$ (10)$ 16,538$ 218,265$
Common stock
See accompanying notes to the consolidated financial statements.

F-6
SMITH MICRO SOFTWARE, INC. CONSOLIDATED STATEMENTS OF CASH FLOWS
(in thousands)
Year ended December 31,2010 2009 2008
Operating activities:Net income (loss) 12,346$ 4,752$ (732)$ Adjustments to reconcile net income (loss) to net cash provided by operating activities, net of the effect of acquisitions: Depreciation and amortization 11,778 10,540 8,446 Loss (gain) on disposal of fixed assets 29 (11) - Provision for adjustments to accounts receivable and doubtful accounts 851 1,596 1,170 Provision for excess and obsolete inventory 203 1,063 435 Tax benefits from stock-based compensation (1,543) (871) (72) Non cash compensation related to stock options & restricted stock 9,496 8,724 11,977 Change in operating accounts, net of effect from acquisitions: Accounts receivable (6,516) (5,998) (6,625) Deferred income taxes 849 914 2,000 Income tax receivable (1,892) (980) 180 Inventories (167) (372) 473 Prepaid expenses and other assets 259 (507) (19) Accounts payable and accrued liabilities (949) (384) (784) Net cash provided by operating activities 24,744 18,466 16,449
Investing activities:Acquisition of eFrontier America, net of cash received - - (623) Acquisition of Avot Media, net of cash received (675) - - Acquisition of Insignia Solutions, net of cash received - - 245 Acquisition of PCTel's Mobile Solutions Group, net of cash received - - (60,931) Acquisition of Core Mobility, Inc., net of cash received 143 (6,907) - Acquisitions - other - - (2,306) Other intangibles - - (500) Capital expenditures (6,312) (4,809) (3,538) Cash proceeds from the disposal of fixed assets - 31 - Purchase of short-term investments (23,418) (8,706) (22,580) Net cash used in investing activities (30,262) (20,391) (90,233)
Financing activities:Tax benefits from stock-based compensation 1,543 871 72 Cash received from exercise of stock options 7,254 1,665 129 Net cash provided by financing activities 8,797 2,536 201 Net increase (decrease) in cash and cash equivalents 3,279 611 (73,583) Cash and cash equivalents, beginning of period 14,577 13,966 87,549 Cash and cash equivalents, end of period 17,856$ 14,577$ 13,966$
Supplemental disclosures of cash flow information: Cash paid for income taxes 5,776$ 6,612$ 1,308$
See accompanying notes to the consolidated financial statements.

F-7
SMITH MICRO SOFTWARE, INC. NOTES TO CONSOLIDATED FINANCIAL STATEMENTS
1. Organization, Basis of Presentation and Summary of Significant Accounting Policies
The Company Smith Micro Software, Inc. designs, develops and markets software products and services primarily for the mobile computing and communications industries. The Company is focused on developing connectivity, communications, and content management solutions for a converging world of wireless and wired networks. The Company’s portfolio of wireless software products and services includes a wide range of software solutions including our QuickLink® family of products. We provide mobile voice and data connectivity across 3G, 4G and Wi-Fi networks. Our mobile communications portfolio includes solutions for Push-To-Talk, Visual Voicemail, mobile device management and video. We also offer user-friendly solutions for the management of mobile content, contacts and calendar data.
Our patented compression technologies are utilized within various Smith Micro products including our line of Personal Computer (“PC”) and Smartphone compression products and our managed file-transfer solution.
We sell our products and services to many of the world’s leading mobile network operators, original equipment manufacturers (“OEM”), device manufacturers and enterprise businesses, as well as directly to consumers. The proliferation of broadband mobile wireless technologies is providing new opportunities for our products and services on a global basis. When these broadband wireless technologies—EVDO, UMTS/HSPA, Wi-Fi, LTE and WiMAX—are combined with new devices such as mobile phones, Personal Computers, Smartphones, Netbooks, and tablets and emerging Machine-to-Machine (“M2M”) devices, opportunities emerge for new communications software products. Our core technologies are designed to address these emerging mobile connectivity and convergence opportunities.
Our innovative line of productivity and graphics products are distributed through a variety of consumer channels worldwide, our online stores, and third-party wholesalers, retailers and value-added resellers. We offer products that operate on Windows, Mac, UNIX, Linux, iOS, Android, Windows Mobile, Symbian and Java platforms.
The underlying design concept common to all of our products is our ability to improve the customer’s experience. This philosophy is based on the combination of solid engineering and exceptional design that reinforces our brand’s competitive differentiation. We have over 25 years of experience in design, creation and custom engineering services for software products. On October 26, 2009, the Company acquired Core Mobility, Inc. (“Core Mobility”), a developer of mobility software and solutions, for $10 million in cash and 700,000 shares of Smith Micro common stock. Core Mobility became a wholly-owned subsidiary of Smith Micro. Of the $10 million of cash consideration, $3.0 million was held back (“Holdback”) as security against possible indemnification obligations and was subsequently paid in 2010. On December 10, 2007, Smith Micro entered into an Asset Purchase Agreement with PCTEL, Inc. pursuant to which Smith Micro agreed to acquire substantially all of the assets of PCTEL’s Mobility Solutions Group (“MSG”). The acquisition was completed on January 4, 2008. Pursuant to the terms of the Asset Purchase Agreement, Smith Micro paid $59.7 million in cash to PCTEL at the closing on January 4, 2008.
Basis of Presentation The accompanying consolidated financial statements reflect the operating results and financial position of Smith Micro Software, Inc. and its wholly owned subsidiaries in accordance with accounting principles generally accepted in the United States of America. All intercompany amounts have been eliminated in consolidation.
Foreign Currency Transactions The Company has international operations resulting from acquisitions over the past several years. The countries in which the Company has a subsidiary or branch office in are Sweden, Norway, Hong Kong, Serbia, the United Kingdom, and Canada. The functional currency for all of these foreign entities is the U.S. dollar in accordance with the Financial Accounting Standards Board (“FASB”) Accounting Standards Codification (“ASC”) Topic No. 830-30, Foreign Currency Matters-Translation of Financial Statements. Foreign currency transactions that increase or decrease expected functional currency cash flows is a foreign currency transaction gain or loss that are included in determining net income for the period in which the exchange rate changes. Likewise, a transaction gain or loss

F-8
(measured from the transaction date or the most recent intervening balance sheet date, whichever is later) realized upon settlement of a foreign currency transaction is included in determining net income for the period in which the transaction is settled.
Use of Estimates The preparation of consolidated financial statements in conformity with accounting principles generally accepted in the U.S. requires management to make estimates and assumptions that affect the reported amounts in the consolidated financial statements and accompanying notes. Actual results could differ from those estimates.
Fair Value of Financial Instruments The Company measures and discloses fair value measurements as required by FASB ASC Topic No. 820, Fair Value Measurements and Disclosures. The carrying value of accounts receivable, foreign cash accounts, prepaid expenses, other current assets, accounts payable, and accrued liabilities are considered to be representative of their respective fair values because of the short-term nature of those instruments. Fair value is an exit price, representing the amount that would be received to sell an asset or paid to transfer a liability in an orderly transaction between market participants. As such, fair value is a market-based measurement that is determined based on assumptions that market participants would use in pricing an asset or a liability. As a basis for considering such assumptions, the FASB establishes a three-tier value hierarchy, which prioritizes the inputs used in the valuation methodologies in measuring fair value:
• Level 1 - Observable inputs that reflect quoted prices (unadjusted) for identical assets or liabilities in active markets.
• Level 2 - Include other inputs that are directly or indirectly observable in the marketplace. • Level 3 - Unobservable inputs which are supported by little or no market activity.
The fair value hierarchy also requires an entity to maximize the use of observable inputs and minimize the use of unobservable inputs when measuring fair value. As required by FASB ASC Topic No. 820, we measure our cash equivalents and short-term investments at fair value. Our cash equivalents and short-term investments are classified within Level 1 by using quoted market prices utilizing market observable inputs. As required by FASB ASC Topic No. 825, Financial Instruments, an entity can choose to measure at fair value many financial instruments and certain other items that are not currently required to be measured at fair value. Subsequent changes in fair value for designated items are required to be reported in earnings in the current period. This Topic also establishes presentation and disclosure requirements for similar types of assets and liabilities measured at fair value. As permitted, the Company has elected not to use the fair value option to measure our available-for-sale securities under this Topic and will continue to report as required by FASB ASC Topic No. 320, Investments-Debt and Equity Securities. We have made this election because the nature of our financial assets and liabilities are not of such complexity that they would benefit from a change in valuation to fair value.
Significant Concentrations For the year ended December 31, 2010, three customers, each accounting for over 10% of revenues, made up 66.3% of revenues and 78% of accounts receivable, and five suppliers, each with more than 10% of inventory purchases, totaled 5% of accounts payable. For the year ended December 31, 2009, four customers, each accounting for over 10% of revenues, made up 65.7% of revenues and 75% of accounts receivable, and four suppliers, each with more than 10% of inventory purchases, totaled 3% of accounts payable. For the year ended December 31, 2008, one customer, Verizon Wireless, made up 32.0% of revenues and 21% of accounts receivable, and four suppliers, each with more than 10% of inventory purchases, totaled 10% of accounts payable.
Cash and Cash Equivalents Cash and cash equivalents generally consist of cash, government securities, mutual funds, and money market funds. These securities are primarily held in two financial institutions and are uninsured except for the minimum Federal Deposit Insurance Corporation (“FDIC”) coverage, and have original maturity dates of three months or less. As of December 31, 2010 and 2009, bank balances totaling approximately $17.6 million and $4.6 million, respectively, were uninsured. On January 1, 2010, our primary United States bank exited the Federal Deposit Insurance Corp.’s Transaction Account Guarantee Program. Our uninsured bank balances would have been $14.3 million for the year
F-9
ended December 31, 2009 if our primary United States bank exited Federal Deposit Insurance Corp.’s Transaction Account Guarantee Program prior to January 1, 2010.
Short-Term Investments Short-term investments consist of corporate notes, bonds, and commercial paper and U.S. government agency and government sponsored enterprise obligations. The Company accounts for these short-term investments as required by FASB ASC Topic No. 320, Investments-Debt and Equity Securities. These debt and equity securities are not classified as either held-to-maturity securities or trading securities. As such, they are classified as available-for-sale securities. Available-for-sale securities are recorded at fair value, with unrealized gains or losses recorded as a separate component of accumulated other comprehensive income in stockholders’ equity until realized.
Accounts Receivable and Allowance for Doubtful Accounts We sell our products worldwide. We perform ongoing credit evaluations of our customers and adjust credit limits based upon payment history, the customer’s current credit worthiness and various other factors, as determined by our review of their current credit information. We continuously monitor collections and payments from our customers. We estimate credit losses and maintain an allowance for doubtful accounts reserve based upon these estimates. While such credit losses have historically been within our estimated reserves, we cannot guarantee that we will continue to experience the same credit loss rates that we have in the past. If not, this could have an adverse effect on our consolidated financial statements. Allowances for product returns are included in other adjustments to accounts receivable on the accompanying consolidated balance sheets. Product returns are estimated based on historical experience and have also been within management’s estimates.
Inventories Inventories consist principally of cables, compact disks (“CDs”), boxes and manuals and are stated at the lower of cost (determined by the first-in, first-out method) or market. The Company regularly reviews its inventory quantities on hand and records a provision for excess and obsolete inventory based primarily on management’s forecast of product demand and production requirements. At December 31, 2010, our net inventory balance of $0.4 million consisted of $0.2 million of assembled products and $0.2 million of components. At December 31, 2009, our net inventory balance of $0.4 million consisted of approximately $0.1 million of assembled products and $0.3 million of components.
Equipment and Improvements Equipment and improvements are stated at cost. Depreciation is computed using the straight-line method based on the estimated useful lives of the assets, generally ranging from three to seven years. Leasehold improvements are amortized using the straight-line method over the shorter of the estimated useful life of the asset or the lease term.
In-Process Research and Development In 2009, we capitalized $1.0 million of IPR&D costs related to our acquisition of Core Mobility in accordance with accounting standards that became effective in 2009. This IPR&D project was completed during the fourth quarter of 2010. As such, amortization has commenced and will continue over its estimated useful life. The fair value of the IPR&D was determined using the discounted cash flow approach. The expected future cash flows were estimated and discounted to their net present values at an appropriate risk-adjusted rate of return. Significant factors considered in the calculation of the rate of return were the weighted average cost of capital and return on assets, as well as the risks inherent in the development process, including the likelihood of achieving technological success and market acceptance. Future cash flows were estimated based on forecasted revenue and costs, taking into account the expected product life cycle, market penetration and growth rates.
Intangible Assets and Amortization Amortization expense related to other intangibles acquired in previous acquisitions is calculated on a straight line basis over various useful lives.
Impairment or Disposal of Long Lived Assets Long-lived assets to be held are reviewed for events or changes in circumstances which indicate that their carrying value may not be recoverable. They are tested for recoverability using undiscounted cash flows to determine

F-10
whether or not impairment to such value has occurred as required by FASB ASC Topic No. 360, Property, Plant, and Equipment. The Company determined that there was no impairment at December 31, 2009 or 2010.
Valuation of Goodwill and Intangible Assets The Company accounts for goodwill and intangible assets as required by FASB ASC Topic No. 350, Intangibles-Goodwill and Other. This statement requires us to periodically assess the impairment of our goodwill and intangible assets, which requires us to make assumptions and judgments regarding the carrying value of these assets. These assets are considered to be impaired if we determine that their carrying value may not be recoverable based upon our assessment of the following events or changes in circumstances:
• a determination that the carrying value of such assets cannot be recovered through undiscounted cash flows; • loss of legal ownership or title to the assets; • significant changes in our strategic business objectives and utilization of the assets; or • the impact of significant negative industry or economic trends.
If the intangible assets are considered to be impaired, the impairment we would recognize is the amount by which the carrying value of the intangible assets exceeds the fair value of the intangible assets. In addition, we base the useful lives and the related amortization expense on our estimate of the useful life of the intangible assets. Due to the numerous variables associated with our judgments and assumptions relating to the carrying value of our intangible assets and the effects of changes in circumstances affecting these valuations, both the precision and reliability of the resulting estimates are subject to uncertainty, and as additional information becomes known, we may change our estimate, in which case, the likelihood of a material change in our reported results would increase. The Company has not recognized any impairment loss through December 31, 2010. In accordance with FASB ASC Topic No. 350, Intangibles-Goodwill and Other, we review the recoverability of the carrying value of goodwill at least annually or whenever events or circumstances indicate a potential impairment. The Company’s annual impairment testing date is December 31. Recoverability of goodwill is determined by comparing the fair value of the Company’s reporting units to the carrying value of the underlying net assets in the reporting units. If the fair value of a reporting unit is determined to be less than the carrying value of its net assets, goodwill is deemed impaired and an impairment loss is recognized to the extent that the carrying value of goodwill exceeds the difference between the fair value of the reporting unit and the fair value of its other assets and liabilities. We determined that we did not have any impairment of goodwill at December 31, 2010, 2009 or 2008. Estimates of reporting unit fair value are based upon market capitalization and therefore are volatile being sensitive to market fluctuations. To the extent that our market capitalization decreases significantly or the allocation of value to our reporting units change, we could be required to write off some or all of our goodwill.
Deferred Income Taxes We account for deferred income taxes as required FASB ASC Topic No. 740, Income Taxes. This statement requires the recognition of deferred tax assets and liabilities for the future consequences of events that have been recognized in our financial statements or tax returns. The measurement of the deferred items is based on enacted tax laws. In the event the future consequences of differences between financial reporting bases and the tax bases of our assets and liabilities result in a deferred tax asset, we are required to evaluate the probability of being able to realize the future benefits indicated by such asset. A valuation allowance related to a deferred tax asset is recorded when it is more likely than not that some portion or the entire deferred tax asset will not be realized. The Company’s net deferred tax assets were not reduced by a tax valuation allowance at December 31, 2010. Management evaluated the positive and negative evidence in determining the realizability of the net deferred tax assets at December 31, 2010 and concluded it is more likely than not that the Company should realize its net deferred tax assets through future operating results and the reversal of taxable temporary differences. In July 2006, the FASB clarified the accounting for uncertainty in income taxes recognized in the financial statements. A tax benefit from an uncertain tax position may be recognized when it is more likely than not that the position will be sustained upon examination, including resolutions of any related appeals or litigation process, based on the technical merits. Income tax positions must meet a more likely-than-not recognition threshold at the effective date to be recognized upon the adoption of new FASB guidance, and in subsequent periods. The interpretation also provides guidance on measurement, derecognition, classification, interest and penalties, accounting in interim periods, disclosure and transition. We adopted this FASB guidance effective January 1, 2007. Based on our evaluation, we have concluded that there are no significant uncertain tax positions requiring recognition on our financial statements.

F-11
Deferred Rent and Other Long-Term Liabilities The long-term liabilities are for deferred rent to account for the difference between straight-line and bargain rents and an earn-out accrual that extended beyond one year for one of our prior year acquisitions.
Revenue Recognition We currently report our net revenues under two operating groups: Wireless and Productivity & Graphics. Within each of these groups software revenue is recognized based on the customer and contract type. We recognize revenue when persuasive evidence of an arrangement exists, delivery has occurred, the price is fixed and determinable, and collectability is probable as required by FASB ASC Topic No. 985-605, Software-Revenue Recognition. We recognize revenues from sales of our software to OEM customers or end users as completed products are shipped and titles passes; or from royalties generated as authorized customers duplicate our software, if the other requirements are met. If the requirements are not met at the date of shipment, revenue is not recognized until these elements are known or resolved. Returns from OEM customers are limited to defective goods or goods shipped in error. Historically, OEM customer returns have not exceeded the very nominal estimates and reserves. Management reviews available retail channel information and makes a determination of a return provision for sales made to distributors and retailers based on current channel inventory levels and historical return patterns. Certain sales to distributors or retailers are made on a consignment basis. Revenue for consignment sales are not recognized until sell through to the final customer is established. Within the Productivity & Graphics group certain revenues are booked net of revenue sharing payments. We have a few multiple element agreements for which we have contracted to provide a perpetual license for use of proprietary software, to provide non-recurring engineering, and in some cases to provide software maintenance (post contract support). For multiple element agreements, vendor specific objective evidence of fair value for all contract elements is reviewed and the timing of the individual element revenue streams is determined and recognized as required. Sales directly to end-users are recognized upon shipment. End users have a thirty day right of return, but such returns are reasonably estimable and have historically been immaterial. We also provide technical support to our customers. Such costs have historically been insignificant.
Sales Incentives For our Productivity & Graphics sales, the cost of sales incentives the Company offers without charge to customers that can be used in, or that are exercisable by a customer as a result of, a single exchange transaction is accounted for as a reduction of revenue as required by FASB ASC Topic No. 985-605, Software-Revenue Recognition. We use historical redemption rates to estimate the cost of customer incentives. Total sales incentives were $2.0 million, $1.2 million and $0.8 million for the years ended December 31, 2010, 2009 and 2008, respectively.
Internal Software Development Costs Development costs incurred in the research and development of new software products and enhancements to existing software products are expensed as incurred until technological feasibility has been established. The Company considers technological feasibility to be established when all planning, designing, coding and testing has been completed according to design specifications. After technological feasibility is established, any additional costs are capitalized. Through December 31, 2010, software has been substantially completed concurrently with the establishment of technological feasibility; and, accordingly, no costs have been capitalized to date.
Capitalized Software and Amortization We capitalize internally developed software and software purchased from third parties if the related software product under development has reached technological feasibility or if there are alternative future uses for the purchased software as required by FASB ASC Topic No. 985-20, Software-Costs of Software to be Sold, Leased, or Marketed. These costs are amortized on a product-by-product basis, typically over an estimated life of five to seven years, using the larger of the amount calculated using the straight-line method or the amount calculated using the ratio between current period gross revenues and the total of current period gross revenues and estimated future gross revenues. At each balance sheet date, we evaluate on a product-by-product basis the unamortized capitalized cost of computer software compared to the net realizable value of that product. The amount by which the unamortized capitalized costs of a computer software product exceed its net realizable value is written off.
Advertising Expense Advertising costs are expensed as incurred. Advertising expenses were $0.9 million, $0.8 million, and $0.9 million for the years ended December 31, 2010, 2009 and 2008, respectively.
F-12
Income Taxes We account for income taxes as required FASB ASC Topic No. 740, Income Taxes. This Topic clarifies the accounting for uncertainty in income taxes recognized in an enterprise’s financial statements and prescribes a recognition threshold and measurement process for financial statement recognition and measurement of a tax position taken or expected to be taken in a tax return. The Topic also provides guidance on derecognition, classification, interest and penalties, accounting in interim periods, disclosure and transition. In the event the future consequences of differences between financial reporting bases and the tax bases of the Company’s assets and liabilities result in a deferred tax asset, we are required to evaluate the probability of being able to realize the future benefits indicated by such asset. A valuation allowance related to a deferred tax asset is recorded when it is more likely than not that some portion or the entire deferred tax asset will not be realized. In 2006, the Company reversed all of its valuation allowance on its deferred tax assets as a result of the Company’s improving financial performance and projected income in future years. In July 2006, the FASB clarified the accounting for uncertainty in income taxes recognized in the financial statements. A tax benefit from an uncertain tax position may be recognized when it is more likely than not that the position will be sustained upon examination, including resolutions of any related appeals or litigation process, based on the technical merits. Based on our evaluation, we have concluded that there are no significant uncertain tax positions requiring recognition on our financial statements. We may from time to time be assessed interest or penalties by major tax jurisdictions, although any such assessments historically have been minimal and immaterial to our financial results. In the event we have received an assessment for interest and/or penalties, it has been classified in the financial statements as general and administrative expense.
Stock-Based Compensation The Company accounts for all stock-based payment awards made to employees and directors based on their fair values and recognized as compensation expense over the vesting period using the straight-line method over the requisite service period for each award as required by FASB ASC Topic No. 718, Compensation-Stock Compensation.
Net Income (Loss) Per Share The Company calculates earnings per share (“EPS”) as required by FASB ASC Topic No. 260, Earning Per Share. Basic EPS is calculated by dividing the net income available to common stockholders by the weighted average number of common shares outstanding for the period, excluding common stock equivalents. Diluted EPS is computed by dividing the net income available to common stockholders by the weighted average number of common shares outstanding for the period plus the weighted average number of dilutive common stock equivalents outstanding for the period determined using the treasury-stock method. For purposes of this calculation, common stock subject to repurchase by the Company and options are considered to be common stock equivalents and are only included in the calculation of diluted earnings per share when their effect is dilutive.
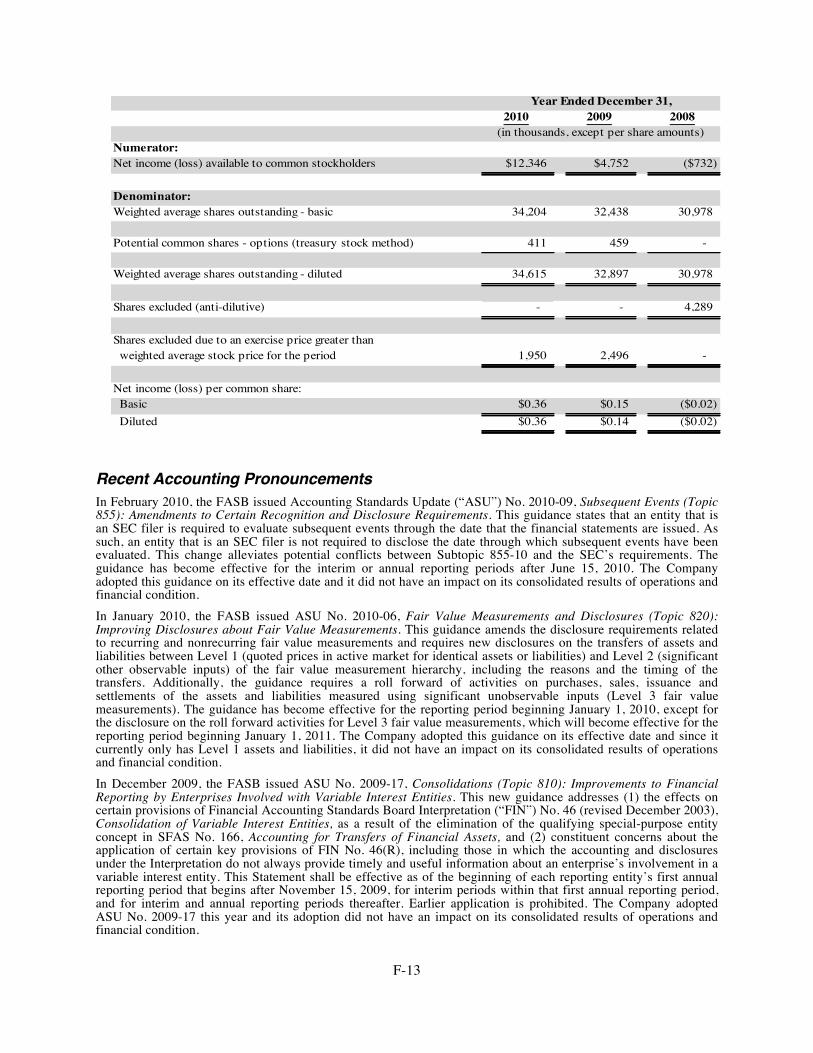
F-13
Year Ended December 31,2010 2009 2008
Numerator:Net income (loss) available to common stockholders $12,346 $4,752 ($732)
Denominator:Weighted average shares outstanding - basic 34,204 32,438 30,978
Potential common shares - options (treasury stock method) 411 459 -
Weighted average shares outstanding - diluted 34,615 32,897 30,978
Shares excluded (anti-dilutive) - - 4,289
Shares excluded due to an exercise price greater than weighted average stock price for the period 1,950 2,496 -
Net income (loss) per common share: Basic $0.36 $0.15 ($0.02) Diluted $0.36 $0.14 ($0.02)
(in thousands, except per share amounts)
Recent Accounting Pronouncements In February 2010, the FASB issued Accounting Standards Update (“ASU”) No. 2010-09, Subsequent Events (Topic 855): Amendments to Certain Recognition and Disclosure Requirements. This guidance states that an entity that is an SEC filer is required to evaluate subsequent events through the date that the financial statements are issued. As such, an entity that is an SEC filer is not required to disclose the date through which subsequent events have been evaluated. This change alleviates potential conflicts between Subtopic 855-10 and the SEC’s requirements. The guidance has become effective for the interim or annual reporting periods after June 15, 2010. The Company adopted this guidance on its effective date and it did not have an impact on its consolidated results of operations and financial condition. In January 2010, the FASB issued ASU No. 2010-06, Fair Value Measurements and Disclosures (Topic 820): Improving Disclosures about Fair Value Measurements. This guidance amends the disclosure requirements related to recurring and nonrecurring fair value measurements and requires new disclosures on the transfers of assets and liabilities between Level 1 (quoted prices in active market for identical assets or liabilities) and Level 2 (significant other observable inputs) of the fair value measurement hierarchy, including the reasons and the timing of the transfers. Additionally, the guidance requires a roll forward of activities on purchases, sales, issuance and settlements of the assets and liabilities measured using significant unobservable inputs (Level 3 fair value measurements). The guidance has become effective for the reporting period beginning January 1, 2010, except for the disclosure on the roll forward activities for Level 3 fair value measurements, which will become effective for the reporting period beginning January 1, 2011. The Company adopted this guidance on its effective date and since it currently only has Level 1 assets and liabilities, it did not have an impact on its consolidated results of operations and financial condition. In December 2009, the FASB issued ASU No. 2009-17, Consolidations (Topic 810): Improvements to Financial Reporting by Enterprises Involved with Variable Interest Entities. This new guidance addresses (1) the effects on certain provisions of Financial Accounting Standards Board Interpretation (“FIN”) No. 46 (revised December 2003), Consolidation of Variable Interest Entities, as a result of the elimination of the qualifying special-purpose entity concept in SFAS No. 166, Accounting for Transfers of Financial Assets, and (2) constituent concerns about the application of certain key provisions of FIN No. 46(R), including those in which the accounting and disclosures under the Interpretation do not always provide timely and useful information about an enterprise’s involvement in a variable interest entity. This Statement shall be effective as of the beginning of each reporting entity’s first annual reporting period that begins after November 15, 2009, for interim periods within that first annual reporting period, and for interim and annual reporting periods thereafter. Earlier application is prohibited. The Company adopted ASU No. 2009-17 this year and its adoption did not have an impact on its consolidated results of operations and financial condition.

F-14
In December 2009, the FASB issued ASU No. 2009-16, Transfers and Servicing (Topic 860): Accounting for Transfers of Financial Assets. This guidance was issued to improve the relevance, representational faithfulness, and comparability of the information that a reporting entity provides in its financial statements about a transfer of financial assets; the effects of a transfer on its financial position, financial performance, and cash flows; and a transferor’s continuing involvement, if any, in transferred financial assets. This Statement must be applied as of the beginning of each reporting entity’s first annual reporting period that begins after November 15, 2009, for interim periods within that first annual reporting period and for interim and annual reporting periods thereafter. Earlier application is prohibited. This Statement must be applied to transfers occurring on or after the effective date. The Company adopted ASU No. 2009-16 this year and its adoption did not have an impact on its consolidated results of operations and financial condition. In October 2009, the FASB issued ASU No. 2009-14, Software (Topic 985): Certain Revenue Arrangements That Include Software Elements (a consensus of the FASB Emerging Issues Task Force). This new guidance amends the scope of existing software revenue recognition accounting. Tangible products containing software components and non-software components that function together to deliver the product’s essential functionality would be scoped out of the accounting guidance on software and accounted for based on other appropriate revenue recognition guidance. For the Company, this guidance is effective for all new or materially modified arrangements entered into on or after January 1, 2011 with earlier application permitted as of the beginning of a fiscal year. Full retrospective application of the new guidance is optional. This guidance must be adopted in the same period that the company adopts the amended accounting for arrangements with multiple deliverables described in the preceding paragraph. The Company is currently assessing its implementation of this new guidance, but does not expect a material impact on the consolidated financial statements. In October 2009, the FASB issued ASU No. 2009-13, Revenue Recognition (Topic 605): Multiple-Deliverable Revenue Arrangements. ASU No. 2009-13 amends revenue recognition guidance for arrangements with multiple deliverables. The new guidance eliminates the residual method of revenue recognition and allows the use of management’s best estimate of selling price for individual elements of an arrangement when vendor specific objective evidence (“VSOE”), vendor objective evidence (“VOE”) or third-party evidence (“TPE”) is unavailable. For the Company, this guidance is effective for all new or materially modified arrangements entered into on or after January 1, 2011 with earlier application permitted as of the beginning of a fiscal year. Full retrospective application of the new guidance is optional. The Company is currently assessing its implementation of this new guidance, but does not expect a material impact on the consolidated financial statements.
2. Acquisitions
Core Mobility, Inc. On October 26, 2009, the Company acquired Core Mobility, a developer of mobility software and solutions, for $10 million in cash and 700,000 shares of Smith Micro common stock. Core Mobility became a wholly-owned subsidiary of Smith Micro. In addition, the former shareholders of Core Mobility had the ability to earn additional cash consideration of up to $1.9 million in the form of earn-out payments, contingent on Core Mobility achieving certain milestone deliverables for product development and deployment. In March 2010, a milestone payment of $0.6 million was made. Of the $10 million of cash consideration, $3.0 million was held back (“Holdback”) as security against possible indemnification obligations. As of December 31, 2010, the entire Holdback had been paid. Acquisition-related costs of $0.2 million were recorded as expense in the fiscal year ended December 31, 2009 in the general and administrative section of the consolidated statement of operations. The total purchase price is summarized as follows (in thousands):
Cash paid at closing 6,970$ Holdback (including interest) 3,041Common stock issued 6,881Milestone payments 1,839 Total purchase price 18,731$
F-15
The Company’s allocation of the purchase price is summarized as follows (in thousands):
Assets:Cash 63$ Accounts receivable 997Unbilled receivable 324Prepaid and other assets 279 Fixed assets 856 Deferred tax assets 1,735 Intangible assets 8,858 Goodwill 10,694 Total assets 23,806
Liabilities:Accounts payable 26 Accrued expenses 258 Deferred revenue 1,280 Deferred tax liability 3,511 Total liabilities 5,075
Total purchase price 18,731$
The results of operations of Core Mobility have been included in the Company’s consolidated financial statements from the date of acquisition. The pro-forma effect of the acquisition on historical periods is not material and therefore is not included.
PCTELʼS Mobility Solutions Group On January 4, 2008, the Company acquired substantially all of the assets of PCTEL’S Mobility Solutions Group in exchange for $59.7 million in cash. The direct acquisition costs incurred were $1.2 million for legal and professional services. The results of operations of the business acquired have been included in the Company’s consolidated financial statements from the date of acquisition. Depreciation and amortization related to the acquisition were calculated based on the estimated fair market values and estimated lives for property and equipment and certain identifiable intangible assets acquired. The total purchase price is summarized as follows (in thousands):
Cash consideration 59,700$ Acquisition related costs 1,231 Total purchase price 60,931$
The Company’s allocation of the purchase price is summarized as follows (in thousands):
Assets:Property & equipment 718$ Intangible assets 13,050 Goodwill 50,319 Total assets 64,087
Liabilities:Deferred revenue 3,156 Total liabilities 3,156
Total purchase price 60,931$

F-16
3. Balance Sheet Details
Short-Term Investments Available-for-sale securities with contractual maturities of less than 12 months were as follows (in thousands):
December 31, 2010 December 31, 2009Amortized Net unrealized Amortized Net unrealized
Fair value cost basis gain (loss) Fair value cost basis gain (loss)Corporate notes, bonds and commercial paper 39,691$ 39,704$ (8)$ 3,499$ 3,498$ -Government securities 15,003 15,007 (2) 27,785 27,789 (2) Total 54,694$ 54,711$ (10)$ 31,284$ 31,287$ (2)$
There were no realized gains (losses) recognized in interest and other income for the year ended December 31, 2010. Realized (losses) recognized in interest and other income were $(0.2) million for the year ended December 31, 2009.
Equipment and Improvements Equipment and improvements consist of the following (in thousands):
December 31,2010 2009
Computer hardware, software, and equipment 10,368$ 6,551$ Leasehold improvements 6,237 4,081 Office furniture and fixtures 1,055 737
17,660 11,369 Less accumulated depreciation and amortization (6,037) (3,176) Equipment and improvements, net 11,623$ 8,193$
Depreciation and amortization expense on equipment and improvements was $2.9 million, $1.7 million and $1.1 million for the years ended December 31, 2010, 2009 and 2008 respectively.
Intangible Assets The following table sets forth our acquired intangible assets by major asset class as of December 31, 2010 and 2009 (in thousands except useful life data):
Usefullife Net book Net book
(years) Gross value Gross valueAmortizing:Purchased technology 1-3 7,347$ (5,344)$ 2,003$ 6,667$ (3,349)$ 3,318$ In process R&D 2 990 (62) 928 990 - 990 Capitalized software 1-7 23,846 (15,336) 8,510 23,846 (11,485) 12,361 Distribution rights 5 482 (482) - 482 (447) 35 Customer lists 3-5 1,484 (1,328) 156 1,484 (1,048) 436 Database 10 182 (56) 126 182 (38) 144 Trademarks 5-10 926 (537) 389 926 (445) 481 Trade names 1-7 2,121 (1,208) 913 2,121 (807) 1,314 Non-compete 2 21 (13) 8 21 (2) 19 Customer agreements 1-2 1,135 (1,135) - 1,135 (1,135) - Customer relationships 4-7 11,130 (4,704) 6,426 11,130 (2,566) 8,564 Totals 49,664$ (30,205)$ 19,459$ 48,984$ (21,322)$ 27,662$
amortizationAccumulated amortization
December 31, 2010 December 31, 2009Accumulated

F-17
Aggregate amortization expense on intangible assets was $8.9 million, $8.8 million, and $7.3 million for the years ended December 31, 2010, 2009, and 2008 respectively. Expected future amortization expense is as follows: $7.9 million for 2011, $5.7 million for 2012, $4.8 million for 2013, $0.9 million for 2014 and $0.1 million thereafter.
Goodwill The Company determined that it did not have any impairment of goodwill at December 31, 2009 or 2010. The carrying amount of the Company’s goodwill was $94.2 million as of December 31, 2010 and $94.3 million as of December 31, 2009. The decrease was due to $0.2 million of interest income recorded relative to Core Mobility partially offset by a $0.1 million increase as a result of a small acquisition made during fiscal year 2010.
Other Assets These are primarily office rent deposits.
Accrued Liabilities Accrued liabilities consist of the following (in thousands):
December 31,
2010 2009Salaries and benefits 6,731$ 5,390$ Income taxes payable 37 106 Royalties and revenue sharing 416 239 Earnouts/holdbacks 1,210 5,220 Marketing expenses, rebates and other 50 404 Total accrued liabilities 8,444$ 11,359$
4. Income Taxes A summary of the income tax expense is as follows (in thousands):
Year Ended December 31, 2010 2009 2008
Current: Federal 3,071$ 3,662$ 855$ State 652 1,215 1,255 Foreign 54 65 101 Total current 3,777 4,942 2,211
Deferred: Federal 943 2,734 2,784 State (82) 22 (230) Foreign - - (148) Excess tax benefits related to stock based compensation 1,543 871 72 Tax deficiencies related to restricted stock expense (15) (66) (625) Purchase accounting adjustment - Core Mobility - (1,765) - Other adjustments (1) - (40) Change in valuation allowance - - 148 Total deferred 2,388 1,796 1,961 Total provision 6,165$ 6,738$ 4,172$
A reconciliation of the provision for income taxes to the amount of income tax expense that would result from applying the federal statutory rate (35% in 2010 and 2009 and 34% in 2008) to the profit before income taxes is as follows:

F-18
Year Ended December 31, 2010 2009 2008
Federal statutory rate 35 % 35 % 34 %State tax, net of federal benefit 5 7 17Equity compensation 3 13 69R&D tax credit (5) (4) (1)Other (5) 8 (2)Change in valuation allowance - - 4
33 % 59 % 121 %
The major components of the Company’s deferred tax assets and liabilities are as follows (in thousands):
2010 2009
CurrentVarious reserves 366$ 660$ Nondeductible accruals 1,208 1,193 Deferred state taxes 228 542 Prepaid expenses (127) (246) Other (27) 59 Equity compensation 917 488 Total Current 2,565$ 2,696$
Non- currentCredit carryforwards 1,201 1,583 Net operating loss carryforwards 659 1,178 State tax (591) (563) Fixed assets (850) (512) Amortization (53) 710 Identifiable intangibles acquired (2,258) (3,585) Equity based compensation 165 192 Other - 3 Total Non-current (1,727)$ (994)$
Year Ended December 31,
The Company has federal and state net operating loss carryforwards of approximately $0.6 million and $7.3 million, respectively, at December 31, 2010. These federal net operating loss carryforwards will expire from 2025 through 2029 and state net operating loss carryforwards will expire 2015 through 2031.
In addition, the Company has federal and state tax credit carryforwards of approximately $0.2 million and $1.0 million, respectively, at December 31, 2010. These tax credits will begin to expire in 2027.
We account for income taxes as required FASB ASC Topic No. 740, Income Taxes. This Topic clarifies the accounting for uncertainty in income taxes recognized in an enterprise’s financial statements and prescribes a recognition threshold and measurement process for financial statement recognition and measurement of a tax position taken or expected to be taken in a tax return. The Topic also provides guidance on de-recognition, classification, interest and penalties, accounting in interim periods, disclosure and transition. The Topic requires an entity to recognize the financial statement impact of a tax position when it is more likely than not that the position will be sustained upon examination. The amount recognized is measured as the largest amount of benefit that is greater than fifty percent likely of being realized upon ultimate settlement. In addition, the Topic permits an entity to recognize interest and penalties related to tax uncertainties either as income tax expense or operating expenses. The Company has chosen to recognize interest and penalties related to tax uncertainties as operating expense.

F-19
The Company has concluded that there are no significant uncertain tax positions requiring recognition in its financial statements. As a result, the adoption of this Topic did not have a material impact on the Company’s results of operation and financial position.
The Company is subject to U.S. federal income tax as well as to income tax of multiple state jurisdictions. Federal income tax returns of the Company are subject to IRS examination for the 2007 through 2009 tax years. State income tax returns are subject to examination for a period of three to four years after filing.
5. Commitments and Contingencies
Leases The Company leases its buildings under operating leases that expire on various dates through 2022. Future minimum annual lease payments under such leases as of December 31, 2010 are as follows (in thousands):
Year Ending December 31, Operating2011 3,049$ 2012 3,0542013 2,7692014 2,4262015 2,383Beyond 9,367 Total 23,048$
Total rent expense was $2.5 million, $1.9 million and $1.8 million for the years ended December 31, 2010, 2009 and 2008, respectively.
Litigation From time to time the Company is subject to litigation in the normal course of business, none of which management believes will likely have a material adverse effect on the Company’s consolidated financial condition or results of operations.
Other Contingent Contractual Obligations During its normal course of business, the Company has made certain indemnities, commitments and guarantees under which it may be required to make payments in relation to certain transactions. These include: intellectual property indemnities to the Company’s customers and licensees in connection with the use, sale and/or license of Company products; indemnities to various lessors in connection with facility leases for certain claims arising from such facility or lease; indemnities to vendors and service providers pertaining to claims based on the negligence or willful misconduct of the Company; indemnities involving the accuracy of representations and warranties in certain contracts; and indemnities to directors and officers of the Company to the maximum extent permitted under the laws of the State of Delaware. In addition, the Company has made contractual commitments to employees providing for severance payments upon the occurrence of certain prescribed events. The Company may also issue a guarantee in the form of a standby letter of credit as security for contingent liabilities under certain customer contracts. The duration of these indemnities, commitments and guarantees varies, and in certain cases, may be indefinite. The majority of these indemnities, commitments and guarantees may not provide for any limitation of the maximum potential for future payments the Company could be obligated to make. The Company has not recorded any liability for these indemnities, commitments and guarantees in the accompanying consolidated balance sheets.
6. Segment and Geographical Information
Segment Information Public companies are required to report financial and descriptive information about their reportable operating segments as required by FASB ASC Topic No. 280, Segment Reporting. The Company has two primary business units based on how management internally evaluates separate financial information, business activities and

F-20
management responsibility. Wireless includes our connectivity and security management, mobile VPN, media and content management, device management, Push-To-Talk, Visual Voicemail, contact and calendar syncing and video content delivery and optimization solutions. Productivity & Graphics includes retail and direct sales of our compression and broad consumer-based software. “Corporate/Other” revenue includes the consulting portion of our services sector which has been de-emphasized and is no longer considered a strategic element of our future plans. The Company does not separately allocate operating expenses to these business units, nor does it allocate specific assets. Therefore, business unit information reported includes only revenues. The following table shows the revenues generated by each business unit (in thousands):
2008Wireless 118,684$ 89,420$ 73,219$ Productivity & Graphics 11,399 17,014 23,925 Corporate/Other 418 845 1,280 Total revenues 130,501 107,279 98,424 Cost of revenues 15,507 15,486 20,108 Gross profit 114,994$ 91,793$ 78,316$
Year Ended December 31,2010 2009
Our three largest customers (Verizon Wireless, Sprint and AT&T) were in the Wireless segment and each exceeded 10% of revenues and accounted for 66.3% of our revenues in fiscal year 2010. For fiscal year 2009, our four largest customers (Verizon Wireless, Dell, Sprint and AT&T) were in the Wireless segment and each exceeded 10% of revenues and accounted for 65.7% of our revenues. For fiscal year 2008, our three largest customers (Verizon Wireless, AT&T and Sprint) were in the Wireless segment and accounted for 48.1% of our revenues.
Geographical Information During the years ended December 31, 2010, 2009 and 2008, the Company operated in three geographic locations: the Americas, Asia Pacific and EMEA (Europe, the Middle East, and Africa). Revenues attributed to the geographic location of the customer’s bill-to address, were as follows (in thousands):
Year ended December 31,2010 2009 2008
Americas 121,495$ 99,172$ 88,350$ Asia Pacific 1,889 3,705 5,011EMEA 7,117 4,402 5,063 Total revenues 130,501$ 107,279$ 98,424$
The Company does not separately allocate specific assets to these geographic locations.
7. Profit Sharing The Company offers its employees a 401(k) plan, in which the Company matches the employee contribution at a rate of 20%, subject to a vesting schedule. Total employer contributions amounted to $0.6 million, $0.4 million and $0.3 million for the years ended December 31, 2010, 2009 and 2008, respectively.
8. Stock-Based Compensation
Stock Plans On July 28, 2005, our Shareholders approved the 2005 Stock Option / Stock Issuance Plan (“2005 Plan”). The 2005 Plan, which became effective the same date, replaced the 1995 Stock Option / Stock Issuance Plan (“1995 Plan”), which expired on May 24, 2005. All outstanding options under the 1995 Plan remained outstanding, but no further grants will be made under that Plan. The 2005 Plan provides for the issuance of non-qualified or incentive stock options and restricted stock to employees, non-employee members of the board and consultants. The exercise price per share for option grants is

F-21
not to be less than the fair market value per share of the Company’s common stock on the date of grant. The Board of Directors has the discretion to determine the vesting schedule. Options may be exercisable immediately or in installments, but generally vest over a four-year period from the date of grant. In the event the holder ceases to be employed by the Company, all unvested options terminate and all vested options may be exercised within a period following termination. In general, options expire ten years from the date of grant. Restricted stock is valued using the closing stock price on the date of the grant. The total value is expensed over the vesting period of 12 to 48 months. The maximum number of shares of the Company’s common stock that were available for issuance over the term of the original 2005 Plan previously could not exceed 5,000,000 shares, plus additional shares equal to 2.5% of the number of shares of common stock outstanding on the last trading day of the calendar year commencing with calendar year 2006, but not in excess of 750,000 shares. On October 11, 2007, our shareholders voted to approve an amendment to the 2005 Plan to increase the maximum number of shares of common stock that may be issued under the 2005 Plan from 5,000,000 shares (plus an annual increase) to 7,000,000 shares (plus an annual increase).
Employee Stock Purchase Plan The Company has a shareholder approved employee stock purchase plan (“ESPP”), under which substantially all employees may purchase the Company’s common stock through payroll deductions at a price equal to 85% of the lower of the fair market values of the stock as of the beginning and end of six-month offering periods. An employee’s payroll deductions under the ESPP are limited to 10% of the employee’s compensation and employee’s may not purchase more than the lesser of $25,000 of stock, or 1,000 shares, for any calendar year. Additionally, no more than 1,000,000 shares may be purchased under the plan.
Rule 10b5-1 Trading Plans On September 16, 2010, William W. Smith, Jr., the President and Chief Executive Officer of the Company entered into a pre-arranged stock trading plan to sell a maximum of 200,000 shares of Company common stock on behalf of The William W. Smith, Jr. Revocable Trust, a trust for which Mr. Smith serves as trustee. The plan was established as part of Mr. Smith’s individual long-term strategy for asset diversification and liquidity. All of the shares had been sold as of October 7, 2010. The plan was adopted in accordance with guidelines specified under Rule 10b5-1 of the Securities Exchange Act of 1934, as amended, and the Company’s policies regarding stock transactions. The transactions under the plan were disclosed publicly with the Securities and Exchange Commission as required by applicable securities laws.
Stock Compensation Expense The Company accounts for all stock-based payment awards made to employees and directors based on their fair values and recognized as compensation expense over the vesting period using the straight-line method over the requisite service period for each award as required by FASB ASC Topic No. 718, Compensation-Stock Compensation.
Valuation of Stock Option and Restricted Stock Awards The weighted average grant-date fair value of stock options granted during the years ended December 31, 2010, 2009 and 2008 was $2.97, $3.23 and $3.74, respectively. The assumptions used to compute the share-based compensation costs for the stock options granted during the years ended December 31, 2010, 2009 and 2008, respectively, using the Black-Scholes option pricing model, were as follows:
Year Ended December 31,2010 2009 2008
AssumptionsRisk-free interest rate (average) 0.3% 0.5% 2.8%Expected dividend yield - - -Weighted average expected life (years) 1 1 4Volatility (average) 72.0% 71.0% 71.0%Forfeiture rate - - 3.5%
The risk-free interest rate assumption was based on the United States Treasury’s rates for U.S. Treasury zero-coupon bonds with maturities similar to those of the expected term of the award being valued. The Company assumed no dividend yield because it does not expect to pay dividends for the foreseeable future. The weighted average expected life is the vesting period for those options granted during that period. The average volatility is based on the actual historical volatility of our common stock.

F-22
Grants of restricted stock are valued using the closing stock price on the date of grant. In the year ended December 31, 2010, a total of 55,000 shares of restricted stock, with a total value of $0.5 million, were granted to non-employee members of the Board of Directors. This cost will be amortized over a period of 12 months. In addition, 0.9 million shares of restricted stock, with a total value of $7.3 million, were granted to key officers and employees of the Company. This cost will be amortized over a period of 48 months.
Valuation of ESPP The Company’s initial six-month offering period began on October 1, 2010. The fair value of the offering is $3.98 and was estimated on the date of grant using a Black-Scholes valuation model that uses the assumptions noted in the following table. The risk-free rate is based on the U.S. treasury yield curve in effect at the time of grant. Expected volatility was based on the historical volatility on the day of grant.
Assumptions Year Ended December 31, 2010
Risk-free interest rate (average) .18% Expected dividend yield - Weighted average expected life (years) .5 Volatility (average) 72.0%
Compensation Costs Stock-based non-cash compensation expenses related to stock options and restricted stock grants were recorded in the financial statements as follows (in thousands):
2010 2009 2008Cost of revenues 101$ 184$ 430$ Selling and marketing 2,529 2,498 3,460 Research and development 2,505 2,514 3,201 General and administrative 4,361 3,528 4,886 Total non-cash stock compensation expense 9,496$ 8,724$ 11,977$
Year Ended December 31,
Total share-based compensation for each year includes cash payment of income taxes related to grants of restricted stock in the amounts of $2.1 million, $1.1 million and $1.2 million for the years ended December 31, 2010, 2009 and 2008, respectively.
Stock Options A summary of the Company’s stock options outstanding under the 2005 Plan as of December 31, 2010 and the activity during the years ended herein are as follows (in thousands except per share amounts):

F-23
Weighted Ave. AggregateShares Exercise Price Intrinsic Value
Outstanding as of December 31, 2007 4,654 11.33$ (911 options exercisable at a weighted average exercise price of $4.93)Granted (weighted average fair value of $3.74) 135 7.51$ Exercised (49) 2.64$ Cancelled (451) 14.28$ Outstanding as of December 31, 2008 4,289 10.94$ (2,481 options exercisable at a weighted average exercise price of $9.31)Granted (weighted average fair value of $3.23) 25 11.59$ Exercised (414) 4.02$ Cancelled (364) 14.56$ Outstanding as of December 31, 2009 3,536 11.29$ (2,754 options exercisable at a weighted average exercise price of $10.55)Granted (weighted average fair value of $2.97) 20 10.51$ Exercised (760) 9.55$ Cancelled (90) 13.80$ Outstanding as of December 31, 2010 2,706 11.69$ -$
Exercisable as of December 31, 2010 2,545 11.54$ 10,700$
Vested and expected to vest at December 31, 2010 2,706 11.69$ 11,000$
During the year ended December 31, 2010, options to acquire 760,000 shares were exercised with an intrinsic value of $4.7 million, resulting in cash proceeds to the Company of $7.3 million. The weighted-average grant-date fair value of options granted during the year ended December 31, 2010 was $2.97. For the year ended December 31, 2010, there were $0.8 million of total unrecognized compensation costs related to non-vested stock options granted under the Plan, which will be recognized over next year. At December 31, 2010, there were 1.5 million shares available for future grants under the 2005 Stock Issuance / Stock Option Plan. Additional information regarding options outstanding as of December 31, 2010 is as follows:
Options outstanding Options exercisable Weighted average Weighted Weighted
Range of Number remaining average Number average exercise outstanding contractual exercise exercisable exercise
prices (in thousands) life (years) price (in thousands) price
$0.24 - $4.00 162 3.2 1.58$ 162 1.58$ $4.01 - $6.00 469 4.9 4.95$ 469 4.95$ $6.01 - $12.00 181 6.8 8.81$ 160 8.93$ $12.01 - $14.00 895 6.1 12.65$ 838 12.65$ $14.01 - $16.00 630 6.2 15.18$ 589 15.18$
$16.01 - $19.00 369 6.4 17.77$ 327 17.82$ 2,706 5.8 11.69$ 2,545 11.54$
Restricted Stock Awards A summary of the Company’s restricted stock awards outstanding under the 2005 Plan as of December 31, 2010, and the activity during years ended therein, are as follows (in thousands):

F-24
Number Weighted averageof shares grant date fair value
Unvested at December 31, 2007 350 12.32$ Granted 1,164 7.73$ Vested (444) 10.59$ Cancelled (72) 11.16$ Unvested at December 31, 2008 998 7.82$ Granted 1,031 5.06$ Vested (472) 7.17$ Cancelled (142) 5.26$ Unvested at December 31, 2009 1,415 6.28$ Granted 933 8.27$ Vested (679) 6.50$ Cancelled and forfeited (65) 9.25$ Unvested at December 31, 2010 1,604 7.23$
9. Comprehensive Income Comprehensive income includes unrealized gains and losses on short-term investments of corporate notes, bonds, and commercial paper and U.S. government agency and government sponsored enterprise debt and equity securities. The following table sets forth the calculation of comprehensive income (in thousands):
Year Ended December 31,2010 2009 2008
Net income (loss) 12,346$ 4,752$ (732)$ Change in unrealized gain (loss) on investments, after tax (8) (71) 69 Total comprehensive income (loss) 12,338$ 4,681$ (663)$
10. Subsequent Events In May 2009, the FASB issued new accounting guidance found under ASC Topic No. 855, Subsequent Events. The Topic establishes general standards of accounting for and disclosure of events that occur after the balance sheet date but before the financial statements are issued or are available to be issued. The Company has adopted this Topic. Subsequent events have been evaluated as of the date of this filing and there are no further disclosures required.

F-25
11. Quarterly Financial Data (Unaudited) The following financial information reflects all normal recurring adjustments, which are, in the opinion of management, necessary for a fair statement of the results of the interim periods. Summarized quarterly data for fiscal 2010 and 2009 are as follows (in thousands, except per share data):
1st Quarter 2nd Quarter 3rd Quarter 4th QuarterSelected quarterly financial data:Revenues 29,862$ 31,357$ 34,008$ 35,274$ Gross profit 26,130$ 27,392$ 30,237$ 31,235$ Operating income 2,906$ 3,682$ 5,862$ 5,931$ Net income 1,592$ 1,885$ 3,094$ 5,775$
Net income per share, basic (1) 0.05$ 0.06$ 0.09$ 0.17$
Weighted average shares outstanding, basic 33,730 34,264 34,274 34,540
Net income per share, diluted (1) 0.05$ 0.05$ 0.09$ 0.16$
Weighted average shares outstanding, diluted 34,176 34,781 34,736 35,111
1st Quarter 2nd Quarter 3rd Quarter 4th QuarterSelected quarterly financial data:Revenues 23,788$ 25,986$ 27,820$ 29,685$ Gross profit 19,265$ 22,064$ 24,280$ 26,184$ Operating income 389$ 2,683$ 4,138$ 3,899$ Net income 278$ 1,277$ 1,981$ 1,216$
Net income per share, basic (1) 0.01$ 0.04$ 0.06$ 0.04$
Weighted average shares outstanding, basic 31,675 32,338 32,523 33,200
Net income per share, diluted (1) 0.01$ 0.04$ 0.06$ 0.04$
Weighted average shares outstanding, diluted 31,904 32,955 33,145 33,675
Year ended December 31, 2009
Year ended December 31, 2010
(1) Basic and diluted net income per share is computed independently for each of the quarters presented. Therefore, the sum of the quarterly per share amounts will not necessarily equal the total for the year.

S-1
SCHEDULE II - VALUATION AND QUALIFYING ACCOUNTS FOR EACH OF THE THREE YEARS
IN THE PERIOD ENDED DECEMBER 31, 2010 (In thousands)
Additions Balance at charged to Balance at
beginning of costs and end of period expenses Deductions period
Allowance for accounts receivable (1): 2010 1,045$ 851$ (1,041)$ 855$ 2009 1,204 1,596 (1,755) 1,045 2008 684 1,170 (650) 1,204
Allowance for excess and obsolete inventory: 2010 1,221$ 203$ (866)$ 558$ 2009 404 1,063 (246) 1,221 2008 102 435 (133) 404
(1) Allowances are for retail return reserves, marketing development funds and doubtful accounts.

EXHIBIT 21.1
SUBSIDIARIES OF THE REGISTRANT
1. Allume Systems, Inc., a California corporation.
2. Tag Acquisition Corporation II, a Delaware corporation.
3. E Frontier Acquisition Corporation, a Delaware corporation.
4. IS Acquisition Sub, Inc., a Delaware corporation.
5. Tel Acquisition Corporation, a Delaware corporation.
6. STF Technologies, Inc., a Missouri corporation.
7. Smith Micro Software LLC Belgrade, a Serbia corporation.
8. Smith Micro Software AS, a Norwegian corporation.
9. Smith Micro Software UK Limited, a United Kingdom corporation.
10. William W. Smith Software Canada. Ltd., a Canadian corporation.
11. Smith Micro Software, Asia Limited, a Hong Kong corporation.
12. Mobility Acquisition Corporation, a Delaware corporation.
13. Core Mobility, Inc., a Delaware corporation.

EXHIBIT 23.1
CONSENT OF INDEPENDENT REGISTERED PUBLIC ACCOUNTING FIRM
We consent to the incorporation by reference in Registration Statement (Nos. 333-02418, 333-40106, 333-62134, 333-121330, 333-123042, 333-129132, 333-149222, and 333-169671) on Form S-8, Registration Statement (Nos. 333-123821, 333-128695, 333-134611, 333-137408, and 333-161658) on Form S-3 and Registration Statement (No. 333-161659) on Form S-4 of Smith Micro Software, Inc. of our reports dated February 25, 2011 relating to our audits of the consolidated financial statements, and the financial statement schedule, and internal control over financial reporting, which appear in this Annual Report on Form 10-K of Smith Micro Software, Inc. for the year ended December 31, 2010.
/s/ SINGERLEWAK LLP Los Angeles, California February 25, 2011