Embed Size (px)
Citation preview

Appendix F. Denver Region and Peer City Assessments

Denver Region and
Peer City Assessments
Prepared by:
February 2019

Appendix F. Denver Region and Peer City Assessments
February 2019 F-1
Contents Page No.
1.0 Introduction ........................................................................................................................................... 2
2.0 Approach ............................................................................................................................................... 2 2.1 Peer Cities ......................................................................................................................................... 2 2.2 Assessment Framework .................................................................................................................... 2
3.0 Technology Readiness Assessment ..................................................................................................... 4 3.1 Technology Categories ...................................................................................................................... 4 3.2 Technology Adoption Lifecycle .......................................................................................................... 5 3.3 Scoring Methodology ......................................................................................................................... 5 3.4 Technology Readiness Assessment Results .................................................................................... 6
4.0 Technology Programs Assessment .................................................................................................... 18 4.1 Agency Technology Programs ........................................................................................................ 18 4.2 Existing Coordination and Funding .................................................................................................. 20 4.3 Desired Collaboration and Outcomes .............................................................................................. 20 4.4 Peer City Interview Summaries ....................................................................................................... 21
Attachment A. Regional Profiles Attachment B. Denver Regional Agency Interviews Attachment C. Peer City Interviews

Appendix F. Denver Region and Peer City Assessments
February 2019 F-2
1.0 Introduction As transportation technologies continue their rapid development and deployment in cities and regions around the country, it is important to understand how the Denver region is utilizing elements of the transportation technology toolbox and where there are opportunities for improvement. This document describes a comparative analysis between the Denver region and 10 other peer city regions throughout the United States that were selected for their similar sizes, high growth rates, and their early embrace of transportation technologies.
The analysis consisted of two parts:
First, a comparative readiness assessment was conducted to show how the Denver region compares in its deployment of technology, and to indicate any lags or gaps.
The second aspect of the analysis focused on an assessment of the current technology programs of the Mobility Choice Blueprint partner agencies: the Colorado Department of Transportation (CDOT), the Denver Regional Council of Governments (DRCOG) the Regional Transportation District (RTD), and the Denver Metro Chamber of Commerce. In addition, a review of such practices of the peer cities was conducted.
2.0 Approach
2.1 Peer Cities To assist in understanding how the Denver area compares nationally in adoption of transportation technology, the following 10 regions were selected for comparison:
Austin, TX Columbus, OH Nashville, TN Portland, OR Seattle, WA
Boston, MA Minneapolis, MN Pittsburgh, PA San Francisco, CA Tampa, FL
These regions were selected for their past and current activities and interest in implementing transportation technologies. The project team sought information from key transportation agencies in these regions including the primary city anchoring the region, the local Metropolitan Planning Organization (MPO), the regional transit agency, and the state department of transportation. It is through these primary agencies that transportation technologies are implemented in a region; either as a result of direct public investment, or through enactment of policies and regulations facilitating private investment. In many of these regions, partnerships were developed or are in the process of being developed between the public sector and private businesses or academia and research institutions.
2.2 Assessment Framework Three primary types of information were used to inform the peer region assessment:
Regional demographics Technology deployment research Telephone interview questions.

Appendix F. Denver Region and Peer City Assessments
February 2019 F-3
The demographic information is used to give context to each peer city, while the specific technology deployment information was used to determine each peer region’s indexed score within the five technology categories.
2.2.1 Regional Demographics Demographic information on each region is included in this report to provide a context for the results of web research and stakeholder interviews on transportation technology. Information from the US Census 1-year ACS data was used, in addition to the American City Business Journals where needed.
2.2.2 Technology Deployment Research Web research was conducted for each peer region to develop a matrix of the types, scale and phase of technology implementation in each of the ten chosen regions for this report. Websites searched included those for cities, metropolitan planning organizations (MPOs), transit agencies, state transportation departments, professional organizations, and media outlets. The level of information relating to technology implementation available online varied greatly, with some agencies providing robust levels of information on websites, while web information on other agencies was practically nonexistent. When information was missing or unclear, attempts to obtain the information were made through the agency phone interviews.
2.2.3 Agency Phone Interviews Following up to web research, interviews were conducted with key individuals representing regional stakeholders to further develop an understanding of each region’s status in adopting transportation technology. Nine key questions were asked of the representatives themed around collaboration, geography, status, cost, and impressions on difficulty and lessons learned. In some cases, agency representatives answered all questions asked, and in other, a select number of questions were answered:
1. What programs, policies, or initiatives for integrating new transportation technologies are currently in place within your region?
2. Is there a regional collaboration for deployment, and what is the process for coordination between various agencies and private companies in your region?
3. Who are the transportation technology leading agencies in your region, and which agency is leading adoption in your region?
4. How does your city collect, share, fund, and use Big Data to improve transportation?
5. Where are the transportation technologies being deployed in your region, what is their status, and how long do the technologies take to implement? Has your region considered and decided against deployment of transportation technologies?
6. What is the funding source, cost and return on investment for technology deployment?
7. Do you have any "lessons learned" or success stories from ongoing programs, policies, or initiatives related to new transportation technologies? What are the barriers to deploying transportation technology in your region, and is there a particular technology complex to deploy?
8. Where do you consider your region in the technology adoption lifecycle?
9. How would you rate your region’s technology readiness?
Appendix F. Denver Region and Peer City Assessments
February 2019 F-4
3.0 Technology Readiness Assessment
3.1 Technology Categories There are a number of technologies that have been developed and deployed during the past several years. The rapid pace of technological advancement in transportation may bring about a sea change for government transportation departments and the traveling public. Key technological improvements help facilitate communication, improve safety, monitor the state of roadways, help optimize the system, and facilitate different modes of transportation.
There are five broad categories of technologies that are emerging within the transportation market. These technology categories include:
1. Enabling Technologies: These technologies are fundamental elements for other technological implementations (e.g. Traffic signal fiber optics, 5G cell network, or electric vehicle charging infrastructure).
2. Safety: These technologies are focused directly upon improving the safety of a component(s) of the transportation system. These technologies will have a direct and measurable improvement on safety (e.g. vehicle (personal, transit, freight, maintenance) collision/warning detection, emergency vehicle preemption, or pedestrian detection).
3. Monitoring and Detection: These technologies involve various methods and approaches for detecting vehicles and/or incidents as well as monitoring roadway conditions (e.g. Roadway cameras, or road weather information systems).
4. Operational Optimization: These technologies include the set of technologies that are designed and deployed with the express purpose of improving the management of the transportation system through optimizing vehicle travel throughout a corridor (e.g. Ramp metering, HOV lanes, or smart tolling).
5. Mode/Travel Demand Change: These technologies facilitate the use of modes other than single-occupant vehicles (SOVs) for travel. They also include those technologies that are used to shift transportation demand from peak congestion periods (e.g. Microtransit, light rail, or integrated multi-modal trip planning and payment systems), and better inform travelers of traffic and travel conditions.
6. For each of these categories, an indexed scale was created to compare the Denver region to its peer regions, using information gathered through research and through telephone interviews with key staff from the region. The research is intended to demonstrate areas where the region is leading, and where it has potential room for improvement.

Appendix F. Denver Region and Peer City Assessments
February 2019 F-5
3.2 Technology Adoption Lifecycle The technology adoption lifecycle (Figure 1) is a sociological model that describes the adoption or acceptance of a new product or innovation, according to the demographic and psychological characteristics of defined adopter groups. The process of adoption over time is typically illustrated as a classical normal distribution or "bell curve". The model indicates that the first group of people to use a new product is called "innovators", followed by "early adopters". Next come the early majority and late majority, and the last group to eventually adopt a product are called laggards. Information obtained from the agency interviews provides additional insight into where that agency is perceived to be on the technology adoption lifecycle, and how the Denver region compares nationally.
3.3 Scoring Methodology Following the web-based information research and agency interviews, the project team applied an index of technology adoption so comparisons could be drawn between Denver and the ten selected regions.
The information obtained through research and interviews included the scale and phase of technology implementation for specific technologies within each of the five transportation technology categories.
The information was synthesized using a scoring methodology to then draw comparisons and form insights. The phasing of each technology was categorized into one of the four phases listed below, each assigned with a score:
None (0 points) indicates that no plans exist for deployment of a project or program. Long range plans with no specific initiative to launch are grouped into this category.
Planned (3 points) indicates that a project or program has been identified as a need, with at least some planning or design having taken place.
Launching (6 points) indicates a project or program has been allocated funding, has a specific launch date, and is in process of becoming operational.
Operational (10 points) indicates a project or program is currently fully operational.
Because the scale of deployments is important, a multiplier was included with each of the technologies as well. The scale categories are below, along with their corresponding multipliers:
Pilots (1point)
Select locations (2 points)
Deployments widely available to a region (3 points)
Each of the five technology categories had a series of specific technologies listed, for which the deployment phases and scale were determined. The scores were multiplied to receive a raw score that was indexed to a scale of 0-10. The individual technology scores were then averaged for each category,
Figure 1

Appendix F. Denver Region and Peer City Assessments
February 2019 F-6
resulting in an indexed 0-10 scale of technology deployment phase and scale for each of the five categories.
For example, if a city is launching a limited deployment of technology within a region, they would receive an indexed score of 3 out of 10. If they were launching a widely available technology, they would receive an indexed score of 6 out of 10.
While this method is not comprehensive, it does provide an easily comparable benchmark of which cities are deploying technologies in the five categories. The specific results for each category and specific takeaways from each peer city region are outlined in the Appendix.
3.4 Technology Readiness Assessment Results Denver, along with most of the ten US regions selected for comparison, is expected to grow substantially over the next decade and a half. Along with ever-increasing lifespans and an aging population, this growth in population to rapidly expanding cities is a substantial factor pushing regions to plan and implement new transportation technologies. As growth in these regions continues, the continued dependence on single occupancy vehicles will add to further traffic congestion and a deterioration of roadway safety. The growing array of new transportation technologies is creating new opportunities to address these issues.
3.4.1 Demographic and Transportation Trends
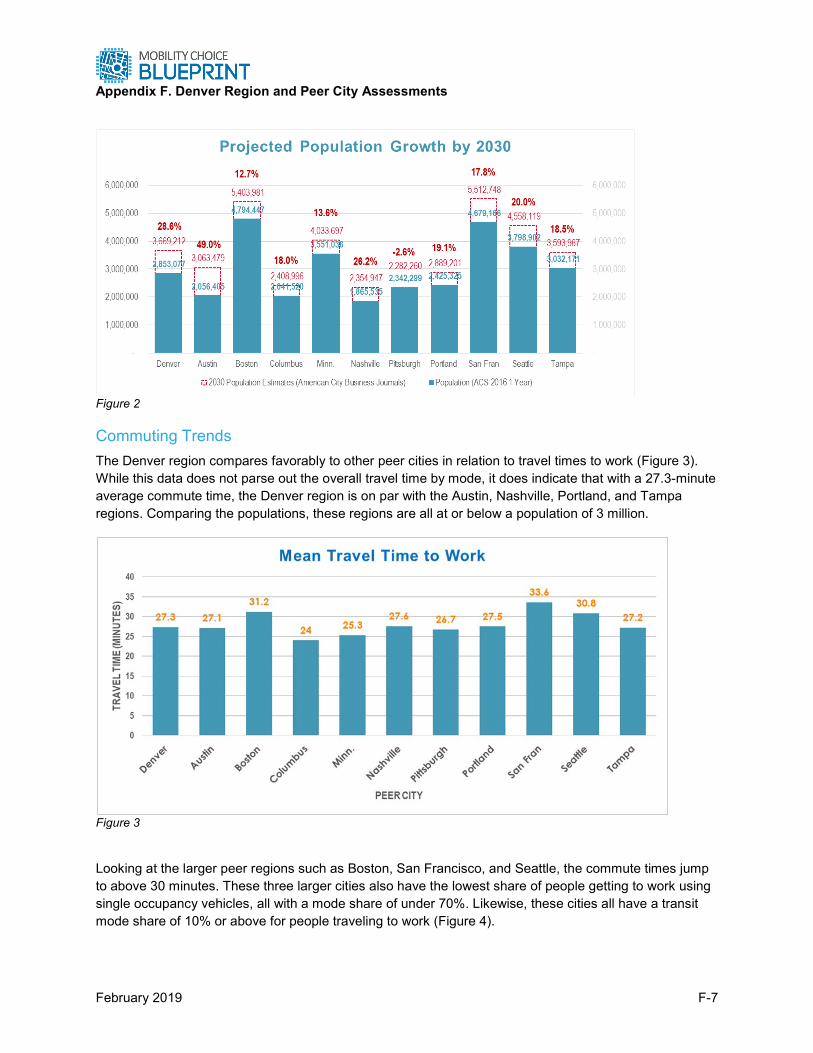
Population Growth The Denver metro area is projected to grow by 29% by 2030, from a current population of over 2.8 million to nearly 3.7 million, according to the American City Business Journals. This projected growth compares with population projections for the peer regions, which range from a slight drop in projected population in the Pittsburgh area (-2.6%) to a robust 49% growth projected for the Austin region. For the purpose of comparing the Denver region to its peer city regions, data from the American City Business Journal was used to keep consistency with the methodology used throughout all the regions. It should be noted that the data projection for the Denver region into 2030 is lower than the forecasts projected by DRCOG. The intent of this comparison is to show the potential growth of each of the peer cities using a common data source, not to provide a basis for specific decisions on the growth of the Denver region. Figure 2 provides a comparison between Denver and the other peer cities surveyed for this report.
Appendix F. Denver Region and Peer City Assessments
February 2019 F-7
Figure 2
Commuting Trends The Denver region compares favorably to other peer cities in relation to travel times to work (Figure 3). While this data does not parse out the overall travel time by mode, it does indicate that with a 27.3-minute average commute time, the Denver region is on par with the Austin, Nashville, Portland, and Tampa regions. Comparing the populations, these regions are all at or below a population of 3 million.
Figure 3
Looking at the larger peer regions such as Boston, San Francisco, and Seattle, the commute times jump to above 30 minutes. These three larger cities also have the lowest share of people getting to work using single occupancy vehicles, all with a mode share of under 70%. Likewise, these cities all have a transit mode share of 10% or above for people traveling to work (Figure 4).

Appendix F. Denver Region and Peer City Assessments
February 2019 F-8
This data indicates a correlation between the peer city’s size and its commute time and mode share. This could be a function of policy, parking availability, congestion, or development pattern. Looking at the potential growth of the Denver region into 2030, the population could reach 3.6 million people, potentially bringing the same transportation challenges that are present in larger regions.
Figure 4
3.4.2 Technology Categories The results of the web-based research and agency interviews for Denver and the selected peer regions have been compiled into comparison charts and are provided in the following sections of this report. Key observations of research results are highlighted in each technology category.

Appendix F. Denver Region and Peer City Assessments
February 2019 F-9
Enabling Technologies Enabling technologies are fundamental elements for other technological components, and include the following:
Fiber optic network for traffic signal systems
5G cell network
Dedicated Short Range Communications (DSRC) for Autonomous Vehicle and Connected Vehicle (AV/CV) operations
Electric Vehicle Charging Infrastructure for plug-in battery electric and hybrid vehicles
Integrated online exchanges for publicly available, multi-agency data
E-government (online government access and business, e-permits, pothole reporting)
Smart streetlights with elements including LED bulbs, motion detection, sensors, and public Wi-Fi
Way finding and trip planning smartphone apps
Denver compares at or above most other regions in their deployment of enabling technologies (Figure 5).
Pittsburgh and San Francisco have the highest technology adoption scores, supported primarily from government support for fiber optic networks supporting traffic signal systems, and integrated data exchanges. The maturity of these services support implementation of DSRC, primarily as pilots in many of the cities with the highest scores.
DSRC technologies are either being planned for implementation, being launched or in the case of Minneapolis, already operational as a pilot. Most regions are planning or launching pilots of DSRC technology before expanding throughout the region. With the exception of Austin, those cities with the highest scores also have received funding in the form of federal grants through programs (CV Pilot in Tampa, Smart City Challenge in Columbus, Advanced Transportation and Congestion Management Technologies Deployment in Seattle, Pittsburgh and San Francisco).
Figure 5
5.5 5.65.1
5.6 5.34.5
6.3
3.6
6.7
5.0 4.7
0
1
2
3
4
5
6
7
8
9
10
IND
EX S
CO
RE
Enabling Technologies

Appendix F. Denver Region and Peer City Assessments
February 2019 F-10
Safety Technologies Four transportation technologies were inventoried for implementation in peer cities including:
Vehicle-to-Infrastructure (V2I) connected vehicle safety applications
Transit collision/warning detection
Emergency vehicle preemption
Pedestrian/bicycle detection
V2I applications support notifications to drivers of vehicles with technology able to receive from public infrastructure similarly equipped for notifications such as curve warnings and traffic signal red light warnings. Of the peer cities surveyed, only Seattle had an operational V2I application, though scaled only to a pilot.
Detectors on buses and at traffic signals can improve safety of roadway operations for the most vulnerable users such as pedestrians and bicycles, and help prevent collisions with other vehicles, particularly those in blind spots.
Emergency vehicle preemption technology sensors at traffic signals provides green phasing for approaching emergency vehicles, with systems operational in select locations or widely available in all peer cities surveyed. As shown in Figure 6, the regions of Minneapolis, Pittsburgh and Portland have the highest scores. This is due primarily to their deployment of transit collision warning and detection, emergency vehicle preemption, and vehicle detection.
Most of the communities surveyed have recently deployed or are currently planning pilots of safety sensors technologies. Federal transportation grants are funding safety implementation pilots in Tampa, Columbus, Pittsburgh, and San Francisco.
Monitoring and Detection Technologies Monitoring and detection technology is the most widely available and operational technology of all five technology categories in all the regions selected for this report, which include:
Vehicle speed/volume detection
Figure 6
3.8
2.7 2.53.2
5.5
2.4
5.24.3
3.83.3 3.2
0
1
2
3
4
5
6
7
8
9
10IN
DEX
SC
ORE
Safety
Appendix F. Denver Region and Peer City Assessments
February 2019 F-11
Roadway weather information systems (RWIS)
Roadway (traffic) cameras
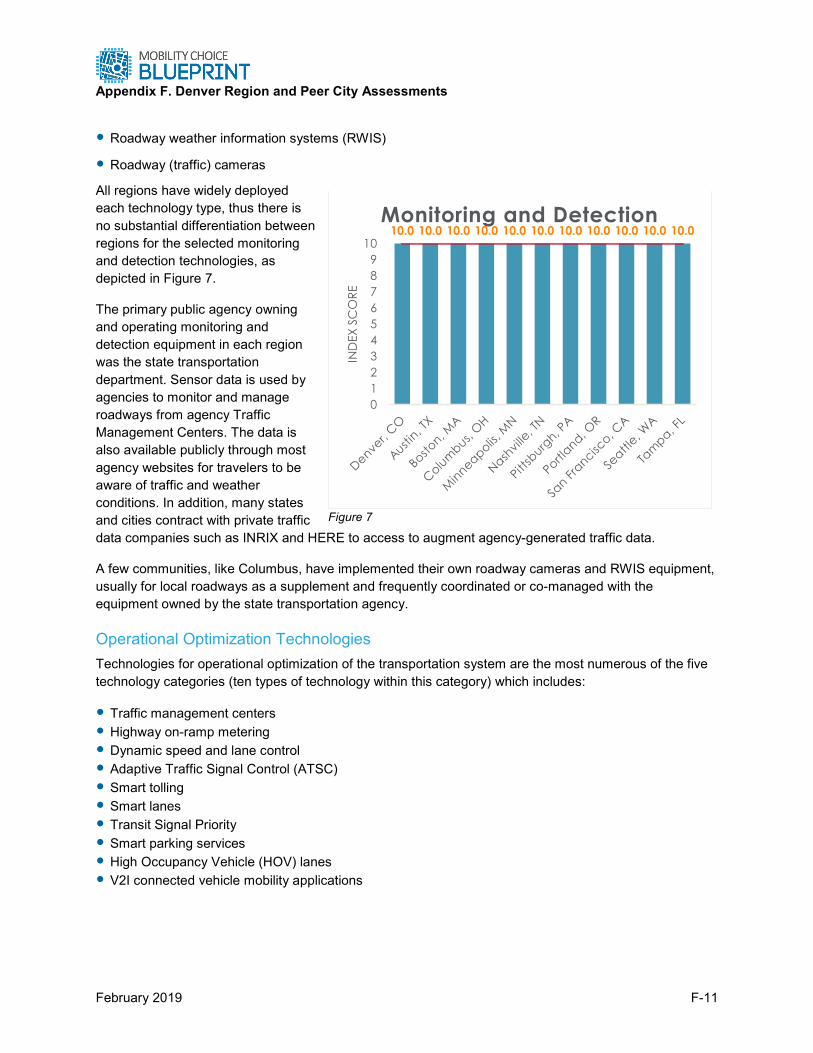
All regions have widely deployed each technology type, thus there is no substantial differentiation between regions for the selected monitoring and detection technologies, as depicted in Figure 7.
The primary public agency owning and operating monitoring and detection equipment in each region was the state transportation department. Sensor data is used by agencies to monitor and manage roadways from agency Traffic Management Centers. The data is also available publicly through most agency websites for travelers to be aware of traffic and weather conditions. In addition, many states and cities contract with private traffic data companies such as INRIX and HERE to access to augment agency-generated traffic data.
A few communities, like Columbus, have implemented their own roadway cameras and RWIS equipment, usually for local roadways as a supplement and frequently coordinated or co-managed with the equipment owned by the state transportation agency.
Operational Optimization Technologies Technologies for operational optimization of the transportation system are the most numerous of the five technology categories (ten types of technology within this category) which includes:
Traffic management centers Highway on-ramp metering Dynamic speed and lane control Adaptive Traffic Signal Control (ATSC) Smart tolling Smart lanes Transit Signal Priority Smart parking services High Occupancy Vehicle (HOV) lanes V2I connected vehicle mobility applications
Figure 7
10.0 10.0 10.0 10.0 10.0 10.0 10.0 10.0 10.0 10.0 10.0
0123456789
10
IND
EX S
CO
RE
Monitoring and Detection

Appendix F. Denver Region and Peer City Assessments
February 2019 F-12
Figure 8 shows that Minneapolis scores the highest in this technology category. In the Minneapolis region, MnDOT has been investing heavily in technologies such as ramp metering, smart tolling, and smart lanes (such as buses allowed on highway shoulders). MnDOT is also piloting a V2I implementation on the section of TH-55 between downtown Minneapolis and I-494. Equipment installed at traffic signals
along the corridor will broadcast traffic signal phasing and timing information to connected vehicles operating in the corridor.
With its federal Advanced Transportation and Congestion Management Technologies Deployment grant awarded in 2016, San Francisco will be piloting dynamic speed and lane control, smart tolling, transit signal priority, HOV lanes, and adaptive traffic signal control technologies.
Mode/Travel Demand Change Technologies Technologies supporting changes in mode and travel demand consist of the following:
Microtransit services (usually for first mile/last mile connections for travelers)
Transportation network companies (TNCs) like Uber and Lyft
Bus rapid transit (BRT) service, street cars, light trail
Mobile transit ticketing
Common payment systems to allow for the purchase of multiple modes of travel for a trip in one payment, usually by smart phone
Carpooling or vanpooling services
As shown in Figure 9, the regions including Boston, Portland, and San Francisco score the highest with the widest range of implementations in this technology category.
The higher scoring cities tended to have robust transit systems that offered a number of multi-modal choices for travelers, featuring extensive rail and BRT networks. The presence of these systems can add or detract from the implementation of other technologies, as the transit system can add to the desirability of other technologies, such as mobile ticketing and common payment systems.
Figure 8
6.9
4.2 4.53.7
7.9
3.6
6.65.9
5.3
6.7
4.9
0
1
2
3
4
5
6
7
8
9
10
IND
EX S
CO
RE
Operational Optimization

Appendix F. Denver Region and Peer City Assessments
February 2019 F-13
Portland and San Francisco are funded through recent federal grants to implement technologies to change mode and travel demand. With funding from the USDOT Mobility on Demand (MOD) grant awarded in 2016, the Portland TriMet transit agency is upgrading its transit trip planning app to include a common payment capability. San Francisco is planning to implement a low speed AV shuttle pilot as one project in its USDOT grant funded projects.
3.4.3 Technology Adoption Lifecycle Responses on opinions of where their agency is on the technology adoption lifecycle are depicted in Figure 10. Not all people interviewed were willing to place their region on a scale, but of those who did, most considered themselves as early adopters of transportation technology. This perception correlates largely with the level of technology implementations researched for the peer regions.
Figure 10
Figure 9
7.86.8
8.77.6
6.7
5.3 5.2
8.5
10.0
7.8
6.1
0123456789
10
IND
EX S
CO
RE
Mode / Travel Demand Change
Innovators SEATTLE
Early Adopters COLUMBUS SEATTLE METRO SAN FRANCISCO TAMPA BOSTON
Early Majority
Late Majority NASHVILLE
Laggards

Appendix F. Denver Region and Peer City Assessments
February 2019 F-14
Figure 11 includes the technology adoption responses from the Denver region through the self-assessment conducted for this project.
Figure 11
3.4.4 Initial Summary The research found the following transportation technologies operational in most regions:
Enabling Technologies: o Traffic signal systems interconnected with fiber optic cables o EV charging infrastructure o Trip planning applications
Safety Technologies: o Emergency vehicle preemption
Monitoring and Detection Technologies: o All technologies considered
Operational Optimization: o Traffic management centers o Highway ramp metering o Dynamic speed/lane control o Adaptive traffic signal control o Smart tolling o Transit signal priority
Innovators RTD
Early Adopters DPW
CDOT
Early Majority CDOT
Late Majority HPTE
Laggards

Appendix F. Denver Region and Peer City Assessments
February 2019 F-15
o Smart parking o HOV lanes
Mode/Travel Demand Change: o Bus rapid transit, street car or light rail o Mobile ticketing for transit o Carpooling/ridesharing services
The following technologies are planning or launching soon in most cities:
Enabling Technologies: o Dedicated Short Range Communications (DSRC) for AV/CV o 5G cellular service
Safety: o V2I connected vehicle safety applications o Pedestrian detection
Mode/Travel Demand Change: o Microtransit servicess o Multi-modal common payment system
What follows are insights on what is the Denver region doing well with transportation technologies, where can the Denver region improve in implementing transportation technologies, how the peer regions are using transportation technologies differently, and lastly, key takeaways that the Denver region should consider for further action.
3.4.5 How Are Peer Cities Using Technology Differently?
Enabling Technologies The State of Minnesota Department of Transportation (MnDOT) is implementing the TH-55 Connected Corridor project, a key regional arterial to be outfitted with Connected Vehicle (CV) communications infrastructure enabling exchange of information with nearby vehicles. This Vehicle-to-Infrastructure (V2I) technology, deployed at traffic signals, will allow for deployment of a number of applications to improve safety and efficiency of roadway users. In additions, ramp intersections along the parallel I-394 corridor may be outfitted with connected vehicle infrastructure to allow for additional applications related to integrated corridor management. The backbone of the Connected Corridor project will be the broadcast of Signal, Phase and Timing (SPaT) information to vehicles directly from traffic signal controllers along the corridor. SPaT data can enable a number of high-value applications that have been identified as initial use cases for a national connected vehicle deployment. In addition, MnDOT will be developing the communications infrastructure and data management systems to support a range of existing and future technologies. The data exchange system will enable the merging of data from multiple sources, as well as sharing of agency data with third parties, to improve information-sharing and enable more efficient system management.
The Columbus Traffic Signal System project, a $79 million, multi-year program nearing completion will link 1,400 traffic signals in the central Ohio region to the Columbus traffic management center. The traffic signals include those owned by Columbus, Franklin County and many of the surrounding suburbs. In
Appendix F. Denver Region and Peer City Assessments
February 2019 F-16
addition, the Columbus TMC is coordinated with the Ohio Department of Transportation TMC, and traffic operations in Dublin, one of Columbus’s suburbs with a more advanced traffic signal system. The coordination of the traffic signals management with ODOT freeway operations gives the region the ability to adjust arterial street traffic flows when construction, accidents of other activities influence traffic flow in the region. The open architecture of the CTSS management software will enable Columbus to add CV and DSRC capabilities of the system, which will commence through its Smart Columbus program beginning in 2019.
Safety King County Metro Transit is one of eight Washington State transit agencies that are piloting technology to help transit vehicles avoid crashes with pedestrians, bicycles, and vehicles. The statewide pilot was announced in 2016. Each of the buses used in the pilot are outfitted with sensors, which trigger warning alerts to drivers. The system scans for pedestrians and bicyclists, and alerts bus drivers of imminent collisions with visual and audio warning alerts drivers before they occur, providing the driver time to take evasive action. The system also monitors following distance, warns drivers of an imminent rear-end collision, alerts drivers if their bus strays from its lane without an active turn signal, and notifies drivers if the bus exceeds the posted speed limit.
Monitoring and Detection The Seattle Department of Transportation (SDOT) collects and maintains volume data for vehicles (including trucks), pedestrians, and bicycles. Engineers and planners use volume data to select future project locations, support grant applications, and track the performance of traffic projects once they are installed. SDOT also collects vehicle speed data. Speed data is particularly useful for making traffic safety decisions such as those connected with traffic calming, Safe Routes to School, Seattle’s Vision Zero Plan and crossing improvements. Speed data can also be reprocessed into vehicle classification data that categorizes vehicles in up to 13 different groups, including motorcycles, cars, and numerous types of trucks. Such data gives planners and engineers a better understanding of the movement of goods within the city. Traffic volumes, speeds, and reported collisions are the three cardinal pieces of data traffic engineers and planners use to evaluate changes to Seattle streets.
The Smart Columbus program has established a partnership with INRIX to use their data to measure effectiveness of their connected vehicle pilots. Smart Columbus is also using the INRIX traffic data to inform their decisions on where to install electric vehicle charging infrastructure (ESVE) in the region.
Operational Optimization Tennessee DOT has four Traffic Management Centers (TMCs) in the state, including one in Nashville. With continued expansion of the SmartWay Program, the system now covers 342 centerline miles. There are statewide 418 urban and 57 rural cameras used to visually monitor Tennessee’s roadways. In addition, they have access to 163 Dynamic Message Signs, 1205 radar detection systems to spot traffic flow interruptions, 49 video cameras, and a city-wide highway advisory radio station broadcasting on AM 1620.
The city of Tampa has implemented an Active Traffic Management (ATM) Program to mitigate recurring and nonrecurring congestion by communicating observations in report form, bi-daily while using tools such as WAZE and Twitter to provide information to the motoring public in an effort to better manage traffic in real time.

Appendix F. Denver Region and Peer City Assessments
February 2019 F-17
Mode/Travel Demand Change Through its Smart Columbus program, the city of Columbus is working with area parking owners, the City’s parking services, the regional visitors and convention authority, Experience Columbus, and technology companies to provide a unified parking experience for visitors to the downtown. The City is planning for a smartphone app to be able to provide the ability for a motorist to know the availability of on-street and off-street parking near their destination. And if the private parking owner allows it, the parker will be able to reserve and pay for the parking space through the app.
3.4.6 Initial Key Takeaways
Government Support and Collaboration Many peer regions have invested in new government structures and have hired executives to manage the implementation of transportation technologies.
State governments are also investing in planning and policy creation to help guide CV and AV deployment. Like Ohio with its DriveOhio program, the Denver region, including CDOT, DRCOG and City and County of Denver should continue to collaborate in examining and updating transportation policy through the Road X Program to reduce barriers for AV/CV technology implementation, ensure roadway safety, and broaden mobility choices.
The implementation of enabling transportation technology that tends to be owned by public agencies, including fiber optic networks for traffic signals systems, smart parking facilities, and traffic management centers is widely operational in most peer regions. In addition, planning activity for technology implementation is or has been a key activity in many regions, including Austin, Portland, Seattle, and Boston. Each community has published transportation plans with significant focus on transportation technology and mobility change. The planning activities are guiding policy change, projects and programs. And most of these cities with recent planning activity are evolving their governance structures, including hiring key public executives and re-allocating agency staff to focus on delivering mobility change and technology adoption.
Funding Impacts The federal government in recent years has made available grant funding for cities and states to pilot and deploy advanced transportation technologies:
Columbus won substantial grant funding from the USDOT Smart City Challenge
Pittsburgh, Denver, San Francisco and Seattle each have achieved sizeable grant funding from the USDOT Advanced Transportation and Congestion Mitigation Deployment program
Tampa was among three agencies to receive USDOT funding for a CV Pilot
Portland TriMet won a USDOT Mobility on Demand grant
These communities are investing their grants to pilot transportation technologies such as V2I connected vehicle applications. San Francisco and Columbus are also developing AV shuttle pilots and multi-modal trip planning apps with their grants.
Appendix F. Denver Region and Peer City Assessments
February 2019 F-18
Initial Impression The Denver region is not necessarily leading in implementing transportation technologies, but neither is it significantly lagging behind comparable regions of the country.
The Denver region could improve its standing in transportation technology implementation by expanding the scale of enabling technologies, particularly fiber optic connections and leveraging private investment in 5G technology. The region could be well served for the coming wave of connected vehicles by making strategic, priority investments in DSRC equipment. Lastly, successful implementation of AV/CV technologies in the Denver region will benefit from continued collaboration with other state and local agencies and build on successful partnerships already existing with the private sector.
4.0 Technology Programs Assessment The research for this report includes interviews of the four partner agencies: CDOT, DRCOG, RTD, and the Denver Metro Chamber. Key staff from each agency was interviewed in order to understand the goals and programs each agency is working on to assess the applicability and improve upon the employment of transportation related technologies. All four are already working on multiple initiatives as well as working together and with local agencies. In many ways there is already a basis for collaboration in the region to push adoption of new transportation technologies.
4.1 Agency Technology Programs
4.1.1 DRCOG As the municipal planning organization for the Denver metro area, DRCOG’s primary mission is to help coordinate regions’ planning activities including transportation planning and implementation. The agency also provides a robust data platform for local agencies to draw on for regional transportation and land use data. Other highlights of the relevant work at DRCOG include:
Smart Region Initiative
o New collaborative program centered around interoperability of new technology and making it accessible to all DRCOG member governments
Multi-jurisdictional Corridor Traffic Signal Coordination
TMA Activity Coordination and Way to Go Program
o These programs are perfect incubators to test new programs to encourage alternatives to single occupant vehicle travel.
4.1.2 RTD RTD provides public rail and bus transit for the Denver Metro area. The agency is focused on delivering three additional lines in the very near future as part of the FasTracks network while also maintaining its’ robust regional, express and local bus services. RTD is challenged by two major issues when it comes to employing new technologies. The first challenge is that they must coordinate with dozens of different municipalities and sometimes CDOT to make changes to the streets, signals and passenger and bus staging areas for most of the miles of transit service they run. The second is that their federal funding comes with strict requirements for how it can be used which limits their ability to experiment with

Appendix F. Denver Region and Peer City Assessments
February 2019 F-19
innovative programs. However, RTD is always looking for additional ways to improve service and is soon embarking on a yet to be defined “Technology Transformation” initiative. Other highlights of the relevant work at RTD include:
Technology “Request For Information”
o RTD has received over 60 proposals from private transportation technology companies and is in the process of considering if and how to partner with them to investigate and employ opportunities to improve service in these four categories: — On-Demand Transportation — Automated Vehicles — Fixed-Route Shuttles — Trip Planning Software
Current planning studies which may identify and prioritize technology related service improvements are the “First and Final Mile” and “Regional Arterials”
4.1.3 CDOT CDOT owns and maintains all of the state highways in Colorado including hundreds of lane mile in the metro area. CDOT has recently established the Road X program to aggressively investigate and test technologies which may beneficially enhance the travel and infrastructure in Colorado. They have a wide range of various technology pilots and ambitious statewide plans. Broadly these initiatives are organized into the six categories. Each one is shown here with an example or two.
Planning o Smart Mobility Plan is a comprehensive planning effort looking at how CDOT will approach emerging
technology
o Fiber Plan to determine prioritization and locations for extended fiber network across the state highway system.
Projects o “Smart 25” project to implement managed motorways concept on I-25 through the south metro area
o Road Usage Charge Pilot to simulate different Road Usage Charge scenarios for 70 volunteer participants statewide
o “Smart I-70” connected vehicle project to implement V2X roadside units along I-70 from Golden to Vail.
Partnerships o Partnership with Panasonic to employ a broad range of technology innovations, particularly on the
I-70 Mountain Corridor.
Operations o Establishment of a Metro Denver Operations Center
Data Management o Establishment of a Chief Data Officer to develop a “connected ecosystem”
Policy o Autonomous Mobility Task Force
Appendix F. Denver Region and Peer City Assessments
February 2019 F-20
o Adoption of Federal Connected and Autonomous Vehicle Standards
4.1.4 Denver Metro Chamber of Commerce The Chamber was the incubator for the Mobility Choice Initiative and has identified transportation infrastructure as one three “pillars” for constant improvement. The Mobility Choice Board which is housed within the Chamber and made up of its members has provided the leadership for coordination of the three public agencies to fund and oversee the work of the Mobility Choice Blueprint project. A regular role for the Chamber is to provide critical information about current and planned transportation infrastructure and programs in order to retain and attract employers to the metro area. In this role, Chamber staff can provide important information to the project about what transportation options are important. One of these considerations is that the potential employers regularly ask for transportation options relevant to three categories of employees 1) C suite executives, 2) mid-level managers and 3) entry level workers. Appropriate and affordable options for each employee category are critical.
Leadership Denver
o Participants in the annual Leadership Denver program can provide an important sounding board for project recommendations and may become an important set of ambassadors to carry the message and recommendations of the project back to the private sector.
Chamber Operations
o Assuming the Blueprint results in recommendations related to the private sector, it is anticipated that the Chamber and the Mobility Choice Board will have a role in continuing an organized dialogue with its members about following through on those recommendations.
o One example would be that counties that are still developing, especially north and west of the Denver should be able to show plans for imminent transit corridors in order to demonstrate a readiness to provide multimodal connections to future housing and employment sites.
4.2 Existing Coordination and Funding Currently coordination amongst the three agencies is primarily conducted on a project-by-project basis so there is a need for a broader and more routine mechanism for coordination, prioritization and collaboration.
In addition, there is not a single vision statement or set of goals through which these efforts are coordinated or vetted.
4.3 Desired Collaboration and Outcomes In discussions with all three governmental agencies, the idea of a regional compact was discussed as important to help everyone move towards the same goals. In general, agency staff did not feel strongly one way or another about the form of the regional compact, whether it be a partnership, compact, memorandum-of-understanding, or other form of agreement. Some staff mentioned that establishing the process for collaboration would be the most important outcome of this entire effort.
As far as outcomes from the Blueprint, some agencies preferred specific actionable recommendations while others preferred flexible high-level recommendations that could apply to different future scenarios.

Appendix F. Denver Region and Peer City Assessments
February 2019 F-21
Above all, agencies wanted to see a final product that was greater than the sum of its parts. One interviewee summed it up by stating “Do not shy away from being bold with the recommendations.”
4.4 Peer City Interview Summaries The research for this section of the report includes a review of similar technology activities in cities similar to Denver. Online research and phone interviews with key staff from each agency were conducted to understand the transportation technology goals, programs and coordination techniques each city is using.
4.4.1 Austin Austin CityUP is a consortium led by Capital Metro (the regional transit agency). CityUP provides a collaboration space for multiple public and private entities including the City of Austin, Capital Metro, UT Austin, the Austin Chamber and numerous technology companies such as AT&T, Verizon, Cisco, Dell, and about 50 other private companies or non-profit organizations.
CityUP exists specifically to plan and implement “Austin Smart City” investments. The consortium has four main areas of focus:
1. Providing a space for dialogue and facilitating public-private opportunities
2. Ensuring Austin Smart City investments take advantage of grant funding and coordinate initiatives to get the most out of finances
3. Developing a financial plan to sustain Austin Smart City investments
4. Providing opportunities to pilot or prototype new transportation and mobility solutions
Additionally, CityUP resulted in a contract between the City and the UT-Austin Center for Transportation Research to host and disseminate transportation data.
4.4.2 Boston The Mayor’s Office of New Urban Mechanics is self-described as the City of Boston’s “Research and Development Lab.” Its goal is to improve quality of life for all Bostonians. One of their focus areas is their Streets Lab which includes a number of “Smart City” technologies such as AVs, smart parking, and IoT technology.
The Office of New Urban Mechanics released a “Boston Smart City Playbook” which details the way the city would like to interact with private companies that want to implement smart city technology within the City of Boston. The Playbook includes six “Plays” describing what types of proposals are helpful and what types are not. The Playbook ultimately serves as a values and vision document for Boston Smart City initiatives, requiring private proposals to first consider how their product improves quality of life for Bostonians.
4.4.3 Columbus The Smart Columbus Program Office is managed by the Chief Innovation Officer at the City of Columbus. Smart Columbus coordinates decision making and implementation with the applicable city department. The group includes representation from the Columbus Partnership, a non-profit organization including more than 65 CEOs from Columbus’s leading businesses and institutions.
Appendix F. Denver Region and Peer City Assessments
February 2019 F-22
Smart Columbus implements transportation technology initiatives primarily using the $40 million they won through the Smart Cities Challenge. An additional $10 million is provided by Vulcan, Inc. (a Paul Allen company). The City of Columbus supplements this $50 million with municipal bonds and state funds.
The City of Columbus recently hired a local IT firm to build their central transportation data hub, known as the Smart Columbus Operating System (SCOS).
4.4.4 Minneapolis Minneapolis was selected as a member of Transportation for America’s Smart Cities Collaborative in the first round of applications. The City has touted the collaboration, saying that no agency, city, or even state could tackle all the challenges and possibilities of emerging technology, and that the Smart Cities Collaborative allows member cities to “gather, collaborate, and divide and conquer.” At the state level, the Governor of Minnesota is in the process of establishing a task force including 15 members of public entities and private companies that would study and make recommendations for AV/CV and Smart City technology.
4.4.5 Nashville The Nashville mayor convened a Connected Nashville working group, culminating in the release of Connected Nashville: A Vision for a Smarter City. The working group was comprised of the Mayor’s Office and Metro departmental staff, transportation providers and other mobility stakeholders, academics/researchers from area universities, and business leaders from sectors such as hospitality, healthcare, telecommunications, and technology. The plan was not limited to Smart Mobility; it also included chapters and strategies for Smart Economy, Smart People, Smart Living, Smart Environment, and Smart Governance.
4.4.6 Pittsburgh The SmartPGH Consortium is a foundation consisting of the City, County, MPO, DOT, Carnegie Mellon University, University of Pittsburgh, Uber, software developers, the Downtown Partnership, and the Hillman Foundation, among others. Its purpose is to optimize technology and infrastructure investments, and to provide a governance structure that can “outlive changes in political and corporate leadership.”
The Consortium requires all members to uphold:
Open data standards and participation in the SmartPGH Data Utility
Meet or exceed City of Pittsburgh MBE/WBE/DBE contracting requirements
Open Book Pittsburgh capital planning coordination (open records on city contracts and campaign financing)
Participation in the SmartPGH workforce development pipeline, which will train Pittsburgh residents for jobs in advanced industries such as advanced manufacturing and cybersecurity
Participation in the City’s Climate Action Plan
Additionally, SmartPGH emphasizes the use of the Western Pennsylvania Regional Data Center (WPRDC) as the clearinghouse for collecting and disseminating data. WPRDC is planned to be the host of the Smart PGH Data Utility.

Appendix F. Denver Region and Peer City Assessments
February 2019 F-23
4.4.7 Portland The Portland mayor directed the Portland Bureau of Transportation (PBOT) to develop policies related to AVs, which was passed by Portland City Council in 2017. Through this effort, the Smart Autonomous Vehicles Initiative was created, and companies were invited to submit proposals for testing on Portland streets.
TriMet, Portland’s transit agency, passed a 0.1% increase in its payroll tax through a board vote. The increase will be incremental over a 10-year period and will fund new technology and equipment, as well as additional service.
4.4.8 San Francisco ConnectSF is the primary initiative that oversees planning for the future of mobility in San Francisco. The initiative is a collaborative effort including the San Francisco Planning Department, the San Francisco Municipal Transportation Agency (SFMTA), the San Francisco County Transportation Authority (SFCTA), and the San Francisco Office of Economic and Workforce Development (OEWD). ConnectSF has set an overarching vision for implementing the Subway Vision, San Francisco Transportation Plan 2050, Transit Corridors Study, Streets and Freeways Study, and Transportation Element Update.
4.4.9 Seattle The Puget Sound Regional Council, Seattle’s MPO, recently released a draft Regional Transportation Plan which contains the following strategies related to emerging technology.
Establish a technology advisory committee consisting of local leadership, private sector representatives, transportation planners, traffic engineers, and other key stakeholders to discuss legal frameworks, liability issues, and technical specifications to support new technologies.
Facilitate regional discussions to identify opportunities to support private sector projects and partnerships and the deployment of pilot programs, such as US DOT’s Connected Vehicle Pilot Deployment Program and the Smart Cities Challenge.
Continue to enhance the regional models to analyze the effect of autonomous and electric vehicles, shared mobility, and new technology on the transportation system and travel behavior.
Similar to Boston, the Seattle Department of Transportation released the New Mobility Playbook, which serves as an invitation to innovators to help solve equity challenges, prototype new products or services, advise on technology, and contribute to policies and proposals.
4.4.10 Tampa Bay Tampa Hillsborough Expressway Authority (THEA) is an independent agency of the state, funded by toll revenue collected on one of the four expressways it maintains. The toll revenue is reinvested in Tampa and Hillsborough County.
THEA received a $17 million grant from the US DOT to test and deploy connected vehicle technology in downtown Tampa as part of US DOT’s CV Pilot Deployment Program. THEA is contributing $4 million to the project from its toll revenue, and has formed a collaborative implementation team consisting of representatives from THEA, HNTB, Siemens, the University of South Florida Center for Urban Transportation Research, and Global-5 Communications. Additional key partners of the project include
Appendix F. Denver Region and Peer City Assessments
February 2019 F-24
the Florida Department of Transportation, the City of Tampa, the Hillsborough Area Regional Transit Authority, the TECO Line Streetcar System, and Hillsborough Community College.

Appendix F. Denver Region and Peer City Assessments Attachment A. Regional Profiles
February 2019 F-25
Attachment A. Regional Profiles

Appendix F. Denver Region and Peer City Assessments Attachment A. Regional Profiles
February 2019 F-26
Regional Profile: Denver, CO
Overview Managing traffic in the Denver region is supported by Traffic Management Centers (TMCs) operated by the City and County of Denver and Colorado Department of Transportation (CDOT). These centers collect and disseminate data on weather, roadway conditions, traffic conditions so traffic operations may be adjusted, including traffic signal timing, to meet current conditions.
CDOT operates ramp meters on I-70 and I-25 in the Denver area to assist in managing traffic volumes and traffic flow on the urban freeways. CDOT has also implemented High Occupancy Vehicle (HOV) lanes on I-25. CDOT also operates dynamic speed and lane controls on the I-70 Mountain Corridor just outside the Denver metro region to the west. CDOT has also deployed smart tolling on I-25 and US 36 in the Denver region. CDOT has also worked with the local transit agency to permit transit bus operations on freeway shoulders, known as smart lanes. The Flatiron Flyer bus is allowed to operate on shoulder during peak periods on US36.
The CDOT RoadX program to provide $12M in funding for technology pilot projects and is considering AV/CV impacts in scenario planning.
The City and County of Denver is operating Adaptive Traffic Signal Control (ATSC) on two roadway corridors. RTD has implemented Transit Signal Priority (TSP) at a number of intersections in the downtown, as well as some arterial corridors. Denver also offers advanced public parking technologies such as smart parking meters and online parking permit management.
The City and County of Denver received the $6 million grant under FHWA’s Advanced Transportation and Congestion Management Technologies Deployment (ATCMTD) program and will use the funds to implement three intelligent vehicle projects--a Connected Traffic Management Center (TMC) and Connected Fleets; Travel Time Reliability as a City Service for Connected Freight; and Safer Pedestrian Crossings for Connected Citizens. The technologies include dedicated short-range communications (DSRC) in 1,500 city fleet vehicles to enable signal priority for truck platooning and for a freight efficiency corridor. The trucks also will be equipped with a system that automatically detects when a pedestrian is in close range. The city was one of seven finalists in the 2016 USDOT Smart City Challenge.
The Smart Region Initiative includes numerous municipalities, including Denver South Economic Development Partnership, Panasonic, CityFi, and others.

Appendix F. Denver Region and Peer City Assessments Attachment A. Regional Profiles
February 2019 F-27
Technology Implementation Assessment Index
Technology Category Technology Implementations Denver, CO Scale Index Score
Traffic signal fiber optic system N 05G cell network L Multiple Locations 4Dedicated Short Range Communications for AV/CV L Multiple Locations 4.0Electric Vehicle Charging Infrastructure O Widely Available 10.0Integrated Data Exchange L Multiple Locations 4.0Smart streetlighting O Multiple Locations 6.7Wayfinding/trip planning app O Widely Available 10.0
5.5
V2I connected vehicle safety applications L Pilot 2.0Transit collision/warning detection N 0.0Emergency vehicle preemption O Multiple Locations 6.7Pedestrian detection O Multiple Locations 6.7
3.8
Vehicle speed/volume detection O Widely Available 10.0Road weather information systems O Widely Available 10.0Roadway cameras O Widely Available 10.0
10.0
Traffic Management Center O Widely Available 10.0Ramp metering O Multiple Locations 6.7Dynamic speed/lane control O Multiple Locations 6.7Adaptive Traffic Signal Control (ATSC) O Multiple Locations 6.7Smart tolling O Multiple Locations 6.7Smart lanes O Multiple Locations 6.7Transit Signal Priority O Multiple Locations 6.7Smart parking O Widely Available 10.0HOV lanes O Multiple Locations 6.7V2I connected vehicle mobility applications L Pilot 2.0
6.9
Microtransit services L Multiple Locations 4.0Transportation Network Companies (TNC) O Widely Available 10.0Bus Rapid Transit, Street Car, or Light Rail O Widely Available 10.0Mobile ticketing for transit O Widely Available 10.0Integrated, multi-modal common payment system P Widely Available 3.0Carpooling or ridesharing O Widely Available 10.0
7.8
Enabling Technologies
Safety
Monitoring and Detection
Operational Optimization
Mode/Travel Demand Change
Table Legend
None N Planned P Launching L Operational O
Appendix F. Denver Region and Peer City Assessments Attachment A. Regional Profiles
February 2019 F-28
Regional Profile: Austin, TX
Overview The City of Austin is home to some of the earliest autonomous mobility testing in the nation. Today, the City of Austin is already home to some of the most advanced autonomous mobility testing. Google X chose Austin as its second city, after its home town of Mountainview, California to deploy its autonomous vehicles.
In November 2016, Austin voters approved the $720 million 2016 Mobility Bond for regional, corridor, and local transportation and mobility improvements. Imagine Austin, the City’s comprehensive plan demands its transportation network provide a wide variety of options that are efficient, reliable, and cost-effective to serve the diverse needs and capabilities of Austin citizens. The plan further calls for public and private sectors to work together to improve air quality and reduce congestion in a collaborative and creative manner. With this policy focus in mind, the City of Austin partnered with Capital Metro, the regional transit agency, to publish a Smart Mobility Roadmap in 2017. The Smart Mobility Roadmap encompasses five key areas: shared-use mobility; electric vehicles and infrastructure; autonomous vehicles; data and technology; and land use and infrastructure. This shared, electric and autonomous vehicle roadmap is expected to serve as the start of a community discussion about the emerging mobility opportunities within the Austin region. The City intends that dialogue to be coordinated with the Austin Strategic Mobility Plan, Capital Metro’s Project Connect, and the Capital Area Metropolitan Planning Organization (CAMPO) for broader regional context.
An early outcome of the Smart Mobility Roadmap is the appointment of a Smart Mobility Director in 2017 to lead a cross-functional team of mobility, technology, policy, data, and user experience specialists to deliver outcomes that improve mobility, safety and access to Austin residents. The position will also manage public-private-partnerships and the evolution of the Parking Enterprise division in its future role of transportation.
Additional insights on Austin include the following:
• Presently developing the Austin Strategic Mobility Plan (2019)
• Hired key leadership in 2018 to manage mobility initiatives
• Conducting or preparing to conduct various technology pilots
• One of seven finalists in the $50M USDOT Smart City Challenge

Appendix F. Denver Region and Peer City Assessments Attachment A. Regional Profiles
February 2019 F-29
Technology Implementation Assessment Index
Technology Category Technology Implementations Austin, TX Scale Index Score
Traffic signal fiber optic system O Widely Available 10.05G cell network L Multiple Locations 4.0Dedicated Short Range Communications for AV/CV P Pilot 1.0Electric Vehicle Charging Infrastructure O Widely Available 10.0Integrated Data Exchange P Multiple Locations 2.0Smart streetlighting L Pilot 2.0Wayfinding/trip planning app O Widely Available 10.0
5.6
V2I connected vehicle safety applications P Pilot 1.0Transit collision/warning detection L Pilot 2.0Emergency vehicle preemption O Multiple Locations 6.7Pedestrian detection P Pilot 1.0
2.7
Vehicle speed/volume detection O Widely Available 10.0Road weather information systems O Widely Available 10.0Roadway cameras O Widely Available 10.0
10.0
Traffic Management Center O Widely Available 10.0Ramp metering O Multiple Locations 6.7Dynamic speed/lane control N 0.0Adaptive Traffic Signal Control (ATSC) O Multiple Locations 6.7Smart tolling N 0.0Smart lanes N 0.0Transit Signal Priority O Multiple Locations 6.7Smart parking O Widely Available 10.0HOV lanes N 0.0V2I connected vehicle mobility applications L Pilot 2.0
4.2
Microtransit services P Pilot 1.0Transportation Network Companies (TNC) O Widely Available 10.0Bus Rapid Transit, Street Car, or Light Rail O Multiple Locations 6.7Mobile ticketing for transit O Widely Available 10.0Integrated, multi-modal common payment system P Widely Available 3.0Carpooling or ridesharing O Widely Available 10.0
6.8
Enabling Technologies
Safety
Monitoring and Detection
Operational Optimization
Mode/Travel Demand Change
Table Legend
None N Planned P Launching L Operational O

Appendix F. Denver Region and Peer City Assessments Attachment A. Regional Profiles
February 2019 F-30
Regional Profile: Boston, MA
Overview Greater Boston is home to some of the nation’s top universities, which the City capitalizes upon through collaboration with both colleges and individual researchers. The region’s longstanding position as a research and academic power house also contributes to a healthy sense of skepticism about new technology. Boston thus considers itself a “fast follower” with respect to transportation technology, promoting an open and collaborative culture that sees value in new partnerships, but requiring proof of concept before deploying new pilots.
One challenge in assessing technology deployments in the Boston region is that Greater Boston lacks a strong county structure. The result is that enabling, monitoring and detection, and operational optimization technologies, unless led by MassDOT, tend to be deployed in a patchwork of municipalities. Notably absent from the region are examples of DSRC-based connected vehicle technology, though 5G is planned for the region. Mode/travel demand change technologies are, however, largely operational and widely available, necessitated by the region’s density and long commutes. Greater Boston has the second lowest share of divers commuting alone to work, which is evidence of its success in encouraging alternative transportation.
The City of Boston employs a civic innovation team, the Office of New Urban Mechanics, which leads many of the region’s transportation technology projects. With a strong focus on serving neighborhoods and residents, projects out of this office tend to originate from use cases rather than technology solutions. Thus so far 12 of the 60 civic innovation projects have involved transportation technology. Additionally, Boston employs a citywide analytics team with 8 core analysts and 15 visiting analysts that seek to measure social vulnerability as one way of identifying where transportation projects are needed. This team maintains a focus on integrating existing city-owned data, collaborating with outside partners, and buying third party data when necessary.
The City of Boston enjoys a good working relationship with MassDOT and neighboring cities and towns, though collaboration in Greater Boston is made difficult by the number of municipalities (102) and less powerful regional government institutions compared to other peer regions. Thus long-term regional programs such as automated fare collection across modes have tended to be among the most challenging, while local projects focusing on the street network within individual municipalities (such as Boston’s on-street car share program) have been easier to implement.
Appendix F. Denver Region and Peer City Assessments Attachment A. Regional Profiles
February 2019 F-31
Technology Implementation Assessment Index
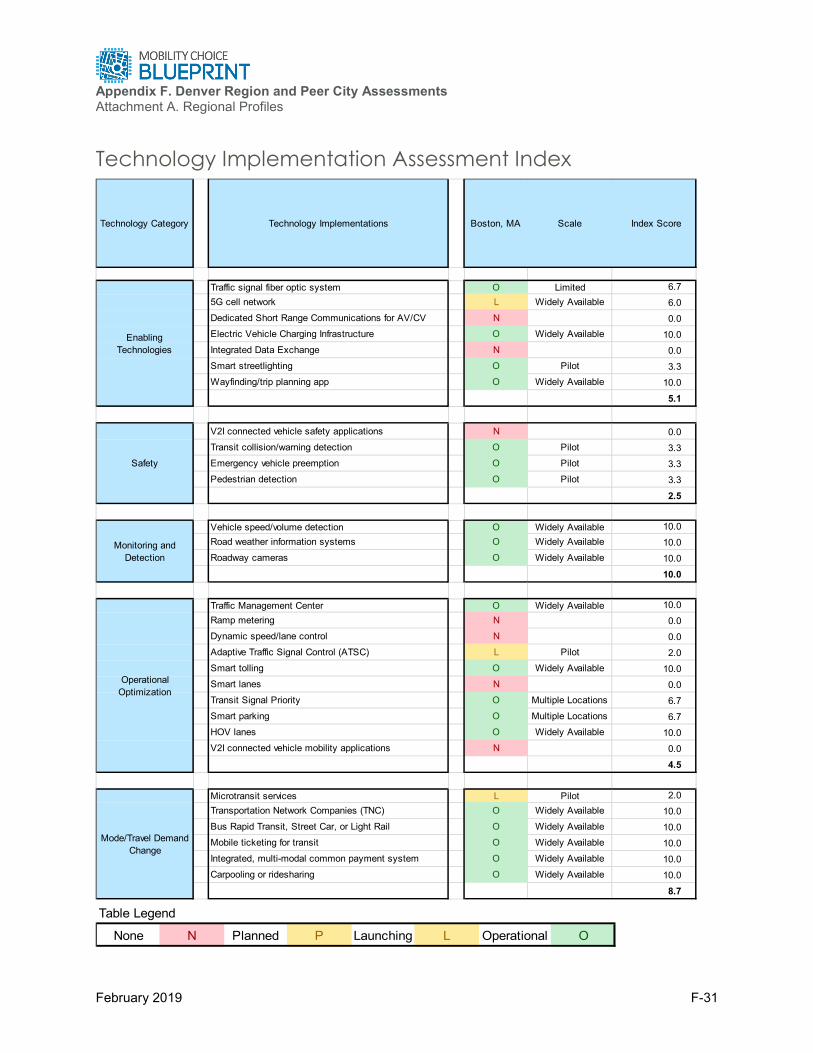
Technology Category Technology Implementations Boston, MA Scale Index Score
Traffic signal fiber optic system O Limited 6.75G cell network L Widely Available 6.0Dedicated Short Range Communications for AV/CV N 0.0Electric Vehicle Charging Infrastructure O Widely Available 10.0Integrated Data Exchange N 0.0Smart streetlighting O Pilot 3.3Wayfinding/trip planning app O Widely Available 10.0
5.1
V2I connected vehicle safety applications N 0.0Transit collision/warning detection O Pilot 3.3Emergency vehicle preemption O Pilot 3.3Pedestrian detection O Pilot 3.3
2.5
Vehicle speed/volume detection O Widely Available 10.0Road weather information systems O Widely Available 10.0Roadway cameras O Widely Available 10.0
10.0
Traffic Management Center O Widely Available 10.0Ramp metering N 0.0Dynamic speed/lane control N 0.0Adaptive Traffic Signal Control (ATSC) L Pilot 2.0Smart tolling O Widely Available 10.0Smart lanes N 0.0Transit Signal Priority O Multiple Locations 6.7Smart parking O Multiple Locations 6.7HOV lanes O Widely Available 10.0V2I connected vehicle mobility applications N 0.0
4.5
Microtransit services L Pilot 2.0Transportation Network Companies (TNC) O Widely Available 10.0Bus Rapid Transit, Street Car, or Light Rail O Widely Available 10.0Mobile ticketing for transit O Widely Available 10.0Integrated, multi-modal common payment system O Widely Available 10.0Carpooling or ridesharing O Widely Available 10.0
8.7
Enabling Technologies
Safety
Monitoring and Detection
Operational Optimization
Mode/Travel Demand Change
Table Legend
None N Planned P Launching L Operational O
Appendix F. Denver Region and Peer City Assessments Attachment A. Regional Profiles
February 2019 F-32
Regional Profile: Columbus, OH
Overview The City of Columbus won the USDOT Smart City Challenge in 2016. Key to its win was the City’s approach to regional collaboration. The community engaged all levels of government from Ohio Department of Transportation, its MPO in the Mid-Ohio Regional Planning Commission, the regional transit agency, as well as the surrounding suburbs. Also key to the Columbus approach to collaboration was its engagement with the private and non-profit sectors. The City proposed in its Smart City Challenge application and has since implemented a governance structure of its Smart Columbus program to include a leadership committee comprised of stakeholders from The Ohio State University, AEP Ohio, the Columbus Partnership, COTA, and Ohio Department of Transportation.
Columbus will leverage a new central connected traffic signal and integrated transportation data system to develop a suite of applications to deliver enhanced human services to residents and visitors. The City plans to integrate an electronic appointments and scheduling platform for doctor visits with transit tracking so that rescheduling is automated and expecting mothers need not wait weeks to reschedule appointments. These applications include a multi-modal trip planning application, a common payment system for all transportation modes, a smartphone application for assistance to persons with disabilities, and integration of travel options at key locations for visitors. Columbus will establish a smart corridor connecting underserved neighborhoods to jobs and services. The smart corridor will enhance Bus Rapid Transit (BRT) service by installing smart traffic signals, smart street lighting, traveler information and payment kiosks, and free public Wi-Fi along the route. Six electric, accessible, autonomous vehicles will be deployed to expand the reach of the BRT system to additional retail and employment centers.
Columbus created the position of Chief Innovation Officer in 2017. The position leads the City’s Smart Columbus program, a partnership between city government and local business leaders that beat out 77 U.S. cities to win a $40 million U.S. Department of Transportation grant to help residents move around more easily and faster through the use of technology. Columbus also won a $10 million grant from the Paul G. Allen Family Foundation to reduce greenhouse emissions. Smart Columbus so far has received pledges of an additional $600 million in projects and money.
The State of Ohio has created its DriveOhio program, an initiative of the Ohio Department of Transportation, facilitates collaboration between the public and private sectors, bringing all the right people to the table and serving as the single point of contact for all things autonomous and connected in Ohio.
A significant contributor to Columbus’s success in the Smart City Challenge was its significant investment in fiber optic cabling connecting most of the Central Ohio region’s 1400+ traffic signals. The project is nearing completion and will result in nearly 600 miles of fiber throughout the entire region. Both Ohio Department of Transportation and Columbus Traffic Management Centers will be able to manage traffic signals owned by the state, Columbus and many of the region’s suburban communities.
Columbus has substantially grown its local commitment following winning the Smart City Challenge—commitments from government, non-profits and private business to the Smart Columbus program have multiplied from $90 million in 2016 to well over $500 million by the end of 2017. The wide array of public-private partnerships with entities such as AEP Ohio, the region’s largest power supplier, The Ohio State

Appendix F. Denver Region and Peer City Assessments Attachment A. Regional Profiles
February 2019 F-33
University, and the Columbus Partnership, the region’s association of 60 of the top employers are combining their resources to advance implementation of transportation technology.
Technology Implementation Assessment Index
Technology Category Technology Implementations Columbus, OH
Scale Index Score
Traffic signal fiber optic system O Widely Available 10.05G cell network L Multiple Locations 4.0Dedicated Short Range Communications for AV/CV L Multiple Locations 4.0Electric Vehicle Charging Infrastructure O Multiple Locations 6.7Integrated Data Exchange O Pilot 3.3Smart streetlighting P Pilot 1.0Wayfinding/trip planning app O Widely Available 10.0
5.6
V2I connected vehicle safety applications L Pilot 2.0Transit collision/warning detection N 0.0Emergency vehicle preemption O Multiple Locations 6.7Pedestrian detection L Multiple Locations 4.0
3.2
Vehicle speed/volume detection O Widely Available 10.0Road weather information systems O Widely Available 10.0Roadway cameras O Widely Available 10.0
10.0
Traffic Management Center O Widely Available 10.0Ramp metering O Widely Available 10.0Dynamic speed/lane control N 0.0Adaptive Traffic Signal Control (ATSC) N 0.0Smart tolling N 0.0Smart lanes L Multiple Locations 4.0Transit Signal Priority O Multiple Locations 6.7Smart parking L Multiple Locations 4.0HOV lanes N 0.0V2I connected vehicle mobility applications L Pilot 2.0
3.7
Microtransit services O Multiple Locations 6.7Transportation Network Companies (TNC) O Widely Available 10.0Bus Rapid Transit, Street Car, or Light Rail O Limited 6.7Mobile ticketing for transit L Widely Available 6.0Integrated, multi-modal common payment system L Widely Available 6.0Carpooling or ridesharing O Widely Available 10.0
7.6
Enabling Technologies
Safety
Monitoring and Detection
Operational Optimization
Mode/Travel Demand Change
Table Legend
None N Planned P Launching L Operational O

Appendix F. Denver Region and Peer City Assessments Attachment A. Regional Profiles
February 2019 F-34
Regional Profile: Minneapolis, MN
Overview City of Minneapolis published in 2017 the Share Mobility Action Plan. According to the Share Mobility Center, the report’s author, the Minneapolis-St. Paul region is expected to gain more than 800,000 new residents by 2040. The anticipated population growth is expected to have a significant impacts on the region’s transportation system.
Without changes to current regional household vehicle ownership rates, the level of growth is projected to add more than 675,000 personal vehicles to roads, impacting traffic congestion, CO2 emissions, worker productivity and quality of life. The report also highlights that residents without access to reliable transportation options will continue to be isolated from jobs, opportunity and vital community resources.
In recent years, the region has implemented transportation technologies including bus rapid transit service and a new light rail route. The region has been an early adopter in bikesharing, carsharing and other forms of shared mobility.
Key transportation challenges identified for the Minneapolis region, which are shared with other regions in the country include:
• Disparities in transportation access
• The stagnation of shared mobility services
• The ease of driving and parking
The State of Minnesota Department of Transportation (MnDOT) is implementing the TH-55 Connected Corridor project, a key regional arterial to be outfitted with Connected Vehicle (CV) communications infrastructure enabling exchange of information with nearby vehicles. In addition, MnDOT will be developing the communications infrastructure and data management systems to support a range of existing and future technologies. The data exchange system will enable the merging of data from multiple sources, as well as sharing of agency data with third parties, to improve information-sharing and enable more efficient system management.
Appendix F. Denver Region and Peer City Assessments Attachment A. Regional Profiles
February 2019 F-35
Technology Implementation Assessment Index
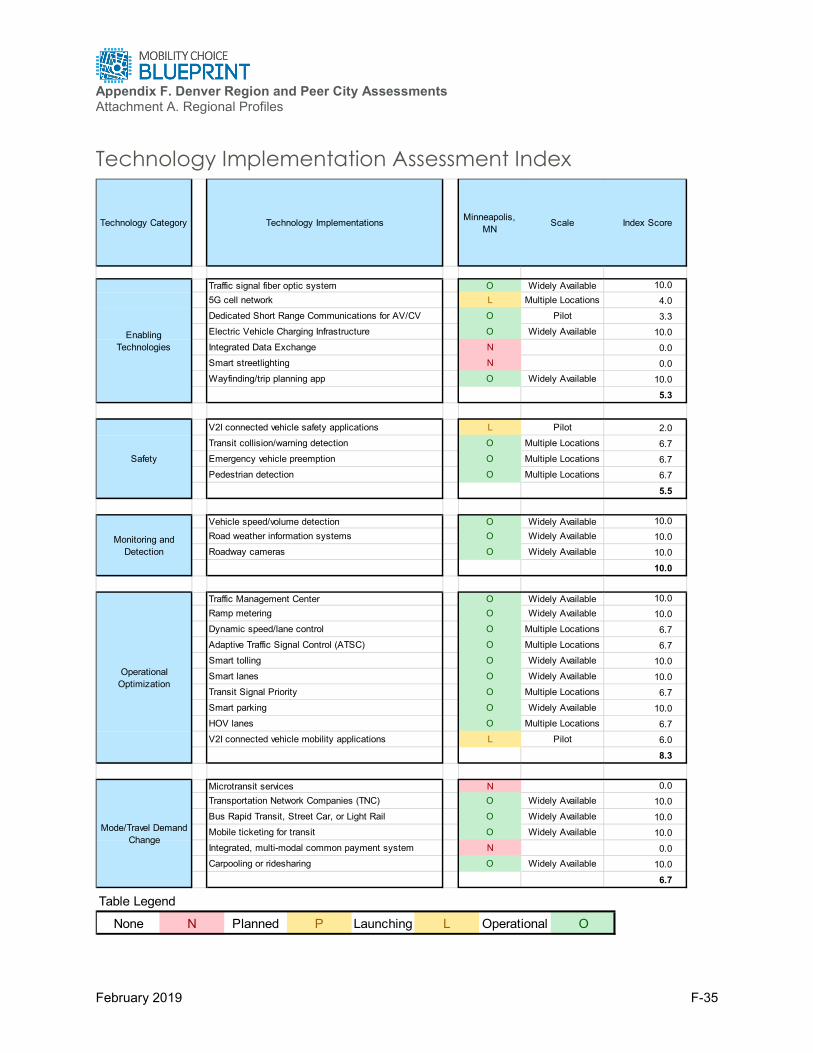
Technology Category Technology Implementations Minneapolis, MN
Scale Index Score
Traffic signal fiber optic system O Widely Available 10.05G cell network L Multiple Locations 4.0Dedicated Short Range Communications for AV/CV O Pilot 3.3Electric Vehicle Charging Infrastructure O Widely Available 10.0Integrated Data Exchange N 0.0Smart streetlighting N 0.0Wayfinding/trip planning app O Widely Available 10.0
5.3
V2I connected vehicle safety applications L Pilot 2.0Transit collision/warning detection O Multiple Locations 6.7Emergency vehicle preemption O Multiple Locations 6.7Pedestrian detection O Multiple Locations 6.7
5.5
Vehicle speed/volume detection O Widely Available 10.0Road weather information systems O Widely Available 10.0Roadway cameras O Widely Available 10.0
10.0
Traffic Management Center O Widely Available 10.0Ramp metering O Widely Available 10.0Dynamic speed/lane control O Multiple Locations 6.7Adaptive Traffic Signal Control (ATSC) O Multiple Locations 6.7Smart tolling O Widely Available 10.0Smart lanes O Widely Available 10.0Transit Signal Priority O Multiple Locations 6.7Smart parking O Widely Available 10.0HOV lanes O Multiple Locations 6.7V2I connected vehicle mobility applications L Pilot 6.0
8.3
Microtransit services N 0.0Transportation Network Companies (TNC) O Widely Available 10.0Bus Rapid Transit, Street Car, or Light Rail O Widely Available 10.0Mobile ticketing for transit O Widely Available 10.0Integrated, multi-modal common payment system N 0.0Carpooling or ridesharing O Widely Available 10.0
6.7
Enabling Technologies
Safety
Monitoring and Detection
Operational Optimization
Mode/Travel Demand Change
Table Legend
None N Planned P Launching L Operational O

Appendix F. Denver Region and Peer City Assessments Attachment A. Regional Profiles
February 2019 F-36
Regional Profile: Nashville, TN
Overview The State of Tennessee Department of Transportation (TDOT) has created the SmartWay system, which includes four transportation management centers, the TN511 voice activated phone system for up to date traffic information, 517 traffic cameras, 174 message signs, 1015 roadway detection systems and 49 video detection systems in the four largest cities.
TDOT is also investing nearly $1.7 million to plan and design the I-24 SMART Corridor Project. Interstate 24 is an integral part of the Nashville regional transportation network and a major route for commuters and freight. Traffic volumes along this corridor have experienced exponential growth in recent years. To respond to this increased traffic demand, TDOT has initiated an Integrated Corridor Management (ICM) Pilot which will be the first connected “Smart” corridor in Tennessee and will include a wide variety of connected vehicle and other ITS technologies designed to enhance traffic and reduce congestion.
The previous Nashville Mayor championed the Connected Nashville Vision Plan in 2017. Among other recommendations, the Connected Nashville Vision Plan calls for multiple pilots and deployments of transportation technologies.

Appendix F. Denver Region and Peer City Assessments Attachment A. Regional Profiles
February 2019 F-37
Technology Implementation Assessment Index
Technology Category Technology Implementations Nashville, TN Scale Index Score
Traffic signal fiber optic system O Multiple Locations 6.75G cell network P Widely Available 3.0Dedicated Short Range Communications for AV/CV P Select Locations 2.0Electric Vehicle Charging Infrastructure O Widely Available 10.0Integrated Data Exchange N 0.0Smart streetlighting N 0.0Wayfinding/trip planning app O Widely Available 10.0
4.5
V2I connected vehicle safety applications P Select Locations 2.0Transit collision/warning detection N 0.0Emergency vehicle preemption O Multiple Locations 6.7Pedestrian detection P Pilot 1.0
2.4
Vehicle speed/volume detection O Widely Available 10.0Road weather information systems O Widely Available 10.0Roadway cameras O Widely Available 10.0
10.0
Traffic Management Center O Widely Available 10.0Ramp metering O Multiple Locations 6.7Dynamic speed/lane control N 0.0Adaptive Traffic Signal Control (ATSC) N 0.0Smart tolling N 0.0Smart lanes N 0.0Transit Signal Priority O Widely Available 10.0Smart parking P Multiple Locations 2.0HOV lanes O Multiple Locations 6.7V2I connected vehicle mobility applications P Pilot 1.0
3.6
Microtransit services O Multiple Locations 6.7Transportation Network Companies (TNC) O Widely Available 10.0Bus Rapid Transit, Street Car, or Light Rail P Multiple Locations 2.0Mobile ticketing for transit P Widely Available 3.0Integrated, multi-modal common payment system N 0.0Carpooling or ridesharing O Widely Available 10.0
5.3
Enabling Technologies
Safety
Monitoring and Detection
Operational Optimization
Mode/Travel Demand Change
Table Legend
None N Planned P Launching L Operational O
Appendix F. Denver Region and Peer City Assessments Attachment A. Regional Profiles
February 2019 F-38
Regional Profile: Pittsburgh, PA
Overview Mayor Peduto created the City of Pittsburgh Department of Mobility and Infrastructure in 2017. The Department is responsible for the transportation of people and goods throughout the City of Pittsburgh, and for managing the operation of and access to the public right-of-way. DOMI is managing the deployment of and response to new mobility and communications technologies such as autonomous vehicles, electric vehicles, shared mobility, and Internet of Things (IoT) connected devices. Goals of the Department of Mobility and Infrastructure include
• No one dies or is seriously injured traveling on city streets.
• Every household in Pittsburgh can access fresh fruits and vegetables within 20 minutes travel of home, without the requirement of a private vehicle.
• All trips less than 1 mile are easily and enjoyably achieved by non-vehicle travel.
• Streets and intersections can be intuitively navigated by an adolescent.
• The combined cost of transportation, housing and energy does not exceed 45% of household income for any income group.
The City of Pittsburgh is working with Carnegie Mellon University, Allegheny County and other government agencies to incubate a range of technological systems that will improve safety, enhance mobility, promote efficiency and address pollution. As the Metro21: Smart Cities Initiative strives to create a global model for smarter city systems, corporations, foundations and startups have also proven to be key partners.
The City of Pittsburgh received a $10.8 million grant under FHWA’s Advanced Transportation and Congestion Management Technologies Deployment (ATCMTD) program for “Smart Spine” corridors in Pittsburgh that connect with primary commercial centers and amenities. The technologies will include expanding the network of connected, real-time adaptive signal controllers to promote more optimized transit operations. The city will complete an LED smart streetlight conversion of nearly 40,000 street lights that in addition to providing energy savings will be equipped with traffic detection and air quality sensors.

Appendix F. Denver Region and Peer City Assessments Attachment A. Regional Profiles
February 2019 F-39
Technology Implementation Assessment Index
Technology Category Technology Implementations Pittsburgh, PA
Scale Index Score
Traffic signal fiber optic system O Select locations 6.75G cell network L Multiple Locations 4.0Dedicated Short Range Communications for AV/CV O Select locations 6.7Electric Vehicle Charging Infrastructure O Widely Available 10.0Integrated Data Exchange O Multiple Locations 6.7Smart streetlighting N 0.0Wayfinding/trip planning app O Widely Available 10.0
6.3
V2I connected vehicle safety applications L Select Locations 4.0Transit collision/warning detection O Pilot 3.3Emergency vehicle preemption O Multiple Locations 6.7Pedestrian detection O Multiple Locations 6.7
5.2
Vehicle speed/volume detection O Widely Available 10.0Road weather information systems O Widely Available 10.0Roadway cameras O Widely Available 30.0
16.7
Traffic Management Center O Widely Available 10.0Ramp metering O Multiple Locations 6.7Dynamic speed/lane control O Multiple Locations 6.7Adaptive Traffic Signal Control (ATSC) O Widely Available 10.0Smart tolling O Multiple Locations 6.7Smart lanes O Multiple Locations 6.7Transit Signal Priority P Multiple Locations 2.0Smart parking O Widely Available 10.0HOV lanes O Multiple Locations 6.7V2I connected vehicle mobility applications P Pilot 1.0
6.6
Microtransit services P Pilot 1.0Transportation Network Companies (TNC) O Widely Available 10.0Bus Rapid Transit, Street Car, or Light Rail O Widely Available 10.0Mobile ticketing for transit N 0.0Integrated, multi-modal common payment system N 0.0Carpooling or ridesharing O Widely Available 10.0
5.2
Enabling Technologies
Safety
Monitoring and Detection
Operational Optimization
Mode/Travel Demand Change
Table Legend
None N Planned P Launching L Operational O
Appendix F. Denver Region and Peer City Assessments Attachment A. Regional Profiles
February 2019 F-40
Regional Profile: Portland, OR
Overview Portland began contemplating AVs as a component of its 2016 Smart Cities application to the U.S. Department of Transportation. AVs were contemplated as a, “ladder of opportunity,” or a safe, reliable, and affordable connection to the places people need to go every day: jobs, school, healthcare, and other essential services. Portland followed this with a secondary application for the US DOT Autonomous Vehicle Proving Pilot Program.
Portland is one of the world’s leading cities developing innovative technology solutions that improve our quality of life. We believe Portland can do this again by developing best practices for testing autonomous vehicles (AV’s). Portland can show how to “do AV smart” by working with transportation providers and the public to implement testing and piloting of this technology, while advancing public safety, protection of the environment and transportation access for everyone, regardless of income.
Autonomous vehicles have the potential to be a truly transformative technology. They could benefit our communities by reducing crashes, improving first and last mile connections for public transit riders, and reducing the high cost of owning a private vehicle. They also have the potential to significantly increase traffic congestion, vehicle miles traveled, and climate pollution. The protections and rules of the road adopted by state and local governments will substantially determine how much benefit and how much burden we experience.
It is also important that cities provide clear leadership as AV technology is tested and piloted before widespread use. AVs operating on city streets with pedestrians, people in wheelchairs, and bicyclists pose different challenges than AVs operating on open stretches of I-5 and I-84. Local streets must continue to be managed by the local agencies which know them best. The City of Portland is updating the Transportation System Plan (TSP), the long-range plan to guide transportation investments in Portland. Portland originally developed its Transportation System Plan in 2002 and it was updated in 2007. Periodic updates of the TSP are mandated by the State of Oregon. The TSP meets state and regional planning requirements and addresses local transportation needs for cost-effective street, transit, freight, bicycle, and pedestrian improvements. The plan will provide transportation options for residents, employees, visitors, and firms doing business in Portland, making it more convenient to walk, bike, take transit -- and drive less—while meeting their daily needs. The TSP provides a balanced transportation system to support neighborhood livability and economic development.
With the update to the TSP, Portland is presently considering a city policy on connected and autonomous vehicles (CAV). In April 2017, Portland announced the Smart Autonomous Vehicles Initiative (SAVI), which directs the Portland Bureau of Transportation to develop autonomous vehicle policies and solicit proposals from companies that would test autonomous vehicles on Portland streets. The City of Portland also began in 2017 consideration of administrative rules for regulating connected and autonomous vehicles. To date, the City has held hearings and sought input from the general public, as well as issuing a Request for Information (RFI) on potential partnerships that could support the development of CAV technology.
The US Department of Transportation (DOT) awarded in 2016 to TriMet, the Portland area transit agency, a $678,000 Mobility on Demand (MOD) SandBox grant that will enable the agency to extend the OpenTripPlanner (OTP) platform. The grant will help the agency add additional shared-use mobility options into the existing trip planning tool. The OTP, initially released as an open source project by TriMet in 2009, was the first planning tool to introduce multiple modes in one trip with the original focus on incorporating biking and walking with transit. Some of the additional elements to be built into the platform will include improvements to base map data so the trip planner can support enhanced pedestrian/wheelchair accessibility information for customers; and improvements to regional address data that will make location search and geocoding more effective and user-friendly.

Appendix F. Denver Region and Peer City Assessments Attachment A. Regional Profiles
February 2019 F-41
Technology Implementation Assessment Index
Technology Category Technology Implementations Portland, OR Scale Index Score
Traffic signal fiber optic system 0.05G cell network P Widely Available 3.0Dedicated Short Range Communications for AV/CV L Pilot 2.0Electric Vehicle Charging Infrastructure O Widely Available 10.0Integrated Data Exchange N 0.0Smart streetlighting N 0.0Wayfinding/trip planning app O Widely Available 10.0
3.6
V2I connected vehicle safety applications L Pilot 2.0Transit collision/warning detection O Multiple Locations 6.7Emergency vehicle preemption O Multiple Locations 6.7Pedestrian detection L Pilot 2.0
4.3
Vehicle speed/volume detection O Widely Available 10.0Road weather information systems O Widely Available 10.0Roadway cameras O Widely Available 10.0
10.0
Traffic Management Center O Widely Available 10.0Ramp metering O Multiple Locations 6.7Dynamic speed/lane control O Multiple Locations 6.7Adaptive Traffic Signal Control (ATSC) O Multiple Locations 6.7Smart tolling N 0.0Smart lanes O Pilot 3.3Transit Signal Priority O Multiple Locations 6.7Smart parking O Widely Available 10.0HOV lanes O Multiple Locations 6.7V2I connected vehicle mobility applications L Pilot 2.0
5.9
Microtransit services P Pilot 1.0Transportation Network Companies (TNC) O Widely Available 10.0Bus Rapid Transit, Street Car, or Light Rail O Widely Available 10.0Mobile ticketing for transit O Widely Available 10.0Integrated, multi-modal common payment system O Widely Available 10.0Carpooling or ridesharing O Widely Available 10.0
8.5
Enabling Technologies
Safety
Monitoring and Detection
Operational Optimization
Mode/Travel Demand Change
Table Legend
None N Planned P Launching L Operational O

Appendix F. Denver Region and Peer City Assessments Attachment A. Regional Profiles
February 2019 F-42
Regional Profile: San Francisco, CA
Overview The Bay Area’s positioning as the epicenter of the nation’s high tech industry is evident in its standing with respect to transportation technology; the San Francisco Region is an “innovative” champion by necessity. Pilot testing for emerging technologies such as autonomous and connected vehicles have been ongoing for years, and California’s leadership in encouraging electric vehicle adoption has placed considerable focus on charging infrastructure. Most enabling, monitoring and detection, and operational optimization technologies are not only operational, but widely available. The region’s focus on alternative transportation is evident in the widespread availability of mode/travel demand change technologies, with the region having the lowest share of residents commuting alone by personal vehicle among the peer regions evaluated. Importantly, all technologies that are not yet operational are planned or launching soon, some of which will be accomplished through the City’s 2016 Advanced Transportation and Congestion Management Technology Deployment grant. In particular this deployment will focus on intersection safety and accessibility for pedestrians and cyclists by deploying smart connected traffic signals, dynamic pickup curbs, and a regional carpool lane system.
The Bay Area has also placed considerable focus on establishing a cohesive long-term vision for the future of mobility in the region. Over the past two years the City and County of San Francisco, San Francisco Municipal Transportation Agency, the San Francisco County Transportation Authority, and others have collaborated on a 50-year mobility vision using a scenario-based approach with considerable community input, much like Denver is embarking upon presently. The City of San Francisco has also refined its own vision through the ConnectSF project, with a focus on the City of San Francisco itself. Further, as a finalist for the U.S. DOT Smart City Challenge, the City of San Francisco has identified many potential future deployments. As a “canary in the coal mine” with respect to deploying new technologies, one lesson key lesson learned for Denver is that it is critical to apply planning principles to pilot projects: identify a problem to be solved and a supporting technology; determine how to measure success; and structure data collection at the beginning of a projects to make meaningful evaluation achievable.
San Francisco Municipal Transportation Agency received the $10.9 grant under FHWA’s Advanced Transportation and Congestion Management Technologies Deployment (ATCMTD) program and will use the funds to encourage ridesharing and carpooling by creating dynamic pickup curbs, which reserve spaces for drop-offs and pick-ups by time of day for these vehicles. It will also set up regional carpool lanes to speed up travel time and provide incentives for carpooling. The funding will also go toward making intersections safer and more accessible for pedestrians and cyclists in the city’s neediest communities by deploying smart connected traffic signals, which will also provide signal preference to priority vehicles, such as emergency and public transit. In addition, San Francisco will deploy a connected tolling system that implements congestion pricing to encourage carpooling and ridesharing and public transit ridership. It will also expand automated shuttle service those wishing to access Treasure Island through public transit.
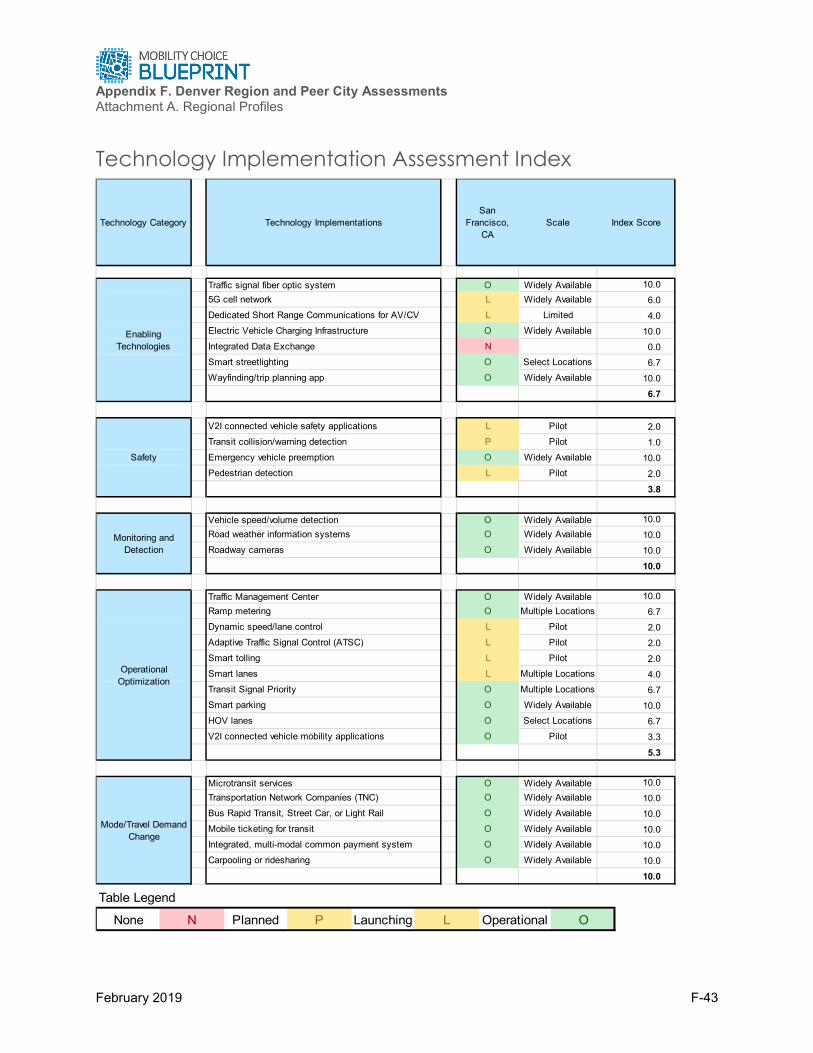
Appendix F. Denver Region and Peer City Assessments Attachment A. Regional Profiles
February 2019 F-43
Technology Implementation Assessment Index
Technology Category Technology ImplementationsSan
Francisco, CA
Scale Index Score
Traffic signal fiber optic system O Widely Available 10.05G cell network L Widely Available 6.0Dedicated Short Range Communications for AV/CV L Limited 4.0Electric Vehicle Charging Infrastructure O Widely Available 10.0Integrated Data Exchange N 0.0Smart streetlighting O Select Locations 6.7Wayfinding/trip planning app O Widely Available 10.0
6.7
V2I connected vehicle safety applications L Pilot 2.0Transit collision/warning detection P Pilot 1.0Emergency vehicle preemption O Widely Available 10.0Pedestrian detection L Pilot 2.0
3.8
Vehicle speed/volume detection O Widely Available 10.0Road weather information systems O Widely Available 10.0Roadway cameras O Widely Available 10.0
10.0
Traffic Management Center O Widely Available 10.0Ramp metering O Multiple Locations 6.7Dynamic speed/lane control L Pilot 2.0Adaptive Traffic Signal Control (ATSC) L Pilot 2.0Smart tolling L Pilot 2.0Smart lanes L Multiple Locations 4.0Transit Signal Priority O Multiple Locations 6.7Smart parking O Widely Available 10.0HOV lanes O Select Locations 6.7V2I connected vehicle mobility applications O Pilot 3.3
5.3
Microtransit services O Widely Available 10.0Transportation Network Companies (TNC) O Widely Available 10.0Bus Rapid Transit, Street Car, or Light Rail O Widely Available 10.0Mobile ticketing for transit O Widely Available 10.0Integrated, multi-modal common payment system O Widely Available 10.0Carpooling or ridesharing O Widely Available 10.0
10.0
Enabling Technologies
Safety
Monitoring and Detection
Operational Optimization
Mode/Travel Demand Change
Table Legend
None N Planned P Launching L Operational O

Appendix F. Denver Region and Peer City Assessments Attachment A. Regional Profiles
February 2019 F-44
Regional Profile: Seattle, WA
Overview Seattle has a history of welcoming and fostering innovation, especially in transportation. Boeing, UPS, and Flexcar (one of the first car sharing companies) were all launched in Seattle, and Seattle was one of the first cities to regulate Uber and Lyft. Seattle is also the first city to permit dockless bikeshare systems like Spin and Limebike. Seattle is also home to local, mobility-focused startups like Luum, mobility service innovators like ReachNow, and Amazon.
Seattle voters approved several years ago new funding for transportation through the city’s $930 million Levy to Move Seattle as well as the region’s $54 billion Sound Transit 3 initiative. As a result of the voter-supported funding, Seattle is building new light rail and streetcar lines, expanding bike routes that are safe for all ages and abilities, building more sidewalks and expanding high frequency bus services.
Seattle published the 2017 New Mobility Playbook, a policy and program framework and direction with an extensive scope that addresses everything from shared transportation to data management to impacts on the local labor market.
The Federal Highway Administration (FHWA) officials awarded in 2017 a $4 million Advanced Transportation and Congestion Management Technologies Deployment (ATCMTD) grant to Seattle for the Multimodal Integrated Corridor Mobility for All (MICMA) project. The Seattle Department of Transportation will use the grant to install and upgrade numerous Intelligent Transportation System (ITS) technologies, including traffic signal priority systems and CCTV cameras for operation management and incident monitoring and detection.
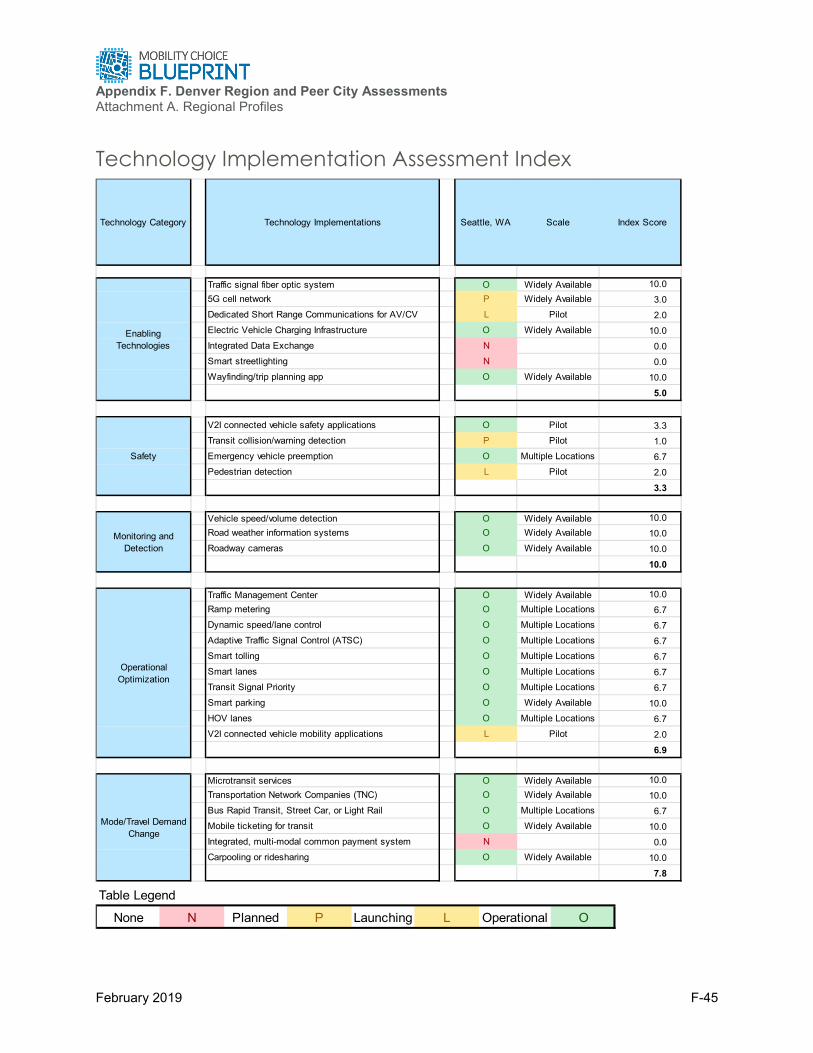
Appendix F. Denver Region and Peer City Assessments Attachment A. Regional Profiles
February 2019 F-45
Technology Implementation Assessment Index
Technology Category Technology Implementations Seattle, WA Scale Index Score
Traffic signal fiber optic system O Widely Available 10.05G cell network P Widely Available 3.0Dedicated Short Range Communications for AV/CV L Pilot 2.0Electric Vehicle Charging Infrastructure O Widely Available 10.0Integrated Data Exchange N 0.0Smart streetlighting N 0.0Wayfinding/trip planning app O Widely Available 10.0
5.0
V2I connected vehicle safety applications O Pilot 3.3Transit collision/warning detection P Pilot 1.0Emergency vehicle preemption O Multiple Locations 6.7Pedestrian detection L Pilot 2.0
3.3
Vehicle speed/volume detection O Widely Available 10.0Road weather information systems O Widely Available 10.0Roadway cameras O Widely Available 10.0
10.0
Traffic Management Center O Widely Available 10.0Ramp metering O Multiple Locations 6.7Dynamic speed/lane control O Multiple Locations 6.7Adaptive Traffic Signal Control (ATSC) O Multiple Locations 6.7Smart tolling O Multiple Locations 6.7Smart lanes O Multiple Locations 6.7Transit Signal Priority O Multiple Locations 6.7Smart parking O Widely Available 10.0HOV lanes O Multiple Locations 6.7V2I connected vehicle mobility applications L Pilot 2.0
6.9
Microtransit services O Widely Available 10.0Transportation Network Companies (TNC) O Widely Available 10.0Bus Rapid Transit, Street Car, or Light Rail O Multiple Locations 6.7Mobile ticketing for transit O Widely Available 10.0Integrated, multi-modal common payment system N 0.0Carpooling or ridesharing O Widely Available 10.0
7.8
Enabling Technologies
Safety
Monitoring and Detection
Operational Optimization
Mode/Travel Demand Change
Table Legend
None N Planned P Launching L Operational O

Appendix F. Denver Region and Peer City Assessments Attachment A. Regional Profiles
February 2019 F-46
Regional Profile: Tampa, FL
Overview Tampa is one of the first cities in the nation to deploy connected vehicle technology on real city streets. In fact, Tampa was one of just three sites in the nation to be selected for the U.S. Department of Transportation (USDOT) Connected Vehicle Pilot Deployment Program, which seeks to spur innovation among early adopters of connected vehicle applications. The other two sites are New York City and the Interstate 80 corridor in Wyoming. The four-year effort began in September 2015, when the USDOT awarded THEA a $17 million contract to implement its winning proposal. In 2016, the project entered its second phase, which includes design, testing and deployment. The third and final phase, expected to begin in mid-2018, will involve the full-scale operation of connected vehicle technology throughout downtown Tampa.
Tampa Bay Next is a program created by the Florida Department of Transportation (FDOT) to modernize Tampa Bay’s transportation infrastructure and prepare for the future. Priorities of the planning effort include:
• Move people and goods safely and efficiently
• Build a comprehensive regional transportation system
• Create meaningful opportunities for public input
• Balance regional needs with community concerns
• Commit to sustainable infrastructure decisions
A few of FDOT’s ongoing transportation technology implementations in the Tamp region include:
• SunTrax. A 400-acre site that will include a 2.25-mile long oval track, which will provide an opportunity for the testing of a multitude of different technologies in a variety of simulated environments.
• Autonomous Shuttle Pilot Project. FDOT is partnering with Hillsborough Area Regional Transit (HART) to initiate the first autonomous shuttle service in the Tampa area.
• Downtowner Shuttle Pilot Project. In conjunction with the Tampa Downtown Partnership, Hillsborough MPO, and the city of Tampa, FDOT funded a portion of the Downtowner, which is an app-based service that provides free, on-demand rides around downtown. This service began in fall 2016 and has experienced great success.
• Solar Roadways Research Project. In partnership with the University of Florida, FDOT is researching solar panels that not only harness energy, but are traffic-bearing as well. This energy can be used to illuminate nearby lighting, and possibly even provide power to electric vehicles that run over the panels in the future. In addition, the panels can provided illuminated street markings that can be modified based on travel demand.
• Wrong-way Driving Detection. FDOT is partnering with University of Southern Florida Center for Urban Transportation Research (CUTR) and FHWA to study the effects of using technology to alert wrong way drivers. As a result, FDOT has installed Rapid Rectangular Flashing Beacons at interstate off-ramps equipped with radar technology and video cameras to identify errant vehicles and alert the District’s Traffic Management Center.

Appendix F. Denver Region and Peer City Assessments Attachment A. Regional Profiles
February 2019 F-47
Technology Implementation Assessment Index
Technology Category Technology Implementations Tampa, FL Scale Index Score
Traffic signal fiber optic system L Multiple Locations 4.05G cell network L Widely Available 6.0Dedicated Short Range Communications for AV/CV L Pilot 2.0Electric Vehicle Charging Infrastructure O Widely Available 10.0Integrated Data Exchange P Pilot 1.0Smart streetlighting N 0.0Wayfinding/trip planning app O Widely Available 10.0
4.7
V2I connected vehicle safety applications L Pilot 2.0Transit collision/warning detection L Pilot 2.0Emergency vehicle preemption O Multiple Locations 6.7Pedestrian detection L Pilot 2.0
3.2
Vehicle speed/volume detection O Widely Available 10.0Road weather information systems O Widely Available 10.0Roadway cameras O Widely Available 10.0
10.0
Traffic Management Center O Widely Available 10.0Ramp metering N 0.0Dynamic speed/lane control O Select Locations 6.7Adaptive Traffic Signal Control (ATSC) L Pilot 2.0Smart tolling O Widely Available 10.0Smart lanes P Select Locations 2.0Transit Signal Priority O Select Locations 6.7Smart parking O Widely Available 10.0HOV lanes N 0.0V2I connected vehicle mobility applications L Pilot 2.0
4.9
Microtransit services O Select Locations 6.7Transportation Network Companies (TNC) O Widely Available 10.0Bus Rapid Transit, Street Car, or Light Rail O Limited 6.7Mobile ticketing for transit O Pilot 3.3Integrated, multi-modal common payment system N 0.0Carpooling or ridesharing O Widely Available 10.0
6.1
Enabling Technologies
Safety
Monitoring and Detection
Operational Optimization
Mode/Travel Demand Change
Table Legend
None N Planned P Launching L Operational O

Appendix F. Denver Region and Peer City Assessments Attachment B. Denver Regional Agency Interviews
February 2019 F-48
Attachment B. Denver Regional Agency Interviews

Appendix F. Denver Region and Peer City Assessments Attachment B. Denver Regional Agency Interviews
February 2019 F-49
CDOT Agency Outreach Meeting Minutes
Project: Mobility Choice Blueprint Study
Subject: Project Management Team Meeting
Date: March 20th, 2018 10:00AM-12:00PM
Location: CDOT HQ, 4201 E Arkansas Ave, Denver, CO 80222
Attendees: Mike King Peter Kozinski Amy Ford Marie Nakagawa Wes Maurer Deb Perkins-Smith Jason Longsdorf (HDR) Drew Parker (HDR)
Summary CDOT owns and maintains all of the state highways in Colorado including hundreds of lane mile in the metro area. CDOT has recently established the Road X program to aggressively investigate and test technologies which may beneficially enhance the travel and infrastructure in Colorado. They have a wide range of various technology pilots and ambitious statewide plans. Broadly these initiatives are organized into the six categories. Each one is shown here with an example or two.
Planning
• Smart Mobility Plan is a comprehensive planning effort looking at how CDOT will approach emerging technology
• Fiber Plan to determine prioritization and locations for extended fiber network across the state highway system.
Projects
• “Smart 25” project to implement managed motorways concept on I-25 through the south metro area
• Road Usage Charge Pilot to simulate different Road Usage Charge scenarios for 70 volunteer participants statewide
Partnerships
• Partnership with Panasonic to employ a broad range of technology innovations, particularly on the I-70 Mountain Corridor.
Operations
• Establishment of a Metro Denver Operations Center
Data Management
• Establishment of a Chief Data Officer to develop a “connected ecosystem”
Policy
Appendix F. Denver Region and Peer City Assessments Attachment B. Denver Regional Agency Interviews
February 2019 F-50
• Autonomous Mobility Task Force
• Adoption of Federal Connected and Autonomous Vehicle Standards
Interview Notes 1. Introductions:
• Mike King - Transportation Planner with Multimodal Planning Branch
o Statewide plan, integrating tech, alternative fuels
• Peter Kozinski -RoadX
o Connected Vehicles to supporting planning policy, ITS, etc.
o Demonstrating tech in a constrained environment
o Panasonic Connected Vehicle Ecosystem
• System that can be used for any type of roads - Commercial grade CV ecosystem
• Infrastructure and all sorts
• Amy Ford - Advanced Mobility
• Marie Nakagawa - Policy and Gov't Relations
o Draft Bills - coordinating CDOT policy with legislation
• Wes Maurer - Lead for Intelligent Transportation Systems
o Cloud-based data ecosystem - partnering with other agencies
o Leverage Big data
o Connected Vehicle network Infrastructure
o Smart Mobility Planning
o Wes will be presenting to DRCOG board 3/21 about Smart Mobility and MCB
• Deb Perkins-Smith – Department of Transportation Development
2. General Thoughts:
• Home-rule municipalities
o CDOT will lead the process for local gov't, but ultimately it is up to the local gov't to adopt it
o ALL SPAT information should be shared with TTI so it can be disbursed and shared
• The Smart Mobility plan is not a policy document
o Will not set technology standards
o Determines how "everyone will play together on the same playground"
o Plan will be a living document so that the folks that implement it can come back and provide feedback on the guidance
• TSM&O Analysis
Appendix F. Denver Region and Peer City Assessments Attachment B. Denver Regional Agency Interviews
February 2019 F-51
o Would look at small scale improvements that extend life of the system and prevent the need to implement capital improvements
• Updating PEL structure
o Technology alternatives - cited in PEL document
o Boilerplate language about being able to reconfigure roadway space for AVs Tech policy working group:
• Educating the public about the technology
• They are working on policy to fix a statute to allow CDOT to collect data like other private orgs can
Recent CDOT survey:
• People want CDOT to be the holder of data and infrastructure, so that 3rd party vendors are not selling their data
• In recent CDOT survey people felt proud that CDOT was leading the charge on implementing tech
MCB Overarching themes
• Smart Infrastructure
• Partnerships
• Consumer Mobility Tools
o Trip Planning App
o Can Google Maps adapt to be this? Or does it need to be a local region focus
• Data, regulatory/policy environment, equity, economic vitality
• "How does this improve people's lives and the economy?"
• NOTE: MBTA had big issues piloting MaaS due to contracting and insurance/ADA issues
3. CDOT’s Technology Framework:
o PLANNING
• Smart Mobility Plan
• Statewide Fiber Plan
• Technology Toolkit (can be appendix in a PEL)
• Scenario Plan Development
3 Connected and Autonomous Vehicle scenarios for CO
What would benefits and challenges be?
• Policy Scenarios
Examines how policies would affect the uptake of AV/CV
• Traffic Modeling
• Statewide Transportation Plan

Appendix F. Denver Region and Peer City Assessments Attachment B. Denver Regional Agency Interviews
February 2019 F-52
• Operations Evaluation
• Statewide Maas/TDM Study
Talking with CCD about integrating or improving GoDenver 2.0 app
• Managed Lanes Procedural Directive Update
• HPTE - Express Lane Statewide Master Plan
o FUNDING
• RoadX -$12 Million
• Agencies are using CMAQ funds to advance tech
• Federal
• HSIP
• FASTER Safety
• Ps/HPTE
• Road usage charge pilot
• Congestion pricing through tech environments
• If CDOT powers vehicles, do they become a utility?
• What would monetizing data look like?
CDOT is not intending to make money, the intention is to improve mobility and safety, any financial return would be a secondary benefit
o PARTNERSHIPS
• Hampden and Wadsworth Signal project in CCD
• E470
• NREL
o CYBERSECURITY
• Protecting critical transportation infrastructure (from attacks)
• ITS America hosting national cybersecurity conference in Denver this year
o PROJECTS
• Safety
Smart Pavement
• 1 Mile of it on the US85 corridor - it can pass communications
• Could read the speed of a vehicle
Bike/Ped Challenge
• Detection
• Lighting
Smart Work Zones - Feds interested in this

Appendix F. Denver Region and Peer City Assessments Attachment B. Denver Regional Agency Interviews
February 2019 F-53
Rural road challenge
• Wildlife, etc.
• Regions 3 & 5 are doing a wildlife study, should coordinate
Smart traffic systems
• Transport
Smart Truck Parking
Hyperloop
• Connected
Connected Ecosystem
Panasonic
Here
Will likely be first ecosystem in the country
3 years to opening day
Local gov'ts not currently included
• Commuting
Smart 25
Smart ramp systems
NB I-25
Denver South TMA - Truck Fire
Thinking about how to disperse traffic across the system off of an autonomous mainline divided highway that is running at a much higher capacity
• Sustainability
Smart Powered Lanes (inductive charging in the pavement) - working with DIA
Statewide EV charging plan
RevWest agreement with all of the mountain states
o INTEROPERABILITY
• Traffic Signals
• Data Sharing
• City of Aspen is ready to start Smart Mobility Lab in 2019
o DATA
• DAISY - Data Analytics Intelligence System (Cloud Environment)
Current traffic management system
Connecting with data from other systems besides CDOT facilities

Appendix F. Denver Region and Peer City Assessments Attachment B. Denver Regional Agency Interviews
February 2019 F-54
Database
Opensource and accessible to other agencies
Waze contract
Here
Strava data
INRIX
Etc.
• Chief Data Office
• Connected Ecosystem
o POLICY
• Internal Specifications
Requiring DSRC units in all new signals
• Autonomous Mobility Task Force
Looking at AV driving permissions
No local jurisdiction can say "no" to AVs
• Rapid Speed Travel
Hyperloop policy and regulatory thinking
Coalition of states thinking about how to regulate these projects
• Federal
CV/AV environments
• Policy review
Data Standards
5G networks - data shared on a spectrum
4. What would make MCB a success for folks?
• CDOT does not want to see highly specific recommendations
• Research project with multiple states for how to connect RUC to AV/electric vehicles
o Would be working with auto manufacturers
• MN has an STSFA grant to look at
• Some cities have charged TNCs for number of trips
o Chicago
• What future do we want to create?
o What is the quality of life vision
o How do we back into it?
• Getting the 3 agencies together to gather around one idea/vision
Appendix F. Denver Region and Peer City Assessments Attachment B. Denver Regional Agency Interviews
February 2019 F-55
o Don't necessarily need a compact, just to all agree on the vision
o Understanding that every agency has its own issues and some individual solutions
• Tipping Point
o Establish an "A-ha" moment so that we can start moving in that direction
o Policy triggers?
o Funding trigger?
o How do we know when all of the myriad possibilities have filtered into a smaller set of options
o Dynamic Routing Transit
• LA
o Mobility as a Service
o Infrastructure as a service
• Moveable parts to adapt to different environmental and transportation needs
• MCB need to not be redundant to what CDOT is already doing
• It also needs to not summarize what the three agencies are doing
• Go further, talk about the economic vitality and livability

Appendix F. Denver Region and Peer City Assessments Attachment B. Denver Regional Agency Interviews
February 2019 F-56
Denver Metro Chamber Meeting Minutes
Project: Mobility Choice Blueprint Study
Subject: General Project Discussion
Date: April 4 from 2:30 – 4 p.m.
Location: Denver Metro Chamber of Commerce
Attendees: Jason Longsdorf (HDR) Denise Burgess (Chamber) Denise King (Chamber) Sam Bailey (Chamber) Cristina Beermann (HDR)
1. Leadership Foundation – Denise
• Programs to learn about the project
• Flagship – Leadership Denver
o 65 people
o Panasonic, May 4th
o 1 full day per month
o Transportation Mobility
o Community focus group
o Experiential activity
• Community collaboration - to solve community problems
• CDOT and Panasonic collaborating as equal partners
2. Sam: Economic Denver Development
• Relocate and expand economic development incentives
• Transportation to prospective companies
o Main drivers for relocation is talent
o Context of transportation, discuss how employee’s making a specific income will live, commute, work
Identify employee burdens, such as connectivity options
Service line near employer, tell me how my employees will get around the region
Easily accessible
Comparing to other transit systems adaptability
• Discussion about cost
o Cost, frequency, reliability, usage, communities that are connected

Appendix F. Denver Region and Peer City Assessments Attachment B. Denver Regional Agency Interviews
February 2019 F-57
Use it to sell employees on location
• Panasonic in 2015
o Smart city development
o Neighborhood planning, lighting, streets, etc.
o Leading companies working with the government
o Road X with CDOT
o RTD’s commuter rail has air rights above all of their lines
Amazon could use conductive charging or similar above the lines
Interesting that RTD is ready to leverage for private sector use
• Private asset using public infrastructure
• Centennial and Lone Tree partners with Uber and Lyft – First and Last Mile example
• Create dedicated lane for pool rides – lowering wait times and idling in a main driving line
o Subscription of riders, alleviate congestion in driving lanes
o Right lane is completely empty besides the 5 – 15 minutes of traffic during peak times
• Jason: In order to offset potential congestion associated with 50 people on bus that are now 25 people in an Uber, either way it is congested
o Legislative steps to heavily incentivize and/or mandate during peak hours, or reasons for Uber and Lyft to pick up multiple passengers
o Systems are built in, per ride rate is built up if you pick up more passengers
• RTD increase ridership and reduce car use – incentive options
o State to offer a modest tax credit for RTD pass
o Encourage employers to purchase Eco Passes who might not offer it
• Denise: Opportunities with Eco Pass are constricted
o The more Eco Passes available means you can do more travel publically
• Be more flexible so more companies would get them, ridership would increase – not sure if this is a possibility
• Peak and surge pricing
o Example: Chicago on NYE and on St Patty’s Day, L costs 1 cent,
o Pricing system and dynamic modeling around peak times for rush hour or during events
o How many games are there and do you run a pricing model so that it appeals to a consumer?
o Adjust for high in demand routes or peak hours, events
o Games that are a big deal i.e. opening weekend, Broncos, etc.

Appendix F. Denver Region and Peer City Assessments Attachment B. Denver Regional Agency Interviews
February 2019 F-58
• Rockies project with Panasonic – smart city project
o 250 million project
o Transit center on west end at DEN
o Will be used by nearby residents
• Traditional construction and overlaying Panasonic piece for this live with a mobility choice approach
3. Parking Impacts
• How might it impact construction
o Game day parking – city to have waived parking
o “Forces a change in culture” – bars in place of tailgating?
o Incentivizing
• Parking would in theory decrease - build parking in a different way so the structure can be repurposed
o Investment community is not yet ready
• Denise: Traditional banking community is not yet ready
o Suggested a waiver for all parking (bank)
o 25 – 27k per structure of parking
1 spot per unit
1.75 for grocery
Partnerships but are there more legislative
• To attract certain tenants, attracts higher end luxury clients , amenity to lure, and opportunity compared to New York or similar
o Culture change
o Public transit is used by entry level to senior level
o Balanced approach to marketing
• Parking minimums –> parking maximums, if you want more than X, there needs to be proof, incentive or an offset
o Make transit competitive that people don’t want to pay for parking
o Hope for that level for economic competition
• Reuse curb space? I.e. Uber and Lyft stopping in travel lanes
o What would you do with the various spaces?
• Transportation is a pillar of the Chamber (always looking, industry and also legislative) Including rural and getting them on board

Appendix F. Denver Region and Peer City Assessments Attachment B. Denver Regional Agency Interviews
February 2019 F-59
• Economic development looking at transit oriented development (TOD) opportunities
o I.e. Lone Tree – Ridge Gate, built with intention to commercially develop
1. I.e. Pena station, South Broadway
• DRCOG is presenting to New Zealand on economic development
• Denise: Central 70 project - how that will affect the communities etc. – try to be thoughtful about thinking all the way through, changing a community and culture, live and work
4. Transportation Committee – Projects/ideas
• Chamber’s been proactive about transportation for funding
• EDC – biggest concerns is regional transportation network
o Inter-city connectivity and bike lanes are weak
• Depth of communities on:
o Light Rail down South Broadway
o Ran down to Cherry Creek
o Better within city, not just suburbs
• Jason: Arterial corridor study of 60 arterials, including Federal, Wadsworth, Hampden Identify how to prioritize
o Flatiron flyer
o A challenge with the variety of different cities, counties, etc.
o Vs. state highways
o Communities who feel neglected (for example, Montebello) for accessibility and connectivity
o New growth and development, how responsive is RTD for increasing lines?
Is the community talks about how service is decreasing
Jason: Formula for increasing ridership and existing routes depends on ridership and new development
5. Equitable transportation systems and Public Private Partnerships
• Community ethnographies –to be inclusive
• Action item: forward link to quiz to attendees
• Recommendations – how to best have P3s
• Hard to convince business community to legislate behaviors, implies there is no moral compass of their own
o Are there opportunities to remove barriers to P3s
I.e. Speeding up procurement process
Appendix F. Denver Region and Peer City Assessments Attachment B. Denver Regional Agency Interviews
February 2019 F-60
Wi-Fi on every light rail or bus like in planes, encourage Colorado based companies
o RTD released RFI for any technology that might help
Received 65 responses and has organized and identified internal red tapes
• What does Utopian transportation future look like?
o Single place for ideas to be vetted for each agency – not contradicting any other projects, etc.
o Wi-Fi availability on RTD services and at DEN
• Regional workforce
o Home advisor or Charles Schwab – amazed by how far everyone lives from work
o Anti-growth initiative in Lakewood, artificially limiting growth
o Transportation – RTD should be an asset for employers
o Retention or retraction
o RTD as a solution or possible consultant
6. First and final mile solutions
o Lyft in Centennial - not ADA compliant
o RTD - Every single vehicle would have to be ADA compliant but would cause issues
• Call-n-Ride becomes a more systematic route
• Can any private entities buy RTD station or bus line?
o On the A Line, built into environmental review process the ability to add in one more station (Pena Station has a privately owned parking lot)
o Must be separately funded
o How could RTD support or partner with standard buses and union drivers?
Could a private company (like Amazon) buy a bus for their service only
Jason Longsdorf – It would be cheaper for the company to buy their own private charter or shuttle due to Union drivers, etc.
7. Big Data
• Jason: A piece of this effort is the additional data we have on our clients – as there’s more data how do we protect it, legislation?
o Need to be prepared so there isn’t a fallout
o Data centers are around the country
o Need to identify a plan on how to utilize data centers, including how much data needs to be stored and if it becomes public information

Appendix F. Denver Region and Peer City Assessments Attachment B. Denver Regional Agency Interviews
February 2019 F-61
• Worked with Airbnb and Strava
o Airbnb sells back to tourism offices across the world
o Demographics of who is coming to visit
o Strava does same with metropolitan community patterns, they sell it back to cities
o Curating different segments for goods, taking in data for public gain
• Who is riding RTD? Who is not riding and why?
o Route capability based on destinations
8. Building ridership and services
• Does RTD sell to companies that want it?
o For example real estate companies
o Open sourced so anyone in the public has free range to information
• Agencies would love to monetize but no way to custom package it, offsets their costs – not a revenue source
• How does RTD appeal to moms that have to get kids from point A to point B?
o Can we go to Kroger about markets their missing, ridership, income levels, demographic…And suggest next grocery store location for commercial development
• Transportation uses trip patterns for this type of data to determined trip patterns
• Design new services
o Transit for kids (Uber-like) would be great if a kid call their own car to and from practice
o Grandparents who no longer drive to and from the doctor’s office
o This community will grow East and North – how do you incentivize counties that are in RTD territory to master plan transit?
As we grow, how do unincorporated counties create a master plan where transit will be there
o Every master plan should include light rail or bus lines running through every new development
Make it a requirement for county planning documents
Appendix F. Denver Region and Peer City Assessments Attachment B. Denver Regional Agency Interviews
February 2019 F-62
DRCOG Agency Outreach Meeting Minutes
Project: Mobility Choice Blueprint Study
Subject: Project Management Team Meeting
Date: March 15th, 2018 2:00PM-3:30PM
Location: DRCOG, 1290 Broadway #100, Denver, CO 80203
Attendees: Jacob Riger Steve Cook Todd Cottrell Flo Raitano Greg Mackinnon Steve Erickson Doug Rex Brad Calvert – Absent Jayla Sanchez-Warren – Absent Jason Longsdorf (HDR) Drew Parker (HDR)
Summary As the municipal planning organization for the Denver metro area, DRCOG’s primary mission is to help coordinate regions’ planning activities including transportation planning and implementation. The agency also provides a robust data platform for local agencies to draw on for regional transportation and land use data. Other highlights of the relevant work at DRCOG include: Smart Region Initiative
o New collaborative program centered around interoperability of new technology and making it accessible to all DRCOG member governments
Multi-jurisdictional Corridor Traffic Signal Coordination
TMA Activity Coordination and Way to Go Program
o These programs are perfect incubators to test new programs to encourage alternatives to single occupant vehicle travel.
Interview Notes 1. Introductions
• Steve Cook: Transportation Modeling and Operations Manager
o Met with modeling group (Smith, Chris, and Ian)
o 20+
• Todd Cottrell
o TIP Program
o Setting how program runs

Appendix F. Denver Region and Peer City Assessments Attachment B. Denver Regional Agency Interviews
February 2019 F-63
o Conducting the TIP call
• Jacob Riger
o Long-Range Transportation Planner
o Multimodal Planning
• Transit
• Freight
• Bike/Ped
o Primary contact for MCB
o Has some ideas
• Drew Parker
• Jason Longsdorf
o Two-phase interview
• Current goals and programs
• Follow-up meeting to understand the needs for coordinating policy and goals
o Task lead for agency/governance portion of project
• Flo Raitano
o Self-described "Chief troublemaker"
o Director of partnership development and innovation
o Executive Office
o Smart Region Initiative Foundation (larger than mobility) is in communications with the following:
• Denver South EDP
• Panasonic
• CityFi
• Inter-operability of every technology, to allow small communities to benefit
• Remove barriers to entry
• Greg Mackinnon
o Transportation Operations Program Manager
• Application and engineering side of technology and transportation

Appendix F. Denver Region and Peer City Assessments Attachment B. Denver Regional Agency Interviews
February 2019 F-64
• Steve Erickson
o Marketing and Communications
o Runs Way2Go program
o Interested in tech, have a platform they're using
o Background in tech and intel
• Regional Planning and Development Division -Absent
o Land Use and Economic Planning (Brad Calvert)
• Area Agency on Aging - Absent
o Keeping elderly in their homes as long as possible (Jayla Sanchez Warren)
2. Programs and Policies:
• Smart Region Initiative: Identifying the existing players. Some local agencies are further ahead than others. Working with Greg on RoadX on pilots.
o Establishing standards
o In the research phase, program is internal
o Sharing land use and travel model
o Traffic synchronization across the entire region
o GIS database
• Ability to provide the highest-level data
o UrbanSim is land use model - open source
• Provide regional dataset
o Planimetrics data
• Could be a way to conduct curb space management
• Provides an understanding of the paved areas across the region
• The pricing of regional data/ products needs to be considered - example of DRAPP project where there is a compromise to get what works best for most agencies
• North Central Region
o Compiling regional data for tactical purposes and public safety
• Active Transportation Plan
o Will include tech components
Appendix F. Denver Region and Peer City Assessments Attachment B. Denver Regional Agency Interviews
February 2019 F-65
• Vision Zero
o Will include tech components
Traffic Signal • Existing regional traffic signal system program
o Has been going on for 20 years
o Provide signal timing services for local agencies that can provide signal progression between agencies
o Fixed timing (everyone is on the same clock)
o AM, PM, and off-peak plans
• Constantly review and improve
o Want to be more dynamic
• Challenge is that there are different systems from agency to agency
• Not all systems communicate with others, defeats the purpose
o Knowledge, expertise, and quantity of staff to monitor and tweak signals is a challenge
o Maintenance issues
• Newer technology may have even higher maintenance costs and may be cost-prohibitive for small agencies
o Is there a consistent technology
• DRCOG is tech agnostic
• Must eventually converge on common signal systems in order to avoid stranded investments
• Would like to see guidance for the local agencies on the interoperability of signal systems
o There is a base level of ITS/signal capacity required on traffic signal projects, but not on other non-ITS/signal projects
o Technology on all projects is integrated during the application process
• TIP
o If you have a transportation technology project than you have to abide by the regional architecture guidelines and use a systems-level approach to determining where and what type of signals may be installed
o DRCOG prioritizes the tech projects, but not many come through
Appendix F. Denver Region and Peer City Assessments Attachment B. Denver Regional Agency Interviews
February 2019 F-66
o Turning around process
• Evaluating based upon how projects relate to MetroVision and how the improve focus communities
• Hoping that project development is more open due to less restrictions on criteria
• Anticipating more unique projects through this process, but not yet sure
o ~$21 million for region, ~$220 million for sub regions (counties)
• Regional signal architecture
o Operators in the RTO working group
o Hard to get everyone to buy into the regional architecture
o CDOT is not always the best player on the architecture
• Need some language in the IGAs with local agencies to make sure CDOT and local agencies are on board
• DRCOG often becomes the enforcer of Federal rules
o CMAQ funds, DRCOG has to ensure applicants
o Signal architecture has clear Federal guidelines
o Sometimes the Federal answer is "try it, and we'll see what the line is" experimenting with different policies, funding, etc.
o If there is a project type that is highly ranked for the Feds, then they may be more likely to fund it and allow it to move forward
• Physical Infrastructure
o Interagency communications
• Existing network owned and operated by CDOT
• Needs to be improved to work for the whole region
o Database hosting
• Will it be in one place or multiple places?
• Shared in real time?
o Panasonic and CDOT are doing one thing, while Denver is doing something different
o Smart Parking
o Trip Planning

Appendix F. Denver Region and Peer City Assessments Attachment B. Denver Regional Agency Interviews
February 2019 F-67
• Have to have APIs from all of the data providers so that everything can come together
• What is the data protocol and data language?
• Already had conversations with CDOT and Denver for
o Ride Amigos - MyWay2Go Platform
• Not a real-time dynamic app
o Denver app did not have enough data and traction with GoDenver App
o Denver released GoDenver 2.0 RFP
• Ultimately want to be able to pay for trips
• Not a technical challenge, more of an agency agreement challenge
• Different agencies have their own apps
o Transit
• VTCLI
Through FTA and CDOT DTR
Expedia for trip planning
Back-end program for providers like SRC or Via
Multiple systems talk to each other so that trips can be made cheaper
Pilot: RTD and Via
• Longmont RTD call-n-ride and Via coordination
• 6 months into the project
• Commitment to shared platform
o Is DRCOG the publisher of the end-user product, or should they be the data host?
• DRCOG cannot provide end-user products better than private industry can
• Coordinating and convening the region around a common issue
o Is the universe of data the Denver Region, or is it the State?
• Does is start at the region level and is then shared to the statewide level?
• Is it then shared to neighboring states
• Policy for how new mobility technology affects land use

Appendix F. Denver Region and Peer City Assessments Attachment B. Denver Regional Agency Interviews
February 2019 F-68
o Desire to do this at DRCOG
• Performance Measures
o Need to have common measures across local agencies
o Everyone has to adhere to them
• Region needs help understanding the tradeoffs of technology
o Could be great for elderly and/or disabled
• What does that do to VMT and travel behaviors
• DRCOG needs to stick to the core business of planning
o Future technology is only one of the tools that is available to DRCOG
• Funding
o Road usage fees?
o DRCOG has a mission statement and they are considering new funding sources as likely necessary
• Scenario Development
o Will be easy for DRCOG to say what they don't want, but may be harder for them to say what they do want
o Curbside management and prices
• If it stresses mobility as a service what does that tell us?
• What types of funding mechanisms support the vision that we want?
• Need to do the basics well too, striping and signing
• Talking with Chariot, Scoop, Dynamic Car Pool apps
o Private industry wants DRCOG to identify and partner with large employer
o Doesn't cost DRCOG anything besides the marketing and time to make connections
o DU Pilot project was championed by Stuart Anderson
• TMAs
o Existing Tech Committee - Way2Go
o Helsinki, Finland was the closest to having a shared payment and trip planning platform, but no real other one in the US
3. Summary Notes (last 5-10 minutes of conversation):
14 million trips per day in the DRCOG region

Appendix F. Denver Region and Peer City Assessments Attachment B. Denver Regional Agency Interviews
February 2019 F-69
• <1% external-external
• Relatively few trips are external to internal
• 97% of trips are within the region
• Overall goals:
o Partnerships (who else can we partner with?)
o Process (coordination with CDOT and RTD)
o Products and Criteria
Should DRCOG have funding criteria for future mobility?
Should DRCOG provide more information in MetroVision about future mobility?
o Smart corridors? How would DRCOG implement this?
o Would like a tangible set of recommendations
• Doug Rex – “do not shy away from being bold on recommendations”
• Whatever we can do to leverage and motivate local agencies and others to move faster and get on board with future mobility
• This is an opportunity for RTD to truncate their service system, improve it, and let the far-out areas be served by private industry
• “What will be the social outcomes of emerging technology?”
• “How will we address the freight and delivery issue?”

Appendix F. Denver Region and Peer City Assessments Attachment B. Denver Regional Agency Interviews
February 2019 F-70
RTD Agency Outreach Meeting Minutes Project: Mobility Choice Blueprint Study
Subject: Project Management Team Meeting
Date: March 19th, 2018 9:00AM-11:00AM
Location: RTD, 1560 Broadway, Denver, CO 80202
Attendees: Brian Welch Jeff Becker Jason Longsdorf (HDR) Drew Parker (HDR)
Summary RTD provides public rail and bus transit for the Denver Metro area. The agency is focused on delivering three additional lines in the very near future as part of the FasTracks network while also maintaining its’ robust regional, express and local bus services. RTD is challenged by two major issues when it comes to employing new technologies. The first challenge is that they must coordinate with dozens of different municipalities and sometimes CDOT to make changes to the streets, signals and passenger and bus staging areas for most of the miles of transit service they run. The second is that their federal funding comes with strict requirements for how it can be used which limits their ability to experiment with innovative programs. However, RTD is always looking for additional ways to improve service and is soon embarking on a yet to be defined “Technology Transformation” initiative. Other highlights of the relevant work at RTD include: Technology “Request For Information”
o RTD has received over 60 proposal from private transportation technology companies and is in the process of considering if and how to partner with them to investigate and employ opportunities to improve service in these four categories:
1. On-Demand Transportation
2. Automated Vehicles
3. Fixed-Route Shuttles
4. Trip Planning Software
Current planning studies which may identify and prioritize technology related service improvements are the “First and Final Mile” and “Regional Arterials”
Interview Notes 1. RFI - Mobility On Demand (non fixed-route fixed-schedule)
o RTD recently received responses to a Request for Information on Mobility On Demand and Mobility as a Service.
o Some of the respondents included:
• TNCs and ride-hailing services

Appendix F. Denver Region and Peer City Assessments Attachment B. Denver Regional Agency Interviews
February 2019 F-71
• Via
• Chariot - route flexible
• RouteMatch
• Demand Trans
• DRMAC
• Autonomous Vehicles
• Supplementing Call-n-Ride?
o Dedicated vehicle fleet vs. utilizing taxis/ride-hailing agencies
o Exchanging trip info
• Expect to get started on this soon
o Where does the RFI information apply?
• 20 call-n-ride service areas, 15 are first-last mile
• Middle of the day, only seeing 5 trips or so
o Would it supplement call-n-ride?
o Secretary Fox - "Dear Colleague" letter
• Arlington, TX (went to entirely Via)
• Certain requirements for federal vehicles (ADA accessibility)
• Makes it hard to replace call-n-ride
• Has to be an equivalent service
Cash payment
Accommodate person with disability
Drug-testing requirements
What is the additional cost associated with it
• Bus bridge example
Need to be able to access every single vehicle and trip
o Centennial call-n-ride (Dry Creek)
• City wanted to replace with Lyft
• Spent 80% of money on ADA vehicle for 1% of riders
• Ran for 6 months
• 10 riders/day (3 came from call-n-ride)
Appendix F. Denver Region and Peer City Assessments Attachment B. Denver Regional Agency Interviews
February 2019 F-72
• Call-n-ride had 50-55 riders
• $50 per trip on Lyft, $20 on call-n-ride
• Uber recovers 40% via fare, not as simple as it seems
2. Long-range planning
o BRT planning underway (regional feasibility study)
o First-last mile (medium range)
o Long-range is mostly large rail projects, not anticipating more money
• Small tweaks to the system, but no large projects
o District would like to do a short-medium-and long range look at system
• "Transportation Transformation"
• Mobility OnDemand RFI
• Outreach to customers
• Model 2040 year of additional transit trips (100,000 trips)
• Currently at $100 million boardings per year
o 1/3 rail, 2/3 bus
o Bus System
• Enhanced bus (BRT)
• Transit Priority
• Complete Streets
• TSP and Dedicated Lane
o Unbelievably complex bureaucratic process to get these completed
• Trip Planning and shared payments system
• Positive Train Control
o Is a double-edged sword, especially as an early-adopter
• Need to know what is the problem to be solved?
o RTD for commute rate is very high in some locations
o RTD is most competitive in this market
• Types of riders
o Don't like captive vs. choice
o Commute

Appendix F. Denver Region and Peer City Assessments Attachment B. Denver Regional Agency Interviews
February 2019 F-73
o All-purpose
o Single-time event riders
o How do you enhance service for each of these groups
o Essential for some trips, not as essential for others
• What can RTD do best vs. what can the new companies do better?
• Looking for what, how, and where should we make investments in technology
o Somewhat technology-skeptical
• Top places to invest:
o Trip Planning and shared payments
o Bus Operations
• Electrification?
• TSP?
• Existing or future
Automated and connected vehicles, how does it apply to transit?
No existing infrastructure or standards to implement
• Who will be the leader to establish the network for
• Driverless emphasis is too strong in the discussion compared to other technologies
o Why not discuss connected vehicles?
o No money to be made in the autonomous or connected transit market vs. the personal trip market, therefore there hasn't been as much money and R&D
• Portland TSP
o Passenger counts on arriving buses allows for priority on TSP
• What would be the best outcome for MCB?
o Who are we serving and who should benefit?
o Berkeley study using chauffeurs to simulate driverless vehicles
o Need to balance livability with tech
3. RTD Datasets
o Private sector has a better understanding of how to monetize data
o Public sector is too afraid to share/sell their data
o Data has increased drastically in the last 15-20 years

Appendix F. Denver Region and Peer City Assessments Attachment B. Denver Regional Agency Interviews
February 2019 F-74
o What data is used real-time?
• What would you want to use it for?
• Need to have MCB discussion about what you would use real-time data vs. archived
o Real-time changes are not that easy for RTD
• Very cautious in planning and provision of service
o Hard for RTD to understand origins and destinations
• People only tap on, don't tap off
o Real-time data is used for dispatching
• Dispatcher knows where all of the vehicles are and can help them divert if there are issues
o RTD would like to hire an operations analyst:
• Model ridership
• Should be looking at TSP, etc.
• Private sector is more sophisticated
o DRCOG and RTD exchange data
o Sometimes cities provide traffic and design data to RTD
o Relative speed vs. transit load
o RTD already meets with Denver regularly to address issues
• Need to make sure there are actionable items coming out of these types of meetings
4. Future of RTD
o Much of the next RTD projects will be local-jurisdiction led from the funding side of things
o Regional BRT transit map - looking at routes carrying 1 million riders per day
o Need to include technology in all future projects
• Fiber
• Communications towers
o Ultimately transit folks and traffic engineers are not all on the same page
• Need to have a compact or agreement with DRCOG, RTD, CDOT, and locals

Appendix F. Denver Region and Peer City Assessments Attachment B. Denver Regional Agency Interviews
February 2019 F-75
• Commitment to use data collectively
• What is the legislative framework for this?
• Local home-rule ultimately is the decider of what gets implemented
• Look at the G-Line mishaps
Jurisdictional fighting and misunderstanding
• What is the risk in using technology?
o "Bleeding-edge" technology
o RTD is not as nimble at procurement and process
• CDOT does not often ask for transit information from RTD
o Bustang will use RTD tech for trip planning and payment
• Modeling data is tightly coordinated between DRCOG, CDOT, and RTD
• Front Range passenger rail project will involve lots of coordination with DTR
o How to tie into a RTD station
o Interoperability?
• Anonymous license plate data for Park and Ride studies
• Data sharing risks
o Privacy
o Safety-sensitivity
o RTD data is not generally thought to be as private of data
5. Summary Notes (last 5-10 minutes of conversation):
o Concerns from the board that MCB would not support transit
o RTD embraces technology that enhances customer experience
o RTD willing to take technological risk
o RTD customers are not the richest, have different means and needs than other transportation populations
o RTD is one comprehensive agency that covers the whole region, there are some advantages to that
• Do any other agencies monetize their data?
o Some charge to recover costs
o Probably not an opportunity to fund anything through monetizing data

Appendix F. Denver Region and Peer City Assessments Attachment B. Denver Regional Agency Interviews
February 2019 F-76
o All data is subject to CORA (Colorado Open Records Act)
• Privatization of service is very tricky
• Don't want to look too far into AV/CV
o Focus on the key RTD rider demographic and needs

Appendix F. Denver Region and Peer City Assessments Attachment C. Peer City Interviews
February 2019 F-77
Attachment C. Peer City Interviews
Appendix F. Denver Region and Peer City Assessments Attachment C. Peer City Interviews
February 2019 F-78
Peer City Interview: Austin, Texas Project: Mobility Choice Blueprint Study
Subject: Interview with Jason JonMichael, City of Austin
Date: April 25, 2018 2:00PM-2:45PM
Location: Conference Call
Attendees: Jason JonMichael, City of Austin Randy Bowman, HDR Drew Parker, HDR
Summary Austin CityUP is a consortium led by Capital Metro (the regional transit agency). CityUP provides a collaboration space for multiple public and private entities including the City of Austin, Capital Metro, the University of Texas Austin, the Austin Chamber and numerous technology companies such as AT&T, Verizon, Cisco, Dell, and about 50 other private companies or non-profit organizations.
CityUP exists specifically to plan and implement “Austin Smart City” investments. The consortium has four main areas of focus:
1. Providing a space for dialogue and facilitating public-private opportunities
2. Ensuring Austin Smart City investments take advantage of grant funding and coordinate initiatives to get the most out of finances
3. Developing a financial plan to sustain Austin Smart City investments
4. Providing opportunities to pilot or prototype new transportation and mobility solutions
Additionally, CityUP resulted in a contract between the City and the University of Texas Austin Center for Transportation Research to host and disseminate transportation data. Jason JonMichael is the Director of the Smart Mobility Program within the City of Austin Department of Transportation. Notes from a conversation with him are below.
Interview Notes 1. What programs, policies, or initiatives for integrating new transportation technologies are
currently in place within your city?
The City is currently working to determine how to do the job of today and tomorrow, with special focus on curb space management, smart mobility, parking enterprise, and ITS. The following technologies are examples of what is currently in place or somewhere in the planning process.
• Traffic signal fiber optic: 90% of the City’s signals are on the Ethernet-based IP system. The City is moving toward 2070 cards in signal controller boxes including D4 software.
• Dedicated short range communications and vehicle-to-infrastructure technology: Smart Mobility is demonstrating and piloting the technology. There are 15
Appendix F. Denver Region and Peer City Assessments Attachment C. Peer City Interviews
February 2019 F-79
different projects in different phases of implementation, including three connected vehicle pilots.
• Autonomous land drones: City of Austin is currently advertising a request for information for drone-based parcel delivery including non-prescription medications and Meals on Wheels.
• Public data portal: City of Austin and Texas Department of Transportation have data portals.
• Smart street lighting: All streetlights have been updated with LEDs, and the City is piloting smart streetlights for late-night student commuting.
• Transit signal priority: exists on multiple corridors
• Bicycle safety app: Kimley-Horn developed a bicycle safety application called the “Connected Traveler Application” that can use a bicyclist’s GPS location via their smartphone to connect to the signal controller via the cloud, and modify the signal cycle and collect bicycle counts (if the bicyclist has the app installed on their phone).
• Pedestrian safety: The City has a contract with GridSmart to conduct machine-learning via cameras for pedestrian detection with centimeter-precision of the pedestrian’s location. Jason’s biggest priority moving forward is to develop a pedestrian detection system within autonomous and connected vehicles via 5G-enabled phones. He sees pedestrian detection and safety as the biggest issue that is currently going unaddressed in the industry.
• Smart tolling: The entire state has open road tolling.
• Microtransit: Chariot operates multiple routes for first and last mile connections and evening student commutes. Capital Metro has started its own microtransit service as well.
2. Where and how are decisions made about transportation technology within your agency?
Following the Smart City Challenge, the City of Austin received $45 million in private sector sponsorships. This created a program architecture that follows the Transportation Research Board’s scenario-planning process. The process includes the following steps:
• Identify system needs and how needs are currently being met.
• Plug in new technology solutions to those needs if they can be a new and promising solution by beginning with a piloting phase.
• Create a revenue-neutral scenario, not showing company preference.
• Companies showcase their technology without having to reveal their industry secrets.
Appendix F. Denver Region and Peer City Assessments Attachment C. Peer City Interviews
February 2019 F-80
Mayor Adler challenged Jason to create a fair and equitable process for evaluating different proposals from students and from businesses. There should be a relatively long gap between proposal and pilot implementation so there can be a competitive open process. This structure allows them to be more nimble than the standard procurement process.
3. What is the process for coordination between various agencies and private companies in your city?
In the past, coordination was disorganized, and the City of Austin struggled to hire Jason. Agencies need to be able to have weight in discussions with multiple government and non-governmental groups in order to be effective, and the Smart Mobility program within the Department of Transportation has accomplished this. Jason’s role as the Assistant Director of Smart Mobility is to educate stakeholders and maintain good relationships. This provides the structure for making decisions quickly, and therefore allows the City to respond quickly to changing technologies.
4. How do your agency and others in the region fund transportation technology initiatives?
Two-thirds of the transportation budget comes from parking revenue. The remainder comes mostly from the Transportation General Fund. Each division in the City of Austin is its own enterprise with its own funding.

Appendix F. Denver Region and Peer City Assessments Attachment C. Peer City Interviews
February 2019 F-81
Peer City Interview: Boston, Massachusetts Project: Mobility Choice Blueprint Study
Subject: Interview with Kristopher Carter, City of Boston
Date: April 11, 2018 2:00PM-3:00PM
Location: Conference Call
Attendees: Kristopher Carter, City of Boston Eric Plapper, HDR
Rick Plenge, HDR
Arthur Bonney, HDR
Summary The Mayor’s Office of New Urban Mechanics is self-described as the City of Boston’s “Research and Development Lab.” Its goal is to improve quality of life for all Bostonians. One of their focus areas is their Streets Lab which includes a number of “Smart City” technologies such as AVs, smart parking, and IoT technology.
The Office of New Urban Mechanics released a “Boston Smart City Playbook” which details the way the city would like to interact with private companies that want to implement smart city technology within the City of Boston. The Playbook includes six “Plays” describing what types of proposals are helpful and what types are not. The Playbook ultimately serves as a values and vision document for Boston Smart City initiatives, requiring private proposals to first consider how their product improves quality of life for Bostonians.
Interview Notes 1. What programs, policies, or initiatives for integrating new transportation technologies are
currently in place within your city?
The Civic Innovation Project is a global thought leadership platform based in Boston and includes a learning lab theme of transportation and mobility. Microtransit, autonomous vehicles, and smart parking are all covered in this theme. There is a lot of ongoing collaboration with Boston area universities, including the Boston Area Research Initiative and individual researchers at universities. The City is currently reorganizing the Departments of Transportation and Public Works.
2. What is the process for coordination between various agencies and private companies in your city?
The Boston region does not have a strong county structure, so most governance happens at the City or State level. The Boston Region MPO is quasi-governmental. The City has a good relationship with the Massachusetts DOT and individual towns surrounding the City. There is a metropolitan mayor’s coalition comprised of mayors from the 16 largest cities near Boston. The mayors discuss topics such as economic development, transportation, and housing. Cross-departmental collaboration within the City tends to be ad hoc for planning and operations.

Appendix F. Denver Region and Peer City Assessments Attachment C. Peer City Interviews
February 2019 F-82
3. Which agencies are most supportive of transportation technology within your region? Is a particular agency leading the charge?
The Cities of Cambridge and Somerville are both very supportive of transportation technology deployment. Boston has also collaborated with the City of Brookline on a regional bikeshare.
4. How does your city collect, share, and use Big Data to improve transportation?
The City has an analytics team comprised of eight in-house analysts and 15 visiting analysts. The analytics team brings in data the City already has through existing offices and contracts and combines it with purchased datasets and data from private partners such as Waze. The City is close to finalizing a relationship with TNCs to better manage curb space. The City has a data sharing agreement with Uber, but the data is somewhat restricted and only provided on a small scale.
5. How long does it take for your region to deploy new transportation technologies?
It varies by project. The shortest timeline is approximately six months and includes projects that the City has full control over, such as an on-street carshare program. Longer timelines are necessary for projects that require more coordination, such as automated fare collections. The overhaul process is very involved, and the City needs to ensure that the platform is open enough and equitable.
6. What are the funding sources, costs, and return on investment for technology deployments?
The City budget provides most of the funding for technology deployments. Capital funding includes the Innovation Fund and outside grant funding, such as Bloomberg Mayor’s Challenge, has also been sought. The City does not have any cost agreements with universities.
7. Do you have any "lessons learned" or success stories from ongoing programs, policies, or initiatives related to new transportation technologies?
Project sequencing is very important. During deployment of the Massachusetts Avenue beacon, the City spent a lot of time studying one intersection and making design changes to that intersection prior to purchasing cameras. Instead, the cameras could have been purchased before redesigning the intersection. It is important to focus on what can be deployed at large scales.
8. Where do you consider your region in the technology adoption lifecycle?
The Boston region is open and collaborative, but purposefully skeptical. Boston is not the first City to pursue new technology, but is a fast follower. Boston places high value in partnerships and oversights, which require a little more time.
9. How would you rate your region’s technology readiness?
Compared to peer cities, Boston has more work to do regarding enabling infrastructure such as fiber. On the staffing side, Boston does a good job of determining which partnerships and technologies make sense for residents. University partnerships also strengthen the region’s technology readiness.

Appendix F. Denver Region and Peer City Assessments Attachment C. Peer City Interviews
February 2019 F-83
Peer City Interview: Columbus, Ohio Project: Mobility Choice Blueprint Study
Subject: Interview with Randy Bowman, City of Minneapolis
Date: April 12, 2018 9:00AM-10:00AM
Location: Conference Call
Attendees: Randy Bowman, City of Columbus (formerly) and HDR (currently) Allison Neuman, HDR Drew Parker, HDR
Summary The Smart Columbus Program Office is managed by the Chief Innovation Officer at the City of Columbus. Smart Columbus coordinates decision making and implementation with the applicable city department. The group includes representation from the Columbus Partnership, a non-profit organization including more than 65 CEOs from Columbus’s leading businesses and institutions.
Smart Columbus implements transportation technology initiatives primarily using the $40 million they won through the Smart Cities Challenge. An additional $10 million is provided by Vulcan, Inc. (a Paul Allen company). The City of Columbus supplements this $50 million with municipal bonds and state funds.
The City of Columbus recently hired a local IT firm to build their central transportation data hub, known as the Smart Columbus Operating System (SCOS).
Interview Notes 1. What programs, policies, or initiatives for integrating new transportation technologies are
currently in place within your city?
After winning the Smart Cities Challenge, the Smart Columbus Program Office was moved from the Department of Public Service to the Mayor’s Office and is run by the Chief Innovation Officer. Staff was brought in from the Department of Technology, Department of Public Service, and other departments within the City. These staff members may become permanent Smart Columbus Program Office employees if the program gets its own cost center after the grant is complete, though they are currently “on loan” from their home departments.
2. Where and how are decisions made about transportation technology within your agency?
The Smart Columbus Program Office hands off and/or coordinates decision-making with other City departments.
3. What is the process for coordination between various agencies and private companies in your city?
With respect to transportation technology, the Smart Columbus Program Office includes representation from the Columbus Partnership, a collaboration of the top 60 CEOs in central Ohio. Through this office, there lies the center of coordination for transportation technology.
Appendix F. Denver Region and Peer City Assessments Attachment C. Peer City Interviews
February 2019 F-84
There is a leadership committee within the Smart Columbus Program Office that includes representation from the City, County, Central Ohio Transit Authority, and Ohio State University. There is also an Executive Committee which includes representatives from other non-governmental organizations. There is a lot of coordination at the project-level between departments, funding partners, and other stakeholders.
4. How do your agency and others in the region fund transportation technology initiatives?
Transportation technology is funded through a combination of City capital funds (municipal bonds), Federal transportation funds through the local MPO, and State capital investment dollars. The Smart Cities Challenge application included $90 million in cash and in-kind donations from 17 private entities and partner agencies, including $23 million in cash from the City of Columbus, Franklin County, and Mid-Ohio Regional Planning Commission. When Randy left the City in December 2017, the value of partnerships was up to $500 million, largely in-kind donations from other agencies. For example, the Energy Authority committed to convert to smart metering and sustainable energy, valued at $300 million.
5. How does your city collect, share, and use Big Data to improve transportation?
The City of Columbus maintains a basic open data portal, primarily for GIS data. The MPO is collaborating with the City to create a regional data exchange. And the Smart Columbus Program Office is creating a large open data platform, now marketed as the Smart Columbus Operating System or SCOS.
6. Do you have any "lessons learned" or success stories from ongoing programs, policies, or initiatives related to new transportation technologies?
The City of Columbus won the USDOT Smart City Challenge in 2016, which will fund over $50 million in autonomous, connected, and electric vehicle demonstration projects and programs. The City created the Smart Columbus Program Office, which manages the grant funding. The City learned early on that resourcing the proper amount of staff to the program is key to success, and as a result of this learning, has added staff with expertise including procurement, contract management, and legal policy know-how.
7. How involved was Columbus in emerging technology before the Smart Cities Challenge?
Columbus was pretty welcoming to new ITS technology before the Smart Cities Challenge. The City was already linking 1,400 traffic signals with fiber optic and open architecture to connect the City and surrounding jurisdictions, which was a commitment of $80 million and included a new traffic management center. Columbus had always been a trailblazer with transportation technology, and winning the Smart Cities Challenge just cemented that reputation.

Appendix F. Denver Region and Peer City Assessments Attachment C. Peer City Interviews
February 2019 F-85
Peer City Interview: Minneapolis, Minnesota Project: Mobility Choice Blueprint Study
Subject: Interview with Jon Wertjes, City of Minneapolis
Date: April 12, 2018 9:00AM-10:00AM
Location: Conference Call
Attendees: Jon Wertjes, City of Minneapolis Allison Neuman, HDR Drew Parker, HDR
Summary Minneapolis was selected as a member of Transportation for America’s Smart Cities Collaborative in the first round of applications. The City has touted the collaboration, saying that no agency, city, or even state could tackle all the challenges and possibilities of emerging technology, and that the Smart Cities Collaborative allows member cities to “gather, collaborate, and divide and conquer.” At the state level, the Governor of Minnesota is in the process of establishing a task force including 15 members of public entities and private companies that would study and make recommendations for AV/CV and Smart City technology.
Interview Notes 1. What programs, policies, or initiatives for integrating new transportation technologies are
currently in place within your city?
Both the region and the City are updating their respective comprehensive transportation and land use plans. Both of these plans will consider transportation technology and should be completed by the end of 2018.
2. Where and how are decisions made about transportation technology within your agency?
The City currently has an ad-hoc model developed for decision-making regarding technology implementation. Typically an idea slowly filters its way up to the appropriate staff member, and then it reaches the transportation directorial group. The comprehensive plan update will likely change the decision-making process. There is also a 10-year strategic action plan underway that will provide more details about implementing transportation technology projects. Within the strategic plan, the City has been using the word “technologies” to refer to both a device in the field as well as autonomous vehicle technology. It does not identify the specific types of technology or where and when the technology will be implemented, but it sets a roadmap for how to accomplish it.
3. What is the process for coordination between various agencies and private companies in your city?
There are four layers of public agencies: state, region, county, and city. The City operates and maintains the surface street system regardless of jurisdiction. The freeway system is entirely run by the State. The transit system is all run by the regional transit agency. Representatives from each of these groups have continued dialogue beyond the Smart City application process. It is currently an informal staff working group and does not meet regularly, but the group is in the exploratory phase of future mobility.
Appendix F. Denver Region and Peer City Assessments Attachment C. Peer City Interviews
February 2019 F-86
There is another task force that was recently created by the Governor’s Office. Member selection is ongoing, but the goal is to have representatives from both the public and private sectors. The task force will study autonomous and connected vehicles and other smart city technologies. Coordination between private companies and government agencies is ad hoc, similar to decision-making processes. Companies can approach the City, and the City can approach companies. The Itasca Project is an employer-led civic alliance focused on building a thriving economy and improved quality of life. The Itasca Project has a working group where technology was identified as an initiative.
4. How do your agency and others in the region fund transportation technology initiatives?
Within the planning process, the City creates two project lists: one that is limited by the existing funding, and another that includes all desired projects should additional funding become available.
5. Do you have any "lessons learned" or success stories from ongoing programs, policies, or initiatives related to new transportation technologies?
Minneapolis is involved in the Smart Cities Collaborative work. There is no way that one agency, entity, or even state can tackle all the possibilities. It is better to gather, collaborate, and divide and conquer. Cities don’t all need to tackle the same issues and reinvent the wheel every time. The Smart Cities Collaborative started in October 2016, and Minneapolis has been involved since the beginning. The group meets in person quarterly and over the phone quarterly for a total of eight meetings per year. The three main topics are autonomous vehicles, Big Data, and smart mobility. Cities are generally assigned tasks within these topics to study and bring back lessons to the group. Year two saw some turnover in cities, but Minneapolis is staying involved.
6. Where are the technologies being deployed?
The biggest considerations include: who is interested? What is the source of the capital funding? Where is the private industry? Where do we want to balance the technology implantation with other regional goals such as equity or access? There is a lot of collaboration between St. Paul and Metro Transit, so St. Paul and transit corridors are prime locations for technology deployment.
7. How long do the technology deployments take to implement?
The City of Minneapolis is willing to test a lot of technology, but expects effort from the private sector as well. The City is not necessarily adopting a lot of technology right now, but is conducting pilot projects and exploring options. The procurement process is lengthy because the City is not beholden to any product or vendor. Pilot projects require a lot of administrative oversight. The change in the on-street parking meter system took multiple years to solicit and test before being implemented. Another example is dockless bikeshare; this will take six months to two years to pilot.
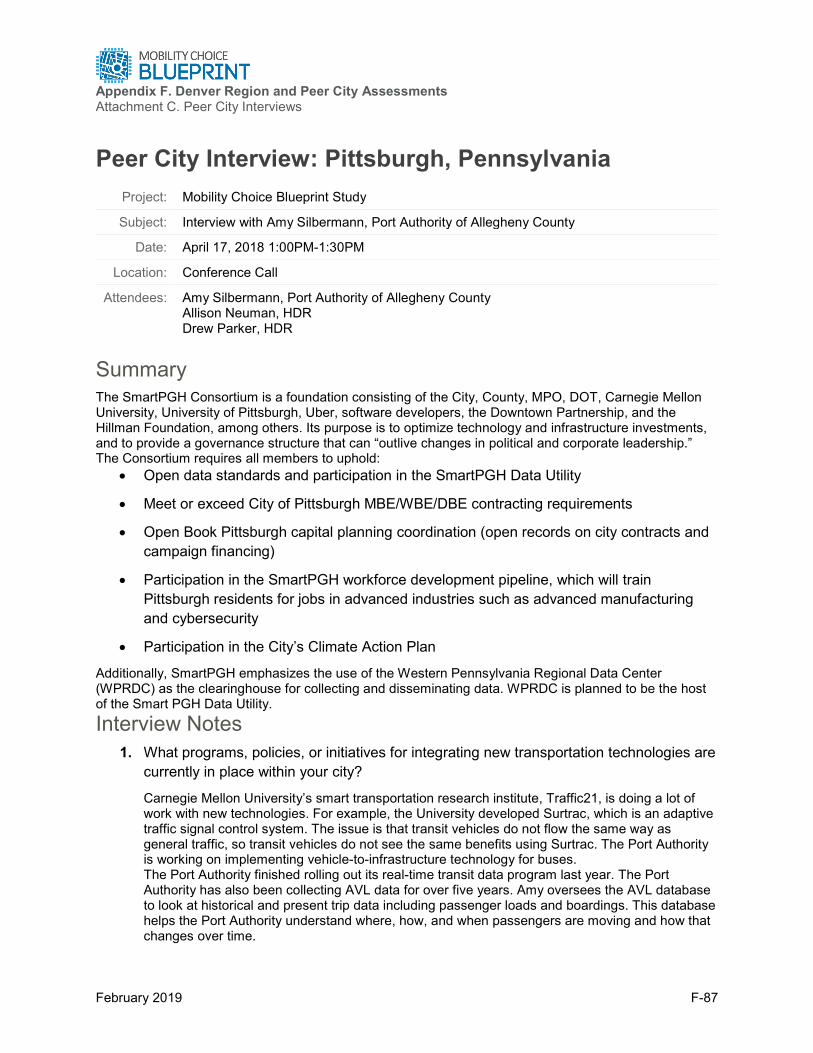
Appendix F. Denver Region and Peer City Assessments Attachment C. Peer City Interviews
February 2019 F-87
Peer City Interview: Pittsburgh, Pennsylvania Project: Mobility Choice Blueprint Study
Subject: Interview with Amy Silbermann, Port Authority of Allegheny County
Date: April 17, 2018 1:00PM-1:30PM
Location: Conference Call
Attendees: Amy Silbermann, Port Authority of Allegheny County Allison Neuman, HDR Drew Parker, HDR
Summary The SmartPGH Consortium is a foundation consisting of the City, County, MPO, DOT, Carnegie Mellon University, University of Pittsburgh, Uber, software developers, the Downtown Partnership, and the Hillman Foundation, among others. Its purpose is to optimize technology and infrastructure investments, and to provide a governance structure that can “outlive changes in political and corporate leadership.” The Consortium requires all members to uphold:
• Open data standards and participation in the SmartPGH Data Utility
• Meet or exceed City of Pittsburgh MBE/WBE/DBE contracting requirements
• Open Book Pittsburgh capital planning coordination (open records on city contracts and campaign financing)
• Participation in the SmartPGH workforce development pipeline, which will train Pittsburgh residents for jobs in advanced industries such as advanced manufacturing and cybersecurity
• Participation in the City’s Climate Action Plan
Additionally, SmartPGH emphasizes the use of the Western Pennsylvania Regional Data Center (WPRDC) as the clearinghouse for collecting and disseminating data. WPRDC is planned to be the host of the Smart PGH Data Utility. Interview Notes
1. What programs, policies, or initiatives for integrating new transportation technologies are currently in place within your city?
Carnegie Mellon University’s smart transportation research institute, Traffic21, is doing a lot of work with new technologies. For example, the University developed Surtrac, which is an adaptive traffic signal control system. The issue is that transit vehicles do not flow the same way as general traffic, so transit vehicles do not see the same benefits using Surtrac. The Port Authority is working on implementing vehicle-to-infrastructure technology for buses. The Port Authority finished rolling out its real-time transit data program last year. The Port Authority has also been collecting AVL data for over five years. Amy oversees the AVL database to look at historical and present trip data including passenger loads and boardings. This database helps the Port Authority understand where, how, and when passengers are moving and how that changes over time.

Appendix F. Denver Region and Peer City Assessments Attachment C. Peer City Interviews
February 2019 F-88
Multiple universities have access to the Port Authority’s AVL data, though no agencies have asked for access. It would be open to anyone that wants it. The Port Authority is working on pilot projects, but there is not a lot of program or policy-level work.
2. What is the process for coordination between various agencies and private companies in your city?
The Port Authority is a countywide transit agency, so the Board of Directors is appointed half by the County and half by the State. The Port Authority works very closely with Allegheny County Economic Development and local transportation departments within the region. Most of the Port Authority’s coordination is with the City of Pittsburgh because the City accounts for the majority of the Port Authority’s service area, and the City is rapidly changing.
3. How do your agency and others in the region fund transportation technology initiatives?
There is no local funding source for transit, so the bulk of the Port Authority’s funding comes from the State. In 2013, the State passed the Act 89 Transportation Plan, allocating an additional $2.3 billion into transportation projects by the fifth year of the plan. This was intended to ensure operating and capital budgets were sustainable for 5-10 years, though this seems unlikely given current budgets. The real-time program was funded through the Port Authority’s capital budget without any special grants. The Port Authority recently submitted a Small Starts grant application for a BRT project. The Urban Redevelopment Authority of Pittsburgh can create transit revitalization investment districts (TRIDs) to capture incremental tax revenue and use it for maintenance efforts around the TRID station. There is also an alcohol tax in Allegheny County that provides some funding to the Port Authority.
4. How does your city collect, share, and use Big Data to improve transportation?
The Port Authority hired a staff person to share data with the Western Pennsylvania Regional Data Center. Other agencies are able to pull transit data from this data portal. The Western Pennsylvania Regional Data Center provides a shared technological and legal infrastructure to support research, analysis, decision-making, and community engagement. It is managed by the University of Pittsburgh Center for Urban and Social Research, in partnership with Allegheny County and the City of Pittsburgh.
5. Do you have any "lessons learned" or success stories from ongoing programs, policies, or initiatives related to new transportation technologies?
Real-time arrival information has been a success story in that it has largely driven down on-time performance complaints without necessarily improving on-time performance.
Other Notes • Port Authority of Allegheny County hired its first Chief Technology Officer in April 2018.

Appendix F. Denver Region and Peer City Assessments Attachment C. Peer City Interviews
February 2019 F-89
Peer City Interview: Portland, Oregon Project: Mobility Choice Blueprint Study
Subject: Interview with Eliot Rose, Metro
Date: April 23, 2018 11:30AM-12:00PM
Location: Conference Call
Attendees: Eliot Rose, Metro Jason Longsdorf, HDR Allison Neuman, HDR Drew Parker, HDR
Summary The Portland mayor directed the Portland Bureau of Transportation (PBOT) to develop policies related to AVs, which was passed by Portland City Council in 2017. Through this effort, the Smart Autonomous Vehicles Initiative was created, and companies were invited to submit proposals for testing on Portland streets.
TriMet, Portland’s transit agency, passed a 0.1% increase in its payroll tax through a board vote. The increase will be incremental over a 10-year period and will fund new technology and equipment, as well as additional service.
Interview Notes 1. What programs, policies, or initiatives for integrating new transportation technologies are
currently in place within your city?
Metro is working on an emerging technology strategy as part of the update to the Regional Transportation Plan (RTP). The RTP carries more weight in the Portland metropolitan area than it does in other cities because all local transportation plans must be consistent with Metro’s RTP. The Portland mayor directed the Portland Bureau of Transportation (PBOT) to develop policies related to autonomous vehicle testing. City Council adopted these policies and passed the autonomous vehicle pilot initiative. As part of the new Smart Autonomous Vehicles Initiative (SAVI), PBOT issued a request for information for pilot projects spearheaded by technology companies, consulting firms, or any other interested parties. The City is still in the process of determining which projects to fund.
2. What is the process for coordination between various agencies and private companies in your city?
Metro oversees a working group regarding emerging technology. All of the counties and large cities within the Metro district are involved in the working group, along with Portland State University and the University of Oregon. The University of Oregon Urbanism Next project also has a working group that focuses on emerging technology research and policy. This working group is more selective than the one created by Metro, and tends to have more advanced conversations. The Technology Association of Oregon also has a working group comprised of business and public sector representatives. In terms of public and private sector collaboration, Greater Portland Inc. recently solicited challenges from public agencies and asked private companies to respond with potential solutions.

Appendix F. Denver Region and Peer City Assessments Attachment C. Peer City Interviews
February 2019 F-90
Metro submitted a challenge and is also working closely with Greater Portland Inc. to develop their grant program for emerging technology. At the statewide level, there is another autonomous vehicle working group with business and public sector representatives. Eliot said he would like to see community organizations become more involved in all of these working groups. When it comes to project-specific tasks, it is easier to work directly with the private sector, but at the policy level, such as the working groups, it is better to include as many people and organizations as possible.
3. How do your agency and others in the region fund transportation technology initiatives?
Hillsboro submitted for the Bloomberg Smart Cities Challenge and has a Smart City plan. Washington County has a long-term transportation study to model impacts of autonomous vehicles. Similarly, Metro is helping the City of Portland to model autonomous vehicles. Eliot was not sure of any dedicated funding source for emerging technology. Funding depends on the department within the City. Agencies and departments that oversee parking tend to have more pilot projects because they have a sustainable revenue stream from parking fees. Metro is attempting to identify funding to support pilot projects with local governments. Eliot noted Sacramento Area Council of Government’s TDM Innovations Grant as a source of inspiration.
4. How does your city collect, share, and use Big Data to improve transportation?
Metro already shares regional land use data, but does not have a portal for transportation data. Metro has realized it needs to take a more active role in compiling and sharing regional transportation data, and this has been identified within Metro’s RTP. Portland State University has an online portal that shares traffic and transit data. Metro is working with partners on major data purchases.
5. Do you have any "lessons learned" or success stories from ongoing programs, policies, or initiatives related to new transportation technologies?
There is high value to informal collaboration. Washington County and other agencies have been active in seeing how Portland’s Smart Autonomous Vehicles Initiative and policies related to TNCs play out. It is important to think about emerging transportation technologies at the regional level. Big companies want to play in big cities, but transportation technology impacts both city dwellers and suburbanites since many trips start or end in the suburbs. For example, Uber ridership is growing in Washington County at a rate of 6-7 times that of Portland. The Transit Signal Priority Program is another example of regional collaboration. It is largely a City of Portland program, but Metro is providing some funding to support regional ITS projects. Metro wants to take a more regional and system-wide approach as opposed to implementing projects one corridor at a time.
6. What are the barriers to deploying transportation technology in the Portland region?
The largest challenge is inter-jurisdictional coordination. For example, there are corridors in Washington County where the ownership bounces from the County to Beaverton every few blocks. This gerrymandering makes it difficult to coordinate and provide consistency. Another challenge is the difference between third-party systems and agency-led technology. Third parties tend to have a larger impact on the general public (think of the difference between Uber implementation and traffic signal priority), so agencies need to have better and more consistent policies surrounding technology and private companies.
Other Notes • Metro created the Technology Strategist position 8 months ago. Eliot is the first person
to hold the position within Metro.

Appendix F. Denver Region and Peer City Assessments Attachment C. Peer City Interviews
February 2019 F-91

Appendix F. Denver Region and Peer City Assessments Attachment C. Peer City Interviews
February 2019 F-92
Peer City Interview: San Francisco, California Project: Mobility Choice Blueprint Study
Subject: Interview with Darton Ito, San Francisco Municipal Transportation Authority
Date: April 26, 2018 3:00PM-4:00PM
Location: Conference Call
Attendees: Darton Ito, San Francisco Metropolitan Transportation Authority Eric Plapper, HDR
Summary ConnectSF is the primary initiative addressing planning for the future of mobility in San Francisco. The initiative is a collaborative effort including the San Francisco Planning Department, the San Francisco Municipal Transportation Agency (SFMTA), the San Francisco County Transportation Authority (SFCTA), and the San Francisco Office of Economic and Workforce Development (OEWD). ConnectSF has set an overarching vision for implementing the Subway Vision, San Francisco Transportation Plan 2050, Transit Corridors Study, Streets and Freeways Study, and Transportation Element Update.
Interview Notes 1. What programs, policies, or initiatives for integrating new transportation technologies are
currently in place within your city?
For the past two years, SFMTA, SFCTA, and the San Francisco Planning Department have been developing a 50-year transportation vision called ConnectSF. The planning process includes coordinating on grant proposals, planning efforts, and alternatives analyses; each partner comes to the table with a different perspective. ConnectSF uses a scenario-based planning approach with lots of community input. The plan has a city, rather than regional, focus. The Metropolitan Transportation Commission, the Bay Area’s nine-county MPO, recently completed its own long-range transportation plan. The regional plan adopted a grassroots approach and included discussions about integrating new technologies.
2. What is the process for coordination between various agencies and private companies in your city?
A group of cities in the region coordinates on a monthly call. This was originally created based on the cities’ need to coordinate with the legislature for topics such as policies related to autonomous vehicles. This call also provides a forum for cities to understand how other cities are responding to private service providers in terms of permitting, pricing, and fees. There are other formal and informal networks to allow cities to learn from one another. San Francisco is unique in that it has one agency for all ground transportation. SFMTA oversees transit, roadways, bicycles, pedestrians, taxis, and parking, among other transportation elements. SFMTA has a Director of Transportation, overseeing the entire agency, allowing better coordination across the multiple SFMTA divisions and units. San Francisco also has an emerging technologies working group to discuss how the City as a whole can respond to new technologies. The group is comprised mostly of representatives from various City agencies and focuses largely on transportation.

Appendix F. Denver Region and Peer City Assessments Attachment C. Peer City Interviews
February 2019 F-93
Finally, there is required coordination between the multiple agencies that operate streets within San Francisco, such as SFMTA, the Recreation and Parks Department within city parks, and the Federal government within national recreation areas.
3. Which agencies are most supportive of transportation technology within your region? Is a particular agency leading the charge?
SFMTA is doing considerable work related to emerging technologies. SFMTA is creating permitting programs and local regulations for programs such as bikeshare, carshare, private microtransit, electric scooter boards, and an autonomous shuttle service.
4. How does your city collect, share, and use Big Data to improve transportation?
The City contracts with one consultant team to manage data sharing for all departments within an online data portal called DataSF. The data collection process is done independently in each department, so this creates challenges; data sources cannot be combined where there are gaps or differences in the data collection processes. The City is trying to be smarter about purchasing data and is looking into purchasing citywide licenses through their data sources as opposed to purchasing an individual license for each department. The City is also looking into tying together different datasets that are used collectively to manage individual programs. For example, the City is currently developing a curb management strategy to identify the best approach for monetizing curb space. This process requires many different datasets: construction zones, on-street parking, bicycle lanes, etc. TNCs are not sharing their data with the City, and that is a huge missed opportunity. The City is trying to build data sharing requirements into the autonomous vehicle permitting process to avoid the same mistake and encourage the private sector to share data.
5. What are the transportation technologies being deployed in your region?
There is a strong focus on electric vehicle charging infrastructure (mostly Level 2). This effort includes a working group and an electrification strategy. The City has expressed concerns that technology will increase demand, but is still hoping to develop additional pilot programs. Additionally, San Francisco was a recipient of the 2016 Advanced Transportation and Congestion Management Technology Deployment grant. This deployment will focus on intersection safety and accessibility for pedestrians and bicyclists by deploying smart connected traffic signals, dynamic pickup curbs, and a regional carpool lane system.
6. What are the funding sources, costs, and return on investment for technology deployments?
There are ongoing discussions at all levels of government about the changing funding landscape. Traditionally, transportation projects have been funded by state and Federal gas tax revenues, but with the rise of fuel-efficient and electric vehicles, this revenue source is depleting over time. The City receives some transportation revenue from parking meters and traffic fines, both of which could decrease with the rise of autonomous vehicles. The City also receives funding from local sales tax revenue and a sliver of funding from the State. The City’s current focus is how to future-proof for 25-year investments. The City is currently incorporating technology components into traditional projects such as corridor improvements instead of pursuing stand-alone technology projects.
7. Do you have any "lessons learned" or success stories from ongoing programs, policies, or initiatives related to new transportation technologies?
When developing pilot programs and preliminary technology concepts, it is important to go back to the basic planning principals, such as determining answers to the following questions: a. What is the problem?

Appendix F. Denver Region and Peer City Assessments Attachment C. Peer City Interviews
February 2019 F-94
b. How do you measure it?
c. How do you structure the data collection process to evaluate the problem and the solution?
8. How would you rate your region’s technology readiness?
San Francisco is set up to adopt certain aspects of technology in isolation, but the region needs standard approaches and a more streamlined process for technology adoption.
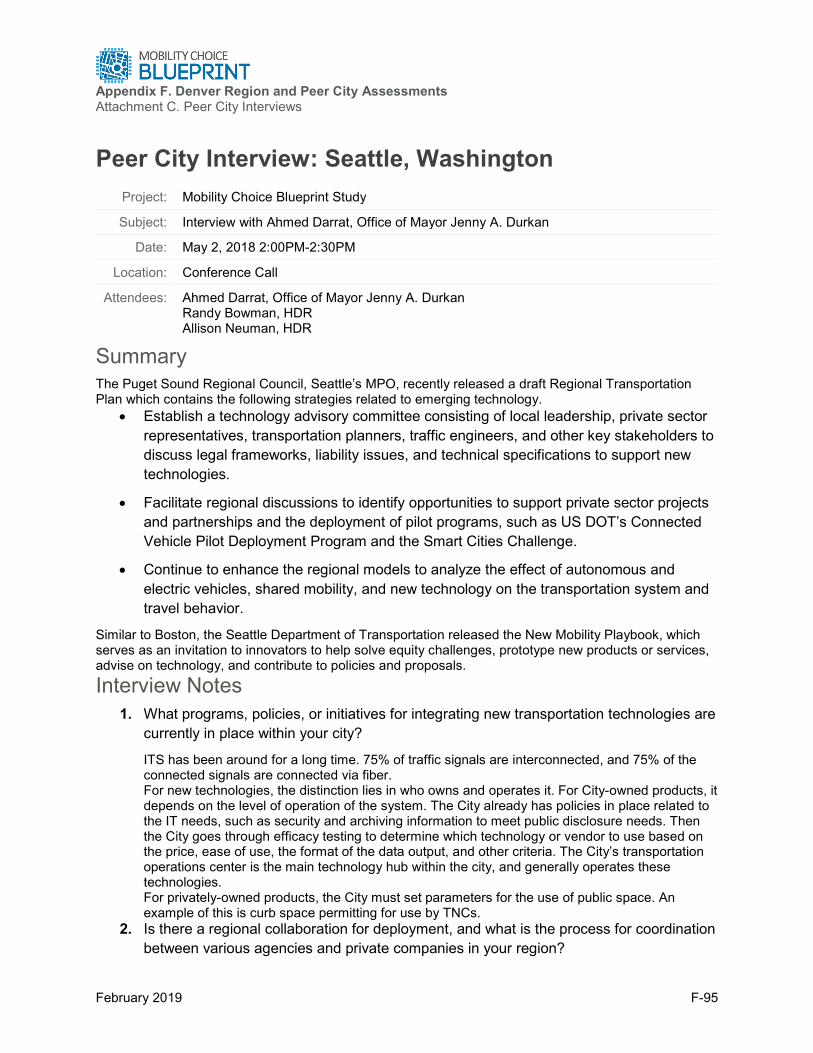
Appendix F. Denver Region and Peer City Assessments Attachment C. Peer City Interviews
February 2019 F-95
Peer City Interview: Seattle, Washington Project: Mobility Choice Blueprint Study
Subject: Interview with Ahmed Darrat, Office of Mayor Jenny A. Durkan
Date: May 2, 2018 2:00PM-2:30PM
Location: Conference Call
Attendees: Ahmed Darrat, Office of Mayor Jenny A. Durkan Randy Bowman, HDR Allison Neuman, HDR
Summary The Puget Sound Regional Council, Seattle’s MPO, recently released a draft Regional Transportation Plan which contains the following strategies related to emerging technology.
• Establish a technology advisory committee consisting of local leadership, private sector representatives, transportation planners, traffic engineers, and other key stakeholders to discuss legal frameworks, liability issues, and technical specifications to support new technologies.
• Facilitate regional discussions to identify opportunities to support private sector projects and partnerships and the deployment of pilot programs, such as US DOT’s Connected Vehicle Pilot Deployment Program and the Smart Cities Challenge.
• Continue to enhance the regional models to analyze the effect of autonomous and electric vehicles, shared mobility, and new technology on the transportation system and travel behavior.
Similar to Boston, the Seattle Department of Transportation released the New Mobility Playbook, which serves as an invitation to innovators to help solve equity challenges, prototype new products or services, advise on technology, and contribute to policies and proposals.
Interview Notes 1. What programs, policies, or initiatives for integrating new transportation technologies are
currently in place within your city?
ITS has been around for a long time. 75% of traffic signals are interconnected, and 75% of the connected signals are connected via fiber. For new technologies, the distinction lies in who owns and operates it. For City-owned products, it depends on the level of operation of the system. The City already has policies in place related to the IT needs, such as security and archiving information to meet public disclosure needs. Then the City goes through efficacy testing to determine which technology or vendor to use based on the price, ease of use, the format of the data output, and other criteria. The City’s transportation operations center is the main technology hub within the city, and generally operates these technologies. For privately-owned products, the City must set parameters for the use of public space. An example of this is curb space permitting for use by TNCs.
2. Is there a regional collaboration for deployment, and what is the process for coordination between various agencies and private companies in your region?
Appendix F. Denver Region and Peer City Assessments Attachment C. Peer City Interviews
February 2019 F-96
The City does not have a particular process for coordination, but knows and works with all the peers across the region. It is more ad hoc than a formalized coordination process. The City has a good relationship with the Washington State Department of Transportation in particular.
3. Who are the transportation technology leading agencies in your region, and which agency is leading adoption in your region?
The Mayor’s Office is leading all aspects of transportation technology. 4. How does your city collect, share, fund, and use Big Data to improve transportation?
The City is currently trying to find better ways to share data among agencies and with the public. The City is also considering how to access data from private companies and aggregate it with existing data. Privacy issues are another concern. The City is working with the University of Washington on a trusted data collaborative where the University would house data.
5. Where are the transportation technologies being deployed in your region, what is their status, and how long do the technologies take to implement? Has your region considered and decided against deployment of certain transportation technologies?
Transportation technologies are being deployed everywhere across the region. The location depends on the type of technology and various needs. The implementation schedule also depends on the technology and who is managing the project. The City can start pilot projects very quickly. If a vendor is managing a cloud-based project and does not have hard infrastructure requirements, the project is more nimble and can get started quickly. Some technologies need to be implemented citywide and require money, effort, and upfront planning before they can be implemented. Timing generally depends on the impact the City is trying to achieve. The City has decided against a variety of technologies, mostly due to funding availability. There are so many good technologies available, but only the top priorities can be funded.
6. What is the funding source, cost, and return on investment for technology deployment?
If a private company is completing the project, the City tries to recover all costs associated with the project. If the project is public, a lot of funding comes from the operations budget. Technology is mostly improving upon processes or needs that already exist, so the budget from the original operations is transferred to the new technology. Capital budgets also provide funding for technology deployment.
7. Do you have any "lessons learned" or success stories from ongoing programs, policies, or initiatives related to new transportation technologies?
The City operated a bikeshare program, but had to stop operations due to political and financial pressures. The City looked to private companies to fill that gap and issued permits for a new privately-operated bikeshare. The City was able to achieve most of its high-level policy outcomes through this process, but it is still not a perfect system and is still considered a pilot program. The City is assessing how this process can be applied to TNC regulations. The City wants to build in predictability so things have the ability to scale in a way that is mutually beneficial to private industry and the public good.
8. Where do you consider your region in the technology adoption lifecycle?
The Seattle region leans toward the front end of the technology adoption lifecycle – Innovators. 9. How would you rate your region’s technology readiness?
Public Acceptance: 10 – Not only is there acceptance, but there is pressure from the public to pursue new technologies. This drives up the score of leadership, policy, and funding.

Appendix F. Denver Region and Peer City Assessments Attachment C. Peer City Interviews
February 2019 F-97
Foundational Elements: 9 or 10 Policies: 10 Funding: 9 or 10 Partnerships: 8 or 9 Leadership: 9 or 10 X-Factor: 9 or 10