Embed Size (px)
Citation preview
Mobile Phones Market In India 2011
MIB, Department of Commerce, Delhi School of Economics P a g e | 1
Mobile Phones Market In India
A Economics Study Report
Submitted in Partial Fulfilment of the Requirements
For the Degree of
Master of International Business
Submitted to:
Dr. Sumati Varma
Dept. of Commerce
Delhi School of Economics
Delhi University
Submitted by :
Tapas Tiwari
Tsetan Angmo
Varun Kaw
Rahul Shah
Vaibhav Gupta
Vikram Singh

Mobile Phones Market In India 2011
MIB, Department of Commerce, Delhi School of Economics P a g e | 2
CONTENTS
INTRODUCTION ............................................................................................................................................... 4
MOBILE HANDSETS V/S FDI .............................................................................................................................. 5
MOBILE TELE-DENSITY ..................................................................................................................................... 6
RATE OF GROWTH OF MOBILE-DENSITY ........................................................................................................................ 7
PRODUCTION AND EXPORTS............................................................................................................................ 8
DRIVERS AND TRENDS ..................................................................................................................................... 9
DRIVERS ................................................................................................................................................................ 9
POLICY AND INITIATIVES ............................................................................................................................................ 9
PRODUCT SEGMENTATION AND DIFFERENT TIERS OF MOBILE PHONES ........................................................ 13
DIFFERENT TIERS OF MOBILE PHONE ........................................................................................................................ 13
MAJOR HANDSET MAKER COMPANIES IN INDIA .......................................................................................................... 13
TAPPING A GLOBAL OPPORTUNITY AND BRIDGING THE MOBILE GENDER GAP ...................................................................... 14
CASE STUDY: MERA MOBILE, MERA SAATHI .............................................................................................................. 14
Spreading the message ................................................................................................................................ 14
Benefits ........................................................................................................................................................ 14
Building a more sustainable future .............................................................................................................. 15
SURVEY RESULTS: .................................................................................................................................................. 16
More Findings of the survey: ........................................................................................................................ 16
SPECTRUM POLICY ......................................................................................................................................... 17
OVERALL INVESTING ENVIRONMENT ............................................................................................................. 18
RELIGION AND MOBILE PHONE (HOW THEY MAKE MONEY ?) ....................................................................... 20
MOBILE PHONES AND ECONOMICS GROWTH ................................................................................................ 20
CASE 1: CATCH THE FISH ....................................................................................................................................... 20
Calls and effect ............................................................................................................................................. 21
CASE 2 : SMARTPHONE APPS FUEL BUSINESS.............................................................................................................. 22
Attract new customers ................................................................................................................................. 22
Improve customer service ............................................................................................................................ 23
Create a revenue opportunity ...................................................................................................................... 23
CASE 3: MOBILES FOR FIGHTING POVERTY .................................................................................................................. 23
MOBILE MARKET: BEHAVIOURAL ECONOMICS PERSPECTIVE ......................................................................... 25
WHAT IS THE BEHAVIOURAL ECONOMICS “REVOLUTION”? ........................................................................................... 25
BEHAVIOURAL ECONOMICS AND EXPLORATION ........................................................................................................... 25
Choice overload ............................................................................................................................................ 25
Heuristics ...................................................................................................................................................... 25
Endowment .................................................................................................................................................. 25
Defaults ........................................................................................................................................................ 25
Mobile Phones Market In India 2011
MIB, Department of Commerce, Delhi School of Economics P a g e | 3
Hyperbolic discounting ................................................................................................................................. 25
Framing biases ............................................................................................................................................. 25
Risk/Loss aversion ........................................................................................................................................ 25
BEHAVIOURAL ECONOMICS AND BEHAVIOURAL ‘BIAS’ ................................................................................................... 25
BEHAVIOURAL ECONOMICS AND CONSUMERS ............................................................................................................. 26
Anchoring Effect ........................................................................................................................................... 26
Too Much Choice or Choice overload ........................................................................................................... 27
Heuristics ...................................................................................................................................................... 27
Endowment .................................................................................................................................................. 27
Defaults ........................................................................................................................................................ 28
Hyperbolic discounting ................................................................................................................................. 28
Framing biases ............................................................................................................................................. 28
Risk/Loss aversion ........................................................................................................................................ 29
APPENDIX A: PRIMARY SURVEY QUESTIONS .................................................................................................. 30
APPENDIX B: BEHAVIORAL ECONOMICS SURVEY QUESTIONS ....................................................................... 31
APPENDIX C: FEEDBACK ABOUT PRESENTATION ............................................................................................ 32
BIBLIOGRAPHY ............................................................................................................................................... 35
TABLE OF FIGURES
FIGURE 1: FDI IN MOBILE PHONE ................................................................................................................................... 5
FIGURE 2: MOBILE TELE DENSITY ................................................................................................................................... 6
FIGURE 3: PRODUCTION AND EXPORTS OF MOBILE PHONES IN INDIA .................................................................................... 8
FIGURE 4: DISCARDING THE PHONE............................................................................................................................... 16
FIGURE 5: CONSUMER DECISION MAKING ...................................................................................................................... 27
FIGURE 6 : HYPERBOLIC DISCOUNTING........................................................................................................................... 28
FIGURE 7: NORMATIVE POLICY MODEL .......................................................................................................................... 29

Mobile Phones Market In India 2011
MIB, Department of Commerce, Delhi School of Economics P a g e | 4
INTRODUCTION
―A lot of people think that the new economy is all about the internet. I think that it's being fuelled by the
internet - as well as by cell phones, digital assistants, and the like - but that it's really about
customers. ‖
– Patricia Seybold
Today mobile phones have moved beyond their primary role of voice communications and have
graduated to become an essential entertaining device for mobile users. We are in an era where users
buy mobile phones not just to be in touch, today‘s youth use it to express their thoughts, for social
networking, to show their interests, play games, read news, surf on the internet, listen to music, chat
instantly with friends & families and even check their bank balances. There are various phone
manufacturers providing handsets.
The Indian mobile industry is the fastest growing in the world and India continues to add more mobile
connections every month than any other country in the world. The telecom boom in the country
provides great opportunity to handset manufacturers and the hottest segment for these manufacturers
is the entry level segment. Among the fastest growing sectors in the country, telecom has been
zooming up the growth curve at a fiery pace. The last few years saw India adding many firsts to its list
of achievements. Some of these are-the world's lowest call rates (1 paisa/sec), fastest growth in the
number of subscribers (15-20 million per month), fastest sale of a million mobile phones (1 week), the
world's cheapest mobile handset (`777), and the world's most affordable 3G phone (`4,999).
The market in India is dominated by mobile. For mobile we have 840 million-plus users, unlike many
other markets, mobile is becoming the dominant device for voice, for value-added services, and
increasingly for mobile Internet also. It‘s somewhat similar to what we saw in Japan in 1999 where,
because of the limitation of broadband and computing. There‘s a whole host of services being created
around mobile. An effective management of mobile services requires an understanding of the factors
that underlie the evolution of the market. Factors such as market potential and timing and speed of
adoption are of great importance for telecom operators for capacity planning. Understanding the
evolution of mobile phone market and its likely future trend is equally important for policy makers.
India is currently facing the onslaught of cheap sub-standard Chinese phones, which occupy as much
as 25 per cent of the market, thanks to the liberal import policies of India. The boost to exports to
mobile phones and their parts will encourage local manufacturing, which is the best answer to
compete with the cheap sub-standard Chinese phones imports. Mobile phone exports from India
could double as a result of Commerce Ministry granting 2 per cent Focus Product Scheme (FPS) on
mobile phone exports in the Foreign Trade President of Indian Cellular Association said that the
special incentive accorded to mobile phone exports could result in the doubling of exports in the next
3-5 years from the annual level of `13,000 crore to `14,000 crore if other enabling policies are put in
place. India is already a base for worldwide quality manufacturing of mobile phones.
Mobile Phones Market In India 2011
MIB, Department of Commerce, Delhi School of Economics P a g e | 5
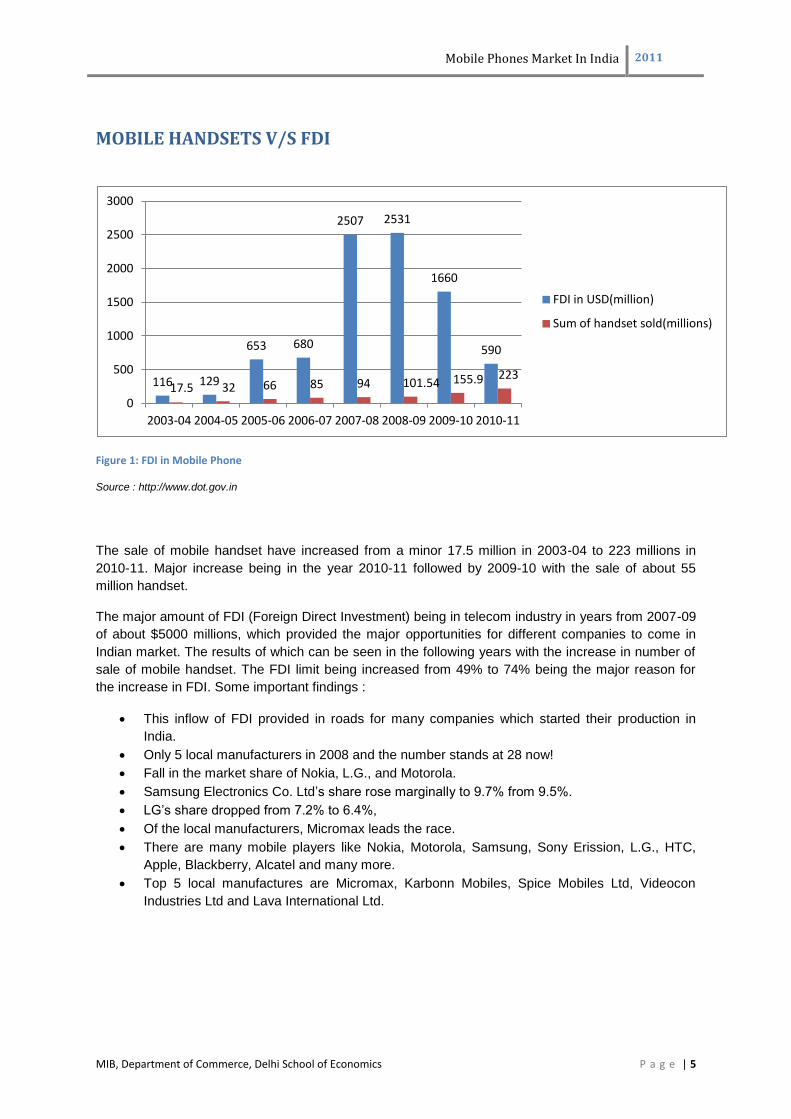
MOBILE HANDSETS V/S FDI
Figure 1: FDI in Mobile Phone
Source : http://www.dot.gov.in
The sale of mobile handset have increased from a minor 17.5 million in 2003-04 to 223 millions in
2010-11. Major increase being in the year 2010-11 followed by 2009-10 with the sale of about 55
million handset.
The major amount of FDI (Foreign Direct Investment) being in telecom industry in years from 2007-09
of about $5000 millions, which provided the major opportunities for different companies to come in
Indian market. The results of which can be seen in the following years with the increase in number of
sale of mobile handset. The FDI limit being increased from 49% to 74% being the major reason for
the increase in FDI. Some important findings :
This inflow of FDI provided in roads for many companies which started their production in
India.
Only 5 local manufacturers in 2008 and the number stands at 28 now!
Fall in the market share of Nokia, L.G., and Motorola.
Samsung Electronics Co. Ltd‘s share rose marginally to 9.7% from 9.5%.
LG‘s share dropped from 7.2% to 6.4%,
Of the local manufacturers, Micromax leads the race.
There are many mobile players like Nokia, Motorola, Samsung, Sony Erission, L.G., HTC,
Apple, Blackberry, Alcatel and many more.
Top 5 local manufactures are Micromax, Karbonn Mobiles, Spice Mobiles Ltd, Videocon
Industries Ltd and Lava International Ltd.
116 129
653 680
2507 2531
1660
590
17.5 32 66 85 94 101.54 155.9 223
0
500
1000
1500
2000
2500
3000
2003-04 2004-05 2005-06 2006-07 2007-08 2008-09 2009-10 2010-11
FDI in USD(million)
Sum of handset sold(millions)
Mobile Phones Market In India 2011
MIB, Department of Commerce, Delhi School of Economics P a g e | 6
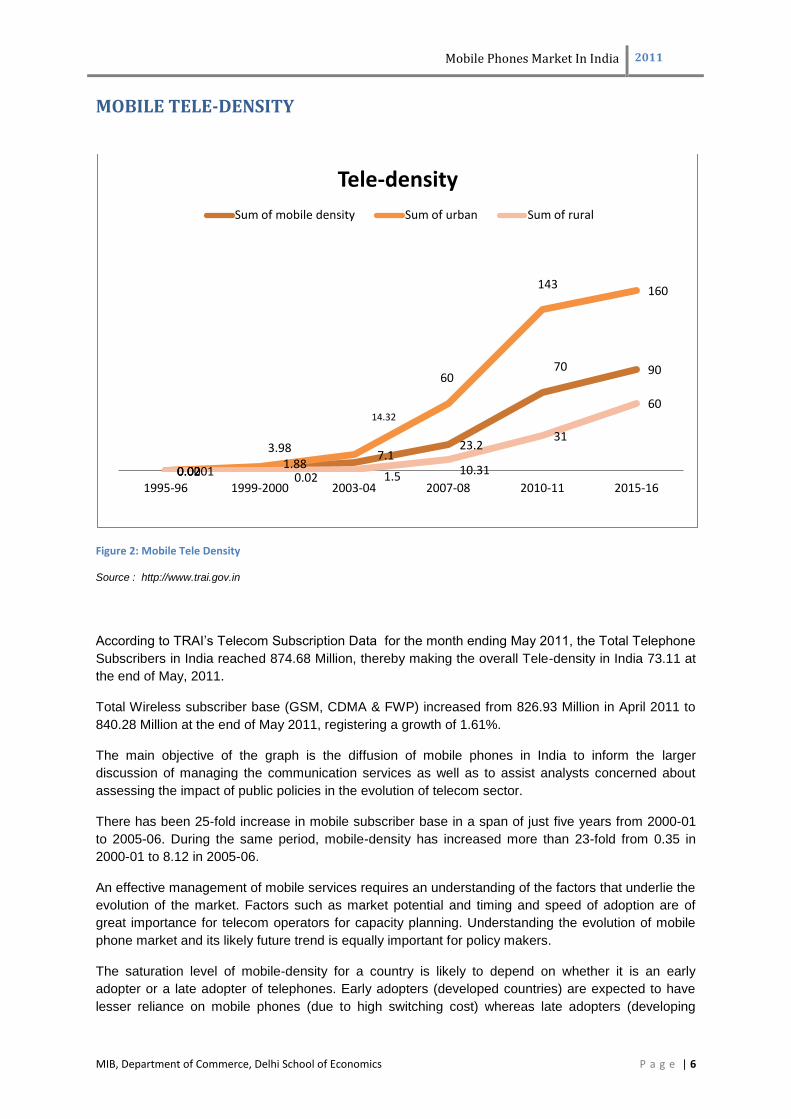
MOBILE TELE-DENSITY
Figure 2: Mobile Tele Density
Source : http://www.trai.gov.in
According to TRAI‘s Telecom Subscription Data for the month ending May 2011, the Total Telephone
Subscribers in India reached 874.68 Million, thereby making the overall Tele-density in India 73.11 at
the end of May, 2011.
Total Wireless subscriber base (GSM, CDMA & FWP) increased from 826.93 Million in April 2011 to
840.28 Million at the end of May 2011, registering a growth of 1.61%.
The main objective of the graph is the diffusion of mobile phones in India to inform the larger
discussion of managing the communication services as well as to assist analysts concerned about
assessing the impact of public policies in the evolution of telecom sector.
There has been 25-fold increase in mobile subscriber base in a span of just five years from 2000-01
to 2005-06. During the same period, mobile-density has increased more than 23-fold from 0.35 in
2000-01 to 8.12 in 2005-06.
An effective management of mobile services requires an understanding of the factors that underlie the
evolution of the market. Factors such as market potential and timing and speed of adoption are of
great importance for telecom operators for capacity planning. Understanding the evolution of mobile
phone market and its likely future trend is equally important for policy makers.
The saturation level of mobile-density for a country is likely to depend on whether it is an early
adopter or a late adopter of telephones. Early adopters (developed countries) are expected to have
lesser reliance on mobile phones (due to high switching cost) whereas late adopters (developing
0.02 1.88
7.1 23.2
70 90
0.02
3.98
14.32
60
143 160
0.0001 0.02 1.5 10.31
31
60
1995-96 1999-2000 2003-04 2007-08 2010-11 2015-16
Tele-density
Sum of mobile density Sum of urban Sum of rural
Mobile Phones Market In India 2011
MIB, Department of Commerce, Delhi School of Economics P a g e | 7
countries) are expected to have lesser reliance on main line telephones (due to high infrastructure
cost).
Rate of growth of mobile-density The analysis reveals that the inflection point (the maximum growth rate point) of the curve will occur
between 2011-12 and 2012-13 (when mobile-density is around 70). During the year 2015-16, there
will be 90 mobile phones for 100 people in the country. Analysis show that the numbers of mobile
phones will exceed the number of people in the country by 2019-20
In this study, the growth of the mobile phone and mobile-density in India has been analyzed using S-
shaped growth curve models. The analysis shows that the high growth phase of the diffusion of
mobile phones will continue till 2015-16. It is estimated that there will be 90 mobile phones per 100
inhabitants in India at the end of year 2015-16. The number of mobile phones will exceed the number
of people in the country by 2019-20. Total mobile phone demand is projected to increase from 800
million in 2010-11 to 1 billion by 2012-13. Growth which is not expected to slow down anytime soon is
now moving to the rural areas.
Mobile Phones Market In India 2011
MIB, Department of Commerce, Delhi School of Economics P a g e | 8
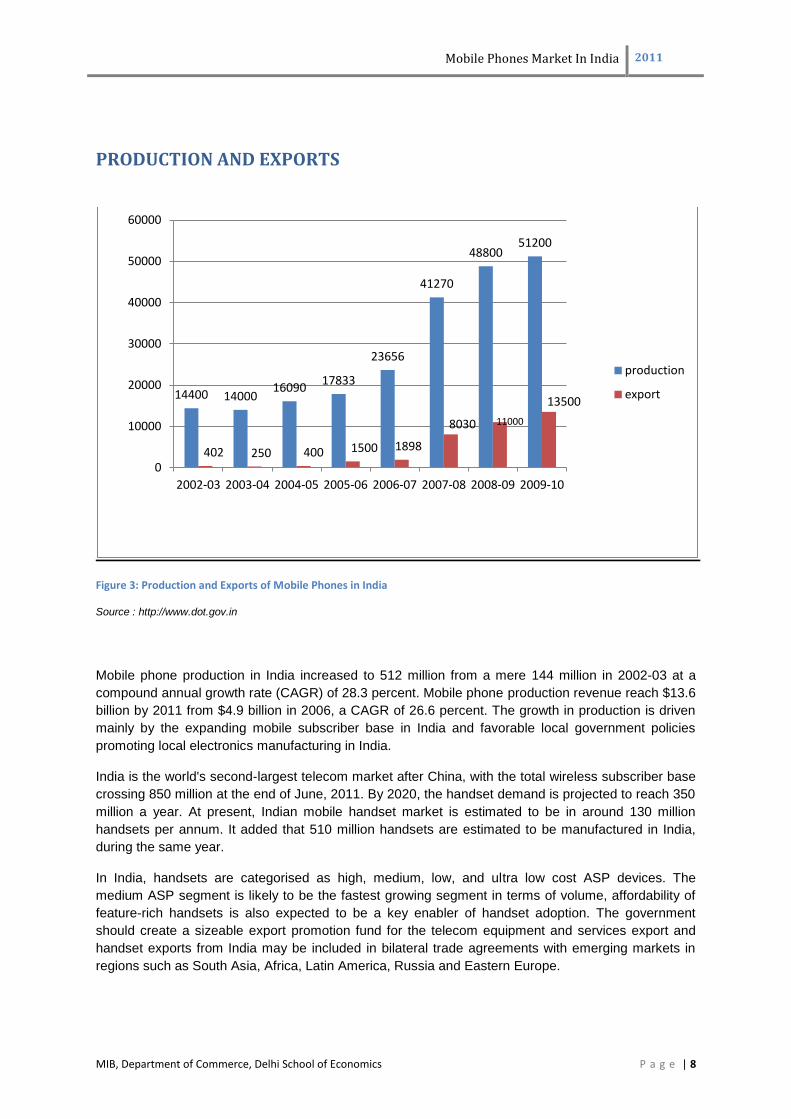
PRODUCTION AND EXPORTS
Figure 3: Production and Exports of Mobile Phones in India
Source : http://www.dot.gov.in
Mobile phone production in India increased to 512 million from a mere 144 million in 2002-03 at a
compound annual growth rate (CAGR) of 28.3 percent. Mobile phone production revenue reach $13.6
billion by 2011 from $4.9 billion in 2006, a CAGR of 26.6 percent. The growth in production is driven
mainly by the expanding mobile subscriber base in India and favorable local government policies
promoting local electronics manufacturing in India.
India is the world's second-largest telecom market after China, with the total wireless subscriber base
crossing 850 million at the end of June, 2011. By 2020, the handset demand is projected to reach 350
million a year. At present, Indian mobile handset market is estimated to be in around 130 million
handsets per annum. It added that 510 million handsets are estimated to be manufactured in India,
during the same year.
In India, handsets are categorised as high, medium, low, and ultra low cost ASP devices. The
medium ASP segment is likely to be the fastest growing segment in terms of volume, affordability of
feature-rich handsets is also expected to be a key enabler of handset adoption. The government
should create a sizeable export promotion fund for the telecom equipment and services export and
handset exports from India may be included in bilateral trade agreements with emerging markets in
regions such as South Asia, Africa, Latin America, Russia and Eastern Europe.
14400 14000 16090
17833
23656
41270
48800 51200
402 250 400 1500 1898
8030 11000
13500
0
10000
20000
30000
40000
50000
60000
2002-03 2003-04 2004-05 2005-06 2006-07 2007-08 2008-09 2009-10
production
export
Mobile Phones Market In India 2011
MIB, Department of Commerce, Delhi School of Economics P a g e | 9
DRIVERS AND TRENDS
Drivers The mobile phone phenomenon is unique in the histories of both the telecommunication and
consumer electronics markets. In less than a decade, people have adopted mobile phones on a
massive scale. This is about three times the size of the television or PC markets. Growth has been
fuelled by the spectacular evolution of mobile phone technologies, both in terms of performance and
miniaturization. As a result, unlike many other appliances, users change their mobile phones on
average every two years. Consequently, replacement handsets today represent about 80% of all
mobile phone purchase.
This rapid growth has been possible due to various proactive and positive decisions of the
Government and contribution of both by the public and the private sector. The rapid strides in the
telecom sector have been facilitated by liberal policies of the Government that provide easy market
access for telecom equipment and a fair regulatory framework for offering telecom services to the
Indian consumers at affordable prices.
Policy and Initiatives
1.Regulatory Framework: The Telecom Regulatory Authority of India (TRAI) was set up in March
1997 as a regulator for Telecom sector. The TRAI‘s functions are recommendatory, regulatory and
tariff setting in telecom sector. Telecom Disputes Settlement and Appellate Tribunal (TDSAT) came
into existence in May, 2000. TDSAT has been empowered to adjudicate any dispute –
• Between a licensor and a licensee
• Between two or more service providers
• Between a service provider and a group of consumers
• hear and dispose of appeal against any direction, decision or order of TRAI
Tariffs for telecommunication services have evolved from a regime where tariffs were determined by
Telecom Regulatory Authority of India to a regime where tariffs are largely under forbearance. TRAI
intervenes by regulating the tariffs for only those services, the markets of which are not competitive.
Universal Service Obligation Fund (USOF) exclusively for meeting the Universal Service Obligation
was established in April, 2002. The Universal Service Levy is presently 5 per cent of the Adjusted
Gross Revenue (AGR) of all telecom service providers except the pure value added service providers
like Internet, Voice Mail, E-Mail service providers etc. Indian Telegraph Act has been amended in
October‘2006 to provide support for all telegraph services including mobile and broadband to bridge
the digital divide.
With the introduction of the Unified Access Licensing Regime, operators can offer telecom access
services to consumers in a technology neutral manner, subject to fulfilling certain conditions.
Introduction of this regime has also broken the legal/regulatory impasse between the cellular and
basic service providers. Issuance of Intra-Circle Merger and Acquisition. Guidelines provide investors
an opportunity to take stakes in existing telecom operations.
2.Government Initiatives : The Government has taken the following main initiatives for the growth of
the Telecom Sector;
Mobile Phones Market In India 2011
MIB, Department of Commerce, Delhi School of Economics P a g e | 10
• All telecom services have been opened up for free competition for unprecedented growth
• 217 (Information Technology Agreement) ITA-I items are at zero Customs Duty. Specified capital
goods and all inputs required to manufacture ITA-I, items are at zero Customs Duty
• Availability of low cost mobile handsets
• The international Long Distance Services (ILDS) opened with effect from April 2002. Calling Party
Pays (CPP) regime was implemented with effect from 1st May
• Guidelines for Unified Access Service License regime were issued in November 2003, 27 licenses
out of 31 Basic Service Licenses were converted to Unified Access Service Licenses
• In April 2004, license fee for Unified Access Service Providers (UAS) was reduced by 2 per cent
• License fee for infrastructure Provider-II reduced from 15 per cent to 6 per cent of the Adjusted
Gross Revenue and spectrum charges between 2 to 4 per cent in June 2004
• Entry fee for NLD licenses was reduced to `2.5 Crore from `100 Crore. Entry fee for ILD reduced to
`2.5 Crore from `25 Crore
• Lease line charges have been reduced to make the bandwidth available at competitive prices to
facilitate growth in IT enabled services
• One India plan i.e. single tariff of `1/-per minute to anywhere in India was introduced from 1st March
2006 by the Public Sector Undertakings. This tariff was emulated by most of the private service
providers also. This scheme has led to death of distance in telecommunication and is going to be
instrumental in promoting National Integration further.
• The robust telecom network has also facilitated the expansion of BPO industry that is having
500,000 employees now and adding 400 employees per day.
• Annual license fee for National Long Distance (NLD), International Long Distance (ILD),
Infrastructure Provider-II, VSAT commercial and Internet Service Provider (ISP) with internet
telephony (restricted) licenses was reduced to 6 per cent of Adjusted Gross Revenue (AGR) with
effort from Jan 2006.
• The Government‘s policy is neutral on use of technology by telecom service providers subject to
availability of scarce resources such as spectrum etc.
• Licence Fees 6-10 per cent of Adjusted Gross Revenue (AGR)
3. Foreign Direct Investment Policy:
Foreign Direct Investment (FDI) was permitted in the telecom sector beginning with the telecom
manufacturing segment in 1991 - when India embarked on economic liberalisation.
FDI is defined as investment made by non-residents in the equity capital of a company. For the
telecom sector, FDI includes investment made by Non-Resident Indians (NRIs), Overseas Corporate
Bodies (OCBs), foreign entities, Foreign Institutional Investors (FIIs), American Depository Receipts
(ADRs)/Global Depository Receipts (GDRs) etc.
Present FDI Policy for the Telecom sector:
• In Basic, Cellular Mobile, National Long Distance, International Long Distance, Value

Mobile Phones Market In India 2011
MIB, Department of Commerce, Delhi School of Economics P a g e | 11
Added Services and Global Mobile Personal Communications by Satellite, FDI is limited to 49 per
cent (under automatic route) subject to grant of licence from the Department of Telecommunications
and adherence by the companies (who are investing and the companies in which investment is being
made) to the licence conditions for foreign equity cap and lock-in period for transfer and addition of
equity and other license provisions.
• Foreign Direct Investment up to 74 per cent permitted, subject to licensing and security requirements
for the following:
- Internet Service (with gateways)
- Infrastructure Providers (Category II)
- Radio Paging Service
• FDI up to 100 per cent permitted in respect to the following telecom services:
- ISPs not providing gateways (Both for satellite and submarine cables)
- Infrastructure Providers providing dark fibre (IP Category I)
- Electronic Mail
- Voice Mail
The above is subject to the following conditions:
- FDI up to 100 per cent is allowed subject to the condition that such companies would divest 26 per
cent of their equity in favour of Indian public within 5 years, if these companies are listed in other parts
of the world.
- The above services would be subject to licensing and security requirements, wherever required.
- Proposals for FDI beyond 49 per cent shall be considered by Foreign
Investment Promotion Board (FIPB) on a case-to-case basis.
• In the manufacturing sector 100 per cent FDI is permitted under the automatic route.
• In Basic, Cellular Mobile, paging and Value Added service, and Global Mobile
Personal Communications by Satellite, FDI is permitted up to 49 per cent (under automatic route)
subject to grant of license from Department of Telecommunications
• Foreign direct investment up to 74 per cent permitted, subject to licensing and security requirements
for the Internet Service (with gateways), Infrastructure Providers (category-II), and Radio Paging
Service
• FDI up to 100 per cent permitted in respect of
- ISPs not providing gateways (both for satellite and submarine cables),
- Infrastructure Providers providing dark fibre (IP Category I);
- Electronic Mail; and
- Voice Mail
Mobile Phones Market In India 2011
MIB, Department of Commerce, Delhi School of Economics P a g e | 12
• FDI up to 49 per cent is also permitted in an investment company, set up for making investment in
the telecom companies licensed to operate telecom services. Investment by these investment
companies in a telecom service company is treated as part of domestic equity and is not set of
against the foreign equity cap.
• Manufacturing - 100 per cent FDI is permitted under automatic route.
FDI is subject to the following conditions:
• FDI up to 100 per cent is allowed subject to the conditions that such companies would divest 26 per
cent of their equity in favour of Indian public in 5 years, if these companies are listed in other parts of
the world.
• The above services would be subject to licensing and security requirements, Wherever required.
• Proposals for FDI beyond 49 per cent shall be considered by FIPB on case to case basis.

Mobile Phones Market In India 2011
MIB, Department of Commerce, Delhi School of Economics P a g e | 13
PRODUCT SEGMENTATION AND DIFFERENT TIERS OF MOBILE
PHONES
Different Tiers of Mobile Phone 1. Ultra Low-cost Mobile : Price range: Less than `1,500
Key features include: B&W screen, messaging, phonebook
2. Low- to Medium-cost : Price range: Less than `1,500 to `2,500
Key features include: coloured screen, FM radio, VGA camera
3. High-cost Mobile: Price range: Less than `2,500 to `4,000
Key features include: extendible memory, digital camera,GPRS,MP3 player
4. Smart Phones Handset : Greater than `4,000
Key features include :QWERTY keypad/touch screen, dual SIM, Wi-Fi, and 3G
Switching propensity from lower level segment to the mid tier segment is expected to increase with
the increase of income level and technology development.
The India mobile handsets market has got even more crowded and fragmented in the lower- and mid-
market segments with the entry of new players offering innovative models at attractive price points to
lure buyers. There is huge demand for feature-rich, low-cost handsets. Of the total handset sales, the
majority of sales fall in the price band of below $75. That is where the majority of the volume is and
that is where you will see the majority of the Indian and Chinese manufacturers playing. Going
forward, the market is going to grow at a rate of 15-20% year-on-year. Low-cost devices will grab 60%
of the market over the next three to four years. People are looking for devices with greater value. That
value could be in terms of features like QWERTY keypad or touch screen etc. One can get a handset
for Rs.2,000-3,000 with features like good memory, touch screen, QWERTY, camera, dual-SIM,
longer battery life etc. The majority of Indian manufacturers are in the low-price band and that is why
market is looking quite competitive. However, if they move up the price band, then they will face
competition from global players. When the low end segment customers go for repeat purchases, they
go for low cost mobile phones with extra features. In fact, many of them are ready to pay higher prices
for these new features and vendors are taking advantage of the psyche of the customers by adding
these features.
Major Handset Maker Companies in India Blackberry Sony Ericsson Karbonn Mobiles G-Five
HTC Motorola Lava Mobiles Vodafone Essar
Sony Ericsson Nokia Micromax Mobile Videocon
Samsung LG Spice
Mobile Phones Market In India 2011
MIB, Department of Commerce, Delhi School of Economics P a g e | 14
Finnish handset maker Nokia is losing its market share in India. Nokia currently has a market share of
36.3% at the end of June 2010 from 54% at the end of June 2009.Second biggest player happens to
be Samsung and MicroMax has surprisingly become the 3rd largest player recently according to
market share.
Tapping a global opportunity and bridging the mobile gender gap There are 300 Million Fewer Female than Male Subscribers who have mobile phone coverage but
don‘t have a handset in the world which amounts to a US$13 Billion Opportunity as well as social
welfare. Cost and perception that it isn‘t necessary to own a mobile phone and fear of being able to
master the technology are the biggest barriers to connecting more women in developing countries. By
using mobile phones women can unlock economic opportunities, save time and money, increase
return on investment and maximize household resources.
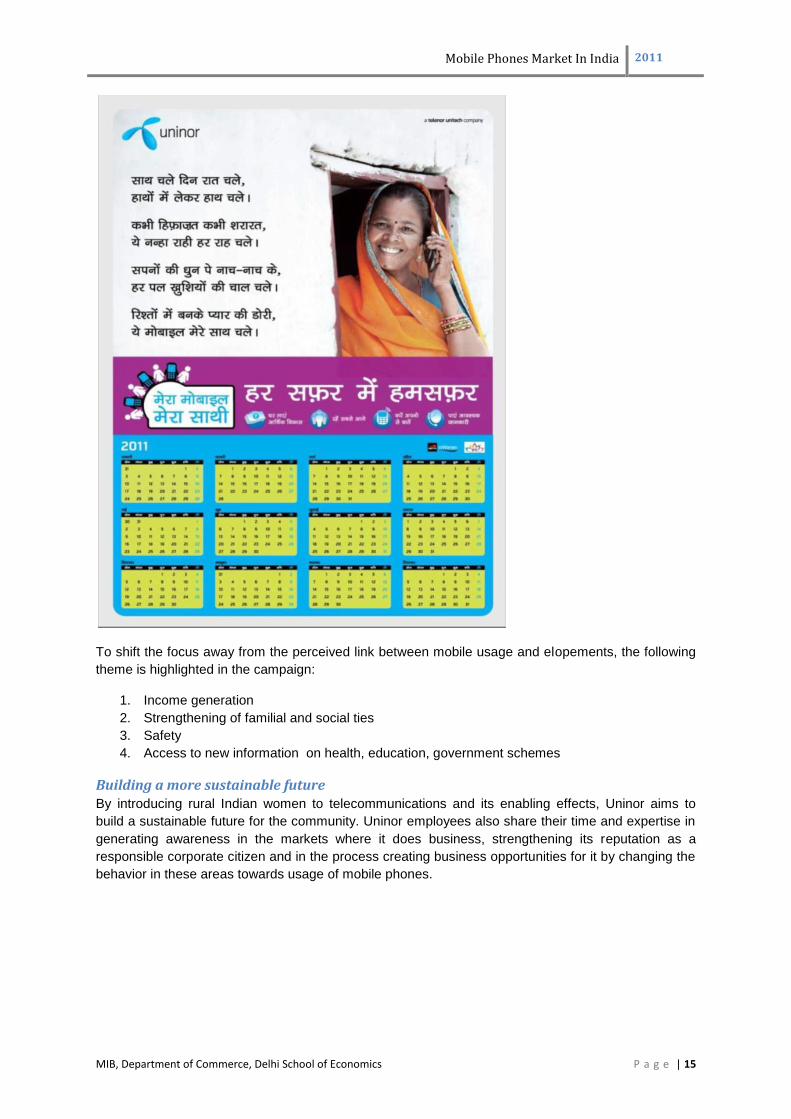
Case Study: Mera Mobile, Mera Saathi In November 2010, a village in Uttar Pradesh banned unmarried women from using mobile phones.
Here, and elsewhere in this region, mobile phones are seen as unwelcome tools that enable women
to step beyond the confines of traditional roles and social mores. This explains the concept of
behavioral economics. Herein thesocial, cognitive and emotional factors helps in understanding the
reason for the economicdecision(to buy or not to buy a mobile) of individuals(women).Mobile
penetration among women in many developing markets is consistently low, with just 28% of Indian
women in possession of a mobile phone.
In an effort to bridge the mobile gender gap in India, Uninor joined forces with the GSM Association‘s
mWomen advocacy campaign. Together they launched ―Mera Mobile, MeraSaathi‖, which means ―My
Mobile, My Companion‖. This campaign aims to bring the life-transforming benefits of mobile phones
to more women across all of India.
Spreading the message
Mera Mobile, MeraSaathi was officially launched in January 2011, in the states of Uttar Pradesh and
Bihar. The campaign is an awareness initiative (for changing the perception and behavior) that
highlights the benefits from mobile phones, including income generation opportunities, stronger
familial and social ties, and new information on health, education and government schemes, as well
as personal safety and entertainment.
Benefits 1. SMS blasts among Uninor users in Uttar Pradesh (UP)
2. Outbound dialing: A voice message in the local language will be delivered to rural customers
3. Leaflets, raising awareness about the advantages of mobile technology, distributed at:
4. Uninor retail outlets
5. AditiUrjaVikas solar charging stations in UP
Distribution of 20,000 calendars in rural UP and Bihar Gram PraudyogikVikasSansthan (GPVS), NGO
partner, pictorially depicting the benefits of mobile phones to reinforce the message to the target
audience throughout the year.
Conducting quick quizzes among the village women. (The one who can list five benefits of mobile use
will get a mobile handset and a Uninor connection free.)
Mobile Phones Market In India 2011
MIB, Department of Commerce, Delhi School of Economics P a g e | 15
To shift the focus away from the perceived link between mobile usage and elopements, the following
theme is highlighted in the campaign:
1. Income generation
2. Strengthening of familial and social ties
3. Safety
4. Access to new information on health, education, government schemes
Building a more sustainable future By introducing rural Indian women to telecommunications and its enabling effects, Uninor aims to
build a sustainable future for the community. Uninor employees also share their time and expertise in
generating awareness in the markets where it does business, strengthening its reputation as a
responsible corporate citizen and in the process creating business opportunities for it by changing the
behavior in these areas towards usage of mobile phones.
Mobile Phones Market In India 2011
MIB, Department of Commerce, Delhi School of Economics P a g e | 16
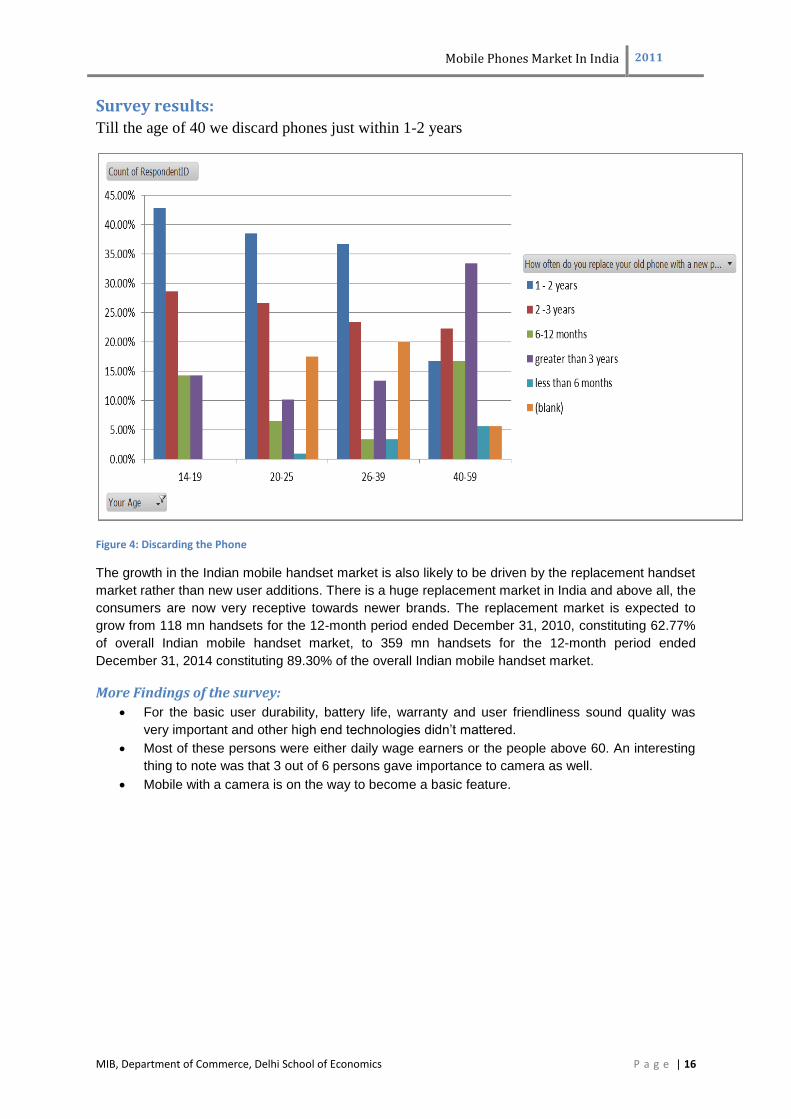
Survey results: Till the age of 40 we discard phones just within 1-2 years
Figure 4: Discarding the Phone
The growth in the Indian mobile handset market is also likely to be driven by the replacement handset
market rather than new user additions. There is a huge replacement market in India and above all, the
consumers are now very receptive towards newer brands. The replacement market is expected to
grow from 118 mn handsets for the 12-month period ended December 31, 2010, constituting 62.77%
of overall Indian mobile handset market, to 359 mn handsets for the 12-month period ended
December 31, 2014 constituting 89.30% of the overall Indian mobile handset market.
More Findings of the survey:
For the basic user durability, battery life, warranty and user friendliness sound quality was
very important and other high end technologies didn‘t mattered.
Most of these persons were either daily wage earners or the people above 60. An interesting
thing to note was that 3 out of 6 persons gave importance to camera as well.
Mobile with a camera is on the way to become a basic feature.

Mobile Phones Market In India 2011
MIB, Department of Commerce, Delhi School of Economics P a g e | 17
SPECTRUM POLICY
Spectrum policy is the most obvious. India is burdened with severe spectrum constraints. Minutes per
subscriber are higher in India than in almost any other country and cities in India have some of the
most densely populated areas. Both these factors increase the need for spectrum, yet Indian
operators is struggling with average spectrum allocations only a third of those available to most
operators in other countries.
Spectrum is a fundamental driver of cost in mobile networks – the fewer spectrums, the more sites
are needed, and the cost of deployment rises accordingly. This scarcity situation in 2G (GSM) is likely
to be replicated in 3G. It causes Indian operators to have to invest more capital building capacity in
urban areas in order to overcome spectrum constraints and preserve service quality, but thereby
limiting capital available for the expansion of coverage into rural areas or to lower income urban
agglomerations. The civilian spectrum shortage is created by two factors: the occupation of critical
frequencies by the military and other government departments; and a policy bias towards a large
number of operators. Many commentators argue that fewer operators would achieve greater
economies of scale, while still preserving the benefits of vigorous competition. All over the world and
across industries, it is amply demonstrated that a market structure with relatively few players but
robust regulatory oversight can be more competitive than one populated by a large number of small
players. In fact market fragmentation has the disadvantage of none of the players having enough
capacity and resources for innovation and delivering greater value to the customer. There is also the
danger of a single large firm emerging as a virtual monopoly in such markets, and drawing monopoly
rents. The government would have to weigh these factors against its apparent objectives of
maximising resources. A government initiative whereby additional spectrum is made available to the
industry has yet to deliver results.
As a consequence, the Indian telecommunications industry is being starved of spectrum and the
private sector is being drained of capital. The losers from this spectrum constraint are the people who
are consequently being denied access to telecommunications services. They are losing out because
licensees are diverting investments to maintain quality of service in urban areas. A comprehensive
review of the overall national benefit of current policy on spectrum allocation is urgently required. Are
there more efficient alternatives for the military and public sector which would free spectrum for
private use while not adversely affecting the military‘s ability to protect India‘s national interests? This
should include an estimate of the cost to the nation of the spectrum that is currently being used by the
military. Greater transparency in this regard would be most desirable. The most serious problem
facing India surrounds data services. India‘s current position, by international standards, is lagging,
and we cannot afford any complacency. The rest of the world is increasingly concerned about
increasing access to high speed data rather than voice connectivity. High-speed data services and
the internet are seen as a critical capability that will drive future global competitiveness in technology
and services. For India, and the rest of the developing world, data services will be delivered by
wireless broadband access rather than fixed line copper or fibre networks. But the vision in India is
likely to be limited by the reality of insufficient spectrum availability. The first 3G spectrum auction
scheduled for January 2009 is to be welcomed but the incremental capacity for each operator is most
likely to be consumed by voice capacity as a result of the deficiencies of 2G spectrum allocations. The
delivery of world-class data services requires very large blocks of spectrum.
A major strategic plan for data services is urgently required to plan the availability of sufficient
spectrum.
Mobile Phones Market In India 2011
MIB, Department of Commerce, Delhi School of Economics P a g e | 18
OVERALL INVESTING ENVIRONMENT
India has chosen a policy of creating a highly competitive, fragmented industry, which has delivered
extraordinarily low prices and high minutes of use per subscriber. However, these low prices are only
currently enjoyed by about 25–30% of the Indian population – the rest do not have a mobile phone.
The real question is to whether the same model will eventually deliver universal access to
telecommunications and most importantly access to high-quality data services. India needs to set out
a stable policy framework to attract long-term investment in telecommunications. That requires a
stable licensing structure, consistent policy decisions and a predictable framework for regulatory
intervention. The history of Indian telecommunications has been one of frequent shifts in policies,
regulations and taxation that create uncertainty for investors. A stable and attractive policy approach
is especially important in the context of the current global credit crunch and with capital so scarce.
Policies are needed which will attract long-term investors who will make the commitments and
investments required to create world-class telecommunications networks and services that will deliver
global competitiveness for all the citizens of India. Therefore this is the time for the government to be
assessing fundamental policy issues that impact sector investment, such as foreign direct investment
caps, licence extension terms, spectrum availability and allocations, and criteria for mergers and
acquisitions. All these issues affect the economics of additional capital investment. There is a need to
determine what sort of industry India needs and set the policy framework accordingly.
The physical infrastructure (or lack thereof) is widely acknowledged to be one of the crucial
impediments to achieving higher and more inclusive economic growth in India. The lack of adequate
infrastructure is particularly acute in rural areas, home to 70% of India‘s population and the 52% of the
work force that is primarily engaged in agriculture and related activities.4 Agriculture in India accounts
for 18% of national income, implying extremely low agricultural productivity. The resulting migration of
excess farm labour to urban areas in search of jobs is straining urban infrastructure and increasing
the population living in city slums. India‘s urban population is expected to double over the next two
decades, to 575 million. Any strategy that seeks to address the problem of inclusive growth will
therefore have to contend with these harsh realities of low productivity in the countryside, a massive
movement of people to the cities, and extensive poverty in both rural and urban areas. Past policies
have not had much success, often being defeated by the magnitude of the problem as well as
weaknesses in implementation. But the message is clear. Rural productivity needs to increase both
as part of the development process and to raise incomes for millions of Indians who live below the
poverty line, in the countryside and the cities. A sustainably faster rate of growth can only be achieved
by improving productivity, but underinvestment in infrastructure is an important barrier. India plans
roughly to double investment in infrastructure, to $500 billion over the next five years, or about 8% of
GDP each year. The Planning Commission maintains that the growth target of the Eleventh Plan
(2007–12) is achievable only if the ‗infrastructure deficit can be overcome and adequate investment
takes place to support higher growth‘.5 The government expects private investors to contribute two-
fifths of the total investment in infrastructure, not only to expand capacity but also to improve the
quality of service. The telecommunications sector has had the most success in attracting private
investment and is often held up as an example for other infrastructure sectors.6 Two familiar reasons
for this status are worth repeating. First, India‘s teledensity has shown extraordinary growth since
private participation in the sector was introduced, rising from less than 1% in 1998 to over 30% today.
Secondly, several research studies have found that the telecommunications infrastructure is one of
the significant factors in economic growth, alongside others such as overall investment, education,
energy and transportation networks.7 The change in India‘s telecoms landscape has been dramatic.
In 1994, the year the National Telecom Policy was drafted; fewer than 1 in 100 Indians owned a
phone. Public sector Executives working for the incumbent monopoly were highly popular, given their
ability to short circuit the endless waiting time for the privilege of owning a telephone. Less than 15
years on, teledensity has increased to more than 32% and subscriber numbers are growing at a rate
Mobile Phones Market In India 2011
MIB, Department of Commerce, Delhi School of Economics P a g e | 19
of about 10 million per month. Ownership of a phone is no longer a function of who you know, but
rather conforms to the conventional forces of demand and supply. Waiting lists are down and voice
calls in India are amongst the cheapest in the world. The Government‘s target of 250 million phones
by the end of 2007 was reached, quite unexpectedly. While the telecoms-growth link has been
explored across different countries and within a particular country over time, few studies have
assessed the relationship at the sub‑national level. India‘s Federal structure, with some states such
as Uttar Pradesh, Maharashtra, and Madhya Pradesh larger in geographical area and population than
most European countries. Moreover, balanced regional development has always been an objective in
India‘s plans and therefore studying the impact of telecoms liberalisation across states will provide
valuable insights for this policy aim. The rapid spread of mobile telephony in India is the most obvious
manifestation of the benefits of telecom sector liberalisation. Fixed line penetration is in fact showing
signs of decline, and future growth will come from mobile. Given that about 10 million wireless
subscribers are being added every month, the impact of telecoms on state-level growth rates can be
explored through the impact of mobile telephony.

Mobile Phones Market In India 2011
MIB, Department of Commerce, Delhi School of Economics P a g e | 20
RELIGION AND MOBILE PHONE (HOW THEY MAKE MONEY ?)
INDIA‘S mobile-phone industry is adding more than 15m new connections each month, its growth sustained by ferocious competition and astonishingly low prices (as little as $0.01 a minute in some cases). The industry‘s regulator, the Telecom Regulatory Authority of India (TRAI), has recently hinted that operators may soon have to charge customers on a per-second, rather than a per-minute, basis. That will be great for subscribers, but will put further pressure on operators, many of which are also having to fork out large sums for 3G licences.
Little wonder, then, that operators are shifting their strategies. Having previously focused on trying to attract as many customers and sell as many SIM cards as possible, they are now looking for ways to get each customer to spend more, by promoting new ―value added services‖. (Operators in the rich world have been struggling with this transition for years, as they have tried to plug the gap left by declining voice revenues and slowing subscriber growth by promoting data services of various kinds.)
In India, the operators have roughly segmented the market using the acronym ABCD, which stands for astrology, Bollywood, cricket and devotion. The idea is that all Indians are fascinated by at least one of these things. Not everyone is interested in astrology, though, and Bollywood and cricket have seasonal appeal. Devotion, by contrast, has a perennial audience.
The manner in which a devout Indian communicates with his God has changed over the years. At my workplace, I often find a couple of my formally dressed colleagues who are in their mid-40s muttering prayers to the wallpaper images on their computers, which consist of pictures of their favourite deity. While they may still continue to carry a picture of their deity in their wallets, this new option fascinates them even more.
The telecoms operators have found different ways to be part of a typical consumer‘s daily routine. Instead of waking up in the morning to a jarring beep from his alarm clock, his cell phone can sing a melodious aarti (prayer) that stimulates his senses at dawn. To experience this divine start to his day, he pays 30 rupees ($0.63) a month. Depending upon his religion, he can subscribe to daily quotes from his God which are fed to him, like medicine, three times a day at regular intervals. For this service he can either pay seven rupees for a ―weekly pack‖, or 28 rupees for a ―monthly pack‖, which includes a free screensaver. To accommodate variations in the popularity of local deities, the operators have customised their services for different regions. There are more Krishna followers in Gujarat (West India), whereas Kolkata (East India) is known for worshipping Durga.
Other devotional services can help with decision-making. Instead of referring to a physical calendar, subscribers can receive automatic alerts to tell them which dates or times of day are inauspicious for starting a new job or shopping for a car. And the caller tune, which is played to incoming callers as they wait for the person they are calling to answer, has graduated from being a bland beeping noise to a bhajan (devotional song). Bharti Airtel, one of India‘s leading operators, has introduced a service which streams live audio aartis recited by bhatjis (priests) to mobile phones from the most important shrines. While the bhatji is intoning those prayers, he is also talking into a microphone placed near the idol. With the introduction of 3G spectrum, the possibility of video streaming is not far off. Given the devotion of Indian consumers to their mobile phones, all this gives the notion of an omnipresent God a whole new meaning.
MOBILE PHONES AND ECONOMICS GROWTH
Case 1: Catch the FISH
You are a fisherman off the coast of northern Kerala. Visiting your usual fishing ground, you bring in an unusually good catch of sardines. That means other fishermen in the area will probably have done well too, so there will be plenty of supply at the local beach market: prices will be low, and you may not even be able to sell your catch. Should you head for the usual market anyway, or should you go down the coast in the hope that fishermen in that area will not have done so well and your fish will
Mobile Phones Market In India 2011
MIB, Department of Commerce, Delhi School of Economics P a g e | 21
fetch a better price? If you make the wrong choice you cannot visit another market because fuel is costly and each market is open for only a couple of hours before dawn—and it takes that long for your boat to putter from one to the next. Since fish are perishable, any that cannot be sold will have to be dumped into the sea.
This, in a nutshell, was the situation facing Kerala's fishermen until 1997. The result was far from ideal for both fishermen and their customers. In practice, fishermen chose to stick with their home markets all the time. This was wasteful because when a particular market is oversupplied, fish are thrown away, even though there may be buyers for them a little farther along the coast. On average, 5-8% of the total catch was wasted, says Robert Jensen, a development economist at Harvard University who has surveyed the price of sardines at 15 beach markets along Kerala's coast. On January 14th 1997, for example, 11 fishermen at Badagara beach ended up throwing away their catches, yet on that day there were 27 buyers at markets within 15km (about nine miles) who would have bought their fish. There were also wide variations in the price of sardines along the coast.
But starting in 1997 mobile phones were introduced in Kerala. Since coverage spread gradually, this provided an ideal way to gauge the effect of mobile phones on the fishermen's behaviour, the price of fish, and the amount of waste. For many years, anecdotes have abounded about the ways in which mobile phones promote more efficient markets and encourage economic activity. One particularly popular tale is that of the fisherman who is able to call several nearby markets from his boat to establish where his catch will fetch the highest price. Mr Jensen's paper adds some numbers to the familiar stories and shows precisely how mobile phones support economic growth.
As phone coverage spread between 1997 and 2000, fishermen started to buy phones and use them to call coastal markets while still at sea. (The area of coverage reaches 20-25km off the coast.) Instead of selling their fish at beach auctions, the fishermen would call around to find the best price. Dividing the coast into three regions, Mr Jensen found that the proportion of fishermen who ventured beyond their home markets to sell their catches jumped from zero to around 35% as soon as coverage became available in each region. At that point, no fish were wasted and the variation in prices fell dramatically. By the end of the study coverage was available in all three regions. Waste had been eliminated and the ―law of one price‖—the idea that in an efficient market identical goods should cost the same—had come into effect, in the form of a single rate for sardines along the coast.
This more efficient market benefited everyone. Fishermen's profits rose by 8% on average and consumer prices fell by 4% on average. Higher profits meant the phones typically paid for themselves within two months. And the benefits are enduring, rather than one-off. All of this, says Mr Jensen, shows the importance of the free flow of information to ensure that markets work efficiently. ―Information makes markets work, and markets improve welfare,‖ he concludes.
Mr Jensen's work is valuable because studies of the economic effect of mobile phones tend to be macroeconomic. A well known example is the finding in 2005 by Leonard Waverman, of the London Business School, that an extra 10 mobile phones per 100 people in a typical developing country leads to an additional 0.59 percentage points of growth in GDP per person.
Calls and effect
One criticism levelled at such studies, says Mr Waverman, is that it is difficult to tell if mobile phones are promoting growth, or growth is promoting the adoption of mobile phones, as people become able to afford them. It is easy to imagine ways in which mobile phones could stimulate economic activity—they make up for poor infrastructure by substituting for travel, allow price data to be distributed and enable traders to engage with wider markets, and so on. Mr Waverman uses a variety of statistical tests to try to tease apart cause and effect. But detailed analyses of micro-market data like Mr Jensen's, he says, show how phones really do make people better off.
Furthermore, says Mr Jensen, phones do this without the need for government intervention. Mobile-phone networks are built by private companies, not governments or charities, and are economically self-sustaining. Mobile operators build and run them because they make a profit doing so, and fishermen, carpenters and porters are willing to pay for the service because it increases their profits.
Mobile Phones Market In India 2011
MIB, Department of Commerce, Delhi School of Economics P a g e | 22
The resulting welfare gains are indicated by the profitability of both the operators and their customers, he suggests. All governments have to do is issue licences to operators, establish a clear and transparent regulatory framework and then wait for the phones to work their economic magic.
Case 2 : Smartphone Apps Fuel Business
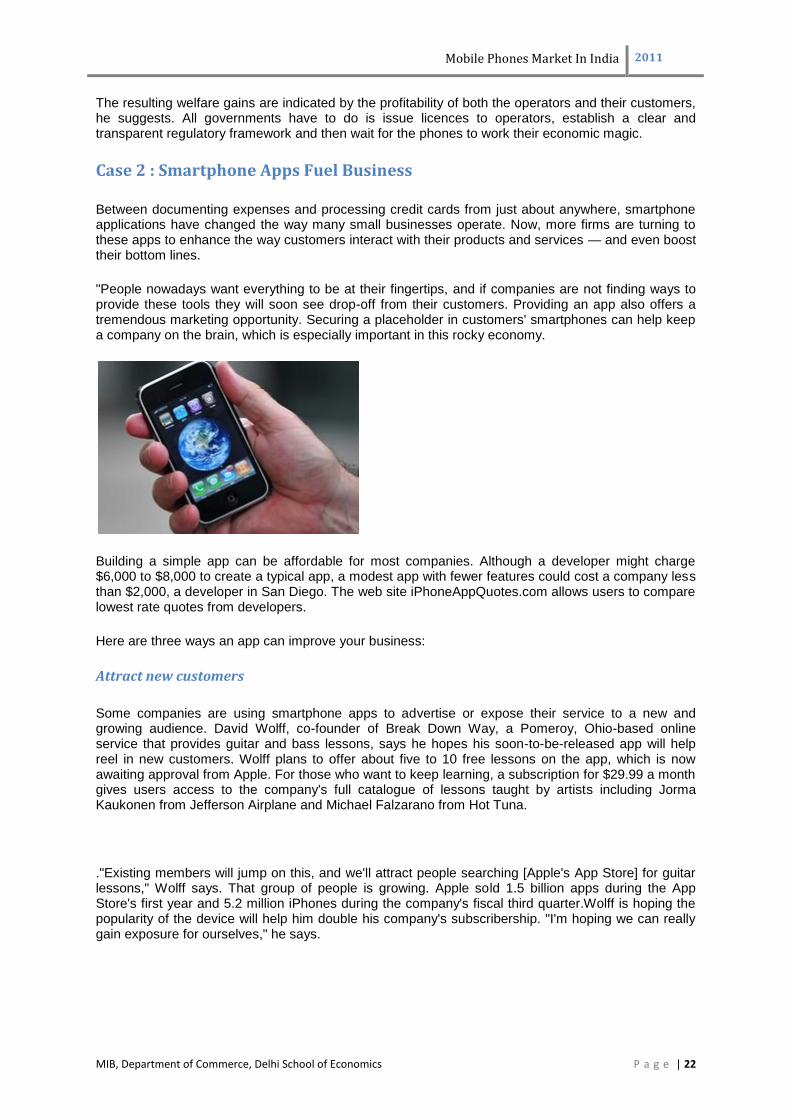
Between documenting expenses and processing credit cards from just about anywhere, smartphone applications have changed the way many small businesses operate. Now, more firms are turning to these apps to enhance the way customers interact with their products and services — and even boost their bottom lines.
"People nowadays want everything to be at their fingertips, and if companies are not finding ways to provide these tools they will soon see drop-off from their customers. Providing an app also offers a tremendous marketing opportunity. Securing a placeholder in customers' smartphones can help keep a company on the brain, which is especially important in this rocky economy.
Building a simple app can be affordable for most companies. Although a developer might charge $6,000 to $8,000 to create a typical app, a modest app with fewer features could cost a company less than $2,000, a developer in San Diego. The web site iPhoneAppQuotes.com allows users to compare lowest rate quotes from developers.
Here are three ways an app can improve your business:
Attract new customers
Some companies are using smartphone apps to advertise or expose their service to a new and growing audience. David Wolff, co-founder of Break Down Way, a Pomeroy, Ohio-based online service that provides guitar and bass lessons, says he hopes his soon-to-be-released app will help reel in new customers. Wolff plans to offer about five to 10 free lessons on the app, which is now awaiting approval from Apple. For those who want to keep learning, a subscription for $29.99 a month gives users access to the company's full catalogue of lessons taught by artists including Jorma Kaukonen from Jefferson Airplane and Michael Falzarano from Hot Tuna.
."Existing members will jump on this, and we'll attract people searching [Apple's App Store] for guitar lessons," Wolff says. That group of people is growing. Apple sold 1.5 billion apps during the App Store's first year and 5.2 million iPhones during the company's fiscal third quarter.Wolff is hoping the popularity of the device will help him double his company's subscribership. "I'm hoping we can really gain exposure for ourselves," he says.

Mobile Phones Market In India 2011
MIB, Department of Commerce, Delhi School of Economics P a g e | 23
Improve customer service
Many apps do more than draw attention to your product; they improve the customer's experience. Jason Gossard, the lead administrator for the Circle School, a parent-owned and operated school in San Antonio, praises the utility of the school's new free app, which is scheduled to launch in a couple weeks. Administrators will be able to use their smartphones to highlight upcoming school events and make speedy updates, he says. And parents will be able to receive updates from the school more easily. "Everyone who had an iPhone was excited about this," he says.
Even if another firm profits from offering your company's app, users still benefit from being able to access your company's service with greater ease. Just ask Tobi Lutke, the CEO of Ottawa-based web site host Shopify. When an independent developer created Shopkeeper, an app that allows any of Shopify's 5,000 customers to manage their inventories, more than 100 users downloaded the $4.99 app. Lutke says Shopkeeper and apps like it are good for his customers and his business. "The app allows small companies to operate more like larger e-commerce shops, which have dedicated staff to improve their workflow," Lutke says. "With this technology, you can be very small and have the same technology as a big corporation."
Create a revenue opportunity
Some apps present companies with new ways to lift profits, and others are revenue generators themselves. Blakely Long, the CEO of BetterQOL, a pain-management service in Bellaire, Texas, and her partner Brian Loftus, a neurologist, are banking that some of the estimated 33 million migraine sufferers will purchase their new app, iHeadache. The app, which costs $9.99 to download, identifies the type of headache a user has, based on their symptoms, the duration of their headache and the medication they may be taking. The app also generates reports which can be shared with physicians. "We are targeting neurologists and headache specialists, as they benefit from having better reports," Loftus says.
Case 3: Mobiles for fighting poverty
Given the high penetration of mobile telephony in developing countries like India, using it to deliver scarce banking services in rural areas is one way of fulfilling the government‘s financial inclusion programme Doing banking work via the mobile is convenient not just for hot-shot businessmen on the go but also for rural communities in the developing world that are often situated many miles away from banks. While it may not address scarcity of capital, which is the main issue of the poor, it does address the issue of access, and, in the case of AppLab (Application Laboratory), an initiative of Google and Grameen Foundation, of information.
In India, the government is setting up elaborate technology and regulatory architecture to deliver basic banking services through mobile-linked accounts in rural areas. Around 73,200 villages with a population of over 2,000 people have been identified to receive mobile-linked basic bank services by March 2012.
The idea is to marry the country‘s 500-million-plus mobile phone network and basic financial services which are often not available in rural areas that have no bank branches. The National Payment Corporation of India, a not-for-profit company that provides low-cost infrastructure for providing payment services among banks, is helping formulate back-end technology solutions. These will link the person‘s mobile number to his no-frills bank account. Eventually, it will be integrated with the unique identity number, once it gets operationalised.
How will this work? One model, successfully tried out in some developing countries, like Kenya, is the banking correspondent (BC) network. The bank appoints a BC in a village, say the kirana shop-owner, and villagers give her their deposits.

Mobile Phones Market In India 2011
MIB, Department of Commerce, Delhi School of Economics P a g e | 24
The BC services them in one of two ways:
She has a phone on which the amount is entered and is wirelessly sent to the bank‘s server -- if the customer has a mobile phone, he gets an SMS receipt; if not, the BC prints out a receipt (such a printer-phone set-up, which includes a scanner for fingerprints, costs around `30,000).
The BC keeps the money, and the bank which has a deposit from the BC debits it from that. When the money is withdrawn, another wireless sync gets done, another SMS/receipt gets generated, and this time around the BC‘s deposit account with the bank gets credited.
There are some doubts as to whether, when the mechanics of this are worked out, this will be profitable for banks or the BC as the volume of money in the hands of those it should most benefit is small. One suggestion to increase volumes is to use the mobile telephony route for NREGS payments. NREGS payments for 2010-11 are expected to be in the region of `60,000 crore. The idea
is that the unique ID each citizen will get will be linked to the BC network. Not only will the government be able to ensure that the money goes to the person concerned, with zero leakage -- a major concern at present -- but it also means that the NREGS worker gets to know he has received his money without wasting the day or two it takes to visit the nearest bank branch to check whether the payment is in. The same holds for all other social sector payments the government makes.
The system sounds good, but there are some glitches. Last year, banks in Madhya Pradesh were pulled up by the state government for not progressing fast enough in its financial inclusion programme, which involves opening more accounts in rural branches. Bankers say they tried to appoint business correspondents on a commission basis but received a lukewarm response. They have also opened accounts through hand-held devices and mobile phones but, in the absence of power and connectivity, the technology-driven solution has been a failure in rural areas. Technology is the biggest issue, and the state government must understand that it is a tough task.
While there are many opportunities in mobile banking services, experts say some issues need to be dealt with first, such as lack of lingual support, providing voice-based support for people who are not literate, weak network coverage in rural areas and different technologies
Mobile Phones Market In India 2011
MIB, Department of Commerce, Delhi School of Economics P a g e | 25
MOBILE MARKET: BEHAVIOURAL ECONOMICS PERSPECTIVE
What is the Behavioural Economics “Revolution”? Economics is a collection of ideas and conventions which economists accept and use to reason with. Namely, it is a culture. Behavioural economics represents a transformation of that culture. Nonetheless, as pointed out by Camerer and Loewenstein (2003), its methods are pretty much the same as those introduced by the Game Theory revolution. At the core of most models in Behavioural Economics there are still agents who maximize a preference relation over some space of consequences and the solution in most cases still involves standard equilibrium concepts. However, the behavioural economists are not committed to what is usually referred to as rational motivations. An economic fable (or a model as we would call it) that has at its core fairness, envy, present-bias and the like is by now not only permitted but even preferred. Why now? Perhaps, economists have finally realized that orthodox economic models are too unrealistic and dogmatic. And perhaps it is the result of our constant search for new directions in research. One might also ask why other ideas (such as those of bounded rationality) are less welcome than those of Behavioural Economics. The models of Behavioural Economics are not that different from those of applied economics and thus are not perceived as a threat. The field of behavioural economics is devoted to studying how consumers actually make choices. It uses some of the insights from psychology to develop predictions about choices people will make and many of these predictions are at odds with the conventional economic model of "rational" consumers.
Behavioural Economics and Exploration A paper in Behavioural Economics typically begins with a description of a real life phenomenon that cannot easily be explained by the standard rational man paradigm. To support the case, references are brought from research in psychology and sometimes even studies of animal behaviour. In Rabin‘s discussion all that is borrowed from psychology is the idea that some people, in some cases, have some present-bias. Each of us can think of situations in which we exhibit present-bias. However, it is also easy to think of situations where we have future-bias. Issues the perspective of behavioural economics explore, include:
Choice overload - consumers have to compare too many products and features leading to
confusion, random choice, or even failure to make any choice.
Heuristics – consumers often take short cuts (e.g., by following rules of thumb such as what others
say/do) when the decision environment is complex relative to their mental and computational apabilities. Endowment – consumers value something more once they have owned it than before they own it
and may be reluctant to give up what they have. They may stay with the present service provider e.g., the incumbent, because of misplaced loyalty and/or a failure to acknowledge poor choices in the past. Defaults – a default inertia may operate in favour of an ‗opt-in‘ default since making a decision to
opt-out‘ takes more effort than to ‗opt-in‘ e.g. an ‗opt-in‘ default would automatically extend a mobile phone or broadband contract unless the customer expressly ‗opts-out‘. Hyperbolic discounting – consumers and service providers may tend to be short-sighted when making decisions overvaluing immediate costs or benefits against future costs or benefits. Framing biases – consumer choice is influenced by the ‗frame‘ in which information is presented;
presentation of the same information in a different ‗frame‘, can lead to a different decision. Risk/Loss aversion – the preference for avoiding loss is widely considered to be greater than the
preference for gain. Part of the reluctance to ‗switch‘ from one supplier to another may be due to the fear that experience with a new supplier is unknown and may be worse.
Behavioural economics and behavioural ‘bias’ Combining economics with psychology and experimental research on decision-making behaviour, behavioural economists have sought to better explain what influences consumers in their purchasing
Mobile Phones Market In India 2011
MIB, Department of Commerce, Delhi School of Economics P a g e | 26
decisions and how this behaviour affects the market (Della Vigna 2009). In essence, behavioural economics uses evidence of how humans actually behave (Sylvan 2009). It argues that observed human decision-making differs from the ‗rational‘ welfare maximizing behaviour assumed in neo-classical economic models. For example, people:
stick with what they know
follow others
settle for something that is good enough, rather than searching for the best (optimal)
procrastinate, putting off things such as saving for retirement or switching
stick with the default option, even if it is not the best
may delay making a decision if it is complex/confusing or avoid it altogether
are readily confused, and prone to misleading advice
are much more concerned about possible losses than possible equivalent gains
are inclined to stick with the status quo
dislike uncertainty
value fairness and care about others, rewarding or punishing behaviour sometimes to their own ‗cost‘
sharply discount the future compared to the present – they care more about immediate benefits and costs than those in the future
tend to be ‗overconfident‘ and sometimes misjudge how disciplined they will be in the future.
often make decisions relying on simple ‗heuristics‘ or rules of thumb rather than considered calculation.
A basic premise of behavioural economics is ―predictable irrationality.‖ Marketing and advertising staff employed by businesses already have and rely on thorough knowledge of such behavioural characteristics to increase sales and boost profits.
A complement to conventional analysis, not a substitute. One thing should be stated clearly at the
outset. Behavioural economics is a complement to conventional neo-classical economics in endeavouring to assist improved marketing decision / understanding buying patterns, not a replacement. Behavioural economists generally agree that markets are best understood by building up from the behaviour of individual agents. But behavioural economics argues that behavioural ‗bias‘ is systematic and predictable so that they can be taken into account to generate better analysis and policies.
Behavioural economics and Consumers We have utilised the framework of behavioural economics to explore actual consumer behaviour and consumer behavioural tendencies that appear particularly relevant to the Mobile market in India. The behavioural economics framework will be used to assist in explaining why some consumers may be making or not making decisions - e.g., to buy a phone , prefer a phone over another. The key behavioural economics insights include:
Anchoring Effect The idea here is that people's choices can be influenced by completely spurious information. In a classic study the experimenter spun a wheel of fortune and pointed out the number that came up to a subject. The subject was then asked whether the number of African countries in the United Nations was greater or less than the number on the wheel of fortune. After they responded, the subjects were asked for their best guess about how many African countries were in the United Nations. Even though the number shown on the wheel of fortune was obviously random, it exerted a significant influence on the subjects' reported guesses. In a similar experimental design , MIB , Delhi School of Economics were told about a mobile phone with a lot of high end features and then asked if they would pay an amount for that bottle equal to the last two digits of their Driving License Number or Bank Account Number. For example , if the last two digits were 30, the question was , " Would you pay `30,000 for the phone ?"
After that the students were asked , the maximum amount they were willing to pay for it. Their answers were strongly influenced by the price determined by the last two digits of their Bank Account/ Drivers License Number. Surprisingly , those with D/L Number of 50 or under, were willing to pay
Mobile Phones Market In India 2011
MIB, Department of Commerce, Delhi School of Economics P a g e | 27
`16,500 while those on the upper half were willing to pay `23,500 on average. Again, these choices seem like mere laboratory games. However, there are very serious economic decisions that can also be influenced by minor variations in the way the choice is framed.
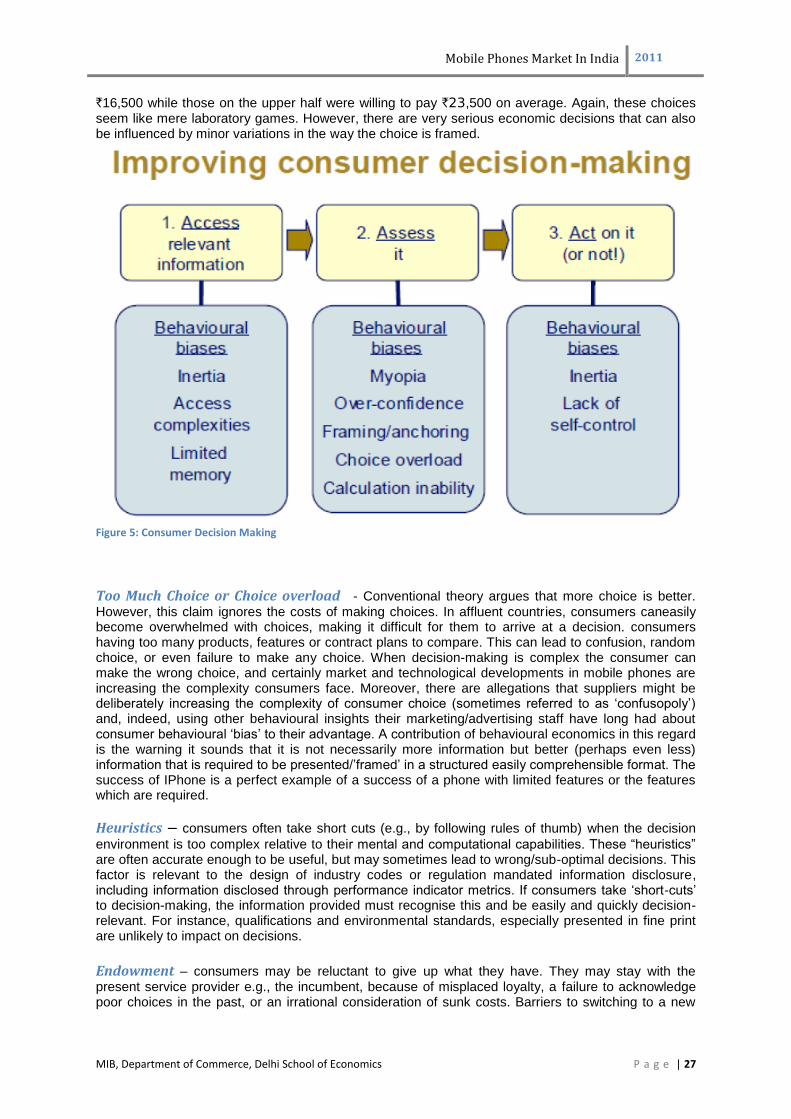
Figure 5: Consumer Decision Making
Too Much Choice or Choice overload - Conventional theory argues that more choice is better.
However, this claim ignores the costs of making choices. In affluent countries, consumers caneasily become overwhelmed with choices, making it difficult for them to arrive at a decision. consumers having too many products, features or contract plans to compare. This can lead to confusion, random choice, or even failure to make any choice. When decision-making is complex the consumer can make the wrong choice, and certainly market and technological developments in mobile phones are increasing the complexity consumers face. Moreover, there are allegations that suppliers might be deliberately increasing the complexity of consumer choice (sometimes referred to as ‗confusopoly‘) and, indeed, using other behavioural insights their marketing/advertising staff have long had about consumer behavioural ‗bias‘ to their advantage. A contribution of behavioural economics in this regard is the warning it sounds that it is not necessarily more information but better (perhaps even less) information that is required to be presented/‘framed‘ in a structured easily comprehensible format. The success of IPhone is a perfect example of a success of a phone with limited features or the features which are required.
Heuristics – consumers often take short cuts (e.g., by following rules of thumb) when the decision
environment is too complex relative to their mental and computational capabilities. These ―heuristics‖ are often accurate enough to be useful, but may sometimes lead to wrong/sub-optimal decisions. This factor is relevant to the design of industry codes or regulation mandated information disclosure, including information disclosed through performance indicator metrics. If consumers take ‗short-cuts‘ to decision-making, the information provided must recognise this and be easily and quickly decision-relevant. For instance, qualifications and environmental standards, especially presented in fine print are unlikely to impact on decisions.
Endowment – consumers may be reluctant to give up what they have. They may stay with the present service provider e.g., the incumbent, because of misplaced loyalty, a failure to acknowledge poor choices in the past, or an irrational consideration of sunk costs. Barriers to switching to a new
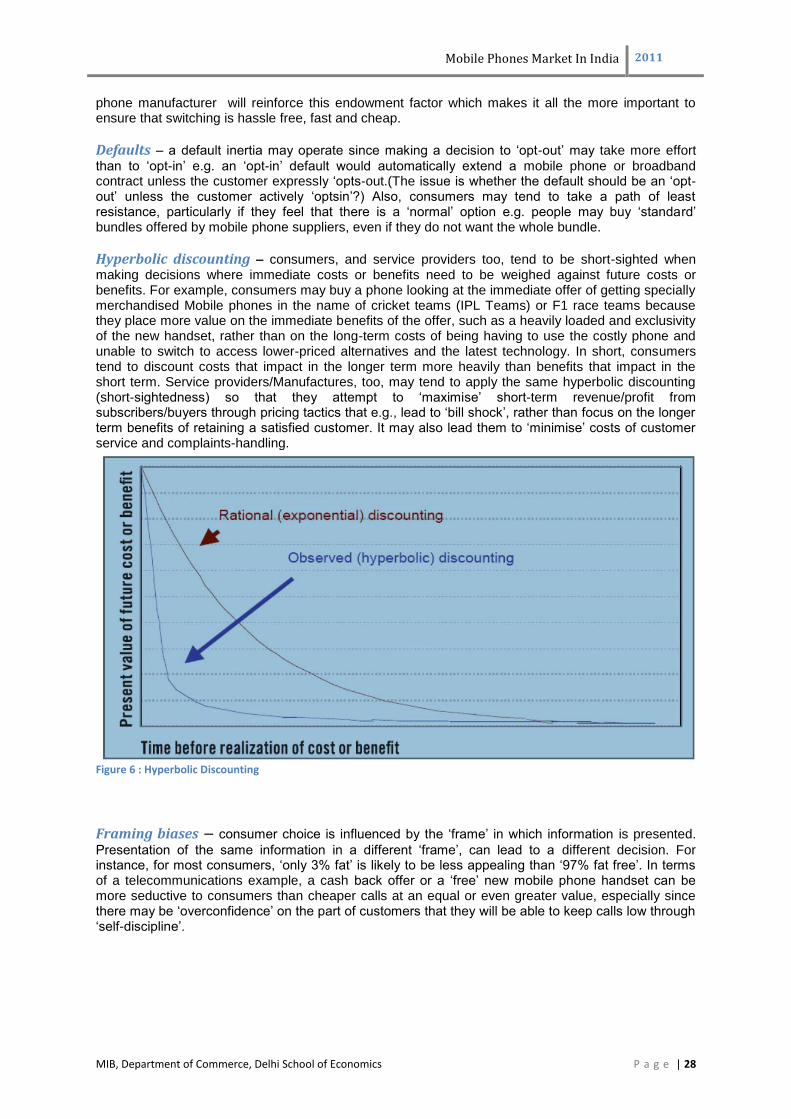
Mobile Phones Market In India 2011
MIB, Department of Commerce, Delhi School of Economics P a g e | 28
phone manufacturer will reinforce this endowment factor which makes it all the more important to ensure that switching is hassle free, fast and cheap.
Defaults – a default inertia may operate since making a decision to ‗opt-out‘ may take more effort
than to ‗opt-in‘ e.g. an ‗opt-in‘ default would automatically extend a mobile phone or broadband contract unless the customer expressly ‗opts-out.(The issue is whether the default should be an ‗opt-out‘ unless the customer actively ‗optsin‘?) Also, consumers may tend to take a path of least resistance, particularly if they feel that there is a ‗normal‘ option e.g. people may buy ‗standard‘ bundles offered by mobile phone suppliers, even if they do not want the whole bundle.
Hyperbolic discounting – consumers, and service providers too, tend to be short-sighted when making decisions where immediate costs or benefits need to be weighed against future costs or benefits. For example, consumers may buy a phone looking at the immediate offer of getting specially merchandised Mobile phones in the name of cricket teams (IPL Teams) or F1 race teams because they place more value on the immediate benefits of the offer, such as a heavily loaded and exclusivity of the new handset, rather than on the long-term costs of being having to use the costly phone and unable to switch to access lower-priced alternatives and the latest technology. In short, consumers tend to discount costs that impact in the longer term more heavily than benefits that impact in the short term. Service providers/Manufactures, too, may tend to apply the same hyperbolic discounting (short-sightedness) so that they attempt to ‗maximise‘ short-term revenue/profit from subscribers/buyers through pricing tactics that e.g., lead to ‗bill shock‘, rather than focus on the longer term benefits of retaining a satisfied customer. It may also lead them to ‗minimise‘ costs of customer service and complaints-handling.
Figure 6 : Hyperbolic Discounting
Framing biases – consumer choice is influenced by the ‗frame‘ in which information is presented.
Presentation of the same information in a different ‗frame‘, can lead to a different decision. For instance, for most consumers, ‗only 3% fat‘ is likely to be less appealing than ‗97% fat free‘. In terms of a telecommunications example, a cash back offer or a ‗free‘ new mobile phone handset can be more seductive to consumers than cheaper calls at an equal or even greater value, especially since there may be ‗overconfidence‘ on the part of customers that they will be able to keep calls low through ‗self-discipline‘.
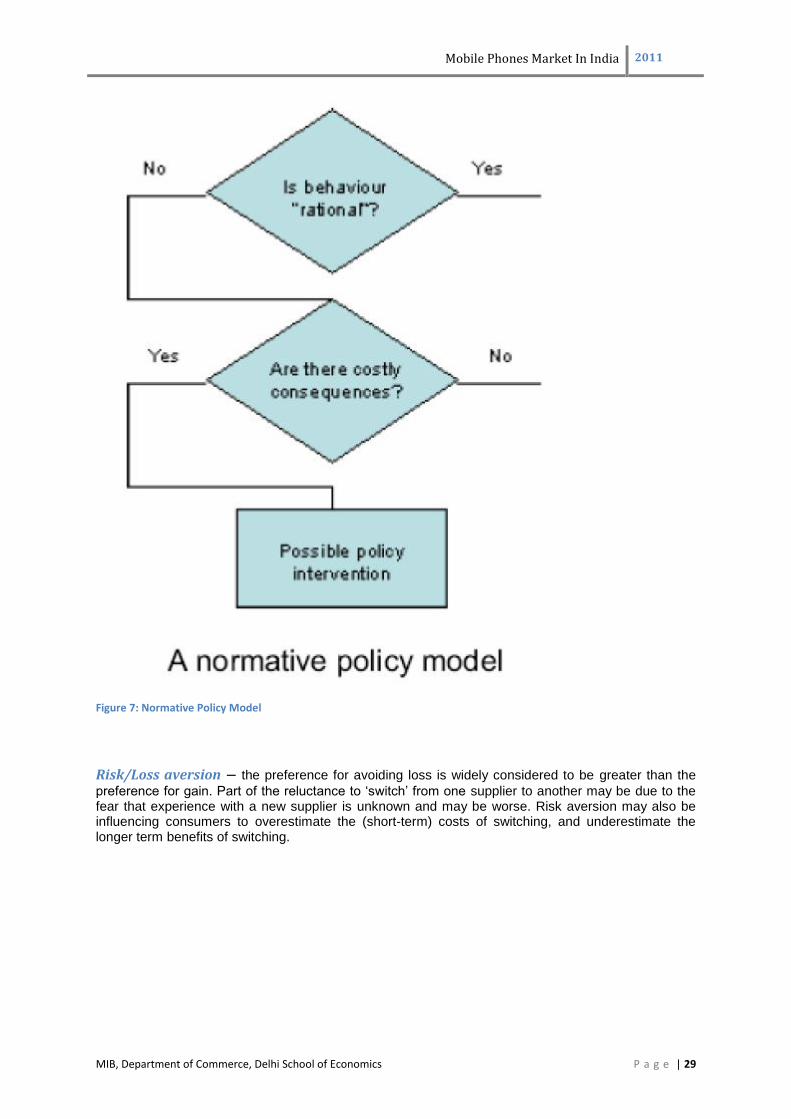
Mobile Phones Market In India 2011
MIB, Department of Commerce, Delhi School of Economics P a g e | 29
Figure 7: Normative Policy Model
Risk/Loss aversion – the preference for avoiding loss is widely considered to be greater than the
preference for gain. Part of the reluctance to ‗switch‘ from one supplier to another may be due to the fear that experience with a new supplier is unknown and may be worse. Risk aversion may also be influencing consumers to overestimate the (short-term) costs of switching, and underestimate the longer term benefits of switching.
Mobile Phones Market In India 2011
MIB, Department of Commerce, Delhi School of Economics P a g e | 30
APPENDIX A: Primary Survey Questions
1 Current City of Residence
2 Your Age
3 Gender
4 Occupation/Profession
5 Income Level (per month in INR)
6 How many phones do you have
7a Rank the features according your priority - Durability
7b Rank the features according your priority - Camera Features
7c Rank the features according your priority - User Friendliness
7d Rank the features according your priority - Sound Quality
7e Rank the features according your priority - Warranty Period
7f Rank the features according your priority - Battery Life
7g Rank the features according your priority - Internet Browsing
7h Rank the features according your priority - Email Sync Application
7i Rank the features according your priority - Social Networking
7j Rank the features according your priority - GPS
8 Which phone do you use
9 How often do you replace your old phone with a new phone
10a Tell us which Mobile brand satisfy a feature the best way possible - Durability
10b Tell us which Mobile brand satisfy a feature the best way possible - User friendliness
10c Tell us which Mobile brand satisfy a feature the best way possible - Email Sync
10d Tell us which Mobile brand satisfy a feature the best way possible - Internet Browsing
10e Tell us which Mobile brand satisfy a feature the best way possible - Social Networking application
10f Tell us which Mobile brand satisfy a feature the best way possible - Value for Money
10g Tell us which Mobile brand satisfy a feature the best way possible - GPS and other high end technologies
10h Tell us which Mobile brand satisfy a feature the best way possible - Voice and Sound Quality
10i Tell us which Mobile brand satisfy a feature the best way possible - Music playing features
10j Tell us which Mobile brand satisfy a feature the best way possible - Camera Features and Quality
11 What is your main internet access method
12 Which brand/(s) serve the purpose of giving the best smart phone
13a Say would you desire these new features or not - A feature on my mobile phone that would allow me to physically locate my friends and for them to locate me
13b Say would you desire these new features or not - A feature on my mobile/cellular phone that would allow me to locate shops, restaurants, hotels, etc, within a specifified radius of my location
13c Say would you desire these new features or not - The ability to move my music, television shows, pod casts, movies, etc. to my mobile phone without storage problems
13d Say would you desire these new features or not - The ability to access product information for a product I am interested in buying by simply scanning a bar code with my mobile-phone
13e Say would you desire these new features or not - Books, magazines and newspapers will all be available online to download onto your mobile
13f Say would you desire these new features or not - Watching 3-D Video in my mobile
14 Any other comments or future expectations you would like to share about Mobile Phone market and Industry - Open-Ended Response
Mobile Phones Market In India 2011
MIB, Department of Commerce, Delhi School of Economics P a g e | 31
APPENDIX B: BEHAVIORAL ECONOMICS SURVEY QUESTIONS
1 Please tell us the last two digits of your driving license number. If you do not have D/L, tell us last two digits of your passport. If you don't have that as well, tell us the last two digits of bank account number.
2 According to our recent market research our group found out that there is a revolutionary phone which is getting launched. With all the features below beside being a super cool phone. 1. Face Recognition 2. Voice Assisted GPS with advanced navigation using MQRS technology. 3. 3D Video Recording, 3D video playback and gaming without glasses. 4. Universal In- built remote to handle all devices in your home. 5. Lots of Hitech features like WiDi over Wi-Fi. Will you be willing to buy such a phone at cost of say the number in question one multiplied by 1000 rupees. ( If the number is 23, will you be willing to pay 23k for this phone)
2(a) Yes
2(b) No
3 What is the maximum money that you can shell out for this phone. ( In thousands of rupees.)
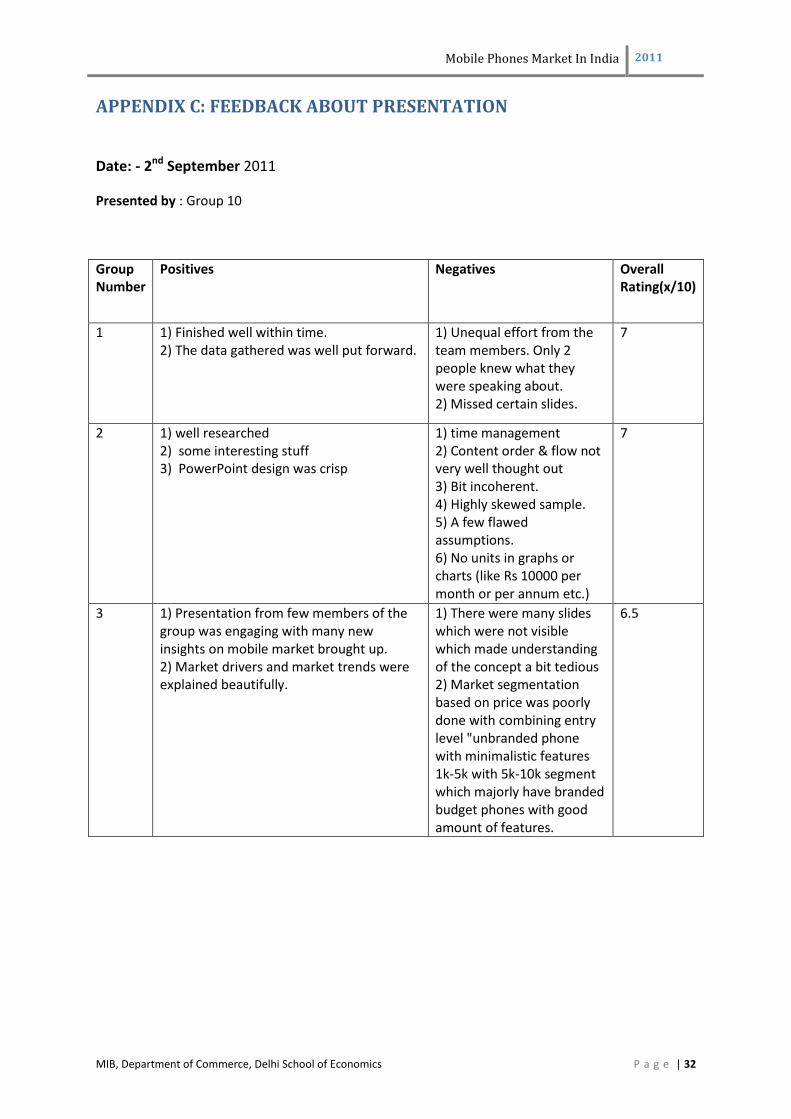
Mobile Phones Market In India 2011
MIB, Department of Commerce, Delhi School of Economics P a g e | 32
APPENDIX C: FEEDBACK ABOUT PRESENTATION
Date: - 2nd September 2011
Presented by : Group 10
Group Number
Positives Negatives Overall Rating(x/10)
1 1) Finished well within time. 2) The data gathered was well put forward.
1) Unequal effort from the team members. Only 2 people knew what they were speaking about. 2) Missed certain slides.
7
2 1) well researched 2) some interesting stuff 3) PowerPoint design was crisp
1) time management 2) Content order & flow not very well thought out 3) Bit incoherent. 4) Highly skewed sample. 5) A few flawed assumptions. 6) No units in graphs or charts (like Rs 10000 per month or per annum etc.)
7
3 1) Presentation from few members of the group was engaging with many new insights on mobile market brought up. 2) Market drivers and market trends were explained beautifully.
1) There were many slides which were not visible which made understanding of the concept a bit tedious 2) Market segmentation based on price was poorly done with combining entry level "unbranded phone with minimalistic features 1k-5k with 5k-10k segment which majorly have branded budget phones with good amount of features.
6.5
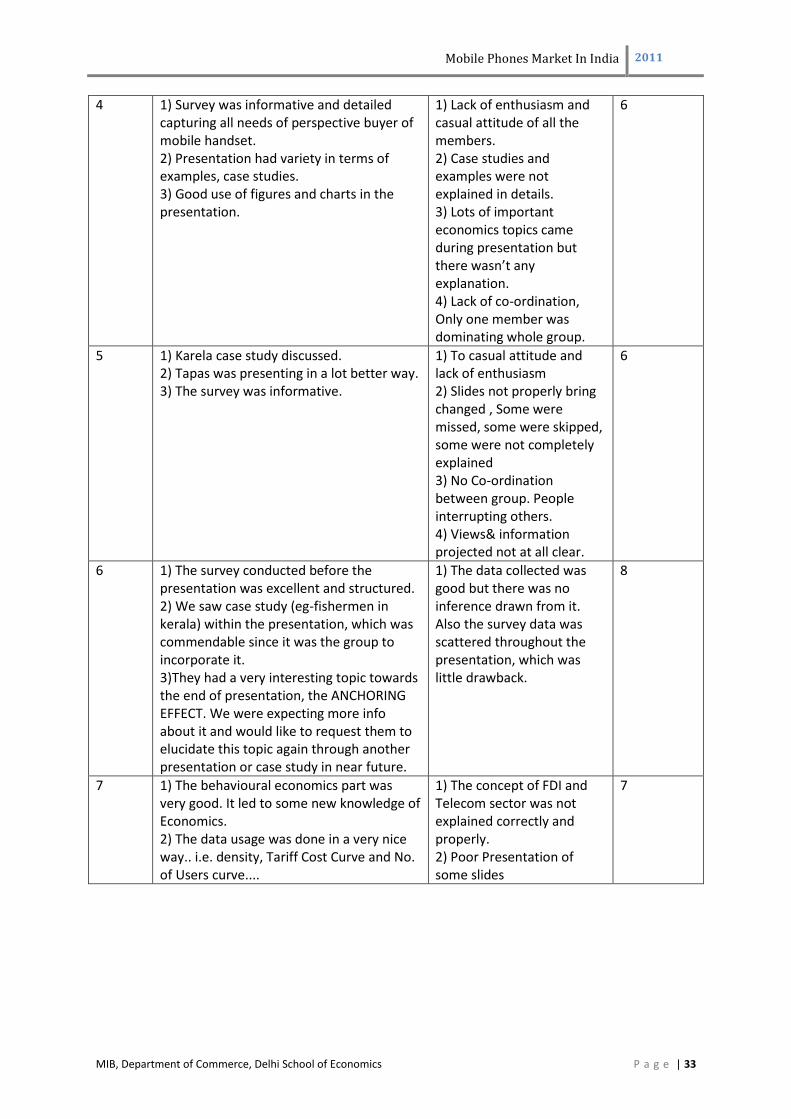
Mobile Phones Market In India 2011
MIB, Department of Commerce, Delhi School of Economics P a g e | 33
4 1) Survey was informative and detailed capturing all needs of perspective buyer of mobile handset. 2) Presentation had variety in terms of examples, case studies. 3) Good use of figures and charts in the presentation.
1) Lack of enthusiasm and casual attitude of all the members. 2) Case studies and examples were not explained in details. 3) Lots of important economics topics came during presentation but there wasn’t any explanation. 4) Lack of co-ordination, Only one member was dominating whole group.
6
5 1) Karela case study discussed. 2) Tapas was presenting in a lot better way. 3) The survey was informative.
1) To casual attitude and lack of enthusiasm 2) Slides not properly bring changed , Some were missed, some were skipped, some were not completely explained 3) No Co-ordination between group. People interrupting others. 4) Views& information projected not at all clear.
6
6 1) The survey conducted before the presentation was excellent and structured. 2) We saw case study (eg-fishermen in kerala) within the presentation, which was commendable since it was the group to incorporate it. 3)They had a very interesting topic towards the end of presentation, the ANCHORING EFFECT. We were expecting more info about it and would like to request them to elucidate this topic again through another presentation or case study in near future.
1) The data collected was good but there was no inference drawn from it. Also the survey data was scattered throughout the presentation, which was little drawback.
8
7 1) The behavioural economics part was very good. It led to some new knowledge of Economics. 2) The data usage was done in a very nice way.. i.e. density, Tariff Cost Curve and No. of Users curve....
1) The concept of FDI and Telecom sector was not explained correctly and properly. 2) Poor Presentation of some slides
7
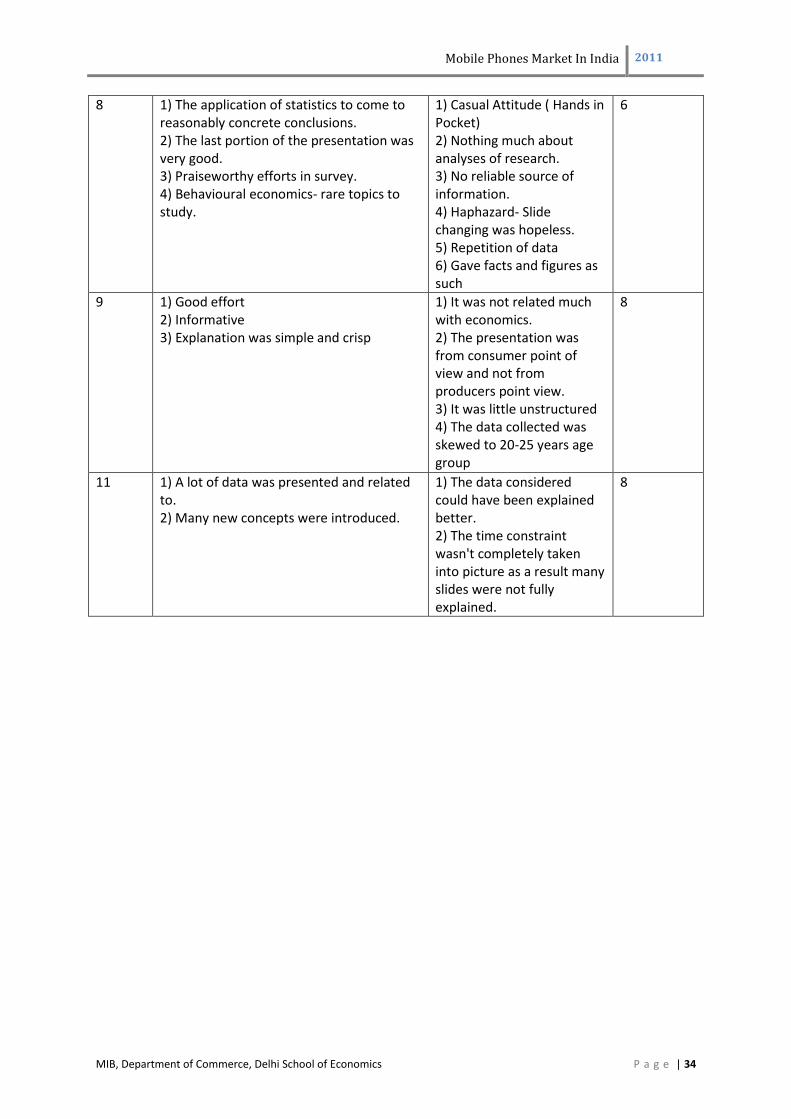
Mobile Phones Market In India 2011
MIB, Department of Commerce, Delhi School of Economics P a g e | 34
8 1) The application of statistics to come to reasonably concrete conclusions. 2) The last portion of the presentation was very good. 3) Praiseworthy efforts in survey. 4) Behavioural economics- rare topics to study.
1) Casual Attitude ( Hands in Pocket) 2) Nothing much about analyses of research. 3) No reliable source of information. 4) Haphazard- Slide changing was hopeless. 5) Repetition of data 6) Gave facts and figures as such
6
9 1) Good effort 2) Informative 3) Explanation was simple and crisp
1) It was not related much with economics. 2) The presentation was from consumer point of view and not from producers point view. 3) It was little unstructured 4) The data collected was skewed to 20-25 years age group
8
11 1) A lot of data was presented and related to. 2) Many new concepts were introduced.
1) The data considered could have been explained better. 2) The time constraint wasn't completely taken into picture as a result many slides were not fully explained.
8
Mobile Phones Market In India 2011
MIB, Department of Commerce, Delhi School of Economics P a g e | 35
BIBLIOGRAPHY
Ariel Rubinstein:
Discussion of “BEHAVIORAL ECONOMICS”.
In Advances in Economics and Econometrics ,Theory and Applications, Ninth World Congress.
Cherie Blair Foundation for Women:
Women and Mobile: A Global Opportunity.
Cherie Blair Foundation for Women. Available online at http://www.cherieblairfoundation.org/our-
work/mobile-technology-programme/women-and-mobile-a-global-opportunity.
Colin F. Camerer, George Loewenstein and Matthew Rabin (2003):
Advances in Behavioral Economics:
Princeton University Press.
Department of Telecom:
India Telecom Vertical Report 2010.
Available online at www.dot.gov.in.
Dr Patrick Xavier (2011):
Behavioural_Econ_and_Customer_complaints_research report.
Available online at http://engage.acma.gov.au/reconnecting/wp-
content/uploads/2011/05/Behavioural_Econ_and_Customer_complaints_research-report_FINAL.pdf,
updated on 30/05/2011.

Mobile Phones Market In India 2011
MIB, Department of Commerce, Delhi School of Economics P a g e | 36
Gentzoglanis, A. &. Henten A. Elgar June (Ed.) (2010):
Regulation and the Evolution of the Global Telecommunications Industry.
Hal R. Varian (2008):
Intermediate Microeconomics. A Modern Approach.
Eigth Edition: East-West Press.
Manjari Juneja:
http://www.expresscomputeronline.com.
Available online at http://www.expresscomputeronline.com/20110515/coverstory01.shtml.
Mera Mobile Mera Saathi:
Uninor and GSMA mWomen launch mobile advocacy campaign in Uttar
Pradesh.
GSMA mWomen.
P.Antoine (2010):
Mobile phone market drivers.
Available online at www.privateline.com/archive/alcaatel.pdf.
Sheena S. Iyengar and Mark R. Lepper (2000):
When choice is demotivating: can one desire too much of a good thing?
In Journal of Personality and Social Psychology.
Vodafone:
Studies and Policy paper- Vodafone.
Available online at
http://www.vodafone.com/content/index/about/about_us/policy/policy_papers.html.
Mobile Phones Market In India 2011
MIB, Department of Commerce, Delhi School of Economics P a g e | 37
Xavier, Patrick (2010):
Behavioural Economics & Telecommunications Policy. In A. &. Henten A. Elgar
June Gentzoglanis (Ed.): Regulation and the Evolution of the Global
Telecommunications Industry.