Embed Size (px)
Citation preview

MOBILE PHONE PULSE OXIMETER
A Thesis Presented
By
Paul Aaron Bohn
to
The Department of Electrical and Computer Engineering
in partial fulfillment of the requirements for the degree of
Master of Science
in the field of
Electrical Engineering
Northeastern University Boston, Massachusetts
May 2015

iii
DEDICATION
To my wife Erin and to my family for their life long support of all my engineering endeavors.

iv
ACKNOWLEDGMENTS I would like to thank the following individuals for their support: Prof. Mark Niedre my thesis advisor for his guidance and for allowing me work independently towards mutual goals. Prof. Gunar Schirner for helping with brainstorming and providing resources to the project. J.P. Laine, my group leader at the Charles Stark Draper Laboratory, Inc., for his encouragement to continue my pursuit of education and for his constant career mentoring. Walter Foley, a colleague, for his friendship and for sharing some of the knowledge that he obtained over his forty-plus year career in engineering. Mary Beth Weissman, Elaine Arnold, and Steve Panagakos at Precision Graphics Inc. for assembling the prototype printed circuit boards. Janki Bhimani and Phanindhar Repala for their contributions towards the development of an Android application. The Senior Capstone Group consisting of Dan Thompson, Dan Abel, Dan Huehner, Hunt Graham, Portia Stephens, and Kerrianne O'Brien for continuing the project after my thesis work and taking it to the next level.

v
TABLE OF CONTENTS
LIST OF TABLES ............................................................................................................................... vii
LIST OF FIGURES ............................................................................................................................ viii
LIST OF ACRONYMS .......................................................................................................................... x
ABSTRACT ....................................................................................................................................... xii
CHAPTER 1: INTRODUCTION ............................................................................................................ 1
1.1 Overview ................................................................................................................................ 1
1.2 Intro to Pulse Oximetry .......................................................................................................... 1
1.3 Low Cost P-Ox for the Developing World ............................................................................ 3
1.4 Proposed / Design .................................................................................................................. 4
1.5 Candidates Contribution ........................................................................................................ 5
CHAPTER 2: SYSTEM DESIGN ........................................................................................................... 6
2.1 Design Goals .......................................................................................................................... 6
2.2 System Architecture ............................................................................................................... 9
2.3 System Behavior .................................................................................................................. 13
2.3.1 MCU ............................................................................................................................. 13
2.3.2 Mobile Phone Application ............................................................................................ 14
CHAPTER 3: HARDWARE DESIGN ................................................................................................... 19
3.1 Audio Breakout Board Description ...................................................................................... 19
3.2 Testbed Board Design Description ...................................................................................... 21
3.2.1 Probes ............................................................................................................................ 22
3.2.2 Microcontroller ............................................................................................................. 22

vi
3.2.3 Audio Communication .................................................................................................. 23
3.2.4 Power Management ...................................................................................................... 23
CHAPTER 4: SOFTWARE DESIGN .................................................................................................... 25
4.1 Testbed Code ....................................................................................................................... 25
CHAPTER 5: TESTING AND ANALYSIS ............................................................................................. 28
5.1 Test Setup One ..................................................................................................................... 28
5.1.1 Hardware ....................................................................................................................... 28
5.1.2 Software ........................................................................................................................ 30
5.1.3 Testing and Analysis ..................................................................................................... 32
5.2 Test Setup Two .................................................................................................................... 42
5.2.1 Hardware ....................................................................................................................... 42
5.2.2 Software ........................................................................................................................ 44
5.2.3 Testing and Analysis ..................................................................................................... 45
CHAPTER 6: CONCLUSION .............................................................................................................. 51
REFERENCES ................................................................................................................................... 53
APPENDIX ....................................................................................................................................... 54
I. SCHEMATIC ................................................................................................................................. 55
II. BILL OF MATERIALS .................................................................................................................... 60
III. PCB LAYOUTS ............................................................................................................................ 65
IV. ELECTRONICS CALCULATIONS ................................................................................................... 73
V. MATLAB SCRIPTS ........................................................................................................................ 82
VI. WORK BREAKDOWN STRUCTURE ............................................................................................. 90
VII. WORK STATUS UPDATES ....................................................................................................... 101
VIII. PART NUMBERING SYSTEM .................................................................................................. 119
ABOUT THE AUTHOR.................................................................................................................... 121

vii
LIST OF TABLES Table 1: General Design Goals ........................................................................................................ 6
Table 2: Specific Design Goals ........................................................................................................ 8
Table 3: Pulse Oximeter Device Components ............................................................................... 10
Table 4: Mobile Phone Components .............................................................................................. 11
Table 5: Mobile Phone Pulse Oximeter Testbed Board Feature List ............................................. 24
Table 6: Variable Descriptions For pox.m ..................................................................................... 26

viii
LIST OF FIGURES Figure 1: Molar Extinction Coefficient for Hemoglobin in Water vs. Wavelength ........................ 2
Figure 2: System Diagram ............................................................................................................. 12
Figure 3: MCU Firmware Component Diagram ............................................................................ 13
Figure 4: Mobile Phone Functional Diagram with Android Application Components ................. 15
Figure 5: Pictorial Start-Up Instructions ........................................................................................ 16
Figure 6: Conceptual GUI (Top Left) Loading Screenshot (Top Right) Icon (Bottom Left)
Android GUI Prototype (Bottom Right) Early Interface ............................................................... 17
Figure 7: Audio Breakout Board .................................................................................................... 20
Figure 8: Audio Breakout Board Close Up .................................................................................... 21
Figure 9: Mobile Phone Pulse Oximeter Testbed .......................................................................... 22
Figure 10: Silicon Labs EFM32TG MCU Tiny Gecko Starter Kit ................................................ 23
Figure 11: Test Setup One Block Diagram .................................................................................... 29
Figure 12: Test Setup One Components ........................................................................................ 29
Figure 13: AFE4400SPO2EVM Evaluation Board with SPI Lead Wires ..................................... 30
Figure 14: Texas Instruments AFE44x0SPO2EVM GUI .............................................................. 31
Figure 15: Total Phase Data Center GUI ....................................................................................... 31
Figure 16: Percent SpO2 & HR Display ........................................................................................ 32
Figure 17: ADC Capture & Analysis ............................................................................................. 33
Figure 18: Save Data to CSV File .................................................................................................. 34
Figure 19: Save Low Level Configuration .................................................................................... 35
Figure 20: Oscilloscope Capture SPI SCLK Frequency & Period ................................................ 36
Figure 21: Register Setting Screen Capture from AFE44x0SPO2EVM GUI ............................... 37
Figure 22: Register Setting Screen Capture from Protocol Analyzer GUI Data Center ................ 37
Figure 23: Oscilloscope Read Register LED2STC Address: 0x0A Data: 0x17C0 ........................ 37
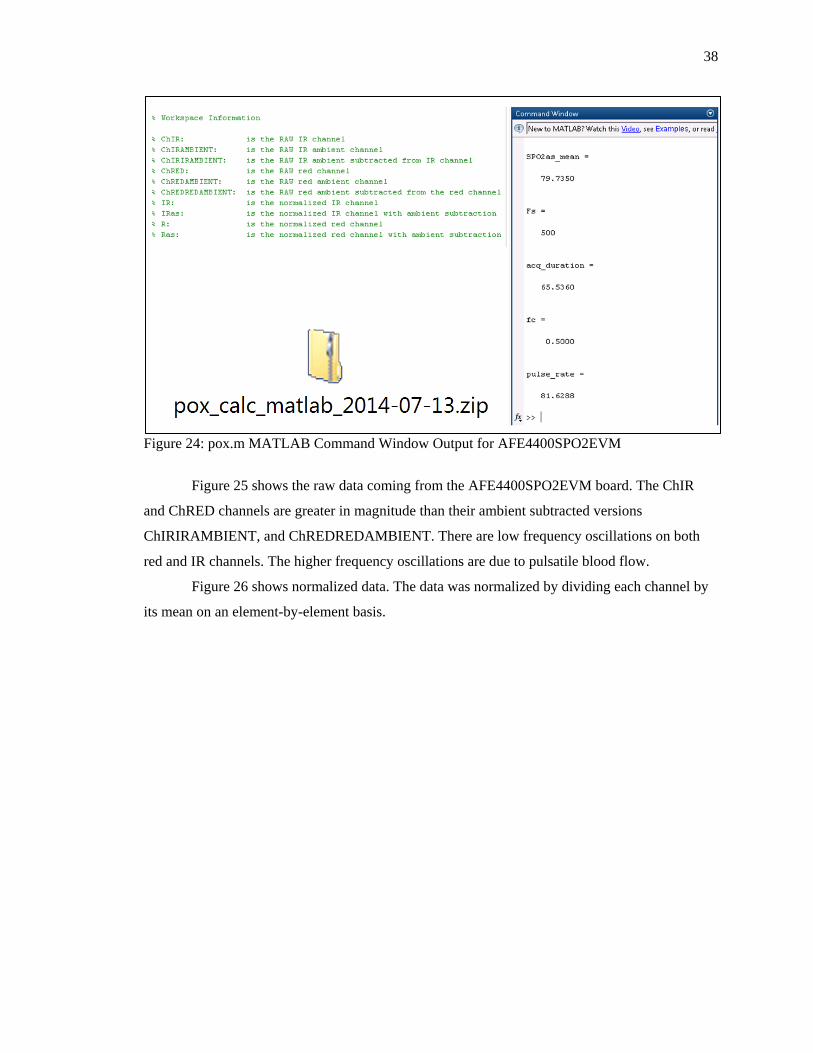
Figure 24: pox.m MATLAB Command Window Output for AFE4400SPO2EVM ..................... 38
Figure 25: RAW Data from AFE4400SPO2EVM ......................................................................... 39
Figure 26: Normalized Data from AFE4400SPO2EVM ............................................................... 39
ix
Figure 27: SpO2 (red); SpO2 Ambient Subtraction (blue) from AFE4400SPO2EVM ................. 40
Figure 28: High Pass Filter Response ............................................................................................ 41
Figure 29: IR Ambient Subtraction Before (red); After Filter (blue) from AFE4400SPO2EVM . 42
Figure 30: Test Setup Two Block Diagram ................................................................................... 43
Figure 31: Hardware Setup Two Pulse Oximeter Testbed & Silicon Labs MCU ......................... 43
Figure 32: Pulse Oximeter Testbed Close Up ................................................................................ 44
Figure 33: Data Flow Diagram ...................................................................................................... 45
Figure 34: pox.m MATLAB Command Window Output for Testbed .......................................... 46
Figure 35: RAW Data from Testbed .............................................................................................. 47
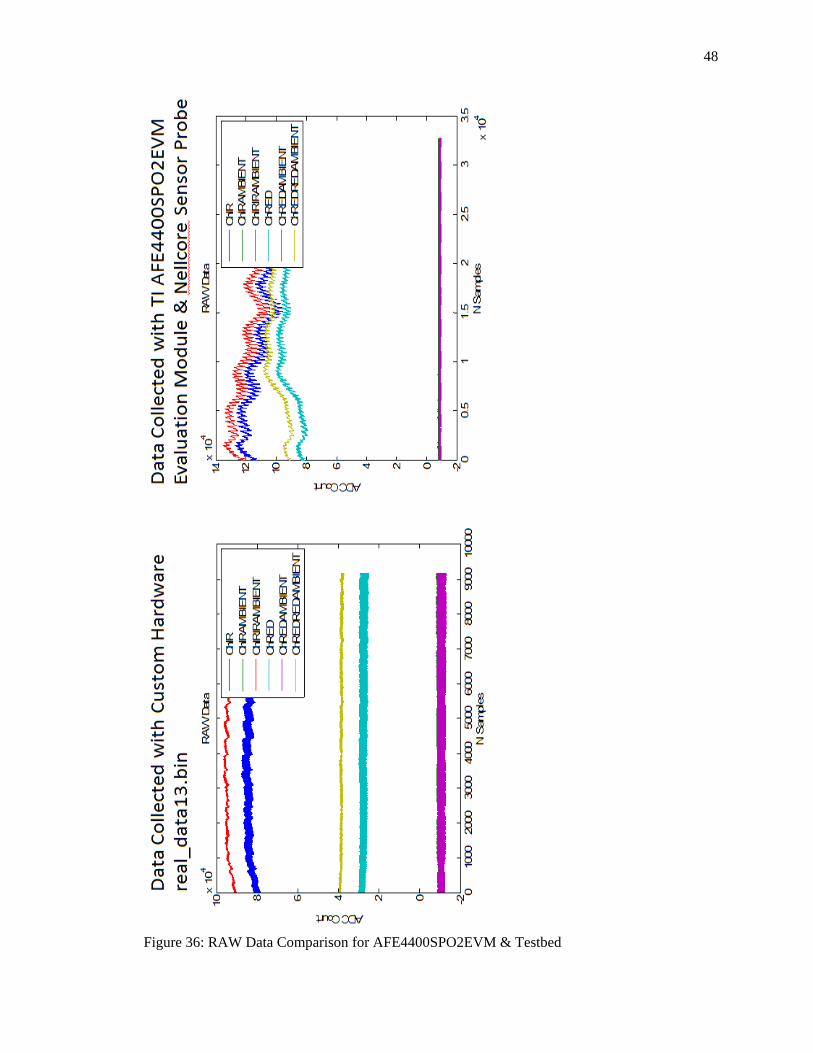
Figure 36: RAW Data Comparison for AFE4400SPO2EVM & Testbed ...................................... 48
Figure 37: Normalized Data from Testbed .................................................................................... 49
Figure 38: Calculated SpO2 (red) SpO2 Ambient Subtraction (blue) from Testbed ..................... 50
Figure 39: IR Ambient Subtraction Before Filter (red); After Filter (blue) from Testbed ............ 50
Figure 40: Android Application Hardware Demo by Undergraduate Capstone Team .................. 51

x
LIST OF ACRONYMS ADC Analog to Digital Converter
AFE Analog Front-End
AGC Automatic Gain Control
COTS Commercial off-the-shelf
CS Chip Select
CSV Comma separated values
DAC Digital to Analog Converter
ECG Electrocardiogram
GPIO General Purpose Input Output
GUI Graphical User Interface
HR Heart Rate
Hb Deoxyhemoglobin
HbO2 Oxyhemoglobin
LED Light Emitting Diode
MCU Microcontroller Unit
MISO Master Input Slave Output
MOSI Master Output Slave Input
NIR Near Infrared
PC Personal Computer
PCB Printed Circuit Board
Pleth Photoplethysmogram
Pox Pulse Oximeter
PR Pulse Rate
SCLK Serial Clock
SpO2 Blood Oxygen Saturation
SPI Serial Peripheral Interface Bus
SNR Signal-to-noise Ratio

xi
TIA Transimpedance Amplifier
USB Universal Serial Bus

xii
ABSTRACT
There is global demand for low cost medical care diagnostics, and too often these life-saving tools are unavailable to low-income countries and remote areas of the world. One example of such a device is a pulse oximeter: a vital instrument that measures blood oxygen saturation. A modern medical grade pulse oximeter is often physically large and requires training and access to a mains power. All such points are contrary to operation in a remote low-income locale. This project covers the design, fabrication, and testing of a testbed pulse oximeter that is targeted for use in the developing world. While developing areas may be lacking infrastructure, mobile phones are readily available. Mobile phones provide a source of power, computation, and access to information that was previously unavailable. By connecting through the headset jack, the testbed design utilizes the phone’s capabilities run a pulse oximeter. Data was acquired from the testbed and then analyzed with good results. Global access to point-of-care medical devices can be significantly improved with further use of mobile computing. This will lead to reductions in cost, increased portability, improved patient compliance, and expanded distribution of medical knowledge.

1
CHAPTER 1: INTRODUCTION
1.1 Overview
The objectives of the thesis are to i) create a record of a testbed pulse oximeter design
that is targeted for use in the developing world, ii) to freely distribute the design information, and
iii) to transfer the knowledge to the Northeastern University student body to continue the work.
1.2 Intro to Pulse Oximetry
A pulse oximeter is a device that measures blood oxygen saturation (SpO2) and pulse rate
(PR) which are important indicators of health. All organs need oxygen to function properly;
performing simple cognitive tasks becomes challenging within minutes after a loss of oxygen.
The heart and brain are particularly sensitive to a reduction in oxygen, and when those organs
begin to fail, risk of death rises dramatically (World Health Organization, 2011). The use of pulse
oximeters can greatly reduce the risk of death during medical procedures that require general
anaesthesia by monitoring a patient's blood oxygen level and intervening when the oxygen drops
below an acceptable range (World Health Organization, 2011).
A pulse oximeter indirectly measures blood oxygen saturation by gauging the color
intensity of blood (Texas Instruments, 2013). Color is an indicator of the amount of oxygen that is
in blood. Red blood cells contain a protein molecule called hemoglobin that transports oxygen
(World Health Organization, 2011). There are two types of hemoglobin: oxyhemoglobin is
hemoglobin combined with oxygen, and deoxyhemoglobin is hemoglobin that lacks oxygen.
Blood transports oxygen from the lungs and heart to the extremities where it is released into
tissues. In a cyclical fashion, oxygen lacking blood returns to the heart and lungs to be
oxygenated. Blood rich with oxyhemoglobin appears red because it filters most light from the
visual spectrum except for red light. The dashed line in figure 1 represents the light absorption of
oxyhemoglobin. The line sharply dips near the red (~660nm) portion of the visual spectrum; thus,
allowing red light to transmit and scatter through the blood. The solid line in figure 1 represents
the light absorption of deoxyhemoglobin (Hb). At the red wavelength of 660nm the
deoxyhemoglobin (Hb) absorption is much greater than oxyhemoglobin (HbO2). The additional
2
attenuation of light from the lower concentration of oxygen causes blood to become dark blue in
color. This explains why the skin of somebody who stops breathing starts to appear blue.
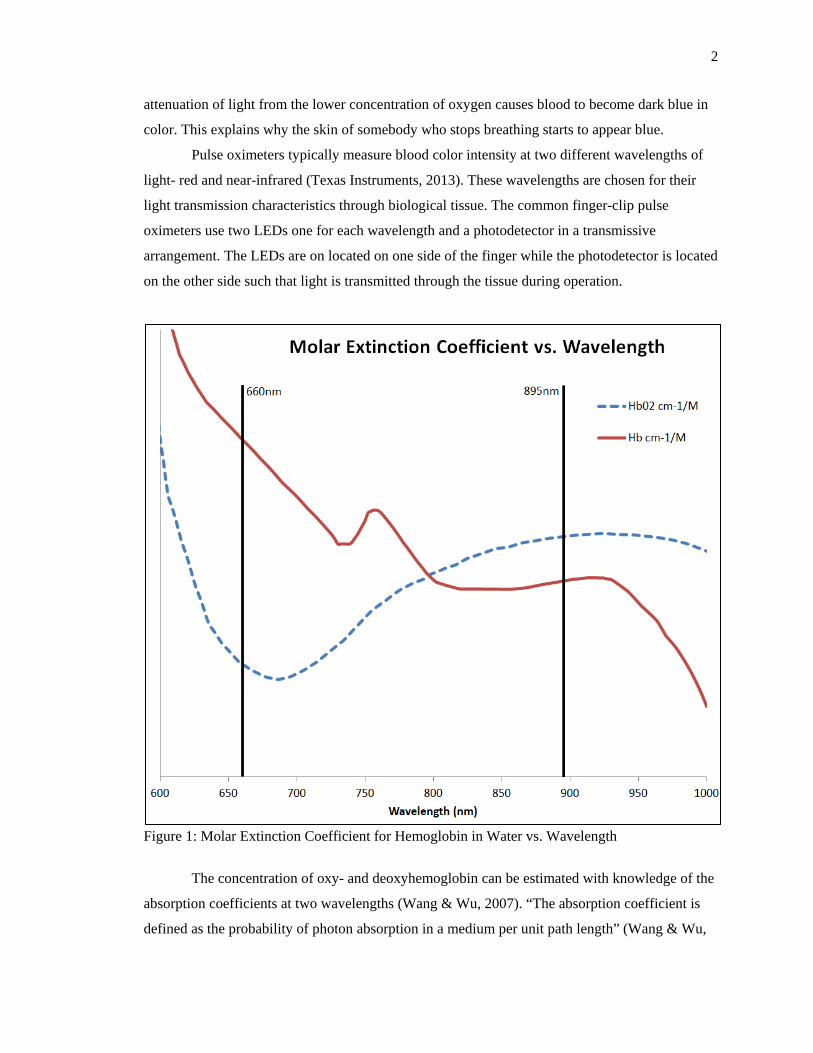
Pulse oximeters typically measure blood color intensity at two different wavelengths of
light- red and near-infrared (Texas Instruments, 2013). These wavelengths are chosen for their
light transmission characteristics through biological tissue. The common finger-clip pulse
oximeters use two LEDs one for each wavelength and a photodetector in a transmissive
arrangement. The LEDs are on located on one side of the finger while the photodetector is located
on the other side such that light is transmitted through the tissue during operation.
Figure 1: Molar Extinction Coefficient for Hemoglobin in Water vs. Wavelength
The concentration of oxy- and deoxyhemoglobin can be estimated with knowledge of the
absorption coefficients at two wavelengths (Wang & Wu, 2007). “The absorption coefficient is
defined as the probability of photon absorption in a medium per unit path length” (Wang & Wu,

3
2007). Figure 1 has two vertical lines that intersect with the molar extinction coefficient curves.
One vertical line is at a wavelength of 660nm (red) and another at 895nm (NIR). An absorption
coefficient equation can be written for each of the wavelengths (Wang & Wu, 2007). The
equations are in terms of wavelength molar extinction coefficients and molar concentration of
oxy- and deoxyhemoglobin (Wang & Wu, 2007). The two equations make up a system with two
unknowns variables. Once oxy- and deoxyhemoglobin is determined. Blood oxygen saturation
can be calculated by taking the ratio oxyhemoglobin to the total hemoglobin in the blood (Wang
& Wu, 2007).
Pulse oximeters often display blood volumetric pulse waveform over time, and report
pulse rate in beats per minute. This is called a pleth waveform, which is shorthand for
photoplethysmogram. The changing blood volume is determined by shining light through tissue
while sensing the returning light with a photodetector. Some of the light will be absorbed in a
periodic fashion as blood pulsates through the body causing a fluctuation in light intensity. The
pulsation of light is sensed by the photodetector then recorded and displayed by the device. The
device then calculates pulse rate by monitoring the number of pulses that occurred in a given
time.
Most pulse oximeters determine SpO2 from an empirical formula (Texas Instruments,
2013). First, the red and IR signals are normalized to remove the DC component caused by
biological tissue and bone. Second, a ratio of the red-IR normalized signals is taken. Third, a
calibration offset and scale factor is applied to the red-IR ratio to generate the resultant SpO2.
The scale factor and offset is empirically determined through calibration and is often stored in a
lookup table.
1.3 Low Cost P-Ox for the Developing World
In the developing world, there is a great need for low-cost point-of-care medical devices
such as pulse oximeters. The lack of infrastructure, reliable source of power, transportation, and
well trained medical workers makes it difficult, if not impossible, to deploy medical equipment
designed to operate in stable hospital conditions. Limited access to medical devices \in low-
income countries leads to lesser quality of life and shortened life spans.
[For example], children with very severe or severe pneumonia should usually be
treated in hospital, but many low-income and middle-income countries do not have a
sufficient number of hospital beds for this strategy. . . .

4
If pneumonia is combined with hypoxaemia, as happens in 13% of cases, children
are five-times more likely to die than are those with only pneumonia. Oxygen
concentrations should therefore be monitored and oxygen therapy should be made
available, but this approach is not always possible. Low-income and middle-income
countries need an estimated 1,000,000 pulse oximeters. (Howitt, et al., 2012)
Affordability of medical devices is of concern. Medical grade pulse oximeters can cost
hundreds or even thousands of US dollars. Low grade devices can be purchased for around 20 US
dollars, but may not meet medical standards or may not come with needed features for use in a
low income situation. Market analysis is required to obtain a true target cost that is viable for low-
income countries. One could imagine a scenario where some of the cost could be offset through
philanthropic means.
1.4 Proposed / Design
The testbed pulse oximeter design outlined in this thesis showcases an example of a
mobile phone turning it into a medical device. Mobile phones have many desirable characteristics
that make them well suited for the task. For example, they are readily available throughout the
world. As of May 2014, there were nearly seven billion mobile subscriptions worldwide
(MOBITHINKING, 2014). 5.4 billion of those subscribers are in the developing countries with a
90.2% market penetration (MOBITHINKING, 2014). Phones provide a reliable source of power.
This is directly achievable by harvesting energy from the phone. Indirectly, the phone’s charger
or a spare battery pack can serve as a power source. Mobile phones have ample computational
power and storage for many medical diagnostic applications. Mobile phones can provide an
avenue for telemedicine by storing data and sending diagnostic results to trained clinicians for
analysis and monitoring. Finally, phones can run applications to guide untrained users. These
applications can provide real-time feedback, medical advice, and operator instructions.
The audio headset jack offers a path to interface medical devices with a mobile phone
(Kuo, Verma, Schmid, & Dutta, 2010). University of Michigan’s Hijack project demonstrated
that data and power can be transferred over the common headset jack opening a method to
connect sensors to existing mobile phones. Drawing power from the headset jack eliminates the
need for batteries or alternate power sources thus keeping cost, size, and weight down. It reduces
the logistical need for batteries to keep the devices operating. Sending diagnostic results through
the audio headset jack forgoes the need for a proprietary data communication port. Almost all

5
mobile phones have a headset jack so it can serve a near universal solution for transmitting low
bandwidth data to a mobile phone. In addition, a modular platform could be developed around the
headset jack interface to add other sensor modalities such as EKG, temperature, blood pressure,
etc. (Kuo, Verma, Schmid, & Dutta, 2010). The remainder of this document addresses design
approaches for the development of a testbed pulse oximeter that is powered by and sends data
through a mobile phone audio headset jack.
1.5 Candidates Contribution
The effort to develop a pulse oximeter testbed was led by the thesis candidate and this
involved the management of fellow students. A summary of work for this project included: (1)
literature research and a design trade study, (2) electronics design and layout of two custom
circuit boards: a mobile phone audio breakout board test fixture and a testbed for pulse oximetry,
(3) the assembly of three breakout boards, (4) managed vendors and manufacturers for test
equipment, parts procurement, PCB manufacturing, and assembly work, (5) wrote MCU test
software in C language and analysis software in MATLAB, (6) wrote thorough technical and
programmatic documentation, (7) tested the hardware, (8) turned over a working example to a
Northeastern University undergraduate capstone group for future improvements.

6
CHAPTER 2: SYSTEM DESIGN
The pulse oximeter system design takes into account the unique environment, use cases,
and constraints presented with a design for the developing world. This chapter covers: (1) general
and specific design goals that were derived from an initial needs assessment, (2) several design
approaches that were considered, (3) a system architecture and behavioral model.
2.1 Design Goals
The needs assessment and design goals that are listed in tables 1 and 2 are forward
looking with the intention that the testbed described in this thesis will make an incremental step
towards meeting the goals listed in this chapter.
General Design Goals
Description
Public Acceptance ● The device must be accepted by users and medical providers of the developing world.
Safety ● The device must pose a very small safety risk to the users. This includes the use of non-hazardous materials/coatings, no choking hazards, no cutting hazards, no electrical hazards, etc.
Reliable ● The device must be very reliable during product lifetime and during operation.
Ease of Operation ● The device must be easily setup. This includes the uses of hardware and software
● The device will display user instructions in real-time.
Performance ● The device must operate in accordance with industry standards for pulse oximetry.
● The device may not perform at the same standards as a high-end medical device in favor for power savings, cost minimization, public acceptance, and ease of operation.
Table 1: General Design Goals
7
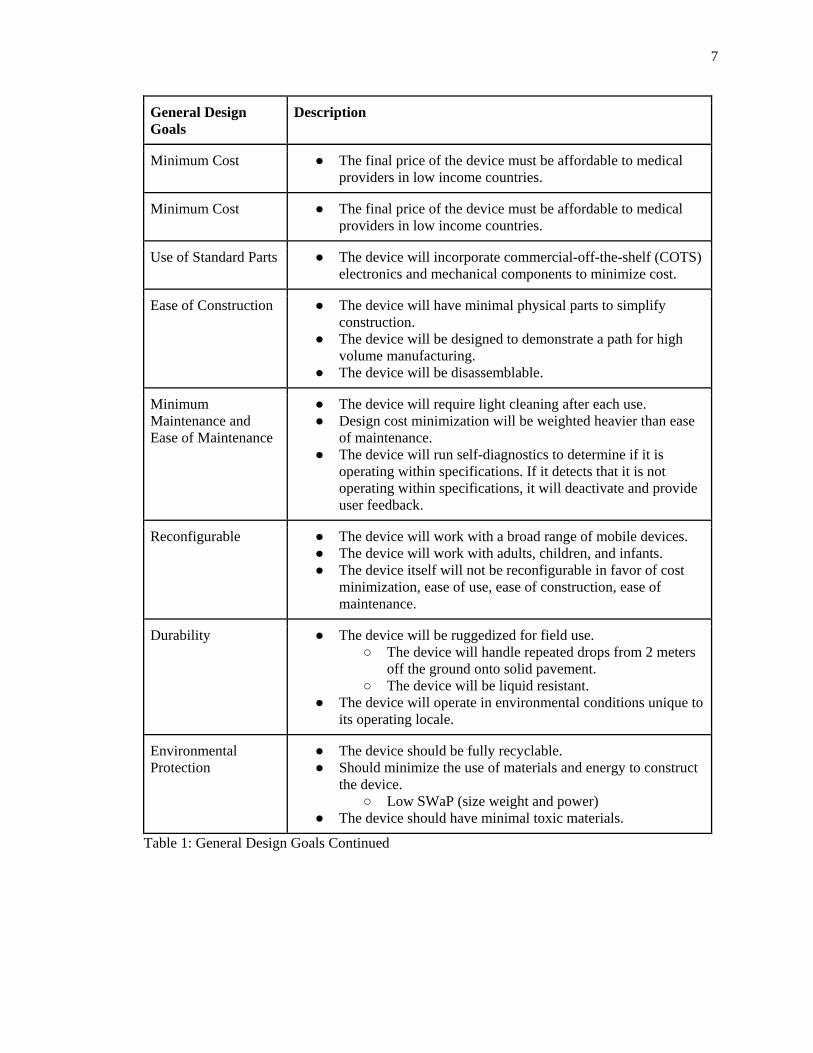
General Design Goals
Description
Minimum Cost ● The final price of the device must be affordable to medical providers in low income countries.
Minimum Cost ● The final price of the device must be affordable to medical providers in low income countries.
Use of Standard Parts ● The device will incorporate commercial-off-the-shelf (COTS) electronics and mechanical components to minimize cost.
Ease of Construction ● The device will have minimal physical parts to simplify construction.
● The device will be designed to demonstrate a path for high volume manufacturing.
● The device will be disassemblable.
Minimum Maintenance and Ease of Maintenance
● The device will require light cleaning after each use. ● Design cost minimization will be weighted heavier than ease
of maintenance. ● The device will run self-diagnostics to determine if it is
operating within specifications. If it detects that it is not operating within specifications, it will deactivate and provide user feedback.
Reconfigurable ● The device will work with a broad range of mobile devices. ● The device will work with adults, children, and infants. ● The device itself will not be reconfigurable in favor of cost
minimization, ease of use, ease of construction, ease of maintenance.
Durability ● The device will be ruggedized for field use. ○ The device will handle repeated drops from 2 meters
off the ground onto solid pavement. ○ The device will be liquid resistant.
● The device will operate in environmental conditions unique to its operating locale.
Environmental Protection
● The device should be fully recyclable. ● Should minimize the use of materials and energy to construct
the device. ○ Low SWaP (size weight and power)
● The device should have minimal toxic materials.
Table 1: General Design Goals Continued

8
Specific Design Goals
Description
Physical ● Finger size form factor ● Incorporate finger sensor (photodetector and LEDs) into device ● Robust cabling
Functional ● Must operate for the duration of a surgical procedure ● Audible feedback ● Alarm modes
○ High PR ○ Low PR ○ No PR ○ Desaturation
● Will operate in low power mode ○ Detect inactivity
● Will harvest energy from phone ● Compatible with as many mobile phones as possible ● Telemedicine ● Provide real-time help ● Bidirectional data transmission over mobile phone headset jack
Environmental ● Regional operating requirements
Economic ● Quantities in the thousands to hundred thousands
Legal ● Must meet most medical regulatory requirements as long as they do not interfere with high-level goals
● Open intellectual property ● Open source hardware and software
Human Factors & Ergonomics
● Compatible with adults and children
Table 2: Specific Design Goals

9
2.2 System Architecture
At the top level the system is comprised of a mobile phone and a pulse oximeter device.
The next layer down includes the components that make up the phone and the pulse oximeter
device. The final layer is made up of the software that runs on both devices.
Several design approaches and architectures were considered for the pulse oximeter
device. The design goal to reduce the overall system cost led to some ideas to use the mobile
phone’s audio circuitry to directly drive the pulse oximeter functionality with minimal
components. This approach would reduce the universality of the solution by limiting the different
types of phones that would work with the device. The pleth measurement performance would also
vary with the phone type.
Another approach was to design the pulse oximeter device circuitry using discrete
electronic components. This is certainly a valid approach that could be cost-effective depending
on parts selection. The disadvantages of this choice include an increase in the number of parts and
a modest increase in physical volume and complexity.
The approach that was selected for this thesis work included the use of a purpose-built
integrated circuit for pulse oximetry. This approach offers several advantages: increased pleth
measurement performance, a reduction in parts count, increased manufacturability, and the cost
drops significantly with volume. The disadvantages might include: a reliance on a single vendor
for the integrated circuit, and the unit cost for small production quantities. As of April 2015, the
current price for 2500 pieces of Texas Instruments part number AFE4490RHAR is 8.94 USD.
While the price may seem a little high, and it may be considered to be a disadvantage it is worth
mentioning that AFE4490 is a medical grade part that can be found in high end instruments. Also,
high production volume will offer a reduction in price and it is likely a business arrangement
could be made with Texas Instruments that would further the cause.

10
Tables 3 and 4 list the pulse oximeter device and mobile phone components for the
selected design approach.
Pulse Oximeter Component
Subcomponents Description
Printed Circuit Board
Photodetector, IR LED, & red LED Sensor probe
Analog front-end for pulse oximetry Detector, LED illumination, signal
digitization, and timing electronics
Microcontroller Provides SpO2 calculation, analog
front-end control, and serial data
communication
Power management electronics Power harvesting, regulation, &
storage
Enclosure Probe/Sensor Fixture Mechanical enclosure features that
holds LEDs and photodiodes
Finger Clip Hinge mechanism and enclosure
body
Data & Power Interface Cable Assembly
Shielded four conductor cable Cable assembly connects the mobile
phone to the pulse oximeter 3.5mm audio connector
Table 3: Pulse Oximeter Device Components

11
Mobile Phone Component
Description
Processor Provides computation power to process and display data.
Memory Provides data storage.
Display Provides graphical user interface.
Speakers Provides audible feedback to the user.
Data & Power Interface Audio jack provides data and power interface.
Radios Provides access to the internet and remote monitoring station.
Battery / Power Pack Provides power through an internal mobile phone battery or an external power pack.
Charger Mobile phone charger that can be solar, thermal or a standard wall adapter.
Table 4: Mobile Phone Components
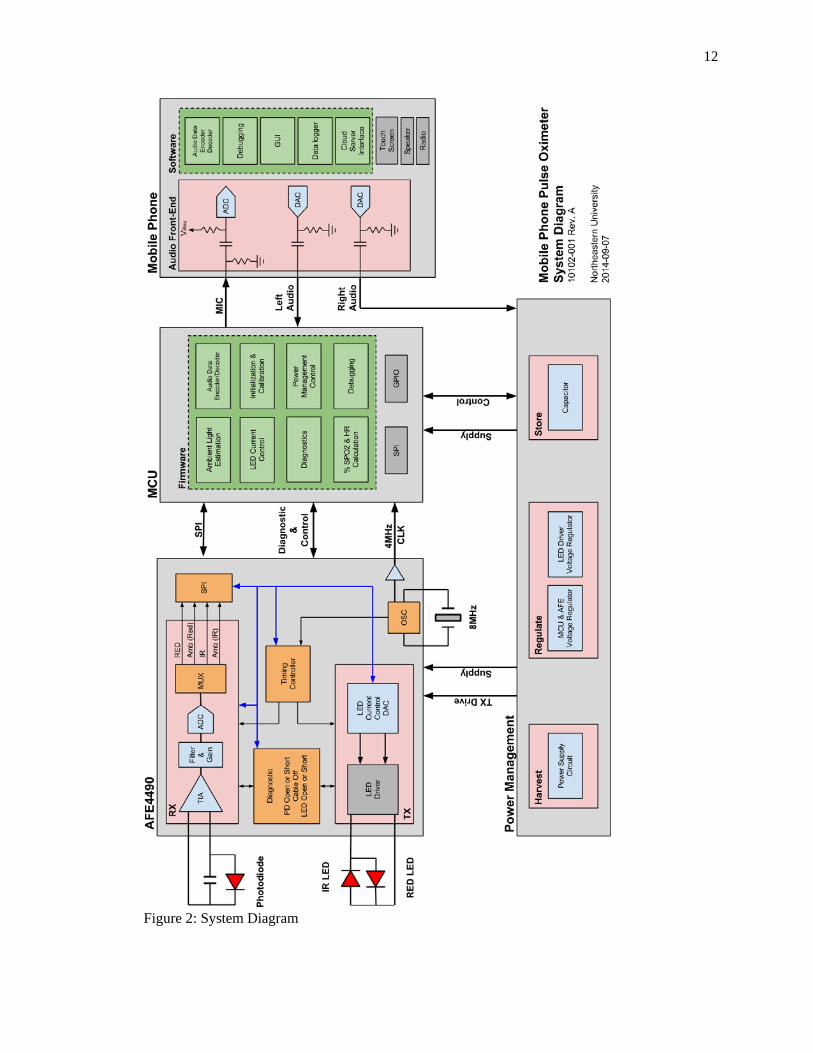
Figure 2 System Diagram shows interconnect between electronic components. This
includes the communications between the analog-front end, MCU and phone. The diagram shows
a phone’s right audio channel supplying the power management block with a power signal. The
power management block supplies power to the MCU and phone while the MCU has some
control authority over the power management block.
12
Figure 2: System Diagram

13
2.3 System Behavior
Much of the system behavior is defined by the device code. The code will include an
Android mobile phone application for user interface and microcontroller code for hardware
management.
2.3.1 MCU
The microcontroller firmware will have many components; most of which are shown in
Figure 3 MCU Firmware Component Diagram. There will be an initialization routine that occurs
during power up plus components for power management, diagnostics, and debugging. There will
also be two control loops: the first is for ambient light cancellation, the second is for automatic
gain control and LED output. There will be routines for calculating SpO2 and pulse rate (PR).
The SpO2 calibration data will be stored in MCU memory. The MCU will handle
communications between the AFE4490 analog front-end for pulse oximetry and the mobile
phone.
Figure 3: MCU Firmware Component Diagram
14
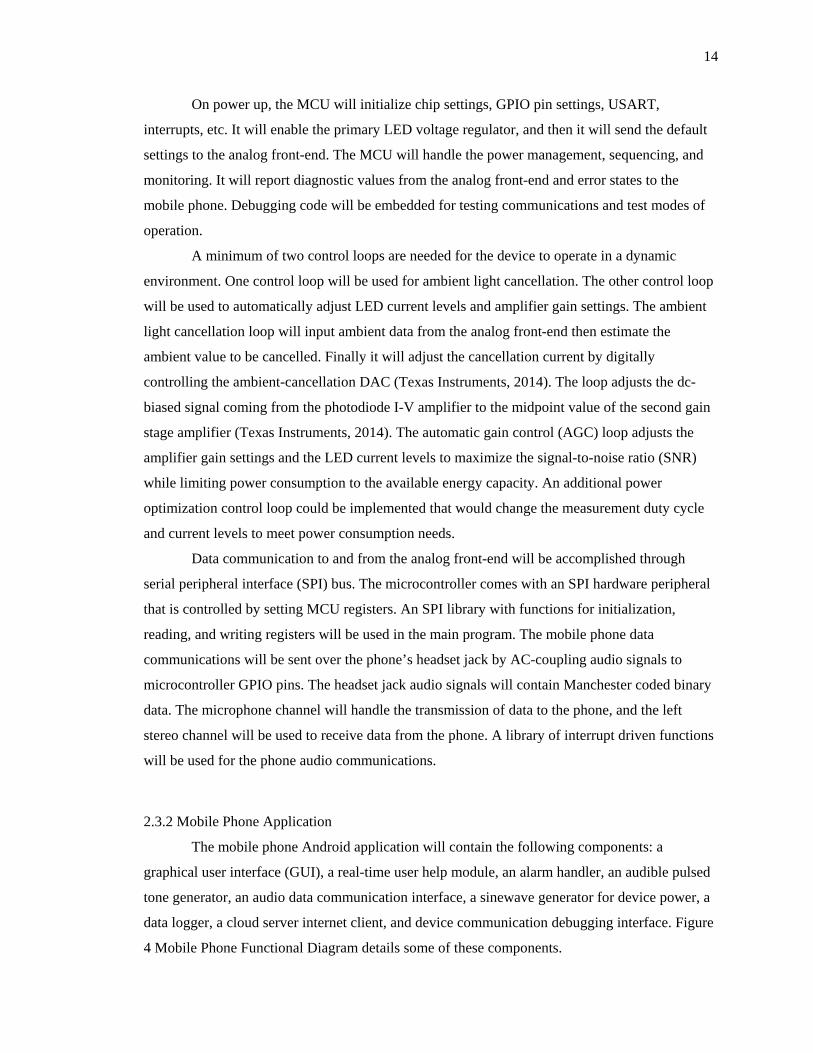
On power up, the MCU will initialize chip settings, GPIO pin settings, USART,
interrupts, etc. It will enable the primary LED voltage regulator, and then it will send the default
settings to the analog front-end. The MCU will handle the power management, sequencing, and
monitoring. It will report diagnostic values from the analog front-end and error states to the
mobile phone. Debugging code will be embedded for testing communications and test modes of
operation.
A minimum of two control loops are needed for the device to operate in a dynamic
environment. One control loop will be used for ambient light cancellation. The other control loop
will be used to automatically adjust LED current levels and amplifier gain settings. The ambient
light cancellation loop will input ambient data from the analog front-end then estimate the
ambient value to be cancelled. Finally it will adjust the cancellation current by digitally
controlling the ambient-cancellation DAC (Texas Instruments, 2014). The loop adjusts the dc-
biased signal coming from the photodiode I-V amplifier to the midpoint value of the second gain
stage amplifier (Texas Instruments, 2014). The automatic gain control (AGC) loop adjusts the
amplifier gain settings and the LED current levels to maximize the signal-to-noise ratio (SNR)
while limiting power consumption to the available energy capacity. An additional power
optimization control loop could be implemented that would change the measurement duty cycle
and current levels to meet power consumption needs.
Data communication to and from the analog front-end will be accomplished through
serial peripheral interface (SPI) bus. The microcontroller comes with an SPI hardware peripheral
that is controlled by setting MCU registers. An SPI library with functions for initialization,
reading, and writing registers will be used in the main program. The mobile phone data
communications will be sent over the phone’s headset jack by AC-coupling audio signals to
microcontroller GPIO pins. The headset jack audio signals will contain Manchester coded binary
data. The microphone channel will handle the transmission of data to the phone, and the left
stereo channel will be used to receive data from the phone. A library of interrupt driven functions
will be used for the phone audio communications.
2.3.2 Mobile Phone Application
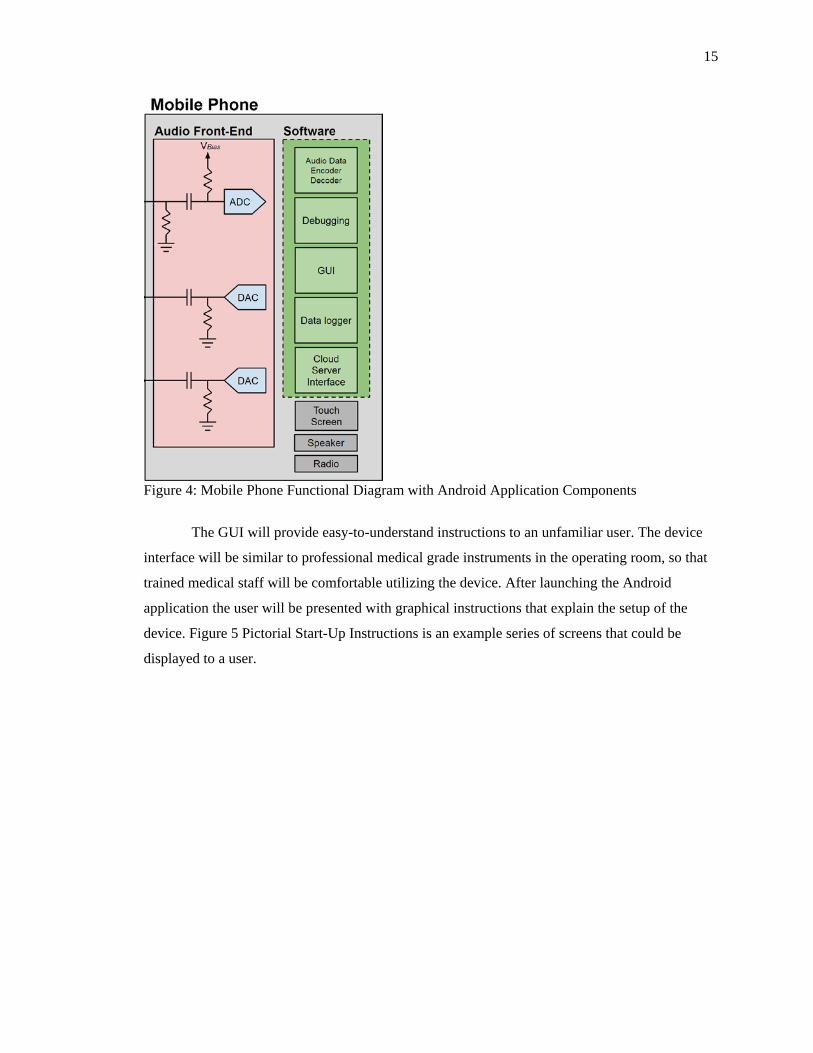
The mobile phone Android application will contain the following components: a
graphical user interface (GUI), a real-time user help module, an alarm handler, an audible pulsed
tone generator, an audio data communication interface, a sinewave generator for device power, a
data logger, a cloud server internet client, and device communication debugging interface. Figure
4 Mobile Phone Functional Diagram details some of these components.
15
Figure 4: Mobile Phone Functional Diagram with Android Application Components
The GUI will provide easy-to-understand instructions to an unfamiliar user. The device
interface will be similar to professional medical grade instruments in the operating room, so that
trained medical staff will be comfortable utilizing the device. After launching the Android
application the user will be presented with graphical instructions that explain the setup of the
device. Figure 5 Pictorial Start-Up Instructions is an example series of screens that could be
displayed to a user.

16
Figure 5: Pictorial Start-Up Instructions
First the device must be plugged in, and then the Android application will generate a sine
wave audio signal on the right audio channel to power the device. Adjusting the mobile phone
volume to maximum provides the most energy to the device. After the device initializes, the
mobile phone application will initiate communications with the device over the left audio channel
and mic channel. After communications with the device is established, the main screen will
appear. If any error states exist the user will be presented with graphical instructions on how to
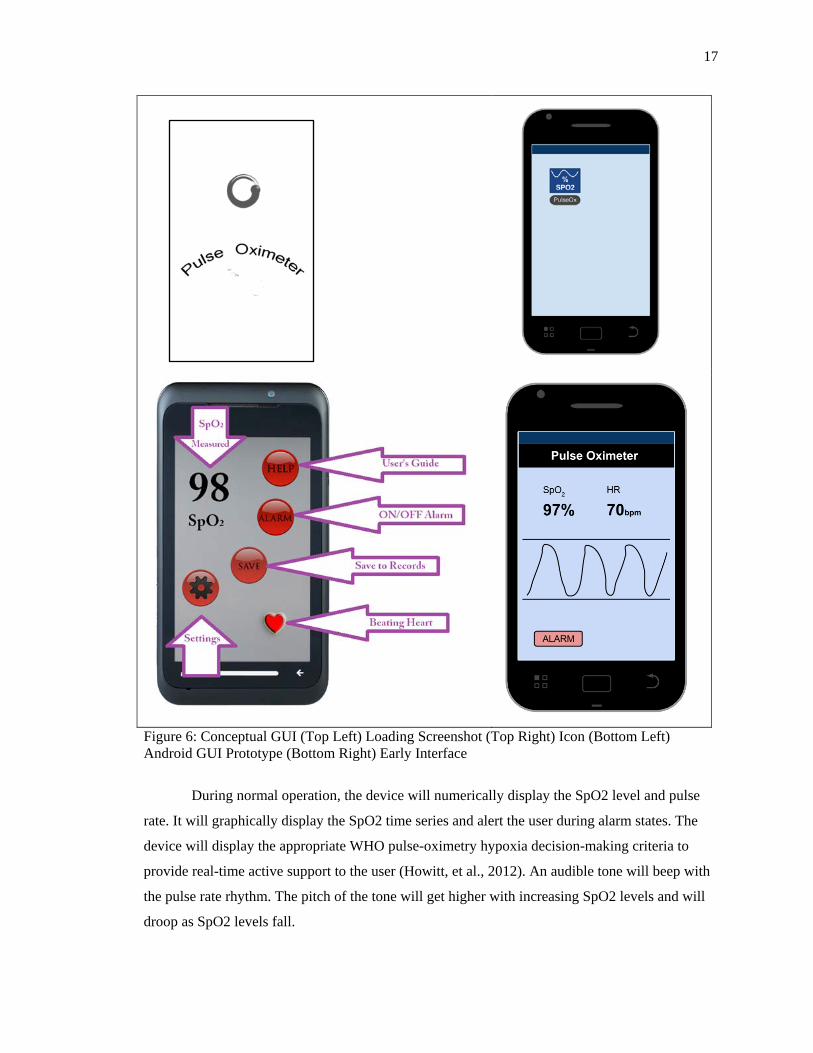
correct the problem. Figure 6 shows four example Android application screenshots. The two
rightmost images are concepts created with Google Draw, and the two leftmost images are
screenshots from an early Android GUI prototype application.
17
Figure 6: Conceptual GUI (Top Left) Loading Screenshot (Top Right) Icon (Bottom Left) Android GUI Prototype (Bottom Right) Early Interface
During normal operation, the device will numerically display the SpO2 level and pulse
rate. It will graphically display the SpO2 time series and alert the user during alarm states. The
device will display the appropriate WHO pulse-oximetry hypoxia decision-making criteria to
provide real-time active support to the user (Howitt, et al., 2012). An audible tone will beep with
the pulse rate rhythm. The pitch of the tone will get higher with increasing SpO2 levels and will
droop as SpO2 levels fall.

18
The application will have a data logging capability. SpO2 records for a given patient and
event can be saved and later retrieved. The records include information on patient identification,
time, geolocation, device id number, phone information, software/firmware version, power usage,
SpO2 raw samples, pulse rate raw samples, alarms, errors, AFE4490 register settings, and
application settings. The record data is saved in a binary format to conserve memory space and to
reduce the wireless bandwidth needed for transmission.
The application will be able to transmit the data in real-time to a remote location over the
internet. This functionality could be used in a number of different ways. For example, it could be
sent to nursing staff to monitor a patient that is in another room, or it could be used to send data
across the world for immediate expert analysis. In addition, the data can be stored to a master
database for long term medical studies.
The application will have a simple text field interface for debug and test of the
communications with the analog front-end and MCU. There will be a text field for register
address and data, a radio button to select the AFE4490 or MCU, and the following buttons: one to
read data and one to write data. If a user wants to read the AFE4490 diagnostic register they will
execute the following four steps. First, they will select the radio button for the AFE4490. Second,
they will initiate the diagnostic sequence by writing to register CONTROL0 by typing 0x00 into
the address field and 0x0004 in the data field. Then they will press the write register button.
Third, they will enable an AFE4490 SPI register read by writing to register CONTROL0 by
typing 0x00 into the address field and 0x0001 into the data field. Then they will press the write
register button. Forth, they will read the DIAG register by typing 0x30 into the address field.
Then they will press the read button to retrieve the data. Similarly, the MCU will have control,
status, and data registers that will be accessed by selecting the MCU radio button.

19
CHAPTER 3: HARDWARE DESIGN
Two custom printed circuit boards (PCBs) were designed, manufactured, and assembled
for this project. One, an audio breakout board was created to gain access to mobile phone audio
signals for testing purposes. Two, a pulse oximeter testbed board was created to experiment and
test early concepts. An analog front-end evaluation module for pulse oximetry from Texas
Instruments was used as a learning tool and reference design to aid the developmental process.
3.1 Audio Breakout Board Description
The audio breakout board consists of a standard cell phone headset cable with a plug, a
headset jack, and four BNC connectors that are attached to a printed circuit board (PCB) with
outer dimensions of 2.5 in by 3.8 in. The PCB has two layers with a ground plane and has rubber
feet so it can rest upright on a bench top. All cables are strain relieved to prevent poor electro-
mechanical connection. The electrical signals are passed one-to-one from the headset plug to the
headset jack using a standard cell phone connector pinout. There is a BNC connector for the left
stereo channel, right stereo channel, and microphone signals. The fourth BNC connector is routed
to the microphone signal through a first order RC high pass filter circuit that will block the
microphone DC bias voltage.
The purpose of the breakout board is to gain access to the audio signals between the cell
phone and an accessory, so an engineer can evaluate their performance. The audio signals can be
monitored by hooking up standard laboratory test equipment, such as an oscilloscope, to the BNC
connectors. One possible setup is to plug the breakout board cable into a cell phone, and then
plug an accessory into the breakout board headset jack.

20
Figure 7: Audio Breakout Board
21
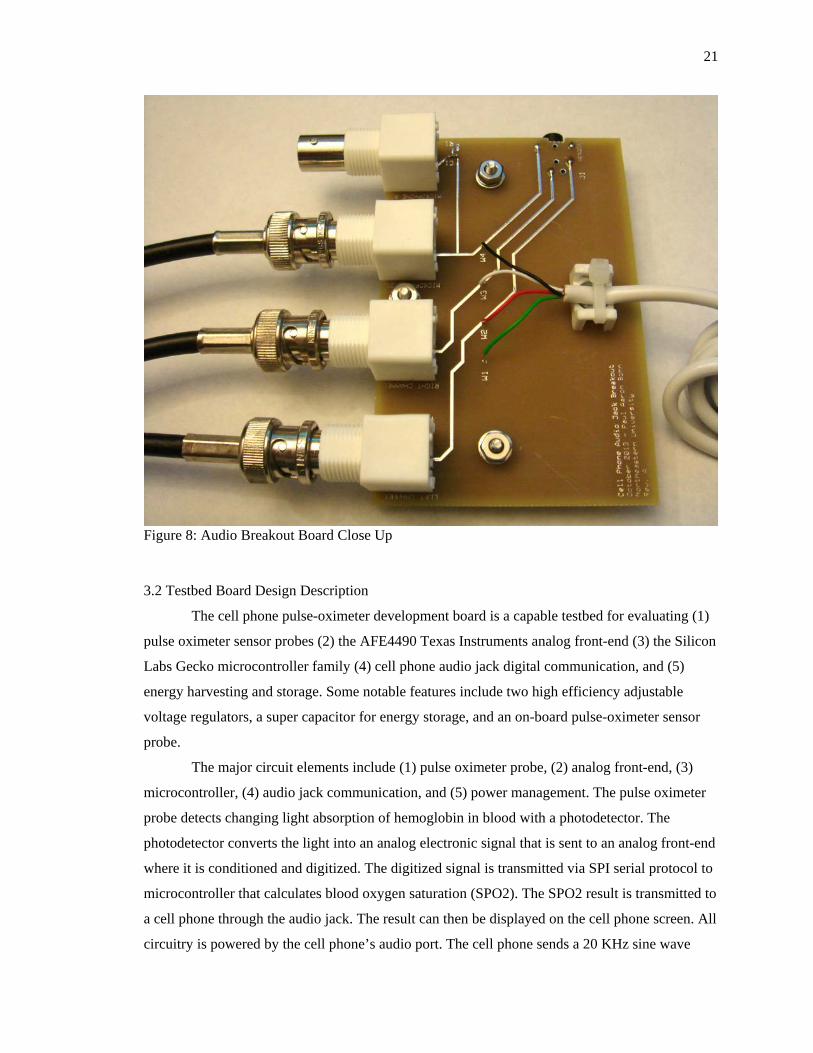
Figure 8: Audio Breakout Board Close Up
3.2 Testbed Board Design Description
The cell phone pulse-oximeter development board is a capable testbed for evaluating (1)
pulse oximeter sensor probes (2) the AFE4490 Texas Instruments analog front-end (3) the Silicon
Labs Gecko microcontroller family (4) cell phone audio jack digital communication, and (5)
energy harvesting and storage. Some notable features include two high efficiency adjustable
voltage regulators, a super capacitor for energy storage, and an on-board pulse-oximeter sensor
probe.
The major circuit elements include (1) pulse oximeter probe, (2) analog front-end, (3)
microcontroller, (4) audio jack communication, and (5) power management. The pulse oximeter
probe detects changing light absorption of hemoglobin in blood with a photodetector. The
photodetector converts the light into an analog electronic signal that is sent to an analog front-end
where it is conditioned and digitized. The digitized signal is transmitted via SPI serial protocol to
microcontroller that calculates blood oxygen saturation (SPO2). The SPO2 result is transmitted to
a cell phone through the audio jack. The result can then be displayed on the cell phone screen. All
circuitry is powered by the cell phone’s audio port. The cell phone sends a 20 KHz sine wave
22
from the right audio channel into a step-up transformer. The signal is rectified, filtered, regulated,
and then temporarily stored in a capacitor for later use.
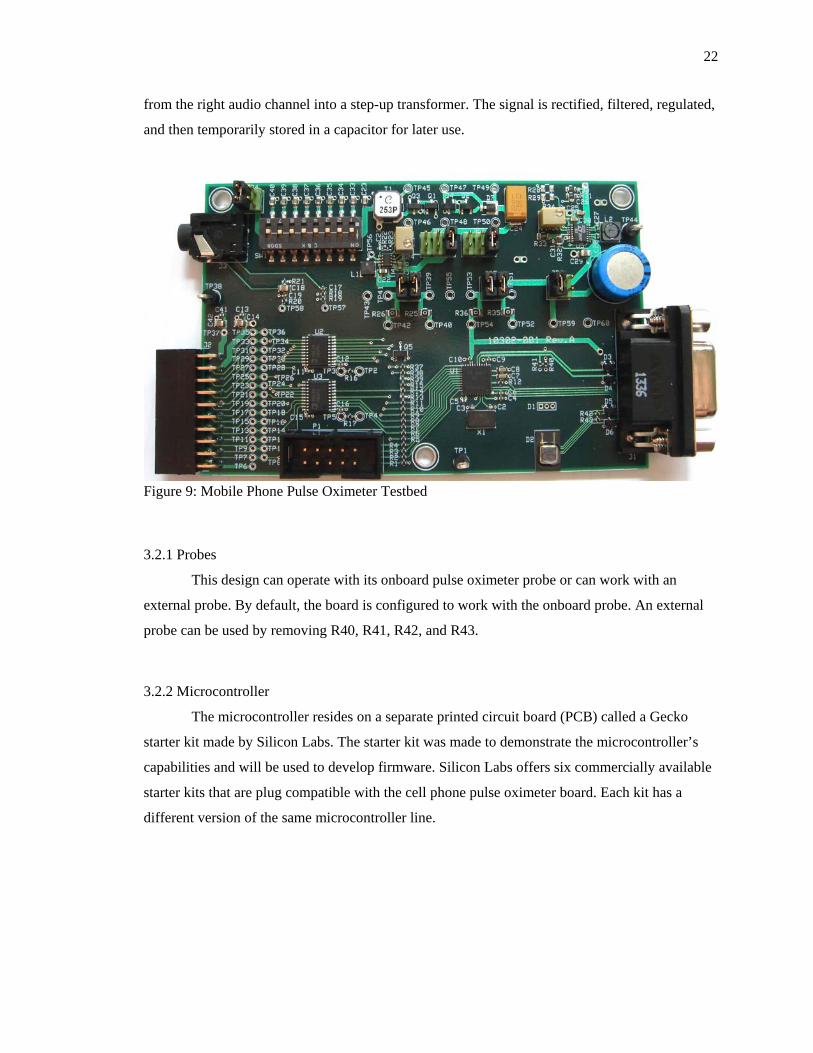
Figure 9: Mobile Phone Pulse Oximeter Testbed
3.2.1 Probes
This design can operate with its onboard pulse oximeter probe or can work with an
external probe. By default, the board is configured to work with the onboard probe. An external
probe can be used by removing R40, R41, R42, and R43.
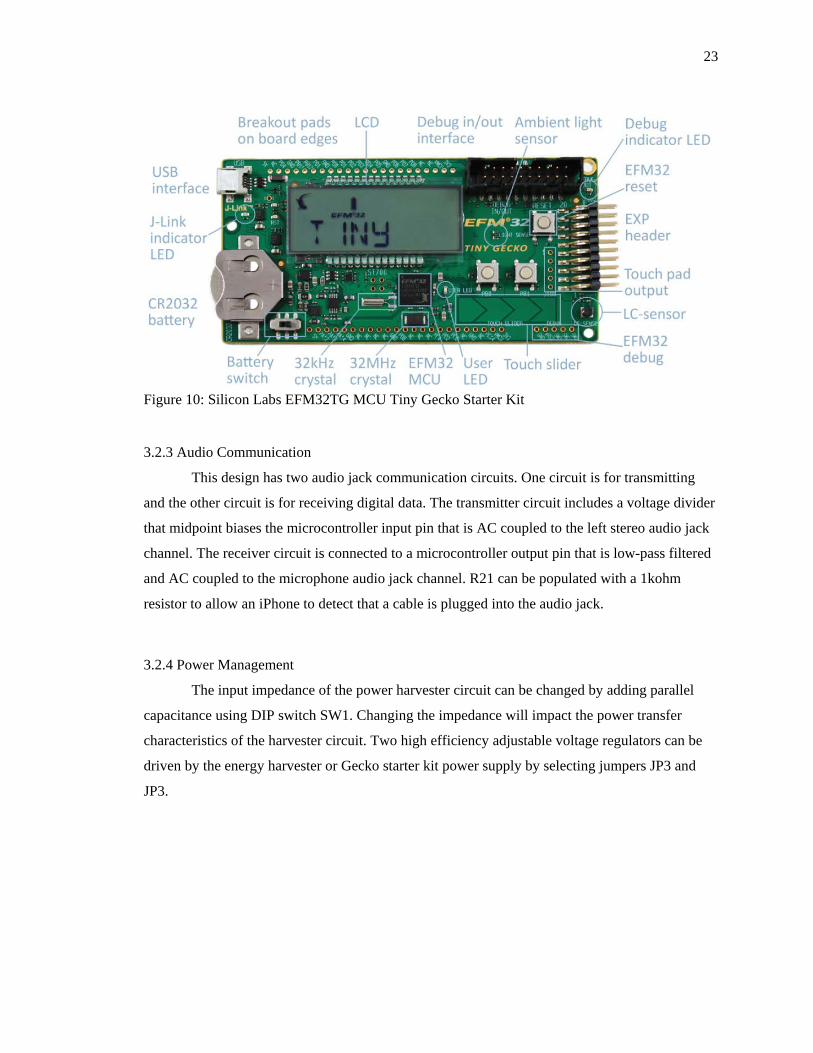
3.2.2 Microcontroller
The microcontroller resides on a separate printed circuit board (PCB) called a Gecko
starter kit made by Silicon Labs. The starter kit was made to demonstrate the microcontroller’s
capabilities and will be used to develop firmware. Silicon Labs offers six commercially available
starter kits that are plug compatible with the cell phone pulse oximeter board. Each kit has a
different version of the same microcontroller line.
23
Figure 10: Silicon Labs EFM32TG MCU Tiny Gecko Starter Kit
3.2.3 Audio Communication
This design has two audio jack communication circuits. One circuit is for transmitting
and the other circuit is for receiving digital data. The transmitter circuit includes a voltage divider
that midpoint biases the microcontroller input pin that is AC coupled to the left stereo audio jack
channel. The receiver circuit is connected to a microcontroller output pin that is low-pass filtered
and AC coupled to the microphone audio jack channel. R21 can be populated with a 1kohm
resistor to allow an iPhone to detect that a cable is plugged into the audio jack.
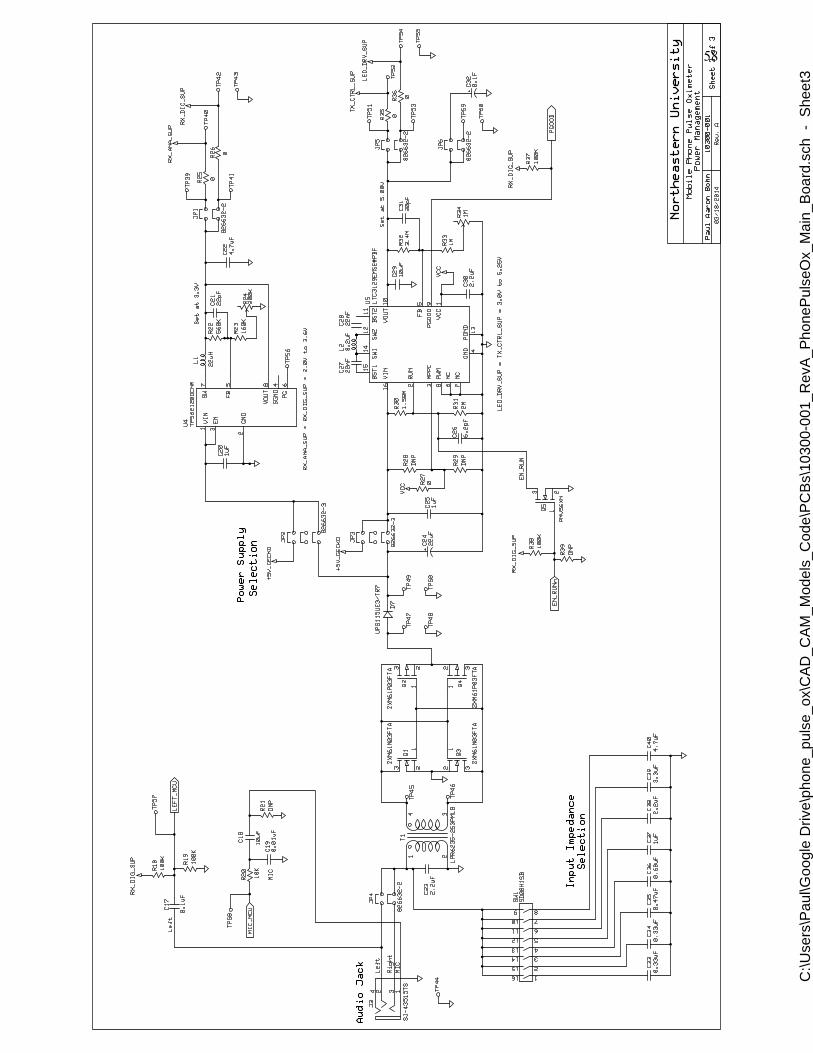
3.2.4 Power Management
The input impedance of the power harvester circuit can be changed by adding parallel
capacitance using DIP switch SW1. Changing the impedance will impact the power transfer
characteristics of the harvester circuit. Two high efficiency adjustable voltage regulators can be
driven by the energy harvester or Gecko starter kit power supply by selecting jumpers JP3 and
JP3.
24
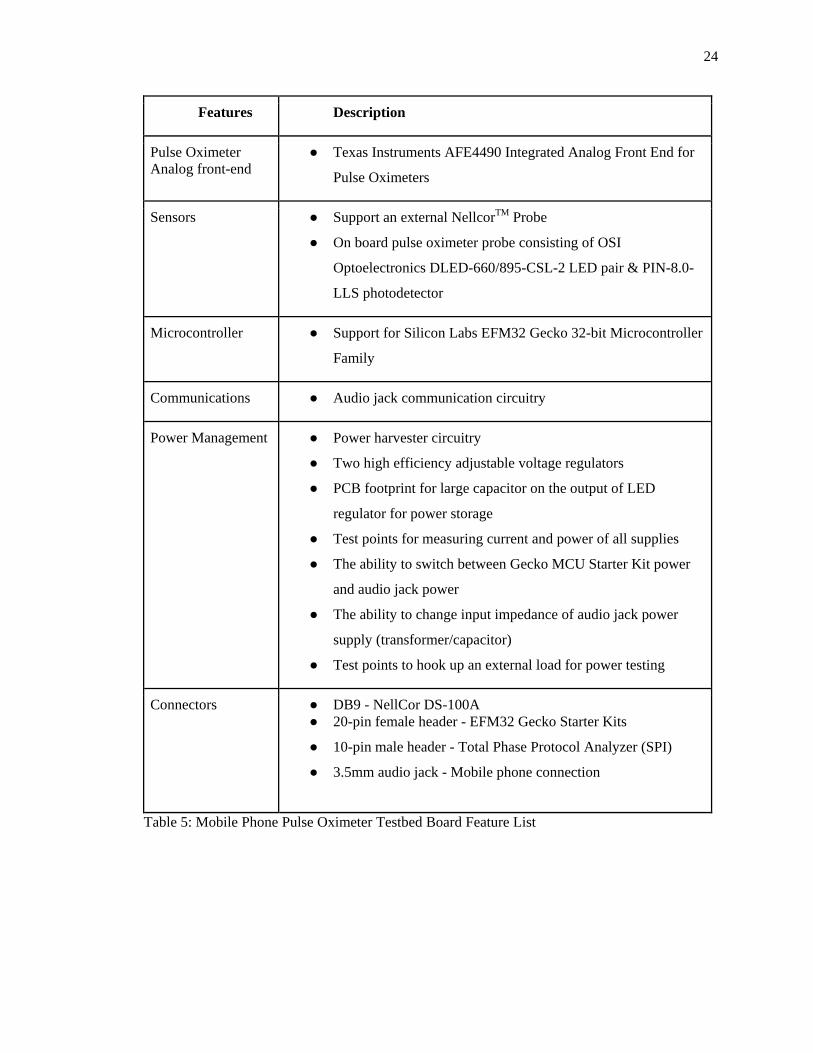
Features Description
Pulse Oximeter Analog front-end
● Texas Instruments AFE4490 Integrated Analog Front End for
Pulse Oximeters
Sensors ● Support an external NellcorTM Probe
● On board pulse oximeter probe consisting of OSI
Optoelectronics DLED-660/895-CSL-2 LED pair & PIN-8.0-
LLS photodetector
Microcontroller ● Support for Silicon Labs EFM32 Gecko 32-bit Microcontroller
Family
Communications ● Audio jack communication circuitry
Power Management ● Power harvester circuitry
● Two high efficiency adjustable voltage regulators
● PCB footprint for large capacitor on the output of LED
regulator for power storage
● Test points for measuring current and power of all supplies
● The ability to switch between Gecko MCU Starter Kit power
and audio jack power
● The ability to change input impedance of audio jack power
supply (transformer/capacitor)
● Test points to hook up an external load for power testing
Connectors ● DB9 - NellCor DS-100A ● 20-pin female header - EFM32 Gecko Starter Kits
● 10-pin male header - Total Phase Protocol Analyzer (SPI)
● 3.5mm audio jack - Mobile phone connection
Table 5: Mobile Phone Pulse Oximeter Testbed Board Feature List

25
CHAPTER 4: SOFTWARE DESIGN
The project codebase consists of microcontroller code, Android mobile phone code, and
MATLAB code. This thesis work concluded with a code package for testbed hardware and a
prototype Android GUI application. Future work will be needed to create device code for the final
pulse oximeter design.
4.1 Testbed Code
The MCU test code was developed using Silicon Labs Simplicity StudioTM. Simplicity
StudioTM was chosen because it is freely provided by the Gecko EFM32TM MCU manufacturer.
Scripting and algorithm development was accomplished with Mathworks MATLAB. MATLAB
was chosen for its ease-of-use, its capability, the author’s familiarity with the tool, and its license
accessibility. Future development should use free-license software and open source tools to keep
costs down and increase the design’s accessibility to technical individuals who live in the
developing world.
An MCU test program was written to learn how the Texas Instruments AFE4490 analog
front-end works. The program initializes the MCU, enables the voltage regulator, sets up SPI
communications, and configures the analog front-end registers. The program can query analog
front-end registers such as the diagnostic register, and it can place analog front-end in data stream
mode.
Two MATLAB scripts were written to support the development effort. The first script
dataimport.m ingests binary SPI data generated by the pulse-oximeter. The script sorts the data by
register address and populates the raw measurement data into MATLAB workspace variables.
Further, it removes erroneous data that is sometimes generated due to experimental setup. The
second script pox.m uses the raw data captured by dataimport.m to calculate SpO2 and pulse rate.
Table 6 covers the variable names and descriptions used in script pox.m.

26
Variable Name Description
ChIR is the RAW IR channel
ChIRAMBIENT is the RAW IR ambient channel
ChIRIRAMBIENT is the RAW IR ambient subtracted from IR channel
ChRED is the RAW red channel
ChREDAMBIENT is the RAW red ambient channel
ChREDREDAMBIENT is the RAW red ambient subtracted from the red channel
IR is the normalized IR channel
IRas is the normalized IR channel with ambient subtraction
IRasfilt is the normalized IR channel with ambient subtraction after going through a high-pass filter
R is the normalized red channel
Ras is the normalized red channel with ambient subtraction
RIR Ratio of red to IR (RIR = R/IR)
Table 6: Variable Descriptions For pox.m
The script pox.m plots the raw data ChIR, ChIRAMBIENT, ChIRIRAMBIENT, ChRED,
ChREDAMBIENT, and ChREDREDAMBIENT. These variables correspond to the registers 42
through 47 of the AFE4490 analog front-end. Variables ChRED, ChREDAMBIENT, ChIR, and
ChIRAMBIENT are normalized by dividing each variable by its own mean on an element-wise
basis. The resultant and corresponding variables are R, Ras, IR, and IRas and are then plotted.
The ratio of the red channel to IR channel is saved to variable RIR and then substituted into a
linear approximation function that outputs SpO2. The SpO2 function is an extremely rough
approximation, and it only defines a monotonic trend. In the future, the SpO2 function will be
replaced with a lookup table filled with empirical data to get valid SpO2 values. The script plots a
time series of the calculated SpO2 data values and outputs the mean SpO2 value to the MATLAB
command window. Pulse rate is determined by analyzing the IRas variable. First, a high pass
filter with a cutoff frequency of 0.5Hz is used to smooth out low frequency artifacts that can be
caused by adjusting acquisition parameters such as amplifier gain or LED current. The resultant

27
signal is saved in variable IRasfilt, the magnitude and phase response of the cutoff filter is
plotted, and the variables IRas, and IRasfilt are plotted versus time. Second, the number of peaks
in a given amount of time are counted and then divided by time to solve for pulse rate.

28
CHAPTER 5: TESTING AND ANALYSIS
Two test setups were used to aid testing, analysis, and software development. The first
setup was made up of commercially available parts and was built around a pulse oximeter
evaluation module. This setup was used to gain familiarity with the Texas Instruments AFE4400
Integrated Analog Front-End for Heart Rate Monitors and Low-Cost Pulse Oximeters. The
second test setup included a testbed mobile phone pulse oximeter board designed to be an
intermediate step to creating a medical device. This board was used to develop the MCU code
and to test hardware functionality.
5.1 Test Setup One
Test setup one introduced the first hands-on experience with a pulse oximeter. It
provided detailed insight on how the AFE4400 analog front-end performs and operates. It
exposed how the AFE44x0 parts handle the SPI protocol and communications. It also provided
the first datasets that were used to begin the development of the MATLAB analysis script pox.m.
5.1.1 Hardware
The first setup consisted of a NellcorTM SpO2 probe, a Texas Instruments
AEF4400SPO2EVM evaluation module, a Total Phase Beagle I2C/SPI protocol analyzer, an
Agilent Technologies MSO-X-3104A oscilloscope, and a Windows 7 computer. Figure 11 Test
Setup One Block Diagram shows how the individual components were connected.

29
Figure 11: Test Setup One Block Diagram
Figure 12: Test Setup One Components
The NellcorTM SpO2 sensor probe is a typical finger clip device that can be found in a
medical office. A photodiode is embedded on one side of the clip and an IR/RED LED pair is
embedded on the opposite side. The sensor probe plugs into a DB9 connector located on the
AFE4400SPO2EVM evaluation board. The board comes with a Windows application to operate
the AFE4400. It provides a working example for an engineer to speed up development. The
AFE4400 evaluation module, the SPI protocol analyzer, and oscilloscope communicate with the
Windows 7 computer over USB. The SPI protocol analyzer and oscilloscope were used to
monitor and capture data from the AFE4400 SPI communication bus. Lead wires were soldered
to the AFE4400 evaluation module to gain access to the SPI electrical signals. Figure 13 shows
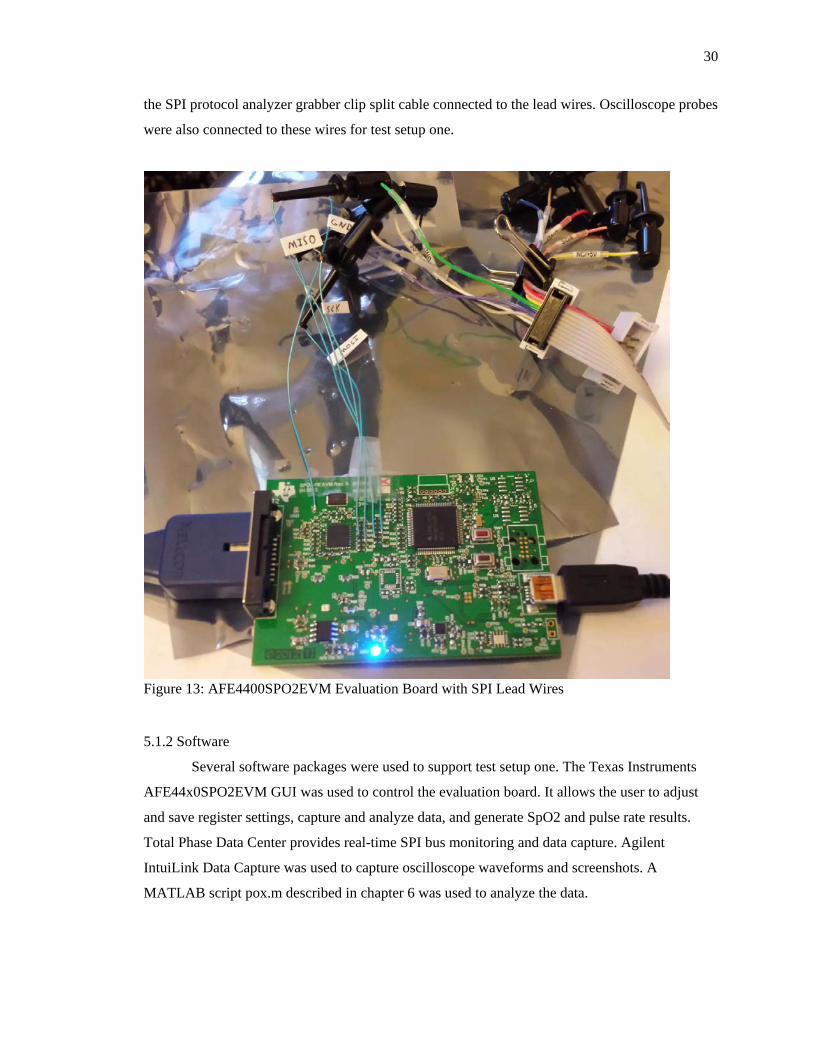
30
the SPI protocol analyzer grabber clip split cable connected to the lead wires. Oscilloscope probes
were also connected to these wires for test setup one.
Figure 13: AFE4400SPO2EVM Evaluation Board with SPI Lead Wires
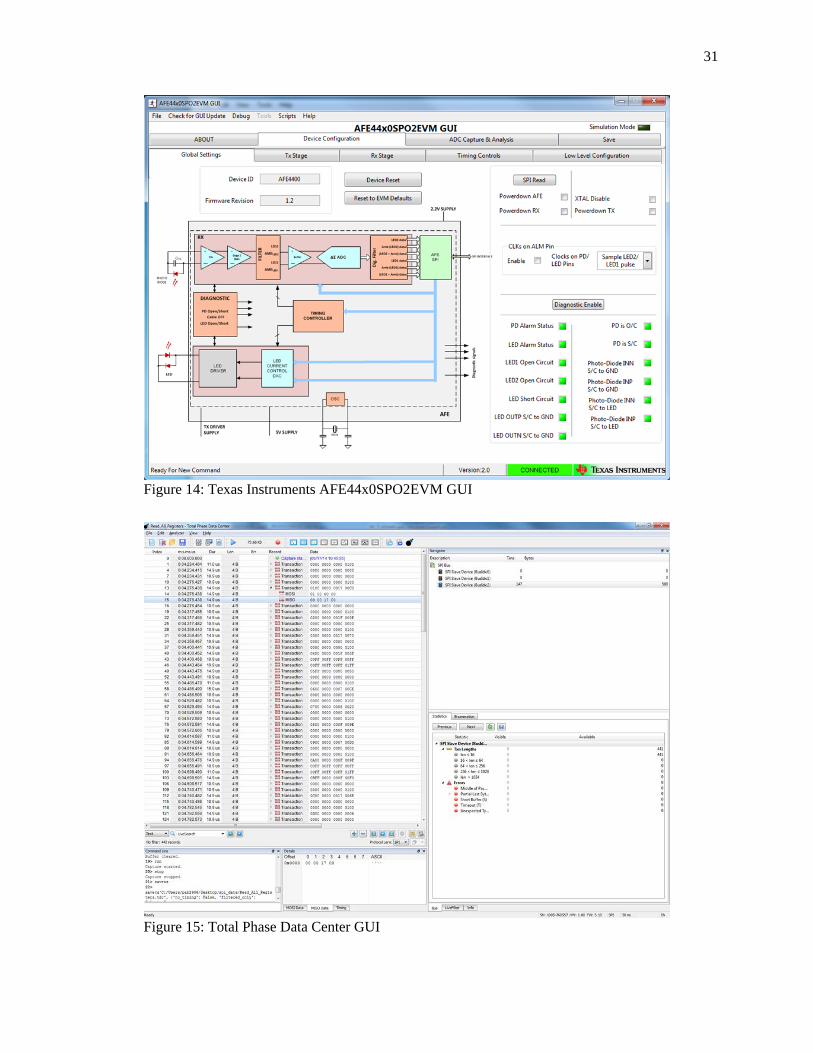
5.1.2 Software
Several software packages were used to support test setup one. The Texas Instruments
AFE44x0SPO2EVM GUI was used to control the evaluation board. It allows the user to adjust
and save register settings, capture and analyze data, and generate SpO2 and pulse rate results.
Total Phase Data Center provides real-time SPI bus monitoring and data capture. Agilent
IntuiLink Data Capture was used to capture oscilloscope waveforms and screenshots. A
MATLAB script pox.m described in chapter 6 was used to analyze the data.
31
Figure 14: Texas Instruments AFE44x0SPO2EVM GUI
Figure 15: Total Phase Data Center GUI

32
5.1.3 Testing and Analysis
Several tests were performed in succession to build up to the final test setup one
configuration. The first test brought the evaluation module online with the provided commercial
software GUI. The SpO2 probe was used to take data sets to confirm that the pulse oximeter was
working. The next tests gathered information on how the AFE4400 communicates over the SPI
data bus.
The data captures were initialized using two tabs within the AFE44x0SPO2EVM GUI.
Figure 16 Percent SpO2 & HR Display shows the resultant heart rate signal, SpO2, and HR after
a sixty second acquisition using the evaluation module and GUI.
Figure 16: Percent SpO2 & HR Display
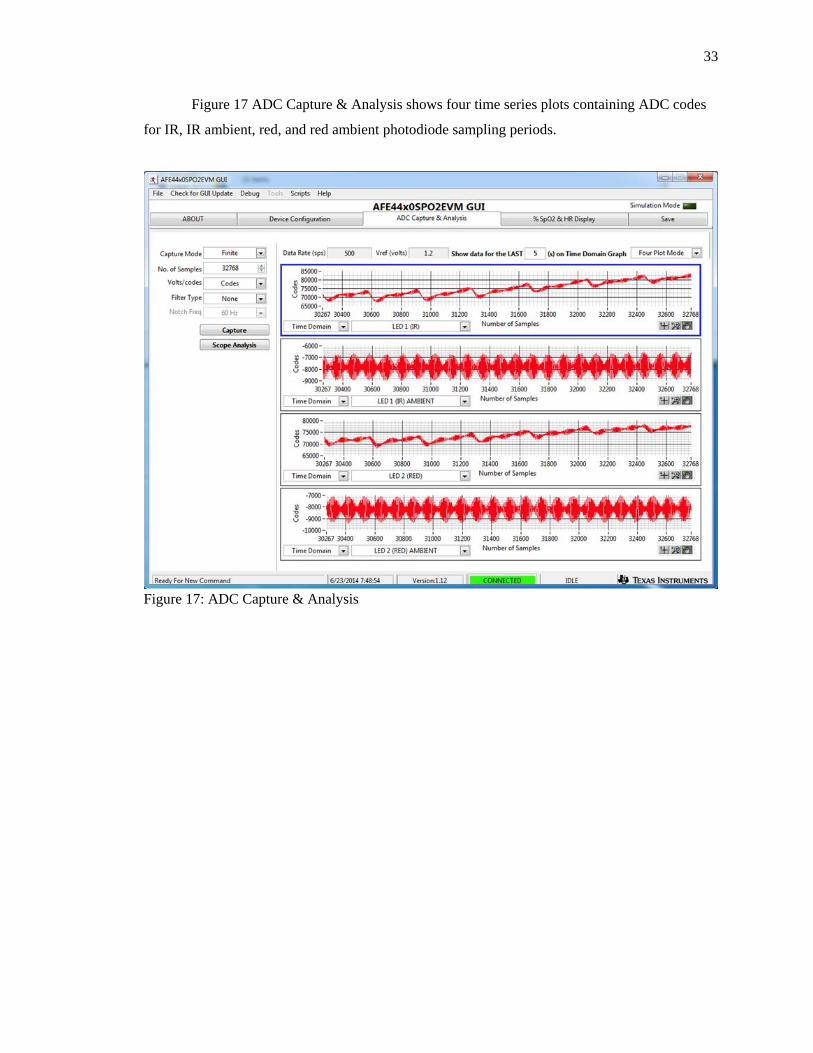
33
Figure 17 ADC Capture & Analysis shows four time series plots containing ADC codes
for IR, IR ambient, red, and red ambient photodiode sampling periods.
Figure 17: ADC Capture & Analysis

34
The data that was captured in the previously mentioned tabs was exported as a CSV file
using the save tab shown in Figure 18.
Figure 18: Save Data to CSV File
The device register settings were saved using buttons within the low level configuration
tab shown in Figure 19. The exported csv data and register settings were used to create the first
version of the MATLAB analysis script pox.m described in chapter 4. The results from the script
provided confirmation that the SpO2 probe and evaluation module was working.

35
Figure 19: Save Low Level Configuration
The next series of tests were to learn how the AFE4400 handles SPI communications.
The oscilloscope was used to determine the SPI clock frequency (see figure 20), validate SPI
signal integrity, and decode SPI messages.

36
Figure 20: Oscilloscope Capture SPI SCLK Frequency & Period
The knowledge gained from monitoring the SPI signals with the oscilloscope was used
adjust the protocol analyzer configuration for proper operation. The low level configuration tab in
the EVM GUI was used to read and write registers while the SPI bus was instrumented. Figures
21 and 22 are partial screen captures of the EVM GUI and protocol analyzer software Data
Center. Figure 23 is a scope capture of an SPI data transaction. All of the figures show an update
made to the AFE4400 register address 0x01 and the resultant data value. The simultaneous
capturing of data was used to validate that the SPI communications were working.

37
Figure 21: Register Setting Screen Capture from AFE44x0SPO2EVM GUI
Figure 22: Register Setting Screen Capture from Protocol Analyzer GUI Data Center
Figure 23: Oscilloscope Read Register LED2STC Address: 0x0A Data: 0x17C0
Test setup one data was captured and analyzed with pox.m. Figure 24 shows the
MATLAB command window output for pox.m. The variable SPO2as_mean is the calculated
mean SpO2 value for 65.536 second acquisition period. The inputs for this SpO2 calculation
included ChIRIRAMBIENT and ChREDREDAMBIENT channels from the analog front-end. A
SpO2 value of 79.735% is low and is unhealthy. The value can be explained because the
instrument was uncalibrated. A linear approximation was used in place of an empirical lookup
table to generate the SpO2 numbers. The variable Fs represents a sample rate of 500Hz. The
variable fc is a cut-off frequency of a high pass filter. The variable pulse_rate was 81.6288 pulses
per minute.
38
Figure 24: pox.m MATLAB Command Window Output for AFE4400SPO2EVM
Figure 25 shows the raw data coming from the AFE4400SPO2EVM board. The ChIR
and ChRED channels are greater in magnitude than their ambient subtracted versions
ChIRIRAMBIENT, and ChREDREDAMBIENT. There are low frequency oscillations on both
red and IR channels. The higher frequency oscillations are due to pulsatile blood flow.
Figure 26 shows normalized data. The data was normalized by dividing each channel by
its mean on an element-by-element basis.

39
Figure 25: RAW Data from AFE4400SPO2EVM
Figure 26: Normalized Data from AFE4400SPO2EVM

40
Figure 27 shows the SpO2 calculation plot. It includes the SpO2 calculation with and
without the ambient light subtraction.
Figure 27: SpO2 (red); SpO2 Ambient Subtraction (blue) from AFE4400SPO2EVM
Figure 28 shows the magnitude and phase response of a high-pass filter that has a cut-off
frequency of 0.5Hz. This filter was used to remove the low frequency oscillations that are in the
ChIRIRAMBIENT channel.

41
Figure 28: High Pass Filter Response
Figure 29 shows IR ambient subtraction signal before and after the high-pass filter. The
filter converges after ~4 seconds which is when the ringing stops. The resultant signal is used to
calculate the pulse rate by counting peaks.
00.
10.
20.
30.
40.
50.
60.
70.
80.
9
-70
-60
-50
-40
-30
-20
-100
Norm
aliz
ed F
requ
ency
(×π
rad/
sam
ple)
Magnitude (dB)
Mag
nitu
de R
espo
nse
(dB)
and
Pha
se R
espo
nse
0.12
61
1.40
64
2.68
68
3.96
71
5.24
75
6.52
78
7.80
82
9.08
85
Phase (radians)

42
Figure 29: IR Ambient Subtraction Before (red); After Filter (blue) from AFE4400SPO2EVM
5.2 Test Setup Two
The purpose of test setup two was to exercise the custom pulse oximeter testbed for the
first time. The work started with an initial board check out. Then microcontroller test software
was written. Finally, data was captured over the SPI bus using a protocol analyzer in the same
fashion as test setup one. Future setups will include a mobile phone.
5.2.1 Hardware
The second setup included the testbed mobile phone pulse oximeter board, Silicon Labs
EFM32TG MCU Tiny Gecko Starter Kit, a Total Phase Beagle I2C/SPI protocol analyzer, and a
Windows 7 computer. Figure 30 Test Setup Two Block Diagram shows how the individual
components were connected.

43
Figure 30: Test Setup Two Block Diagram
Figures 31 and 32 show the testbed hardware in a powered up state. The MCU board and
protocol analyzer is visible in Figure 31. The red/IR LED is visibly lit and is located in the left
corner of the testbed board. The onboard photodiode and LEDs were used to the collect data that
is described in the test and analysis section.
Figure 31: Hardware Setup Two Pulse Oximeter Testbed & Silicon Labs MCU

44
Figure 32: Pulse Oximeter Testbed Close Up
Initial hardware check out included the installation of pin header jumpers, testing the
power supplies, experimenting with the super capacitor, and driving the power circuitry with a
sine wave from a mobile phone. A PCB layout error was discovered during first power up and
resolved by cutting a trace away from a via. After the repair was made, the voltage regulators
came up and were adjustable to the designed ranges. A second PCB error was detected by reading
out a diagnostic register from the analog front-end. The diagnostic indicated that the photodiode
detector was installed with the wrong polarity. A small wire jumper can be seen in Figure 32
located near the top portion of the DB9 connector that is embossed with the letters AMP. The
jumper was installed and two PCB traces were cut to alleviate the photodiode polarity reversal.
5.2.2 Software
Test setup two required an MCU test program, Total Phase Data Center, and MATLAB
scripts. Figure 33 shows the data flow starting at the testbed SpO2 hardware. The MCU program
configures the analog front-end to continuously stream data. The SPI signals are digitized using
the SPI protocol analyzer. The decoded SPI messages were logged with Total Phase Data Center
and then exported as a binary file. The script dataimport.m was used to decode SPI messages and

45
store the resultant data to the MATLAB workspace. The data in the workspace was analyzed with
pox.m.
Figure 33: Data Flow Diagram
5.2.3 Testing and Analysis
The measurements were taken by placing a finger between the onboard photodetector and
LED package. A dark cloth was used to cover the testbed to prevent ambient light from
interfering with the measurement. Measurements were taken and then imported into MATLAB
for analysis. Using a trial and error approach, the analog front-end registers were adjusted to get
the signals within range. A differentiation between test setup one and two was that the analog
front-end gain settings were static. If experimental conditions changed it resulted in a bad
measurement. For example, an increase in ambient light or finger position motion would often
drive the pleth signal out of range.
Figure 34 shows a MATLAB command window output for a dataset that was taken with
testbed. The SPO2_mean variable was equal to 79.9655% which is close to the results of
79.735% acquired from test setup one. The test setup two acquisition time was 18.378 seconds
while test setup one was 65.536 seconds. The sample rate of 500 Hz and high pass filter cutoff
frequency of 0.5Hz was the same for both setups. The pulse rate for test setup two was 67.8850
pulses per minute while test setup one was 81.6288 pulses per minute.

46
Figure 34: pox.m MATLAB Command Window Output for Testbed
Figure 35 shows the raw data captured from testbed pulse oximeter board. The signal
magnitudes for CHIR, CHIRIRAMBIENT, are close to 7x10^4 ADC counts and the signal
magnitudes for ChRED, ChREDREDAMBIENT are close to 3x10^4 ADC counts. Test setup two
signals for the previously mentioned channels were close to 12x10^4 and 9x10^4 ADC counts,
which is approximately a factor of 5 difference. The SNR of these signals are impacted by the
sensor characteristics, how the measurement was taken, and the analog front-end settings.

47
Figure 35: RAW Data from Testbed
Figure 36 shows a side-by-side comparison of raw data from the testbed board and TI
AFE4400SPO2EVM evaluation board. The data collected from the AFE4400SPO2EVM board
has about 3.5 more samples than the testbed board. The IR and red channels from the
AFE4400SPO2EVM board converge onto each other while the testbed channels do not. The
converging behavior is likely due to analog front-end control register updates during the
acquisition. The testbed register settings remain static during the acquisition; therefore, the
signals magnitudes remain relatively static.
48
Figure 36: RAW Data Comparison for AFE4400SPO2EVM & Testbed

49
Figure 37 shows normalized red channel data. The red ambient subtracted data is
significantly less noisy than the red channel. The test setup one data has less noise than the test
setup two.
Figure 37: Normalized Data from Testbed
Figure 38 shows the SpO2 plot. The SpO2 value converges on ~79% after 1500 samples.
This change could be a result of a physical motion artifact. Again, this data is noisy compared to
test setup one.

50
Figure 38: Calculated SpO2 (red) SpO2 Ambient Subtraction (blue) from Testbed
Figure 39 shows IR ambient subtraction signal before and after a high-pass filter
with a cutoff frequency of 0.5Hz. In the test setup two case, the filter was not necessary because
the low frequency oscillations were not present. The magnitude of the signal appears to be less
than the test setup one case.
Figure 39: IR Ambient Subtraction Before Filter (red); After Filter (blue) from Testbed

51
CHAPTER 6: CONCLUSION
The impact of mobile computing on point-of-care medical devices has not been fully
realized. The potential cost savings, the increased mobility, improved patient compliance, and
distribution of knowledge has the potential to revolutionize medical care. While many pulse
oximeters are commercially available only a few utilize mobile phone technology.
A testbed mobile phone pulse oximeter was designed, built, and tested. MCU test
software and MATLAB analysis software was written. A working reference design was turned
over to a Northeastern University undergraduate capstone group for further development. Figure
40 shows the results of the capstone group’s work. A prototype Android application is running in
conjunction with the testbed hardware.
Figure 40: Android Application Hardware Demo by Undergraduate Capstone Team

52
The final goal is to develop a medical grade patient monitor. The monitor would have a
fully integrated suite of diagnostics including electrocardiogram (ECG), respiratory, SpO2, blood
pressure, digital stethoscope, and temperature sensing. It would be portable and provide
interactive user instructions, real-time data analysis, medical record data logging, alarms, and
remote monitoring. The patient monitor device would take the form of a small ruggedized
enclosure with connectors for sensors and phone/tablet interface. The mobile device would
provide a video display, audio feedback, computing, data storage, communications, and power.
The design will be open source licensed both hardware and software. As well as being created
with open design software tools would allow engineers in the developing world to modify the
patient monitor to address needs unique to their locale.

53
REFERENCES Howitt, P., Darzi, A., Yang, G.-Z., Ashrafian, H., Atun, R., Barlow, J., . . . Conteh, L. (2012).
Technologies for global health. The Lancet Commissions, 507-535. doi:10.1016/S0140-
6736(12)61127-1
Kuo, Y.-S., Verma, S., Schmid, T., & Dutta, P. (2010). Hijacking power and bandwidth from the
mobile phone's audio interface. Proceedings of the First ACM Symposium on Computing
for Development (pp. 1-10). London, United Kingdom: ACM.
doi:10.1145/1926180.1926210
MOBITHINKING. (2014, May 16). Global mobile statistics 2014 Part A: Mobile subscribers;
handset market share; mobile operators. Retrieved April 16, 2015, from mobiForge:
http://mobiforge.com/research-analysis/global-mobile-statistics-2014-part-a-mobile-
subscribers-handset-market-share-mobile-operators#subscribers
Texas Instruments. (2013, August 28). SpO Pulse Ox Wrist Oximeter Reference Design. Dallas,
Texas, United States of America: Texas Instruments Incorporated. Retrieved from
http://www.ti.com/tool/tida-00010
Texas Instruments. (2014, June). AFE4490 Integrated Analog Front-End for Pulse Oximeters.
Rev H. Dallas, Texas, United States of America: Texas Instruments Incorporated.
Retrieved from http://www.ti.com/product/afe4490
Wang, L. V., & Wu, H. (2007). Biomedical optics: principles and imaging. Hoboken, N.J.:
Wiley-Interscience.
World Health Organization. (2011). Pulse Oximetry Training Manual. Geneva, Switzerland:
WHO Press.

APPENDIX
54

I. SCHEMATICS
55

C:\U
sers
\Pau
l\Goo
gle
Driv
e\ph
one_
puls
e_ox
\CA
D_C
AM
_Mod
els_
Cod
e\P
CB
s\10
300-
001_
Rev
A_P
hone
Pul
seO
x_M
ain_
Boa
rd.s
ch -
She
et1
56

C:\U
sers
\Pau
l\Goo
gle
Driv
e\ph
one_
puls
e_ox
\CA
D_C
AM
_Mod
els_
Cod
e\P
CB
s\10
300-
001_
Rev
A_P
hone
Pul
seO
x_M
ain_
Boa
rd.s
ch -
She
et2
57
C:\U
sers
\Pau
l\Goo
gle
Driv
e\ph
one_
puls
e_ox
\CA
D_C
AM
_Mod
els_
Cod
e\P
CB
s\10
300-
001_
Rev
A_P
hone
Pul
seO
x_M
ain_
Boa
rd.s
ch -
She
et3
58

C:\U
sers
\Pau
l\Des
ktop
\Pho
ne_A
udio
_Bre
akou
t.sch
- S
heet
1
59

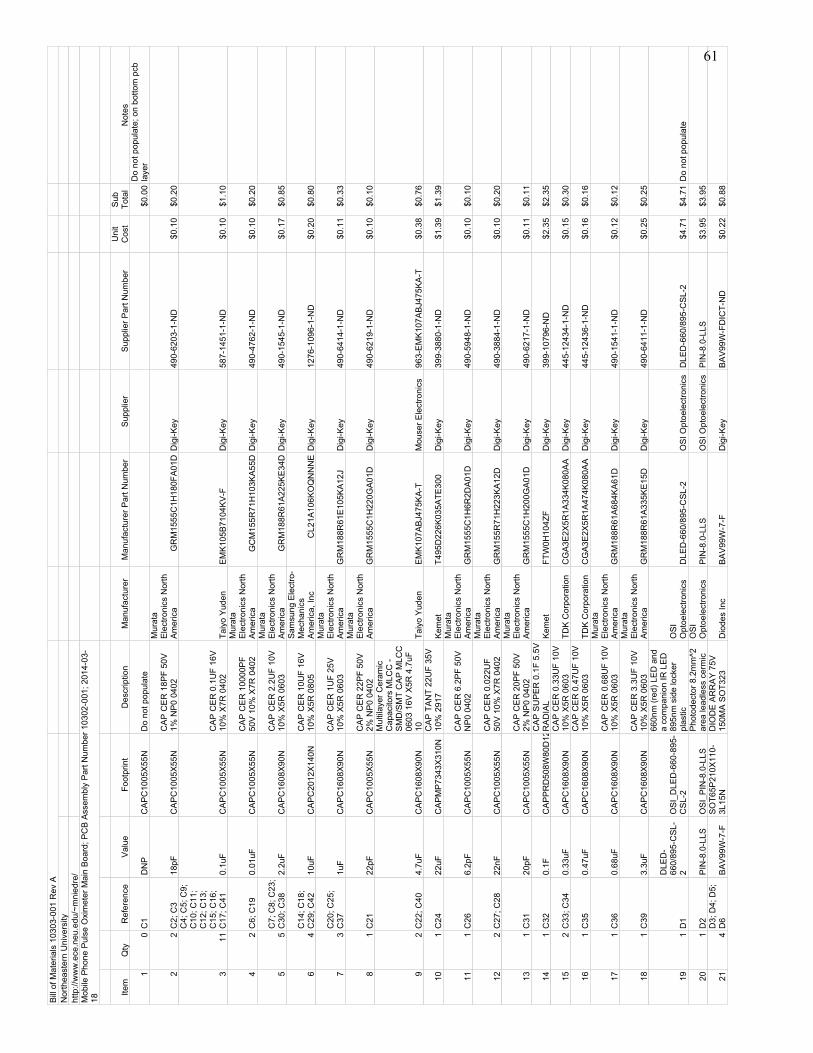
II. BILL OF MATERIALS
60
10
C1
DN
PC
AP
C10
05X
55N
Do
not p
opul
ate
$0.0
0D
o no
t pop
ulat
e; o
n bo
ttom
pcb
laye
r
22
C2;
C3
18pF
CA
PC
1005
X55
NC
AP
CE
R 1
8PF
50V
1% N
P0
0402
Mur
ata
Ele
ctro
nics
Nor
thA
mer
ica
GR
M15
55C
1H18
0FA
01D
Dig
i-Key
490-
6203
-1-N
D$0
.10
$0.2
0
311
C4;
C5;
C9;
C10
; C11
;C
12; C
13;
C15
; C16
;C
17; C
410.
1uF
CA
PC
1005
X55
N
CA
P C
ER
0.1
UF
16V
10%
X7R
040
2Ta
iyo
Yud
enE
MK
105B
7104
KV
-FD
igi-K
ey58
7-14
51-1
-ND
$0.1
0$1
.10
42
C6;
C19
0.01
uFC
AP
C10
05X
55N
CA
P C
ER
100
00P
F50
V 1
0% X
7R 0
402
Mur
ata
Ele
ctro
nics
Nor
thA
mer
ica
GC
M15
5R71
H10
3KA
55D
Dig
i-Key
490-
4762
-1-N
D$0
.10
$0.2
0
55
C7;
C8;
C23
;C
30; C
382.
2uF
CA
PC
1608
X90
NC
AP
CE
R 2
.2U
F 10
V10
% X
5R 0
603
Mur
ata
Ele
ctro
nics
Nor
thA
mer
ica
GR
M18
8R61
A22
5KE
34D
Dig
i-Key
490-
1545
-1-N
D$0
.17
$0.8
5
64
C14
; C18
;C
29; C
4210
uFC
AP
C20
12X
140N
CA
P C
ER
10U
F 16
V10
% X
5R 0
805
Sam
sung
Ele
ctro
-M
echa
nics
Am
eric
a, In
cC
L21A
106K
OQ
NN
NE
Dig
i-Key
1276
-109
6-1-
ND
$0.2
0$0
.80
73
C20
; C25
;C
371u
FC
AP
C16
08X
90N
CA
P C
ER
1U
F 25
V10
% X
5R 0
603
Mur
ata
Ele
ctro
nics
Nor
thA
mer
ica
GR
M18
8R61
E10
5KA
12J
Dig
i-Key
490-
6414
-1-N
D$0
.11
$0.3
3
81
C21
22pF
CA
PC
1005
X55
NC
AP
CE
R 2
2PF
50V
2% N
P0
0402
Mur
ata
Ele
ctro
nics
Nor
thA
mer
ica
GR
M15
55C
1H22
0GA
01D
Dig
i-Key
490-
6219
-1-N
D$0
.10
$0.1
0
92
C22
; C40
4.7u
FC
AP
C16
08X
90N
Mul
tilay
er C
eram
icC
apac
itors
MLC
C -
SM
D/S
MT
CA
P M
LCC
0603
16V
X5R
4.7
uF10
Taiy
o Y
uden
EM
K10
7AB
J475
KA
-TM
ouse
r Ele
ctro
nics
963-
EM
K10
7AB
J475
KA
-T$0
.38
$0.7
6
101
C24
22uF
CA
PM
P73
43X
310N
CA
P T
AN
T 22
UF
35V
10%
291
7K
emet
T495
D22
6K03
5ATE
300
Dig
i-Key
399-
3880
-1-N
D$1
.39
$1.3
9
111
C26
6.2p
FC
AP
C10
05X
55N
CA
P C
ER
6.2
PF
50V
NP
0 04
02
Mur
ata
Ele
ctro
nics
Nor
thA
mer
ica
GR
M15
55C
1H6R
2DA
01D
Dig
i-Key
490-
5948
-1-N
D$0
.10
$0.1
0
122
C27
; C28
22nF
CA
PC
1005
X55
NC
AP
CE
R 0
.022
UF
50V
10%
X7R
040
2
Mur
ata
Ele
ctro
nics
Nor
thA
mer
ica
GR
M15
5R71
H22
3KA
12D
Dig
i-Key
490-
3884
-1-N
D$0
.10
$0.2
0
131
C31
20pF
CA
PC
1005
X55
NC
AP
CE
R 2
0PF
50V
2% N
P0
0402
Mur
ata
Ele
ctro
nics
Nor
thA
mer
ica
GR
M15
55C
1H20
0GA
01D
Dig
i-Key
490-
6217
-1-N
D$0
.11
$0.1
1
141
C32
0.1F
CA
PP
RD
508W
80D
1200
H85
0PC
AP
SU
PE
R 0
.1F
5.5V
RA
DIA
LK
emet
FTW
0H10
4ZF
Dig
i-Key
399-
1079
6-N
D$2
.35
$2.3
5
152
C33
; C34
0.33
uFC
AP
C16
08X
90N
CA
P C
ER
0.3
3UF
10V
10%
X5R
060
3TD
K C
orpo
ratio
nC
GA
3E2X
5R1A
334K
080A
AD
igi-K
ey44
5-12
434-
1-N
D$0
.15
$0.3
0
161
C35
0.47
uFC
AP
C16
08X
90N
CA
P C
ER
0.4
7UF
10V
10%
X5R
060
3TD
K C
orpo
ratio
nC
GA
3E2X
5R1A
474K
080A
AD
igi-K
ey44
5-12
436-
1-N
D$0
.16
$0.1
6
171
C36
0.68
uFC
AP
C16
08X
90N
CA
P C
ER
0.6
8UF
10V
10%
X5R
060
3
Mur
ata
Ele
ctro
nics
Nor
thA
mer
ica
GR
M18
8R61
A68
4KA
61D
Dig
i-Key
490-
1541
-1-N
D$0
.12
$0.1
2
181
C39
3.3u
FC
AP
C16
08X
90N
CA
P C
ER
3.3
UF
10V
10%
X5R
060
3
Mur
ata
Ele
ctro
nics
Nor
thA
mer
ica
GR
M18
8R61
A33
5KE
15D
Dig
i-Key
490-
6411
-1-N
D$0
.25
$0.2
5
191
D1
DLE
D-
660/
895-
CS
L-2
OS
I_D
LED
-660
-895
-C
SL-
2
660n
m (r
ed) L
ED
and
a co
mpa
nion
IR L
ED
895n
m s
ide
lock
erpl
astic
OS
IO
ptoe
lect
roni
csD
LED
-660
/895
-CS
L-2
OS
I Opt
oele
ctro
nics
DLE
D-6
60/8
95-C
SL-
2$4
.71
$4.7
1D
o no
t pop
ulat
e
201
D2
PIN
-8.0
-LLS
OS
I_P
IN-8
.0-L
LSP
hoto
dect
or 8
.2m
m^2
area
lead
less
cer
mic
OS
IO
ptoe
lect
roni
csP
IN-8
.0-L
LSO
SI O
ptoe
lect
roni
csP
IN-8
.0-L
LS$3
.95
$3.9
5
214
D3;
D4;
D5;
D6
BA
V99
W-7
-FS
OT6
5P21
0X11
0-3L
15N
DIO
DE
AR
RA
Y 7
5V15
0MA
SO
T323
Dio
des
Inc
BA
V99
W-7
-FD
igi-K
eyB
AV
99W
-FD
ICT-
ND
$0.2
2$0
.88
Bill
of M
ater
ials
103
03-0
01 R
ev A
Nor
thea
ster
n U
nive
rsity
http
://w
ww
.ece
.neu
.edu
/~m
nied
re/
Mob
ile P
hone
Pul
se O
xim
eter
Mai
n B
oard
; PC
B A
ssem
bly
Par
t Num
ber 1
0302
-001
; 201
4-03
-18
Item
Qty
Ref
eren
ceV
alue
Foot
prin
tD
escr
iptio
nM
anuf
actu
rer
Man
ufac
ture
r Par
t Num
ber
Sup
plie
rS
uppl
ier P
art N
umbe
rU
nit
Cos
tS
ubTo
tal
Not
es
61

221
D7
UP
S11
5UE
3/TR
7MIC
RO
SE
MI_
UP
S11
5UE
3TR
7
DIO
DE
SC
HO
TTK
Y15
V 1
A P
OW
ER
MIT
E
Mic
rose
mi
Com
mer
cial
Com
pone
nts
Gro
upU
PS
115U
E3/
TR7
Dig
i-Key
UP
S11
5UE
3/TR
7CT-
ND
$1.5
9$1
.59
231
J117
3435
4-1
TE_1
7343
54-1
CO
NN
D-S
UB
RC
PT
R/A
9P
OS
GO
LD/F
LTE
Con
nect
ivity
1734
354-
1D
igi-K
eyA
3510
7-N
D$1
.57
$1.5
7
241
J2P
PP
C10
2LJB
N-R
CS
ullin
s_P
PP
C10
2LJB
N-R
CC
ON
N F
MA
LE 2
0PO
SD
L .1
" R/A
GO
LDS
ullin
s C
onne
ctor
Sol
utio
nsP
PP
C10
2LJB
N-R
CD
igi-K
eyS
5563
-ND
$1.7
3$1
.73
251
J3S
J-43
515T
SC
UI_
SJ-
4351
5TS
CO
NN
3.5
MM
AU
DIO
JAC
K W
/TIP
SH
NT
CU
I Inc
SJ-
4351
5TS
Dig
i-Key
CP
-435
15TS
-ND
$1.3
6$1
.36
264
JP1;
JP
4;JP
5; J
P6
8266
32-2
TE_8
2663
2-2
CO
NN
HE
AD
ER
BR
KW
Y 4
PO
S V
ER
TG
OLD
TE C
onne
ctiv
ity82
6632
-2D
igi-K
eyA
1064
68-N
D$0
.62
$2.4
8
272
JP2;
JP
382
6632
-3TE
_826
632-
3
CO
NN
HE
AD
ER
BR
KW
Y 6
PO
S V
ER
TG
OLD
TE C
onne
ctiv
ity82
6632
-3D
igi-K
eyA
1145
47-N
D$0
.73
$1.4
6
281
L122
uHM
urat
a_LQ
H3N
PN
220M
M0L
IND
UC
TOR
22U
H 2
0%S
MD
Mur
ata
Ele
ctro
nics
Nor
thA
mer
ica
LQH
3NP
N22
0MM
0LD
igi-K
ey49
0-66
37-1
-ND
$0.4
3$0
.43
291
L28.
2uF
Abr
acon
_AS
PI-
0418
S-8
R2N
-T3
IND
UC
TOR
PO
WE
RM
INI 8
.2U
H 0
418
Abr
acon
Cor
pora
tion
AS
PI-0
418S
-8R
2N-T
3D
igi-K
eyA
SP
I-041
8S-8
R2N
-T3C
T-N
D$0
.45
$0.4
5
301
P1
SB
H11
-PB
PC
-D
05-S
T-B
KS
ullin
s_S
BH
11-
PB
PC
-D05
-ST-
BK
CO
NN
HE
AD
ER
2.5
4M
M 1
0PO
S G
OLD
Sul
lins
Con
nect
orS
olut
ions
SB
H11
-PB
PC
-D05
-ST-
BK
Dig
i-Key
S91
69-N
D$0
.61
$0.6
1
312
Q1;
Q3
ZXM
61N
03FT
AS
OT9
5P23
0X11
0-3L
30N
MO
SFE
T N
-CH
30V
1.4A
SO
T23-
3D
iode
s In
cZX
M61
N03
FTA
Dig
i-Key
ZXM
61N
03FC
T-N
D$0
.59
$1.1
8
322
Q2;
Q4
ZXM
61P
03FT
AS
OT9
5P23
0X11
0-3L
30N
MO
SFE
T P
-CH
30V
1.1A
SO
T23-
3D
iode
s In
cZX
M61
P03
FTA
Dig
i-Key
ZXM
61P
03FC
T-N
D$0
.59
$1.1
8
331
Q5
PM
V56
XN
SO
T95P
230X
110-
3L30
NM
OS
FET
N-C
H 2
0V3.
76A
SO
T23
NX
PS
emic
ondu
ctor
sP
MV
56X
N,2
15D
igi-K
ey56
8-65
40-1
-ND
$0.4
4$0
.44
346
R1;
R15
;R
18; R
19;
R37
; R38
100K
RE
SC
1005
X40
NR
ES
100
K O
HM
1/16
W 1
% 0
402
Sta
ckpo
leE
lect
roni
cs In
cR
MC
F040
2FT1
00K
Dig
i-Key
RM
CF0
402F
T100
KC
T-N
D$0
.04
$0.2
4
3518
R2;
R3;
R4;
R5;
R6;
R7;
R8;
R9;
R10
;R
11; R
14;
R16
; R17
;R
27; R
40;
R41
; R42
;R
430
RE
SC
1005
X40
NR
ES
0.0
OH
M 1
/16W
JUM
P 0
402
Sta
ckpo
leE
lect
roni
cs In
cR
MC
F040
2ZT0
R00
Dig
i-Key
RM
CF0
402Z
T0R
00C
T-N
D$0
.02
$0.3
6
361
R12
1KR
ES
C10
05X
40N
RE
S 1
K O
HM
1/1
6W1%
040
2S
tack
pole
Ele
ctro
nics
Inc
RM
CF0
402F
T1K
00D
igi-K
eyR
MC
F040
2FT1
K00
CT-
ND
$0.0
4$0
.04
373
R13
; R21
;R
39D
NP
RE
SC
1005
X40
ND
o no
t pop
ulat
e 04
02$0
.00
$0.0
0
381
R20
10K
RE
SC
1005
X40
NR
ES
10K
OH
M 1
/16W
5% 0
402
Sta
ckpo
leE
lect
roni
cs In
cR
MC
F040
2JT1
0K0
Dig
i-Key
F040
2JT1
0K0C
T-N
D$0
.02
$0.0
2
391
R22
560K
RE
SC
1005
X40
NR
ES
560
K O
HM
1/16
W 5
% 0
402
Sta
ckpo
leE
lect
roni
cs In
cR
MC
F040
2JT5
60K
Dig
i-Key
RM
CF0
402J
T560
KC
T-N
D$0
.02
$0.0
2
401
R23
160K
RE
SC
1005
X40
NR
ES
160
K O
HM
1/16
W 5
% 0
402
Sta
ckpo
leE
lect
roni
cs In
cR
MC
F040
2JT1
60K
Dig
i-Key
RM
CF0
402J
T160
KC
T-N
D$0
.02
$0.0
2
411
R24
200K
Bou
rns_
3224
WTR
IMM
ER
200
K O
HM
0.25
W S
MD
Bou
rns
Inc.
3224
W-1
-204
ED
igi-K
ey32
24W
-1-2
04E
CT-
ND
$3.6
4$3
.64
424
R25
; R26
;R
35; R
360
RE
SC
2012
X65
NR
ES
0.0
OH
M 1
/8W
JUM
P 0
805
Sta
ckpo
leE
lect
roni
cs In
cR
MC
F080
5ZT0
R00
Dig
i-Key
RM
CF0
805Z
T0R
00C
T-N
D$0
.03
$0.1
243
2R
28; R
29D
NP
RE
SC
2012
X65
ND
o no
t pop
ulat
e 08
05$0
.00
$0.0
0D
o no
t pop
ulat
e
441
R30
1.58
MR
ES
C15
08X
50N
RE
S 1
.58M
OH
M1/
10W
1%
060
3 S
MD
Vis
hay
Dal
eC
RC
W06
031M
58FK
EA
Dig
i-Key
541-
1.58
MH
CT-
ND
$0.0
8$0
.08
451
R31
2MR
ES
C15
08X
50N
RE
S 2
.00M
OH
M1/
10W
1%
060
3 S
MD
Vis
hay
Dal
eC
RC
W06
032M
00FK
EA
Dig
i-Key
541-
2.00
MH
CT-
ND
$0.0
8$0
.08
461
R32
3.4M
RE
SC
2012
X65
NR
ES
3.4
M O
HM
1/8
W1%
080
5S
tack
pole
Ele
ctro
nics
Inc
RM
CF0
805F
T3M
40D
igi-K
eyR
MC
F080
5FT3
M40
CT-
ND
$0.0
4$0
.04
471
R33
1MR
ES
C20
12X
65N
RE
S 1
M O
HM
1/8
W1%
080
5S
tack
pole
Ele
ctro
nics
Inc
RM
CF0
805F
T1M
00D
igi-K
eyR
MC
F080
5FT1
M00
CT-
ND
$0.0
4$0
.04
Bill
of M
ater
ials
103
03-0
01 R
ev A
Nor
thea
ster
n U
nive
rsity
http
://w
ww
.ece
.neu
.edu
/~m
nied
re/
Mob
ile P
hone
Pul
se O
xim
eter
Mai
n B
oard
; PC
B A
ssem
bly
Par
t Num
ber 1
0302
-001
; 201
4-03
-18
Item
Qty
Ref
eren
ceV
alue
Foot
prin
tD
escr
iptio
nM
anuf
actu
rer
Man
ufac
ture
r Par
t Num
ber
Sup
plie
rS
uppl
ier P
art N
umbe
rU
nit
Cos
tS
ubTo
tal
Not
es
62

481
R34
1MB
ourn
s_32
24W
TRIM
ME
R 1
M O
HM
0.25
W S
MD
Bou
rns
Inc.
3224
W-1
-105
ED
igi-K
ey32
24W
-1-1
05E
CT-
ND
$3.6
4$3
.64
491
SW
1S
D08
H1S
BC
K_S
D08
H1S
BS
WIT
CH
DIP
SP
ST
SE
ALE
D 8
PO
S 2
5VC
&K
Com
pone
nts
SD
08H
1SB
Dig
i-Key
CK
N61
29-N
D$2
.90
$2.9
0
501
T1LP
R62
35-
253P
MLB
Coi
lCra
ft_LP
R62
35-
253P
MLB
Ste
p-up
/ fly
back
trans
form
er 1
:20
Coi
lcra
ftLP
R62
35-2
53P
MLB
Coi
lcra
ftLP
R62
35-2
53P
MLB
$1.0
6$1
.06
513
TP1;
TP
38;
TP44
;K
eyst
one_
5011
TES
T P
OIN
T P
CM
ULT
I PU
RP
OS
E B
LKK
eyst
one
Ele
ctro
nics
5011
Dig
i-Key
5011
K-N
D$0
.35
$1.0
5
5222
TP2;
TP
3;TP
4; T
P5;
TP39
; TP
40;
TP41
; TP
42;
TP43
; TP
45;
TP46
; TP
47;
TP48
; TP
49;
TP50
; TP
51;
TP52
; TP
53;
TP54
; TP
55;
TP59
; TP
60c1
52h1
02t
$0.0
0D
o no
t pop
ulat
e
5335
TP6;
TP
7;TP
8; T
P9;
TP10
; TP
11;
TP12
; TP
13;
TP14
; TP
15;
TP16
; TP
17;
TP18
; TP
19;
TP20
; TP
21;
TP22
; TP
23;
TP24
; TP
25;
TP26
; TP
27;
TP28
; TP
29;
TP30
; TP
31;
TP32
; TP
33;
TP34
; TP
35;
TP36
; TP
37;
TP56
; TP
57;
TP58
;c1
14h6
4t$0
.00
Do
not p
opul
ate
541
U1
AFE
4490
RH
AT
TI_A
FE44
90R
HA
TIC
AFE
FR
ON
T E
ND
40V
QFN
Texa
s In
stru
men
tsA
FE44
90R
HA
TD
igi-K
ey29
6-35
685-
1-N
D$1
8.67
$18.
67
552
U2;
U3
AD
G33
08B
RU
ZSO
P65
P64
0X12
0-20
L30N
IC X
LATO
R 8
CH
1.2
-5.
5V 2
0-TS
SO
PA
nalo
g D
evic
esIn
cA
DG
3308
BR
UZ
Dig
i-Key
AD
G33
08B
RU
Z-N
D$4
.31
$8.6
2
561
U4
TPS
6212
0DC
NRS
OT6
5P28
0X14
5-8L
30N
IC R
EG
BU
CK
SY
NC
AD
J S
OT2
3-8
Texa
s In
stru
men
tsTP
S62
120D
CN
RD
igi-K
ey29
6-27
815-
1-N
D$2
.01
$2.0
1
571
U5
LTC
3129
EM
SE
#PB
FLi
near
_LTC
3129
EM
SE
#PB
FIC
RE
G B
UC
K B
ST
AD
J 0.
2A 1
6MS
OP
Line
ar T
echn
olog
yLT
C31
29E
MS
E#P
BF
Dig
i-Key
LTC
3129
EM
SE
#PB
F-N
D$6
.31
$6.3
1
581
X1
8.00
0MH
ZA
brac
on_A
BM
7-8.
000M
HZ-
D2Y
-TC
RY
STA
L 8M
HZ
18P
FS
MD
Abr
acon
Cor
pora
tion
AB
M7-
8.00
0MH
Z-D
2Y-T
Dig
i-Key
535-
9831
-1-N
D$1
.31
$1.3
1
$83.
61To
tal C
ost
Bill
of M
ater
ials
103
03-0
01 R
ev A
Nor
thea
ster
n U
nive
rsity
http
://w
ww
.ece
.neu
.edu
/~m
nied
re/
Mob
ile P
hone
Pul
se O
xim
eter
Mai
n B
oard
; PC
B A
ssem
bly
Par
t Num
ber 1
0302
-001
; 201
4-03
-18
Item
Qty
Ref
eren
ceV
alue
Foot
prin
tD
escr
iptio
nM
anuf
actu
rer
Man
ufac
ture
r Par
t Num
ber
Sup
plie
rS
uppl
ier P
art N
umbe
rU
nit
Cos
tS
ubTo
tal
Not
es
63

11
C1
1uF
CA
P C
ER
1U
F 4V
20%
X5R
060
3TD
K C
orpo
ratio
nY
NA
18B
3U0G
105M
Dig
i-key
445-
3720
-1-N
D$0
.94
$0.9
42
1J1
CO
NN
3.5
MM
AU
DIO
JA
CK
4 C
ON
D P
CB
CU
I Inc
SJ-
4351
4D
igi-k
eyC
P-4
3514
-ND
$1.3
1$1
.31
Mou
nt o
n bo
ttom
sid
e of
PC
B
34
J2; J
3;J4
; J5
CO
NN
BN
C J
AC
K R
/A 5
0 O
HM
PC
BTE
Con
nect
ivity
1-13
3754
3-0
Dig
i-key
A97
553-
ND
$2.0
3$8
.12
41
R1
DN
PD
o no
t pop
ulat
e$0
.00
$0.0
0
51
CB
L A
SS
Y 3
.5M
M S
LIM
6' 4
C W
HT
Tens
ility
Inte
rnat
iona
lC
orp
10-0
0332
Dig
i-key
839-
1030
-ND
$4.3
8$4
.38
63
BU
MP
ER
RE
CE
SS
ED
#4
SC
RE
W B
LAC
KK
eyst
one
Ele
ctro
nics
720
Dig
i-key
720K
-ND
$0.2
6$0
.78
Dril
l hol
e be
twee
n B
NC
con
nect
ors
for t
hird
bum
per
73
18-8
Sta
inle
ss S
teel
Pan
Hea
d P
hilli
psM
achi
ne S
crew
, 4-4
0 Th
read
, 3/8
" Len
gth
McM
aste
r-C
arr
9177
2A10
8$0
.04
$0.1
3
83
18-8
Sta
inle
ss S
teel
Gen
eral
Pur
pose
Fla
tW
ashe
r, N
umbe
r 4 S
crew
Siz
e, 5
/16"
OD
, .02
"-.0
4" T
hick
McM
aste
r-C
arr
9214
1A00
5$0
.01
$0.0
4
93
18-8
Sta
inle
ss S
teel
Inte
rnal
-Too
th L
ock
Was
her,
Num
ber 4
Scr
ew S
ize,
.27"
OD
, .01
"-.
02" T
hick
McM
aste
r-C
arr
9175
7A10
1$0
.03
$0.0
9
103
18-8
Sta
inle
ss S
teel
Mac
hine
Scr
ew H
ex N
ut,
4-40
Thr
ead
Siz
e, 1
/4" W
idth
, 3/3
2" H
eigh
tM
cMas
ter-
Car
r91
841A
005
$0.0
3$0
.08
111
CA
BLE
TIE
MO
UN
T 2-
WA
Y W
HIT
ETE
Con
nect
ivity
6088
01-1
Dig
i-key
A11
4092
-ND
$0.4
5$0
.45
121
CA
BLE
TIE
NA
TUR
AL
4" 1
8LB
TE C
onne
ctiv
ity2-
6047
71-9
Dig
i-key
2-60
4771
-9-N
D$0
.10
$0.1
0
131
18-8
Sta
inle
ss S
teel
Pan
Hea
d P
hilli
psM
achi
ne S
crew
, 6-3
2 Th
read
, 1/4
" Len
gth
McM
aste
r-C
arr
9177
2A14
4$0
.05
$0.0
5
141
18-8
Sta
inle
ss S
teel
Gen
eral
Pur
pose
Fla
tW
ashe
r, N
umbe
r 6 S
crew
Siz
e, 5
/16"
OD
, .02
"-.0
4" T
hick
McM
aste
r-C
arr
9214
1A00
8$0
.01
$0.0
1
151
18-8
Sta
inle
ss S
teel
Inte
rnal
-Too
th L
ock
Was
her,
Num
ber 6
Scr
ew S
ize,
.3" O
D, .
01"-
.03
" Thi
ckM
cMas
ter-
Car
r91
757A
103
$0.0
3$0
.03
161
18-8
Sta
inle
ss S
teel
Mac
hine
Scr
ew H
ex N
ut,
6-32
Thr
ead
Siz
e, 5
/16"
Wid
th, 7
/64"
Hei
ght
McM
aste
r-C
arr
9184
1A00
7$0
.03
$0.0
317
1ph
one_
audi
o_br
eako
ut_r
ev_a
Cus
tom
PC
BE
xpre
ssP
CB
Exp
ress
PC
B$1
7.00
$17.
00
$31.
29To
tal
Bill
of M
ater
ials
Nor
thea
ster
n U
nive
rsity
http
://w
ww
.ece
.neu
.edu
/~m
nied
re/
Pho
ne A
udio
Bre
akou
t; R
ev.A
; 201
3-11
-05
Item
Qty
Ref
eren
ceVal
ueD
escr
iptio
nM
anuf
actu
rer
Man
ufac
ture
r Par
tN
umbe
rS
uppl
ier
Sup
plie
r Par
t Num
ber
Uni
t Cos
tS
ub T
otal
Not
es
64

III. PCB LAYOUTS
65

C:\U
sers
\Pau
l\Goo
gle
Driv
e\ph
one_
puls
e_ox
\CA
D_C
AM
_Mod
els_
Cod
e\P
CB
s\10
301-
001_
Rev
A_P
hone
Pul
seO
x_M
ain_
Boa
rd.p
cb (
Silk
scre
en &
pad
s)
66

C:\U
sers
\Pau
l\Goo
gle
Driv
e\ph
one_
puls
e_ox
\CA
D_C
AM
_Mod
els_
Cod
e\P
CB
s\10
301-
001_
Rev
A_P
hone
Pul
seO
x_M
ain_
Boa
rd.p
cb (
Silk
scre
en)67
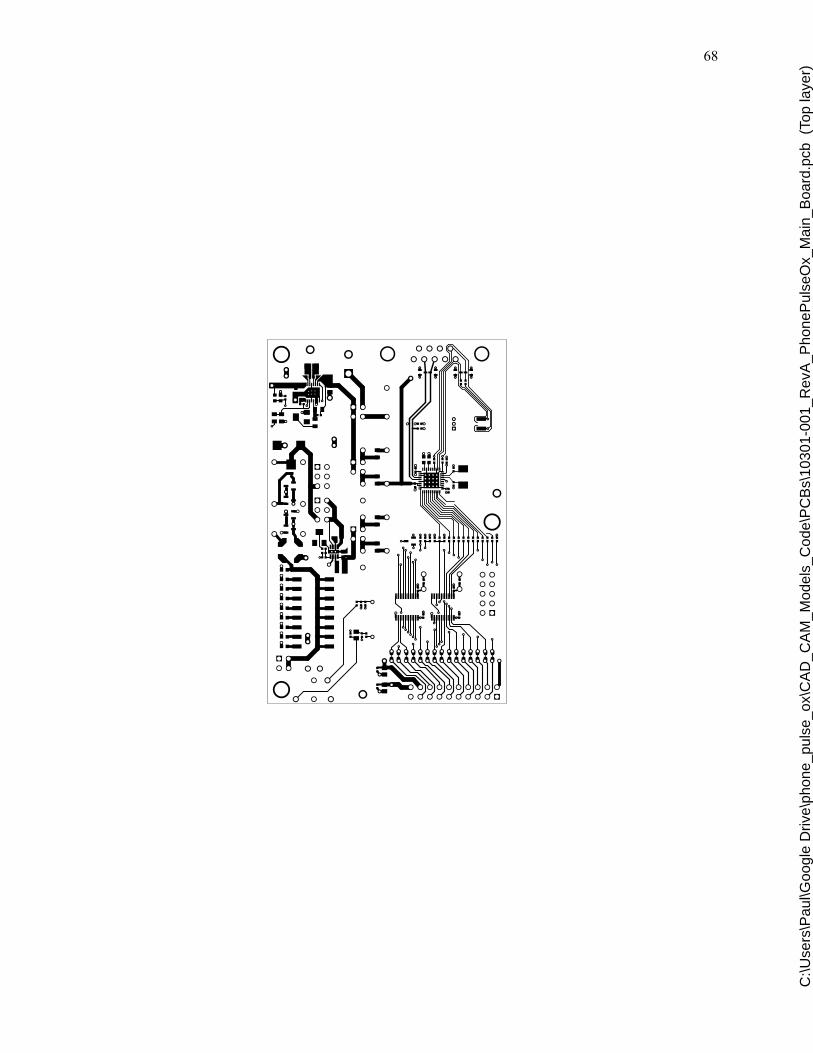
C:\U
sers
\Pau
l\Goo
gle
Driv
e\ph
one_
puls
e_ox
\CA
D_C
AM
_Mod
els_
Cod
e\P
CB
s\10
301-
001_
Rev
A_P
hone
Pul
seO
x_M
ain_
Boa
rd.p
cb (
Top
laye
r)
68

C:\U
sers
\Pau
l\Goo
gle
Driv
e\ph
one_
puls
e_ox
\CA
D_C
AM
_Mod
els_
Cod
e\P
CB
s\10
301-
001_
Rev
A_P
hone
Pul
seO
x_M
ain_
Boa
rd.p
cb (
Bot
tom
laye
r)69

All Layers
70

Top Layer
71

Bottom Layer
72

IV. ELECTRONICS CALCULATIONS
73

Nor
thea
ster
n U
nive
rsity
http
://w
ww
.ece
.neu
.edu
/~m
nied
re/
Last
Upd
ated
: 20
13-1
1-23
LTC
3129
Indu
ctor
Cur
rent
(p12
)
Inpu
t Val
ues
Cal
cula
ted
Val
ues
Max
imum
Ave
rage
Indu
ctor
Cur
rent
0.27
5A
mps
IOU
T(B
UC
K)
0.24
475
Am
ps
Dut
y C
ycle
0.4
Rat
ioIO
UT(
BO
OS
T)0.
1485
Am
ps
Effi
cien
cy0.
9R
atio
RU
N P
in C
ompa
rato
r (p1
4)
Inpu
t Val
ues
Cal
cula
ted
Val
ues
R3
1580
000
Ohm
sV
IN(T
UR
N-O
N)
2.18
38V
olts
R4
2000
000
Ohm
sR
3/R
40.
79R
atio
Max
imum
Pow
er-P
oint
Con
trol
(p15
, p21
)
Inpu
t Val
ues
Cal
cula
ted
Val
ues
R5
1960
000
Ohm
sV
in(M
PP
C)
2.32
65V
olts
R6
2000
000
Ohm
sR
5/R
60.
98R
atio
Ele
ctro
nics
Cal
cula
tions
103
04-0
01 R
ev A
Mob
ile P
hone
Pul
se O
xim
eter
Mai
n B
oard
10304-001_R
evA
_PhonePuls
eO
x_M
ain
_Board
_Calc
ula
tions -
LTC
3129
1
74

Vin
(MP
PC
)2
Vol
tsR
5/R
60.
7021
2765
9574
468
Rat
io
Pro
gram
min
g V
out (
p17)
Inpu
t Val
ues
Cal
cula
ted
Val
ues
R1(
fixed
)33
2000
0O
hms
Vou
t4.
9995
0980
3921
57V
olts
R2
1020
000
Ohm
sR
1/R
23.
2549
0196
0784
31R
atio
CFF
1.99
E-0
5Fa
rads
Des
ired
Vou
t(low
)3
Vol
tsD
esire
d R
1/R
2(lo
w)
1.55
3191
489
Rat
io
Des
ired
Vou
t(hig
h)5.
25V
olts
Des
ired
R1/
R2(
high
)3.
4680
8510
6R
atio
3340
000
R1
(fixe
d)34
0000
0
R2
(fixe
d)10
0000
0R
1/R
23.
4R
atio
R3
(trim
mer
pot
)10
0000
0V
out (
high
)5.
17V
olts
R1/
(R2+
R3)
1.7
Rat
io
Vou
t (lo
w)
3.17
25V
olts
CFF
1.94
E-0
5Fa
rads
R1+
R2+
R3
5400
000
Ohm
s
Indu
ctor
Sel
ectio
n (p
17)
Inpu
t Val
ues
Cal
cula
ted
Val
ues
Sw
itchi
ng F
requ
ency
1.2
MH
zD
ELT
A_I
L(P
-P)(
BU
CK
)0.
3021
6802
1680
217
Am
ps
Indu
ctan
ce8.
2M
icro
Hen
ryD
ELT
A_I
L(P
-P)(
BO
OS
T)0.
1133
1300
8130
081
Am
ps
10304-001_R
evA
_PhonePuls
eO
x_M
ain
_Board
_Calc
ula
tions -
LTC
3129
2
75

Sw
itch
Pin
Min
ium
Low
Tim
e0.
09M
icro
Sec
ond
Min
imum
Indu
ctor
Sat
urat
ion
Cur
rent
Rat
ing
(Buc
k)0.
4260
8401
0840
109
Am
ps
Vin
Buc
k15
Vol
tsM
inim
um In
duct
or S
atur
atio
nC
urre
nt R
atin
g (B
oost
)0.
3316
5650
4065
041
Am
ps
Vou
tBuc
k5
Vol
ts0.
09
Vin
Boo
st2.
5V
olts
Vou
tBoo
st5
Vol
ts
Out
put C
apac
itor S
elec
tion
(p19
)
Inpu
t Val
ues
Cal
cula
ted
Val
ues
Sw
itchi
ng F
requ
ency
1.2
MH
zD
elta
_V(P
-P)(
BU
CK
)0.
0004
5V
olts
I_LO
AD
0.05
Am
psD
elta
_V(P
-P)(
BO
OS
T)0.
0106
4166
6666
667
Vol
ts
Sw
itch
Pin
Min
ium
Low
Tim
e0.
09M
icro
Sec
ond
Del
ta_V
(P-P
)(B
UC
K)_
ES
R0.
0056
0538
1165
919
Vol
ts
CO
UT
10M
icro
Far
adD
elta
_V(P
-P)(
BO
OS
T)_E
SR
0.01
1210
7623
3183
9V
olts
I_LO
AD
0.05
Am
ps
R_E
SR
0.1
Ohm
s
10304-001_R
evA
_PhonePuls
eO
x_M
ain
_Board
_Calc
ula
tions -
LTC
3129
3
76

Last
Upd
ated
: 20
13-1
1-23
TPS
6212
0
Mai
n C
ontro
l Loo
p (p
17)
Inpu
t Val
ues
VIN
10V
olts
TON
0.26
Mic
ro S
econ
ds
VO
UT
2V
olts
ILP
FMpe
ak2,
080
Mill
i Am
ps
Indu
ctor
Val
ue0.
001
Mic
ro H
enry
Inpu
t Val
ues
IOU
Tmax
0.05
Am
psV
inm
in4.
67V
olts
RD
S(O
N)m
ax3.
4O
hms
RL
10O
hms
VO
UTm
ax4
Vol
ts
Inpu
t Val
ues
VR
EF
0.8
Vol
tsR
1/R
23.
5R
atio
R1
5600
00O
hms
VO
UT
3.6
Vol
ts
Ele
ctro
nics
Cal
cula
tions
103
04-0
01 R
ev A
Nor
thea
ster
n U
nive
rsity
http
://w
ww
.ece
.neu
.edu
/~m
nied
re/
Mob
ile P
hone
Pul
se O
xim
eter
Mai
n B
oard
Cal
cula
ted
Valu
es
100%
Dut
y C
ycle
Low
Dro
pout
Ope
ratio
n(p
18)
Cal
cula
ted
Valu
es
Out
put V
olta
ge S
ettin
g (p
21)
Cal
cula
ted
Valu
es
10304-001_R
evA
_PhonePuls
eO
x_M
ain
_Board
_Calc
ula
tions -
TPS62120
4
77

R2
1600
00O
hms
CFF
1.14
E-1
1Fa
rad
R3
(adj
ust)
2000
00O
hms
Inpu
t Val
ues
VIN
11V
olts
delta
_IL
0.09
1236
3636
4A
mps
VO
UT
3.28
Vol
tsIL
_max
0.05
5618
1818
1818 2
Am
ps
Indu
ctor
Val
ue22
Mic
ro H
enry
Iout
max
0.01
Am
ps
Indu
ctor
Sel
ectio
n (p
22)
Cal
cula
ted
Valu
es
10304-001_R
evA
_PhonePuls
eO
x_M
ain
_Board
_Calc
ula
tions -
TPS62120
5
78

Line
ar R
egul
ator
Line
ar R
egul
ator
Line
ar R
egul
ator
Inpu
t Vol
tage
(V)
Inpu
t Pow
er (W
)O
utpu
t Vol
tage
(V)
Out
put C
urre
nt (A
)O
utpu
t Pow
er (W
)V
olta
ge D
rop
(V)
Pow
er D
Isip
atio
n (W
)E
ffici
ency
(%)
100.
043.
30.
004
0.01
326.
70.
0268
33.0
0%
10304-001_R
evA
_PhonePuls
eO
x_M
ain
_Board
_Calc
ula
tions -
Lin
ear R
egula
tor Eff
icie
nty
6
79

Cur
rent
(A)
Res
ista
nce
(Ohm
)V
olta
ge D
rop
(V)
Pow
er (W
)
0.00
001
20.
0000
20.
0000
0000
02
1.00
E-0
52.
00E
+00
2.00
E-0
52.
00E
-10
10304-001_R
evA
_PhonePuls
eO
x_M
ain
_Board
_Calc
ula
tions -
Voltage D
rop
7
80

R10
0.16
C0.
10.
0004
7
V5
5
Cha
rge
Tim
e t (
S)
1
I (am
ps)
0.05
Par
amet
erV
alue
Equ
atio
n
Tim
e C
onst
ant T
1T
= R
*CV
olta
ge a
fter 1
RC
pas
ses
with
no
curr
ent r
estri
ctio
ns (V
)3.
1663
.2%
cha
rged
V =
0.6
3*R
C
Ene
rgy
stor
ed in
cap
acito
rs (J
oule
s,w
att -
sec
)1.
25E
= 0
.5*C
*V^2
Q (C
)0.
0021
62M
inim
um C
harg
e Ti
me
no c
urre
ntre
stric
tions
(s)
2.52
5in
stan
tane
ous
volta
ge in
cap
acito
r whe
nch
argi
ng3.
1606
0279
4V
_cap
= V
_sou
rce
*[1-
e^(-
t/RC
)]
Con
stan
t Cur
rent
Cha
rge
Tim
e (s
)10
t = (C
*V)/I
http
://w
ww
.circ
uits
.dk
/cal
cula
tor_
capa
cito
r_di
scha
rge.
htm
Con
stan
t Cur
rent
Cha
rge
Tim
e (m
in)
0.16
6666
6667
min
utes
= t
/ 60
10304-001_R
evA
_PhonePuls
eO
x_M
ain
_Board
_Calc
ula
tions -
Capacitor C
harg
e
8
81

V. MATLAB SCRIPTS
82

C:\Users\pab2906\Downloads\pox.m Wednesday, April 08, 2015 2:57 PM
% Title: Pulse Oximeter Calculations
% Description: A preliminary attempt to manipulate raw data from a Texas
% Instruments Part AFE4490.
% Revision: 2014-08-24_1
% Workspace Information
% ChIR: is the RAW IR channel
% ChIRAMBIENT: is the RAW IR ambient channel
% ChIRIRAMBIENT: is the RAW IR ambient subtracted from IR channel
% ChRED: is the RAW red channel
% ChREDAMBIENT: is the RAW red ambient channel
% ChREDREDAMBIENT: is the RAW red ambient subtracted from the red channel
% IR: is the normalized IR channel
% IRas: is the normalized IR channel with ambient subtraction
% R: is the normalized red channel
% Ras: is the normalized red channel with ambient subtraction
% clc
% clear
close all;
% load('codes.mat');
% plot raw data
figure
plot(ChIR,'DisplayName','ChIR');
hold all;
plot(ChIRAMBIENT,'DisplayName','ChIRAMBIENT');
plot(ChIRIRAMBIENT,'DisplayName','ChIRIRAMBIENT');
plot(ChRED,'DisplayName','ChRED');
plot(ChREDAMBIENT,'DisplayName','ChREDAMBIENT');
plot(ChREDREDAMBIENT,'DisplayName','ChREDREDAMBIENT');
title('RAW Data')
xlabel('N Samples')
ylabel('ADC Count')
legend('ChIR','ChIRAMBIENT', 'ChIRIRAMBIENT', 'ChRED', 'ChREDAMBIENT', 'ChREDREDAMBIENT');
hold off;
% pox calculation without ambient subtraction %%%%%%%%%%%%%%%%%%%%%%%%%%%%%
R = ChRED./mean(ChRED);
IR = ChIR./mean(ChIR);
RIR = R./IR;
% equation for spo2 derived from normalized (R/IR)
% will create a spo2 empirical lookup table for real application
% for now a linear approximation will do
SPO2 = -33.33*RIR+113.3;
SPO2_mean = mean(SPO2);
% pox calculation with ambient subtraction %%%%%%%%%%%%%%%%%%%%%%%%%%%%%%%%
Ras = ChREDREDAMBIENT/mean(ChREDREDAMBIENT);
IRas = ChIRIRAMBIENT/mean(ChIRIRAMBIENT);
RIRas = Ras./IRas;
-1-
83

C:\Users\pab2906\Downloads\pox.m Wednesday, April 08, 2015 2:57 PM
SPO2as = -33.33*RIRas+113.3;
SPO2as_mean = mean(SPO2as)
% plot normalized red/ir and red/ir ambient subraction
figure
plot(IR, 'b');
hold on;
plot(IRas, 'r');
hold on;
plot(R, 'color', [0 0.75 0.75]);
hold on;
plot(Ras, 'color', [0.75 0.75 0]);
title('Normalized Red/IR and Red/IR Ambient Subraction')
xlabel('N Samples')
ylabel('Normalized')
legend('IR','IRas','R','Ras');
hold off;
% plot spo2
n=1:length(RIR);
figure
plot(n,SPO2, 'r')
hold on;
plot(n,SPO2as, 'b')
title('SPO2')
xlabel('N Samples')
ylabel('SPO2 Percent')
legend('SPO2','SPO2as');
hold off;
% calculate blood pulse rate %%%%%%%%%%%%%%%%%%%%%%%%%%%%%%%%%%%%%%%%%%%%%%
% afe4490 pulse repetition count
prp_count = 7999;
% pulse repetition frequency PRF afe4490 datasheet notation
prf = 4e6/(prp_count+1);
% sample rate use standard notation
Fs = prf
% pulse repetition period (s)
prp = 1/prf;
% sample duration (s) see afe4490 datasheet for information
sample_duration = prp/4;
% number of samples
n = length(ChIRIRAMBIENT);
% acquisition duration
acq_duration = n*prp
-2-
84

C:\Users\pab2906\Downloads\pox.m Wednesday, April 08, 2015 2:57 PM
% time vector
time = linspace(0,acq_duration,n);
% unit frequency is nyquist frequency defined as
f_nyq = Fs/2;
% cutoff frequency (Hz)
fc = 0.5
% normalized cutoff frequency Wn
Wn = (fc/f_nyq);
% filter order
order = 6;
% high pass filter
[z,p,k] = butter(order,Wn,'high');
[sos,g] = zp2sos(z,p,k); % convert to sos form
Hd = dfilt.df2tsos(sos,g); % create a dfilt object
h = fvtool(Hd); % plot magnitude response
set(h,'Analysis','freq') % display frequency response
IRasfilt = sosfilt(sos,IRas);
% plot signal before and after filter
figure
plot(time, IRas, 'r');
hold on
plot(time, IRasfilt, 'b');
title('IRas and IRasfilt')
xlabel('Time (s)')
ylabel('Normalized')
hold off
filtstart = 3000;
filtend = 8000;
% plot data after filter converges
stlvls = statelevels(IRasfilt(filtstart:filtend));
% set max beats per minute
bpm_max = 120;
bps_max = bpm_max/60;
pulse_period_max = 1/bps_max;
pulse_period_max_samp = floor(pulse_period_max / Wn);
[pks,locs] = findpeaks(IRasfilt(filtstart:filtend),'MinPeakDistance', pulse_period_max_samp);
min = (acq_duration - time(filtstart)) / 60;
pulse_rate = length(pks) / min
-3-
85

C:\Users\pab2906\Downloads\dataimport.m Wednesday, April 08, 2015 3:01 PM
% imports spi binary data file from protocol analyzer software
% populates workspace with formatted data from AFE4490
% Revision: 2014-08-24_1
clc
clear
close all
fileID = fopen('real_data13.bin');
%fileID = fopen('adc_capture_no_error_20140623_194832.bin');
%fileID = fopen('adc_capture_20140623_194832.bin');
%raw = fread(fileID, [10000, 1], 'uint8'); % read a limited number of samples
raw = fread(fileID, 'uint8'); % read all samples
fclose(fileID);
% locate ones in raw data maxtrix
oneloc = find(raw==1);
readbitloc = 0;
readbitloccnt = 0;
% search for byte sequences in raw data to locate spi read bits
for i = 1 : numel(oneloc)
% check if previous three bytes are zero
if raw(oneloc(i)-1)==0 & raw(oneloc(i)-2)==0 & raw(oneloc(i)-3)==0
% check if next four bytes rawre zero OR 255
if ( raw(oneloc(i)+1)==0 & raw(oneloc(i)+2)==0 & raw(oneloc(i)+3)==0 & raw(oneloc(i)+4
)==0) | ( raw(oneloc(i)+1)==255 & raw(oneloc(i)+2)==255 & raw(oneloc(i)+3)==255 & raw(
oneloc(i)+4)==255)
readbitloccnt = readbitloccnt+1;
readbitloc(readbitloccnt) = oneloc(i);
end
end
end
address = 0;
dataH = 0;
dataM = 0;
dataL = 0;
for i = 1:numel(readbitloc)-12
address(i,1) = raw(readbitloc(i)+5);
dataH(i) = raw(readbitloc(i)+10);
dataM(i) = raw(readbitloc(i)+11);
dataL(i) = raw(readbitloc(i)+12);
end
% contcatenate hex data and convert
hexdata = [dec2hex(dataH) dec2hex(dataM) dec2hex(dataL)];
raw_data = hex2dec(hexdata);
data = bitand(raw_data,4194303); % bitmask to clear upper two bits 0x3FFFFF
-1-
86

C:\Users\pab2906\Downloads\dataimport.m Wednesday, April 08, 2015 3:01 PM
adr_rawdata = [address, raw_data];
adr_datawbitmask =[address, data];
ZEROcnt=0;
ALED2CONVENDcnt=0;
ALED1CONVENDcnt=0;
ADCRSTENDCT0cnt=0;
ADCRSTENDCT1cnt=0;
ADCRSTENDCT2cnt=0;
ADCRSTENDCT3cnt=0;
TIAGAINcnt=0;
CONTROL1cnt=0;
SPARE2cnt=0;
SPARE4cnt=0;
RESERVED2cnt=0;
ChREDcnt=0;
ChREDAMBIENTcnt=0;
ChIRcnt=0;
ChIRAMBIENTcnt=0;
ChREDREDAMBIENTcnt=0;
ChIRIRAMBIENTcnt=0;
ERRORcnt=0;
unknaddress=0;
% sort data into variables
for i = 1:length(address)
switch address(i)
case 0
ZEROcnt=ZEROcnt+1;
case 16
ALED2CONVENDcnt=ALED2CONVENDcnt+1;
ALED2CONVEND(ALED2CONVENDcnt,1) = data(i);
case 20
ALED1CONVENDcnt=ALED1CONVENDcnt+1;
ALED1CONVEND(ALED1CONVENDcnt,1) = data(i);
case 22
ADCRSTENDCT0cnt=ADCRSTENDCT0cnt+1;
ADCRSTENDCT0(ADCRSTENDCT0cnt,1) = data(i);
case 24
ADCRSTENDCT1cnt=ADCRSTENDCT1cnt+1;
ADCRSTENDCT1(ADCRSTENDCT1cnt,1) = data(i);
case 26
ADCRSTENDCT2cnt=ADCRSTENDCT2cnt+1;
ADCRSTENDCT2(ADCRSTENDCT2cnt,1) = data(i);
case 28
ADCRSTENDCT3cnt=ADCRSTENDCT3cnt+1;
ADCRSTENDCT3(ADCRSTENDCT3cnt,1) = data(i);
case 32
TIAGAINcnt=TIAGAINcnt+1;
TIAGAIN(TIAGAINcnt,1) = data(i);
case 30
CONTROL1cnt=CONTROL1cnt+1;
CONTROL1(CONTROL1cnt,1) = data(i);
-2-
87

C:\Users\pab2906\Downloads\dataimport.m Wednesday, April 08, 2015 3:01 PM
case 36
SPARE2cnt=SPARE2cnt+1;
SPARE2(SPARE2cnt,1) = data(i);
case 38
SPARE4cnt=SPARE4cnt+1;
SPARE4(SPARE4cnt,1) = data(i);
case 40
RESERVED2cnt=RESERVED2cnt+1;
RESERVED2(RESERVED2cnt,1) = data(i);
case 42 % 0x2A LED2VAL: LED2 Digital Sample Value Register
ChREDcnt=ChREDcnt+1;
ChRED(ChREDcnt,1) = data(i);
case 43 % 0x2B ALED2VAL: Ambient LED2 Digital Sample Value Register
ChREDAMBIENTcnt=ChREDAMBIENTcnt+1;
% check for sign bit
if(length(dec2bin(data(i)))>21)
% mask sign bit 0x1FFFFF
ChREDAMBIENT(ChREDAMBIENTcnt,1) = bitand(data(i),2097151)-2^21;
else
ChREDAMBIENT(ChREDAMBIENTcnt,1) = data(i);
end
case 44 % 0x2C LED1VAL: LED1 Digital Sample Value Register
ChIRcnt=ChIRcnt+1;
ChIR(ChIRcnt,1) = data(i);
case 45 % 0x2D ALED1VAL: Ambient LED1 Digital Sample Value Register
ChIRAMBIENTcnt=ChIRAMBIENTcnt+1;
% check for sign bit
if(length(dec2bin(data(i)))>21)
% mask sign bit 0x1FFFFF
ChIRAMBIENT(ChIRAMBIENTcnt,1) = bitand(data(i),2097151)-2^21;
else
ChIRAMBIENT(ChIRAMBIENTcnt,1) = data(i);
end
case 46 % 0x2E LED2-ALED2VAL: LED2-Ambient LED2 Digital Sample Value Register
ChREDREDAMBIENTcnt=ChREDREDAMBIENTcnt+1;
ChREDREDAMBIENT(ChREDREDAMBIENTcnt,1) = data(i);
case 47 % 0x2F LED1-ALED1VAL: LED1-Ambient LED1 Digital Sample Value Register
ChIRIRAMBIENTcnt=ChIRIRAMBIENTcnt+1;
ChIRIRAMBIENT(ChIRIRAMBIENTcnt,1) = data(i);
otherwise
ERRORcnt=ERRORcnt+1;
unknaddress(ERRORcnt,1)=address(i);
end
end
% code below removes array elements if the array lengths do not match
% this can happen if there are data capture errors
size = [ChREDcnt; ChREDAMBIENTcnt; ChIRcnt; ChIRAMBIENTcnt; ChREDREDAMBIENTcnt; ChIRIRAMBIENTcnt
; ];
max = max(size);
min = min(size);
diff = max - min;
-3-
88

C:\Users\pab2906\Downloads\dataimport.m Wednesday, April 08, 2015 3:01 PM
mode = mode(size);
var = var(size);
% make lengths match
for i=(ChREDcnt+1):max
ChRED(i) = 0;
end
for i=(ChREDAMBIENTcnt+1):max
ChREDAMBIENT(i) = 0;
end
for i=(ChIRcnt+1):max
ChIR(i) = 0;
end
for i=(ChIRAMBIENTcnt+1):max
ChIRAMBIENT(i) = 0;
end
for i=(ChREDREDAMBIENTcnt+1):max
ChREDREDAMBIENT(i) = 0;
end
for i=(ChIRIRAMBIENTcnt+1):max
ChIRIRAMBIENT(i) = 0;
end
for i=max:-1:min
ChRED(i) = [];
ChREDAMBIENT(i) = [];
ChIR(i) = [];
ChIRAMBIENT(i) = [];
ChREDREDAMBIENT(i) = [];
ChIRIRAMBIENT(i) = [];
end
size = [length(ChRED); length(ChREDAMBIENT); length(ChIR); length(ChIRAMBIENT); length(
ChREDREDAMBIENT); length(ChIRIRAMBIENT); ]
% clear the workspace
clear ChIRAMBIENTcnt ChIRIRAMBIENTcnt ChIRcnt ChREDAMBIENTcnt ChREDcnt
clear ZEROcnt ADCRSTENDCT0cnt ADCRSTENDCT1cnt ADCRSTENDCT2cnt ADCRSTENDCT3cnt
clear ALED1CONVENDcnt ALED2CONVENDcnt CONTROL1cnt RESERVED2cnt SPARE2cnt
clear SPARE4cnt TIAGAINcnt adr_rawdata diff max min mode var raw_data
clear address data dataH dataL dataM fileID hexdata unknaddress size adr_datawbitmask
clear i oneloc raw readbitloc readbitloccnt ans ERRORcnt ChREDREDAMBIENTcnt
disp('done')
-4-
89

VI. WORK BREAKDOWN STRUCTURE
90

NO
TES
Task
IDTa
skD
escr
iptio
nS
ubta
sk D
escr
iptio
n
Task
Lab
orS
ubto
tal
(FTE
)
Mat
eria
ls &
Ser
vice
s(D
olla
rs)
Not
es
1.0
0.05
1.1
1.2
Mar
ket R
esea
rch
1.3
Lice
nsin
g
2.0
0.05
2.1
Sys
tem
Req
uire
men
ts
2.2
Sys
tem
Arc
hite
ctur
e
2.3
Beh
avio
r Mod
el
2.4
Reg
ulat
ory
Res
earc
h
2.5
Doc
umen
tatio
n
3.0
3.1
PC
B L
ayou
t$2
,000
.00
3.2
PC
B F
abric
atio
n$2
,000
.00
3.3
PC
B A
ssem
bly
& R
ewor
k$2
,000
.00
3.4
Par
ts$1
,000
.00
3.5
Test
Equ
ipm
ent &
Fix
turin
g$5
,000
.00
3.6
Rap
id P
roto
typi
ng$2
,000
.00
Wor
k B
reak
dow
n S
truct
ure
Pha
se1
100
00-0
01 R
ev A
Nor
thea
ster
n U
nive
rsity
[1] 1
FTE
(ful
l tim
e eq
uiva
lent
) is
equa
l to
fifty
-two
40hr
wee
ks o
f lab
or o
r20
80hr
s/yr
http
://w
ww
.ece
.neu
.edu
/~m
nied
re/
[2] 1
FTE
bas
ed o
n $4
1,60
0 ho
urly
wag
e
Mob
ile P
hone
Pul
se O
xim
eter
PREL
IMIN
AR
YLa
st U
pdat
ed: 2
014-
01-1
8
Pro
gram
Man
agem
ent
Eng
age
Med
ical
Pro
fess
iona
ls
Sys
tem
s E
ngin
eerin
g0.
05 F
TE v
olun
teer
labo
r fro
m P
aul B
ohn
Mat
eria
ls a
nd S
ervi
ces
Two
spin
s ~6
sqi
n fo
ur la
yer b
oard
s
Two
spin
s ~1
0-20
bar
e bo
ards
per
spi
n
Two
sold
er s
tenc
ils ($
375/
ea) p
lus
3as
sem
bled
boa
rds
per s
pin
Four
enc
losu
re p
roto
type
s
Top L
eve
l
1
91

3.7
Mac
hini
ng$6
00.0
0
4.0
0.1
4.1
Res
earc
h
4.2
Pho
ne S
elec
tion
4.3
Test
ing
4.4
Test
Sof
twar
e
4.5
Doc
umen
tatio
n
5.0
0.4
5.1
Ele
ctro
nics
Des
ign
5.2
PC
B L
ayou
t
5.3
PC
B T
est &
Deb
ug
5.4
MC
U F
irmw
are
5.5
Test
Sof
twar
e
5.6
Ven
dor M
anag
emen
t
5.7
Doc
umen
tatio
n
6.0
0.2
6.1
Test
GU
I
6.2
Pul
se O
x G
UI
6.3
Doc
umen
tatio
n
7.0
0.2
7.1
Mec
hani
cal D
esig
n
7.2
Sys
tem
Pac
kagi
ng
7.3
Ven
dor M
anag
emen
t
7.4
Doc
umen
tatio
n
Day
wor
th o
f mac
hing
labo
r
Mob
ile P
hone
Stu
dy
Ele
ctro
nics
0.15
FTE
vol
unte
er la
bor f
rom
Pau
l Boh
n
May
be
Mob
ile P
hone
App
Mec
hani
cal D
esig
n an
d S
yste
m P
acka
ging
Top L
eve
l
2
92
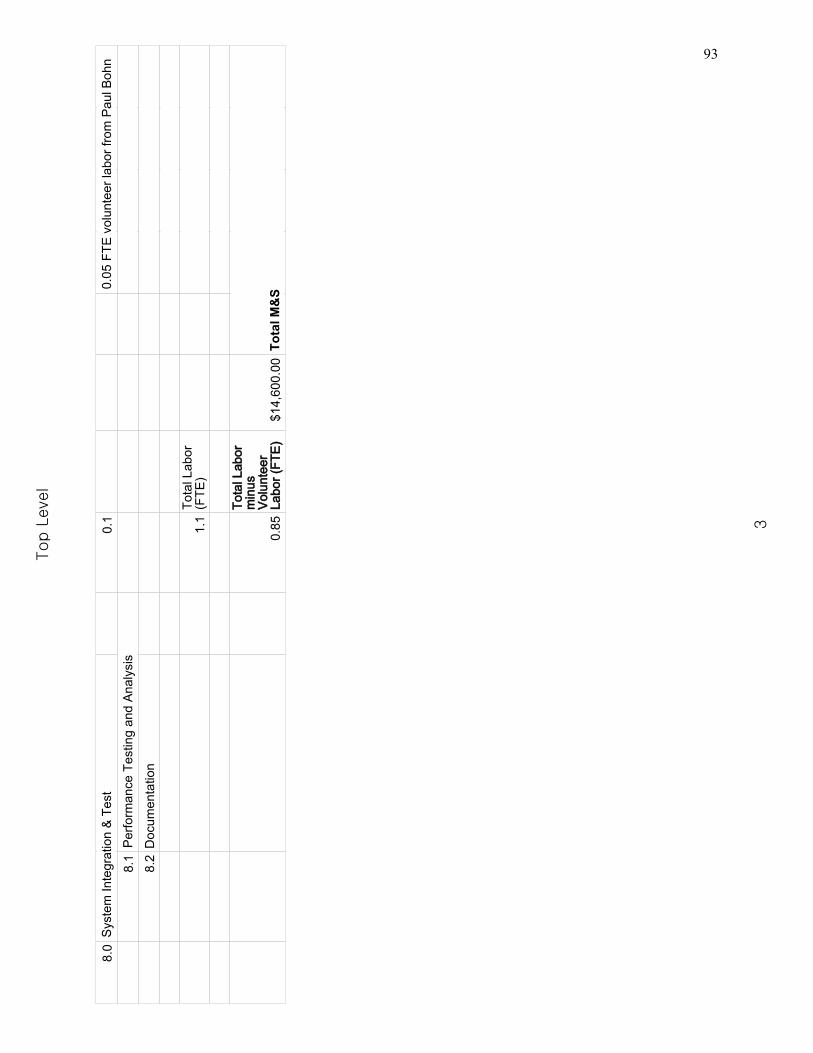
8.0
0.1
8.1
8.2
Doc
umen
tatio
n
1.1
Tota
l Lab
or(F
TE)
0.85
Tota
l Lab
orm
inus
Vol
unte
erLa
bor (
FTE
)$1
4,60
0.00
Sys
tem
Inte
grat
ion
& T
est
0.05
FTE
vol
unte
er la
bor f
rom
Pau
l Boh
n
Per
form
ance
Tes
ting
and
Ana
lysi
s
Tota
l M&
S
Top L
eve
l
3
93
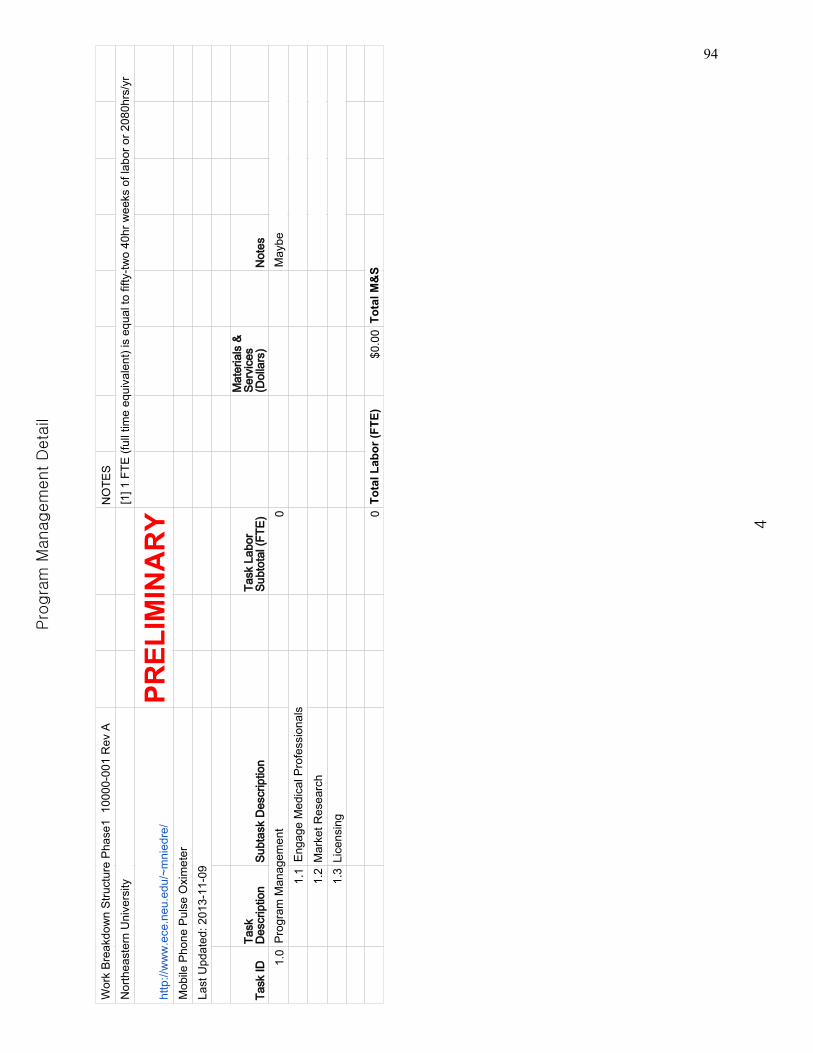
NO
TES
Task
IDTa
skD
escr
iptio
nS
ubta
sk D
escr
iptio
nTa
sk L
abor
Sub
tota
l (FT
E)
Mat
eria
ls &
Ser
vice
s(D
olla
rs)
Not
es
1.0
0
1.1
1.2
Mar
ket R
esea
rch
1.3
Lice
nsin
g
0$0
.00
Wor
k B
reak
dow
n S
truct
ure
Pha
se1
100
00-0
01 R
ev A
Nor
thea
ster
n U
nive
rsity
[1] 1
FTE
(ful
l tim
e eq
uiva
lent
) is
equa
l to
fifty
-two
40hr
wee
ks o
f lab
or o
r 208
0hrs
/yr
http
://w
ww
.ece
.neu
.edu
/~m
nied
re/
PREL
IMIN
AR
YM
obile
Pho
ne P
ulse
Oxi
met
er
Last
Upd
ated
: 201
3-11
-09
Pro
gram
Man
agem
ent
May
be
Eng
age
Med
ical
Pro
fess
iona
ls
Tota
l Lab
or (F
TE)
Tota
l M&
S
Pro
gra
m M
anagem
ent D
eta
il
4
94

NO
TES
Task
IDTa
skD
escr
iptio
nS
ubta
skD
escr
iptio
nTa
sk L
abor
Sub
tota
l (FT
E)
Mat
eria
ls &
Ser
vice
s(D
olla
rs)
Not
es
2.0
0.1
2.1
2.2
2.3
Beh
avio
rM
odel
2.3.
1
2.3.
2
2.4
2.5
Doc
umen
tatio
n
2.3.
1
2.3.
2
0.1
$0.0
0
Wor
k B
reak
dow
n S
truct
ure
Pha
se1
100
00-0
01 R
ev A
Nor
thea
ster
n U
nive
rsity
[1] 1
FTE
(ful
l tim
e eq
uiva
lent
) is
equa
l to
fifty
-two
40hr
wee
ks o
f lab
or o
r 208
0hrs
/yr
http
://w
ww
.ece
.neu
.edu
/~m
nied
re/
PREL
IMIN
AR
YM
obile
Pho
ne P
ulse
Oxi
met
er
Last
Upd
ated
: 201
3-11
-09
Sys
tem
s E
ngin
eerin
gW
AG
Sys
tem
Req
uire
men
ts
Sys
tem
Arc
hite
ctur
e
Con
cept
of O
pera
tion
Pul
se O
xim
eter
Alg
orith
m
Reg
ulat
ory
Res
earc
h
Con
cept
of O
pera
tion
Use
r
Tota
l Lab
or (F
TE)
Tota
l M&
S
Sys
tem
s E
ngin
eering D
eta
il
5
95

NO
TES
Task
IDTa
skD
escr
iptio
nS
ubta
sk D
escr
iptio
nTa
sk L
abor
Sub
tota
l (FT
E)
Mat
eria
ls &
Ser
vice
s(D
olla
rs)
Not
es
3.0
0
3.1
PC
B L
ayou
t
3.2
PC
B F
abric
atio
n
3.3
PC
B A
ssem
bly
& R
ewor
k
3.4
Par
ts
3.5
Test
Equ
ipm
ent &
Fix
turin
g
3.6
Rap
id P
roto
typi
ng
3.7
Mac
hini
ng
0$0
.00
Wor
k B
reak
dow
n S
truct
ure
Pha
se1
100
00-0
01 R
ev A
Nor
thea
ster
n U
nive
rsity
[1] 1
FTE
(ful
l tim
e eq
uiva
lent
) is
equa
l to
fifty
-two
40hr
wee
ks o
f lab
or o
r 208
0hrs
/yr
http
://w
ww
.ece
.neu
.edu
/~m
nied
re/
PREL
IMIN
AR
YM
obile
Pho
ne P
ulse
Oxi
met
er
Last
Upd
ated
: 201
3-11
-09
Mat
eria
ls a
nd S
ervi
ces
May
be
Tota
l Lab
or (F
TE)
Tota
l M&
S
Mate
rial and S
erv
ices D
eta
il
6
96
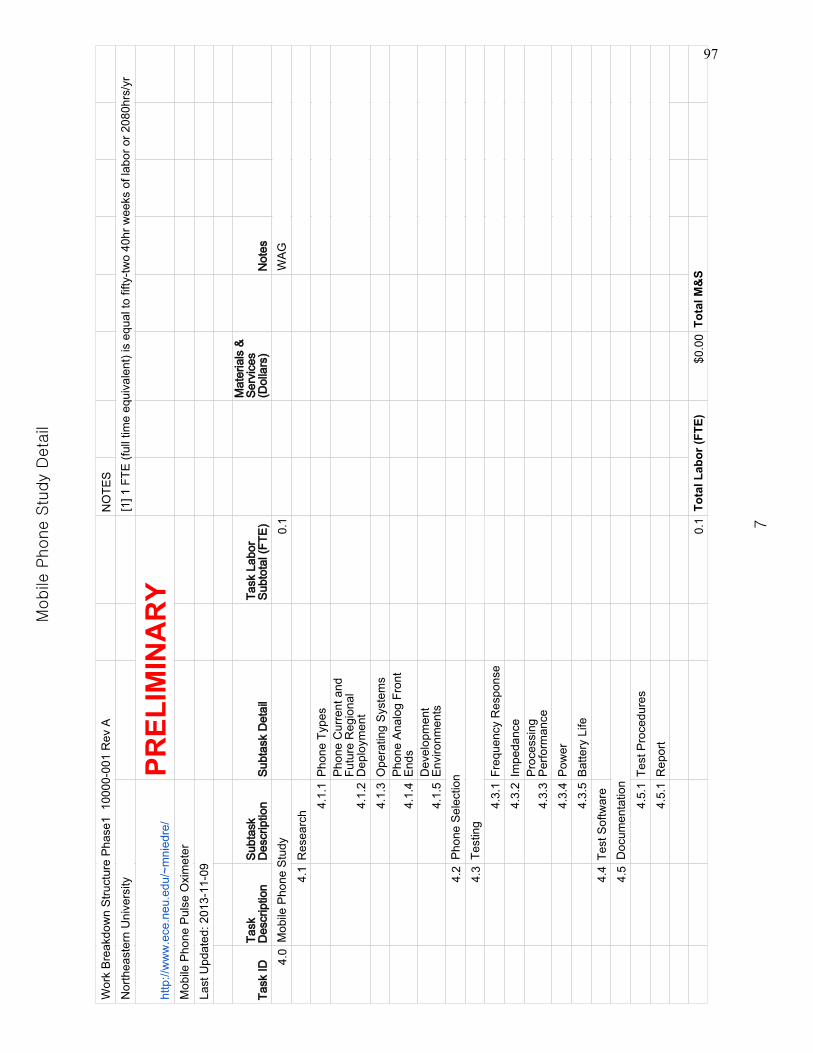
NO
TES
Task
IDTa
skD
escr
iptio
nS
ubta
skD
escr
iptio
nS
ubta
sk D
etai
lTa
sk L
abor
Sub
tota
l (FT
E)
Mat
eria
ls &
Ser
vice
s(D
olla
rs)
Not
es
4.0
0.1
4.1
Res
earc
h
4.1.
1P
hone
Typ
es
4.1.
2
Pho
ne C
urre
nt a
ndFu
ture
Reg
iona
lD
eplo
ymen
t
4.1.
3O
pera
ting
Sys
tem
s
4.1.
4P
hone
Ana
log
Fron
tE
nds
4.1.
5D
evel
opm
ent
Env
ironm
ents
4.2
4.3
4.3.
1Fr
eque
ncy
Res
pons
e
4.3.
2Im
peda
nce
4.3.
3P
roce
ssin
gP
erfo
rman
ce
4.3.
4P
ower
4.3.
5B
atte
ry L
ife
4.4
Test
Sof
twar
e
4.5
4.5.
1Te
st P
roce
dure
s
4.5.
1R
epor
t
0.1
$0.0
0
Wor
k B
reak
dow
n S
truct
ure
Pha
se1
100
00-0
01 R
ev A
Nor
thea
ster
n U
nive
rsity
[1] 1
FTE
(ful
l tim
e eq
uiva
lent
) is
equa
l to
fifty
-two
40hr
wee
ks o
f lab
or o
r 208
0hrs
/yr
http
://w
ww
.ece
.neu
.edu
/~m
nied
re/
PREL
IMIN
AR
YM
obile
Pho
ne P
ulse
Oxi
met
er
Last
Upd
ated
: 201
3-11
-09
Mob
ile P
hone
Stu
dyW
AG
Pho
ne S
elec
tion
Test
ing
Doc
umen
tatio
n
Tota
l Lab
or (F
TE)
Tota
l M&
S
Mobile
Phone S
tudy
Deta
il
7
97
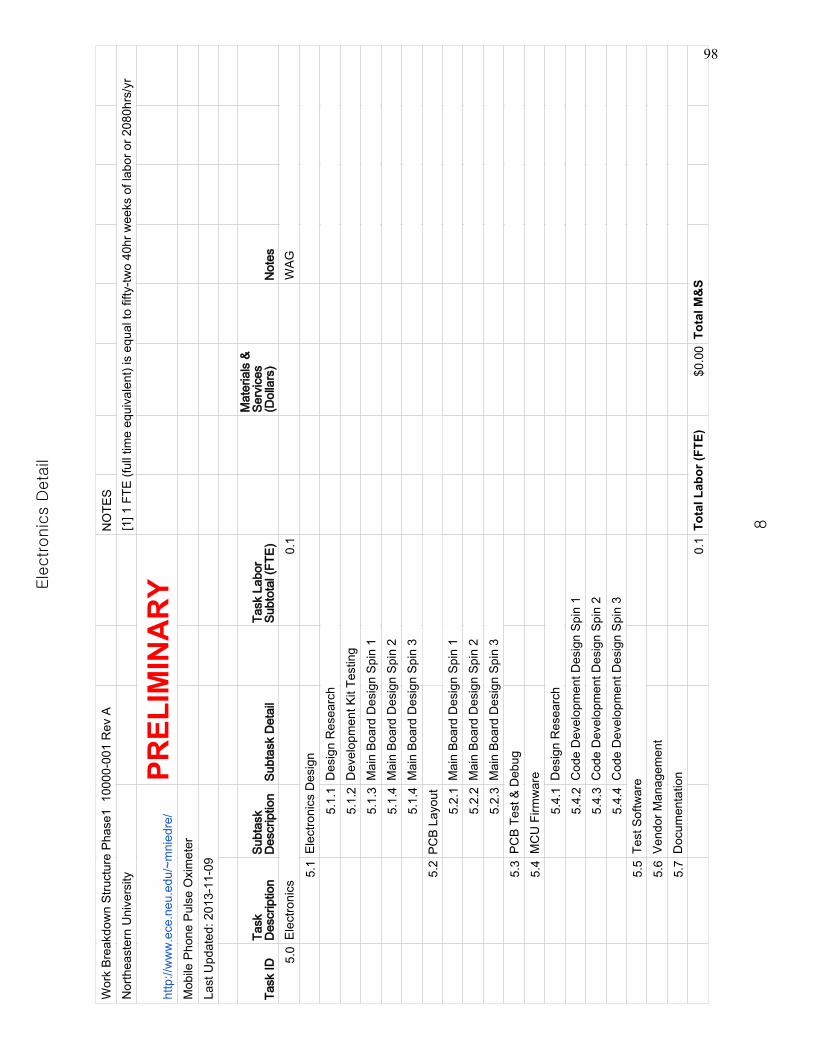
NO
TES
Task
IDTa
skD
escr
iptio
nS
ubta
skD
escr
iptio
nS
ubta
sk D
etai
lTa
sk L
abor
Sub
tota
l (FT
E)
Mat
eria
ls &
Ser
vice
s(D
olla
rs)
Not
es
5.0
0.1
5.1
5.1.
1
5.1.
2
5.1.
3
5.1.
4
5.1.
4
5.2
PC
B L
ayou
t
5.2.
1
5.2.
2
5.2.
3
5.3
5.4
5.4.
1
5.4.
2
5.4.
3
5.4.
4
5.5
5.6
5.7
0.1
$0.0
0
Wor
k B
reak
dow
n S
truct
ure
Pha
se1
100
00-0
01 R
ev A
Nor
thea
ster
n U
nive
rsity
[1] 1
FTE
(ful
l tim
e eq
uiva
lent
) is
equa
l to
fifty
-two
40hr
wee
ks o
f lab
or o
r 208
0hrs
/yr
http
://w
ww
.ece
.neu
.edu
/~m
nied
re/
PREL
IMIN
AR
YM
obile
Pho
ne P
ulse
Oxi
met
er
Last
Upd
ated
: 201
3-11
-09
Ele
ctro
nics
WA
G
Ele
ctro
nics
Des
ign
Des
ign
Res
earc
h
Dev
elop
men
t Kit
Test
ing
Mai
n B
oard
Des
ign
Spi
n 1
Mai
n B
oard
Des
ign
Spi
n 2
Mai
n B
oard
Des
ign
Spi
n 3
Mai
n B
oard
Des
ign
Spi
n 1
Mai
n B
oard
Des
ign
Spi
n 2
Mai
n B
oard
Des
ign
Spi
n 3
PC
B T
est &
Deb
ug
MC
U F
irmw
are D
esig
n R
esea
rch
Cod
e D
evel
opm
ent D
esig
n S
pin
1
Cod
e D
evel
opm
ent D
esig
n S
pin
2
Cod
e D
evel
opm
ent D
esig
n S
pin
3
Test
Sof
twar
e
Ven
dor M
anag
emen
t
Doc
umen
tatio
n
Tota
l Lab
or (F
TE)
Tota
l M&
S
Ele
ctronic
s D
eta
il
8
98

NO
TES
Task
IDTa
skD
escr
iptio
nS
ubta
skD
escr
iptio
nTa
sk L
abor
Sub
tota
l (FT
E)
Mat
eria
ls &
Ser
vice
s(D
olla
rs)
Not
es
7.0
0
7.1
7.1.
1
7.1.
2
7.1.
3
7.1.
4
7.2
7.2.
1
7.2.
2
7.3
7.4
0$0
.00
Wor
k B
reak
dow
n S
truct
ure
Pha
se1
100
00-0
01 R
ev A
Nor
thea
ster
n U
nive
rsity
[1] 1
FTE
(ful
l tim
e eq
uiva
lent
) is
equa
l to
fifty
-two
40hr
wee
ks o
f lab
or o
r 208
0hrs
/yr
http
://w
ww
.ece
.neu
.edu
/~m
nied
re/
PREL
IMIN
AR
YM
obile
Pho
ne P
ulse
Oxi
met
er
Last
Upd
ated
: 201
3-11
-09
Mec
hani
cal D
esig
n an
d S
yste
m P
acka
ging
May
be
Mec
hani
cal D
esig
n Des
ign
Res
earc
h
Des
ign
Fing
er C
lip
Des
ign
Opt
ical
Pat
h &
Lig
ht S
hrou
d
Des
ign
Cab
le S
train
Rel
ief
Sys
tem
Pac
kagi
ng
Des
ign
Res
earc
h
Des
ign
Enc
losu
re
Ven
dor M
anag
emen
t
Doc
umen
tatio
n
Tota
l Lab
or (F
TE)
Tota
l M&
S
Mechanic
al D
esig
n a
nd S
yste
m P
acka
gin
g D
eta
il
10
99

NO
TES
Task
IDTa
skD
escr
iptio
nS
ubta
skD
escr
iptio
nTa
sk L
abor
Sub
tota
l (FT
E)
Mat
eria
ls &
Ser
vice
s(D
olla
rs)
Not
es
8.0
0.1
8.1
8.1.
1
8.1.
2
8.1.
3
8.2
Doc
umen
tatio
n 8.2.
1
8.2.
2
0.1
$0.0
0
Wor
k B
reak
dow
n S
truct
ure
Pha
se1
100
00-0
01 R
ev A
Nor
thea
ster
n U
nive
rsity
[1] 1
FTE
(ful
l tim
e eq
uiva
lent
) is
equa
l to
fifty
-two
40hr
wee
ks o
f lab
or o
r 208
0hrs
/yr
http
://w
ww
.ece
.neu
.edu
/~m
nied
re/
PREL
IMIN
AR
YM
obile
Pho
ne P
ulse
Oxi
met
er
Last
Upd
ated
: 201
3-11
-09
Sys
tem
Inte
grat
ion
& T
est
WA
G
Per
form
ance
Tes
ting
and
Ana
lysi
s
Mea
sure
men
t Qua
lity
Use
r Exp
erie
nce
Pow
er A
naly
sis
Pro
cedu
res
Rep
orts
Tota
l Lab
or (F
TE)
Tota
l M&
S
Sys
tem
Inte
gra
tion &
Test D
eta
il
11
100

VII. WORK STATUS UPDATES
101

Mobile Phone Pulse Oximeter Project Status Updates
Northeastern University
09/7/2014 03/31/2015 Paul Bohn
● Worked on thesis document 08/31/2014 09/06/2014 Paul Bohn
● Distributed information to capstone team members ● Wrote short tutorial on how to load mcu project code ● Worked on thesis document
08/24/2014 08/30/2014 Paul Bohn
● Met with Mark Niedre to discuss progress ● Collected a lot data ● Created slideshow with latest results
○ figured out register settings for AFE4490 ● Attended telecon with capstone group
08/17/2014 08/23/2014 Paul Bohn
● Identified schematic error ○ On board photodiode pinout is reversed ○ Modified custom PCB to fix photodiode pin reversal
● Updated schematic ● MCU Code
○ Added diagnostic code ○ Changed power up sequence
08/10/2014 08/16/2014 Paul Bohn
● Successfully powered up custom device (LED lights up and ADC samples) and
1 of 18 10003001
102

Mobile Phone Pulse Oximeter Project Status Updates
Northeastern University
captured real data for the first time! ● Offered to provide a bare PCB to capstone team members for hardware development
testing ● Provided capstone team members with a list of task options that would drive to project
forward ● Suggested that capstone team members should call me on the phone so I can help
them with task planning ● MCU Code
○ Configured/wrote default register settings into AFE4490 ○ Refined AFE4490 register settings and added comments ○ Fixed gpio pin assignment errors ○ Setup pin interrupt service to capture data when ADC_RDY signal goes high
● Shared MCU code with capstone group 08/03/2014 08/09/2014 Paul Bohn
● Completed preliminary MCU SPI code to read and write AFE4490 registers ○ Successfully wrote registers to custom board
● Attempted to coordinate meeting with capstone team members 07/27/2014 08/02/2014 Paul Bohn
● Completed the development of a MATLAB script that will import a binary file containing raw AFE4400 SPI data into the workspace. The script parses the raw data into matrices that correspond to AFE4400 registers. The data was captured with a Total Phase Beagle SPI protocol analyzer.
● Processed the imported raw SPI data with analysis script pox.m ● Removed power to ground short on second custom PCB by cutting trace away ● Tested power supplies on second custom PCB
○ The board comes up fine 07/20/2014 07/26/2014 Paul Bohn
● Developing a MATLAB script that will import RAW AFE4400 data from a SPI protocol
2 of 18 10003001
103

Mobile Phone Pulse Oximeter Project Status Updates
Northeastern University
analyzer 07/13/2014 07/19/2014 Paul Bohn
● Released preliminary MATLAB script for analyzing RAW AFE4400 data ● Communicated with Dan Thompson via email. Pointed him towards information that is
pertinent to MCU cell phone communication. ● Developing a MATLAB script that will import RAW AFE4400 data from a SPI protocol
analyzer 07/06/2014 07/12/2014 Paul Bohn
● Developing MATLAB script pox.m to analyze RAW AFE4400 data 06/29/2014 07/05/2014 Paul Bohn
● Developing MATLAB script to analyze RAW AFE4400 data ○ Able to calculate rough SPO2 values
06/22/2014 06/28/2014 Paul Bohn
● Completed SPI data capture slide show ● Developing MATLAB script to analyze RAW AFE4400 data
06/15/2014 06/21/2014 Paul Bohn
● Provided cost estimate information ● Created SPI data capture slide show
3 of 18 10003001
104

Mobile Phone Pulse Oximeter Project Status Updates
Northeastern University
06/08/2014 06/14/2014 Paul Bohn
● Added SPI code to project directory ● On campus meeting
○ Turned over hardware to capstone team ● Started work to grab SPI data from development board (requires hardware mod)
05/01/2014 06/07/2014 Paul Bohn
● Installed LEDs on development boards ● Development of SPI MCU code
05/25/2014 05/31/2014 Paul Bohn
● Bringing capstone team uptospeed by distributing project information ● Development of SPI MCU code
05/18/2014 05/24/2014 Paul Bohn
● Updated the 10100001_RevA_PhonePulseOx_Development_Plan ● Met with capstone team ● Bringing capstone team uptospeed by distributing project information ● Contacted Chris Poling from ProTEQ Solutions to get a loaner Oscilloscope
05/11/2014 05/17/2014 Paul Bohn
● Updated the 10100001_RevA_PhonePulseOx_Development_Plan ● Met with Gunar and Mark to discuss project and how to bring in capstone group ● Going through MCU training material
05/04/2014 05/10/2014
4 of 18 10003001
105

Mobile Phone Pulse Oximeter Project Status Updates
Northeastern University
Paul Bohn ● Going through MCU training material
04/27/2014 05/03/2014 Paul Bohn
● Archived Janki’s reports and software to project folder ○ https://drive.google.com/?authuser=0#folders/0Bw57FuC6l3MXU1VFWUhFMllDbDg
● Experimented with TI AFE4400 Dev Kit ● Requested, secured, and reviewed source code for TI dev kit ● Going through MCU training material
○ http://www.silabs.com/support/training/Pages/onlinetraining.aspx ○ Reading data sheets etc.
04/20/2014 04/26/2014 Paul Bohn
● Visited NEU picked up TI AFE4400 Dev Kit ● Going through MCU training material
○ http://www.silabs.com/support/training/Pages/onlinetraining.aspx
● Located Totalphase SPI debugger cable ● Consolidated all project parts and equipment ● Requested assistance to build a future team to complete the project
04/06/2014 04/12/2014 Paul Bohn
● Attended Monday team meeting
5 of 18 10003001
106

Mobile Phone Pulse Oximeter Project Status Updates
Northeastern University
) ○ uploaded full project directories ○ created directories for source code development
■ 10305001_Firmware ■ 10400001_Test_App ■ 10401001_POx_App
● Submitted solder paste gerber file to assembly house ● Supported board assembly by answering questions ● Attended Monday team meeting ● Received boards on Friday (3/28) ● Started testing board
○ identified and fixed minor layout error ○ voltage regulators power up and adjust ○ confirmed device can be powered by a cell phone
03/16/2014 03/22/2014
6 of 18 10003001
107

Mobile Phone Pulse Oximeter Project Status Updates
Northeastern University
Paul Bohn ● Packaged and edited PCB design files for archival ● Put parts kit together ● Shipped parts kit to assembly house ● Researched DXF to Gerber file conversion so a so a solder paste stencil can be made ● Generated a solder paste gerber file from a dxf file using linkcad7 and gerbv ● Attended Monday team meeting ● Met with Prof. Mark Niedre to give a status update
03/09/2014 03/15/2014 Paul Bohn
● Purchased Gerber Files ● PCBs arrived ● Newark parts arrived ● Digikey parts should arrive early next week ● Attended Monday team meeting
03/02/2014 03/08/2014 Paul Bohn
● Submitted Digikey order (Web ID 49783172 Access ID 76224) ● Updated 10900001_RevA_PhonePulseOx_Part_Numbering ● Submitted Newark Electronics order ● Submitted ExpressPCB order
02/23/2014 03/01/2014 Paul Bohn
● Completed PCB Layout ● Updated schematic, BOM, and Digikey order (Web ID 49783172 Access ID 76224) ● Sent design to a very experienced electrical engineer for review ● Requested quote from assembly house and worked out a deal for free assembly
service.
7 of 18 10003001
108

Mobile Phone Pulse Oximeter Project Status Updates
Northeastern University
● Attended Monday team meeting 02/16/2014 02/22/2014 Paul Bohn
● Sent information to Janki on PCB design ● Routing PCB ● Updated schematic, BOM, and Digikey order
02/09/2014 02/15/2014 Paul Bohn
● Attended Monday team meeting ● Did a factory restore on Janki’s new laptop ● Made PCB footprint ● Modified schematic ● Completed rough PCB parts placement ● Worked on Digikey order. It is basically complete at this point. ● Requested information from OSI Optics ● Started team building and recruitment
○ Identified four potential team members ● Started routing PCB
8 of 18 10003001
109

Mobile Phone Pulse Oximeter Project Status Updates
Northeastern University
01/26/2014 02/01/2014 Paul Bohn
● Worked on proposal text ● Received budgetary pricing for Fluke Spo2 device $2000.00 ● Worked on design description write up ● Met with Coilcraft sales engineer. Can get any number of free samples. Modified and
custom inductor designs are possible ● Met with Janki and discussed cell phone app. Started to development of app behavior
model ● Researched Android market penetration in the developing world
01/19/2014 01/25/2014 Paul Bohn
● Wrote draft proposal text ● Updated work breakdown structure and budget ● Worked on design description write up ● Request quote for SPO2 tester ● Supported Tier1 seed grant proposal preparations
01/12/2014 01/18/2014 Paul Bohn
● Worked on pcb footprints ● Updated BOM ● Requested information from new NEU group “ENABLE” ● NEU campus meeting ● Created a Google Drive tutorial ● Developed strawman proposal document ● Created proposal budget ● Encouraged Janki to balance spring14 schedule to make time for this project
01/05/2014 01/11/2014 Paul Bohn
10 of 18 10003001
110

Mobile Phone Pulse Oximeter Project Status Updates
Northeastern University
● Worked on pcb footprints ● Started digikey order: Web ID 49783172 Access ID 76224 ● Updated BOM
12/29/2013 01/04/2014 Paul Bohn
● Parts from TI have arrived ● Consolidated parts to one box ● Worked on pcb footprints ● Updated BOM
12/22/2013 12/28/2013 Paul Bohn
● Parts came in from OSI Optoelectronics ● Parts from TI have shipped
○ Went with AFE4490 because AFE4400 was backordered 12/15/2013 12/21/2013 Paul Bohn
● Updated 10303001_RevA_PhonePulseOx_Main_Board_BOM to include part package dimensions
● Making PCB footprints for the circuit board layout ● Requested samples from Texas Instruments and OSI Optoelectronics
12/08/2013 12/14/2013 Paul Bohn
● Updated 10303001_RevA_PhonePulseOx_Main_Board_BOM to include PCB footprints
● Making PCB footprints for the circuit board layout
11 of 18 10003001
111

Mobile Phone Pulse Oximeter Project Status Updates
Northeastern University
● Researched Design Spark CAD tools for next version ○ http://www.designspark.com/
Mark Nakib
● Returned Analog Discovery to Ufuk Muncuk 12/01/2013 12/07/2013 Paul Bohn
● Worked on schematic and submitted draft for review ● Updated 10303001_RevA_PhonePulseOx_Main_Board_BOM ● Making PCB footprints for the circuit board layout ● Started designing an integrated PCB sensor ● Secured samples from
○ Coilcraft ○ Linear Technology
● Parts from OSI Optoelectronics are being shipped from overseas ● Attended meeting at NEU
11/24/2013 11/30/2013 Paul Bohn
● Worked on schematic and power calculations ○ Schematic is close to completion
● Requested samples from ○ Coilcraft ○ OSI Optoelectronics ○ Linear Technology ○ Silicon Labs
● Contacted Fluke medical and Silicon Labs ● Updated Google Doc 10101001_RevA_PhonePulseOx_Documentation ● Organized project directory ● Installed Google Drive for PC to streamline workflow
11/17/2013 11/23/2013 Paul Bohn
12 of 18 10003001
112

Mobile Phone Pulse Oximeter Project Status Updates
Northeastern University
● Watched WHO pulse ox training video ● Worked on schematic and bill of materials for main board ● Created main board calculations spreadsheet ● Organized project folder and added documentation ● Applied part numbers to project files ● Design research
○ Selected parts ○ Read datasheets ○ Reviewed reference designs ○ Reviewed reference material ○ Reviewed code
Janki Bhimani
● Did reverse engineering and to the operation algorithm from code of AFE4400 ● found on which formulae it works ● traced the algorithm of operation
11/10/2013 11/16/2013 Paul Bohn
● Worked on development plan slideshow ● Made some mobile phone cartoons for slideshow ● Updated part numbering for documentation ● Capturing schematic for main PCB ● Absorbing training material created by the World Health Organization
Mark Nakib
● Installed analog discovery software ● Began experimenting to become more familiar with system
11/03/2013 11/09/2013 Paul Bohn
● Made another pass at WBS task details ● Worked on development plan slide show ● Updated audio breakout board documentation
13 of 18 10003001
113

Mobile Phone Pulse Oximeter Project Status Updates
Northeastern University
● Committed audio breakout board to SVN ● Tracked down analog discovery ADI module ● Added a mobile phone study section to PhonePulseOx_Documentation ● Performed design research
Mark Nakib
● Picked up analog discovery 10/27/2013 11/02/2013 Paul Bohn
● Started a development plan slide show ● Installed TI AFE4400 development kit GUI ● Updated phone audio breakout BOM ● Assembled and tested 3 phone audio breakout boards ● Delivered phone audio breakout boards to NEU ● Updated file directory structure readme ● Created budget tracking spreadsheet ● Created configuration management part number assignment spreadsheet
Mark Nakib
● Met with Paul to pick up audio breakout boards 10/20/2013 10/26/2013 Paul Bohn
● Researched Silicon Labs Gecko MCU families ● Worked on schematic capture for cell phone pulse oximeter ● Updated nuForge wikipages ● Updated Phone Pulse Oximeter Google Document with design requirements ● Made first cut at an action item list ● Installed TortoiseSVN ● Research version control methods ● Status update meeting with Mark Niedre ● Started development of a work breakdown structure
Janki Bhimani
14 of 18 10003001
114

Mobile Phone Pulse Oximeter Project Status Updates
Northeastern University
● Retrieved dev kit from Mark Nidre ● Installed TI AFE4400 development kit GUI ● Experimented with TI AFE4400 development kit
Mark Nakib
● Researched mobile phone sinewave generator applications ● Requested source code for mobile phone application software ● Researched mobile phone software development
10/13/2013 10/19/2013 Paul Bohn
● Released first version of system block diagram ● Submitted project background reading material to team members ● Created project action item list ● Created instructions to submit ExpressPCB order ● Met with Janki and divided up tasks ● Started schematic capture for cell phone pulse oximeter ● Researched Silicon Labs Gecko MCU families ● Updated nuForge wikipages ● Updated Phone Pulse Oximeter Google Document
10/06/2013 10/12/2013 Paul Bohn
● Completed cell phone audio breakout board PCB layout and documentation ● Submitted breakout board design for review ● Made PCB footprint for AFE4400 ● Reviewed development board schematic ● Started to develop system block diagram
9/29/2013 10/05/2013
15 of 18 10003001
115

Mobile Phone Pulse Oximeter Project Status Updates
Northeastern University
Paul Bohn
● Completed a detailed read of AFE4400 datasheet ● Completed detailed read of AFE4400 development kit user guide ● Evaluated DesignSpark CAD tools as a possible longer term solution ● Installed and used PCB Library Expert 2013 to aid layout
9/22/2013 9/28/2013 Paul Bohn
● Started to layout PCB for cell phone audio breakout board ○ using express pcb for design (http://www.expresspcb.com/)
● Met with PI on 9/23 to discuss embedded design ● Submitted items for purchasing ● Started reading AFE4400 datasheet ● Started to record design goals in design documentation
9/15/2013 9/21/2013 Paul Bohn
● Performed some design research ● Started development of a cell phone audio breakout test fixture
○ captured schematic ● Created bill of materials for audio breakout test fixture ● First parts arrived on 9/17 from allheart second order came in on 9/20 ● Started to take a closer look at the TI AFE4400 ● Read a paper AudioDAQ: Turning the Mobile Phone's Ubiquitous Headset Port into a
116

Mobile Phone Pulse Oximeter Project Status Updates
Northeastern University
● Gathered costing information for dev kits and parts ○ https://docs.google.com/spreadsheet/ccc?key=0Ag57FuC6l3MXdHFpSEZOSG
hUZnU1M3BYSXp4M2JtbVE#gid=0 ● Decided to develop the following as intermediate steps
○ Cell phone audio jack interface test fixture ○ Digital Stethoscope
● Purchased parts from medical supplier allheart
117
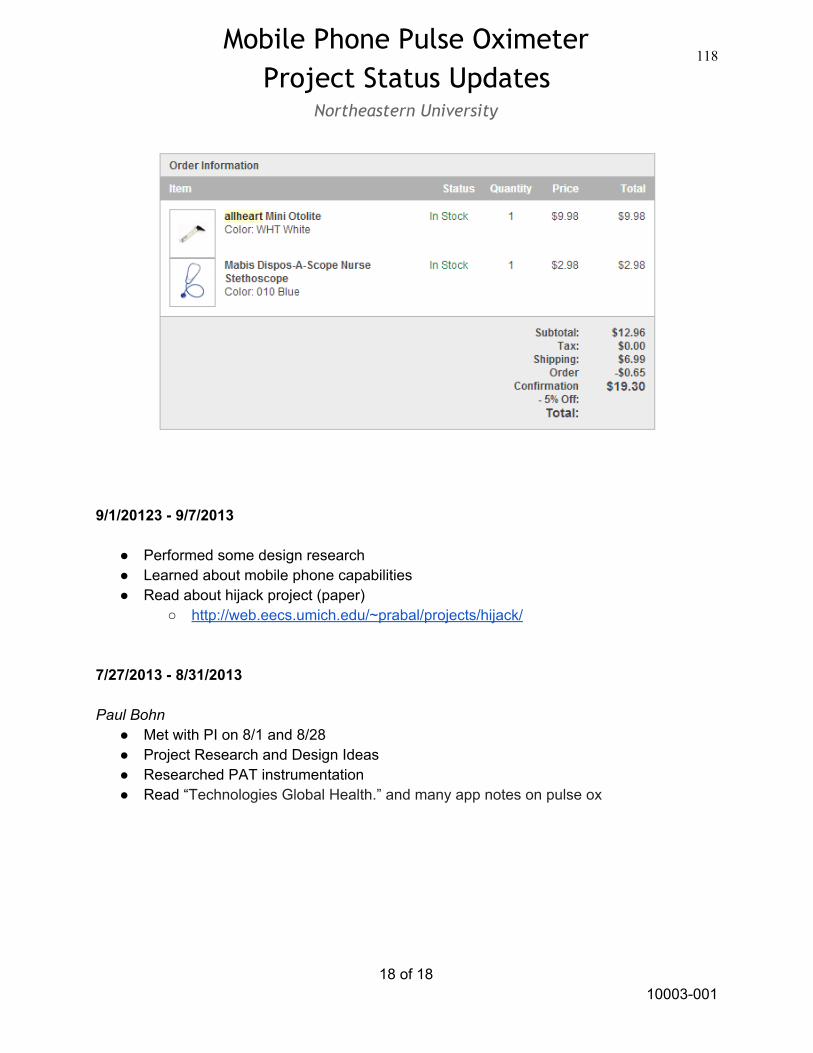
Mobile Phone Pulse Oximeter Project Status Updates
Northeastern University
9/1/20123 9/7/2013
● Performed some design research ● Learned about mobile phone capabilities ● Read about hijack project (paper)
○ http://web.eecs.umich.edu/~prabal/projects/hijack/ 7/27/2013 8/31/2013 Paul Bohn
● Met with PI on 8/1 and 8/28 ● Project Research and Design Ideas ● Researched PAT instrumentation ● Read “Technologies Global Health.” and many app notes on pulse ox
18 of 18 10003001
118

VIII. PART NUMBERING SYSTEM
119

Par
t Num
ber
Suf
fix N
umbe
rR
evis
ion
Task
Doc
umen
t Typ
eS
oftw
are
Des
crip
tion
Not
es
1000
000
1A
Pro
gram
Man
agm
ent
Goo
gle
Spr
eads
heet
Goo
gle
Driv
eW
ork
Bre
ak D
own
Stru
ctur
e P
hase
1
1000
100
1A
Pro
gram
Man
agm
ent
Goo
gle
Spr
eads
heet
Goo
gle
Driv
eW
ork
Bre
ak D
own
Stru
ctur
e P
hase
2
1000
200
1A
Pro
gram
Man
agm
ent
Goo
gle
Spr
eads
heet
Goo
gle
Driv
eB
udge
t Tra
ckin
g
1000
300
1A
Pro
gram
Man
agm
ent
Goo
gle
Doc
umen
tG
oogl
e D
rive
Wor
k S
tatu
s U
pdat
es
1010
000
1A
Sys
tem
s E
ngin
eerin
gG
oogl
e P
rese
ntat
ion
Goo
gle
Driv
eP
rodu
ct D
evel
opm
ent P
lan
1010
100
1A
Sys
tem
s E
ngin
eerin
gG
oogl
e D
ocum
ent
Goo
gle
Driv
eD
esig
n D
ocum
enta
tion
1010
200
1A
Sys
tem
s E
ngin
eerin
gG
oogl
e D
raw
ing
Goo
gle
Driv
eS
yste
m D
iagr
am
1010
300
1A
Sys
tem
s E
ngin
eerin
gM
ATL
AB
Scr
ipt
MA
TLA
BD
ata
anal
ysis
alg
orith
ms
1010
300
1B
Sys
tem
s E
ngin
eerin
gM
ATL
AB
Scr
ipt
MA
TLA
BD
ata
impo
rt an
d an
alys
is a
lgor
ithm
s
1010
300
1C
Sys
tem
s E
ngin
eerin
gM
ATL
AB
Scr
ipt
MA
TLA
BD
ata
impo
rt an
d an
alys
is a
lgor
ithm
s
1010
300
1D
Sys
tem
s E
ngin
eerin
gM
ATL
AB
Scr
ipt
MA
TLA
BD
ata
impo
rt an
d an
alys
is a
lgor
ithm
s
1010
400
1A
Sys
tem
s E
ngin
eerin
gG
oogl
e D
ocum
ent
Goo
gle
Driv
eM
S T
hesi
s
1020
000
1A
Mob
ile P
hone
Stu
dyG
oogl
e D
ocum
ent
Goo
gle
Driv
eN
ot s
tarte
d
1030
000
1A
Ele
ctro
nics
Sch
emat
icE
xpre
ssP
CB
Mob
ile P
hone
Pul
se O
xim
eter
Mai
n B
oard
1030
100
1A
Ele
ctro
nics
PC
B L
ayou
tE
xpre
ssP
CB
Mob
ile P
hone
Pul
se O
xim
eter
Mai
n B
oard
1030
200
1A
Ele
ctro
nics
PC
B A
ssem
bly
Ado
be A
crob
atM
obile
Pho
ne P
ulse
Oxi
met
er M
ain
Boa
rd
1030
300
1A
Ele
ctro
nics
Bill
of M
ater
ials
Goo
gle
Spr
eads
heet
Mob
ile P
hone
Pul
se O
xim
eter
Mai
n B
oard
1030
400
1A
Ele
ctro
nics
Ele
ctro
nics
Cal
cula
tions
Goo
gle
Spr
eads
heet
Mob
ile P
hone
Pul
se O
xim
eter
Mai
n B
oard
1030
500
1A
Ele
ctro
nics
Gec
ko A
RM
MC
US
ourc
e C
ode
STK
3300
Gec
kco
MC
U F
irmw
are
for
Mob
ile P
hone
Pul
se O
xim
eter
Mai
n B
oard
1030
2-00
1
1040
000
1A
Mob
ile P
hone
App
And
roid
Sou
rce
Cod
eM
obile
Pho
ne T
est G
UI
1040
100
1A
Mob
ile P
hone
App
And
roid
Sou
rce
Cod
eM
obile
Pho
ne P
ulse
Oxi
met
er A
ppN
ot s
tarte
d
1050
000
1A
Mec
hani
cal D
esig
n an
dS
yste
ms
Pac
kagi
ngN
ot s
tarte
d
1060
000
1A
Sys
tem
Inte
grat
ion
& T
est
Pre
sent
atio
nM
S P
ower
poin
tTI
AFE
4400
SP
I Dat
a C
aptu
re
1060
100
1B
Sys
tem
Inte
grat
ion
& T
est
Pre
sent
atio
nM
S P
ower
poin
tP
relim
inar
y P
OX
Dat
a A
naly
sis
1060
200
1A
Sys
tem
Inte
grat
ion
& T
est
Pre
sent
atio
nM
S P
ower
poin
tP
relim
inar
y P
OX
Dat
a A
naly
sis�
with
Cus
tom
Har
dwar
e
1070
000
1A
Pro
duct
ion
Not
sta
rted
1080
000
1A
Qua
lity
Not
sta
rted
1090
000
1A
Con
figur
atio
n M
anag
emen
tG
oogl
e S
prea
dshe
etG
oogl
e D
rive
Par
t Num
berin
g S
yste
m
Par
t Num
berin
g S
yste
m 1
0900
-001
Rev
A
Nor
thea
ster
n U
nive
rsity
http
://w
ww
.ece
.neu
.edu
/~m
nied
re/
Mob
ile P
hone
Pul
se O
xim
eter
Last
Upd
ated
: 201
5-03
-01
120

ABOUT THE AUTHOR
From a very early age, Paul Aaron Bohn wanted to know how things worked. Ultimately,
this led to his desire to become an engineer. He pursued hobbies and activities that involved
hands-on experience such as amateur radio, model making, building toys, and repairing products.
He has worked for electrical contractors, general contractors, a violin maker, research
organizations, and, as a teenager, started a machining business.
Paul studied Electrical Engineering in a joint undergraduate program at University of
Missouri-St. Louis and Washington University in St. Louis. In 2005, he transferred to
Northeastern University and graduated two years later with a Bachelor of Science in Electrical
Engineering. He previously worked for the Boston University Electronics Design Facility where
he developed equipment for scientific research. Paul is currently a Member Technical Staff in the
Imaging and Sensor Systems Group at The Charles Stark Draper Laboratory.
Paul enjoys developing prototypes that demonstrate new capability, and all of the
multidisciplinary aspects of engineering that are required to bring prototypes to fruition. He has
had the opportunity to work on a broad range of projects. For instance, he has developed devices
for medical research, surface physics, high energy physics, biological research, energy sector,
imaging, precision timing, communication systems, remote sensing, particle detection, guidance,
navigation, and control.
One of Paul’s other passions includes music. He is a founding member of Juventas New
Music Ensemble where he served as the President of the Board of Directors, and Chairmen of the
governance committee. He played an integral part in the incorporation and filing for IRS
501(c)(3) non-profit status. The organization still is thriving since his departure to pursue
graduate education.
121