Embed Size (px)
Citation preview

MOBILE CLOUD COMPUTING SOLUTION FOR VISUALIZATION OF
ROAD ROUGHNESS
LAM CHEN RIANG
A project report submitted in partial fulfilment of the
requirements for the award of Bachelor of Science
(Hons.) Software Engineering
Lee Kong Chian Faculty of Engineering and Science
Universiti Tunku Abdul Rahman
April 2017

ii
DECLARATION
I hereby declare that this project report is based on my original work except for
citations and quotations which have been duly acknowledged. I also declare that it
has not been previously and concurrently submitted for any other degree or award at
UTAR or other institutions.
Signature :
Name :
ID No. :
Date :

iii
APPROVAL FOR SUBMISSION
I certify that this project report entitled “MOBILE CLOUD COMPUTING
SOLUTION FOR VISUALIZATION OF ROAD ROUGHNESS” was prepared
by LAM CHEN RIANG has met the required standard for submission in partial
fulfilment of the requirements for the award of Bachelor of Science (Hons.) Software
Engineering at Universiti Tunku Abdul Rahman.
Approved by,
Signature :
Supervisor :
Date :
Signature :
Co-Supervisor :
Date :

iv
The copyright of this report belongs to the author under the terms of the
copyright Act 1987 as qualified by Intellectual Property Policy of Universiti Tunku
Abdul Rahman. Due acknowledgement shall always be made of the use of any
material contained in, or derived from, this report.
© 2017, Lam Chen Riang. All right reserved.

v
ACKNOWLEDGEMENTS
I would like to thank everyone who had contributed to the successful completion of
this project. I would like to express my gratitude to my research supervisor, Dr. Tay
Yong Haur for his invaluable advice, guidance and his enormous patience throughout
the development of the research.
Special thanks to Lui Cai An, Soo Ching Pau and Ng Ching Yap that shared
their vehicle or smartphone to conducting the experiment. Without their kind
contribution, the progress of the experiment will be very slow and ineffective. My
gratitude to them for sharing the resources.
Last, I would also like to express my greatest appreciation to my parents and
friends who had helped and given me motivation and inspiration throughout the
project. Without their support, I believe the project would not able to complete on
time.

vi
ABSTRACT
Nowadays, many road accidents occurs due to the bad road condition that does not
fix immediately. Thus, road authorities are urged to obtain the latest road surface
condition which will be helpful for them to plan and manage the road development
ahead. An affordable and reliable mobile cloud solution that apply the crowdsourcing
solution is proposed to solve this issue. In this paper, we will be discussing the
design of mobile cloud solution, data pre-processing method, and road roughness
calculation. A mobile application that used to collect data using the built-in sensor is
developed. The collected data is then going through a data pre-processing process
and send to the cloud server. The computation of the result will be using a server-less
cloud service to minimize and prevent the waste of computation resources. Before
the computation of road roughness, it will go through another stage of data pre-
processing process. The processed data will be calculating through bump detection
algorithm. After that, the result will be visualized under a heat map form.
KEYWORD – crowdsourcing, bump detection, Android, NDK, multithreading, DSP
MQTT, cloud solution, AWS

vii
TABLE OF CONTENTS
DECLARATION ii
APPROVAL FOR SUBMISSION iii
ACKNOWLEDGEMENTS v
ABSTRACT vi
TABLE OF CONTENTS vii
LIST OF TABLES x
LIST OF FIGURES xi
CHAPTER
1 INTRODUCTION 13
1.1 Background 13
1.2 Problem Statement 14
1.3 Objectives 16
1.4 Scope 16
1.5 Significant of the project 17
2 RELATED WORK 18
2.1 Introduction 18
2.2 Benkelman Beam 18
2.2.1 Strength 19
2.2.2 Limitation 19
2.3 Bump Integrator 19
2.3.1 Fifth Wheel Bump Integrator 19
2.3.2 Vehicle Mounted Bump Integrator 20
2.3.3 Strength 20
2.3.4 Limitation 21
2.4 Rolling Straight Edge 21

viii
2.4.1 Strength 21
2.4.2 Limitation 22
2.5 Road surface profiler 22
2.5.1 Strength 22
2.5.2 Limitation 23
2.6 Walking Profiler 23
2.6.1 Strength 23
2.6.2 Limitation 24
2.7 Waze 24
2.7.1 Strength 25
2.7.2 Limitation 25
2.8 Summary of existing method 25
3 PROJECT METHODOLOGY 27
3.1 Introduction 27
3.2 Proposed solution 27
3.2.1 Introduction 27
3.2.2 Android Data Acquisition Application 29
3.2.3 Data Analysis 33
3.2.4 Data Visualization 36
3.2.5 Cloud Web Service 37
3.3 Technology Involved 39
3.3.1 Mobile Phone 39
3.3.2 Message Queue Telemetry Transport (MQTT) 41
3.3.3 MongoDB 41
3.3.4 Toolset, Framework and Library 41
3.3.5 Cloud Web Service 44
4 RESULTS AND DISCUSSIONS 46
4.1 Introduction 46
4.2 Experiment Specification 46
4.3 Bump Index Calculation 47
4.3.1 Experiment 1 47

ix
4.3.2 Experiment 2 49
4.4 Data Pre-Processing 51
4.4.1 First Stage 51
First, we will implement the low pass filter on the
accelerometer to filter out the high frequency. We cut off the
frequency at 25Hz. The result is as below: 51
4.4.2 Stage 2 53
4.4.3 Result Evaluation 56
4.5 Summary 59
5 CONCLUSIONS AND RECOMMENDATIONS 60
5.1 Conclusions 60
5.2 Recommendations for future work 60
5.2.1 Vibration of vehicle engine 60
5.2.2 Car suspension 61
5.2.3 Position of the phone 61
REFERENCES 62

x
LIST OF TABLES
Table 2.1 Summary of related work 25

xi
LIST OF FIGURES
Figure 2.1Benkelman Beam 19
Figure 2.2 Fifth Wheel Bump Integrator 20
Figure 2.3 Vehicle Mounted Bump Integrator 20
Figure 2.4 Rolling Straight Edge 21
Figure 2.5 Road Surface Profiler 22
Figure 2.6 Walking Profiler 23
Figure 2.7 Waze logo 24
Figure 2.8 Making report on Waze 24
Figure 3.1 System Overview 28
Figure 3.2 Android Sensor Architecture 30
Figure 3.3 Gyro Drift Filter Design 31
Figure 3.4 System Design of Android application 32
Figure 3.5 Web Page Visualization 37
Figure 3.6 Cloud Solution Design 39
Figure 3.7 MQTT logo 41
Figure 3.8 MongoDB logo 41
Figure 3.9 Paho Logo 42
Figure 3.10 Flask Logo 42
Figure 3.11 Folium Logo 43
Figure 3.12 Pandas Logo 43
Figure 3.13 EC2 Logo 44
Figure 3.14 Lambda Logo 44
Figure 3.15 S3 Logo 45

xii
Figure 4.1 Z-axis Acceleration Result 47
Figure 4.2 Frequency graph of Z-axis acceleration 48
Figure 4.3 Frequency graph of Simultaneity Index of SDyz(i) 48
Figure 4.4 Result from Z and Y acceleration 49
Figure 4.5 Frequency graph of Z and Y axis result 49
Figure 4.6 Result after implemented gyroscope 50
Figure 4.7 Frequency graph of the result after implemented
gyroscope 51
Figure 4.8 Low pass filter on acceleration 52
Figure 4.9 Result after stage 1 of data pre-processing 53
Figure 4.10 Frequency graph of data pre-processing stage 1's
result 53
Figure 4.11 Frequency graph after stationary filter 54
Figure 4.12 Result after data pre-processing 54
Figure 4.13 Road bump 55
Figure 4.14 Short distance of rough road at top position 55
Figure 4.15 Short distance of rough road at middle position 56
Figure 4.16 Short distance of rough road at bottom position 56
Figure 4.17 Result from another vehicle 57
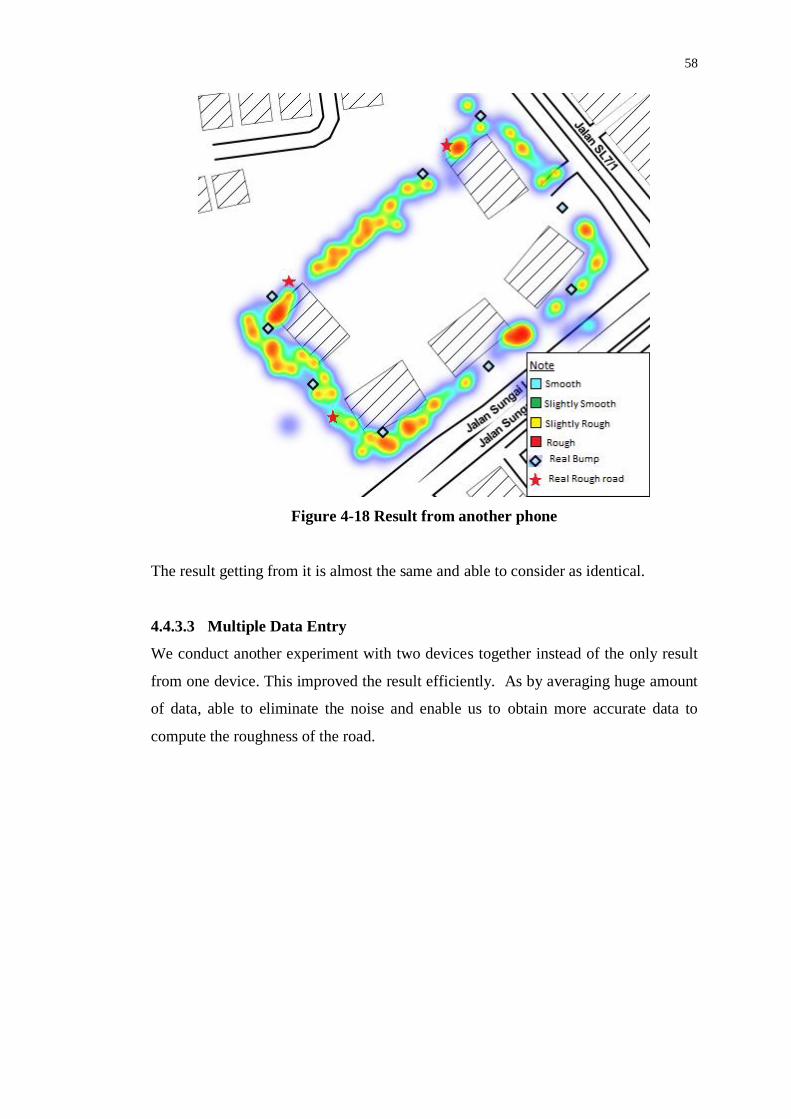
Figure 4.18 Result from another phone 58

13
CHAPTER 1
1 INTRODUCTION
1.1 Background
“Road Roughness” is invariably known as the most vital road condition measurement
in this world (Hunt and Jonathan 2001). Road roughness is the account of the flatness
and frictional properties of the road and it is gaining concern over time as it used to
indicate a road condition. A road with bad roughness condition may lead to
uncomfortable ride experience, unexpected vehicle maintenance cost, extra fuel
consumption and safety issue. Thus, having a good road infrastructure maintenance
and management is an important task and responsibility that no country could deny.
In developing country, Malaysia as an example, maintaining a good condition of
road infrastructure is a challenging task for the road authorities like JKR, PBT,
DBKL and MBPJ. This is due to the bad traffic congestion and most of the road is
done in a hurry. Thus, the deterioration of the road is typically much faster than we
expect. Besides, the weather in Malaysia which is usually humid and warm will also
cause some damage to the road surface. So, the latest information about the road
surface is what the road authorities urge to have. In order to get the road surface
condition data for the maintenance and management planning, the three approaches
mostly used by the authorities is by human visual inspection, using sophisticated
profilers and optical profile meter which is used to measure the road surface shape
(Darawade et al. 2016).

14
1.2 Problem Statement
• The road authorities are not able to monitor all the road condition.
According to the 2013 Malaysian Well-being report by Economic Planning
Unit, the RDI increased from 0.75 in 2000 to 1.91 in 2012 and the total
road length in Malaysia increased from 67,591 kilometers in 2000 to
182,628 kilometers in 2012 (2013). The road fixing and maintenance
protocol applied by the authorities should aim to get the road fixed quickly
and efficiently so the road users’ safety is secured. However, with this
huge size of road network size, it is a big challenge for the authorities to
get the latest road condition data and send the road maintenance team to
fix the road in a very short period of time.
• Current road authorities’ road fixing and maintaining protocol is
passive.
Road fixing and maintaining are a high expense for most of the road
authorities. So, most of them will prioritize to repair the road that road users
have lodged a report on it and the damaged road that without report
normally will delay until someone lodged a report on it. JKR Selangor said
they would able to repair a pothole within 24hours after the particular
pothole is reported (Menon 2015). However, the problem comes in when
there is no people report about the pothole and how long the JKR Selangor
would take to notice and repair the pothole. Malaysia has a daily traffic
level of 5 vehicles on a minor rural road to over 3,000vehichles the 2-lane.
The two sites which located on dual carriageway have the traffic flows of
3,000 and 15,000 vehicles per day on the 4-lane road and 6-lane highway
(Kwang, Morosuik and Emby 1992). With such heavy traffic in Malaysia,
the longer the time taken to repair the potholes, the higher chances that the
pothole to cause an accident. This will definitely put the road users at risk.

15
• Direct measuring the road roughness is expensive and required a lot of
human resources.
The engineers have faced the problem of analysis and maintaining the road
surface for many years. No doubt it is a big challenge that every engineer
desire to solve. Although, detection of the road surface condition is
important but the profiling method of using direct measurement of the road
are typically expensive. The road authorities have limited road funding and
they have to ensure the funding is spent wisely and efficiently. Thus, road
surface detection that will require a lot of funding and resources normally
will not take into consideration.
• There is no platform to let the road user know the road surface
condition in advance.
Currently, there is no any platform that provides road surface condition
information to the users. The road users would avoid these bumpy roads or
be more careful of the bad road ahead if they able to get the latest road
condition information in advance. Besides, the road surface condition
information also will be very useful to the road authorities. To ensure the
road funding used in the most competent and economical way, the road
authorities require an efficient pavement management system to help in the
decision-making process and the road surface information can be applied
and take into consideration in this process. The continuously recorded road
roughness data also allows road authorities to determine the roughness
progression rate of the road. By this way, an appropriate action can be
done by the road authorities (Hunt and Jonathan 2001).

16
1.3 Objectives
• To develop a mobile application that can collect the road roughness with the
built-in sensors.
• To develop a framework that collects road surface information using
crowdsourcing.
• To develop a backend server that collects a constant stream of data from
various devices.
• To visualize the consolidated data that collected from the backend server.
1.4 Scope
The project aims to develop a mobile cloud computing solution that allows mobile
devices to collect road roughness data on the road of Sungai Long area to a
centralized storage for further data aggregation and visualization. This project is
divided into 3 modules:
1. Data Acquisition:
An android-based mobile application will be developed. The mobile phone’s built-in
sensor will able to collect the data about the road surface condition while the driver is
driving. Simultaneously, the data will be sending to the cloud server. Thus, the
mobile device used must have an active internet connection access.
2. Data Analysis
The data will be pass through several data filtration model. The data that sent to the
cloud server will be process constantly by using the road roughness detection
algorithm. The algorithm will be detecting the road bumpiness.
3. Data visualization
A web application will be developed to visualize the road surface condition on the
map.

17
1.5 Significant of the project
• To visualize the road surface condition with a faster update rate.
• Provide a solution for the road authority to keep track on the road surface
condition and faster reaction to the damaged road.
• Provide a platform for the road user to share the road surface condition safely
and freely while they are driving.
• Enable road user to foresee the road surface condition and make a better road
trip planning which can let them reach the destination safely.

18
CHAPTER 2
2 RELATED WORK
2.1 Introduction
There is no single definition for road roughness. The normal definition of roughness
is a countenance of anomalies on the road surface that affects the ride experience of
the vehicle (Pavement Interactive 2007).
ASTM E867 defines the roughness as “The deviation of a surface from a true
planar surface with characteristic dimensions that affect vehicle dynamics and ride
quality”
Besides road user’s comfort level of a ride on a specific road, road roughness
is an important factor which related to vehicle’s vibration while it is moving, the
vehicle’s moving velocity, wear and tear of the wheels with times and vehicle’s
moving cost. Other than that, roughness index normally considered as a measured
surface with high frequency and short wavelength component (Sayer, Thomas and
William 1986). Roughness is significant to determine the interaction between a real
object and its environment. As the road surface’s quantification evolves as a top
interest to the engineers, examination of the performance of the wearing course of a
road will be a good solution( Sayer, Thomas and William ,1986) . Although there are
many methods for road roughness measuring, but in this review, we will covering the
major methods that used by the road authorities and their strength and weakness as
well.
2.2 Benkelman Beam
Benkelman beam is a device that works on the lever arm principle. It is used with a
loaded truck which is generally 80kN (8165kg) with dual tires inflated to 480kPal to
550kPal on a single axis. To get the measurement of the road surface, the tip of the
beam need to place between the dual tires and measure the road surface rebound as
the truck is moved away at a creep speed.

19
Figure 2-1Benkelman Beam
2.2.1 Strength
The strengths of Benkelman Beam are:
• Simple. It is very simple to apply and does not involve very complex
calculation.
• Quick. It can be applied in a very short time period as its operation is simple.
• Cheap cost. It does not require any expensive or special customized device
to detect the road surface condition.
2.2.2 Limitation
The limitations of Benkelman Beam are:
• Inefficient. Benkelman beam can only apply in a single point of the road. For
a single road, multiple time of measurement is needed.
2.3 Bump Integrator
There is two type of bump integrator which is the fifth wheel bump integrator and
vehicle mounted bump integrator.
2.3.1 Fifth Wheel Bump Integrator
It is a device developed by CRRI which consist of a standard pneumatic wheel
mounted within a rectangular with a single leaf spring on either side (CSIR, n.d.).
The spring dashpots mounted on the leaf spring provide damping for the suspension.
To get the measurement of the road surface, the bump integrator is towed by a

20
pickup or jeep at a constant speed of 32kmph under standard tire pressure of
2.1kg/cm2. The bump (cm) and corresponding road length are recorded on a panel
board.
Figure 2-2 Fifth Wheel Bump Integrator
2.3.2 Vehicle Mounted Bump Integrator
This device consists of an integrating unit that mounted on the rear axle of a car or
jeep. The bump integrator unit contains two sensors, one each for bump and distance
measurement. To get the measurement of the road surface, the bump integrator is
towed by a pickup or jeep at a constant speed of 32kmph. The bump (cm) and
corresponding road length are recorded on a computer base data acquisition system.
Figure 2-3 Vehicle Mounted Bump Integrator
2.3.3 Strength
The strengths of bump integrators are:
• Simple. It very easy to apply and does not require the user to have depth
knowledge in this area to use it.
• Fast. It can measures certain length of road in a very short time.

21
2.3.4 Limitation
The limitations of the bump integrators are:
• Speed limitation. It needs to be performing at the constant speed of 32kmph
in order to get the accurate data.
• Sensitive. It will easily affect by the vehicle vibration(Tai et al., 2010).
2.4 Rolling Straight Edge
The rolling straight edge stimulates 3-meter rigid straightedge sliding along the road
surface. It has rubber tyre wheels with the support of a rigid frame on arranged at the
center and both end of the frame. A strip chart recorder or a computerized pointer is
placed at the center of the wheel. In order to measure the road surface roughness, it is
pushed at 1-2kmph. During the measuring process, the number of irregularities,
length, and distance from the starting point is recorded. The depression on the road
surface on an analogue scale measured by the rolling straight edge will the compare
with the national specification for surface regularity.
Figure 2-4 Rolling Straight Edge
2.4.1 Strength
The strength of rolling straight edge is:
• Accuracy. The device is highly sensitive to the road roughness. It measures
depression on the road surface on an analogue scale of 0-12mm +0.25mm.

22
2.4.2 Limitation
The limitation of the rolling straight edge is:
• The device is easy to be broken. As the device is very sensitive to the road
measurement, thus a slight damage of this device will also affect the result.
Thus, this device should be dismantled and handled with care to avoid any
damage.
2.5 Road surface profiler
Road surface profiler also knew as a high-speed profiler. The road surface profiler is
produced with the idea of a profiler under a van or heavy vehicle. This device is
equipped with lesser height sensor, accelerometer, and GPS device. This device is
capable of measuring a precise profile of one or more wheel paths while moving at
speed 100kmph. To get the road measurement, it will capture every inch of the road
profile and the data will then send to the computer database which places inside the
vehicle and the speed of the vehicle usually operate on 70kmph.
Figure 2-5 Road Surface Profiler
2.5.1 Strength
The strengths of road surface profiler are:
• Straightforward. It is very easy to understand and operate. The road tester just
needs to drive on the road and the calculation is done automatically by the
computer.
• Efficiency. This device able to measure a very long range of an amount of
road precisely per day. With this device, the road surface detection work can
be done in very fast and efficient way.

23
2.5.2 Limitation
The limitations of the road surface profiler are:
• High cost. This device is expensive and the maintenance of device and
vehicle would be a drawback that most of the road authorities cannot afford
to apply it.
• Complexity. The procedures for conducting and controlling the device are
relatively complex. The road surface profiler requires the tester to spend the
time to understand the validation and control procedure of this profiler.
2.6 Walking Profiler
The walking profiler is a high-precision measurement instrument for collecting road
surface condition information at true walking speed. The inclinometer between two
support feet in this device is usually used to compute the road surface profile. To get
the road surface measurement, the tester would have to push the walking profiler at
the pace roughly 800 meters per hour.
Figure 2-6 Walking Profiler
2.6.1 Strength
The strengths of walking profiler are:
• Convenient. The size of the device is very small so it can be carried easily to
every place to conduct the road roughness test.
• Efficient. The data collection can be very fast which around 4km per day.
24
2.6.2 Limitation
The limitations of walking profiler are:
• High cost. The cost device is expensive and it requires a frequent
maintenance which also very expensive.
2.7 Waze
In the years of technology booming, everyone tends to become an active user of the
internet that share some of their personal data toward the internet. This makes the
concept “crowdsourcing” come in to solve the traffic congestion problem.
Crowdsourcing is a method that engaging a huge group of people which have
common goal to solve a problem. Waze, the traffic and navigation application that
have the most community able to show the road traffic on the road real time.
Figure 2-7 Waze logo
They achieved this by using the concept of crowd-sourcing. By having the
application open on their phone, users are passively contributing the information
about their road trip to the whole community. Besides, the user also can report that
specific the road condition. Then, Waze will analyze and stream the real-time report
data to all the user.
Figure 2-8 Making report on Waze

25
2.7.1 Strength
• Near real time report. This is because the huge active crowd of the user that
constantly updating the road condition. This makes the update rate become
very fast.
• Convenient. The user only needs to make sure the application is open while
driving in order to contribute data to the community.
2.7.2 Limitation
• High dependency of the crowd. Without a huge number of crowd, the
accuracy of the result will not be accurate and will be biased to some false
report from the user.
• Reliability of report. As all the data is contributed by the public and not a
professional tester. This creates a big uncertainty of how the reliable of the
collected data.
• Concentrate on the road traffic. Waze is currently concentrating on the road
traffic condition but to the road surface condition.
2.8 Summary of existing method
Table 2.1 Summary of related work
Method of
measurement
Principal of
operation
Advantages Disadvantages
Benkelman Beam Lever arm Simple, quick,
and cheap
Inefficient
Bump Integrator RTRRMS Simple and fast Speed have to be
constant, result is
affected by vehicle
vibration
Rolling Straight
Edge
Direct profile
measurement
High accuracy Easy to break
Road surface
profiler
RTRRMS Straightforward
and efficient
High cost and the
operation and control
process is complex.
Walking profiler RTRRMS Convenient and High cost

26
efficient.
Waze Crowdsourcing Near real-time
report, convenient
Highly dependency to
crowd, reliability of
report, concentrate to
traffic

27
CHAPTER 3
3 PROJECT METHODOLOGY
3.1 Introduction
In this chapter discuss the proposed solution and every technology involved in the
solution.
3.2 Proposed solution
3.2.1 Introduction
In order to decrease the time needed for road fixing and maintaining, an affordable
and reliable solution to collect the road roughness information on every road is
needed. Nowadays, almost everyone has a smartphone and most of the phones are
equipped with many useful sensors. The proposed solution is to create crowdsourced
road surface monitoring application for the mobile phone that with active internet
access. Then all the collected data will be filter and pass to the cloud server, AWS
EC2 via a “lightweight” protocol, MQTT (Message Queue Telemetry Transport). In
order to create an affordable solution, we used a cloud PaaS (Planform as a Service),
AWS Lambda to periodically check for update and compute if there is a new data
come in. Then, the result computed will be store into AWS S3.
The system can be separate into of four part:
• Android Data Acquisition application
• Data Analysis
• Data Visualization
• Cloud Web Solution

28
Figure 3-1 System Overview

29
3.2.2 Android Data Acquisition Application
To collect data from the user, we will be creating an Android application that placed
on the car dashboard.
Figure 3-2 Phone position on the car dashboard
In this application, we will be accessing three motion sensors (Accelerometer,
Magnetometer, Gyroscope) and a position sensor (GPS sensor).
The sampling frequency of the motion sensor we set it at 50Hz and position sensor is
1Hz. However, on the current software architecture of Android, there is an
unpredictable time amount of delivery rate. The current architecture of Android
sensor put a heavy polling and buffering to deliver data.

30
Figure 3-3 Android Sensor Architecture
So, in order to minimize the unpredictable delivery time, we decided to bypass the
Framework and SDK level to have direct access to HAL level via NDK to obtain the
physical sensor data. Then, we will have a first stage of pre-processing of data. We
will use a low pass filter to filter out the high frequency on the accelerometer.
𝑥 = ∝ �̌� + (1−∝)�̅� (3.1)
where
∝ = alpha
𝑥 = after filter sensor value
�̌� = past sensor value
�̅� = current sensor value
The constant value of alpha is calculated as below:
∝ = 𝜏
𝜏 𝑑𝑡 (3.2)

31
where
∝ = alpha
𝜏 = time constant
𝑑𝑡 = the sampling frequency
The time constant is calculated as below:
𝜏 =
1
2𝜋 𝑓𝑐
(3.3)
where
𝜏 = time constant
𝑓𝑐 = cut off frequency
In order to get a smoothing graph on the accelerometer, we will cut off the
frequency above 40Hz which resulting us to have Alpha with a value of 0.89.
Then, the gyroscope will have a drift over time. The drift will produce a near
constant-deviation (Johann, Lauro and Surat,2009). So, we can a correct and
eliminate the drift value with a sensor fusion technique via a complimentary filter.
This technique requires accelerometer, magnetometer, and gyroscope. We will be
using Sensor library in Android to archive this filter. In order to filter out the drift
error, the calculated orientation from accelerometer and magnetometer as a
supportive information for the long-term interval while gyroscope for the short
period of time. The overview of the filter design is shown below:
Figure 3-4 Gyro Drift Filter Design

32
After that, we will use an MQTT client library, Paho to send the data to the
MQTT broker to the cloud server. In order to make the application fully utilizes the
resources and efficient, thread and service are applied. Below is the overview of the
system overview of the android application:
Figure 3-5 System Design of Android application

33
Figure 3-6 Data Collection Application
3.2.3 Data Analysis
For data analysis part, firstly we will pre-process the data and make it clean and
suitable for the calculation. Then, we will calculate the distance traveled per second
using Haversine algorithm. Lastly, we will calculate the bump index which
represents the roughness of the road.
The process of data analysis can be separated it into three parts:
• Data Pre-Processing
• Distance calculation
• Bump Index calculation

34
3.2.3.1 Data Pre-Processing
This is the second stage of data pre-processing. This process is to filter out the noise
and some unnecessary data that would cause the inaccuracy of the result.
First, the filter we use on data pre-processing process is a stationary filter.
This filter intention is to filter out the acceleration peak when the vehicle is not
moving. As these peaks can be caused by closing the door or boot of the car.
Lastly, we use a mean filter to reduce the noise and smoothing the graph of
the dataset. We will label every data that within the 0.5 second as the same partition
and take its mean value.
�̅� =
∑ 𝑥
𝑁
(3.4)
where
�̅� = wheelbase, m
∑ 𝑥 = vehicle speed, m/s
𝑁 = recording cycle, Hz
3.2.3.2 Distance traveled Calculation
The calculation will be using the Haversine algorithm to calculate the distance
between two points on a sphere (Earth radius) given their longitudes and latitudes.
The algorithm of the Haversine formula is shown below:
𝑎 = sin(∆∅/2)2 + cos(∅1). cos 𝜃1 . sin(∆𝜃)2
(3.5)
𝑐 = 2𝑎 tan (√𝑎 , √(1 − 𝑎)) (3.6)
𝑑 = 𝑅 × 𝑐
(3.7)

35
where
𝑑 = Distance travelled
𝑅 = Earth Radius
∆∅ = Radians of latitude
∆𝜃 = Radians of longitude
∅1 = latitude
𝜃1 = longitude
3.2.3.3 Bump Index Calculation
We will be calculating the bumpiness of the road by using the bump index
calculation from Yagi (2010). He stated that it able to detect the road bump created
during Niigataken Chuetsu-Oki Earthquake 2007. Other than that, Darawade et al.
( 2016) also mention that root mean square acceleration of the data would be able to
show the roughness of the road.
First, we will need to calculate the standard deviation of Y-axis and Z-axis
acceleration and X-axis orientation acceleration which will define as SDy(i), SDz(i)
and SDz(i).
𝜎 = √∑(𝑥 − �̃�)2
𝑁 − 1
(3.8)
where
𝜎=standard deviation
𝑥=initial value
𝑥=current value
𝑁=total number of record value
Then, we will need to calculate the simultaneity index which is defined as
SDyzx(i).

36
𝑆𝐷𝑦𝑧𝑝(𝑖) = 𝑆𝐷𝑦(𝑖) ×𝑆𝐷𝑧(𝑖)×𝑆𝐷𝑝(𝑖) (3.9)
In order to get a better result, we will the cycle number of wheelbase time
which includes the wheelbase, speed and recording speed. The cycle number of
wheelbase time is defined as Nw.
𝑁𝑤 =
𝐿𝑤
𝑉×𝐻
(3.10)
where
𝑁𝑤= cycle number of wheelbase time
𝐿𝑤= wheelbase, m
𝑉 = vehicle speed, m/s
𝐻 = recording cycle, Hz
The following formula will be using to calculate the bump index, Byzx(i)
𝐵𝑦𝑧𝑝(𝑖) = 𝑆𝐷𝑦𝑧𝑝(𝑖)×𝑆𝐷𝑦𝑧𝑝(𝑖 + 𝑁𝑤) (3.11)
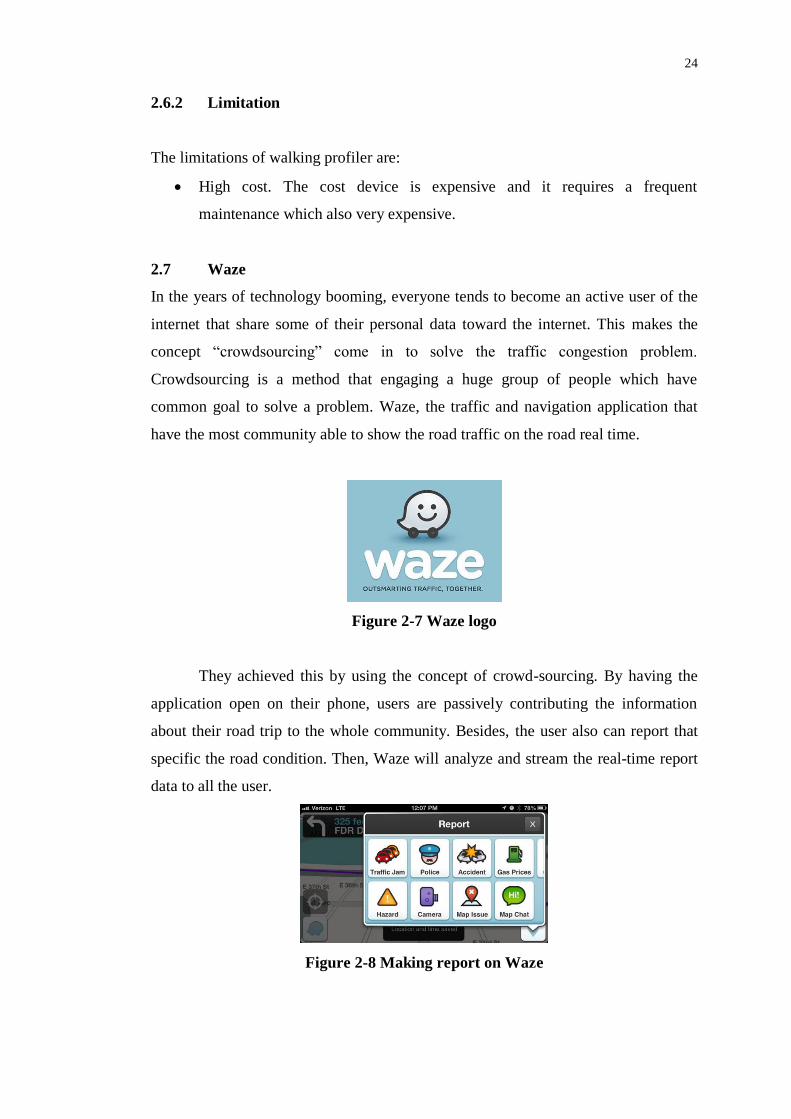
3.2.4 Data Visualization
For the data visualization, we will be using an open source python framework,
Folium that enables us to display the data in a heat map form under the
OpenStreetMap and then save it locally under HTML format. The bumpiness of the
data will be auto scale by the framework. Below is the generated result:
37
Figure 3-7 Web Page Visualization
3.2.5 Cloud Web Service
In this part, we will be using few web service from Amazon to provide an efficient
and affordable solution. There are 3 services we are using:
• Elastic Computer Cloud (EC2)
• Lambda
• Simple Storage Service (S3)
3.2.5.1 Elastic Computer Cloud (EC2)
In this solution, two EC2 instances will be using. One will act as a database that
receives and store all the data and another one will be used to host the web server in
order to displace the result of the road roughness. Both does not require a very high
specification of computing power. By doing this, the cost to implement the solution
can be reduced compare to use an own server do all the services.

38
3.2.5.2 Lambda
We also created a lambda function that constantly checks for update on the database.
If there is an update, it will retrieve all the latest sensor data from the database and
compute it into bump index. Then the bump index will be stored into database and a
heat map that represent the bump index will be generated and put into another
service storage S3. Lambda enables us to scale up and down the computation power
easily. This will prevent from wasting the resources and compute the result with
minimum resources.
Figure 3-8 Lambda Executed Result
3.2.5.3 Simple Storage Service (S3)
All the result will be stored into the cloud storage after it computed by Lambda
service. This storage service provides high scalability and reliability storage at a low
cost.
3.2.5.4 Cloud Service Solution Design

39
Figure 3-9 Cloud Solution Design
3.3 Technology Involved
3.3.1 Mobile Phone
3.3.1.1 Accelerometer
The accelerometer is a tiny mass on a tiny spring. The accelerometer is a sensor in
the smartphone that used to measure the acceleration force. It allows the user to
know their surrounding of the phone better. With the accelerometer, the user can
determine whether the object is moving uphill or downhill. For example, by
detecting how the user holds their phone, the smartphone would rotate their display
between portrait and landscape mode. The sensitivity of the accelerometer is quite
high. This is because they are intended to measure the tiny shift in
acceleration(Goodrich, 2013). The responding unit of acceleration in Android is
meter per second square (m/𝑠2) (Grey and Adam, 2012).

40
3.3.1.2 Magnetometer
The magnetometer is used to measure the magnetic field changes around the
smartphone. The sensor creates Hall effect sensor with the modern solid state
technology to detect the Earth’s magnetic field in three different perpendicular axes
X, Y and Z. By simply passing a current through a wire make the hall effect sensor
worked. A resulting voltage across the width of the wire which is corresponding to
the polarity and strength of the magnetic field is produced due to the higher density
of electron on one side of the wire. The reporting unit for the magnetic field changes
in Android is microtesla. The accuracy of it might be bad as it affects a lot by the
local environment (the present of nearby metal) (Grey and Adam, 2012).
3.3.1.3 Gyroscope
Gyroscope is tiny masses on a tiny spring that designed to measure the Coriolis force.
The Earth’s gravity used by the gyroscope to get the orientation of the phone. Rotor,
a freely-rotating disk which mounts onto a spinning axis in the center of the larger
wheel is consisting in it. As the axis turn, the rotor remains stationary to indicate the
central gravitational pull (Goodrich 2013). A gyroscope would able to use to measure
the rate of rotation around the phone roll axis. When the phone rolls, it will measure
the non-zero value until the platform level out. The reporting unit for the rotation
force is radians per second (rad/s). However, the gyroscope will introduce large error
due to the noise and offsets. This would make the integrated data to be useless within
a second if the address is not addressed during the calculation of angle(Grey and
Adam, 2012).
3.3.1.4 GPS
Among the sensors that that built-in in the phone, GPS sensor is the most frequently
used and convenient sensor that used by the community. When visiting an unfamiliar
place, the GPS sensor can locate your position and provide you turn-by-turn direction.
The GPS reciever in the smartphone communicates with unit among the 30 global
position satellites in the GPS system. The receiver will receive the phone position
from at least 3 satellites and then determine the current location based on the
intersection point of the overlapping sphere and the built-in GPS receiver of the
smartphone (Gordon, n.d). Thus, to obtain the correct current location will take a
substantial amount of time.

41
3.3.2 Message Queue Telemetry Transport (MQTT)
MQTT is a protocol for internet connectivity that used for machine-to-
machine(M2M) and invented by Dr. Andy Stanford-Clark in 1999. As it is
extremely simple and lightweight, so it is able to minimize network bandwidth and
device resources requirement while at the same time ensure reliability and some
degree quality assurance on the delivery (Mqtt.org, n.d).
Figure 3-10 MQTT logo
3.3.3 MongoDB
MongoDB is an open source NoSQL database. A flexible document model that is
similar is used to store data in MongoDB. The document able to contain one or more
field which includes array, binary data, and sub-documents. The advantages of using
MongoDB is scalability, flexibility, and performance. It able to scale up depending
on the needs and able to support thousands of nodes, petabytes of data and hundreds
of thousands operation per second without rebuilding custom partitioning and
caching layers (MongoDB, n.d).
Figure 3-11 MongoDB logo
3.3.4 Toolset, Framework and Library
3.3.4.1 Native Development Kit(NDK)
NDK is a toolset that let the developer implement native code like C and C++ into
Android application (Google, n.d). With NDK, the developer able to use native code
library. Android application is generally written in Java but it will have some
limitation on memory management and performance. NDK enable the developer to

42
directly program into Android native interface. Thus, this will boost up the
performance of the application and increase the reusing of code.
3.3.4.2 Paho
Paho is an open source project that creates by Eclipse to provide client
implementation of MQTT. It is aimed at application for Machine-to-Machine (M2M)
and Internet of Thing (IoT) (Eclipse.org, n.d). Its intention is to include decoupling
between devices and application and to boost the rapid growth of middleware and
applications.
Figure 3-12 Paho Logo
3.3.4.3 Flask
Flask is a Python open source micro web framework. It is build that based on the
Werkzeug toolkit. It also used and Jinja2 template engine as the core system engine.
It is suitable for a small project that with only one or two functions as itself does not
require any particular tools or libraries to run it. In order to provide a really simple
framework that with no restriction to implement anything it minimize everything and
thus there is no data access layer in it. In short, Flask is a good because it is simple,
well documented and have an active community that continuous providing external
module for it.
Figure 3-13 Flask Logo

43
3.3.4.4 Folium
Folium is a Python open source map visualization framework that mapping the
strength of the Leaflet.js library. It allows the developer to manipulate the data in
python and then visualize it on a Leaflet map. Folium has numerous of built-in tile
sets from Mapbox, Stamen, and OpenStreetMap. It also supports GeoJSON and
TopoJSON. In shorts, Folium is a very powerful framework that helps to generate
interactive Leaflet maps.
Figure 3-14 Folium Logo
3.3.4.5 Pandas
Pandas is a python open source framework that provides high performance and easy
to use a data structure for data analysis. It is sponsor by NUMFocus which ensure the
quality and success of the framework. It built on top of Numpy and make a high level
of the task is incredible to complete. As a conclusion, Pandas is a good data analytic
framework that enables developer to speed up data analytical process.
Figure 3-15 Pandas Logo
3.3.4.6 Pymongo
Pymongo is a native Python driver library that used for interacting with MongoDB
database.

44
3.3.4.7 Boto
Boto is a Python library that allows developer to write a program that makes use of
the service of Amazon Web Service like Amazon S3.
3.3.5 Cloud Web Service
3.3.5.1 Elastic Computer Cloud (EC2)
EC2 is an IaaS (Infrastructure as a Service) cloud service that provided by Amazon
Web Service(AWS) for a secure, resizable and computes capacity in the cloud. It
allows the user to rent a virtual computer with complete control to run their own
computer application. EC2 reduce the time amount require to build up a new server
and the user only pay for the capacity they actually used.
Figure 3-16 EC2 Logo
3.3.5.2 Lambda
Lambda is a PaaS (Platform as a Service) cloud service that provided by Amazon
Web Service(AWS) to run the code without managing the server. Lambda provides a
continuous scaling on the resources. The uploaded code will run in parallel and
processes each trigger individually. Lambda will also can be scaled precisely based
on the size of each workload needed. The user will only charge with the compute
time of the code consumed.
Figure 3-17 Lambda Logo

45
3.3.5.3 Simple Storage Service (S3)
S3 is an IaaS (Infrastructure as a Service) cloud service that provided by Amazon
Web Service(AWS) for storage purposes. It is intended to make the computing
become more scalability for the developer. S3 let developers store and retrieve any
amount of data, at any time from any place on the internet. It is like a bulk data
storage and thus it reduces the cost of having and maintain a data storage.
Figure 3-18 S3 Logo

46
CHAPTER 4
4 RESULTS AND DISCUSSIONS
4.1 Introduction
This chapter will be discussing the experiment test to test the road surface detection
algorithm and the effect of data filtration of the proposed solution in Chapter 3.
4.2 Experiment Specification
• The smartphone is stayed under the sky which means the test bed cannot have
any tunnel or any building that cover the road. This is to make sure the GPS
signal is clear and does not have any inference will affect its accuracy. So, we
decided to carry out the test around Forest Green Condominium.
• The smartphone is placed on the vehicle dashboard that in front of
passenger’s seat statically and horizontally. The position of the display side
of the phone is placed upright and the home button is point toward the back
of the vehicle. This mean the running direction is Y-axis, X-axis is the width
direction and the vertical direction is Z-axis. This is to control and prevent the
result from being inaccurate due to the phone position.
• The phone that used in this experiment is Samsung galaxy Note 2. The
motion sensors’ sampling rate is 50Hz while position sensor is 1Hz.
• The vehicle that used is TOYOTA VIOS which has 2550mm wheelbase,
4285mm long, 1695mm width, 1435mm height and 990kg weight. The test is
carried out around Forest Green Condominium and the vehicle is moving
clockwise at a square course.
• The experiment is conducted 3 round and each round has 500m long. There
are 9 bumps in the test road and 2 short distance of rough road in along the
test bed.

47
4.3 Bump Index Calculation
4.3.1 Experiment 1
This is the first preliminary experiment, we tried to imitate the concept of Fifth
Wheel Bump Indicator that measures the International Roughness Index (IRI) over
Z-axis of its acceleration.
Figure 4-1 Z-axis Acceleration Result
From the result above, we able to see that it is almost impossible to recognize
the road obstacle as the number of noise is high. So, we decided to include the Y-axis
acceleration to calculate the simultaneity index of the standard deviation of the two
axes (Y and Z).
𝑆𝐷𝑦𝑧(𝑖) = 𝑆𝐷𝑦(𝑖) ×𝑆𝐷𝑧(𝑖)
(4.1)
From the graph, in Figure 4.3 below we can see that it is some of the noise
has been filtering and the graph become smoother compared to graph in Figure 4.2

48
Figure 4-2 Frequency graph of Z-axis acceleration
Figure 4-3 Frequency graph of Simultaneity Index of SDyz(i)
Then we will be calculating the bump index with the following equation
𝐵𝑦𝑧(𝑖) = 𝑆𝐷𝑦𝑧(𝑖)×𝑆𝐷𝑦𝑧(𝑖 + 𝑁𝑤) (4.2)
The Nw is the cycle number of wheelbase time and the equation is stated in
Chapter 3. However, the result still does not really look very reasoning.

49
Figure 4-4 Result from Z and Y acceleration
Figure 4-5 Frequency graph of Z and Y axis result
4.3.2 Experiment 2
To improve the result getting from Experiment 1, we decided to re-conduct
the experiment with adding another sensor which is the gyroscope. This is because

50
when the vehicle passes through rough road it will cause the phone to rotate around
X-axis and generate the pitch data. We defined the pitch data as p(i). Then, we will
calculate the Simultaneity Index by getting the product of standard deviation
acceleration along Y and Z axis and the pitch data.
𝑆𝐷𝑦𝑧𝑝(𝑖) = 𝑆𝐷𝑦(𝑖) ×𝑆𝐷𝑧(𝑖)×𝑆𝐷𝑝(𝑖) (4.3)
Then follow by the calculation of bump index:
𝐵𝑦𝑧𝑝(𝑖) = 𝑆𝐷𝑦𝑧𝑝(𝑖)×𝑆𝐷𝑦𝑧𝑝(𝑖 + 𝑁𝑤) (4.4)
After applying gyroscope, the frequency graph in Figure 4.7 shown there is
an improved result and the some of the high peaks has been normalized. But the
more new noise has been introduced into the dataset as a new sensor is implemented.
Figure 4-6 Result after implemented gyroscope

51
Figure 4-7 Frequency graph of the result after implemented gyroscope
4.4 Data Pre-Processing
We noticed that there are still a lot of noise that we should filter out from the data. So,
we decided to have few data filtration model. We have two stage of data filtration.
The first stage of it was implemented in mobile application and another stage is
implemented at cloud server before the calculation of bump index. We decided to
separate the pre-processing process is to prevent heavy loaded the server and
decrease the computation resources required.
4.4.1 First Stage
First, we will implement the low pass filter on the accelerometer to filter out the high
frequency. We cut off the frequency at 25Hz. The result is as below:

52
Figure 4-8 Low pass filter on acceleration
Then we realized that gyroscope will introduce a drift error over the time and
it will be the reason the that caused the result to become unrecognize. As a result, we
decided to implement magnetometer sensor into the application and fuse it with
accelerometer and gyroscope to correct the data collected from the gyroscope. The
data fusion is done through a complimentary filter. The result of it seems much more
promising than the past 2 experiment.

53
Figure 4-9 Result after stage 1 of data pre-processing
Figure 4-10 Frequency graph of data pre-processing stage 1's result
4.4.2 Stage 2
In this stage, we decided to implement a stationary filter to filter out some minor
high peak acceleration when the car is not moving.

54
Figure 4-11 Frequency graph after stationary filter
Then, follow we will have a mean filter which will portion the data into every
0.5 seconds. The result has been filtered a lot of noise. It able to detect 7 bumps out
of 9 and 3 short distance of the rough road. A bump sample is shown in Figure 4.13
and 3 short distance of rough road is shown in Figure 4.14, 4.15 and 4.16.
Figure 4-12 Result after data pre-processing

55
Figure 4-13 Road bump
Figure 4-14 Short distance of rough road at top position

56
Figure 4-15 Short distance of rough road at middle position
Figure 4-16 Short distance of rough road at bottom position
4.4.3 Result Evaluation
In this section, we will evaluate the different of the constant factors which are
significant for the experiment.
4.4.3.1 Different Car
As every car will have different suspension condition which will direct affect the
result. This is because a softer the suspension system of the vehicle, the less vibration
will the driver feel. The another vehicle we used is Proton Wira which has 2500mm

57
wheelbase, 4270mm length, 1680mm width, 1385mm height and 980kg. It has a
stiffer suspension system compare to Vios. So, a lesser noise and more accurate
result are produced.
Figure 4-17 Result from another vehicle
4.4.3.2 Different Phone
As every phone might have different performance in term of the processor and better
sensor it has which will affect the data collection result. In this experiment, we used
another phone which is XiaoMi Mi3 to collect the data and the result is shown below:
58
Figure 4-18 Result from another phone
The result getting from it is almost the same and able to consider as identical.
4.4.3.3 Multiple Data Entry
We conduct another experiment with two devices together instead of the only result
from one device. This improved the result efficiently. As by averaging huge amount
of data, able to eliminate the noise and enable us to obtain more accurate data to
compute the roughness of the road.

59
4.5 Summary
As s summary of this chapter, we can see that by applying the crowdsources concept
is able to improve the result. We can clearly see that the noise is dropped when we
are collecting result from two devices compare to using only one device.

CHAPTER 5
5 CONCLUSIONS AND RECOMMENDATIONS
5.1 Conclusions
In this project, we have presented and proven that a by applying the crowdsourcing
concept into this solution able to produce a better accuracy of the result. We have
designed an affordable mobile cloud computing solution which is also reliable and
efficient to collect and monitor the latest road surface condition. We also discussed a
basic calculation of road roughness and made it be more reliable by pre-processing
the data with 4 data filtration model.
As road surface condition need to monitor continuously from time to time
and when a damaged of the road does not be fix immediately, it might cause an
accident which everyone does not it to happen. So, with our approach, we able to
analyze the road condition in the shortest time compare to the solution in the market.
However, the result still is not able to identify the type of road obstacle which
causes the road surface to be rough and bad as we detect the road bump or pothole
based on the analysis of the high-energy event of the acceleration of the vehicle.
Besides, we are using a basic bump index calculation that does not cover many
factors that will affect the accuracy of the result. So, the result still has a lot of room
for improvement.
5.2 Recommendations for future work
5.2.1 Vibration of vehicle engine
When the car is started, the will cause a tiny vibration to the vehicle and it will
contribute to the signal and have a significant magnitude that would affect the
accuracy of the result. These vibrations should be able to eliminate with a
mathematical periodic filter.

5.2.2 Car suspension
Every car has a different suspension condition and this factor would directly affect
the result’s accuracy. A better mathematical model should come out to cover this
area.
5.2.3 Position of the phone
Currently the during the data collection period, the phone has to place upright facing
to the sky on the car dashboard. In the future work, it should give the possibility to
analyze the road surface without this limitation.

REFERENCES
Ambler, S.W. and Lines, M., 2012. Disciplined Agile Delivery: A Practitioner’s
Guide to Agile Software Delivery in the Enterprise, IBM Press.
Eclipse.org, n.d. Paho - Open Source messaging for M2M. [Online] Available at :
http://www.eclipse.org/paho/ [Accessed 3 Apr. 2017].
Darawade, K. et al., 2016. Estimation of Road Surface Roughness Condition from
Android Smartphone Sensors. International Journal of Recent Trends in
Engineering & Research, 2(3), pp.339–346.
ECONOMIC PLANNING UNIT, M., 2013. MALAYSIAN Well-being Report.
Official Report Economic Planning Unit,Malaysia, p.13.
Goodrich, R., 2013a. Accelerometer vs. Gyroscope: What’s the Difference?. [Online].
Available at: http://www.livescience.com/40103-accelerometer-vs-
gyroscope.html [Accessed 13 August 2016].
Goodrich, R., 2013b. Accelerometers: What They Are & How They Work. [Online].
Available at: http://www.livescience.com/40102-accelerometers.html [Accessed
13 August 2016].
Google, n.d. Android NDK | Android Developers. [online] Available at:
https://developer.android.com/ndk/index.html [Accessed 3 Apr. 2017].
Gordon, J., How Does GPS Work on Cell Phones? . [Online]. Available at:
http://traveltips.usatoday.com/gps-work-cell-phones-21574.html [Accessed 13
August 2016].
Greg, M. and Adam, S.,2012. Professional Android Sensor Programming.
Indianapolis : John Wiley & Sons,Inc.
Hunt, P. and Jonathan, B., 2001. Analysis of unbound granular pavement
deterioration for use in asset management modelling. , p.129.
Johann, B., Lauro, O. and Surat K.,2009. Journal of Navigation. Heuristic Reduction
of Gyro Drift, 62(1), pp.41-58.
Kelly, W., 2010. 7 Key Principles of Lean Software Development. [Online].
Available at: http://www.allaboutagile.com/7-key-principles-of-lean-software-
development-2/ [Accessed 17 August 2016].
Kwang, H.J., Morosiuk, G. and Emby, J., 1992. An assessment of the skid resistance
and macrotexture of bituminous road surfacings in Malaysia. REAAA
conference, pp.443–449.

MongoDB, n.d. Internet of Things. [Online] Avaliable at:
https://www.mongodb.com/use-cases/internet-of-things [Accessed 4 April 2017]
Mqtt.org, n.d. FQA-FREQUENTLY ASKED QUESTIONS | MQTT. [Online]
Available at: http://mqtt.org/faq [Accessed 4 April 2017]
Pavement Interactive, 2007. Roughness. [Online]. Available at:
http://www.pavementinteractive.org/article/roughness/ [Accessed 13 August
2016].
Sayer, M.W., Gillespie, T.D. & Paterson, W.D.., 1986. Guidelines for Conducting
and Calibrating Road Roughness Measurements, Available at:
https://deepblue.lib.umich.edu/bitstream/handle/2027.42/3133/72764.pdf?seque
nce=2.
Tai, Y., Chan, C. & Hsu, J.Y., 2010. Automatic road anomaly detection using smart
mobile device. 2010 15th Conference on Artificial Intelligence and Applications
(TAAI), pp.1–8.
Yagi, K.,2010. Extensional smartphone probe for road bump detection. In: ITS
Korea, 17th ITS World Congress.Bunsan, 25-29 October 2010. (ITS Korea), pp.
1-10.


![Cloud-Based LiDAR Visualization and ExploitationLD09]-paper.pdf · Cloud-Based LiDAR Visualization and Exploitation ... afforded by cloud computing will expand the industry's ability](https://img.pdfslide.us/doc/110x75/5ab302c07f8b9a284c8df910/cloud-based-lidar-visualization-and-ld09-paperpdfcloud-based-lidar-visualization.jpg)