Embed Size (px)
Citation preview
Mobile Applications for Tourism
Assessing Service Models and Technologies from the Performance Perspective
Joao Andre Lopes Ferreira
Thesis to obtain the Master of Science Degree in
Information Systems and Computer Engineering
Supervisor: Prof. Alberto Manuel Rodrigues da Silva
Examination Committee
Chairperson: Prof. Ernesto Jose Marques MorgadoSupervisor: Prof. Alberto Manuel Rodrigues da Silva
Member of the committee: Prof. Andre Ferreira Ferrao Couto e Vasconcelos
November 2014

Abstract
Cloud Computing is a paradigm reaching more and more people and enterprises. When Cloud Comput-ing joins with mobile devices, it becomes ubiquitous and at the same time even more powerful. To unifythese two sides, Mobile Computing with Cloud Computing, there are two possible ways and both usingservices of Cloud Computing: either using Backend as a Service or Platform as a Service. In this disser-tation, we do an overview on Mobile Cloud Computing and its services, benefits and challenges. We alsoexplain in what consists each service and the differences between Backend as a Service and Platformas a Service. Since applications require the usage of these two services, we explore the differencesbetween native, web, and hybrid applications and in what situations each type of application should bedeveloped. Plus, it is shown the two applications developed for tourism along with some functionalitiesadopted and optimizations. Furthermore, we analyse some results we got by testing performance of thecloud to confirm if meets developers’ expectations. And, we also show the performance obtained fromnative and web cloud applications.
Keywords: performance, user experience, service model, cloud, platform

Resumo
Cloud Computing e um paradigma que atinge cada vez mais pessoas e empresas. Quando CloudComputing se junta com os dispositivos moveis, torna-se omnipresente e ao mesmo tempo mais po-deroso. Para unir Mobile Computing com Cloud Computing existe dois caminhos possıveis e ambosusando servicos do Cloud Computing: usando Backend as a Service ou Platform as a Service. Nestadissertacao, da-se uma visao geral ao paradigma de Mobile Cloud Computing e os seus servicos, be-nefıcios e desafios. Tambem explica no que e que consiste cada servico e as diferencas entre Backendas a Service e Platform as a Service. Uma vez que as aplicacoes requerem a utilizacao destes doisservicos para poder fornecer os seus respectivos servicos, explora as diferencas entre aplicacoes nati-vas, web e hıbridas e em que situacoes deve ser desenvolvida cada tipo de aplicacao. Esta investigacaoe suportada pelo desenvolvimento de duas aplicacoes desenvolvidas para a area do turismo juntamentecom algumas das funcionalidades adoptadas bem como optimizacoes. Para alem disto, analiza-se osresultados de desempenho obtidos para confirmar se corresponde as expectativas. E tambem se apre-senta o desempenho obtido a partir das aplicacoes nativas e web que usam cloud.
Palavras-chave: desempenho, experiencia do utilizador, modelo de servico, cloud, plataforma

Contents
Acronyms xi
1 Introduction 11.1 Context and Motivation . . . . . . . . . . . . . . . . . . . . . . . . . . . . . . . . . . . . . . 11.2 Research Problem . . . . . . . . . . . . . . . . . . . . . . . . . . . . . . . . . . . . . . . . 21.3 Proposed Solution . . . . . . . . . . . . . . . . . . . . . . . . . . . . . . . . . . . . . . . . 21.4 Goals . . . . . . . . . . . . . . . . . . . . . . . . . . . . . . . . . . . . . . . . . . . . . . . 31.5 Additional Contributions . . . . . . . . . . . . . . . . . . . . . . . . . . . . . . . . . . . . . 31.6 Document Outline . . . . . . . . . . . . . . . . . . . . . . . . . . . . . . . . . . . . . . . . 3
2 Background 52.1 Mobile Cloud Computing . . . . . . . . . . . . . . . . . . . . . . . . . . . . . . . . . . . . . 52.2 Services of Mobile Cloud Computing . . . . . . . . . . . . . . . . . . . . . . . . . . . . . . 6
2.2.1 Software as a Service . . . . . . . . . . . . . . . . . . . . . . . . . . . . . . . . . . 62.2.2 Platform as a Service . . . . . . . . . . . . . . . . . . . . . . . . . . . . . . . . . . 72.2.3 Infrastructure as a Service . . . . . . . . . . . . . . . . . . . . . . . . . . . . . . . 72.2.4 Backend as a Service . . . . . . . . . . . . . . . . . . . . . . . . . . . . . . . . . . 82.2.5 Comparison between the services . . . . . . . . . . . . . . . . . . . . . . . . . . . 82.2.6 Benefits . . . . . . . . . . . . . . . . . . . . . . . . . . . . . . . . . . . . . . . . . . 102.2.7 Cloud Computing . . . . . . . . . . . . . . . . . . . . . . . . . . . . . . . . . . . . . 102.2.8 Mobile Cloud Computing . . . . . . . . . . . . . . . . . . . . . . . . . . . . . . . . 12
2.3 Challenges . . . . . . . . . . . . . . . . . . . . . . . . . . . . . . . . . . . . . . . . . . . . 132.3.1 Security . . . . . . . . . . . . . . . . . . . . . . . . . . . . . . . . . . . . . . . . . . 132.3.2 Network . . . . . . . . . . . . . . . . . . . . . . . . . . . . . . . . . . . . . . . . . . 14
2.4 Applications . . . . . . . . . . . . . . . . . . . . . . . . . . . . . . . . . . . . . . . . . . . . 152.4.1 Native . . . . . . . . . . . . . . . . . . . . . . . . . . . . . . . . . . . . . . . . . . . 152.4.2 Web . . . . . . . . . . . . . . . . . . . . . . . . . . . . . . . . . . . . . . . . . . . . 152.4.3 Hybrid . . . . . . . . . . . . . . . . . . . . . . . . . . . . . . . . . . . . . . . . . . . 162.4.4 Which one to choose . . . . . . . . . . . . . . . . . . . . . . . . . . . . . . . . . . 16
2.5 Related Work . . . . . . . . . . . . . . . . . . . . . . . . . . . . . . . . . . . . . . . . . . . 17
3 Applications Developed 193.1 Windows Azure . . . . . . . . . . . . . . . . . . . . . . . . . . . . . . . . . . . . . . . . . . 19
3.1.1 WebMatrix . . . . . . . . . . . . . . . . . . . . . . . . . . . . . . . . . . . . . . . . 213.1.2 SQL Database Service . . . . . . . . . . . . . . . . . . . . . . . . . . . . . . . . . 213.1.3 WebMAT and Web Site service . . . . . . . . . . . . . . . . . . . . . . . . . . . . . 223.1.4 NativeMAT and Mobile Service . . . . . . . . . . . . . . . . . . . . . . . . . . . . . 293.1.5 Optimizations . . . . . . . . . . . . . . . . . . . . . . . . . . . . . . . . . . . . . . . 34
3.2 Problems and Challenges . . . . . . . . . . . . . . . . . . . . . . . . . . . . . . . . . . . . 39
4 Evaluation 434.1 Tools . . . . . . . . . . . . . . . . . . . . . . . . . . . . . . . . . . . . . . . . . . . . . . . . 43
4.1.1 Apache JMeter (WebMAT) . . . . . . . . . . . . . . . . . . . . . . . . . . . . . . . 434.1.2 Eclipse (NativeMAT) . . . . . . . . . . . . . . . . . . . . . . . . . . . . . . . . . . . 45
4.2 Results . . . . . . . . . . . . . . . . . . . . . . . . . . . . . . . . . . . . . . . . . . . . . . 464.2.1 Web Application (WebMAT) . . . . . . . . . . . . . . . . . . . . . . . . . . . . . . . 464.2.2 Multiple Users . . . . . . . . . . . . . . . . . . . . . . . . . . . . . . . . . . . . . . 46
v
vi CONTENTS
4.2.3 Single User . . . . . . . . . . . . . . . . . . . . . . . . . . . . . . . . . . . . . . . . 514.2.4 Optimizations . . . . . . . . . . . . . . . . . . . . . . . . . . . . . . . . . . . . . . . 52
4.3 Native Application (NativeMAT) . . . . . . . . . . . . . . . . . . . . . . . . . . . . . . . . . 544.4 NativeMAT and WebMAT . . . . . . . . . . . . . . . . . . . . . . . . . . . . . . . . . . . . 55
5 Conclusion and Future Work 575.1 Conclusion . . . . . . . . . . . . . . . . . . . . . . . . . . . . . . . . . . . . . . . . . . . . 575.2 Future Work . . . . . . . . . . . . . . . . . . . . . . . . . . . . . . . . . . . . . . . . . . . . 58
A Applications’ Screen Shots 59A.1 WebMAT . . . . . . . . . . . . . . . . . . . . . . . . . . . . . . . . . . . . . . . . . . . . . 59A.2 NativeMAT . . . . . . . . . . . . . . . . . . . . . . . . . . . . . . . . . . . . . . . . . . . . 60
List of Figures
2.1 Cloud Computing stack . . . . . . . . . . . . . . . . . . . . . . . . . . . . . . . . . . . . . 62.2 Schema that shows some differences between (a) Software as a Service and (b) an ap-
plication using a Backend as a Service. . . . . . . . . . . . . . . . . . . . . . . . . . . . . 102.3 Graph generated Quantcast that shows the number of visits on Amazon website. . . . . . 122.4 Offloading beneficial by communication and computation [35]. . . . . . . . . . . . . . . . . 13
3.1 Windows Azure Portal . . . . . . . . . . . . . . . . . . . . . . . . . . . . . . . . . . . . . . 203.2 Windows Azure - categories of the services . . . . . . . . . . . . . . . . . . . . . . . . . . 203.3 “servername.windowsazure.net” - Management of the database. . . . . . . . . . . . . . . 223.4 Windows Azure SQL Databases dashboard tab. . . . . . . . . . . . . . . . . . . . . . . . 223.5 Monitor tab on Windows Azure Web Site service of a specific web application. . . . . . . 233.6 Usage overview on dashboard tab of Windows Azure Web Site service. . . . . . . . . . . 233.7 Hosting plan modes . . . . . . . . . . . . . . . . . . . . . . . . . . . . . . . . . . . . . . . 243.8 Windows Azure SQL Database: Connection Strings . . . . . . . . . . . . . . . . . . . . . 253.9 Schema of sending a request to server. . . . . . . . . . . . . . . . . . . . . . . . . . . . . 253.10 Different modes of scaling . . . . . . . . . . . . . . . . . . . . . . . . . . . . . . . . . . . . 303.11 The name of the service and the name of the database schema is exactly the same. . . . 313.12 Two different interfaces to handle with containers and blobs of a specific storage account. 323.13 Client ID result . . . . . . . . . . . . . . . . . . . . . . . . . . . . . . . . . . . . . . . . . . 333.14 Google’s PageSpeed recommendations . . . . . . . . . . . . . . . . . . . . . . . . . . . . 343.15 Original image . . . . . . . . . . . . . . . . . . . . . . . . . . . . . . . . . . . . . . . . . . 373.16 Zoom of the image shown in figure 3.15 . . . . . . . . . . . . . . . . . . . . . . . . . . . . 383.17 Bug of Windows Azure . . . . . . . . . . . . . . . . . . . . . . . . . . . . . . . . . . . . . . 40
4.1 An example of all the element needed to do a load test. . . . . . . . . . . . . . . . . . . . 444.2 DDMS interface of Eclipse . . . . . . . . . . . . . . . . . . . . . . . . . . . . . . . . . . . . 454.3 Chart illustrating test results with number of threads = 10, ramp-up time = 10, and loop
count = 2. Gaussian Timer Random with deviation = 100, and constant delay offset = 300. 474.4 Chart illustrating test results with number of threads = 10, ramp-up time = 10, and loop
count = 2. Gaussian Timer Random with deviation = 100, and constant delay offset = 300. 484.5 Chart illustrating test results with number of threads = 100, ramp-up time = 10, and loop
count = 2. Gaussian Timer Random with deviation = 100, and constant delay offset = 300. 494.6 Snapshots on “monitor” tab of the Windows Azure Web Sites dashboard. . . . . . . . . . 504.7 Second test - 10 users using cache. . . . . . . . . . . . . . . . . . . . . . . . . . . . . . . 514.8 Fourth test - 1000 users using cache. . . . . . . . . . . . . . . . . . . . . . . . . . . . . . 524.9 Snapshots on “monitor” tab of the Windows Azure Web Sites dashboard. . . . . . . . . . 534.10 Snapshots took from “trace.html” file generated from experiment #1 using Systrace tool. . 554.11 Snapshots took from “trace.html” file generated from experiment #2 using Systrace tool. . 55
A.1 Home screen. . . . . . . . . . . . . . . . . . . . . . . . . . . . . . . . . . . . . . . . . . . . 59A.2 List of all PoIs. . . . . . . . . . . . . . . . . . . . . . . . . . . . . . . . . . . . . . . . . . . 60A.3 Details of a PoI. . . . . . . . . . . . . . . . . . . . . . . . . . . . . . . . . . . . . . . . . . . 60A.4 PoIs loading of “Castles” category. . . . . . . . . . . . . . . . . . . . . . . . . . . . . . . . 61A.5 Details of a PoI. . . . . . . . . . . . . . . . . . . . . . . . . . . . . . . . . . . . . . . . . . . 62
vii

List of Tables
2.1 Responsibilities of vendors and clients [4]. . . . . . . . . . . . . . . . . . . . . . . . . . . . 82.2 Estimated costs of infrastructure under a possible scenario of two application servers
backed by two database servers and balanced by a load balancer [51]. . . . . . . . . . . 11
3.1 Sizes obtained from the original after compression with the different tools . . . . . . . . . 363.2 Sizes obtained from the original after compression with the different tools . . . . . . . . . 363.3 Sizes obtained from the original after using different types of compression with Preview. . 36
4.1 Time and errors obtained with 10 users. . . . . . . . . . . . . . . . . . . . . . . . . . . . . 474.2 Time and errors obtained with 10 users and with Cache. . . . . . . . . . . . . . . . . . . . 484.3 Time and errors obtained with 100 user and with Cache. . . . . . . . . . . . . . . . . . . . 494.4 Thoughput per minute obtained on 4 tests (with 10 users without using cache and 10, 100
and 1000 users using cache) . . . . . . . . . . . . . . . . . . . . . . . . . . . . . . . . . . 514.5 Time obtained from web application running on different platforms using Safari and Chrome. 524.6 Time obtained from mobile application . . . . . . . . . . . . . . . . . . . . . . . . . . . . . 54
ix

Acronyms
MC - Mobile Computing
CC - Cloud Computing
MCC - Mobile Cloud Computing
SaaS - Software as a Service
BaaS - Backend as a Service
MBaaS - Mobile Backend as a Service
PaaS - Platform as a Service
IaaS - Infrastructure as a Service
HTML - HyperText Markup Language
NIST - National Institute of Standards and Technology
CPU - Central Processing Unit
SDK - Software Development Kit
API - Application Programming Interface
SQL - Structured Query Language
UI - User Interface
CapEx - Capital Expenditure
OpEx - Operating Expenditure
GPS - Global Positioning System
BYOD - Bring Your Own Device
IDE - Integrated Development Environment
CSS - Cascading Style Sheets
PHP - Hypertext Preprocessor
AJAX - Asynchronous JavaScript and XML
XML - EXtensible Markup Language
xi
xii ACRONYMS
CDN - Content Delivery Network
SSL - Secure Sockets Layer
URL - Uniform Resource Locator
DOM - Document Object Model
DDMS - Dalvik Debug Monitor Server
PDO - PHP Data Objects
GUI - Graphical User Interface
PoI - Point of Interest
Chapter 1
Introduction
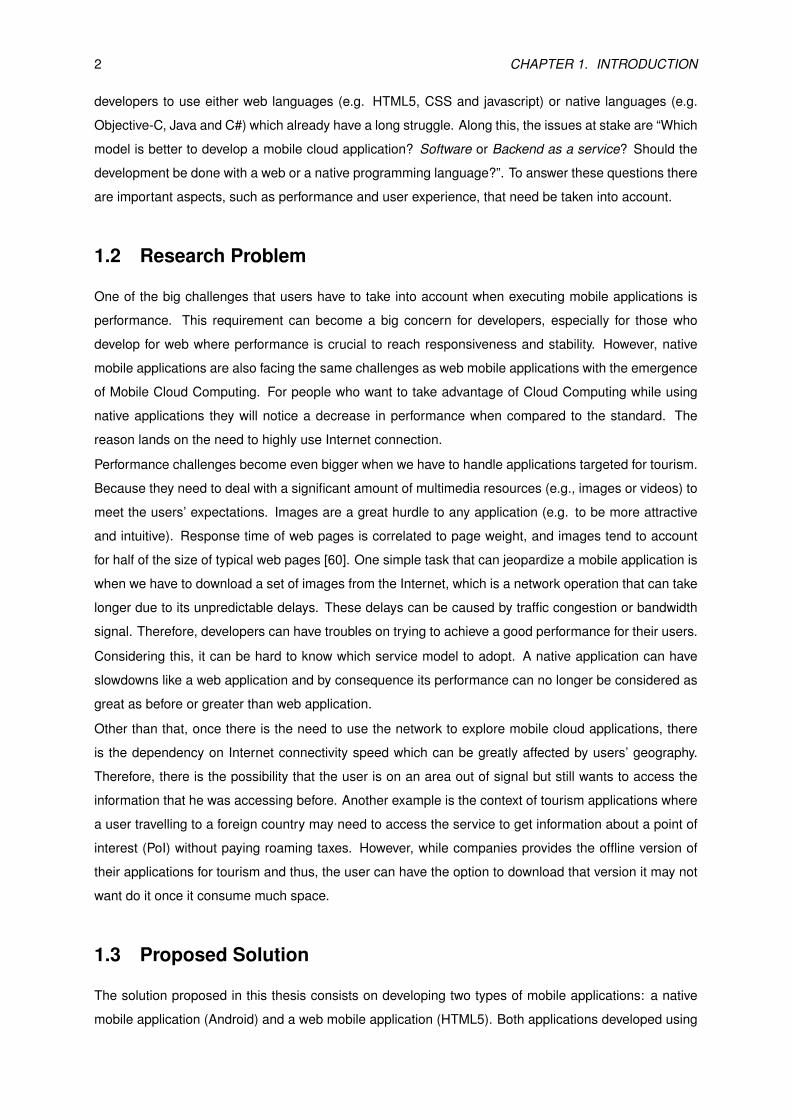
1.1 Context and Motivation
Tourism is a global leisure activity widely practised. In 2011 there were over 983 million international
tourist arrivals worldwide, representing a growth of 4.6% when compared to the 940 million in 2010 [1].
Meanwhile, in this kind of activity mobile devices (e.g. smartphones and tablets) are an highly choice
for people to get better experiences. Its powerful and portable capabilities make them greater than any
other electronic device when it comes to go outside doors.
Besides that people also tend to do a significant number of activities on their mobile devices (e.g. taking
photos, use GPS, listen to music) due to its effectiveness and convenience. Mobile devices’ portability
make them more ubiquitous and extremely efficient on the field.
However, the evolution of mobile devices has been so fast that people start to gain concern about having
a: (i) powerful processor to handle applications with tough computations without losing performance; (ii)
high storage capacity to store their multimedia content and applications; and (iii) high memory to help to
compute their work while maintaining high levels of processing power. Thereby, mobile devices become
a big bet for Cloud providers. With Cloud Computing being used by mobile devices, it appeared a new
way to think and to do things, eliminating some barriers and also leading to the rise of important issues
such as privacy, performance or bandwidth of mobile network. So far, we did not find any application for
tourism such as TripAdvisor 1 and Foursquare 2 that use service models of Cloud Computing.
Cloud Computing has the following variances: Software as a Service [29], Platform as a Service [54] and
Infrastructure as a Service [42, 12]. They are used in many kind of businesses by various organizations.
Recently it arose another type of service, Backend as a Service [33, 36]. Targeting native applications,
so they can also benefit from Cloud Computing services. At the same time, Backend as a Service is
an alternative to Software as a Service on delivering software business. The goal is to reach every
mobile device independently if it is native or a mobile web applications because there is no perfect type
of application that can meet all business requirements.
Furthermore, these service models also provide features to make it easier to develop and to allow
1http://www.tripadvisor.com2https://foursquare.com
1
2 CHAPTER 1. INTRODUCTION
developers to use either web languages (e.g. HTML5, CSS and javascript) or native languages (e.g.
Objective-C, Java and C#) which already have a long struggle. Along this, the issues at stake are “Which
model is better to develop a mobile cloud application? Software or Backend as a service? Should the
development be done with a web or a native programming language?”. To answer these questions there
are important aspects, such as performance and user experience, that need be taken into account.
1.2 Research Problem
One of the big challenges that users have to take into account when executing mobile applications is
performance. This requirement can become a big concern for developers, especially for those who
develop for web where performance is crucial to reach responsiveness and stability. However, native
mobile applications are also facing the same challenges as web mobile applications with the emergence
of Mobile Cloud Computing. For people who want to take advantage of Cloud Computing while using
native applications they will notice a decrease in performance when compared to the standard. The
reason lands on the need to highly use Internet connection.
Performance challenges become even bigger when we have to handle applications targeted for tourism.
Because they need to deal with a significant amount of multimedia resources (e.g., images or videos) to
meet the users’ expectations. Images are a great hurdle to any application (e.g. to be more attractive
and intuitive). Response time of web pages is correlated to page weight, and images tend to account
for half of the size of typical web pages [60]. One simple task that can jeopardize a mobile application is
when we have to download a set of images from the Internet, which is a network operation that can take
longer due to its unpredictable delays. These delays can be caused by traffic congestion or bandwidth
signal. Therefore, developers can have troubles on trying to achieve a good performance for their users.
Considering this, it can be hard to know which service model to adopt. A native application can have
slowdowns like a web application and by consequence its performance can no longer be considered as
great as before or greater than web application.
Other than that, once there is the need to use the network to explore mobile cloud applications, there
is the dependency on Internet connectivity speed which can be greatly affected by users’ geography.
Therefore, there is the possibility that the user is on an area out of signal but still wants to access the
information that he was accessing before. Another example is the context of tourism applications where
a user travelling to a foreign country may need to access the service to get information about a point of
interest (PoI) without paying roaming taxes. However, while companies provides the offline version of
their applications for tourism and thus, the user can have the option to download that version it may not
want do it once it consume much space.
1.3 Proposed Solution
The solution proposed in this thesis consists on developing two types of mobile applications: a native
mobile application (Android) and a web mobile application (HTML5). Both applications developed using
1.4. GOALS 3
services from Windows Azure from Microsoft to fit the context of Mobile Cloud Computing.
We want to create a Software as a Service with Windows Azure Web Site service targeted to mobile
devices in order to give a look and feel similar to a native application. Also develop a native application
that connects to a cloud computing service called Backend as a Service. In this sense, both applications
are going to face network issues enabling them to be compared and therefore understand if they have
the same wide performance divergence as before when native applications did not require network to
provide their services.
Regarding network signal issue, we are going to mitigate it by using internal storage or cache of mobile
devices or browser (depending on what kind of application we are dealing with). HTML5 brought a new
set of features such as offline storage. Thus, we want to know if web applications are tantamount to
native applications.
Next, the challenge is to use some tools to run tests, analyse, and determine the performance of both
mobile applications in order to be able to come to a conclusion about the performance of both. Also
try to see how to improve performance of the web mobile application so that it can be closer to the
performance reached by the Android application.
1.4 Goals
After identifying the problem and its subsequent challenges, it is important to mention in a clear way
what are the goals of this research:
G1: Identify and analyse the problems faced when users try to load, render and display a set of images
that are preventing applications to achieve good performance.
G2: Discover how to overcome those problems by figuring out what is causing them and then, search-
ing methods to help on its performance optimization.
G3: Compare and analyse a native mobile application and a web mobile application in what perform-
ance concerns.
1.5 Additional Contributions
A survey of Mobile Cloud Computing has been published on Open Journal of Mobile Computing and
Cloud Computing of Scientific Online Publishing (SOP) [21].
1.6 Document Outline
This dissertation is divided into five chapters. Chapter 1, in which this section is included, is where we in-
troduce the context and motivation, problems, solutions proposed and goals of this dissertation.Chapter
2 describes Mobile Computing, Cloud Computing and Mobile Cloud Computing paradigms as well as

4 CHAPTER 1. INTRODUCTION
its services, benefits and challenges. Also, it shows the different type of applications that can be de-
veloped regarding this new paradigm and it presents different papers that describes other aspects in
detail. Chapter 3 introduces the platform used to developed our mobile cloud applications as well as a
tool and service to help in this process as well as description of all the steps taken on the development
process. Then chapter 4 starts presenting some tools that were utilized to do some tests and explores
the limitation of Windows Azure and discuss the results obtained from the two applications developed.
Finally, chapter 5 shows some conclusions reached and future work.
Chapter 2
Background
2.1 Mobile Cloud Computing
The concept of Mobile Cloud Computing (MCC) comes along with two parts, Cloud Computing (CC)
and Mobile Computing (MC). It was due to these two computing paradigms that MCC paradigm has
emerged.
MC is described as an act of portable devices usage to run stand-alone applications and/or accessing
remote applications via wireless networks [19]. MC has three major components: communication, hard-
ware and software. The software component, are the mobile applications present in the devices like
Whatsapp, Viber or Any.Do. Regarding the hardware, we may consider mobile devices with their hard-
ware components, such as sensors, batteries, etc. And finally, the communication is related to mobile
networks.
CC appeared to help users to reduce their concerns about device requirements in order to run the new-
est software (e.g. higher CPU speed and larger storage capacity) [69, 24, 12, 11, 75, 43]. The most
accepted and common definition of CC is the one from National Institute of Standards and Techno-
logy (NIST) which says that “CC enables on-demand network access to a shared pool of configurable
computing resources (e.g. networks, servers, storage, applications, and services) that can be rapidly
provisioned and released with minimal management effort or service interaction” [30].
The main service models provided by the CC paradigm are: Platform as a Service (PaaS), Infrastructure
as a Service (IaaS) and Software as a Service (SaaS).
Regarding MCC, there are multiple definitions but no consensual ones on what it is [32, 18]. From our
perspective, it is just the combination between CC and MC, meaning the integration of CC within a mo-
bile environment. It refers to an infrastructure where both data storage and (most of) the processing
can occur outside of the mobile device or can be distributed between cloud-based servers and mobile
devices.
Nowadays, MCC is a big bet for organizations due to their willing to adapt to the new technologies and
explore their advantages. This trend is changing the way companies work as well as their habits. Ac-
cording to Gartner, mobile technologies and CC come as the first priority when it comes to Business
5
6 CHAPTER 2. BACKGROUND
and Technology decisions [61]. Experts surveyed by Pew Internet Project expect that by 2020, most
people who use Internet will work primarily through cyberspace-based applications on remote servers
accessed through networked devices. Next section explore the services brought by CC.
2.2 Services of Mobile Cloud Computing
CC can be viewed as a collection of services, and as we mentioned, there are three main service models
- SaaS, PaaS and IaaS. Companies see SaaS as the preferred software delivery method of the future
and as the most popular form of cloud service. Last year (in 2013) it had 63% of organizations using
SaaS, 8% more than in 2011 [8].
Since CC has got three types of services and these services that are built one top of another, CC is
usually depicted as a layered stack.
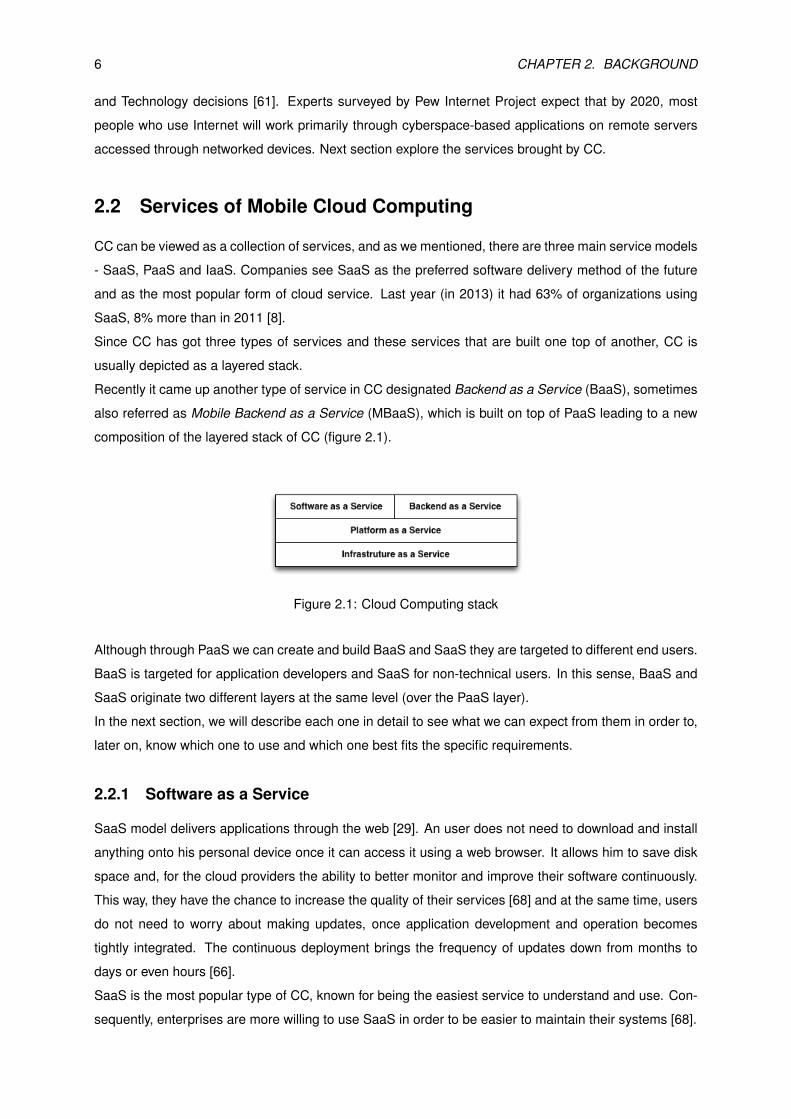
Recently it came up another type of service in CC designated Backend as a Service (BaaS), sometimes
also referred as Mobile Backend as a Service (MBaaS), which is built on top of PaaS leading to a new
composition of the layered stack of CC (figure 2.1).
Figure 2.1: Cloud Computing stack
Although through PaaS we can create and build BaaS and SaaS they are targeted to different end users.
BaaS is targeted for application developers and SaaS for non-technical users. In this sense, BaaS and
SaaS originate two different layers at the same level (over the PaaS layer).
In the next section, we will describe each one in detail to see what we can expect from them in order to,
later on, know which one to use and which one best fits the specific requirements.
2.2.1 Software as a Service
SaaS model delivers applications through the web [29]. An user does not need to download and install
anything onto his personal device once it can access it using a web browser. It allows him to save disk
space and, for the cloud providers the ability to better monitor and improve their software continuously.
This way, they have the chance to increase the quality of their services [68] and at the same time, users
do not need to worry about making updates, once application development and operation becomes
tightly integrated. The continuous deployment brings the frequency of updates down from months to
days or even hours [66].
SaaS is the most popular type of CC, known for being the easiest service to understand and use. Con-
sequently, enterprises are more willing to use SaaS in order to be easier to maintain their systems [68].
2.2. SERVICES OF MOBILE CLOUD COMPUTING 7
Popular examples of SaaS are: Google Apps1, Microsoft Office 3652, Skype3, AccuWeather4 and Mur-
ally5
2.2.2 Platform as a Service
PaaS model is a CC service that allows developers to create and deploy their web applications quickly
and easily using the provided frameworks [54]. This facilitates the complexity of maintaining the software
and its infrastructure that supports it and without also doing investments like buying the supporting
infrastructure (e.g. operating systems, web servers, database servers).
In addition, with PaaS, developers can also create a BaaS and enjoy all of what BaaS offers (section
2.2.4). Unlike SaaS, in the PaaS the responsibility of managing the system is shared by the user and
the provider [68].
A study, underwritten by Red Hat, Inc.6, found that PaaS has the potential to cut Federal IT costs by
US$20.5 billion annually, or 25 per cent of the Federal government’s IT budget, by speeding up software
development [10, 47].
Popular examples of PaaS are: AWS Elastic Beanstalk7, Heroku8, Salesforce9, Google App Engine10,
Windows Azure11.
2.2.3 Infrastructure as a Service
IaaS model is where we get the fundamental building blocks for cloud services [42, 12]. IaaS is where
compute resources such as storage, hardware, servers and network capabilities which are owned and
hosted by a service provider are offered to customers on-demand. It is a way to provide the hardware
infrastructure (i.e. the equipment) of CC and that is why IaaS is also sometimes referred to as Hardware
as a Service (HaaS).
The service provider owns the equipment and is responsible for managing virtualization, servers, stor-
age, and networking while the client has to take care of the data, applications, runtime, and middleware
[30, 55, 25, 68].
IaaS is the most flexible Cloud Computing model and allows for automated deployment of servers, pro-
cessing power, storage, and networking.
Popular examples of IaaS are: Amazon EC212, Rackspace13
1http://www.google.com/enterprise/apps/business/2http://office.microsoft.com/en-US/?CTT=973http://www.skype.com/en/4http://www.accuweather.com5https://mural.ly6http://pt.redhat.com7http://aws.amazon.com/elasticbeanstalk/8https://www.heroku.com9http://www.salesforce.com/platform/overview/
10https://developers.google.com/appengine11https://azure.microsoft.com/en-us/12http://aws.amazon.com/ec2/13http://www.rackspace.com
8 CHAPTER 2. BACKGROUND
2.2.4 Backend as a Service
The BaaS model allows developers to connect/link their native mobile applications to a backend cloud
storage and start to enjoy some of the features they provide like push notifications and integration with
social networking services [33, 36]. Yet, these applications can also save their data in the cloud instead
of saving it in the mobile device storage or data can even be saved in both cloud and storage.
There are some platforms, for instance Google App Engine and Windows Azure, that provide custom
software development kits (SDKs) and application programming interfaces (APIs) that make it easier
to develop mobile applications and link them to a backend. Examples of BaaS are: appcelerator14,
appery.io15, kinvey16, Parse17 and StackMob18
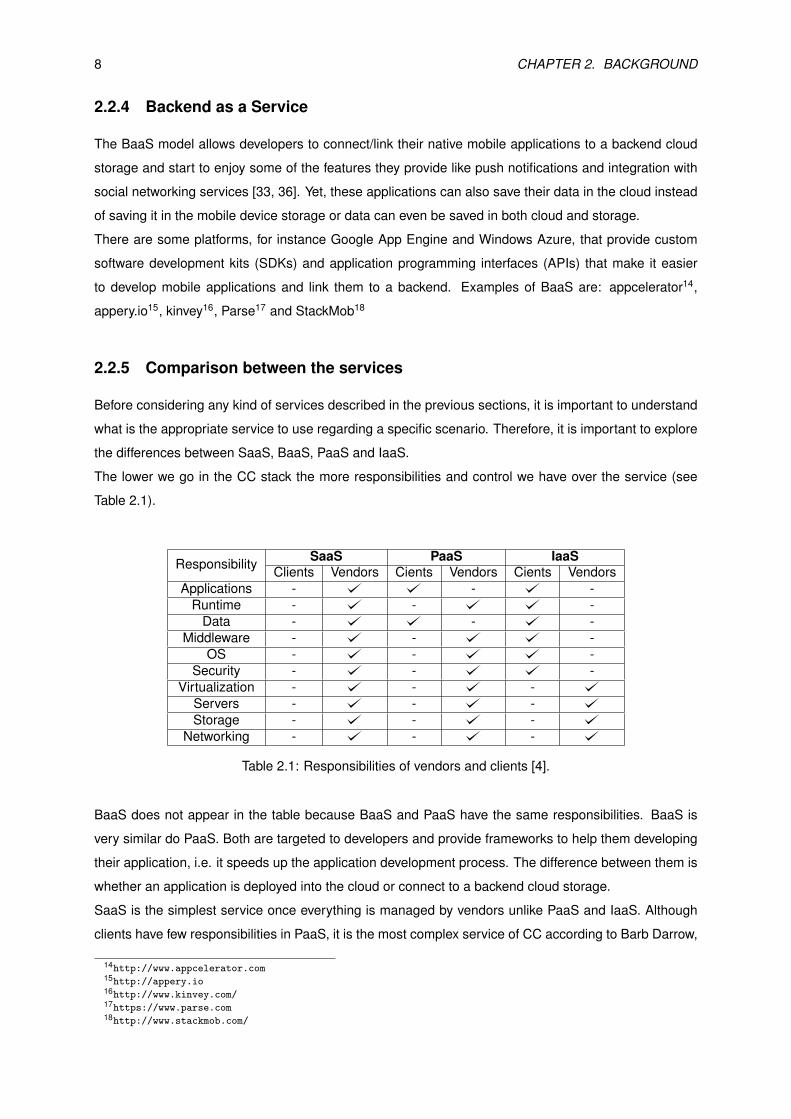
2.2.5 Comparison between the services
Before considering any kind of services described in the previous sections, it is important to understand
what is the appropriate service to use regarding a specific scenario. Therefore, it is important to explore
the differences between SaaS, BaaS, PaaS and IaaS.
The lower we go in the CC stack the more responsibilities and control we have over the service (see
Table 2.1).
Responsibility SaaS PaaS IaaSClients Vendors Cients Vendors Cients Vendors
Applications - - -Runtime - - -
Data - - -Middleware - - -
OS - - -Security - - -
Virtualization - - -Servers - - -Storage - - -
Networking - - -
Table 2.1: Responsibilities of vendors and clients [4].
BaaS does not appear in the table because BaaS and PaaS have the same responsibilities. BaaS is
very similar do PaaS. Both are targeted to developers and provide frameworks to help them developing
their application, i.e. it speeds up the application development process. The difference between them is
whether an application is deployed into the cloud or connect to a backend cloud storage.
SaaS is the simplest service once everything is managed by vendors unlike PaaS and IaaS. Although
clients have few responsibilities in PaaS, it is the most complex service of CC according to Barb Darrow,
14http://www.appcelerator.com15http://appery.io16http://www.kinvey.com/17https://www.parse.com18http://www.stackmob.com/
2.2. SERVICES OF MOBILE CLOUD COMPUTING 9
senior writer at GigaOM19, says “for most companies, PaaS is just too complicated for most humans,
including developers” [17]. Moreover, Gartner estimates that $131 billion cloud computing market, PaaS
represents about 1%, whereas SaaS sits at 17.7% and IaaS at 5.5% [38].
SaaS is seen as the primary type cloud investment with 82% citing its usage today and even more when
it is seen as the deployment model for new applications with 84% [48].
Currently SaaS has the biggest slice of the cake. One of the reasons for this to be happening is the fact
that SaaS is more targeted to users than only just for developers. Our vision, in this, is that when we go
further down in the Cloud Computing’s stack, the target audience is more restrict.
Regarding the development process of SaaS using PaaS and an application using BaaS, we have the
following differences:
SaaS
1. The (web) mobile application resides in the web hosting service and it needs another application
(browser, as an intermediary) to run the (web) mobile application.
2. Images are also in the file system of the web hosting service. However the images can be placed
in a storage service instead.
3. To work with data (store and retrieve), it needs to link the (web) application with an SQL database
or with Storage depending if it is required a relational or non-relational database.
BaaS
1. If it is a native application, it is not present in the cloud but in the mobile device. If it is web
application, the application resides in other domain rather than running in the cloud itself where is
the BaaS created and located.
2. Unlike SaaS, they do not need SQL database. Unless, it requires a relational database, because
in BaaS it is possible to create tables and do whatever with the data (e.g. insert into the table, edit,
delete).
3. With BaaS, it is necessary the Storage service in order to work with images (such as save images
in the cloud and retrieve them).
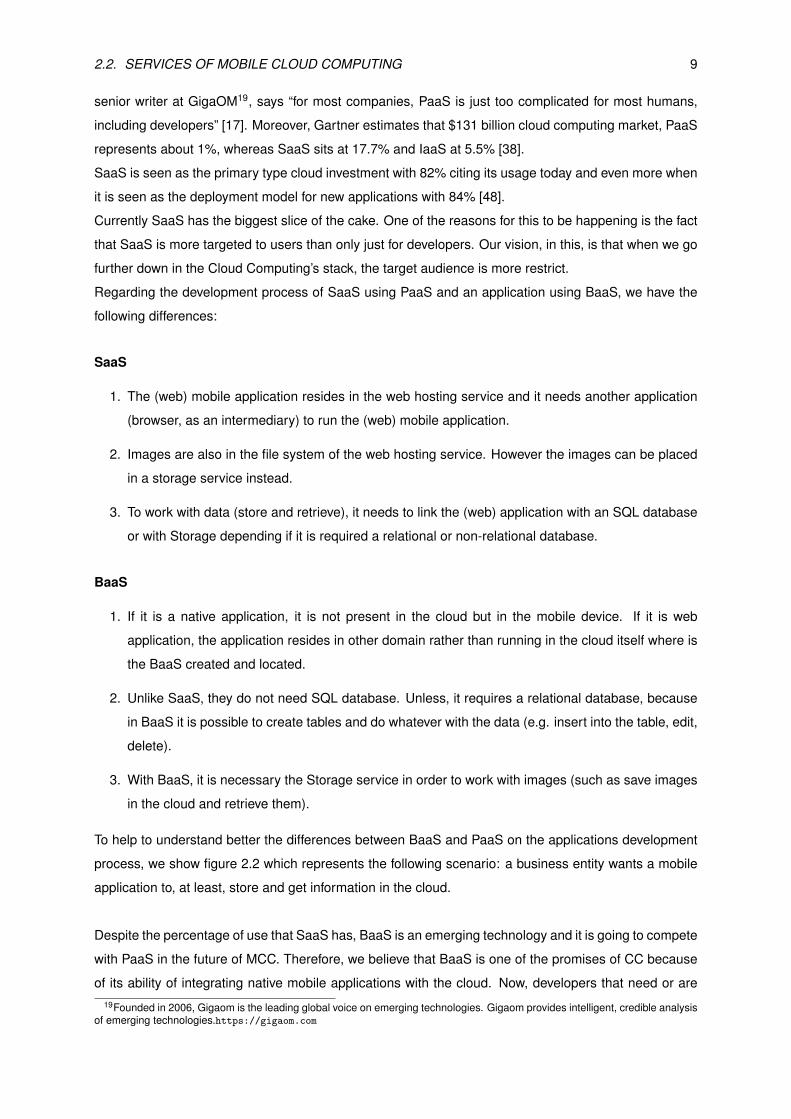
To help to understand better the differences between BaaS and PaaS on the applications development
process, we show figure 2.2 which represents the following scenario: a business entity wants a mobile
application to, at least, store and get information in the cloud.
Despite the percentage of use that SaaS has, BaaS is an emerging technology and it is going to compete
with PaaS in the future of MCC. Therefore, we believe that BaaS is one of the promises of CC because
of its ability of integrating native mobile applications with the cloud. Now, developers that need or are19Founded in 2006, Gigaom is the leading global voice on emerging technologies. Gigaom provides intelligent, credible analysis
of emerging technologies.https://gigaom.com
10 CHAPTER 2. BACKGROUND
Figure 2.2: Schema that shows some differences between (a) Software as a Service and (b) an applic-ation using a Backend as a Service.
more familiar with native applications for their business, they can adapt them to moving towards to MCC,
where some of the computations, but not all of them, are offloaded to the cloud, in order to enjoy the
best of both sides.
2.2.6 Benefits
CC is changing the way companies work and the people’s habits. MCC helps to break some barriers to
mobile users as well as to mobile business companies [18]. We will see the benefits that CC brought in
order to understand how does it affect the mobile world.
2.2.7 Cloud Computing
Companies are now looking for how to take fully advantage of CC technology in order to have more
engagement with their customers. Experts on this topic believe that this trend will grow even more.
When companies use it properly, working with the cloud can bring some benefits, extending them also
to customers. Namely in what concerns to cost savings, storage and ubiquity in data access.
Cost Savings. This is one of the main benefits for organizations. With CC, organizations do not need
to acquire equipments to provide their service to customers. Also, they do not need to manage the
part of the system that now relies on CC service.
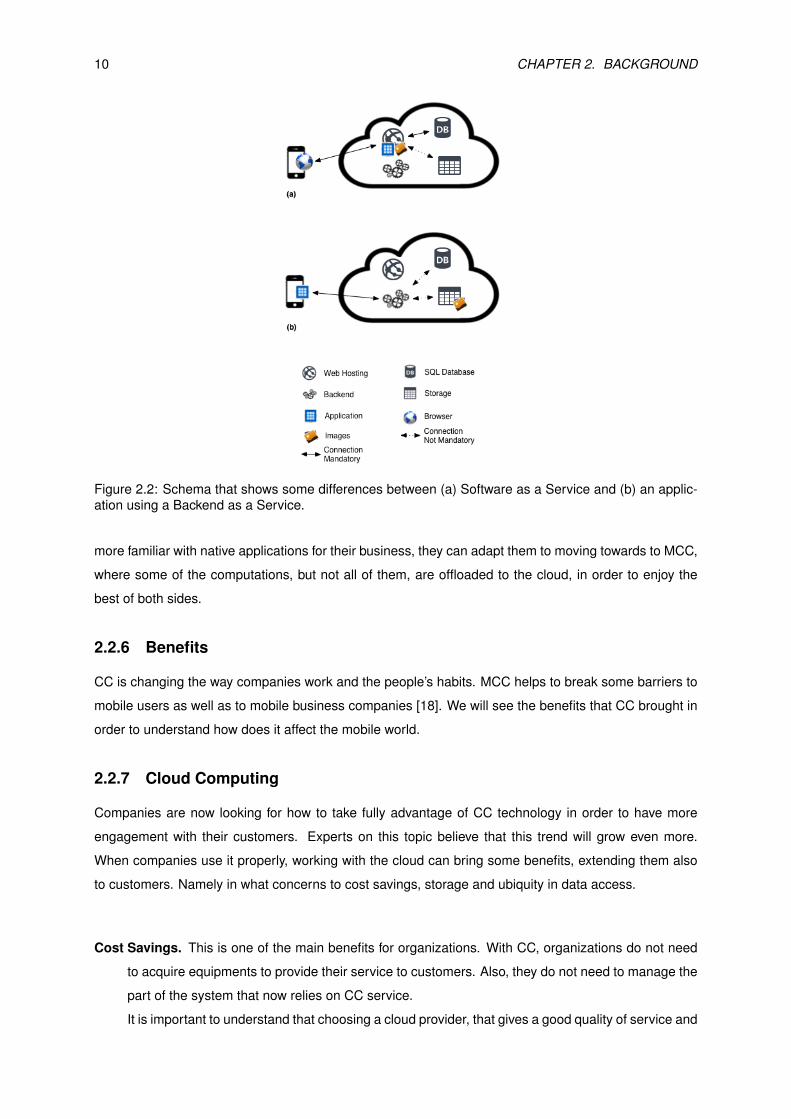
It is important to understand that choosing a cloud provider, that gives a good quality of service and
2.2. SERVICES OF MOBILE CLOUD COMPUTING 11
a great availability, can be a significant improvement when comparing with internal IT or managed
services. Table 2.2 shows an example of a possible business scenario where it is worth to use CC
as reported by Reese [51].
InternalIT
ManagedServices
TheCloud
CapitalInvestment $40’000 $0 $0
SetupCosts $10’000 $5’000 $1’000
MonthlyServices $0 $4’000 $2’400
MonthlyLabor $3’200 $0 $1’000
Cost OverThree Years $149’000 $129’000 $106’000
Table 2.2: Estimated costs of infrastructure under a possible scenario of two application servers backedby two database servers and balanced by a load balancer [51].
From table 2.2 analysis, the costs savings between the different strategies over the three years are
[51]:
1. From Internal IT to Managed Services, the cost savings are 13.5% - Managed Services is
less costly
2. From Internal IT to The Cloud, the cost savings are 18% - The Cloud is less costly
3. From Managed Services to The Cloud, the cost savings are 29% - The Cloud is less costly
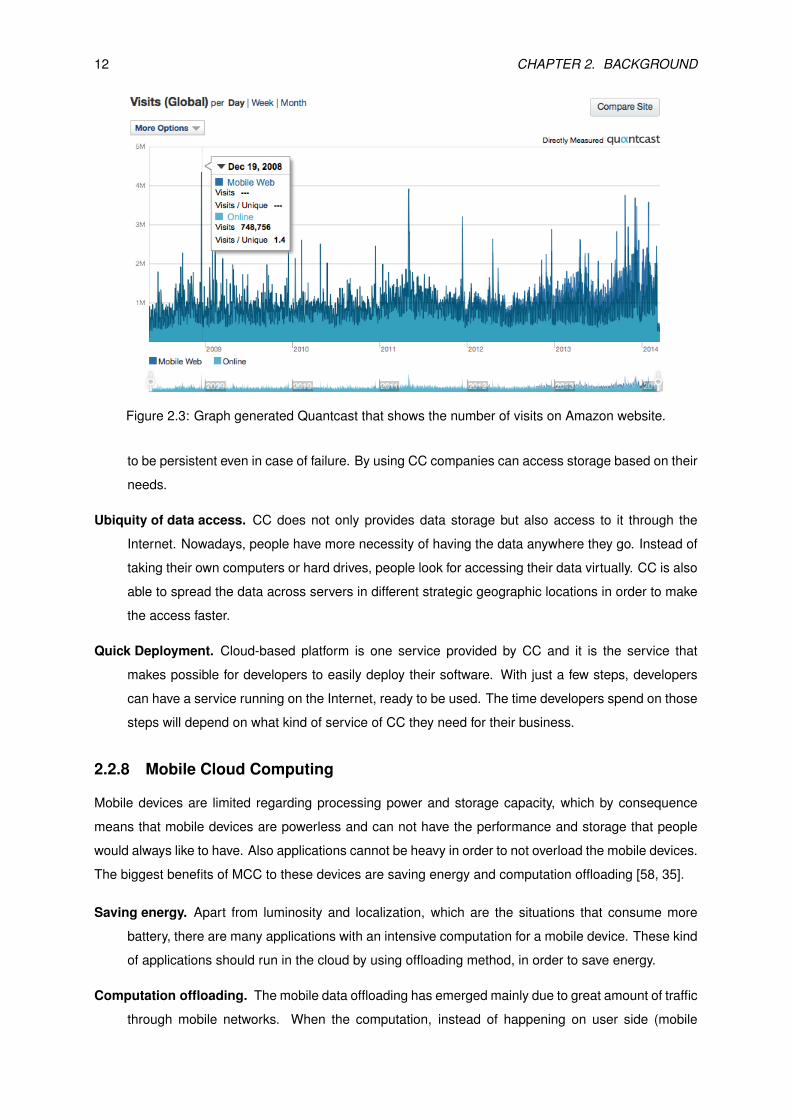
One of the biggest problems across all companies is the lack of uniform load across servers. These
peaks of load can vary daily, weekly, monthly or even yearly (see the example from Amazon, Figure
2.3). Therefore, companies do not need the same amount of servers working all the time. Even
with companies at full power, there is no guarantee that they will be able to respond to some peak
of requests.
The graph of Quantcast20, figure 2.3, shows that a fixed capacity on the infrastructure is a big
issue on costs due to the difficulty of predicting how many machines are needed to always provide
the best service. CC provides a pool of resources that fits the company needs on-demand. Its
elasticity reduces the need to monitor and do a forecast of the website’s traffic in order to handle
it properly. With CC, companies can easily meet their peaks of load without having the worry of
providing enough resources. This way companies tend to have less capital expenditure (CapEx)
and more operating expenditure (OpEx) which is a classic way to stretch their budget.
Huge storage and persistence. Since CC is on-demand and offers a pool of resources including data-
base servers, companies do not need to worry about storage space and increasing it. An example
is duplicating the data to guarantee availability regardless any server’s fault. Therefore, data needs20https://www.quantcast.com
12 CHAPTER 2. BACKGROUND
Figure 2.3: Graph generated Quantcast that shows the number of visits on Amazon website.
to be persistent even in case of failure. By using CC companies can access storage based on their
needs.
Ubiquity of data access. CC does not only provides data storage but also access to it through the
Internet. Nowadays, people have more necessity of having the data anywhere they go. Instead of
taking their own computers or hard drives, people look for accessing their data virtually. CC is also
able to spread the data across servers in different strategic geographic locations in order to make
the access faster.
Quick Deployment. Cloud-based platform is one service provided by CC and it is the service that
makes possible for developers to easily deploy their software. With just a few steps, developers
can have a service running on the Internet, ready to be used. The time developers spend on those
steps will depend on what kind of service of CC they need for their business.
2.2.8 Mobile Cloud Computing
Mobile devices are limited regarding processing power and storage capacity, which by consequence
means that mobile devices are powerless and can not have the performance and storage that people
would always like to have. Also applications cannot be heavy in order to not overload the mobile devices.
The biggest benefits of MCC to these devices are saving energy and computation offloading [58, 35].
Saving energy. Apart from luminosity and localization, which are the situations that consume more
battery, there are many applications with an intensive computation for a mobile device. These kind
of applications should run in the cloud by using offloading method, in order to save energy.
Computation offloading. The mobile data offloading has emerged mainly due to great amount of traffic
through mobile networks. When the computation, instead of happening on user side (mobile
2.3. CHALLENGES 13
devices), happens in the cloud (in the server side), this makes mobile devices able to save energy,
i.e., extend the battery life. However, the amount of energy that we save by offloading applications
computation depends on whether it is a light or a heavy application regarding computation. It also
depends in the communication time needed.
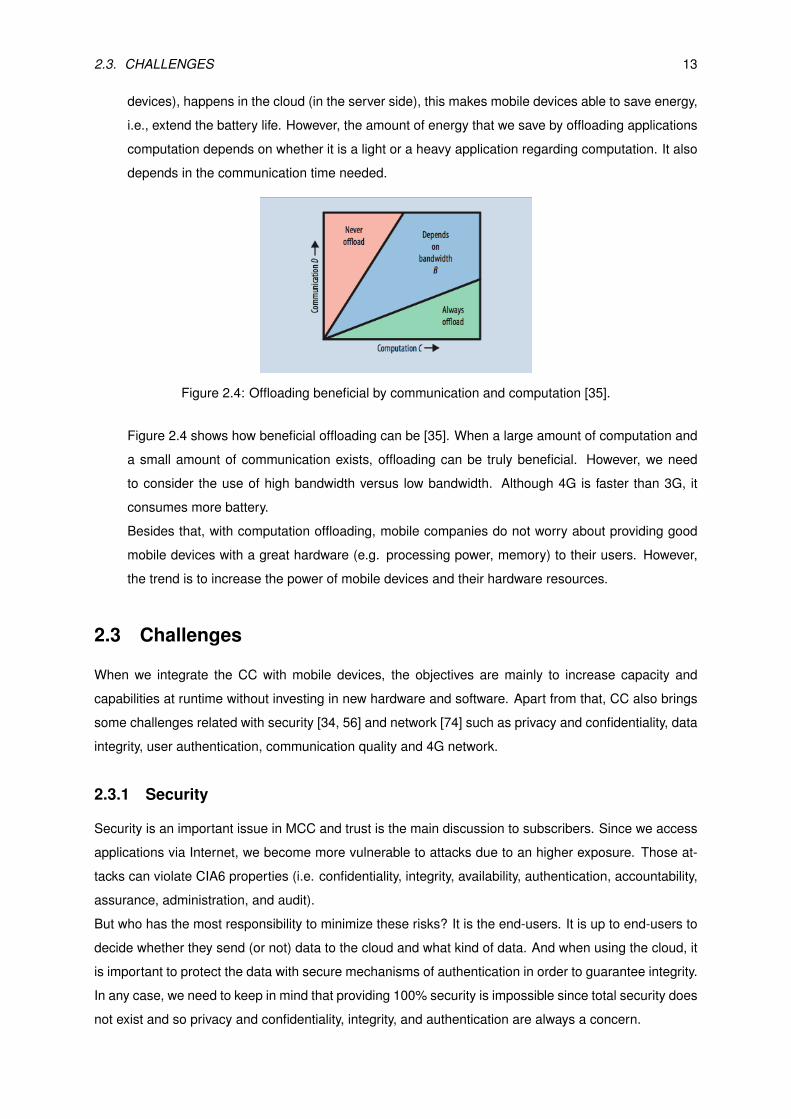
Figure 2.4: Offloading beneficial by communication and computation [35].
Figure 2.4 shows how beneficial offloading can be [35]. When a large amount of computation and
a small amount of communication exists, offloading can be truly beneficial. However, we need
to consider the use of high bandwidth versus low bandwidth. Although 4G is faster than 3G, it
consumes more battery.
Besides that, with computation offloading, mobile companies do not worry about providing good
mobile devices with a great hardware (e.g. processing power, memory) to their users. However,
the trend is to increase the power of mobile devices and their hardware resources.
2.3 Challenges
When we integrate the CC with mobile devices, the objectives are mainly to increase capacity and
capabilities at runtime without investing in new hardware and software. Apart from that, CC also brings
some challenges related with security [34, 56] and network [74] such as privacy and confidentiality, data
integrity, user authentication, communication quality and 4G network.
2.3.1 Security
Security is an important issue in MCC and trust is the main discussion to subscribers. Since we access
applications via Internet, we become more vulnerable to attacks due to an higher exposure. Those at-
tacks can violate CIA6 properties (i.e. confidentiality, integrity, availability, authentication, accountability,
assurance, administration, and audit).
But who has the most responsibility to minimize these risks? It is the end-users. It is up to end-users to
decide whether they send (or not) data to the cloud and what kind of data. And when using the cloud, it
is important to protect the data with secure mechanisms of authentication in order to guarantee integrity.
In any case, we need to keep in mind that providing 100% security is impossible since total security does
not exist and so privacy and confidentiality, integrity, and authentication are always a concern.
14 CHAPTER 2. BACKGROUND
Privacy and confidentiality. Most of the people do not have the proper education. Thereby, it can be
hard for them to understand how dangerous theirs (innocent) actions can be. Organizations take
advantage of what people place on Internet to sell personal data to other organizations that are
interested in it. Facebook and online documents, such as Google Docs, are well-known examples
[63]. Cloud providers, who provide storage to customers, also have access to the data stored by
their users. And like Facebook, they can disclose it or use it for unauthorized purposes [16].
Data Integrity. Since data is stored in the cloud, each user is responsible for ensuring the integrity of
his data. Cloud providers say that the data stored is utmost safe but there have been cases where
data have been modified or lost. These situations may happen due to some security breach or
some human error [6].
Authentication. One way to minimize either privacy or data integrity is the provision and use of strong
authentication methods. However, this is not always enough. Users have the tendency to use weak
passwords to access external resources in order to have a memorable password. The problem of
strong passwords is that they are hard to remember. Yet, they should not do it if they want to
protect their data in terms of rights and authentication. And because of this, there is a need for
more secure authentication methods. Different mechanisms of authentication has been proposed
and presented for example in [59, 28, 57, 23].
2.3.2 Network
Cloud services are increasing along with their use. For example, storing stuff remotely to access it from
anywhere and whenever. This is an example of what people do with cloud services. Furthermore, on
business, CC boosts remote working even also using mobile devices [64, 40, 15]. So, it is quite important
to enhance the network which becomes a significant challenge.
Communication quality. The quality of communication of mobile devices depends heavily on band-
width of the mobile network. This bandwidth is very inconstant, specially when we are moving at
a significant speed, making the internet connectivity unpredictable. It can be hard to know when
the signal is strong or weak, or even out-of-signal. Thereby, users may not be able to connect
to the cloud and get their service. On the other hand, this can happen because of either traffic
congestion or network failures [74]. Availability becomes an important issue in MCC than that in
the CC, namely in wired networks. However, there are researches that proposed some solutions
[27] (e.g. Femtocell).
4G network. 4G is the fourth generation of mobile telecommunications technology that still increases
the bandwidth and latency. Even if 4G promises some advantages such as widening mobile cov-
erage area, smothering quicker handoff, varied services and so forth [49], it seems that it is not
enough. There are still issues [67] like upgrading from 3G to 4G (since many mobile devices were
not built for that) or rather, most of smartphones and tablets with mobile connectivity cannot latch
2.4. APPLICATIONS 15
on to 800MHz or 2.6GHz signals as they don’t have the necessary chips built-in[72, 13]. In fact in
many regions, users still struggle to get a 3G signal.
2.4 Applications
Regarding mobile applications that can be developed, there are three types: native, web, and hybrid.
It is important to go in detail about each one so that we can distinguish them by understanding their
differences. Thus, to make it easier to choose the type that fits the requirements of one application, we
will go deeper on native and web (HTML5) mobile applications development in order to get a thorough
understanding.
2.4.1 Native
Native applications are those which are developed by targeting a single operating system (OS) and using
the specific languages and SDKs (e.g. Java for Android, Objective-C for iOS, or C#/.NET for Windows
Phone) provided by some IDEs such as Eclipse, Xcode, or Visual Studio.
There are many reasons to use these kind of applications, namely: (1) Best performance (fastest, most
reliable and responsive experience to users); (2) Full access to the features of a specific devices (e.g.
camera, accelerometer, geolocation, notifications, and compass).
However, what limits this type of applications is the fact that they are going to run on a specific kind of
devices. For instance, if developed in Objective-C, it only runs on iOS and not on Android or Windows
Phone. By consequence, if developers want to reach all platforms it will require more time and know-
ledge.
On the other hand, there are some approaches and frameworks to overcome this limitation. One of them
is the MDD approach based on the XIS-Mobile technology [53, 52].
2.4.2 Web
Mobile Web applications are canned in a way that they look like a mobile application. They are usu-
ally developed using PHP, Node.js, ASP.NET, HTML, CSS, or JavaScript. This kind of application is a
cross-platform mobile application that work on multiple devices regardless the operating system. But
unfortunately, there are also some limitations that remain, such as the access to the native device func-
tionality (e.g. GPS localization and camera).
One of the problems of creating such application is the fact that people are far less likely to use them.
A study made on United States by Flurry reports that only just 20% of time spent on mobile devices is
spent browsing the web, people much prefer dedicated applications in comparison with browser-based
solutions [31].
16 CHAPTER 2. BACKGROUND
2.4.3 Hybrid
Hybrid applications is the combination of both worlds. It is an HTML application rendered in a browser
embedded within an application that lives in an app store [9]. Hybrid applications, like native applications,
run on the device but are developed with web technologies (HTML5 [73], CSS, and JavaScript). Hybrid
is defined as a web application and then is wrapped inside of a native container that provides access
to the native features. Cordova21 and PhoneGap22 are popular examples of frameworks to build hybrid
applications such as Banana Republic23 [9], Google Apps [22], Yahoo! Livestand [70], Foursquare and
Facebook [65].
2.4.4 Which one to choose
There is a lot of discussion when it comes out the idea of building mobile applications and two dominant
lines of debates appear: build a native application or build a web-based application. The differences
between native and web applications resides mainly on the look and feel. HTML5 tries to give a very
similar look and feel and experience to what users would find in a native application [45]. For example, in
HTML5 when it is implemented a drop-down list, depending on what operating system the application is
running, it will fetch the native drop-down list correspondent to the operating system. Another difference
is the access to on-device features [7, 41] where native applications have full access while mobile web
applications need an application programming interface (API) to reach down to the device itself.
HTML5 has brought a surge of on-mobile features access such as GPS location, audio and video cap-
turing, and accelerometer. Also, the user interface (UI) speed is improved. It is hard to achieve the same
speed and performance of native applications with mobile web applications where rendering and loading
are the biggest concerns. Remote access will strongly depend of connectivity which can be weak or null.
On the other hand, HTML5 does not depend on App Stores to make their applications available to users
and provide updates. In addition, HTML5 now provides offline application capabilities (e.g. offline stor-
age, geolocation, canvas graphics, and video/audio playback) that allow web applications to run when
active network connection is not available [62] and to store persistent databases in the web browser
itself [26]. One example is Gmail from Google [50].
We believe that hybrid applications will not replace native applications entirely because there are things
that one can do better than the other. Nevertheless, according to Gartner, an American information
technology research advisory firm, more than 50% of mobile applications are going to be hybrids by
2016 and its vice president Van Baker said that it “should consider how applications can be enriched or
improved by the addition of native device capabilities and evaluate development frameworks that offer
the ability to develop native, hybrid and Web applications using the same code base. When possible,
development activities should be consolidated via cross-platform frameworks”, and he also reckons that
building hybrid applications will make their lives easier.
21http://cordova.apache.org22http://phonegap.com23https://play.google.com/store/apps/details?id=com.skava.hybridapp.bananarepublic
2.5. RELATED WORK 17
There are many experts that have the same opinion, such as Telerik24 which says on its survey that
“There are no ‘one-size-fits-all’ solutions for mobile application development” and Todd Anglin said that
“Many developers are finding the choice between native and hybrid approaches is dependent on busi-
ness needs, application requirements, developer skill, development time, and other factors”.
It is important to understand the differences between native and mobile web application in order to better
decide which one to use. To support the best choice, developers have to answer the following 5 essen-
tial questions [14]: (1) How many mobile devices platforms do you want to support? (2) Do you have
a “bring your own device” (BYOD) [5, 44] strategy? (3) How many on-device features do you need to
access? (4) How important is security and/or performance? (5) What is the purpose of the application?
For instance, Facebook has originally developed his mobile application as a web application. However,
when they built and provided a native application, Mark Zuckerberg said that “The biggest mistake we
made as a company was betting too much on HTML5 as opposed to native”.
Now we need to take into consideration the network factor regarding MCC. One of the things that native
applications did not need to worry was the network because all the data was in the mobile device. For
instance, if the intention of the mobile application is to store data on an external source (in the cloud
in this case) the network will be necessary to connect with the cloud and obtain the data. Since the
network is unpredictable (as we mentioned in section 2.3.2) it is hard to measure the performance of
one application in these situations. Therefore, performance is not only an issue for web applications but
for native applications using external resources such as backend cloud storage, i.e. native applications
using BaaS.
So, the two described scenarios are the following:
Without BaaS. If the first priority of a business application is performance or on-device features, then
native application is the way to go. But if cross-platform is a concern as it will certainly be in
corporations implementing BYOD strategies, then mobile web applications are a better choice.
With BaaS. With BYOD strategies we keep the same thought as we described before. However, per-
formance is more complicated to evaluate since both applications requires network. Therefore, it is
necessary to regard another issues such as on-device feature. If this is also a priority, then native
application is the option to take otherwise, it is the web application.
2.5 Related Work
Hoang et al. give an overview regarding MCC, starting with some different definitions for MCC that exist,
which are very similar to each other [27]. The paper also gives a notion of the service models of CC.
However, they do not show the differences between the different services and do not present BaaS since
it is a recent service model. MCC applications are introduced for different business models (e.g. mobile
commerce, mobile learning, mobile healthcare and mobile gaming) and the purpose of applying MCC to
the applications for those business models.
24Telerik is an end-to-end provider of application development tools and solutions for building cross-platform and mobile applic-ations [2].
18 CHAPTER 2. BACKGROUND
They analyses some approaches to deal with offloading in two different types of environments: static
and dynamic (when a user is on the move and the connection or bandwidth of his mobile device is chan-
ging). Niroshinie et al. discuss some methods of offloading tasks (e.g. how to tackle issues related to
the distance between the device and the cloud and the heterogeneity) [20].
Hoang et al. also analyse security regarding two categories: (1) Security for mobile users, where it
shows approaches on how to protect mobile devices from possible threats and how to avoid the leak
of user’s personal information and (2) Security data on clouds, where it presents methods to secure
data access and solutions proposed to address the integrity and digital right management issues. Khan
et al. focus more on security issues. They show numerous challenges in this field and some security
frameworks for MCC [32].
The survey presented by Niroshinie et al. explains the need of using MCC nowadays by exploring the
different applications (such as image processing, natural language processing, crowd computing, shar-
ing GPS/Internet data, sensor data applications, multimedia searches and social network) and scenarios
[20].
Amatya and Kurti present a survey where it shows the trends on the mobile development in cross-
platform, mainly the potential of two approaches which are web-based approach and hybrid approach
[3].
Appcelerator published a white paper that debates native and HTML5 development. It gives some high-
lights of statistics of Native and HTML applications in production. It describes some aspects that are
important for successful applications such as: user experience, performance, monetization, cross plat-
form deployment costs, fragmentation, availability of programming expertise, importance of immediate
updates and distribution control, timeliness of few OS innovations and security. It also introduces a tool
that helps developers to deliver cross-platform applications without much effort [71].
Also, a paper of Ogunlolu et al., based on their development costs, cross platform capabilities, ap-
plication performance and development cycle, shows a comparison between web mobile applications
(HTML5) and native applications (Android OS, iOS and Windows Phone OS). It also does a brief look to
some features (e.g. offline, geolocation, real time communication and connectivity and multimedia) that
come with HTML5 and not with HTML4 which leverage more power and efficiency to web applications
[46].
Madaudo and Scandurra present some tools for application development using both approaches cross-
platform and native application development [39]. Also, together with Li and Powell, they show some
advantages and drawbacks of each approach for each aspect (e.g. user experience, performance,
device-specific features) [37].
Chapter 3
Applications Developed
This chapter introduces Windows Azure platform and tools that can be used to interact with it. Further-
more, it shows and discusses the two applications we developed for tourism (a web application and a
native application that we named as WebMAT and NativeMAT respectively) along with the their linked
services from Windows Azure (Web Site service and Mobile Service). These two applications serves
basically to consult PoIs in Portugal (screen shots in appendix A). And, this chapter also shows all the
development process of both WebMAT and NativeMAT applications, i.e., all the steps we have done in
order to connect WebMAT and NativeMAT to a cloud service and then, send and receive data. Also, we
discuss some developed features using some APIs and frameworks. And at last, optimizations that we
did by taking into account some recommendations and good practices.
3.1 Windows Azure
As we have already mentioned in section 2.2.2, Windows Azure is a PaaS provided by Microsoft. To
start developing applications with this platform, Microsoft provides two Integrated Development Environ-
ments (IDEs): (1) WebMatrix, a free, lightweight and cloud-connected web development tool and (2) the
well-known Visual Studio Express or just Visual Studio1. Now depending on what type of service the
developers want to use and application to develop, they have more than these two tools. For example,
in the case that a developer wants to develop a native application and save the data in the cloud (and
benefit from some other features provided by the cloud provider) the option is to use Mobile Service and
the development tools can be Eclipse (Android) and/or Xcode (iOS).
Through Windows Azure Portal2 we can easily create and manage the services. The downside of Win-
dows Azure is the fact that it is not free. The developer only has 3 months of free trial and the services
created using this subscription have limits per month (e.g., the amount of data in traffic). Therefore, if
the limits are exceeded the services are suspended and the developer can no longer use the services.
The good way for testing Windows Azure’s capacity (e.g., availability, scalability and performance) is to
developing a web mobile application hosted within its Web Site service. WebMatrix was the chosen tool
1Free, but limited editions of Visual Studio for individual programming languages supported by .NET and SQL.2https://manage.windowsazure.com/
19
20 CHAPTER 3. APPLICATIONS DEVELOPED
to develop the web mobile application once it is free and facilitates its development and deployment to
Windows Azure.
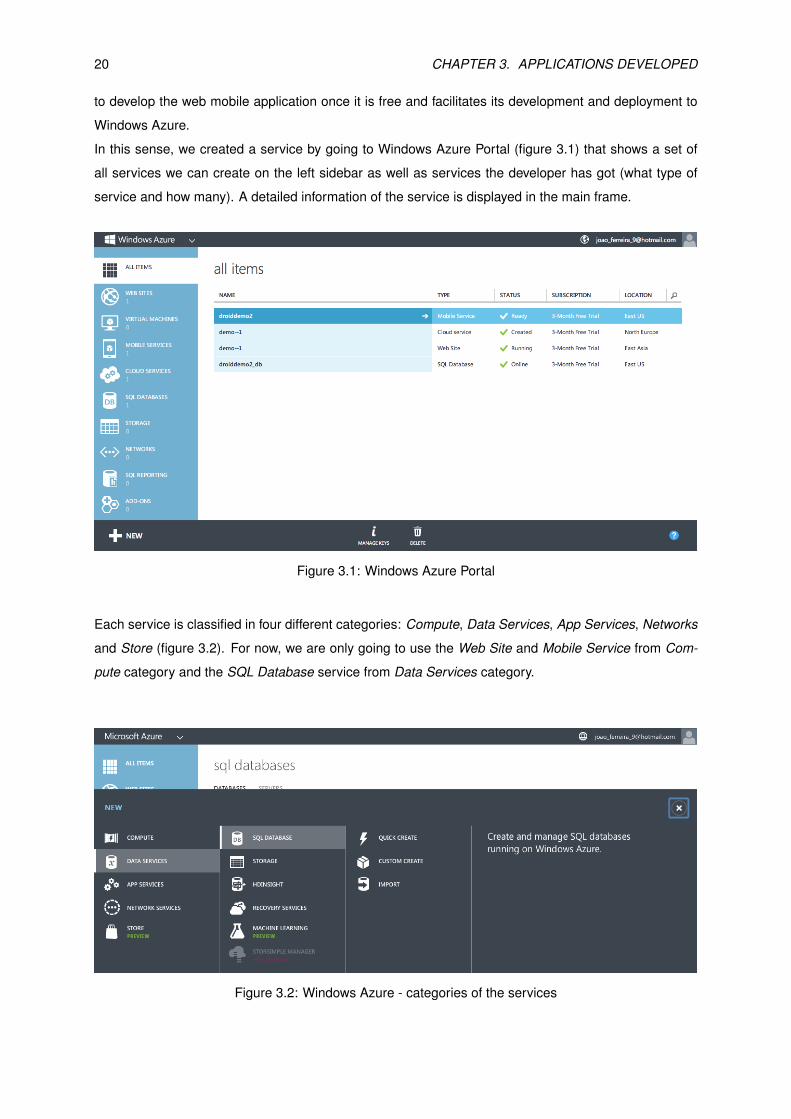
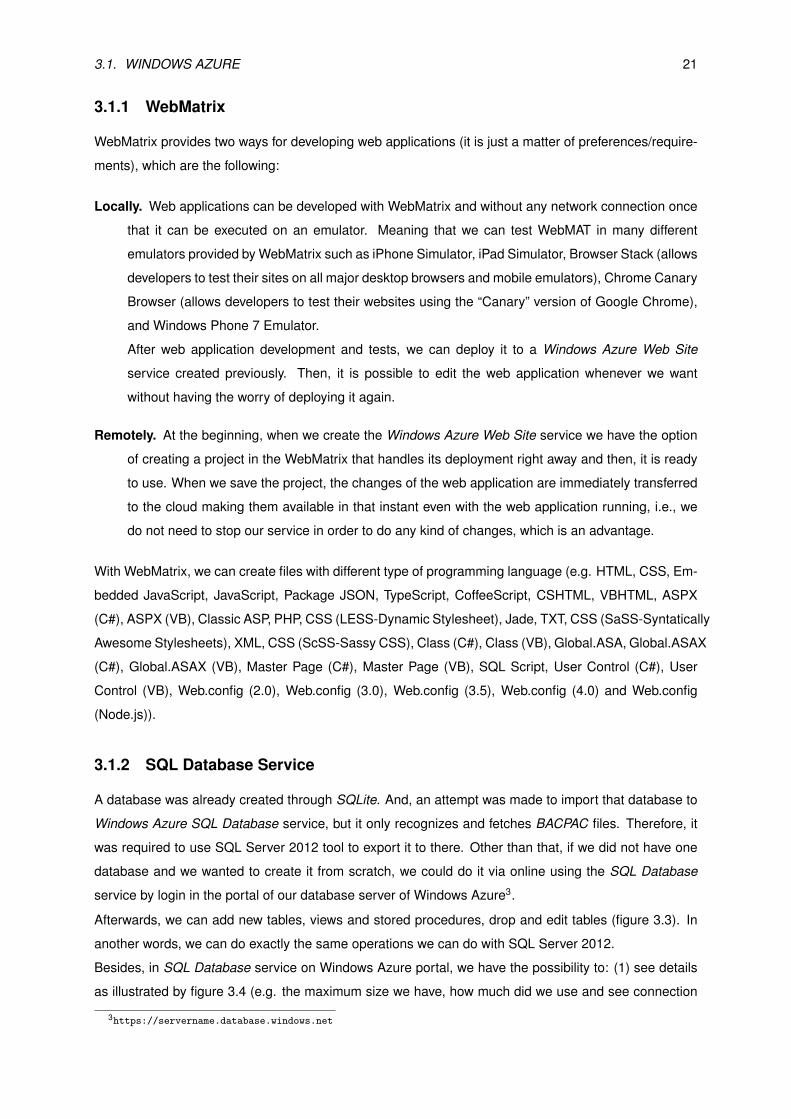
In this sense, we created a service by going to Windows Azure Portal (figure 3.1) that shows a set of
all services we can create on the left sidebar as well as services the developer has got (what type of
service and how many). A detailed information of the service is displayed in the main frame.
Figure 3.1: Windows Azure Portal
Each service is classified in four different categories: Compute, Data Services, App Services, Networks
and Store (figure 3.2). For now, we are only going to use the Web Site and Mobile Service from Com-
pute category and the SQL Database service from Data Services category.
Figure 3.2: Windows Azure - categories of the services
3.1. WINDOWS AZURE 21
3.1.1 WebMatrix
WebMatrix provides two ways for developing web applications (it is just a matter of preferences/require-
ments), which are the following:
Locally. Web applications can be developed with WebMatrix and without any network connection once
that it can be executed on an emulator. Meaning that we can test WebMAT in many different
emulators provided by WebMatrix such as iPhone Simulator, iPad Simulator, Browser Stack (allows
developers to test their sites on all major desktop browsers and mobile emulators), Chrome Canary
Browser (allows developers to test their websites using the “Canary” version of Google Chrome),
and Windows Phone 7 Emulator.
After web application development and tests, we can deploy it to a Windows Azure Web Site
service created previously. Then, it is possible to edit the web application whenever we want
without having the worry of deploying it again.
Remotely. At the beginning, when we create the Windows Azure Web Site service we have the option
of creating a project in the WebMatrix that handles its deployment right away and then, it is ready
to use. When we save the project, the changes of the web application are immediately transferred
to the cloud making them available in that instant even with the web application running, i.e., we
do not need to stop our service in order to do any kind of changes, which is an advantage.
With WebMatrix, we can create files with different type of programming language (e.g. HTML, CSS, Em-
bedded JavaScript, JavaScript, Package JSON, TypeScript, CoffeeScript, CSHTML, VBHTML, ASPX
(C#), ASPX (VB), Classic ASP, PHP, CSS (LESS-Dynamic Stylesheet), Jade, TXT, CSS (SaSS-Syntatically
Awesome Stylesheets), XML, CSS (ScSS-Sassy CSS), Class (C#), Class (VB), Global.ASA, Global.ASAX
(C#), Global.ASAX (VB), Master Page (C#), Master Page (VB), SQL Script, User Control (C#), User
Control (VB), Web.config (2.0), Web.config (3.0), Web.config (3.5), Web.config (4.0) and Web.config
(Node.js)).
3.1.2 SQL Database Service
A database was already created through SQLite. And, an attempt was made to import that database to
Windows Azure SQL Database service, but it only recognizes and fetches BACPAC files. Therefore, it
was required to use SQL Server 2012 tool to export it to there. Other than that, if we did not have one
database and we wanted to create it from scratch, we could do it via online using the SQL Database
service by login in the portal of our database server of Windows Azure3.
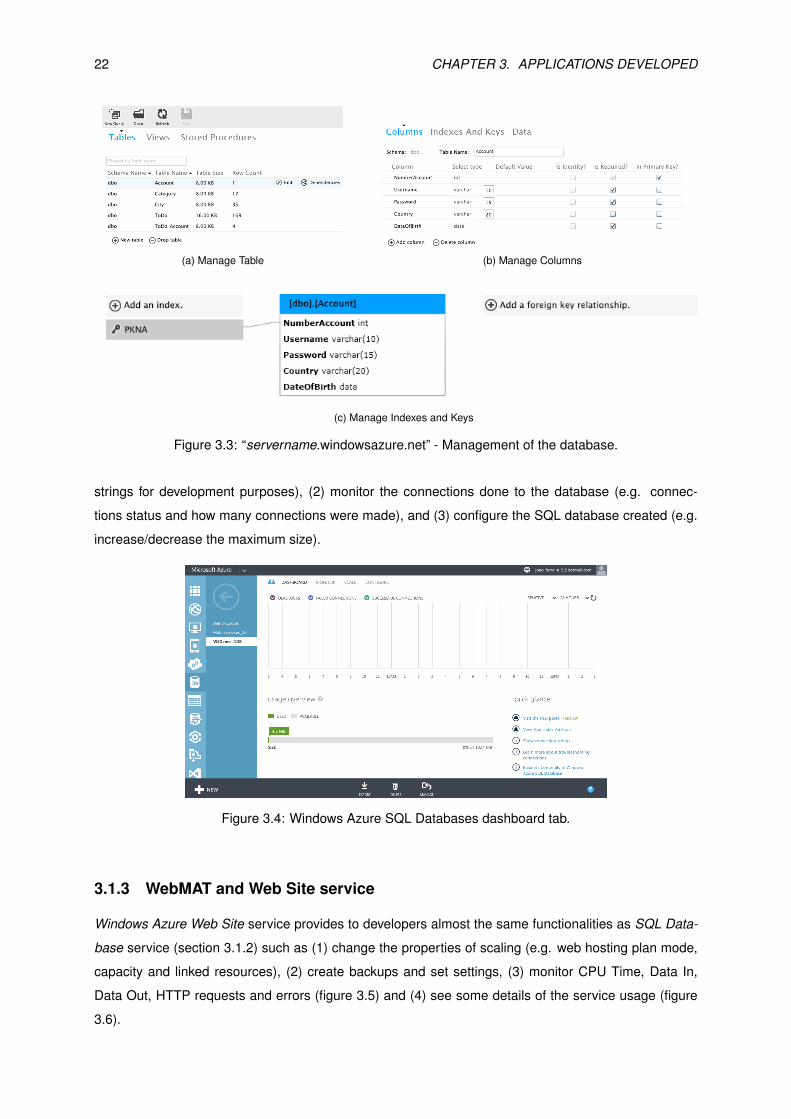
Afterwards, we can add new tables, views and stored procedures, drop and edit tables (figure 3.3). In
another words, we can do exactly the same operations we can do with SQL Server 2012.
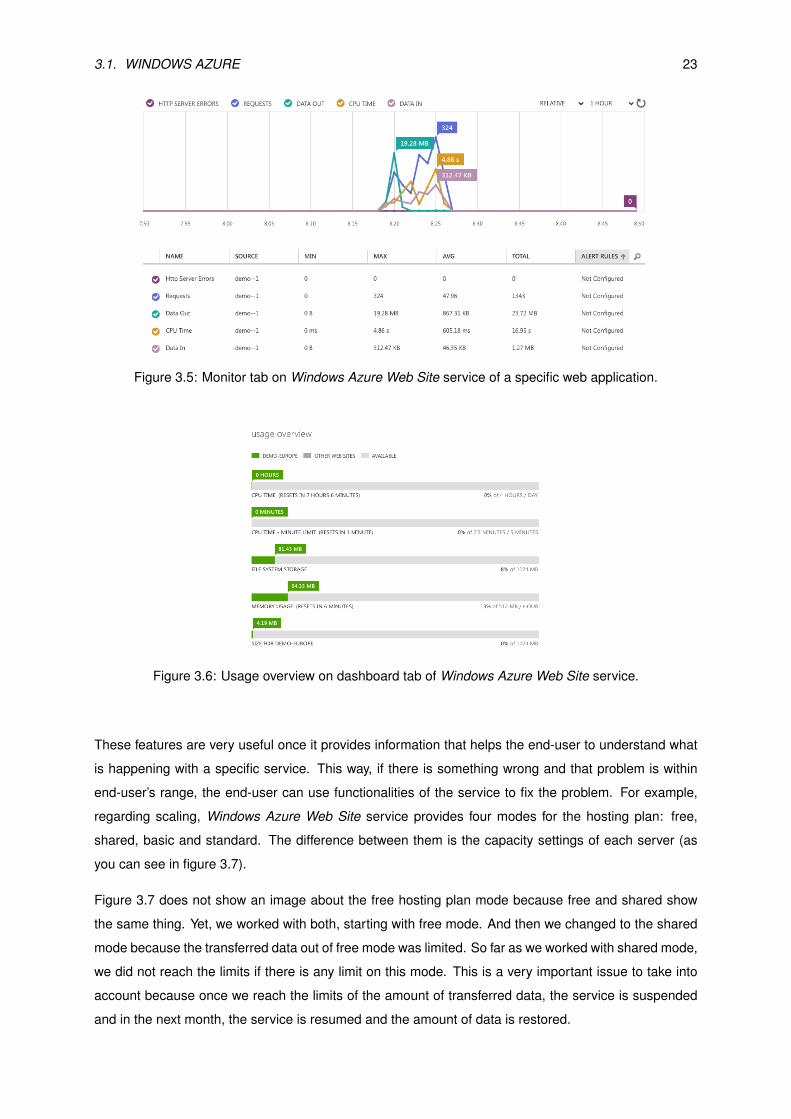
Besides, in SQL Database service on Windows Azure portal, we have the possibility to: (1) see details
as illustrated by figure 3.4 (e.g. the maximum size we have, how much did we use and see connection
3https://servername.database.windows.net
22 CHAPTER 3. APPLICATIONS DEVELOPED
(a) Manage Table (b) Manage Columns
(c) Manage Indexes and Keys
Figure 3.3: “servername.windowsazure.net” - Management of the database.
strings for development purposes), (2) monitor the connections done to the database (e.g. connec-
tions status and how many connections were made), and (3) configure the SQL database created (e.g.
increase/decrease the maximum size).
Figure 3.4: Windows Azure SQL Databases dashboard tab.
3.1.3 WebMAT and Web Site service
Windows Azure Web Site service provides to developers almost the same functionalities as SQL Data-
base service (section 3.1.2) such as (1) change the properties of scaling (e.g. web hosting plan mode,
capacity and linked resources), (2) create backups and set settings, (3) monitor CPU Time, Data In,
Data Out, HTTP requests and errors (figure 3.5) and (4) see some details of the service usage (figure
3.6).
3.1. WINDOWS AZURE 23
Figure 3.5: Monitor tab on Windows Azure Web Site service of a specific web application.
Figure 3.6: Usage overview on dashboard tab of Windows Azure Web Site service.
These features are very useful once it provides information that helps the end-user to understand what
is happening with a specific service. This way, if there is something wrong and that problem is within
end-user’s range, the end-user can use functionalities of the service to fix the problem. For example,
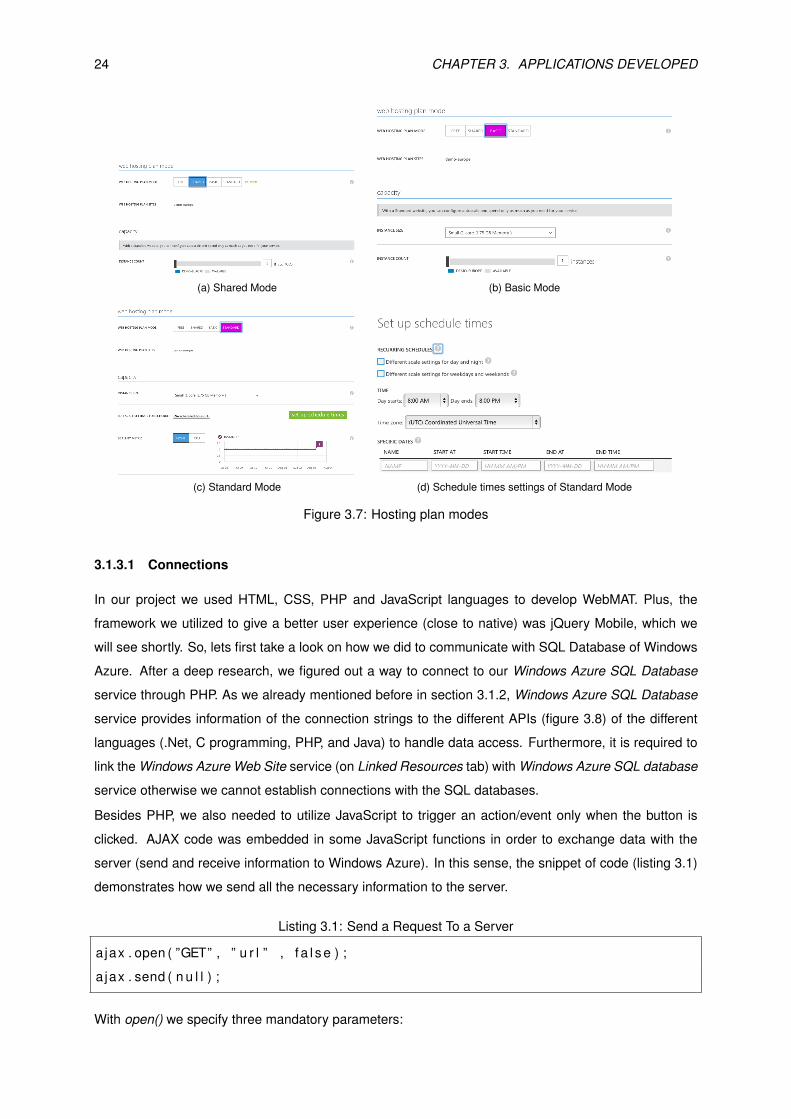
regarding scaling, Windows Azure Web Site service provides four modes for the hosting plan: free,
shared, basic and standard. The difference between them is the capacity settings of each server (as
you can see in figure 3.7).
Figure 3.7 does not show an image about the free hosting plan mode because free and shared show
the same thing. Yet, we worked with both, starting with free mode. And then we changed to the shared
mode because the transferred data out of free mode was limited. So far as we worked with shared mode,
we did not reach the limits if there is any limit on this mode. This is a very important issue to take into
account because once we reach the limits of the amount of transferred data, the service is suspended
and in the next month, the service is resumed and the amount of data is restored.
24 CHAPTER 3. APPLICATIONS DEVELOPED
(a) Shared Mode (b) Basic Mode
(c) Standard Mode (d) Schedule times settings of Standard Mode
Figure 3.7: Hosting plan modes
3.1.3.1 Connections
In our project we used HTML, CSS, PHP and JavaScript languages to develop WebMAT. Plus, the
framework we utilized to give a better user experience (close to native) was jQuery Mobile, which we
will see shortly. So, lets first take a look on how we did to communicate with SQL Database of Windows
Azure. After a deep research, we figured out a way to connect to our Windows Azure SQL Database
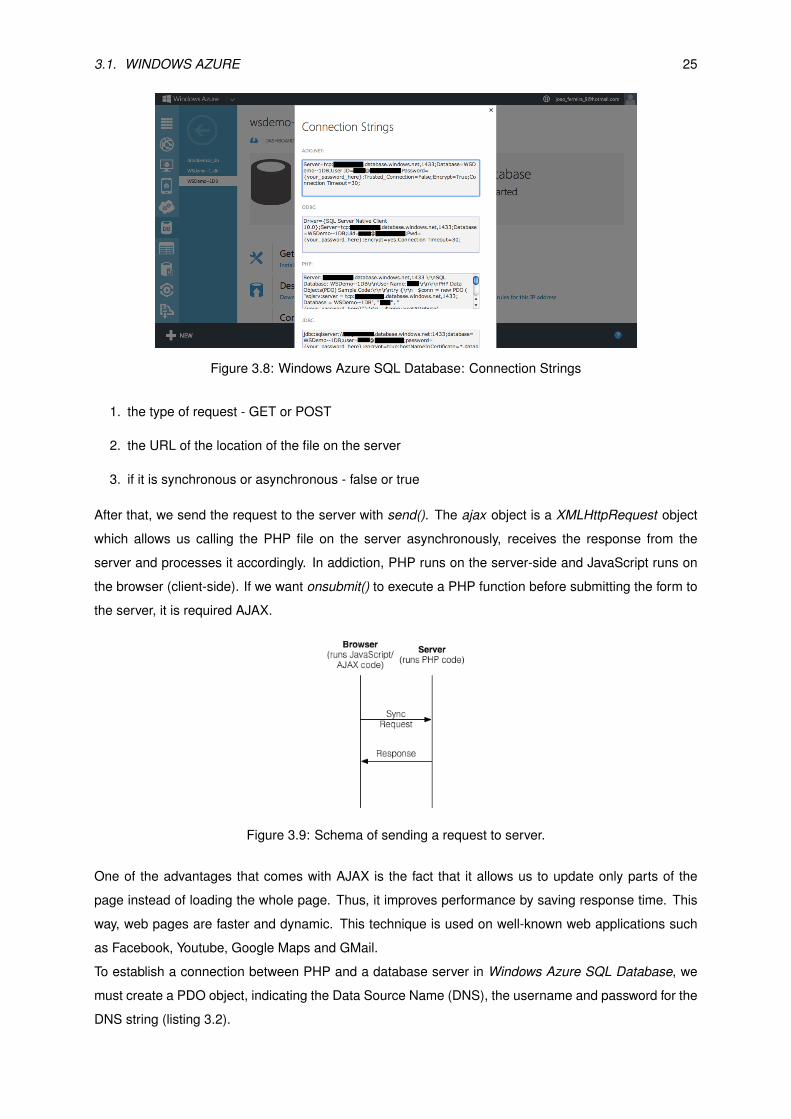
service through PHP. As we already mentioned before in section 3.1.2, Windows Azure SQL Database
service provides information of the connection strings to the different APIs (figure 3.8) of the different
languages (.Net, C programming, PHP, and Java) to handle data access. Furthermore, it is required to
link the Windows Azure Web Site service (on Linked Resources tab) with Windows Azure SQL database
service otherwise we cannot establish connections with the SQL databases.
Besides PHP, we also needed to utilize JavaScript to trigger an action/event only when the button is
clicked. AJAX code was embedded in some JavaScript functions in order to exchange data with the
server (send and receive information to Windows Azure). In this sense, the snippet of code (listing 3.1)
demonstrates how we send all the necessary information to the server.
Listing 3.1: Send a Request To a Server
a jax . open ( ”GET” , ” u r l ” , f a l s e ) ;
a jax . send ( n u l l ) ;
With open() we specify three mandatory parameters:
3.1. WINDOWS AZURE 25
Figure 3.8: Windows Azure SQL Database: Connection Strings
1. the type of request - GET or POST
2. the URL of the location of the file on the server
3. if it is synchronous or asynchronous - false or true
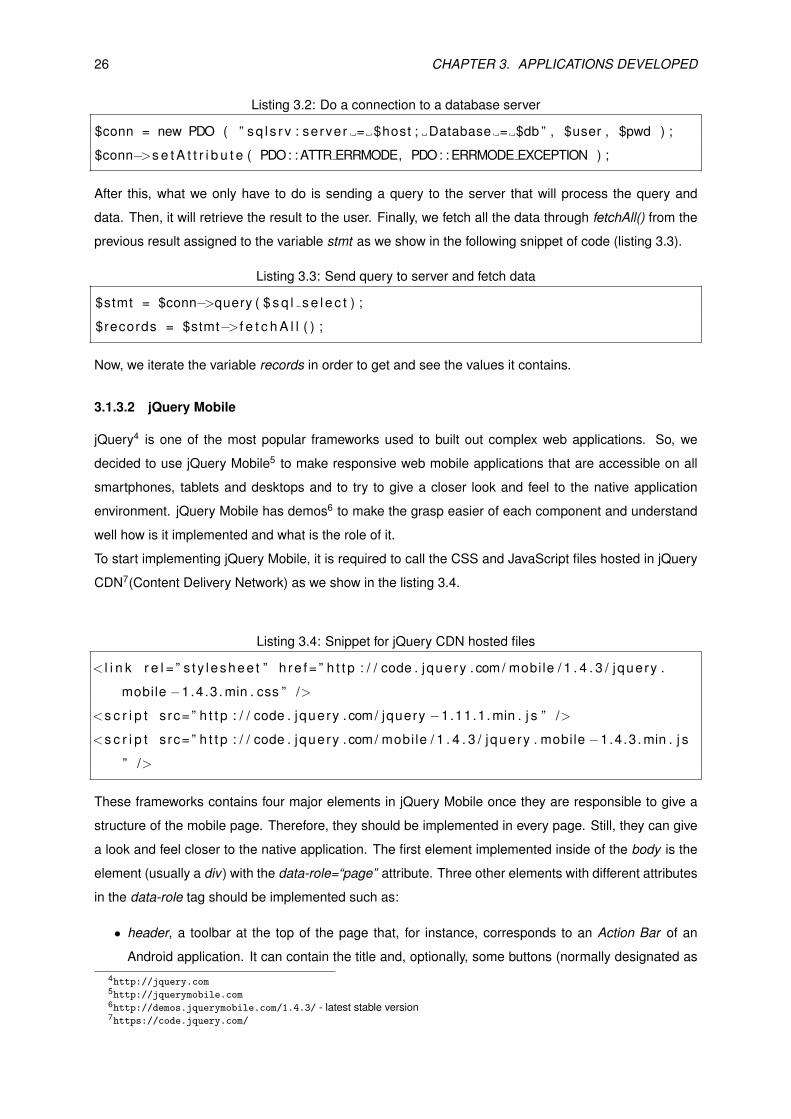
After that, we send the request to the server with send(). The ajax object is a XMLHttpRequest object
which allows us calling the PHP file on the server asynchronously, receives the response from the
server and processes it accordingly. In addiction, PHP runs on the server-side and JavaScript runs on
the browser (client-side). If we want onsubmit() to execute a PHP function before submitting the form to
the server, it is required AJAX.
Figure 3.9: Schema of sending a request to server.
One of the advantages that comes with AJAX is the fact that it allows us to update only parts of the
page instead of loading the whole page. Thus, it improves performance by saving response time. This
way, web pages are faster and dynamic. This technique is used on well-known web applications such
as Facebook, Youtube, Google Maps and GMail.
To establish a connection between PHP and a database server in Windows Azure SQL Database, we
must create a PDO object, indicating the Data Source Name (DNS), the username and password for the
DNS string (listing 3.2).
26 CHAPTER 3. APPLICATIONS DEVELOPED
Listing 3.2: Do a connection to a database server
$conn = new PDO ( ” s q l s r v : server = $host ; Database = $db ” , $user , $pwd ) ;
$conn−>s e t A t t r i b u t e ( PDO: : ATTR ERRMODE, PDO: : ERRMODE EXCEPTION ) ;
After this, what we only have to do is sending a query to the server that will process the query and
data. Then, it will retrieve the result to the user. Finally, we fetch all the data through fetchAll() from the
previous result assigned to the variable stmt as we show in the following snippet of code (listing 3.3).
Listing 3.3: Send query to server and fetch data
$stmt = $conn−>query ( $ s q l s e l e c t ) ;
$records = $stmt−>f e t c h A l l ( ) ;
Now, we iterate the variable records in order to get and see the values it contains.
3.1.3.2 jQuery Mobile
jQuery4 is one of the most popular frameworks used to built out complex web applications. So, we
decided to use jQuery Mobile5 to make responsive web mobile applications that are accessible on all
smartphones, tablets and desktops and to try to give a closer look and feel to the native application
environment. jQuery Mobile has demos6 to make the grasp easier of each component and understand
well how is it implemented and what is the role of it.
To start implementing jQuery Mobile, it is required to call the CSS and JavaScript files hosted in jQuery
CDN7(Content Delivery Network) as we show in the listing 3.4.
Listing 3.4: Snippet for jQuery CDN hosted files
< l i n k r e l = ” s t y l eshee t ” h re f = ” h t t p : / / code . jquery . com/ mobile / 1 . 4 . 3 / jquery .
mobile −1.4 .3 . min . css ” />
<s c r i p t s rc= ” h t t p : / / code . jquery . com/ jquery −1.11.1. min . j s ” />
<s c r i p t s rc= ” h t t p : / / code . jquery . com/ mobile / 1 . 4 . 3 / jquery . mobile −1.4 .3 . min . j s
” />
These frameworks contains four major elements in jQuery Mobile once they are responsible to give a
structure of the mobile page. Therefore, they should be implemented in every page. Still, they can give
a look and feel closer to the native application. The first element implemented inside of the body is the
element (usually a div ) with the data-role=“page” attribute. Three other elements with different attributes
in the data-role tag should be implemented such as:
• header, a toolbar at the top of the page that, for instance, corresponds to an Action Bar of an
Android application. It can contain the title and, optionally, some buttons (normally designated as4http://jquery.com5http://jquerymobile.com6http://demos.jquerymobile.com/1.4.3/ - latest stable version7https://code.jquery.com/
3.1. WINDOWS AZURE 27
action buttons).
• content, a div that contains all the content of the page.
• footer, a toolbar at the bottom of the page that, for instance, corresponds to a Navigation Bar from
the Android application. It can contain buttons (e.g., for navigation purposes).
All together are the standard boilerplate page template (listing 3.5).
Listing 3.5: First element in jQuery Mobile page
<d iv data−r o l e = ” page ”>
<d iv data−r o l e = ” header ” > . . . < / d iv>
<d iv data−r o l e = ” content ” > . . . < / d iv>
<d iv data−r o l e = ” f o o t e r ” > . . . < / d iv>
</ d iv>
In WebMAT, we developed an application that gives two lists: (1) a list of points of interests (PoIs) of
Portugal by different categories (e.g., castles, beaches, monuments, statues) and/or cities (e.g., Lisbon,
Porto, etc), and (2) a list of the favourites PoIs for each correspondent user. Regarding this, we imple-
mented elements such as Navbar Widget (to make easier the navigation between pages and help the
user to know which page he/she is at the moment), Listview Widget (to display the list of PoIs), and
Selectmenu Widget (to filter the list of the PoIs).
3.1.3.3 HTML5 APIs
HTML5 APIs were designed to develop all web applications easier across multiple devices and user
agency. HTML APIs cover a set of functionalities and features that extends the power of a web applica-
tion and helps developers to improve their web mobile applications in some aspects (e.g., performance
and user experience). These APIs include the much-talked about video and audio API, an API for
building offline applications, one for editing page content, another of the controls of drag and drop func-
tionality, and finally the geolocation. We are going to focus on offline applications since one of the goals
of this dissertation is to turn WebMAT useful even when the user is offline. Therefore, HTML5 can take
WebMAT offline by using either one of these features: Application Cache, known as App Cache, and
Web Storage.
App Cache
App Cache allows users to keep resources of the web application in cache. Most of the times, despite
of this feature being seen as a feature that can make a web application running in offline mode, it can
also dramatically improves the web application experience in terms of performance. App Cache gives
three advantages:
28 CHAPTER 3. APPLICATIONS DEVELOPED
1. Offline browsing. Users can continue to access and use the web application without an internet
connection but, only the resources that have been downloaded. We are going to give more details
further down.
2. Speed up the web application. With resources in cache, web applications becomes much more
effective and responsive since cached resources load faster.
3. Reduce server load. If the cache has the necessary resources to respond to the user’s request,
the web application instead of sending requests to the server to obtain the resources that user
ask, it will fetch the cached resources. Also, the browser will only download updated/changed
resources from the server as we will see shortly.
App Cache requires the addition of two more files to WebMAT: (1) web.config that tells to the web
application that exists a manifest file of the type “.appcache”, and (2) manifest.appcache that will contain
the information of all necessary resources assigned by developer.
When a user enters in one web page of the application and the html element contains the manifest tag,
which contains the name of manifest file as an attribute, it will download the resources assigned to the
manifest file once. However, those resources can be re-downloaded next time when either the manifest
file was modified or cache of the browser is cleaned. The manifest app cache file is static which is a
downside. This file can only be changed directly in the file and not through any other method yet. For
instance, if the content of an html file is dynamic, this means that there will be eventually a change in that
file and will not affect the manifest file in any circumstances. Which in turn means that the app cache
will not re-download the html file with the new content.
Web Storage
HTML5 provides Web Storage that gives the opportunity to store data locally in the user’s browser. This
kind of method of storing data is more secure and faster than the one with cookies that are transmitted
through HTTP headers without being duly encrypted (unless the web application is under SSL protocol).
Also, it slows down a web application by transmitting the same data over and over needlessly. Plus, the
size limit of Web Storage is much more higher, where it has got 5 megabytes against the insignificant 4
kilobytes per cookie and the information is never transmitted to the server. But still, depending on what
kind of application a developer wants to develop, 5 megabytes of storage continues to be too limited
(e.g., an application that involves many images/videos).
Web Storage is divided into two parts for storing data: localStorage and sessionStorage. The only
difference between them is the time the data remains stored. sessionStorage keeps the data until the
tab of the browser is closed. While localStorage does not have time limit, i.e., there is no time for when
the data expires and is deleted. The only way to clean its content is by clearing localStorage manually.
Thus, it is up to the developer to decide when is the right moment to clear the data from localStorage
In fact, this is one advantage of localStorage and it is what we pretend. We want that a specific data
remains available even when the user closes the tab or the window. Still, when the user does not have
3.1. WINDOWS AZURE 29
connection to the network, the data is kept in the browser to navigate in offline mode. For example, to
show the list of favourites PoIs, we check who is the user (saved in localStorage in a key/value pair)
in order to retrieve the information correspondent to that specific user. If that username field is not
provided, the web application does not return any data.
3.1.4 NativeMAT and Mobile Service
In this section, we are going to use a new service of Windows Azure called Mobile Services where a
developer can create a BaaS that provides SDKs to help developer to develop applications targeted to
different platforms (e.g., Windows Phone, iOS applications, Android, HTML, Xamarin and PhoneGap)
that connects and send requests to the backend cloud storage. One advantage of this service is the fact
that the backend can fit every single application developed for different platforms, i.e., we can create an
Android and a Windows Phone applications that use the same backend cloud storage of Mobile Service
as well as benefit of the same features that come with the service like authentication. In the authentica-
tion, we can use different authentication providers (e.g., Microsoft, Facebook, Twitter, and Google).
To start using Mobile Service, we must create a service in the Windows Azure Portal like we did with
Web Site service in the previous section. Since Mobile Service allows us to create a BaaS, then through
this service we can configure authentication providers and Windows, Apple or Google push notifications.
Regarding the data, we can create tables with no relation corresponding to a non-relational database
(NoSQL database). However, if a SQL database is required, there is also a possibility to link tables from
Mobile Service with the tables present on the SQL Database service. And, like Web Site service, it al-
lows to monitor the behaviour of our Mobile Service (e.g., API Calls, Data Out, HTTP Server Errors, SQL
CPU %, SQL Log Writes % and SQL Physical Data Reads %) and choose the type of mobile service
tier of scaling.
The standard mode has same functionalities as basic mode. The difference is that standard mode has
a higher capacity (Maximum unit count : 10) than basic mode (Maximum unit count : 6).
To link NativeMAT to our BaaS, it is required two parameters: application key and service url. We can
grab both on dashboard page of our Mobile Service in Windows Azure Portal. For application key, we
can click on MANAGE KEYS button, which is on bottom. For service url, we go to the right side of the
page and we found it bellow of MOBILE SERVICE URL label. Afterwards, we can instantiate our service
(listing 3.11) and start calling methods and execute queries.
Listing 3.6: Instantiate the constructor
Mob i leServ i ceC l ien t mCl ient = new Mob i leServ i ceC l ien t ( ServiceURL ,
Appl icat ionKey , t h i s ) ;
3.1.4.1 Database
The data of a Mobile Service can be handled in two different manners depending on which type of
database it is required. If there is no need of an SQL database, Mobile service is enough since it has its
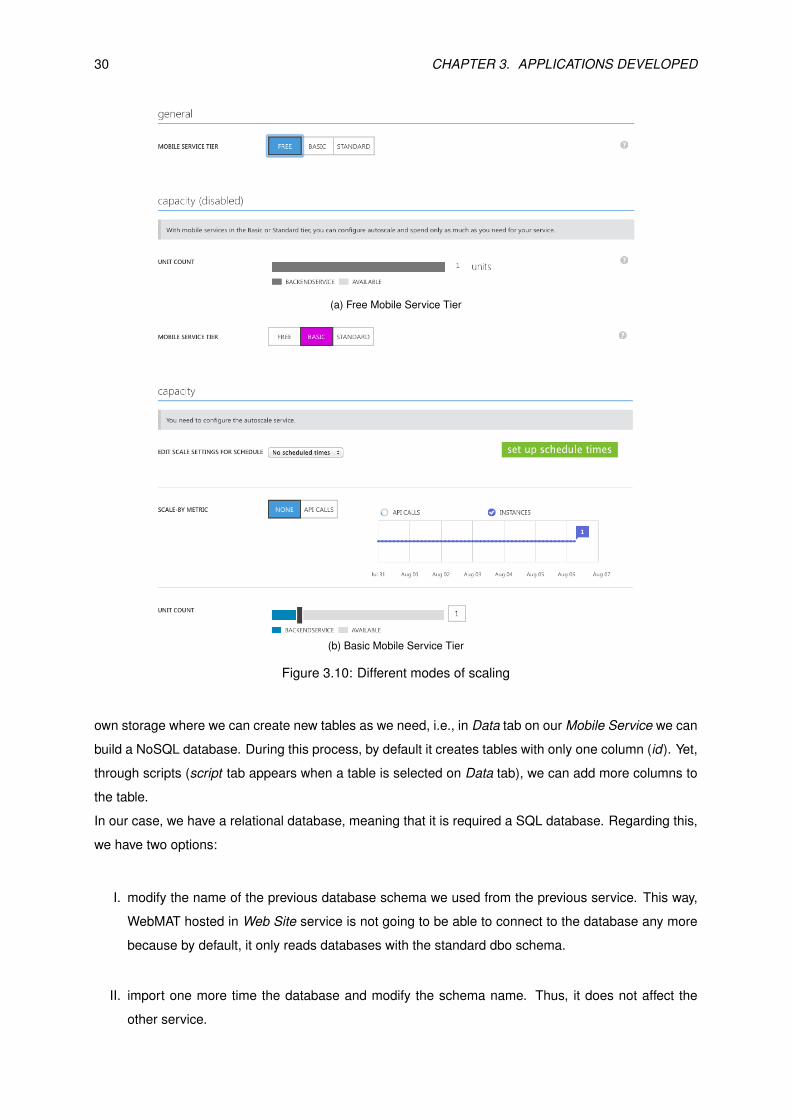
30 CHAPTER 3. APPLICATIONS DEVELOPED
(a) Free Mobile Service Tier
(b) Basic Mobile Service Tier
Figure 3.10: Different modes of scaling
own storage where we can create new tables as we need, i.e., in Data tab on our Mobile Service we can
build a NoSQL database. During this process, by default it creates tables with only one column (id). Yet,
through scripts (script tab appears when a table is selected on Data tab), we can add more columns to
the table.
In our case, we have a relational database, meaning that it is required a SQL database. Regarding this,
we have two options:
I. modify the name of the previous database schema we used from the previous service. This way,
WebMAT hosted in Web Site service is not going to be able to connect to the database any more
because by default, it only reads databases with the standard dbo schema.
II. import one more time the database and modify the schema name. Thus, it does not affect the
other service.
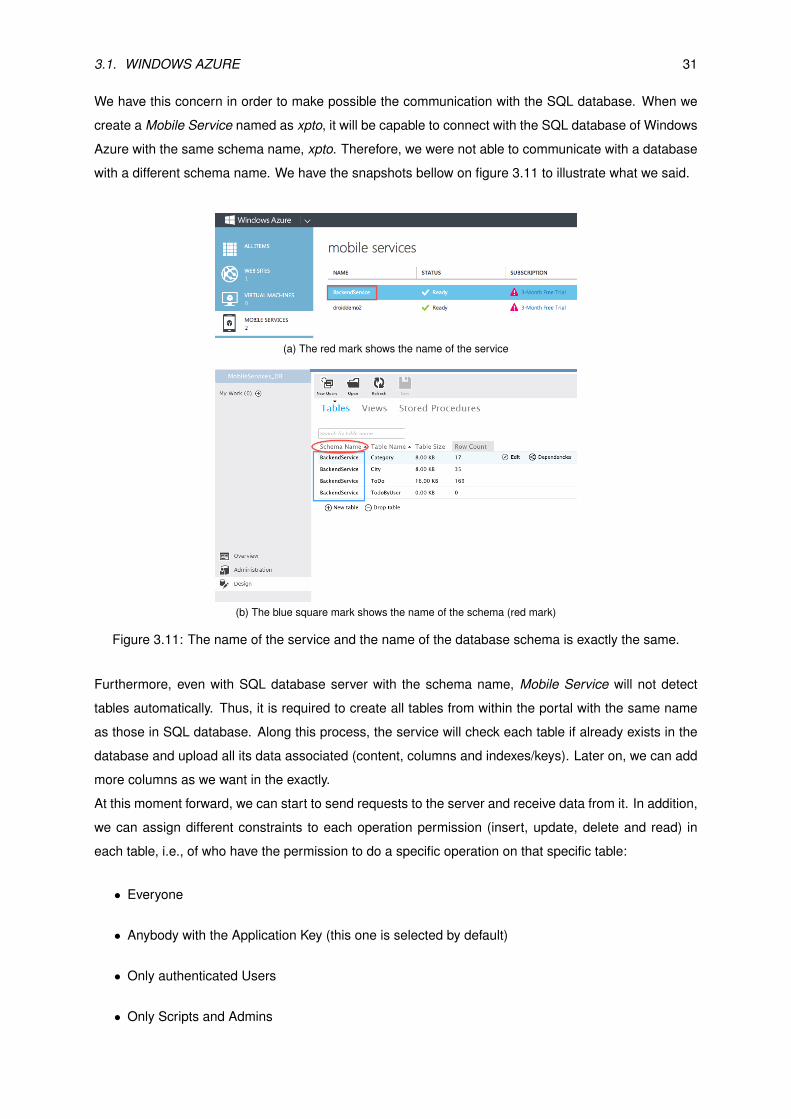
3.1. WINDOWS AZURE 31
We have this concern in order to make possible the communication with the SQL database. When we
create a Mobile Service named as xpto, it will be capable to connect with the SQL database of Windows
Azure with the same schema name, xpto. Therefore, we were not able to communicate with a database
with a different schema name. We have the snapshots bellow on figure 3.11 to illustrate what we said.
(a) The red mark shows the name of the service
(b) The blue square mark shows the name of the schema (red mark)
Figure 3.11: The name of the service and the name of the database schema is exactly the same.
Furthermore, even with SQL database server with the schema name, Mobile Service will not detect
tables automatically. Thus, it is required to create all tables from within the portal with the same name
as those in SQL database. Along this process, the service will check each table if already exists in the
database and upload all its data associated (content, columns and indexes/keys). Later on, we can add
more columns as we want in the exactly.
At this moment forward, we can start to send requests to the server and receive data from it. In addition,
we can assign different constraints to each operation permission (insert, update, delete and read) in
each table, i.e., of who have the permission to do a specific operation on that specific table:
• Everyone
• Anybody with the Application Key (this one is selected by default)
• Only authenticated Users
• Only Scripts and Admins
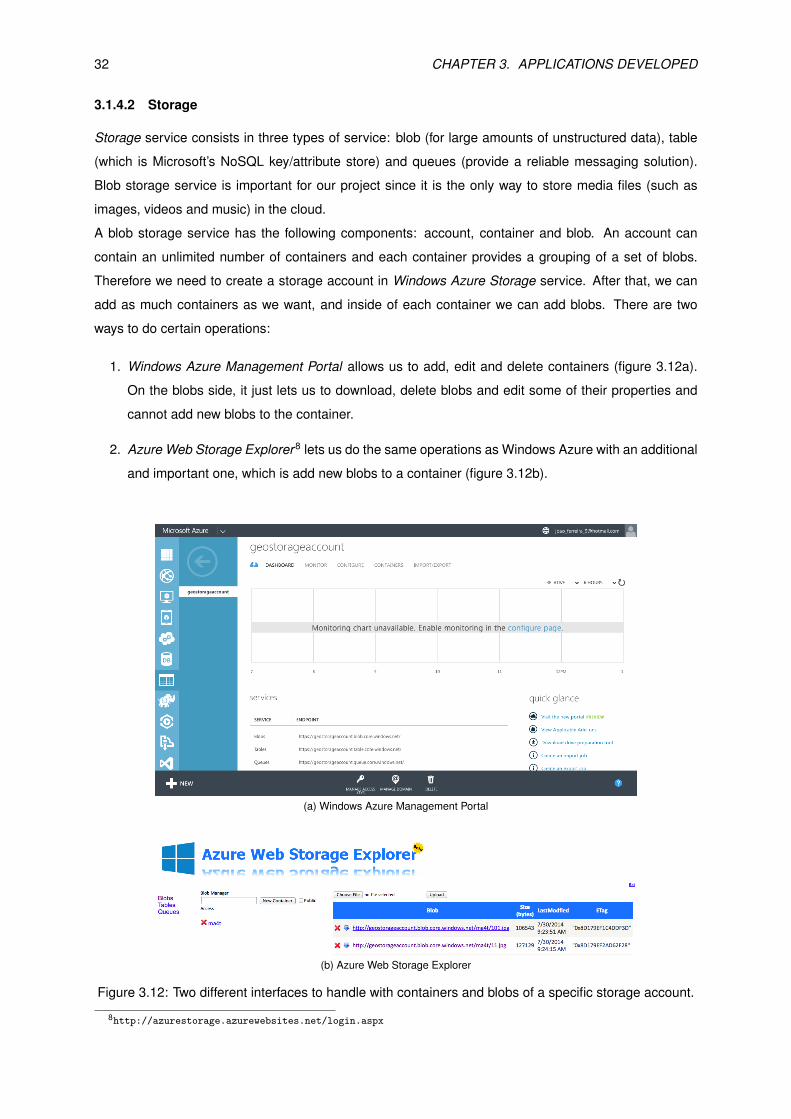
32 CHAPTER 3. APPLICATIONS DEVELOPED
3.1.4.2 Storage
Storage service consists in three types of service: blob (for large amounts of unstructured data), table
(which is Microsoft’s NoSQL key/attribute store) and queues (provide a reliable messaging solution).
Blob storage service is important for our project since it is the only way to store media files (such as
images, videos and music) in the cloud.
A blob storage service has the following components: account, container and blob. An account can
contain an unlimited number of containers and each container provides a grouping of a set of blobs.
Therefore we need to create a storage account in Windows Azure Storage service. After that, we can
add as much containers as we want, and inside of each container we can add blobs. There are two
ways to do certain operations:
1. Windows Azure Management Portal allows us to add, edit and delete containers (figure 3.12a).
On the blobs side, it just lets us to download, delete blobs and edit some of their properties and
cannot add new blobs to the container.
2. Azure Web Storage Explorer8 lets us do the same operations as Windows Azure with an additional
and important one, which is add new blobs to a container (figure 3.12b).
(a) Windows Azure Management Portal
(b) Azure Web Storage Explorer
Figure 3.12: Two different interfaces to handle with containers and blobs of a specific storage account.
8http://azurestorage.azurewebsites.net/login.aspx
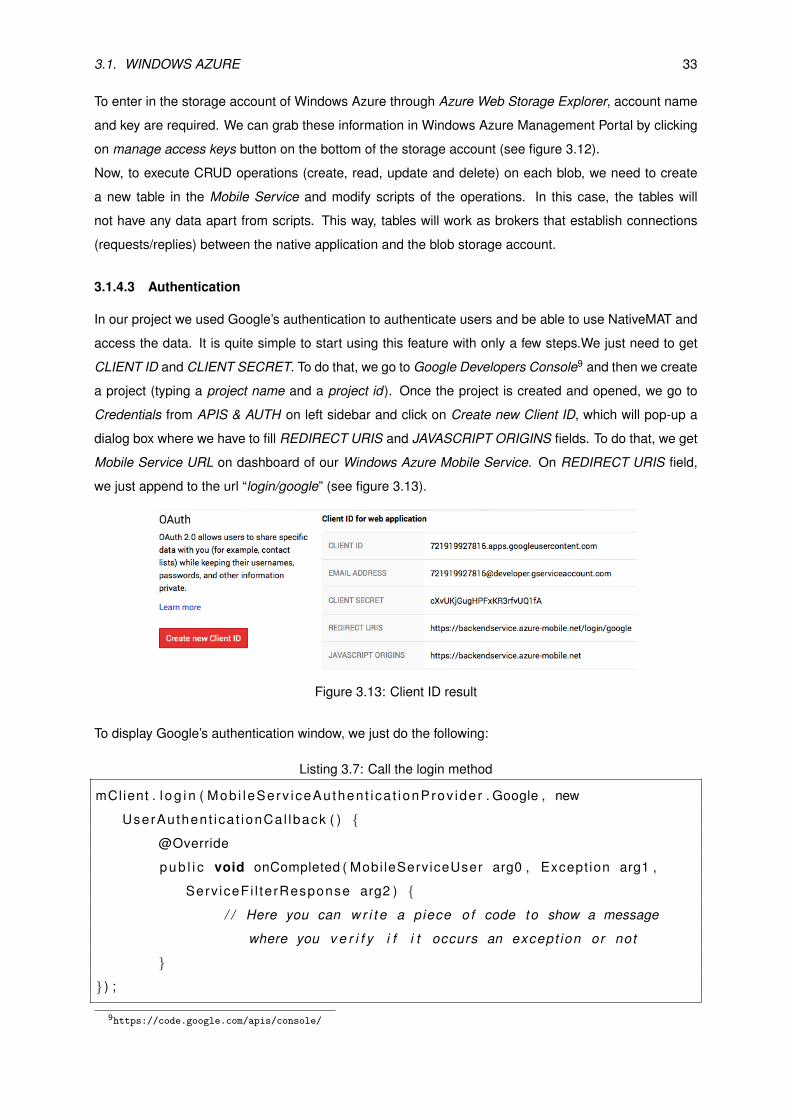
3.1. WINDOWS AZURE 33
To enter in the storage account of Windows Azure through Azure Web Storage Explorer, account name
and key are required. We can grab these information in Windows Azure Management Portal by clicking
on manage access keys button on the bottom of the storage account (see figure 3.12).
Now, to execute CRUD operations (create, read, update and delete) on each blob, we need to create
a new table in the Mobile Service and modify scripts of the operations. In this case, the tables will
not have any data apart from scripts. This way, tables will work as brokers that establish connections
(requests/replies) between the native application and the blob storage account.
3.1.4.3 Authentication
In our project we used Google’s authentication to authenticate users and be able to use NativeMAT and
access the data. It is quite simple to start using this feature with only a few steps.We just need to get
CLIENT ID and CLIENT SECRET. To do that, we go to Google Developers Console9 and then we create
a project (typing a project name and a project id). Once the project is created and opened, we go to
Credentials from APIS & AUTH on left sidebar and click on Create new Client ID, which will pop-up a
dialog box where we have to fill REDIRECT URIS and JAVASCRIPT ORIGINS fields. To do that, we get
Mobile Service URL on dashboard of our Windows Azure Mobile Service. On REDIRECT URIS field,
we just append to the url “login/google” (see figure 3.13).
Figure 3.13: Client ID result
To display Google’s authentication window, we just do the following:
Listing 3.7: Call the login method
mClient . l o g i n ( Mob i l eServ i ceAu then t i ca t i onProv ide r . Google , new
UserAuthen t i ca t ionCa l lback ( ) {
@Override
p u b l i c void onCompleted ( Mobi leServiceUser arg0 , Except ion arg1 ,
Serv iceFi l te rResponse arg2 ) {
/ / Here you can w r i t e a piece of code to show a message
where you v e r i f y i f i t occurs an except ion or not
}
} ) ;
9https://code.google.com/apis/console/
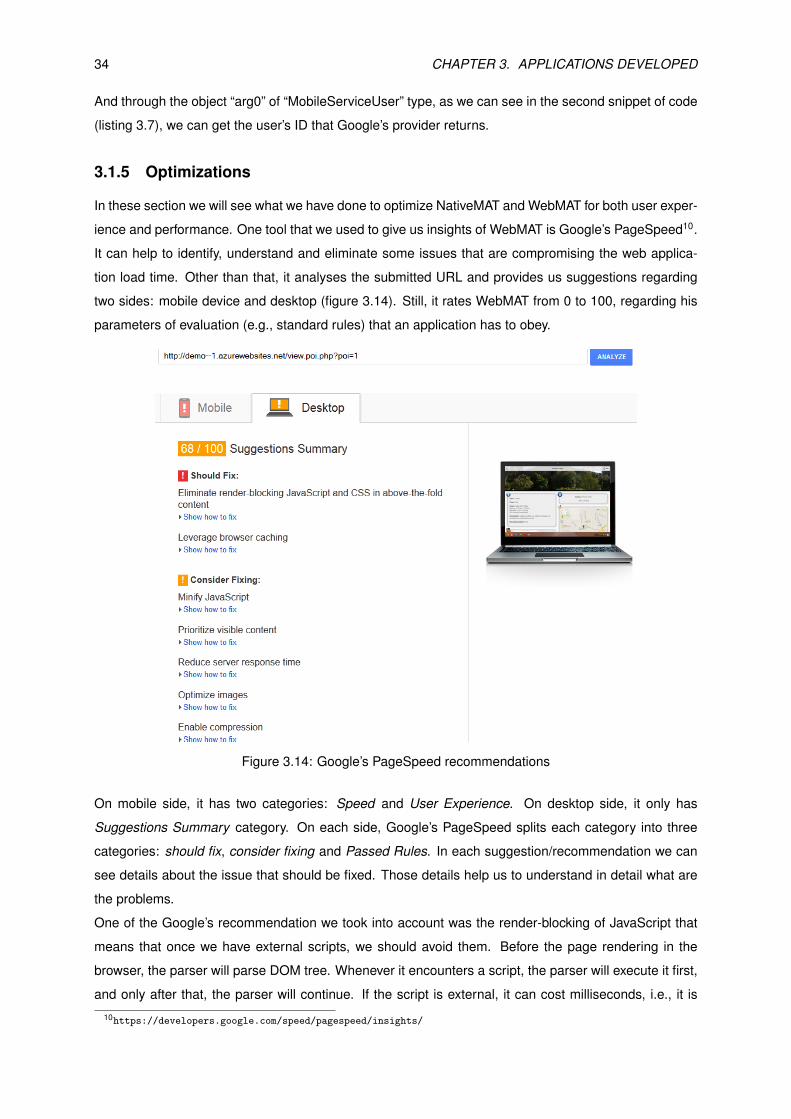
34 CHAPTER 3. APPLICATIONS DEVELOPED
And through the object “arg0” of “MobileServiceUser” type, as we can see in the second snippet of code
(listing 3.7), we can get the user’s ID that Google’s provider returns.
3.1.5 Optimizations
In these section we will see what we have done to optimize NativeMAT and WebMAT for both user exper-
ience and performance. One tool that we used to give us insights of WebMAT is Google’s PageSpeed10.
It can help to identify, understand and eliminate some issues that are compromising the web applica-
tion load time. Other than that, it analyses the submitted URL and provides us suggestions regarding
two sides: mobile device and desktop (figure 3.14). Still, it rates WebMAT from 0 to 100, regarding his
parameters of evaluation (e.g., standard rules) that an application has to obey.
Figure 3.14: Google’s PageSpeed recommendations
On mobile side, it has two categories: Speed and User Experience. On desktop side, it only has
Suggestions Summary category. On each side, Google’s PageSpeed splits each category into three
categories: should fix, consider fixing and Passed Rules. In each suggestion/recommendation we can
see details about the issue that should be fixed. Those details help us to understand in detail what are
the problems.
One of the Google’s recommendation we took into account was the render-blocking of JavaScript that
means that once we have external scripts, we should avoid them. Before the page rendering in the
browser, the parser will parse DOM tree. Whenever it encounters a script, the parser will execute it first,
and only after that, the parser will continue. If the script is external, it can cost milliseconds, i.e., it is
10https://developers.google.com/speed/pagespeed/insights/
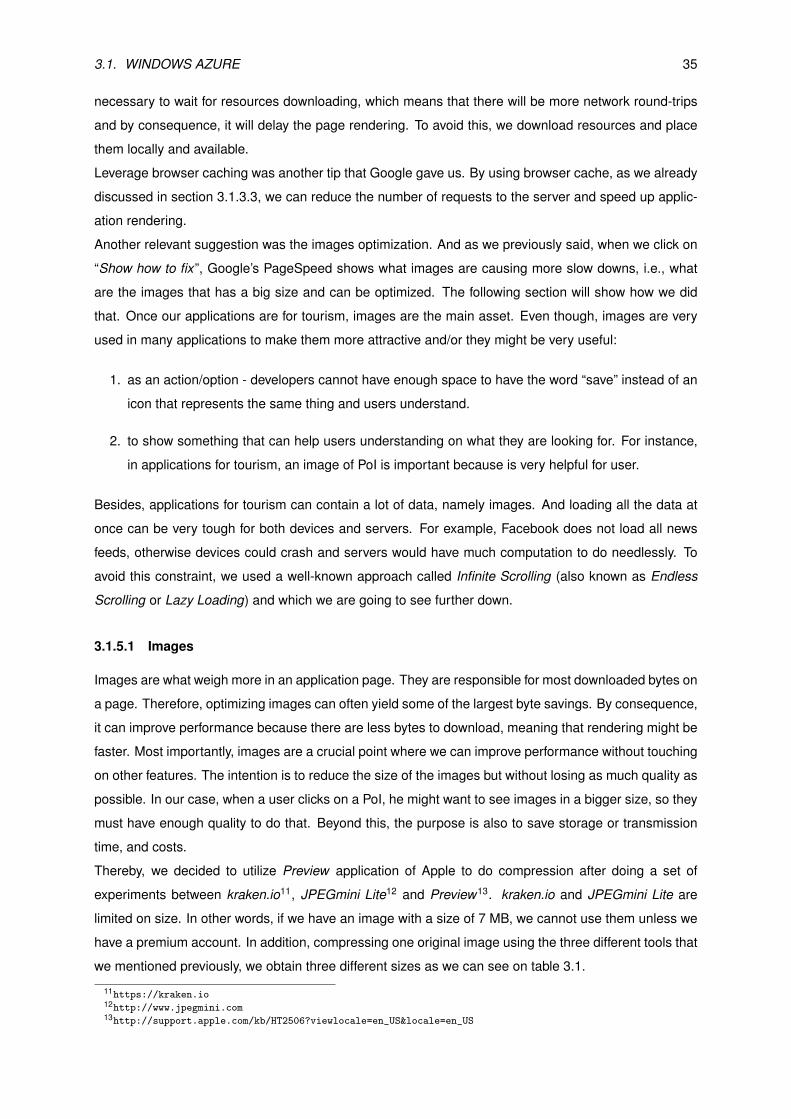
3.1. WINDOWS AZURE 35
necessary to wait for resources downloading, which means that there will be more network round-trips
and by consequence, it will delay the page rendering. To avoid this, we download resources and place
them locally and available.
Leverage browser caching was another tip that Google gave us. By using browser cache, as we already
discussed in section 3.1.3.3, we can reduce the number of requests to the server and speed up applic-
ation rendering.
Another relevant suggestion was the images optimization. And as we previously said, when we click on
“Show how to fix”, Google’s PageSpeed shows what images are causing more slow downs, i.e., what
are the images that has a big size and can be optimized. The following section will show how we did
that. Once our applications are for tourism, images are the main asset. Even though, images are very
used in many applications to make them more attractive and/or they might be very useful:
1. as an action/option - developers cannot have enough space to have the word “save” instead of an
icon that represents the same thing and users understand.
2. to show something that can help users understanding on what they are looking for. For instance,
in applications for tourism, an image of PoI is important because is very helpful for user.
Besides, applications for tourism can contain a lot of data, namely images. And loading all the data at
once can be very tough for both devices and servers. For example, Facebook does not load all news
feeds, otherwise devices could crash and servers would have much computation to do needlessly. To
avoid this constraint, we used a well-known approach called Infinite Scrolling (also known as Endless
Scrolling or Lazy Loading) and which we are going to see further down.
3.1.5.1 Images
Images are what weigh more in an application page. They are responsible for most downloaded bytes on
a page. Therefore, optimizing images can often yield some of the largest byte savings. By consequence,
it can improve performance because there are less bytes to download, meaning that rendering might be
faster. Most importantly, images are a crucial point where we can improve performance without touching
on other features. The intention is to reduce the size of the images but without losing as much quality as
possible. In our case, when a user clicks on a PoI, he might want to see images in a bigger size, so they
must have enough quality to do that. Beyond this, the purpose is also to save storage or transmission
time, and costs.
Thereby, we decided to utilize Preview application of Apple to do compression after doing a set of
experiments between kraken.io11, JPEGmini Lite12 and Preview13. kraken.io and JPEGmini Lite are
limited on size. In other words, if we have an image with a size of 7 MB, we cannot use them unless we
have a premium account. In addition, compressing one original image using the three different tools that
we mentioned previously, we obtain three different sizes as we can see on table 3.1.
11https://kraken.io12http://www.jpegmini.com13http://support.apple.com/kb/HT2506?viewlocale=en_US&locale=en_US
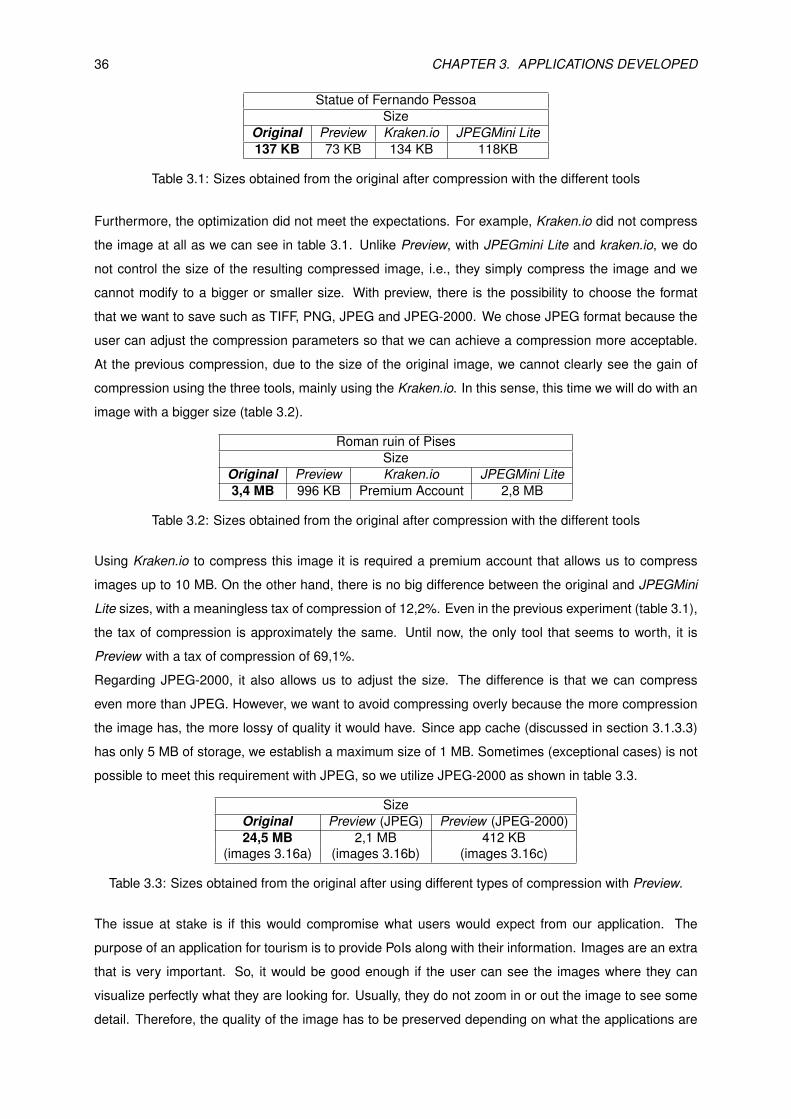
36 CHAPTER 3. APPLICATIONS DEVELOPED
Statue of Fernando PessoaSize
Original Preview Kraken.io JPEGMini Lite137 KB 73 KB 134 KB 118KB
Table 3.1: Sizes obtained from the original after compression with the different tools
Furthermore, the optimization did not meet the expectations. For example, Kraken.io did not compress
the image at all as we can see in table 3.1. Unlike Preview, with JPEGmini Lite and kraken.io, we do
not control the size of the resulting compressed image, i.e., they simply compress the image and we
cannot modify to a bigger or smaller size. With preview, there is the possibility to choose the format
that we want to save such as TIFF, PNG, JPEG and JPEG-2000. We chose JPEG format because the
user can adjust the compression parameters so that we can achieve a compression more acceptable.
At the previous compression, due to the size of the original image, we cannot clearly see the gain of
compression using the three tools, mainly using the Kraken.io. In this sense, this time we will do with an
image with a bigger size (table 3.2).
Roman ruin of PisesSize
Original Preview Kraken.io JPEGMini Lite3,4 MB 996 KB Premium Account 2,8 MB
Table 3.2: Sizes obtained from the original after compression with the different tools
Using Kraken.io to compress this image it is required a premium account that allows us to compress
images up to 10 MB. On the other hand, there is no big difference between the original and JPEGMini
Lite sizes, with a meaningless tax of compression of 12,2%. Even in the previous experiment (table 3.1),
the tax of compression is approximately the same. Until now, the only tool that seems to worth, it is
Preview with a tax of compression of 69,1%.
Regarding JPEG-2000, it also allows us to adjust the size. The difference is that we can compress
even more than JPEG. However, we want to avoid compressing overly because the more compression
the image has, the more lossy of quality it would have. Since app cache (discussed in section 3.1.3.3)
has only 5 MB of storage, we establish a maximum size of 1 MB. Sometimes (exceptional cases) is not
possible to meet this requirement with JPEG, so we utilize JPEG-2000 as shown in table 3.3.
SizeOriginal Preview (JPEG) Preview (JPEG-2000)24,5 MB 2,1 MB 412 KB
(images 3.16a) (images 3.16b) (images 3.16c)
Table 3.3: Sizes obtained from the original after using different types of compression with Preview.
The issue at stake is if this would compromise what users would expect from our application. The
purpose of an application for tourism is to provide PoIs along with their information. Images are an extra
that is very important. So, it would be good enough if the user can see the images where they can
visualize perfectly what they are looking for. Usually, they do not zoom in or out the image to see some
detail. Therefore, the quality of the image has to be preserved depending on what the applications are
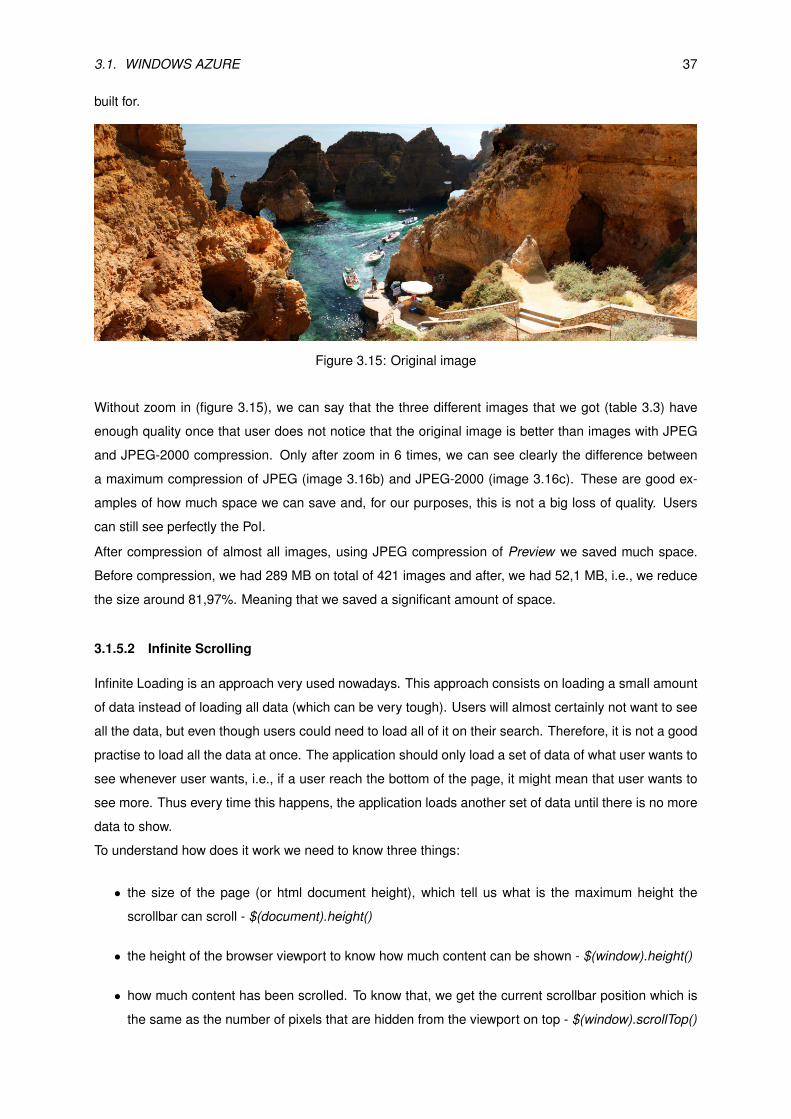
3.1. WINDOWS AZURE 37
built for.
Figure 3.15: Original image
Without zoom in (figure 3.15), we can say that the three different images that we got (table 3.3) have
enough quality once that user does not notice that the original image is better than images with JPEG
and JPEG-2000 compression. Only after zoom in 6 times, we can see clearly the difference between
a maximum compression of JPEG (image 3.16b) and JPEG-2000 (image 3.16c). These are good ex-
amples of how much space we can save and, for our purposes, this is not a big loss of quality. Users
can still see perfectly the PoI.
After compression of almost all images, using JPEG compression of Preview we saved much space.
Before compression, we had 289 MB on total of 421 images and after, we had 52,1 MB, i.e., we reduce
the size around 81,97%. Meaning that we saved a significant amount of space.
3.1.5.2 Infinite Scrolling
Infinite Loading is an approach very used nowadays. This approach consists on loading a small amount
of data instead of loading all data (which can be very tough). Users will almost certainly not want to see
all the data, but even though users could need to load all of it on their search. Therefore, it is not a good
practise to load all the data at once. The application should only load a set of data of what user wants to
see whenever user wants, i.e., if a user reach the bottom of the page, it might mean that user wants to
see more. Thus every time this happens, the application loads another set of data until there is no more
data to show.
To understand how does it work we need to know three things:
• the size of the page (or html document height), which tell us what is the maximum height the
scrollbar can scroll - $(document).height()
• the height of the browser viewport to know how much content can be shown - $(window).height()
• how much content has been scrolled. To know that, we get the current scrollbar position which is
the same as the number of pixels that are hidden from the viewport on top - $(window).scrollTop()
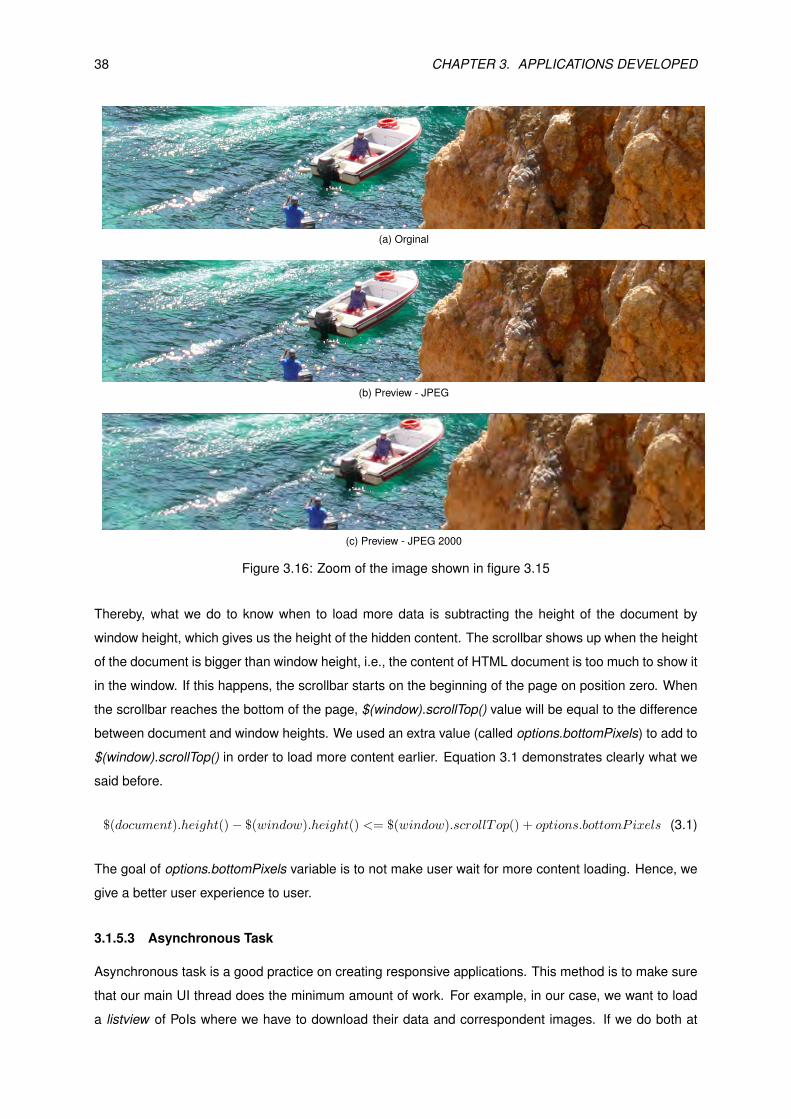
38 CHAPTER 3. APPLICATIONS DEVELOPED
(a) Orginal
(b) Preview - JPEG
(c) Preview - JPEG 2000
Figure 3.16: Zoom of the image shown in figure 3.15
Thereby, what we do to know when to load more data is subtracting the height of the document by
window height, which gives us the height of the hidden content. The scrollbar shows up when the height
of the document is bigger than window height, i.e., the content of HTML document is too much to show it
in the window. If this happens, the scrollbar starts on the beginning of the page on position zero. When
the scrollbar reaches the bottom of the page, $(window).scrollTop() value will be equal to the difference
between document and window heights. We used an extra value (called options.bottomPixels) to add to
$(window).scrollTop() in order to load more content earlier. Equation 3.1 demonstrates clearly what we
said before.
$(document).height()− $(window).height() <= $(window).scrollTop() + options.bottomPixels (3.1)
The goal of options.bottomPixels variable is to not make user wait for more content loading. Hence, we
give a better user experience to user.
3.1.5.3 Asynchronous Task
Asynchronous task is a good practice on creating responsive applications. This method is to make sure
that our main UI thread does the minimum amount of work. For example, in our case, we want to load
a listview of PoIs where we have to download their data and correspondent images. If we do both at
3.2. PROBLEMS AND CHALLENGES 39
the same time, it will take a longer duration and mostly, when we have to take into account network
bandwidth. This is a typical example of a possible long task that may hang our application because it
involves unpredictable delays. To not waste too much time waiting on something that might not be so
relevant to the user, at first, we download the data in the main UI thread which last less than images.
Downloading images should be handled in a different thread, i.e., in background (in an asynchronous
task). Whenever it got downloaded the images, they will show in their corresponding position in the list.
This way, we reduce the time that user need to wait and keep user’s engagement because users tolerate
some delays, especially if we provide some progress feedback rather than a frozen application that gives
them no clue what it is happening.
3.2 Problems and Challenges
The application that connects to Mobile Service talked in section 3.1.4 was one of the most difficult ap-
plications to develop. In fact, it was the application with more errors than the web mobile application. I
think that Eclipse and the Windows Azure platform did not help too and we will explain why further down.
And the errors were the following:
1. This error (listing 3.8) showed up because the class which we were trying to run were not found
in the classpath. And normally, to fix this error, we have to check the classpath by going to “Run
Configurations” on menu bar and it would appear a tab called as classpath but, unfortunately this
tab does not appear on an Android application.
Listing 3.8: Classpath error
java . lang . noc lassde f founder ro r : com. m ic roso f t . windowsazure .
mob i leserv ices . m o b i l e s e r v i c e c l i e n t
What we did to solve this was the deletion of the file where we call the class file that is not founded
at runtime and recreated it again.
2. There are errors that are hard to understand how they happened. And the error presented in
figure 3.17 is one of them. With no modifications on the code of the application, sometimes the
application runs perfectly with Windows Azure and sometimes did not and it shows up an error
message (figure 3.17). When the error appeared, we tried thereafter one more time and it worked.
Our guess is that the error is not ours and perhaps, it is normal to happen. To confirm our suspects,
we tried to use the demo available on Windows Azure Portal for download. And it appeared the
exactly same error as NativeMAT.
3. Another error appeared when we tried to use authentication provider (of Google or Microsoft) from
Android SDK provided by Microsoft, it always appeared the error that we show you in listing 3.9.
Listing 3.9: Permission error
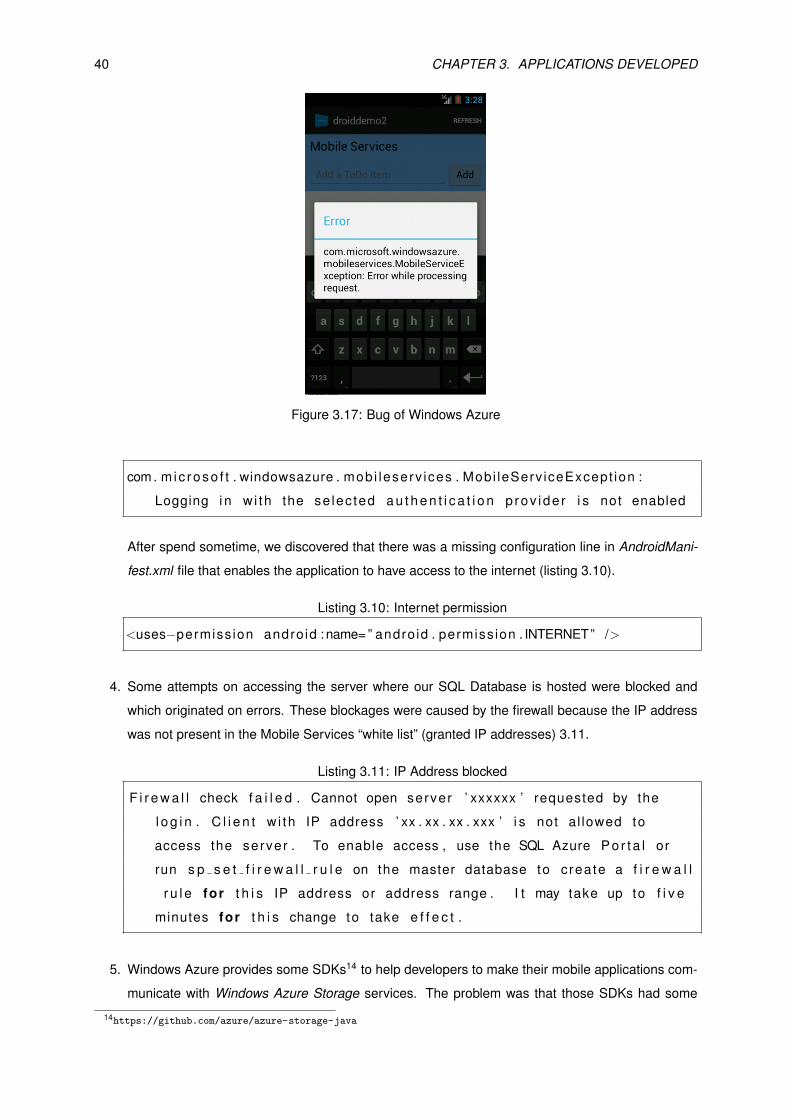
40 CHAPTER 3. APPLICATIONS DEVELOPED
Figure 3.17: Bug of Windows Azure
com. m ic roso f t . windowsazure . mob i leserv ices . Mobi leServ iceExcept ion :
Logging i n w i th the se lec ted a u t h e n t i c a t i o n p rov ide r i s not enabled
After spend sometime, we discovered that there was a missing configuration line in AndroidMani-
fest.xml file that enables the application to have access to the internet (listing 3.10).
Listing 3.10: Internet permission
<uses−permiss ion android : name= ” andro id . permiss ion . INTERNET” />
4. Some attempts on accessing the server where our SQL Database is hosted were blocked and
which originated on errors. These blockages were caused by the firewall because the IP address
was not present in the Mobile Services “white list” (granted IP addresses) 3.11.
Listing 3.11: IP Address blocked
F i r e w a l l check f a i l e d . Cannot open server ’ xxxxxx ’ requested by the
l o g i n . C l i e n t w i th IP address ’ xx . xx . xx . xxx ’ i s not al lowed to
access the server . To enable access , use the SQL Azure P o r t a l or
run s p s e t f i r e w a l l r u l e on the master database to create a f i r e w a l l
r u l e for t h i s IP address or address range . I t may take up to f i v e
minutes for t h i s change to take e f f e c t .
5. Windows Azure provides some SDKs14 to help developers to make their mobile applications com-
municate with Windows Azure Storage services. The problem was that those SDKs had some
14https://github.com/azure/azure-storage-java
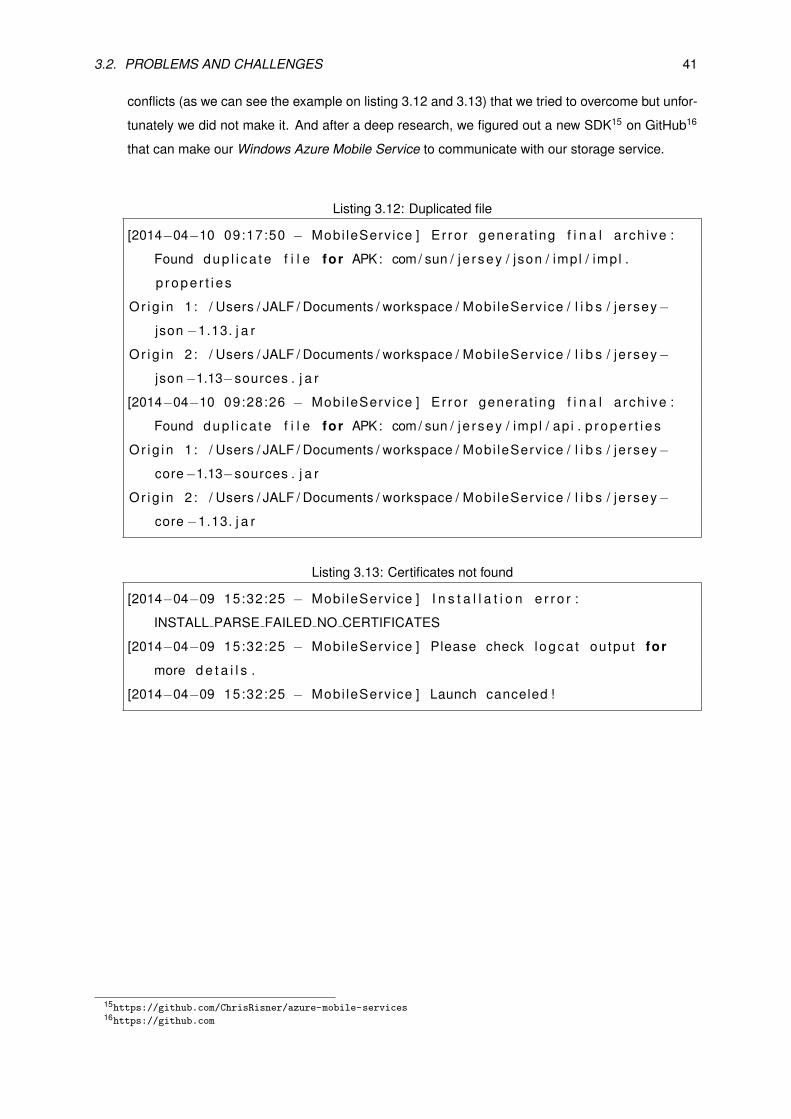
3.2. PROBLEMS AND CHALLENGES 41
conflicts (as we can see the example on listing 3.12 and 3.13) that we tried to overcome but unfor-
tunately we did not make it. And after a deep research, we figured out a new SDK15 on GitHub16
that can make our Windows Azure Mobile Service to communicate with our storage service.
Listing 3.12: Duplicated file
[2014−04−10 09:17:50 − Mobi leServ ice ] E r ro r generat ing f i n a l a rch ive :
Found d u p l i c a t e f i l e for APK: com/ sun / j e r sey / json / impl / impl .
p r o p e r t i e s
Or ig in 1 : / Users / JALF / Documents / workspace / Mobi leServ ice / l i b s / je rsey−
json −1.13. j a r
Or ig in 2 : / Users / JALF / Documents / workspace / Mobi leServ ice / l i b s / je rsey−
json−1.13−sources . j a r
[2014−04−10 09:28:26 − Mobi leServ ice ] E r ro r generat ing f i n a l a rch ive :
Found d u p l i c a t e f i l e for APK: com/ sun / j e r sey / impl / ap i . p r o p e r t i e s
Or ig in 1 : / Users / JALF / Documents / workspace / Mobi leServ ice / l i b s / je rsey−
core−1.13−sources . j a r
Or ig in 2 : / Users / JALF / Documents / workspace / Mobi leServ ice / l i b s / je rsey−
core −1.13. j a r
Listing 3.13: Certificates not found
[2014−04−09 15:32:25 − Mobi leServ ice ] I n s t a l l a t i o n e r r o r :
INSTALL PARSE FAILED NO CERTIFICATES
[2014−04−09 15:32:25 − Mobi leServ ice ] Please check logca t output for
more d e t a i l s .
[2014−04−09 15:32:25 − Mobi leServ ice ] Launch canceled !
15https://github.com/ChrisRisner/azure-mobile-services16https://github.com

Chapter 4
Evaluation
This section presents the tools used to perform performance tests on both WebMAT and NativeMAT
applications as well as the results obtained from each tool and application. Furthermore, it also dis-
cusses the performance of Windows Azure (with 10, 100, and 1000 users), WebMAT and NativeMAT
applications and shows the results we got using JMeter and Systrace tools.
4.1 Tools
4.1.1 Apache JMeter (WebMAT)
Apache JMeter1 is a tool used to test performance of web applications from Apache. This tool is a 100%
pure Java application and has been widely accepted as a performance testing tool for web applications.
We will go to evaluate the behaviour of our Windows Azure Web Site service through our web application
by increasing requests. To create a load test in JMeter we need to build a test plan that is a sequence
of operations that JMeter will execute. So, we build a simple JMeter test, which involves three elements:
a thread group, a logic controller, and listeners. These elements are very important because each one
has a particular and important role.
Thread group is where we can specify how many threads will execute a set of operations (HTTP re-
quests), i.e., each thread simulates a single user who will send requests to the server. Also, we
can assign how much time each thread will perform the same task on loop count and the ramp-up
period is the time span that JMeter will take to get all threads running.
Logic controllers let us define the order of samplers processing that will occur on a thread. From a
group of controllers, we used a simple controller because unlike other logic controllers do, this one
does not provide any customization or change of loop count or randomization. Simple controller act
as a container who possesses a set of samplers, which allows us to define configurable requests
that can be sent to a server, i.e., samplers simulate a user’s request.
1http://jmeter.apache.org
43
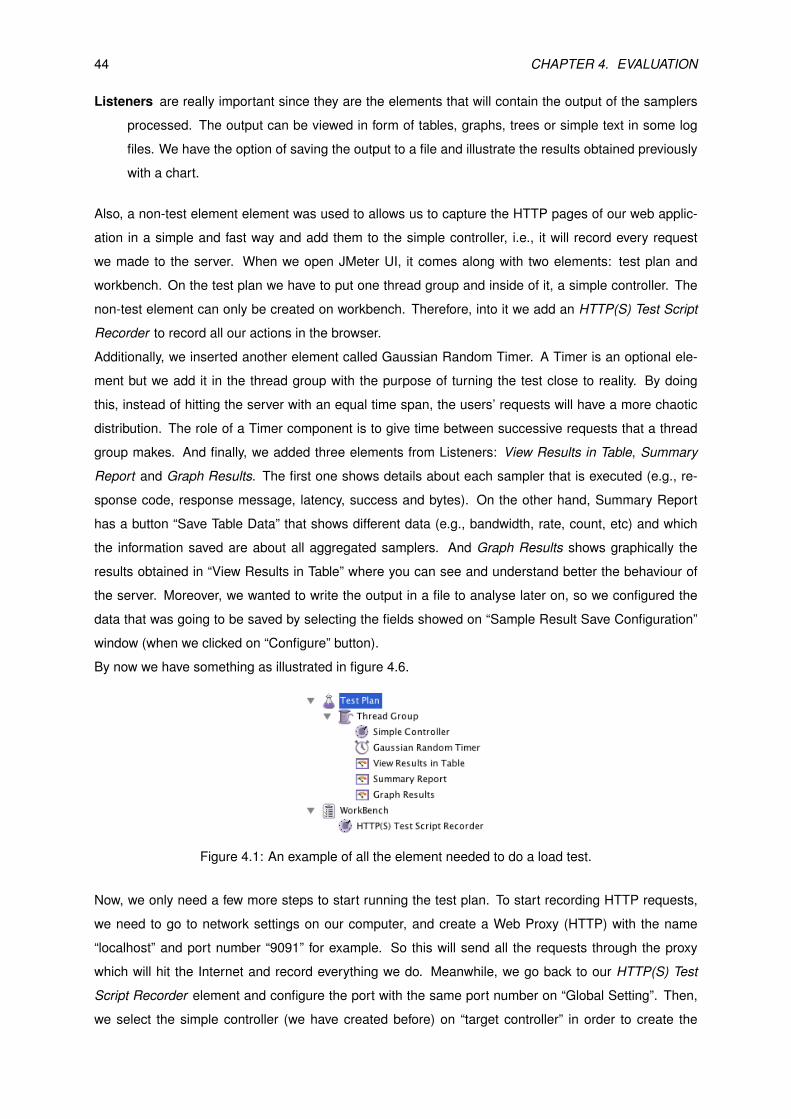
44 CHAPTER 4. EVALUATION
Listeners are really important since they are the elements that will contain the output of the samplers
processed. The output can be viewed in form of tables, graphs, trees or simple text in some log
files. We have the option of saving the output to a file and illustrate the results obtained previously
with a chart.
Also, a non-test element element was used to allows us to capture the HTTP pages of our web applic-
ation in a simple and fast way and add them to the simple controller, i.e., it will record every request
we made to the server. When we open JMeter UI, it comes along with two elements: test plan and
workbench. On the test plan we have to put one thread group and inside of it, a simple controller. The
non-test element can only be created on workbench. Therefore, into it we add an HTTP(S) Test Script
Recorder to record all our actions in the browser.
Additionally, we inserted another element called Gaussian Random Timer. A Timer is an optional ele-
ment but we add it in the thread group with the purpose of turning the test close to reality. By doing
this, instead of hitting the server with an equal time span, the users’ requests will have a more chaotic
distribution. The role of a Timer component is to give time between successive requests that a thread
group makes. And finally, we added three elements from Listeners: View Results in Table, Summary
Report and Graph Results. The first one shows details about each sampler that is executed (e.g., re-
sponse code, response message, latency, success and bytes). On the other hand, Summary Report
has a button “Save Table Data” that shows different data (e.g., bandwidth, rate, count, etc) and which
the information saved are about all aggregated samplers. And Graph Results shows graphically the
results obtained in “View Results in Table” where you can see and understand better the behaviour of
the server. Moreover, we wanted to write the output in a file to analyse later on, so we configured the
data that was going to be saved by selecting the fields showed on “Sample Result Save Configuration”
window (when we clicked on “Configure” button).
By now we have something as illustrated in figure 4.6.
Figure 4.1: An example of all the element needed to do a load test.
Now, we only need a few more steps to start running the test plan. To start recording HTTP requests,
we need to go to network settings on our computer, and create a Web Proxy (HTTP) with the name
“localhost” and port number “9091” for example. So this will send all the requests through the proxy
which will hit the Internet and record everything we do. Meanwhile, we go back to our HTTP(S) Test
Script Recorder element and configure the port with the same port number on “Global Setting”. Then,
we select the simple controller (we have created before) on “target controller” in order to create the
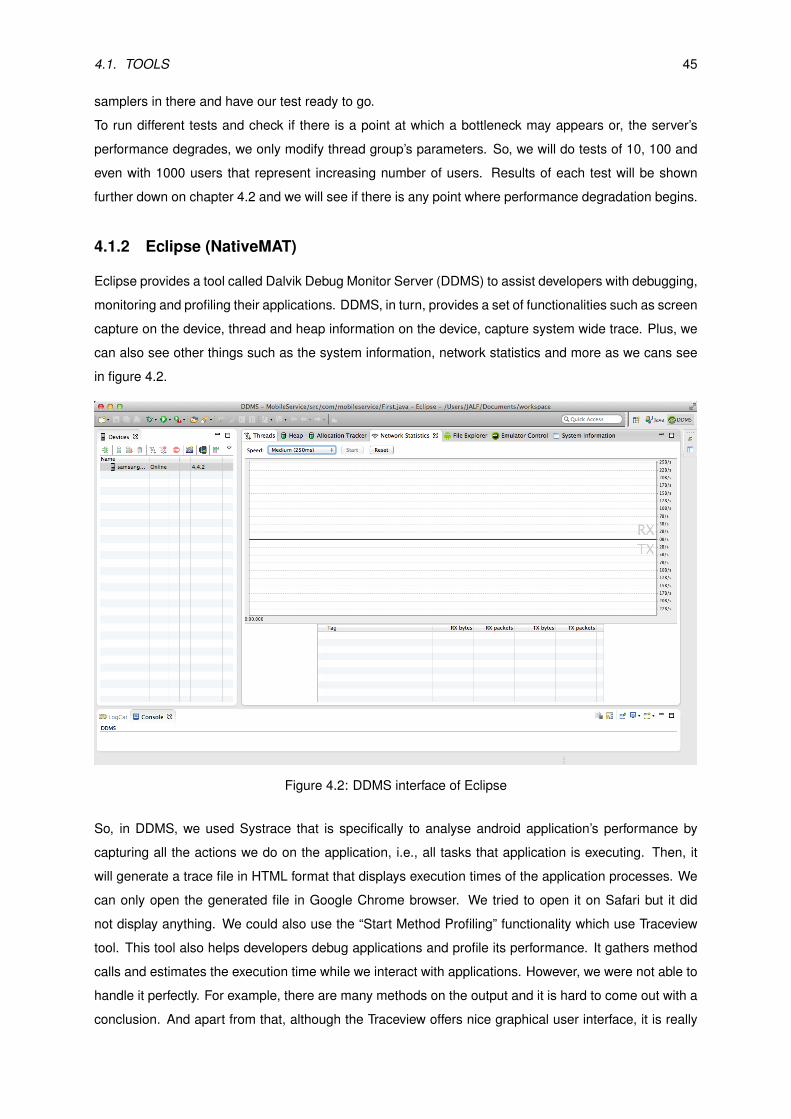
4.1. TOOLS 45
samplers in there and have our test ready to go.
To run different tests and check if there is a point at which a bottleneck may appears or, the server’s
performance degrades, we only modify thread group’s parameters. So, we will do tests of 10, 100 and
even with 1000 users that represent increasing number of users. Results of each test will be shown
further down on chapter 4.2 and we will see if there is any point where performance degradation begins.
4.1.2 Eclipse (NativeMAT)
Eclipse provides a tool called Dalvik Debug Monitor Server (DDMS) to assist developers with debugging,
monitoring and profiling their applications. DDMS, in turn, provides a set of functionalities such as screen
capture on the device, thread and heap information on the device, capture system wide trace. Plus, we
can also see other things such as the system information, network statistics and more as we cans see
in figure 4.2.
Figure 4.2: DDMS interface of Eclipse
So, in DDMS, we used Systrace that is specifically to analyse android application’s performance by
capturing all the actions we do on the application, i.e., all tasks that application is executing. Then, it
will generate a trace file in HTML format that displays execution times of the application processes. We
can only open the generated file in Google Chrome browser. We tried to open it on Safari but it did
not display anything. We could also use the “Start Method Profiling” functionality which use Traceview
tool. This tool also helps developers debug applications and profile its performance. It gathers method
calls and estimates the execution time while we interact with applications. However, we were not able to
handle it perfectly. For example, there are many methods on the output and it is hard to come out with a
conclusion. And apart from that, although the Traceview offers nice graphical user interface, it is really
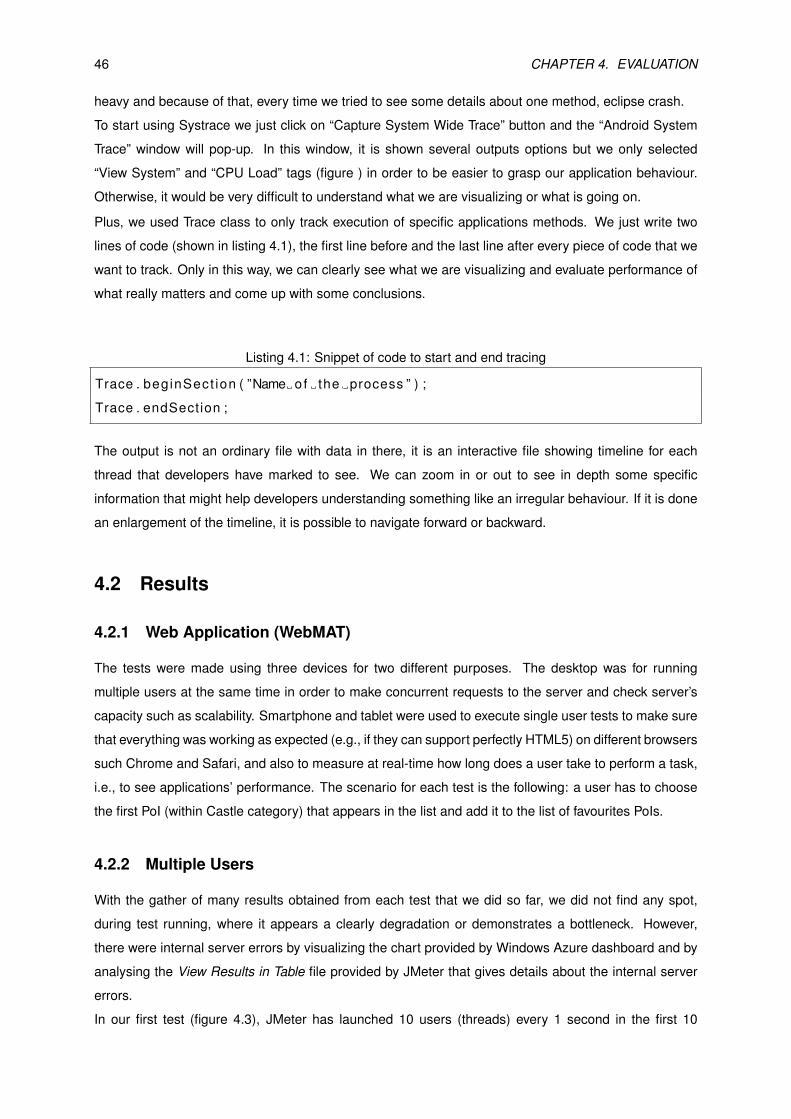
46 CHAPTER 4. EVALUATION
heavy and because of that, every time we tried to see some details about one method, eclipse crash.
To start using Systrace we just click on “Capture System Wide Trace” button and the “Android System
Trace” window will pop-up. In this window, it is shown several outputs options but we only selected
“View System” and “CPU Load” tags (figure ) in order to be easier to grasp our application behaviour.
Otherwise, it would be very difficult to understand what we are visualizing or what is going on.
Plus, we used Trace class to only track execution of specific applications methods. We just write two
lines of code (shown in listing 4.1), the first line before and the last line after every piece of code that we
want to track. Only in this way, we can clearly see what we are visualizing and evaluate performance of
what really matters and come up with some conclusions.
Listing 4.1: Snippet of code to start and end tracing
Trace . beginSect ion ( ”Name of the process ” ) ;
Trace . endSection ;
The output is not an ordinary file with data in there, it is an interactive file showing timeline for each
thread that developers have marked to see. We can zoom in or out to see in depth some specific
information that might help developers understanding something like an irregular behaviour. If it is done
an enlargement of the timeline, it is possible to navigate forward or backward.
4.2 Results
4.2.1 Web Application (WebMAT)
The tests were made using three devices for two different purposes. The desktop was for running
multiple users at the same time in order to make concurrent requests to the server and check server’s
capacity such as scalability. Smartphone and tablet were used to execute single user tests to make sure
that everything was working as expected (e.g., if they can support perfectly HTML5) on different browsers
such Chrome and Safari, and also to measure at real-time how long does a user take to perform a task,
i.e., to see applications’ performance. The scenario for each test is the following: a user has to choose
the first PoI (within Castle category) that appears in the list and add it to the list of favourites PoIs.
4.2.2 Multiple Users
With the gather of many results obtained from each test that we did so far, we did not find any spot,
during test running, where it appears a clearly degradation or demonstrates a bottleneck. However,
there were internal server errors by visualizing the chart provided by Windows Azure dashboard and by
analysing the View Results in Table file provided by JMeter that gives details about the internal server
errors.
In our first test (figure 4.3), JMeter has launched 10 users (threads) every 1 second in the first 10
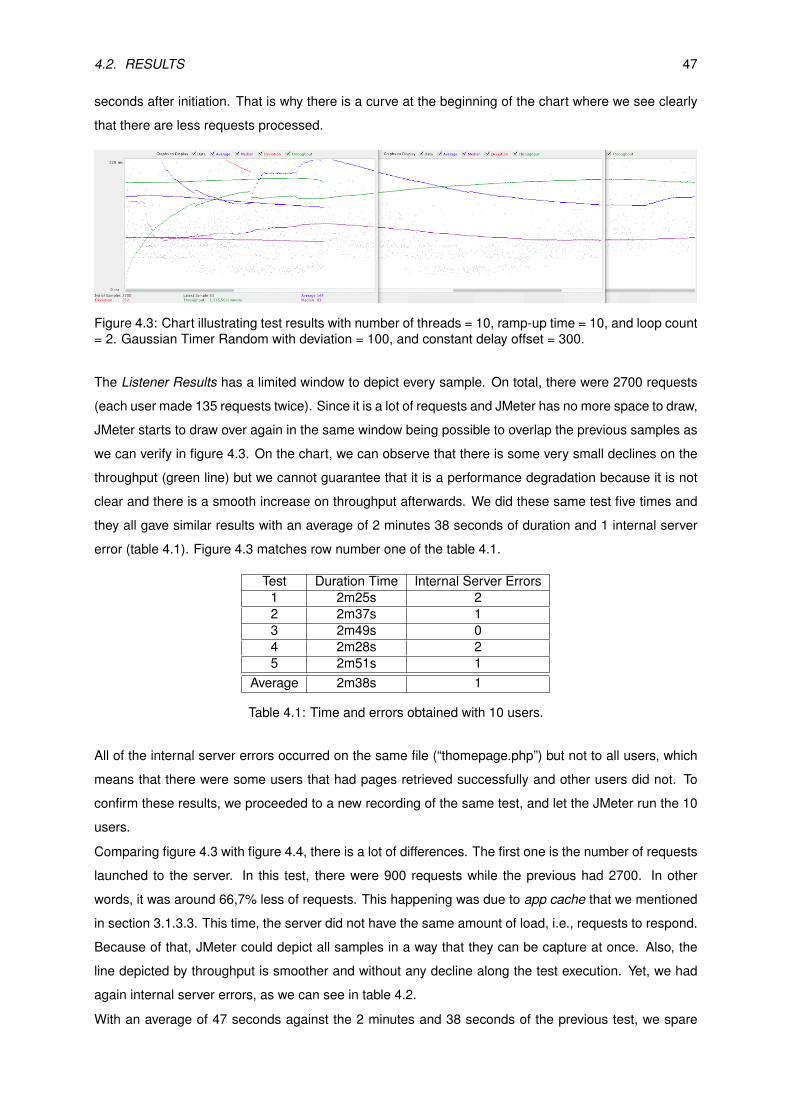
4.2. RESULTS 47
seconds after initiation. That is why there is a curve at the beginning of the chart where we see clearly
that there are less requests processed.
Figure 4.3: Chart illustrating test results with number of threads = 10, ramp-up time = 10, and loop count= 2. Gaussian Timer Random with deviation = 100, and constant delay offset = 300.
The Listener Results has a limited window to depict every sample. On total, there were 2700 requests
(each user made 135 requests twice). Since it is a lot of requests and JMeter has no more space to draw,
JMeter starts to draw over again in the same window being possible to overlap the previous samples as
we can verify in figure 4.3. On the chart, we can observe that there is some very small declines on the
throughput (green line) but we cannot guarantee that it is a performance degradation because it is not
clear and there is a smooth increase on throughput afterwards. We did these same test five times and
they all gave similar results with an average of 2 minutes 38 seconds of duration and 1 internal server
error (table 4.1). Figure 4.3 matches row number one of the table 4.1.
Test Duration Time Internal Server Errors1 2m25s 22 2m37s 13 2m49s 04 2m28s 25 2m51s 1
Average 2m38s 1
Table 4.1: Time and errors obtained with 10 users.
All of the internal server errors occurred on the same file (“thomepage.php”) but not to all users, which
means that there were some users that had pages retrieved successfully and other users did not. To
confirm these results, we proceeded to a new recording of the same test, and let the JMeter run the 10
users.
Comparing figure 4.3 with figure 4.4, there is a lot of differences. The first one is the number of requests
launched to the server. In this test, there were 900 requests while the previous had 2700. In other
words, it was around 66,7% less of requests. This happening was due to app cache that we mentioned
in section 3.1.3.3. This time, the server did not have the same amount of load, i.e., requests to respond.
Because of that, JMeter could depict all samples in a way that they can be capture at once. Also, the
line depicted by throughput is smoother and without any decline along the test execution. Yet, we had
again internal server errors, as we can see in table 4.2.
With an average of 47 seconds against the 2 minutes and 38 seconds of the previous test, we spare
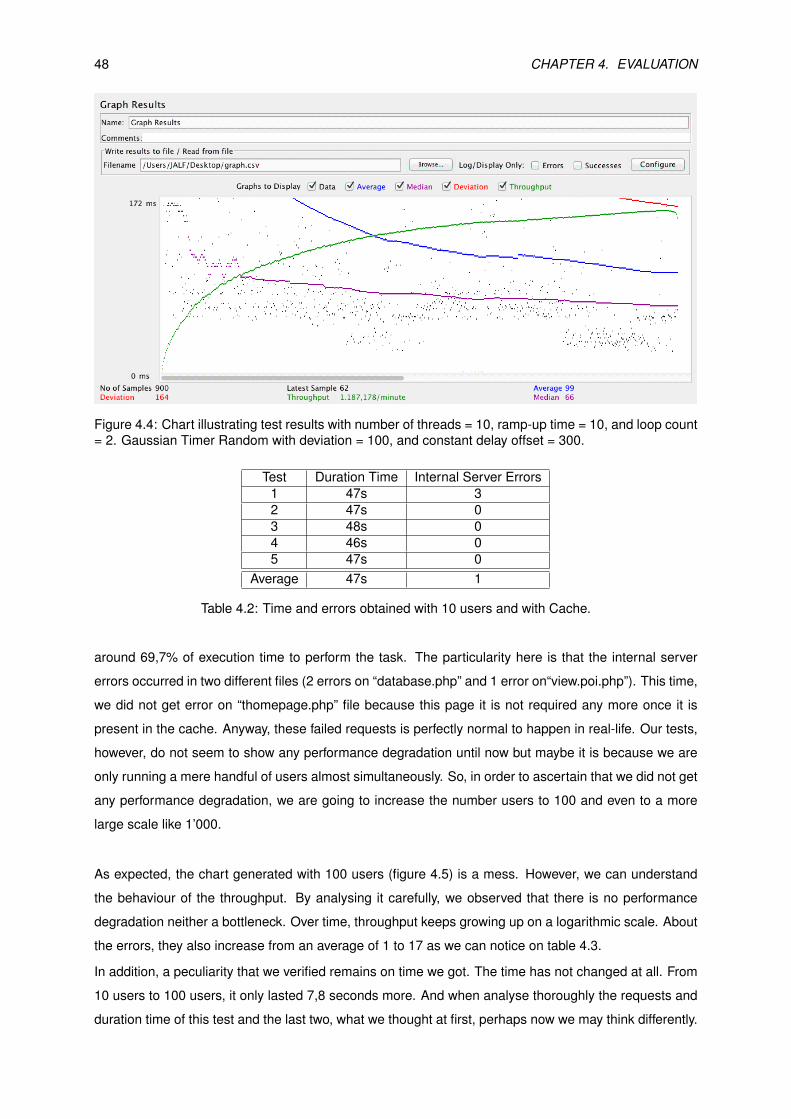
48 CHAPTER 4. EVALUATION
Figure 4.4: Chart illustrating test results with number of threads = 10, ramp-up time = 10, and loop count= 2. Gaussian Timer Random with deviation = 100, and constant delay offset = 300.
Test Duration Time Internal Server Errors1 47s 32 47s 03 48s 04 46s 05 47s 0
Average 47s 1
Table 4.2: Time and errors obtained with 10 users and with Cache.
around 69,7% of execution time to perform the task. The particularity here is that the internal server
errors occurred in two different files (2 errors on “database.php” and 1 error on“view.poi.php”). This time,
we did not get error on “thomepage.php” file because this page it is not required any more once it is
present in the cache. Anyway, these failed requests is perfectly normal to happen in real-life. Our tests,
however, do not seem to show any performance degradation until now but maybe it is because we are
only running a mere handful of users almost simultaneously. So, in order to ascertain that we did not get
any performance degradation, we are going to increase the number users to 100 and even to a more
large scale like 1’000.
As expected, the chart generated with 100 users (figure 4.5) is a mess. However, we can understand
the behaviour of the throughput. By analysing it carefully, we observed that there is no performance
degradation neither a bottleneck. Over time, throughput keeps growing up on a logarithmic scale. About
the errors, they also increase from an average of 1 to 17 as we can notice on table 4.3.
In addition, a peculiarity that we verified remains on time we got. The time has not changed at all. From
10 users to 100 users, it only lasted 7,8 seconds more. And when analyse thoroughly the requests and
duration time of this test and the last two, what we thought at first, perhaps now we may think differently.
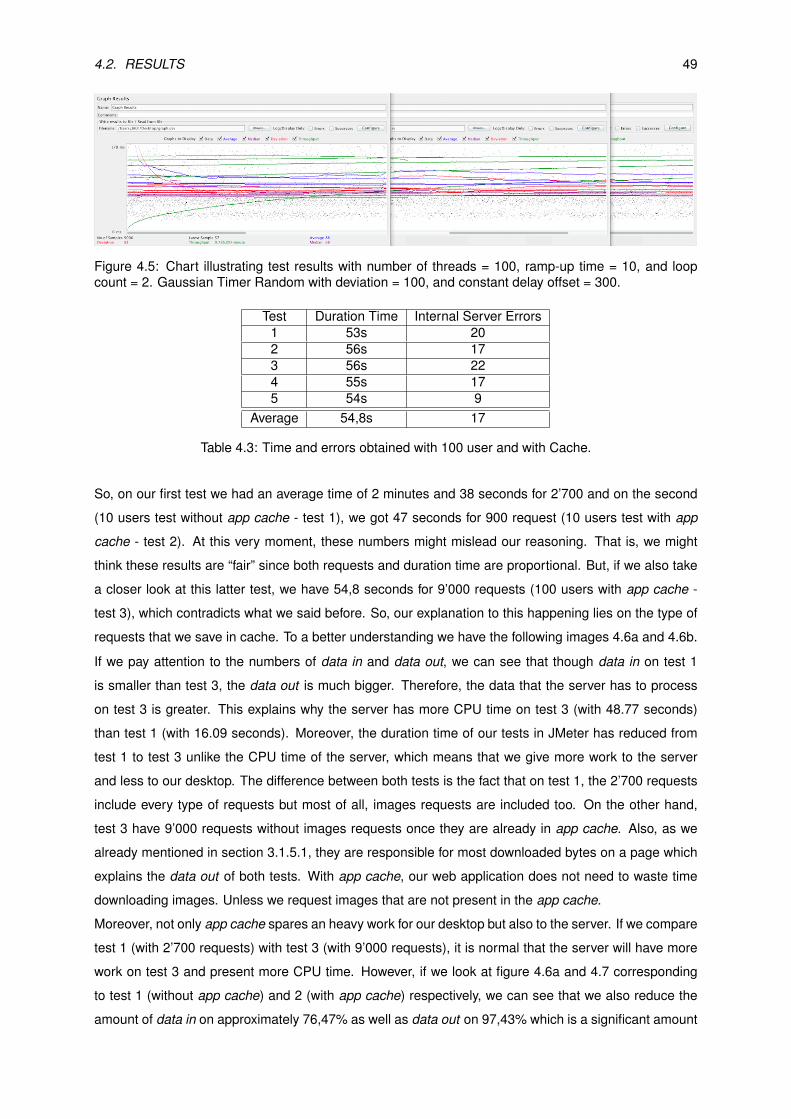
4.2. RESULTS 49
Figure 4.5: Chart illustrating test results with number of threads = 100, ramp-up time = 10, and loopcount = 2. Gaussian Timer Random with deviation = 100, and constant delay offset = 300.
Test Duration Time Internal Server Errors1 53s 202 56s 173 56s 224 55s 175 54s 9
Average 54,8s 17
Table 4.3: Time and errors obtained with 100 user and with Cache.
So, on our first test we had an average time of 2 minutes and 38 seconds for 2’700 and on the second
(10 users test without app cache - test 1), we got 47 seconds for 900 request (10 users test with app
cache - test 2). At this very moment, these numbers might mislead our reasoning. That is, we might
think these results are “fair” since both requests and duration time are proportional. But, if we also take
a closer look at this latter test, we have 54,8 seconds for 9’000 requests (100 users with app cache -
test 3), which contradicts what we said before. So, our explanation to this happening lies on the type of
requests that we save in cache. To a better understanding we have the following images 4.6a and 4.6b.
If we pay attention to the numbers of data in and data out, we can see that though data in on test 1
is smaller than test 3, the data out is much bigger. Therefore, the data that the server has to process
on test 3 is greater. This explains why the server has more CPU time on test 3 (with 48.77 seconds)
than test 1 (with 16.09 seconds). Moreover, the duration time of our tests in JMeter has reduced from
test 1 to test 3 unlike the CPU time of the server, which means that we give more work to the server
and less to our desktop. The difference between both tests is the fact that on test 1, the 2’700 requests
include every type of requests but most of all, images requests are included too. On the other hand,
test 3 have 9’000 requests without images requests once they are already in app cache. Also, as we
already mentioned in section 3.1.5.1, they are responsible for most downloaded bytes on a page which
explains the data out of both tests. With app cache, our web application does not need to waste time
downloading images. Unless we request images that are not present in the app cache.
Moreover, not only app cache spares an heavy work for our desktop but also to the server. If we compare
test 1 (with 2’700 requests) with test 3 (with 9’000 requests), it is normal that the server will have more
work on test 3 and present more CPU time. However, if we look at figure 4.6a and 4.7 corresponding
to test 1 (without app cache) and 2 (with app cache) respectively, we can see that we also reduce the
amount of data in on approximately 76,47% as well as data out on 97,43% which is a significant amount
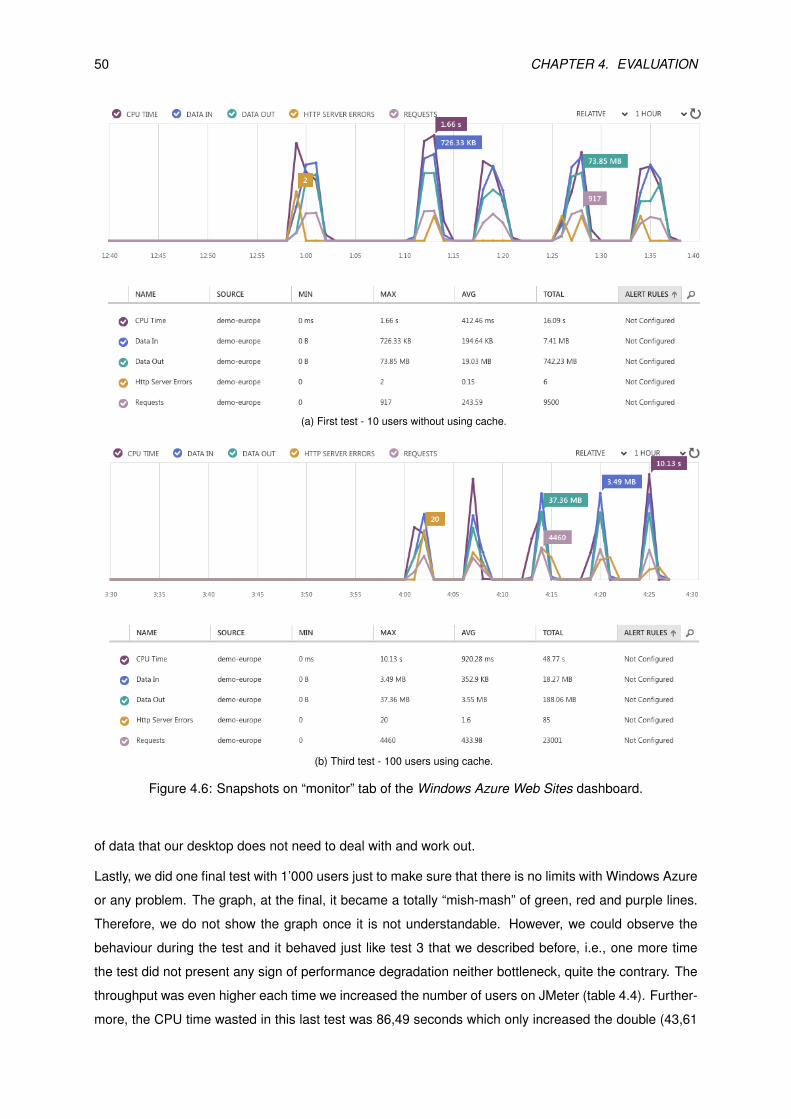
50 CHAPTER 4. EVALUATION
(a) First test - 10 users without using cache.
(b) Third test - 100 users using cache.
Figure 4.6: Snapshots on “monitor” tab of the Windows Azure Web Sites dashboard.
of data that our desktop does not need to deal with and work out.
Lastly, we did one final test with 1’000 users just to make sure that there is no limits with Windows Azure
or any problem. The graph, at the final, it became a totally “mish-mash” of green, red and purple lines.
Therefore, we do not show the graph once it is not understandable. However, we could observe the
behaviour during the test and it behaved just like test 3 that we described before, i.e., one more time
the test did not present any sign of performance degradation neither bottleneck, quite the contrary. The
throughput was even higher each time we increased the number of users on JMeter (table 4.4). Further-
more, the CPU time wasted in this last test was 86,49 seconds which only increased the double (43,61
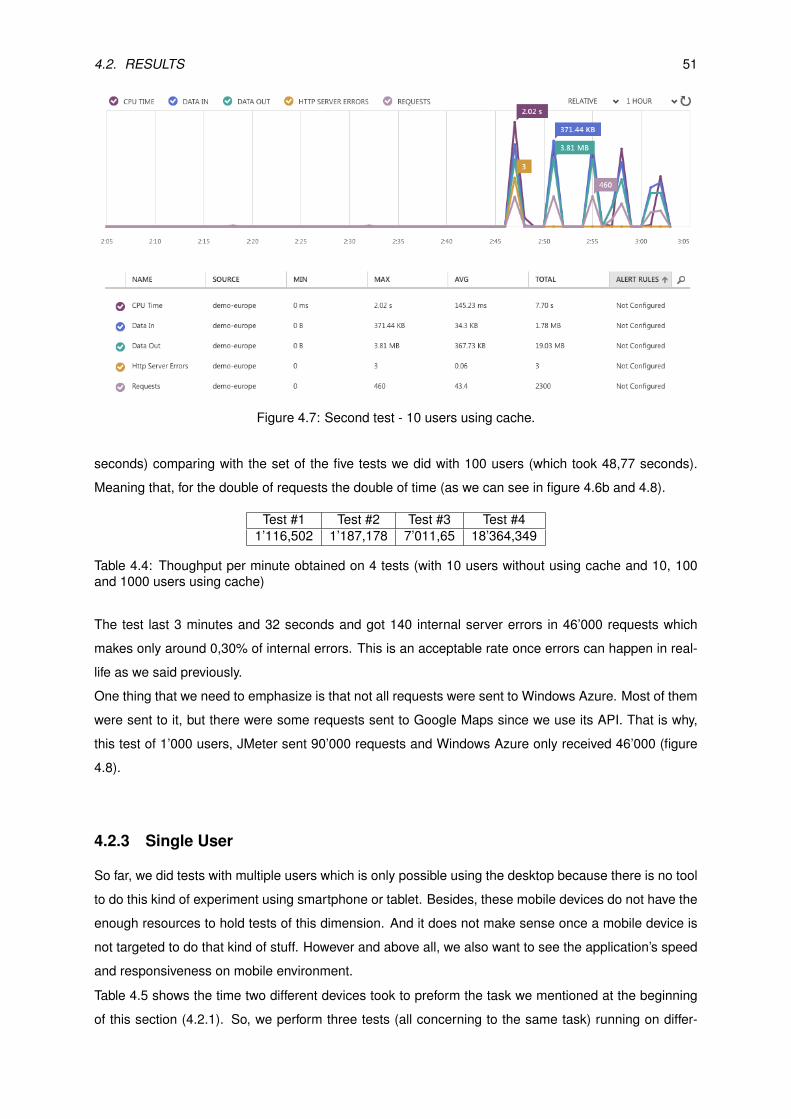
4.2. RESULTS 51
Figure 4.7: Second test - 10 users using cache.
seconds) comparing with the set of the five tests we did with 100 users (which took 48,77 seconds).
Meaning that, for the double of requests the double of time (as we can see in figure 4.6b and 4.8).
Test #1 Test #2 Test #3 Test #41’116,502 1’187,178 7’011,65 18’364,349
Table 4.4: Thoughput per minute obtained on 4 tests (with 10 users without using cache and 10, 100and 1000 users using cache)
The test last 3 minutes and 32 seconds and got 140 internal server errors in 46’000 requests which
makes only around 0,30% of internal errors. This is an acceptable rate once errors can happen in real-
life as we said previously.
One thing that we need to emphasize is that not all requests were sent to Windows Azure. Most of them
were sent to it, but there were some requests sent to Google Maps since we use its API. That is why,
this test of 1’000 users, JMeter sent 90’000 requests and Windows Azure only received 46’000 (figure
4.8).
4.2.3 Single User
So far, we did tests with multiple users which is only possible using the desktop because there is no tool
to do this kind of experiment using smartphone or tablet. Besides, these mobile devices do not have the
enough resources to hold tests of this dimension. And it does not make sense once a mobile device is
not targeted to do that kind of stuff. However and above all, we also want to see the application’s speed
and responsiveness on mobile environment.
Table 4.5 shows the time two different devices took to preform the task we mentioned at the beginning
of this section (4.2.1). So, we perform three tests (all concerning to the same task) running on differ-
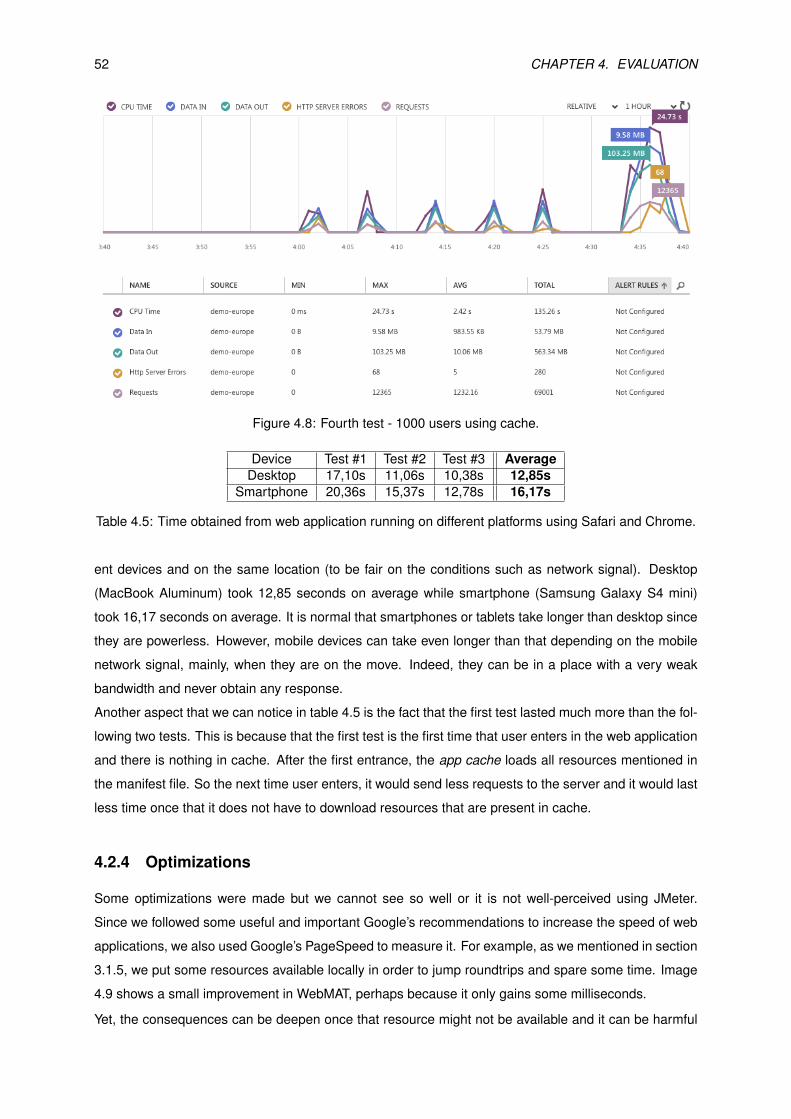
52 CHAPTER 4. EVALUATION
Figure 4.8: Fourth test - 1000 users using cache.
Device Test #1 Test #2 Test #3 AverageDesktop 17,10s 11,06s 10,38s 12,85s
Smartphone 20,36s 15,37s 12,78s 16,17s
Table 4.5: Time obtained from web application running on different platforms using Safari and Chrome.
ent devices and on the same location (to be fair on the conditions such as network signal). Desktop
(MacBook Aluminum) took 12,85 seconds on average while smartphone (Samsung Galaxy S4 mini)
took 16,17 seconds on average. It is normal that smartphones or tablets take longer than desktop since
they are powerless. However, mobile devices can take even longer than that depending on the mobile
network signal, mainly, when they are on the move. Indeed, they can be in a place with a very weak
bandwidth and never obtain any response.
Another aspect that we can notice in table 4.5 is the fact that the first test lasted much more than the fol-
lowing two tests. This is because that the first test is the first time that user enters in the web application
and there is nothing in cache. After the first entrance, the app cache loads all resources mentioned in
the manifest file. So the next time user enters, it would send less requests to the server and it would last
less time once that it does not have to download resources that are present in cache.
4.2.4 Optimizations
Some optimizations were made but we cannot see so well or it is not well-perceived using JMeter.
Since we followed some useful and important Google’s recommendations to increase the speed of web
applications, we also used Google’s PageSpeed to measure it. For example, as we mentioned in section
3.1.5, we put some resources available locally in order to jump roundtrips and spare some time. Image
4.9 shows a small improvement in WebMAT, perhaps because it only gains some milliseconds.
Yet, the consequences can be deepen once that resource might not be available and it can be harmful
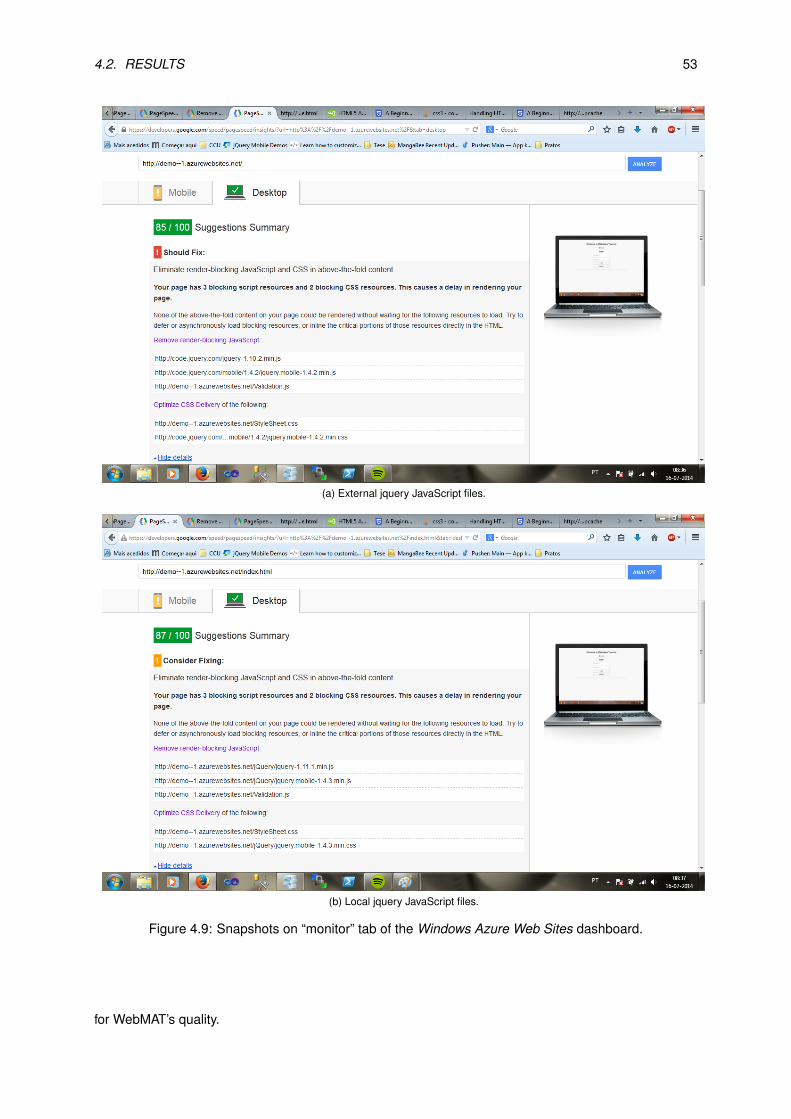
4.2. RESULTS 53
(a) External jquery JavaScript files.
(b) Local jquery JavaScript files.
Figure 4.9: Snapshots on “monitor” tab of the Windows Azure Web Sites dashboard.
for WebMAT’s quality.
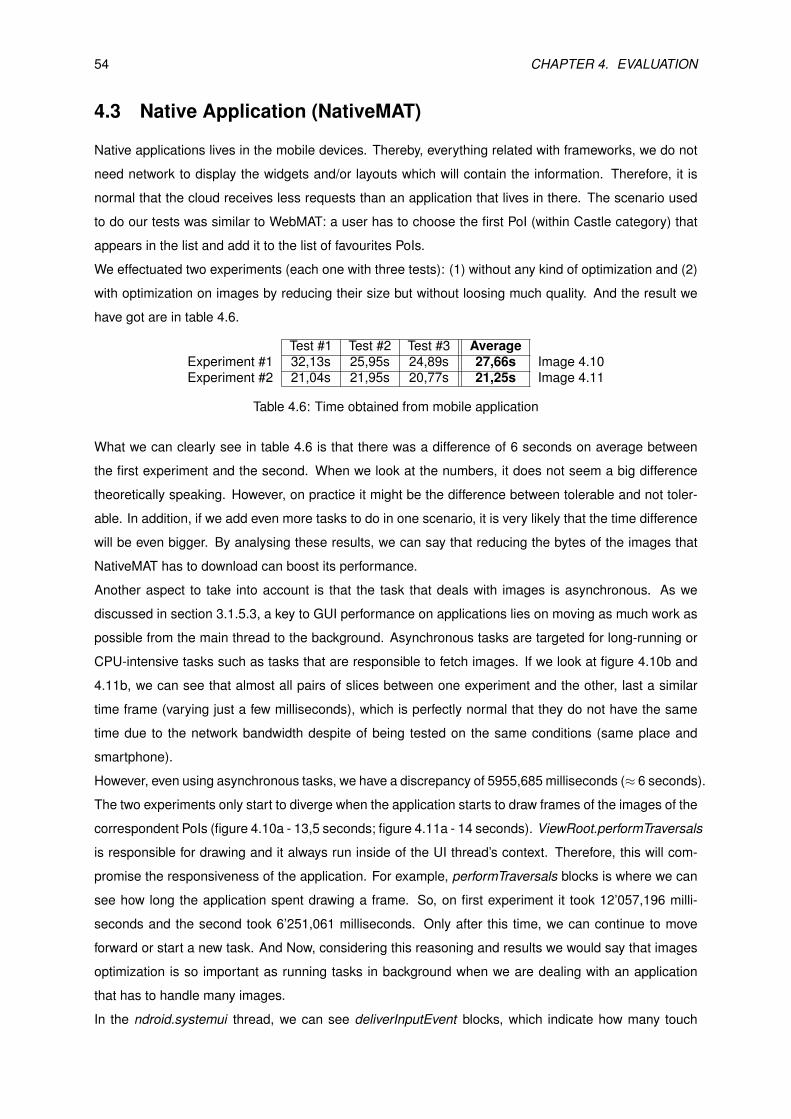
54 CHAPTER 4. EVALUATION
4.3 Native Application (NativeMAT)
Native applications lives in the mobile devices. Thereby, everything related with frameworks, we do not
need network to display the widgets and/or layouts which will contain the information. Therefore, it is
normal that the cloud receives less requests than an application that lives in there. The scenario used
to do our tests was similar to WebMAT: a user has to choose the first PoI (within Castle category) that
appears in the list and add it to the list of favourites PoIs.
We effectuated two experiments (each one with three tests): (1) without any kind of optimization and (2)
with optimization on images by reducing their size but without loosing much quality. And the result we
have got are in table 4.6.
Test #1 Test #2 Test #3 AverageExperiment #1 32,13s 25,95s 24,89s 27,66s Image 4.10Experiment #2 21,04s 21,95s 20,77s 21,25s Image 4.11
Table 4.6: Time obtained from mobile application
What we can clearly see in table 4.6 is that there was a difference of 6 seconds on average between
the first experiment and the second. When we look at the numbers, it does not seem a big difference
theoretically speaking. However, on practice it might be the difference between tolerable and not toler-
able. In addition, if we add even more tasks to do in one scenario, it is very likely that the time difference
will be even bigger. By analysing these results, we can say that reducing the bytes of the images that
NativeMAT has to download can boost its performance.
Another aspect to take into account is that the task that deals with images is asynchronous. As we
discussed in section 3.1.5.3, a key to GUI performance on applications lies on moving as much work as
possible from the main thread to the background. Asynchronous tasks are targeted for long-running or
CPU-intensive tasks such as tasks that are responsible to fetch images. If we look at figure 4.10b and
4.11b, we can see that almost all pairs of slices between one experiment and the other, last a similar
time frame (varying just a few milliseconds), which is perfectly normal that they do not have the same
time due to the network bandwidth despite of being tested on the same conditions (same place and
smartphone).
However, even using asynchronous tasks, we have a discrepancy of 5955,685 milliseconds (≈ 6 seconds).
The two experiments only start to diverge when the application starts to draw frames of the images of the
correspondent PoIs (figure 4.10a - 13,5 seconds; figure 4.11a - 14 seconds). ViewRoot.performTraversals
is responsible for drawing and it always run inside of the UI thread’s context. Therefore, this will com-
promise the responsiveness of the application. For example, performTraversals blocks is where we can
see how long the application spent drawing a frame. So, on first experiment it took 12’057,196 milli-
seconds and the second took 6’251,061 milliseconds. Only after this time, we can continue to move
forward or start a new task. And Now, considering this reasoning and results we would say that images
optimization is so important as running tasks in background when we are dealing with an application
that has to handle many images.
In the ndroid.systemui thread, we can see deliverInputEvent blocks, which indicate how many touch
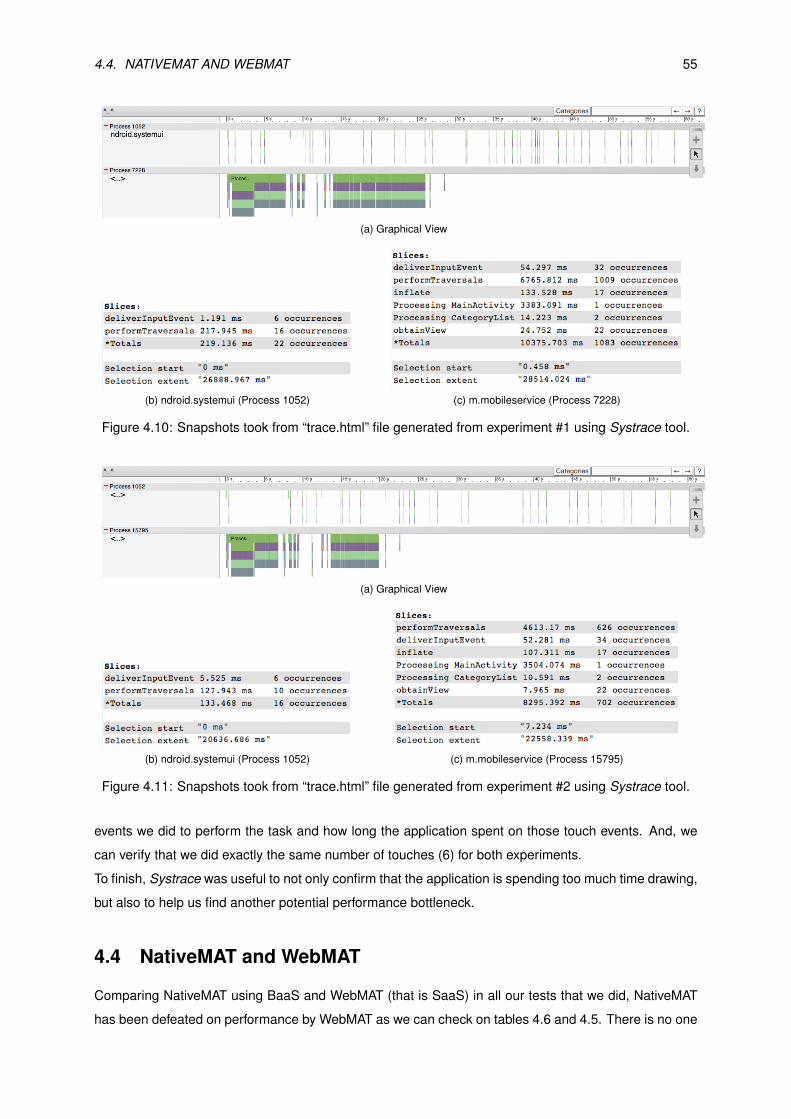
4.4. NATIVEMAT AND WEBMAT 55
(a) Graphical View
(b) ndroid.systemui (Process 1052) (c) m.mobileservice (Process 7228)
Figure 4.10: Snapshots took from “trace.html” file generated from experiment #1 using Systrace tool.
(a) Graphical View
(b) ndroid.systemui (Process 1052) (c) m.mobileservice (Process 15795)
Figure 4.11: Snapshots took from “trace.html” file generated from experiment #2 using Systrace tool.
events we did to perform the task and how long the application spent on those touch events. And, we
can verify that we did exactly the same number of touches (6) for both experiments.
To finish, Systrace was useful to not only confirm that the application is spending too much time drawing,
but also to help us find another potential performance bottleneck.
4.4 NativeMAT and WebMAT
Comparing NativeMAT using BaaS and WebMAT (that is SaaS) in all our tests that we did, NativeMAT
has been defeated on performance by WebMAT as we can check on tables 4.6 and 4.5. There is no one

56 CHAPTER 4. EVALUATION
single test where native defeats web application regarding the scenario we described in sections 4.2.1
and 4.3. However, this is not valid for other applications not targeted to tourism or that needs to load
a significant amount of images. Because as we verify in previous section, the native application only
waste a significant amount of time on images rendering. Therefore, if most of the application handles
with text data, then it will have a superior performance.
Chapter 5
Conclusion and Future Work
5.1 Conclusion
Mobile Cloud Computing brings with itself some changes to mobile applications. With it, it is required
network connection which compromise mobile devices’ performance once it is unpredictable. This way,
both web and native mobile applications may suffer from this network issue. However, in order to un-
derstand the impact it can cause to both we developed these two types of applications using Windows
Azure.
Windows Azure is a good platform for (mobile) developers to create application towards to Mobile Cloud
Computing paradigm. It provides a variety of services according to different needs and requirements
as well as the required SDKs for mobile application to be able to communicate with its services. The
services we used to communicate were Web Site and Mobile Service that let us to create an SaaS and
a BaaS respectively.
In this sense, we developed and deployed an HTML5 application (WebMAT) to our Web Site service us-
ing WebMatrix tool, and an android application (NativeMAT) linked to our Mobile Service. Through these
applications, we did some tests that showed that there is no performance degradation and bottleneck
from Windows Azure when increasing the number of users and requests. Moreover, the performance
results of both WebMAT and NativeMAT brings another meaning to the though that performance of nat-
ive mobile applications is better than web mobile applications. Since native applications had all the data
locally, they did not depend on external resources, which result in a remarkable performance.
Now with Mobile Cloud Computing native applications have significant performance loss once that they
are worse than web applications in the tests we have performed. One of the reasons for this is the pro-
gress reached with HTML5 that can leverage performance significantly by using app cache (one of its
features). Yet, the most important reason is image rendering. As we verified in section 4.2, NativeMAT
spent more time on rendering once this task had to done in the main thread, which can delay the current
task and the followings. In regard to mobile applications for tourism (having many images), we conclude
that web applications can have a better performance than native applications.
57
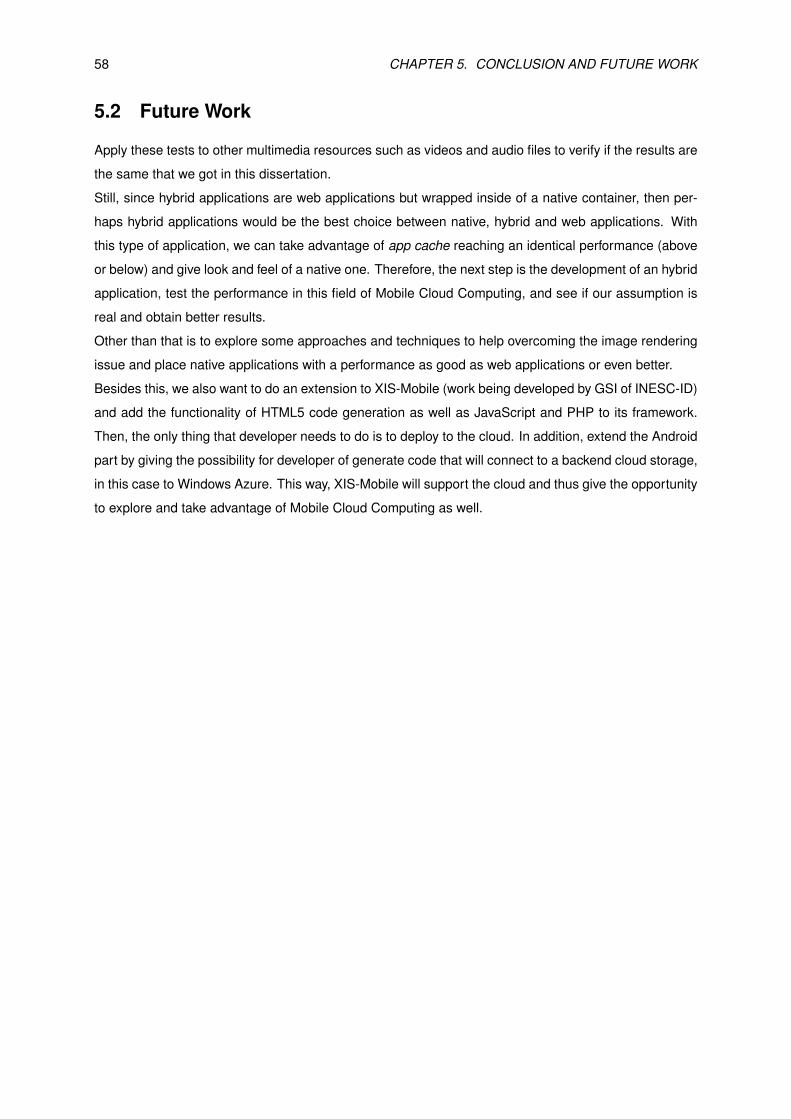
58 CHAPTER 5. CONCLUSION AND FUTURE WORK
5.2 Future Work
Apply these tests to other multimedia resources such as videos and audio files to verify if the results are
the same that we got in this dissertation.
Still, since hybrid applications are web applications but wrapped inside of a native container, then per-
haps hybrid applications would be the best choice between native, hybrid and web applications. With
this type of application, we can take advantage of app cache reaching an identical performance (above
or below) and give look and feel of a native one. Therefore, the next step is the development of an hybrid
application, test the performance in this field of Mobile Cloud Computing, and see if our assumption is
real and obtain better results.
Other than that is to explore some approaches and techniques to help overcoming the image rendering
issue and place native applications with a performance as good as web applications or even better.
Besides this, we also want to do an extension to XIS-Mobile (work being developed by GSI of INESC-ID)
and add the functionality of HTML5 code generation as well as JavaScript and PHP to its framework.
Then, the only thing that developer needs to do is to deploy to the cloud. In addition, extend the Android
part by giving the possibility for developer of generate code that will connect to a backend cloud storage,
in this case to Windows Azure. This way, XIS-Mobile will support the cloud and thus give the opportunity
to explore and take advantage of Mobile Cloud Computing as well.
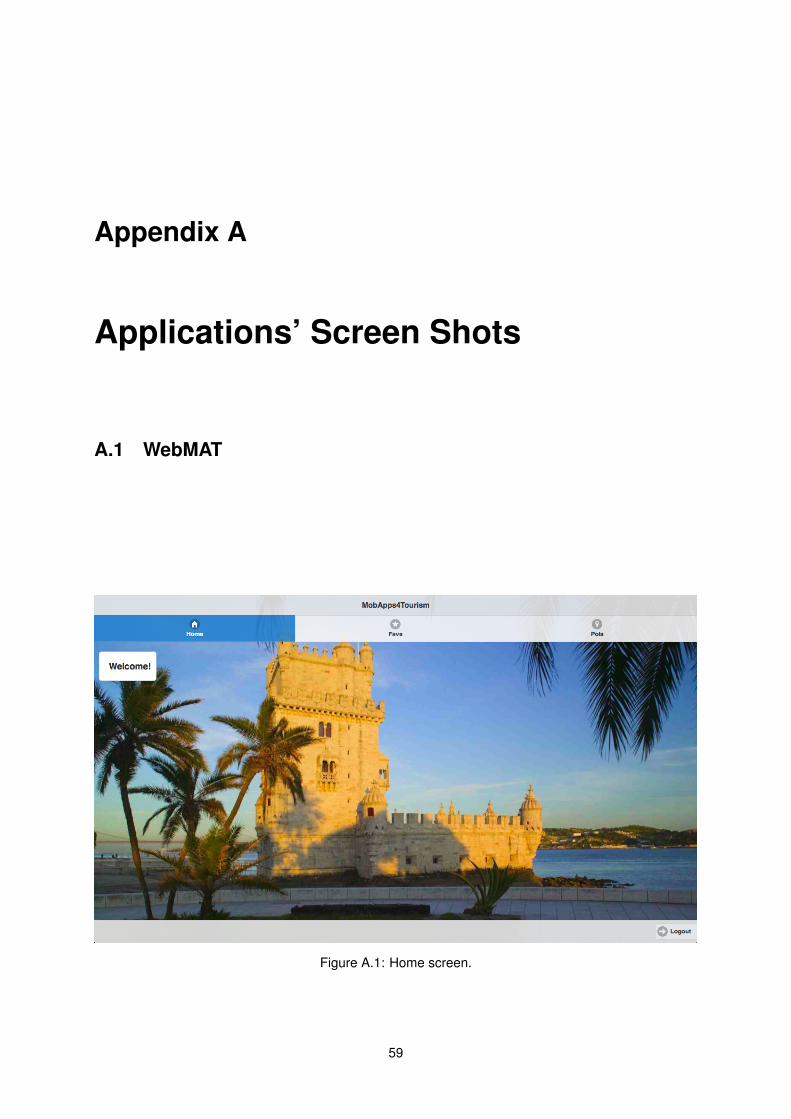
Appendix A
Applications’ Screen Shots
A.1 WebMAT
Figure A.1: Home screen.
59
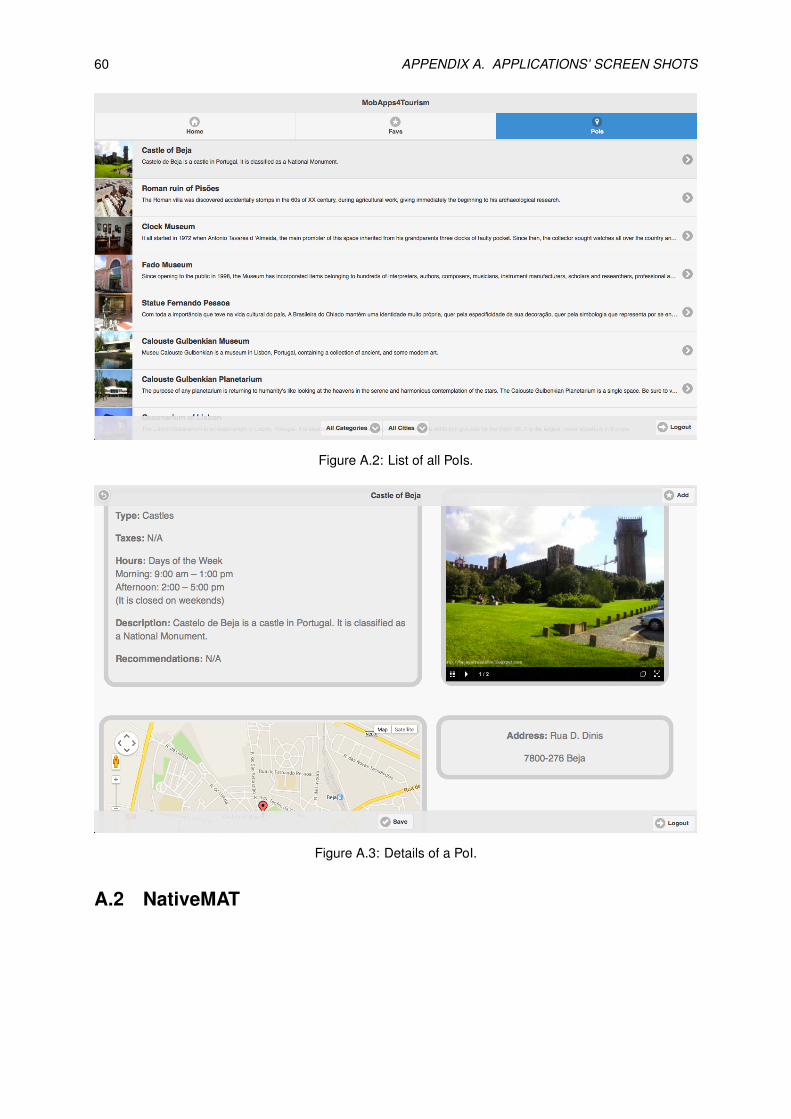
60 APPENDIX A. APPLICATIONS’ SCREEN SHOTS
Figure A.2: List of all PoIs.
Figure A.3: Details of a PoI.
A.2 NativeMAT
A.2. NATIVEMAT 61
(a) Home Screen (b) Loading Lists of Categories and Cities
(c) List of categories (d) List of PoIs
Figure A.4: PoIs loading of “Castles” category.
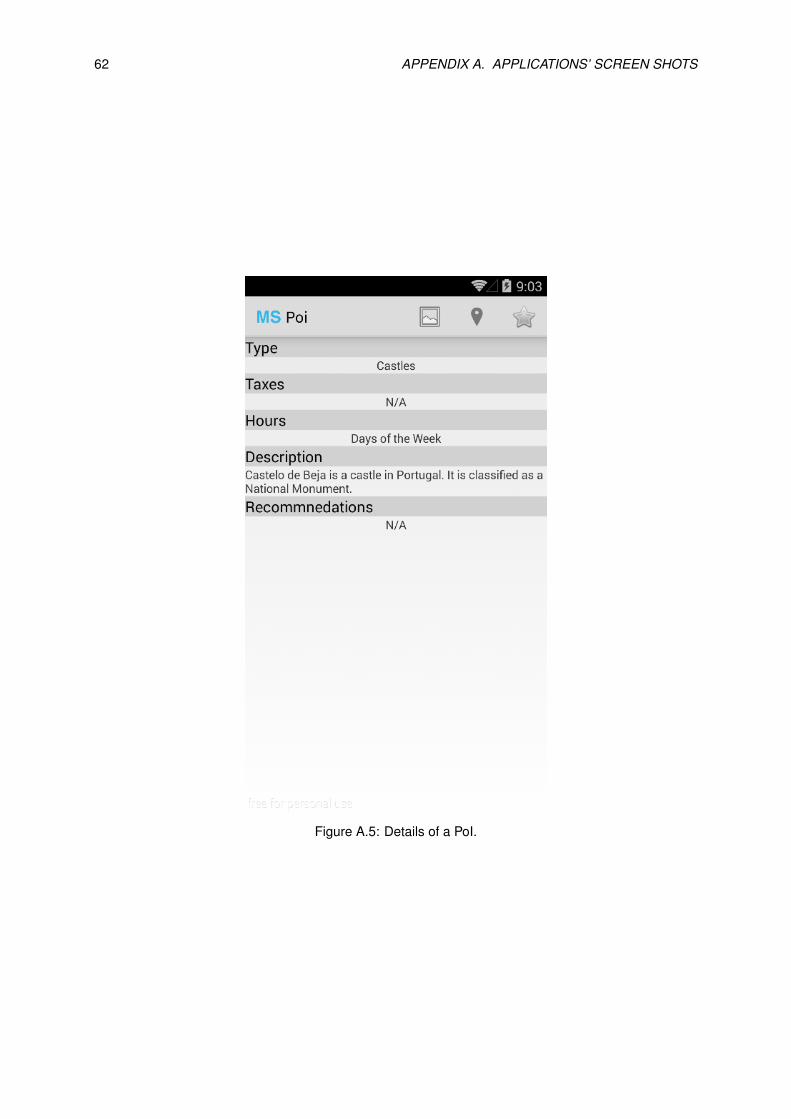
62 APPENDIX A. APPLICATIONS’ SCREEN SHOTS
Figure A.5: Details of a PoI.
Bibliography
[1] Unwto tourism highlights. http://mkt.unwto.org/sites/all/files/docpdf/
unwtohighlights12enhr.pdf, 2012.
[2] Telerik releases everlive, backend services for rapid cross-platform and mobile application devel-opment. http://www.telerik.com/company/press-releases/2013/10/22/telerik-releases-
everlive-backend-services-for-rapid-cross-platform-and-mobile-application-
development, October 2013.
[3] Suyesh Amatya and Arianit Kurti. Cross-platform mobile development: challenges and opportunit-ies. In ICT Innovations 2013, pages 219–229. Springer, 2014.
[4] apprenda. Iaas, paas, saas (explained and compared). http://apprenda.com/library/paas/
iaas-paas-saas-explained-compared/.
[5] Rafael Ballagas, Michael Rohs, Jennifer G Sheridan, and Jan Borchers. Byod: Bring your owndevice. In UbiComp 2004 Workshop on Ubiquitous Display Environments, 2004.
[6] Rohit Bhadauria, Rituparna Chaki, Nabendu Chaki, and Sugata Sanyal. A survey on security issuesin cloud computing. CoRR, abs/1109.5388, 2011.
[7] Eric Bidelman. Capturing audio & video in html5. http://www.html5rocks.com/en/tutorials/
getusermedia/intro/, October 2013.
[8] North Bridge. 2013 future of cloud computing survey reveals business driving cloud adoption ineverything as a service era; it investing heavily to catch up and support consumers graduating frombyod to byoc. http://www.northbridge.com/2013-future-cloud-computing-survey-reveals-business-driving-cloud-adoption-everything-service-era-it.
[9] Raluca Budiu. Mobile: Native apps, web apps, and hybrid apps. http://www.nngroup.com/
articles/mobile-native-apps/, September 2013.
[10] BusinessWire. Feds say platform-as-a-service can save us$20.5 billion annually in federal itcosts. http://www.businesswire.com/news/home/20131120005198/en/Feds-Platform-as-a-
Service-Save-US20.5-Billion-Annually-Federal#.UyLZjdzFm0s, November 2013.
[11] Rajkumar Buyya, Chee Shin Yeo, Srikumar Venugopal, James Broberg, and Ivona Brandic. Cloudcomputing and emerging it platforms: Vision, hype, and reality for delivering computing as the 5thutility. Future Generation computer systems, 25(6):599–616, 2009.
[12] Jason Carolan, Steve Gaede, James Baty, Glenn Brunette, Art Licht, Jim Remmell, Lew Tucker,and Joel Weise. Introduction to cloud computing architecture. White Paper, 1st edn. Sun MicroSystems Inc, 2009.
[13] Rory Cellan-Jones. 4g signal problems. http://www.bbc.com/news/technology-24143735.
[14] Bill Claybrook. Mobile cloud apps vs. native apps: The developer’s perspective. http://www.test.org/doe/, November 2012.
[15] Astec Computing. Mobile & remote working. http://www.asteccomputing.co.uk/services/
mobile-remote-working/.
[16] CLoUD ComPUtING. Cloud computing privacy concerns on our doorstep. Communications of theACM, 54(1), 2011.
63
64 BIBLIOGRAPHY
[17] Barb Darrow. So... do you really need a paas? http://gigaom.com/2013/12/03/so-do-you-
really-need-a-paas/, December 2013.
[18] Hoang T Dinh, Chonho Lee, Dusit Niyato, and Ping Wang. A survey of mobile cloud computing:architecture, applications, and approaches. Wireless communications and mobile computing, 2011.
[19] Xiaopeng Fan, Jiannong Cao, and Haixia Mao. A survey of mobile cloud computing. ZTE Corpor-ation, 2011.
[20] Niroshinie Fernando, Seng W Loke, and Wenny Rahayu. Mobile cloud computing: A survey. FutureGeneration Computer Systems, 29(1):84–106, 2013.
[21] Joao Lopes Ferreira and Alberto Rodrigues da Silva. Mobile cloud computing. In Open JournalMobile Computing and Cloud Computing, in Press, Scientific Online Publishing, 2014.
[22] Google Apps for iOS. http://www.google.com/mobile/ios/.
[23] George H. Forman and John Zahorjan. The challenges of mobile computing. Computer, 27(4):38–47, April 1994.
[24] Armando Fox, Rean Griffith, A Joseph, R Katz, A Konwinski, G Lee, D Patterson, A Rabkin, andI Stoica. Above the clouds: A berkeley view of cloud computing. Dept. Electrical Eng. and Comput.Sciences, University of California, Berkeley, Rep. UCB/EECS, 28:13, 2009.
[25] gartner. Infrastructure as a service (iaas). http://www.gartner.com/it-glossary/
infrastructure-as-a-service-iaas.
[26] Johan Harjono, Gloria Ng, Ding Kong, and Jimmy Lo. Building smarter web applications withhtml5. In Proceedings of the 2010 Conference of the Center for Advanced Studies on CollaborativeResearch, pages 402–403. IBM Corp., 2010.
[27] Dinh Thai Hoang, Chonho Lee, Dusit Niyato, and Ping Wang. A survey of mobile cloud comput-ing: architecture, applications, and approaches. Wireless Communications and Mobile Computing,13(18):1587–1611, 2013.
[28] Markus Jakobsson, Elaine Shi, Philippe Golle, and Richard Chow. Implicit authentication for mobiledevices. In Proceedings of the 4th USENIX Conference on Hot Topics in Security, HotSec’09,pages 9–9, Berkeley, CA, USA, 2009. USENIX Association.
[29] Jeffrey Kaplan. Saas survey shows new model becoming mainstream. Cutter Consortium ExecutiveUpdate, 6(22):1–5, 2005.
[30] Ben Kepes. Understanding the cloud computing stack: Saas, paas, iaas. http:
//www.rackspace.com/knowledge_center/whitepaper/understanding-the-cloud-computing-
stack-saas-paas-iaas/, October 2013.
[31] Simon Khalaf. Flurry five-year report: It’s an app world. the web just lives init. http://blog.flurry.com/bid/95723/Flurry-Five-Year-Report-It-s-an-App-World-The-
Web-Just-Lives-in-It, April 2013.
[32] Abdul Nasir Khan, ML Mat Kiah, Samee U Khan, and Sajjad A Madani. Towards secure mobilecloud computing: a survey. Future Generation Computer Systems, 29(5):1278–1299, 2013.
[33] kinvey. What is mobile backend as a service (mbaas)? http://www.kinvey.com/mbaas-mobile-
backend-as-a-service.
[34] Soeung-Kon Victor Ko, Jung-Hoon Lee, and Sung Woo Kim. Mobile cloud computing securityconsiderations. Journal of Security Engineering, 9(2), 2012.
[35] Karthik Kumar and Yung-Hsiang Lu. Cloud computing for mobile users: Can offloading computationsave energy? Computer, 43(4):51–56, 2010.
[36] Kin Lane. Overview of backend as a service (baas) white paper. 2013.
[37] Yuesong Li and Mark Powell. Html5, a serious contender to native app development or not? 2013.
BIBLIOGRAPHY 65
[38] David Linthicum. Cloud computing. http://www.infoworld.com/d/cloud-computing/paas-
isnt-dying-its-becoming-part-of-iaas-234351.
[39] Rosario Madaudo and Patrizia Scandurra. Native versus cross-platform frameworks for mobileapplication development. 2013.
[40] SC Magazine. Awareness of remote working, cloud computing and use of mobile deviceswill affect businesses in the future. http://www.scmagazineuk.com/awareness-of-remote-
working-cloud-computing-and-use-of-mobile-devices-will-affect-businesses-in-the-
future/article/180320/.
[41] Michael Mahemoff. Html5 vs native: The mobile app debate. http://www.html5rocks.com/en/
mobile/nativedebate/, June 2011.
[42] Sunilkumar S Manvi and Gopal Krishna Shyam. Resource management for infrastructure as aservice (iaas) in cloud computing: A survey. Journal of Network and Computer Applications, 2013.
[43] Lijun Mei, Wing Kwong Chan, and TH Tse. A tale of clouds: Paradigm comparisons and somethoughts on research issues. In Asia-Pacific Services Computing Conference, 2008. APSCC’08.IEEE, pages 464–469. Ieee, 2008.
[44] Keith W Miller, Jeffrey Voas, and George F Hurlburt. Byod: security and privacy considerations. ItProfessional, 14(5):0053–55, 2012.
[45] Damon Oehlman and Sebastien Blanc. Pro Android Web Apps: Develop for Android Using HTML5,CSS3 & JavaScript. Apress, 2011.
[46] Isaac Ogunlolu et al. Html5, the future of mobile applications:: A comparison between html5 ap-plication development platforms and native platforms. 2012.
[47] Amy Pasquarello. Feds say platform-as-a-service can save us$20.5 billion annually in fed-eral it costs. http://www.meritalk.com/pdfs/paas-or-play/MeriTalk_PaaS_or_Play_Study_
Release.pdf, November 2013.
[48] Fredric Paul. Cloud jargon unwound: Distinguishing saas, iaas and paas [infographic].http://readwrite.com/2013/05/08/explained-saas-iaas-paas-infographic#awesm=
~oyQxSt98VvrOwh.
[49] M. Rahman and F. A M Mir. Fourth generation (4g) mobile networks - features, technologies issues.In 3G and Beyond, 2005 6th IEEE International Conference on, pages 1–5, Nov 2005.
[50] Leena Rao. Google’s new html5 chrome apps for gmail, calendar and docs give users offlineaccess. http://techcrunch.com/2011/08/31/googles-new-html5-chrome-apps-for-gmail-
calendar-and-docs-give-users-offline-access/, August 2011.
[51] George Reese. The economics of cloud computing. http://broadcast.oreilly.com/2008/10/
the-economics-of-cloud-c.html.
[52] Andre Ribeiro and Alberto Rodrigues da Silva. Survey on cross-platforms and languages for mobileapps. In 8th International Conference on the Quality of Information and Communications Techno-logy, QUATIC 2012, Lisbon, Portugal, 2-6 September 2012, Proceedings, pages 255–260, 2012.
[53] Andre Ribeiro and AR Silva. Xis-mobile: A dsl for mobile applications. In Proceedings of SAC 2014Conference, ACM, 2014.
[54] Luis Rodero-Merino, Luis M Vaquero, Eddy Caron, Adrian Muresan, and Frederic Desprez. Buildingsafe paas clouds: A survey on security in multitenant software platforms. computers & security,31(1):96–108, 2012.
[55] Margaret Rouse. Infrastructure as a service (iaas). http://searchcloudcomputing.techtarget.com/definition/Infrastructure-as-a-Service-IaaS/, August 2010.
[56] Deepti Sahu, Shipra Sharma, Vandana Dubey, and Alpika Tripathi. Cloud computing in mobileapplications. International Journal of Scientific and Research Publications, 2(8):1–9, 2012.
66 BIBLIOGRAPHY
[57] Elaine Shi, Yuan Niu, Markus Jakobsson, and Richard Chow. Implicit authentication through learn-ing user behavior. In Proceedings of the 13th International Conference on Information Security,ISC’10, pages 99–113, Berlin, Heidelberg, 2011. Springer-Verlag.
[58] Slideshare. Globalsoft technologies. http://www.slideshare.net/IEEEFINALYEARPROJECTS/
cloud-computing-for-mobile-users-can-offloading-computation-save-energy.
[59] Zhexuan Song, Jesus Molina, Sung Lee, Houcheng Lee, Seigo Kotani, and Ryusuke Mas-uoka. Trustcube: An infrastructure that builds trust in client. In David Gawrock, Helmut Reimer,Ahmad-Reza Sadeghi, and Claire Vishik, editors, Future of Trust in Computing, pages 68–79.Vieweg+Teubner, 2009.
[60] Steve Souders. Even Faster Web Sites. O’Reilly Media, June 2009.
[61] Conn. STAMFORD. Gartner executive program survey of more than 2,000 cios shows digital tech-nologies are top priorities in 2013. http://www.gartner.com/newsroom/id/2304615.
[62] Antero Taivalsaari and Tommi Mikkonen. The web as an application platform: The saga continues.In Software Engineering and Advanced Applications (SEAA), 2011 37th EUROMICRO Conferenceon, pages 170–174. IEEE, 2011.
[63] TECHNEWSDAILY. How facebook sells your personal information. http://news.discovery.
com/tech/gear-and-gadgets/how-facebook-sells-your-personal-information-130124.htm,January 2013.
[64] Tyler Thia. Cloud computing boosts remote working. http://www.zdnet.com/cloud-computing-
boosts-remote-working-2062203321/.
[65] tumblr. The native mobile app fallacy. http://ox86.tumblr.com/post/45101804690/the-native-mobile-app-fallacy.
[66] Fred van den Bosch. The future of monitoring data is in the cloud. http://programming.oreilly.com/2013/12/the-future-of-monitoring-data-is-in-the-cloud.html.
[67] Upkar Varshney and Radhika Jain. Issues in emerging 4g wireless networks. Computer, 34(6):94–96, June 2001.
[68] Priya Viswanathan. Saas, paas and iaas in the mobile industry. http://mobiledevices.about.
com/od/additionalresources/a/Saas-Paas-And-Iaas-In-The-Mobile-Industry.htm.
[69] WA Vogels. Head in the clouds - the power of infrastructure as a service. In First workshop onCloud Computing and in Applications (CCA’08)(October 2008), 2008.
[70] Ren Waldura. Yahoo! mojito is now open source. https://developer.yahoo.com/blogs/ydn/
yahoo-mojito-now-open-source-52490.html, April 2012.
[71] Appcelerator white paper. Native vs. html5 mobile app development: Which option is best? 2012.
[72] Dan Worth. Top 10 pros and cons of 4g networks. http://www.v3.co.uk/v3-uk/news/2200131/
top-10-pros-and-cons-of-4g-networks.
[73] Stelios Xinogalos, Kostas E Psannis, and Angelo Sifaleras. Recent advances delivered by html 5in mobile cloud computing applications: a survey. In Proceedings of the Fifth Balkan Conference inInformatics, pages 199–204. ACM, 2012.
[74] Lan Zhang, Xuan Ding, Zhiguo Wan, Ming Gu, and Xiang-Yang Li. Wiface: A secure geosocialnetworking system using wifi-based multi-hop manet. In Proceedings of the 1st ACM Workshop onMobile Cloud Computing & Services: Social Networks and Beyond, MCS ’10, pages 3:1–3:8,New York, NY, USA, 2010. ACM.
[75] Qi Zhang, Lu Cheng, and Raouf Boutaba. Cloud computing: state-of-the-art and research chal-lenges. Journal of internet services and applications, 1(1):7–18, 2010.

![THE ACCEPTANCE OF MOBILE TRAVEL APPLICATIONS: A …ijsser.org/uploads/ijsser_02__341.pdf · tourism value chain [6]. For tourism businesses, the internet offers the opportunity for](https://img.pdfslide.us/doc/110x75/5e7fd05623cf11180e4a42d8/the-acceptance-of-mobile-travel-applications-a-tourism-value-chain-6-for-tourism.jpg)