Embed Size (px)
Citation preview
Mobile Application Performance Report Optimization Recommendations and
Performance Analysis Report
Prepared for - http://www.google.com VS
http://www.yahoo.com
Emulated Device Type: iPad
OVERALL PERFORMANCE SCORE: A 92/100 points
Mobile Application Performance Report:
Performance Predictions, Analysis and Recommendations
www.shunra.com 1.877.474.8672 2 of 18
Thursday, May 05, 2011
Table of Contents
TABLE OF CONTENTS ................................................................................................................................ 2
OVERVIEW ............................................................................................................................................... 3
WEBPAGE LOAD TIMES ............................................................................................................................ 3
WEBPAGE PERFORMANCE COMPARISON ................................................................................................ 6
WATERFALL ANALYSIS.............................................................................................................................. 7
COMPONENT DOWNLOAD ANALYSIS ....................................................................................................... 8
COMPONENT ANALYSIS COMPARISON .................................................................................................... 9
OPTIMIZATION RECOMMENDATIONS FOR MOBILE WEB APPLICATIONS ............................................... 10
SUMMARY FOR HTTP://WWW.GOOGLE.COM ..................................................................................................... 10
OPTIMIZATION DETAILS .................................................................................................................................. 12
IMPROVE MOBILE USER EXPERIENCE WITH SHUNRA ............................................................................. 16
APPENDIX 1: MOBILE APPLICATION PERFORMANCE TEST METHODOLOGY ........................................... 17

Mobile Application Performance Report:
Performance Predictions, Analysis and Recommendations
www.shunra.com 1.877.474.8672 3 of 18
Overview With the rise in mobile application development and deployments – a recent Shunra survey
showed 93% of responding companies had current or planned mobile initiatives – organizations
are increasingly exploring and implementing best practices to manage the complexity of mobile
environments and proactively predict and fine tune performance levels.
Mobile service level agreements (SLAs) are becoming more commonplace as end users become
more geographically distributed and reliant on anywhere-anytime access to applications and
information. In fact, Morgan Stanley’s State of the Internet Report expects mobile Internet
access to surpass PC-based Internet access by 20141. And, by 2015, over half of all mobile
subscribers are expected to be engaged in m-payments2, over 1 billion subscribers will access
financial services from mobile devices3, and the mobile commerce market will exceed $119
billion4.
The numbers are staggering and point to a mobile tipping point that is upon us. Shunra
recognizes the challenges presented by mobile environments and is pleased to provide a free
solution for testing your webpages and gaining insight into how those pages are experienced by
your end users. In the following pages, you will find key performance indicators for your end
user’s experience, including webpage load times, a component download analysis, insight into
additional performance metrics and specific optimization suggestions based, in part, on industry
accepted best practices.
Webpage Load Times To establish webpage load times, performance tests were executed on a test server in the
Amazon EC2 Cloud Computing Environment – Eastern US availability zone. A baseline was
gathered approximating the performance a mobile user might encounter while using a WiFi
connection to access your test page(s). For simplicity sake, a Firefox browser was used for all
tests. While page rendering and other performance variations are expected from mobile
devices, , the point of this report is to highlight general issues with webpages, and the
substantial vulnerability to network performance that often dwarfs local mobile device
performance limitations such as CPU speed. Network emulation technology was applied to
1 “Internet Trends” by Mary Meeker, Morgan Stanley (April 12, 2010). 2 “Mobile Payments for Digital and Physical Goods,” Juniper Research ( April 20, 2010). 3 “Mobile Banking,” Global Industry Analysts (February 1, 2010). 4 “Shopping by Mobile Will Grow to $119 Billion in 2015,”, ABI Research (February 16, 2010).
Mobile Application Performance Report:
Performance Predictions, Analysis and Recommendations
www.shunra.com 1.877.474.8672 4 of 18
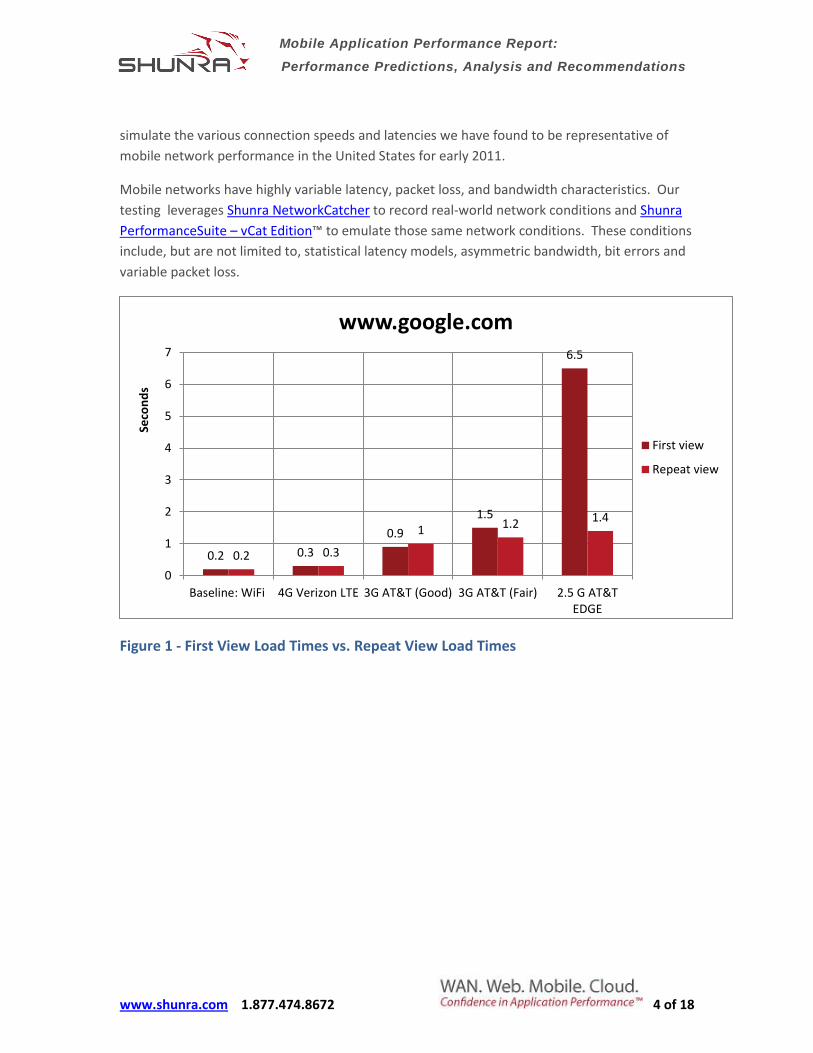
simulate the various connection speeds and latencies we have found to be representative of
mobile network performance in the United States for early 2011.
Mobile networks have highly variable latency, packet loss, and bandwidth characteristics. Our
testing leverages Shunra NetworkCatcher to record real-world network conditions and Shunra
PerformanceSuite – vCat Edition™ to emulate those same network conditions. These conditions
include, but are not limited to, statistical latency models, asymmetric bandwidth, bit errors and
variable packet loss.
Figure 1 - First View Load Times vs. Repeat View Load Times
0.2 0.3
0.9
1.5
6.5
0.2 0.3
1 1.2 1.4
0
1
2
3
4
5
6
7
Baseline: WiFi 4G Verizon LTE 3G AT&T (Good) 3G AT&T (Fair) 2.5 G AT&TEDGE
Seco
nd
s
www.google.com
First view
Repeat view
Mobile Application Performance Report:
Performance Predictions, Analysis and Recommendations
www.shunra.com 1.877.474.8672 5 of 18
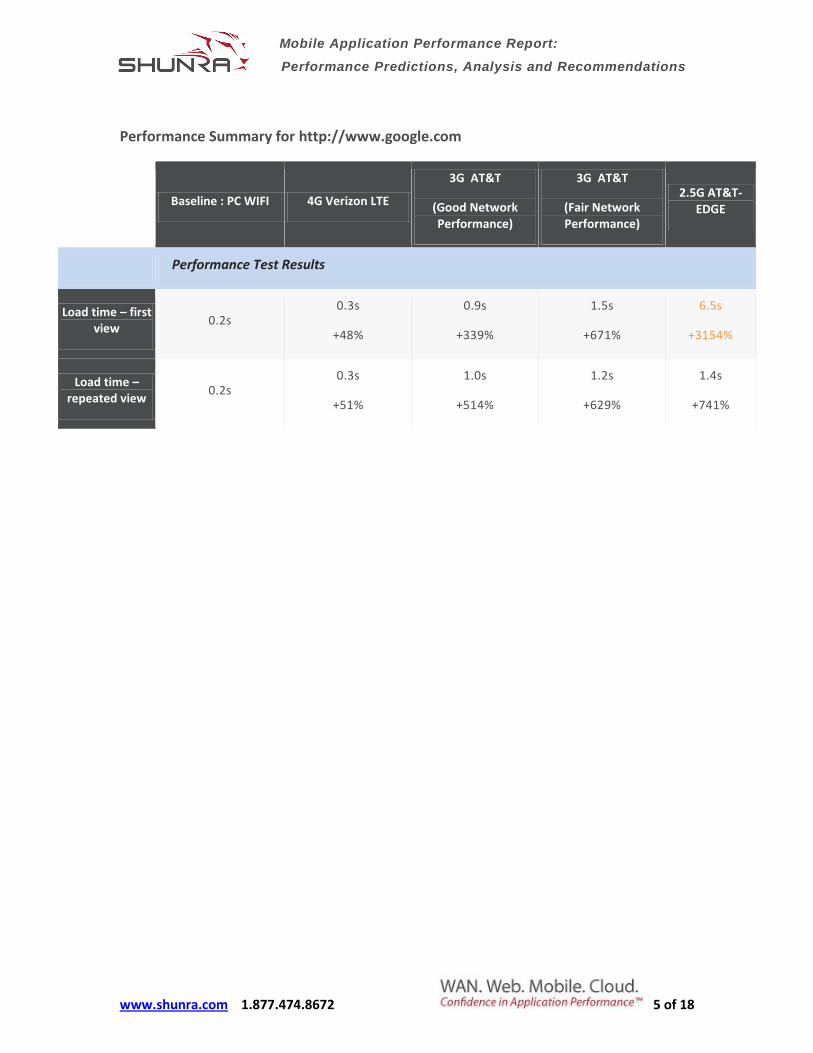
Performance Summary for http://www.google.com
Baseline : PC WIFI 4G Verizon LTE
3G AT&T
(Good Network Performance)
3G AT&T
(Fair Network Performance)
2.5G AT&T- EDGE
Performance Test Results
Load time – first view
0.2s 0.3s
+48%
0.9s
+339%
1.5s
+671%
6.5s
+3154%
Load time – repeated view
0.2s 0.3s
+51%
1.0s
+514%
1.2s
+629%
1.4s
+741%
Mobile Application Performance Report:
Performance Predictions, Analysis and Recommendations
www.shunra.com 1.877.474.8672 6 of 18
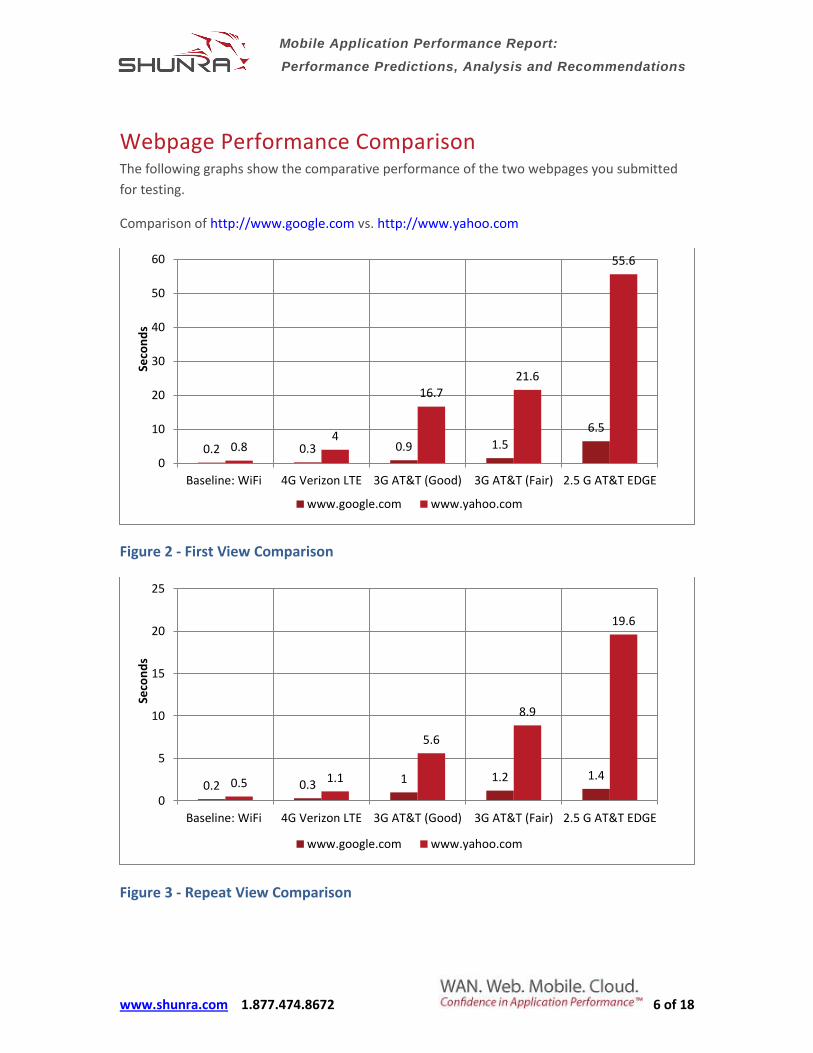
Webpage Performance Comparison The following graphs show the comparative performance of the two webpages you submitted
for testing.
Comparison of http://www.google.com vs. http://www.yahoo.com
Figure 2 - First View Comparison
Figure 3 - Repeat View Comparison
0.2 0.3 0.9 1.5
6.5
0.8 4
16.7
21.6
55.6
0
10
20
30
40
50
60
Baseline: WiFi 4G Verizon LTE 3G AT&T (Good) 3G AT&T (Fair) 2.5 G AT&T EDGE
Seco
nd
s
www.google.com www.yahoo.com
0.2 0.3 1 1.2 1.4 0.5 1.1
5.6
8.9
19.6
0
5
10
15
20
25
Baseline: WiFi 4G Verizon LTE 3G AT&T (Good) 3G AT&T (Fair) 2.5 G AT&T EDGE
Seco
nd
s
www.google.com www.yahoo.com
Mobile Application Performance Report:
Performance Predictions, Analysis and Recommendations
www.shunra.com 1.877.474.8672 7 of 18
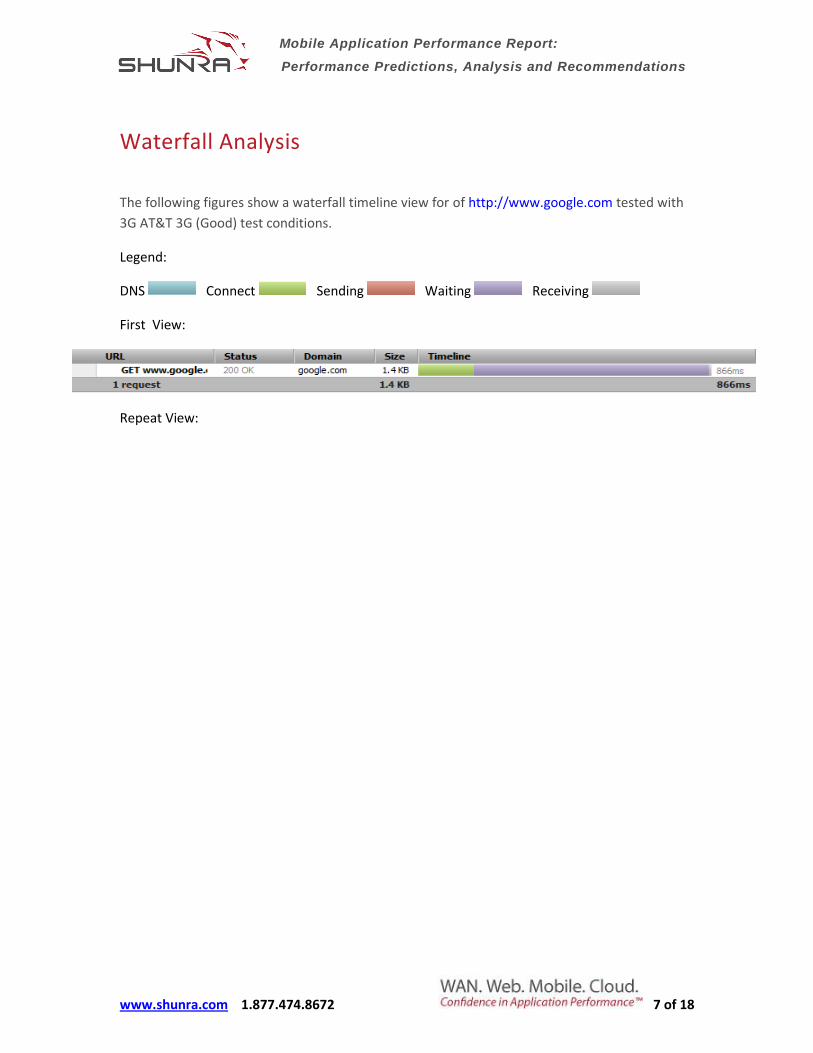
Waterfall Analysis
The following figures show a waterfall timeline view for of http://www.google.com tested with
3G AT&T 3G (Good) test conditions.
Legend:
DNS Connect Sending Waiting Receiving
First View:
Repeat View:
Mobile Application Performance Report:
Performance Predictions, Analysis and Recommendations
www.shunra.com 1.877.474.8672 8 of 18
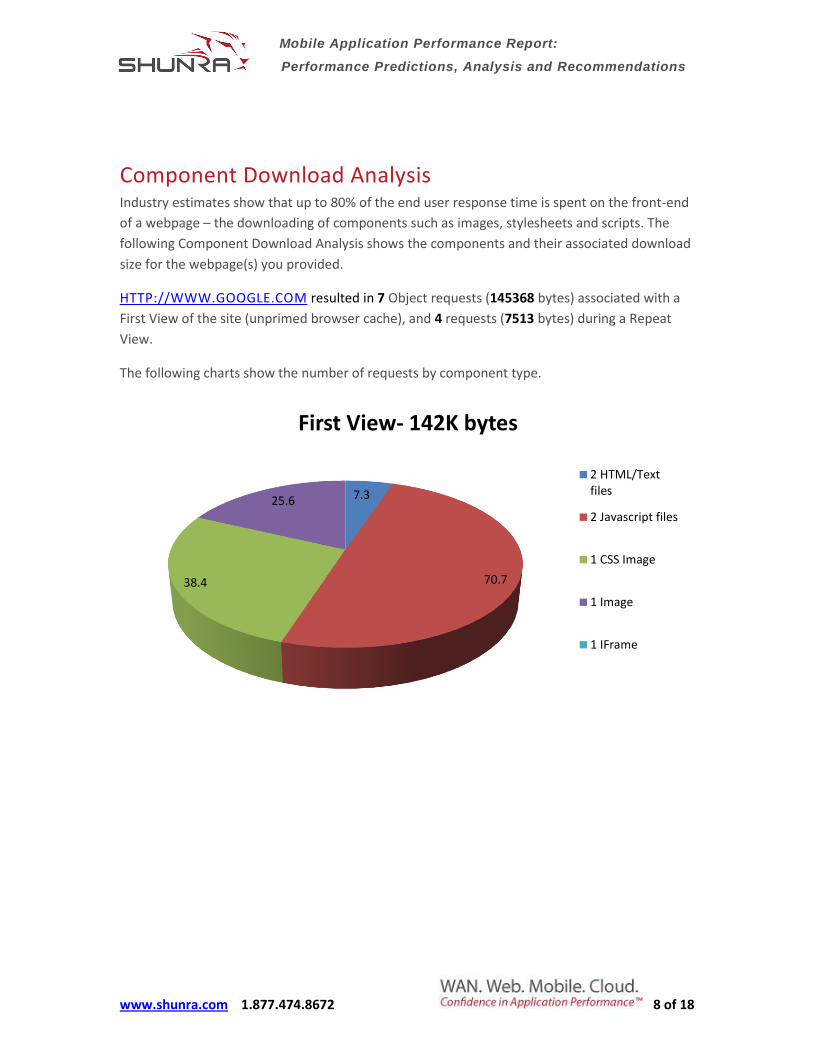
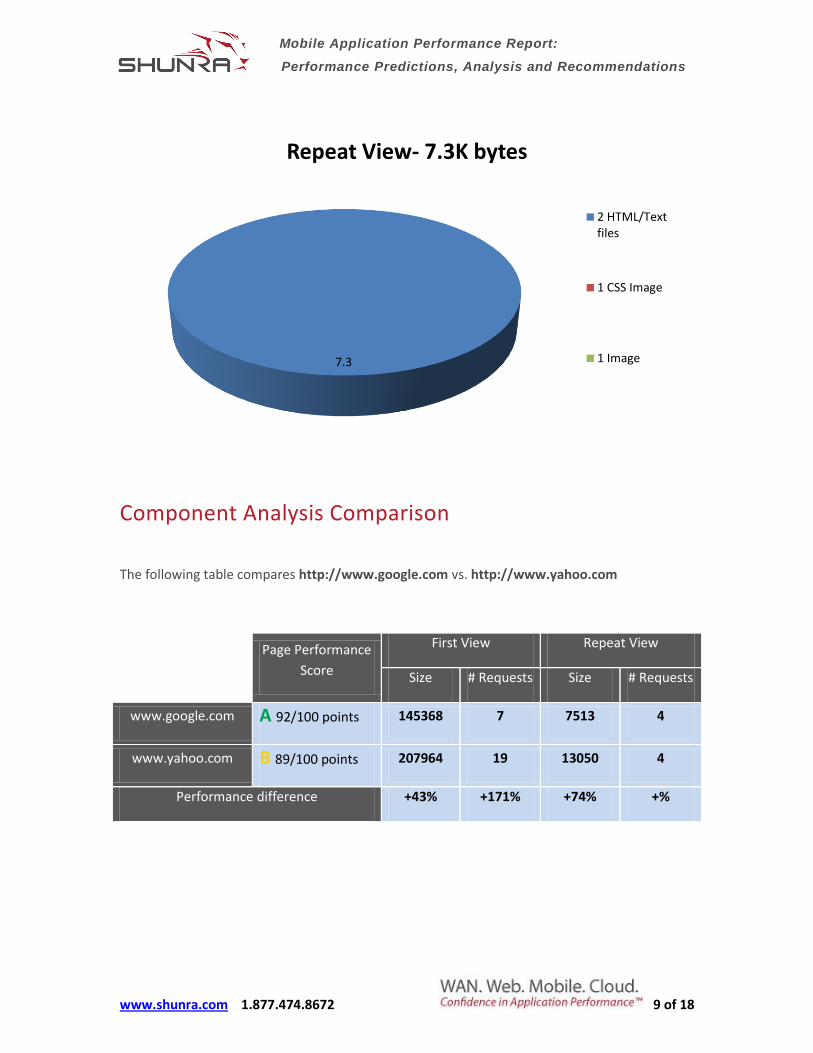
Component Download Analysis Industry estimates show that up to 80% of the end user response time is spent on the front-end
of a webpage – the downloading of components such as images, stylesheets and scripts. The
following Component Download Analysis shows the components and their associated download
size for the webpage(s) you provided.
HTTP://WWW.GOOGLE.COM resulted in 7 Object requests (145368 bytes) associated with a
First View of the site (unprimed browser cache), and 4 requests (7513 bytes) during a Repeat
View.
The following charts show the number of requests by component type.
7.3
70.7 38.4
25.6
First View- 142K bytes
2 HTML/Textfiles
2 Javascript files
1 CSS Image
1 Image
1 IFrame
Mobile Application Performance Report:
Performance Predictions, Analysis and Recommendations
www.shunra.com 1.877.474.8672 9 of 18
Component Analysis Comparison
The following table compares http://www.google.com vs. http://www.yahoo.com
Page Performance
Score
First View Repeat View
Size # Requests Size # Requests
www.google.com A 92/100 points 145368 7 7513 4
www.yahoo.com B 89/100 points 207964 19 13050 4
Performance difference +43% +171% +74% +%
7.3
Repeat View- 7.3K bytes
2 HTML/Textfiles
1 CSS Image
1 Image
Mobile Application Performance Report:
Performance Predictions, Analysis and Recommendations
www.shunra.com 1.877.474.8672 10 of 18
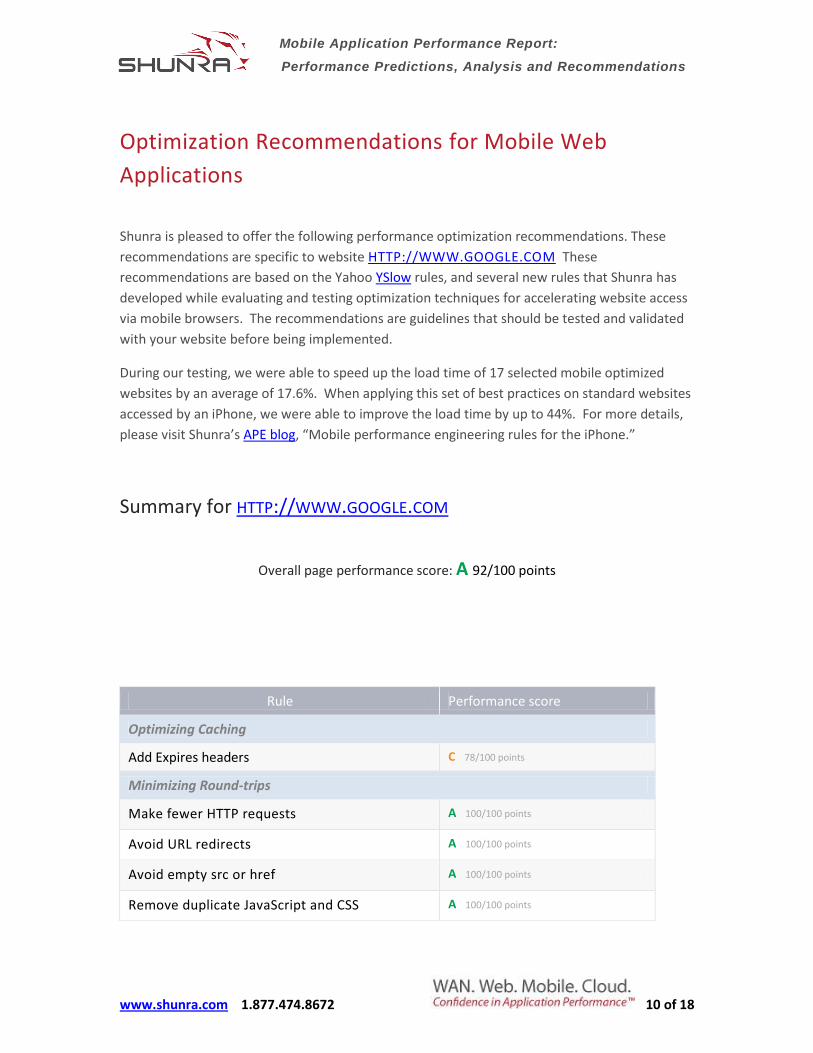
Optimization Recommendations for Mobile Web
Applications
Shunra is pleased to offer the following performance optimization recommendations. These
recommendations are specific to website HTTP://WWW.GOOGLE.COM These
recommendations are based on the Yahoo YSlow rules, and several new rules that Shunra has
developed while evaluating and testing optimization techniques for accelerating website access
via mobile browsers. The recommendations are guidelines that should be tested and validated
with your website before being implemented.
During our testing, we were able to speed up the load time of 17 selected mobile optimized
websites by an average of 17.6%. When applying this set of best practices on standard websites
accessed by an iPhone, we were able to improve the load time by up to 44%. For more details,
please visit Shunra’s APE blog, “Mobile performance engineering rules for the iPhone.”
Summary for HTTP://WWW.GOOGLE.COM
Overall page performance score: A 92/100 points
Rule Performance score
Optimizing Caching
Add Expires headers C 78/100 points
Minimizing Round-trips
Make fewer HTTP requests A 100/100 points
Avoid URL redirects A 100/100 points
Avoid empty src or href A 100/100 points
Remove duplicate JavaScript and CSS A 100/100 points
Mobile Application Performance Report:
Performance Predictions, Analysis and Recommendations
www.shunra.com 1.877.474.8672 11 of 18
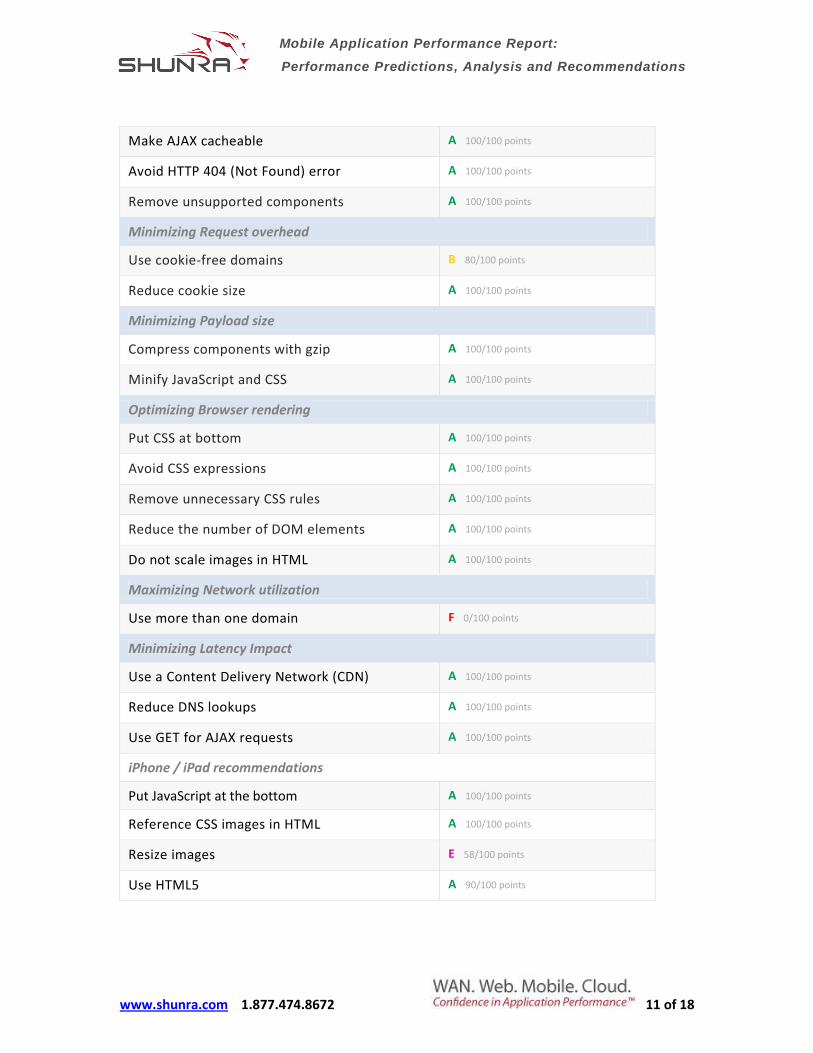
Make AJAX cacheable A 100/100 points
Avoid HTTP 404 (Not Found) error A 100/100 points
Remove unsupported components A 100/100 points
Minimizing Request overhead
Use cookie-free domains B 80/100 points
Reduce cookie size A 100/100 points
Minimizing Payload size
Compress components with gzip A 100/100 points
Minify JavaScript and CSS A 100/100 points
Optimizing Browser rendering
Put CSS at bottom A 100/100 points
Avoid CSS expressions A 100/100 points
Remove unnecessary CSS rules A 100/100 points
Reduce the number of DOM elements A 100/100 points
Do not scale images in HTML A 100/100 points
Maximizing Network utilization
Use more than one domain F 0/100 points
Minimizing Latency Impact
Use a Content Delivery Network (CDN) A 100/100 points
Reduce DNS lookups A 100/100 points
Use GET for AJAX requests A 100/100 points
iPhone / iPad recommendations
Put JavaScript at the bottom A 100/100 points
Reference CSS images in HTML A 100/100 points
Resize images E 58/100 points
Use HTML5 A 90/100 points
Mobile Application Performance Report:
Performance Predictions, Analysis and Recommendations
www.shunra.com 1.877.474.8672 12 of 18
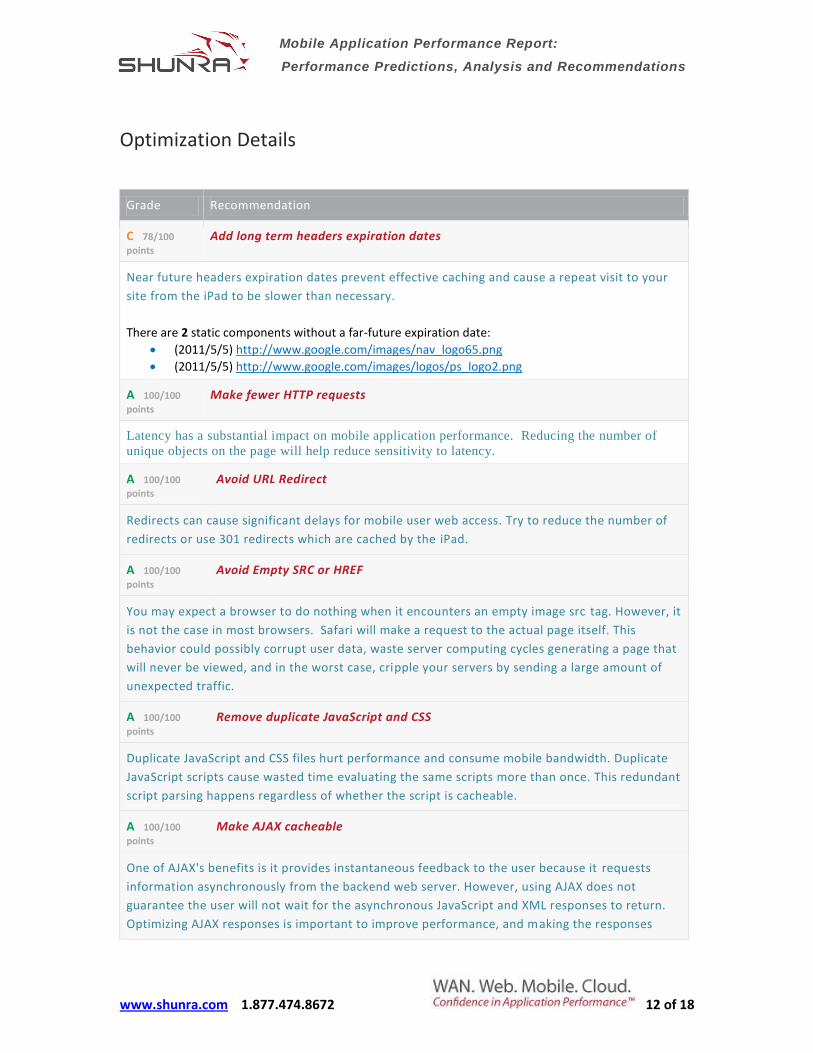
Optimization Details
Grade Recommendation
C 78/100
points Add long term headers expiration dates
Near future headers expiration dates prevent effective caching and cause a repeat visit to your
site from the iPad to be slower than necessary.
There are 2 static components without a far-future expiration date:
(2011/5/5) http://www.google.com/images/nav_logo65.png
(2011/5/5) http://www.google.com/images/logos/ps_logo2.png
A 100/100
points Make fewer HTTP requests
Latency has a substantial impact on mobile application performance. Reducing the number of
unique objects on the page will help reduce sensitivity to latency.
A 100/100
points Avoid URL Redirect
Redirects can cause significant delays for mobile user web access. Try to reduce the number of
redirects or use 301 redirects which are cached by the iPad.
A 100/100
points Avoid Empty SRC or HREF
You may expect a browser to do nothing when it encounters an empty image src tag. However, it
is not the case in most browsers. Safari will make a request to the actual page itself. This
behavior could possibly corrupt user data, waste server computing cycles generating a page that
will never be viewed, and in the worst case, cripple your servers by sending a large amount of
unexpected traffic.
A 100/100
points Remove duplicate JavaScript and CSS
Duplicate JavaScript and CSS files hurt performance and consume mobile bandwidth. Duplicate
JavaScript scripts cause wasted time evaluating the same scripts more than once. This redundant
script parsing happens regardless of whether the script is cacheable.
A 100/100
points Make AJAX cacheable
One of AJAX's benefits is it provides instantaneous feedback to the user because it requests
information asynchronously from the backend web server. However, using AJAX does not
guarantee the user will not wait for the asynchronous JavaScript and XML responses to return.
Optimizing AJAX responses is important to improve performance, and making the responses
Mobile Application Performance Report:
Performance Predictions, Analysis and Recommendations
www.shunra.com 1.877.474.8672 13 of 18
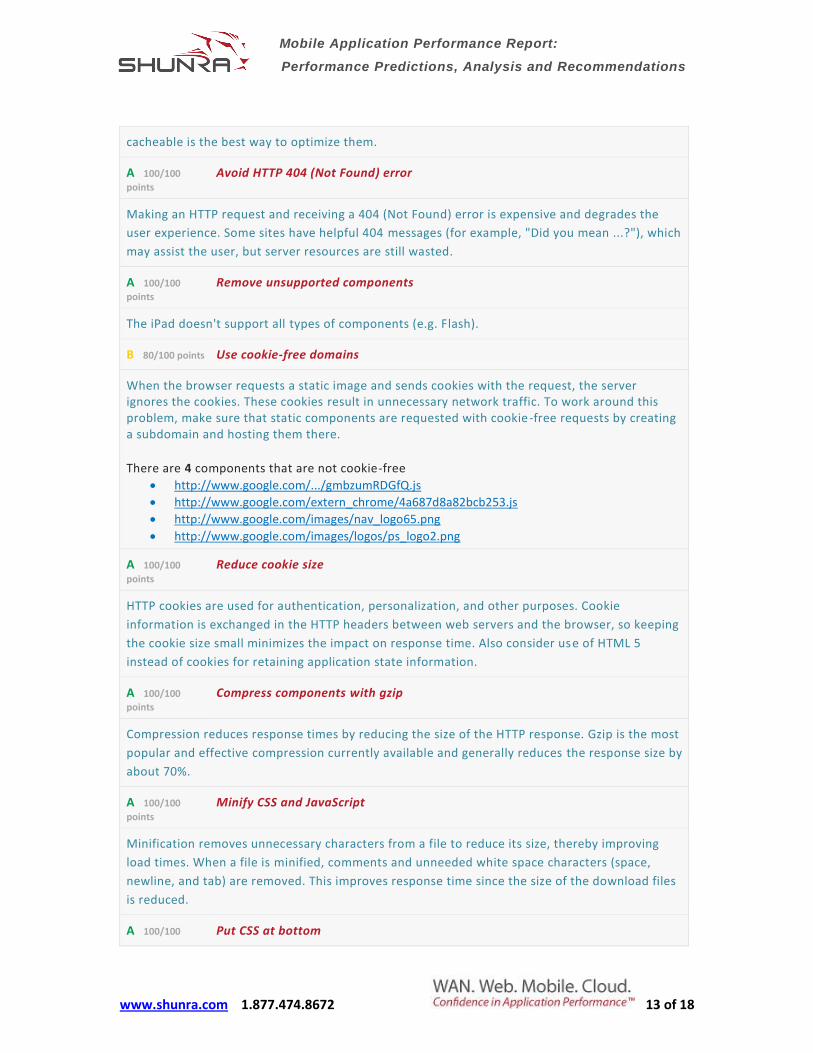
cacheable is the best way to optimize them.
A 100/100
points Avoid HTTP 404 (Not Found) error
Making an HTTP request and receiving a 404 (Not Found) error is expensive and degrades the
user experience. Some sites have helpful 404 messages (for example, "Did you mean ...?"), which
may assist the user, but server resources are still wasted.
A 100/100
points Remove unsupported components
The iPad doesn't support all types of components (e.g. Flash).
B 80/100 points Use cookie-free domains
When the browser requests a static image and sends cookies with the request, the server ignores the cookies. These cookies result in unnecessary network traffic. To work around this problem, make sure that static components are requested with cookie-free requests by creating a subdomain and hosting them there.
There are 4 components that are not cookie-free
http://www.google.com/.../gmbzumRDGfQ.js
http://www.google.com/extern_chrome/4a687d8a82bcb253.js
http://www.google.com/images/nav_logo65.png
http://www.google.com/images/logos/ps_logo2.png
A 100/100
points Reduce cookie size
HTTP cookies are used for authentication, personalization, and other purposes. Cookie
information is exchanged in the HTTP headers between web servers and the browser, so keeping
the cookie size small minimizes the impact on response time. Also consider use of HTML 5
instead of cookies for retaining application state information.
A 100/100
points Compress components with gzip
Compression reduces response times by reducing the size of the HTTP response. Gzip is the most
popular and effective compression currently available and generally reduces the response size by
about 70%.
A 100/100
points Minify CSS and JavaScript
Minification removes unnecessary characters from a file to reduce its size, thereby improving
load times. When a file is minified, comments and unneeded white space characters (space,
newline, and tab) are removed. This improves response time since the size of the download files
is reduced.
A 100/100 Put CSS at bottom
Mobile Application Performance Report:
Performance Predictions, Analysis and Recommendations
www.shunra.com 1.877.474.8672 14 of 18
points
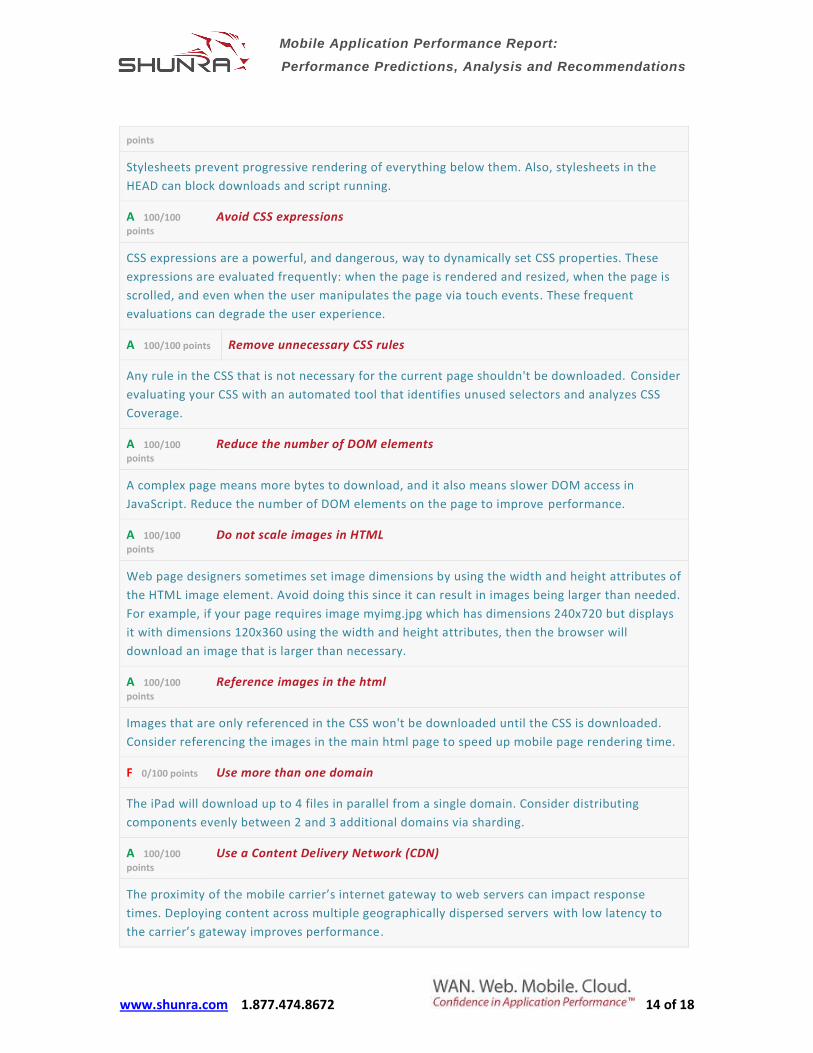
Stylesheets prevent progressive rendering of everything below them. Also, stylesheets in the
HEAD can block downloads and script running.
A 100/100
points Avoid CSS expressions
CSS expressions are a powerful, and dangerous, way to dynamically set CSS properties. These
expressions are evaluated frequently: when the page is rendered and resized, when the page is
scrolled, and even when the user manipulates the page via touch events. These frequent
evaluations can degrade the user experience.
A 100/100 points Remove unnecessary CSS rules
Any rule in the CSS that is not necessary for the current page shouldn't be downloaded. Consider
evaluating your CSS with an automated tool that identifies unused selectors and analyzes CSS
Coverage.
A 100/100
points Reduce the number of DOM elements
A complex page means more bytes to download, and it also means slower DOM access in
JavaScript. Reduce the number of DOM elements on the page to improve performance.
A 100/100
points Do not scale images in HTML
Web page designers sometimes set image dimensions by using the width and height attributes of
the HTML image element. Avoid doing this since it can result in images being larger than needed.
For example, if your page requires image myimg.jpg which has dimensions 240x720 but displays
it with dimensions 120x360 using the width and height attributes, then the browser will
download an image that is larger than necessary.
A 100/100
points Reference images in the html
Images that are only referenced in the CSS won't be downloaded until the CSS is downloaded.
Consider referencing the images in the main html page to speed up mobile page rendering time.
F 0/100 points Use more than one domain
The iPad will download up to 4 files in parallel from a single domain. Consider distributing
components evenly between 2 and 3 additional domains via sharding.
A 100/100
points Use a Content Delivery Network (CDN)
The proximity of the mobile carrier’s internet gateway to web servers can impact response
times. Deploying content across multiple geographically dispersed servers with low latency to
the carrier’s gateway improves performance.
Mobile Application Performance Report:
Performance Predictions, Analysis and Recommendations
www.shunra.com 1.877.474.8672 15 of 18
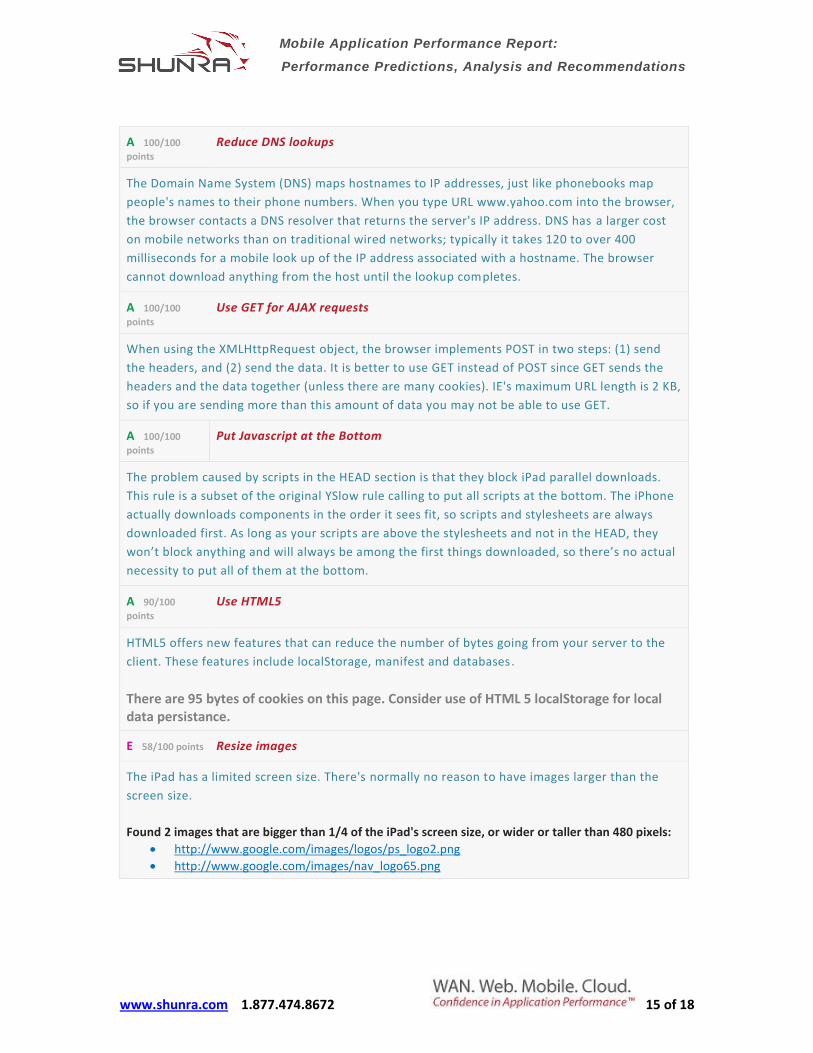
A 100/100
points Reduce DNS lookups
The Domain Name System (DNS) maps hostnames to IP addresses, just like phonebooks map
people's names to their phone numbers. When you type URL www.yahoo.com into the browser,
the browser contacts a DNS resolver that returns the server's IP address. DNS has a larger cost
on mobile networks than on traditional wired networks; typically it takes 120 to over 400
milliseconds for a mobile look up of the IP address associated with a hostname. The browser
cannot download anything from the host until the lookup completes.
A 100/100
points Use GET for AJAX requests
When using the XMLHttpRequest object, the browser implements POST in two steps: (1) send
the headers, and (2) send the data. It is better to use GET instead of POST since GET sends the
headers and the data together (unless there are many cookies). IE's maximum URL length is 2 KB,
so if you are sending more than this amount of data you may not be able to use GET.
A 100/100
points Put Javascript at the Bottom
The problem caused by scripts in the HEAD section is that they block iPad parallel downloads.
This rule is a subset of the original YSlow rule calling to put all scripts at the bottom. The iPhone
actually downloads components in the order it sees fit, so scripts and stylesheets are always
downloaded first. As long as your scripts are above the stylesheets and not in the HEAD, they
won’t block anything and will always be among the first things downloaded, so there’s no actual
necessity to put all of them at the bottom.
A 90/100
points Use HTML5
HTML5 offers new features that can reduce the number of bytes going from your server to the
client. These features include localStorage, manifest and databases.
There are 95 bytes of cookies on this page. Consider use of HTML 5 localStorage for local data persistance.
E 58/100 points Resize images
The iPad has a limited screen size. There's normally no reason to have images larger than the
screen size.
Found 2 images that are bigger than 1/4 of the iPad's screen size, or wider or taller than 480 pixels:
http://www.google.com/images/logos/ps_logo2.png
http://www.google.com/images/nav_logo65.png

Mobile Application Performance Report:
Performance Predictions, Analysis and Recommendations
www.shunra.com 1.877.474.8672 16 of 18
Improve mobile user experience with Shunra
Shunra PerformanceSuite enables you to easily test performance of your website or application using our mobile emulation library, our ability to monitor and record real-world network conditions, and powerful performance analytics to validate user performance based on actual wireless network performance scenarios.
With the Shunra PerformanceSuite, you can deploy applications and make infrastructure changes with confidence:
Gain accurate insight into production network conditions and precisely replay those conditions in the test lab
Discover network related performance bottlenecks before you launch your website
Achieve service level objectives from keyboard to eyeball Accurately compare the performance of different versions of your site or
application Simulate projected peak seasonal traffic loads Test and validate infrastructure and software "fixes" under production
conditions – before going live
Shunra PerformanceSuite is available in different editions to meet your specific application performance engineering needs. Please contact Shunra at [email protected] or 1.877.474.8672 for more information.
Mobile Application Performance Report:
Performance Predictions, Analysis and Recommendations
www.shunra.com 1.877.474.8672 17 of 18
APPENDIX 1: Mobile Application Performance Test
Methodology
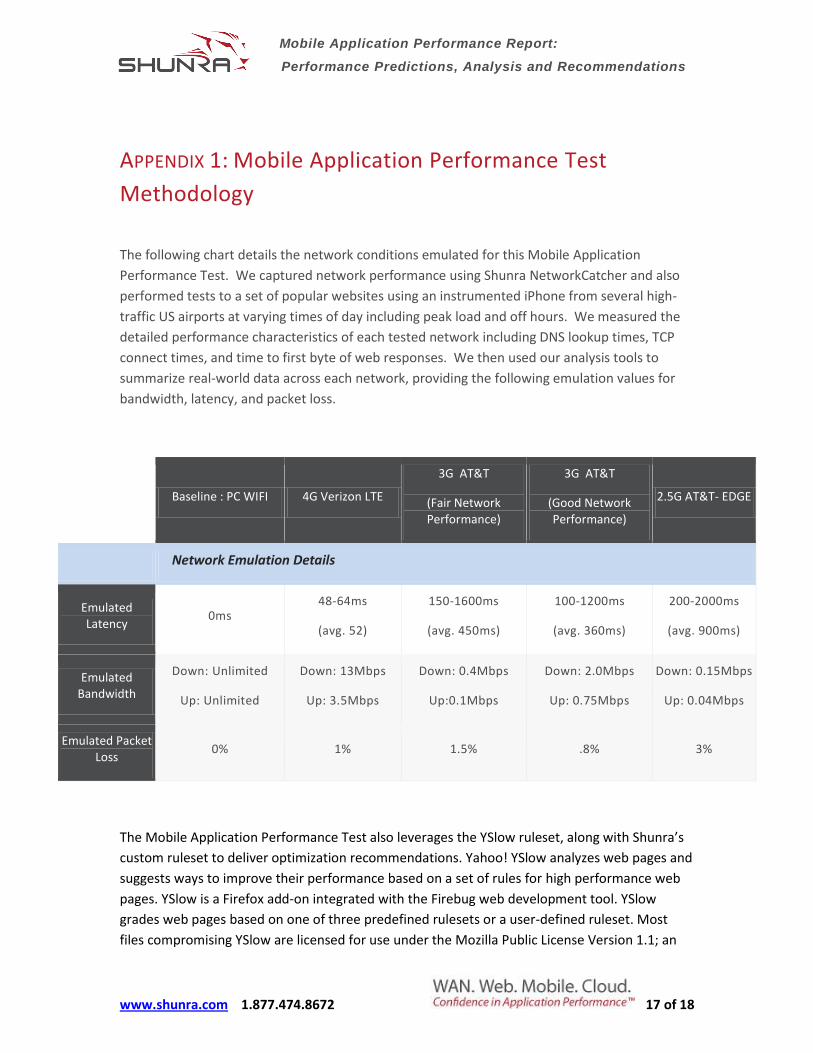
The following chart details the network conditions emulated for this Mobile Application
Performance Test. We captured network performance using Shunra NetworkCatcher and also
performed tests to a set of popular websites using an instrumented iPhone from several high-
traffic US airports at varying times of day including peak load and off hours. We measured the
detailed performance characteristics of each tested network including DNS lookup times, TCP
connect times, and time to first byte of web responses. We then used our analysis tools to
summarize real-world data across each network, providing the following emulation values for
bandwidth, latency, and packet loss.
Baseline : PC WIFI 4G Verizon LTE
3G AT&T
(Fair Network Performance)
3G AT&T
(Good Network Performance)
2.5G AT&T- EDGE
Network Emulation Details
Emulated Latency
0ms 48-64ms
(avg. 52)
150-1600ms
(avg. 450ms)
100-1200ms
(avg. 360ms)
200-2000ms
(avg. 900ms)
Emulated Bandwidth
Down: Unlimited
Up: Unlimited
Down: 13Mbps
Up: 3.5Mbps
Down: 0.4Mbps
Up:0.1Mbps
Down: 2.0Mbps
Up: 0.75Mbps
Down: 0.15Mbps
Up: 0.04Mbps
Emulated Packet Loss
0% 1% 1.5% .8% 3%
The Mobile Application Performance Test also leverages the YSlow ruleset, along with Shunra’s
custom ruleset to deliver optimization recommendations. Yahoo! YSlow analyzes web pages and
suggests ways to improve their performance based on a set of rules for high performance web
pages. YSlow is a Firefox add-on integrated with the Firebug web development tool. YSlow
grades web pages based on one of three predefined rulesets or a user-defined ruleset. Most
files compromising YSlow are licensed for use under the Mozilla Public License Version 1.1; an
Mobile Application Performance Report:
Performance Predictions, Analysis and Recommendations
www.shunra.com 1.877.474.8672 18 of 18
online version of the license agreement is available at developer.yahoo.com/YSlow/license.html.
YSlow includes jslint by Douglas Crockford, which is licensed under a BSD-style license. YSlow
also includes files from the Yahoo! User Interface library, which are licensed under the BSD
license.
© 2011, Shunra Software. All rights reserved. Shunra, the Shunra logo, PerformanceSuite, and NetworkCatcher are
trademarks or registered trademarks of Shunra Software.
Report generated by Shunra mobile test system version 1.0.0.63 using Shunra vCat 7.0


![Performance in Android: Tips and Techniques [IndicThreads Mobile Application Development Conference]](https://img.pdfslide.us/doc/110x75/559b66ee1a28ab2b3c8b47d3/performance-in-android-tips-and-techniques-indicthreads-mobile-application-development-conference.jpg)