Embed Size (px)
Citation preview
Mobile Access, National Voice Calls and SMS
Market Assessment
30 January 2015
Prepared for:
Version 1.1
Cartesian: Mobile Access, National Voice Calls and SMS
Copyright © 2015 Cartesian Ltd. All rights reserved. 1
Version History
Version Date Author Changes Distribution Approval
1.1 30/1/15 Cartesian Final version incorporating UCC feedback UCC T Twinemanzi
Confidentiality
This document and the information contained herein are private and confidential, and are solely
for the use of the Uganda Communications Commission.
Copyright
The contents of this document are copyright © 2015 Cartesian Ltd. All rights reserved.
The information contained herein is the property of Cartesian and is provided on condition that
it will not be reproduced, copied, lent, or disclosed, directly or indirectly, nor used for any
purpose other than that for which it was specifically furnished.
Cartesian Ltd. Registered in England and Wales. Registered Number: 03230513
Registered Office Address: Descartes House, 8 Gate Street, London WC2A 3HP United Kingdom

Cartesian: Mobile Access, National Voice Calls and SMS
Copyright © 2015 Cartesian Ltd. All rights reserved. 2
Table of Contents
1 Executive Summary ............................................................................................................... 5
Overview of market performance .................................................................................... 5
Key findings regarding market structure .......................................................................... 7
SMP assessment conclusions ........................................................................................... 7
2 Introduction ........................................................................................................................... 8
3 Market Definition .................................................................................................................. 8
4 Assessment of market performance ..................................................................................... 9
Service Penetration and Growth ...................................................................................... 9
Calling and SMS Usage ................................................................................................... 13
Retail Prices .................................................................................................................... 15
Industry Revenue ........................................................................................................... 18
Service Quality ................................................................................................................ 19
Innovation ...................................................................................................................... 21
Market Performance Assessment Conclusions .............................................................. 21
5 Market Structure Assessment ............................................................................................. 21
Market Concentration .................................................................................................... 21
Network Effects .............................................................................................................. 24
Other barriers to entry ................................................................................................... 27
Sunk Costs ...................................................................................................................... 28
Economies of Scale ......................................................................................................... 29
Economies of Scope ....................................................................................................... 30
Extent of Vertical Integration ......................................................................................... 31
Market Structure Assessment Conclusions .................................................................... 32
6 Market Conduct Assessment ............................................................................................... 34
Scale and Ability to Access Resources ............................................................................ 34
Control of Essential Upstream Inputs ............................................................................ 35
Access to Sales and Distribution Channels ..................................................................... 37
Transparency of Retail Consumer Information .............................................................. 38
Ease of Consumer Switching .......................................................................................... 39
Countervailing Buyer Power ........................................................................................... 40
Evidence of Dynamic Competition ................................................................................. 40
Potential for Market Growth .......................................................................................... 41
Market Conduct Assessment Conclusions ..................................................................... 42
Cartesian: Mobile Access, National Voice Calls and SMS
Copyright © 2015 Cartesian Ltd. All rights reserved. 3
7 Basic Market Conditions ...................................................................................................... 43
Technology ..................................................................................................................... 43
Cost Conditions............................................................................................................... 46
Basic Market Conditions Conclusions............................................................................. 48
8 Overall Conclusion of SMP Assessment .............................................................................. 48
Cartesian: Mobile Access, National Voice Calls and SMS
Copyright © 2015 Cartesian Ltd. All rights reserved. 4
List of Figures
Number of Subscriptions and Market Share in Uganda by CSP, 2014 ..................... 7
Mobile Subscriptions in Uganda, Q4 2011 – Q2 2014 ............................................ 10
Mobile Penetration in Uganda, Q4 2011 – Q2 2014 .............................................. 10
Mobile Penetration in Selected Countries and Regions, 2014 ............................... 11
Uganda Key Demographic data, 2014 .................................................................... 11
Total Voice Traffic in Uganda (million minutes), 2008 - 2014 ................................ 13
SMS usage and pricing in selected African countries, 2014 ................................... 14
SMS/Voice Minutes Ratio for selected countries and regions, 2014 ..................... 14
Retail Prices for Voice Calls and SMS in Uganda, Q3 2014 ..................................... 15
Mobile Voice Tariff Evolution (UGX/min), 2006 – 2014 ......................................... 16
Average Price of Calls (USD cent/min) and SMS (USD cents/text) in Selected
African Countries, 2014 .......................................................................................... 17
Retail prices and Implied Network Costs in Uganda (UGX), June 2014 .................. 17
Mobile Service Revenue in Uganda, 2012 - 2019 ................................................... 18
Call Drop Rate in Uganda, 1H 2013 - 1H 2014 ........................................................ 19
Blocked Call Rate in Uganda, 2H 2013 – 1H 2014 .................................................. 20
Mobile Subscriptions Market Share in Uganda, 2011 – 2014 ................................ 22
Market Concentration (HHI) in Uganda Retail Mobile Services, 2011 – 2014 ....... 23
Mobile Originated Traffic Market Share in Uganda, 2012 – 2014 .......................... 24
Average Monthly Originated Traffic by Subscriptions, 2014 .................................. 25
Mobile Money Market Share, 2014 ........................................................................ 26
Financial Results from Multinational CSPs present in Uganda, 2013 ..................... 34
Mobile Subscriptions Forecast in Uganda, 2011 – 2019 ........................................ 41
Mobile Money Subscriptions, Dec 2010 – Jun 2014 ............................................... 42
Mobile Technology Framework for Originating and Terminating Calls and SMS ... 43
Spectrum Allocation Status in Uganda (GSM Bands), Q3 2014 .............................. 45
Reference Interconnection Rate (UGX), 2012 ........................................................ 47
Cartesian: Mobile Access, National Voice Calls and SMS
Copyright © 2015 Cartesian Ltd. All rights reserved. 5
1 Executive Summary
1.1 This document sets out an assessment of whether or not there is effective competition in the market
for mobile access, national voice calls and SMS within Uganda, ("mobile calling and SMS market")
particularly whether or not one or more communications service providers (CSPs) have significant
market power (SMP). A firm or group of firms with SMP have the potential to either increase price
above and/or reduce output below the competitive level. It follows that consumers will benefit less
in a market where CSPs exercise SMP compared with a market in which competition is effective.
1.2 Mobile calling and SMS services are supplied in Uganda by Airtel, MTN, Orange, Sure Telecom, Uganda
Telecom and K2. Of these firms: Airtel, MTN, Orange, Uganda Telecom and Sure Telecom are mobile
network operators (MNOs); and, K2 is a mobile virtual network operator (MVNO) with a wholesale
supply agreement with Orange.
Overview of market performance
1.3 The mobile calling and SMS market is important not only for the country’s telecom sector but also for
the wider Ugandan economy and society. In particular, it provides the main means of communication
for a greater part of the population.
1.4 With respect to market penetration and growth, it was found that:
There were 19M mobile "subscriptions" as at June 2014, where "subscriptions" are
measured by the number of active SIMs;
It is been estimated that each user of the mobile call and SMS services has on average 1.5
SIM cards, which implies that even though there are 19M subscriptions there is likely to be
closer to 12 million actual users of mobile calling and SMS services;
Expressed as a percentage of the population, the number of subscriptions (active SIMs) for
mobile calling and SMS services equates to 50% of the population. This implies, however,
that the estimated penetration by unique mobile user in Uganda is approximately 33% of
the population (because each user has approximately 1.5 SIMs) and hence 67% of the
population do not have a mobile subscription;
The number of mobile calling and SMS subscriptions has increased by 7% per annum on
average between 2011 and 2014. But, this does not imply that the number of users has
increased by 7% per annum between 2011 and 2014. This observed 7% per annum growth
in subscriptions can attributed a growth in the average number of SIMs per user from
approximately 1.22 per user in 2011 to approximately 1.5 per user; and
The total voice traffic in Uganda decreased slightly between 2012/13 and 2013/14, which
suggests that there has been no growth over this period. This observation is consistent
with the proposition that observed growth in the number of subscriptions is caused by
existing subscribers purchasing an additional SIM rather the additional users subscribing
to a mobile calling and SMS service.
1.5 In summary, the evidence indicates that over the past three years there has been little if any increase
in the number of users of mobile calling and SMS services, and that any observed growth in
subscriptions is likely to be due to existing users purchasing additional SIM cards. This observation is
Cartesian: Mobile Access, National Voice Calls and SMS
Copyright © 2015 Cartesian Ltd. All rights reserved. 6
of concern in its own right given that it suggests that growth in the market for mobile calling and SMS
services has slowed and new users are not benefiting from these services.
1.6 Regarding the pricing of mobile calling and SMS services:
Prepaid subscriptions account for 99% of total mobile subscriptions in Uganda;
The CSPs offer call price plans that in include significant discounts for calls made by their
customers to other customers that subscribe to the same CSP network, i.e. on-net calls,
compared with calls made by their customers to customers of other CSPs, i.e. off-net calls;
As a result of this discount between on-net and off-net pricing, many consumers buy a
number of SIM cards in order to access different CSP networks and swap between these
SIM cards depending which network the person they wish to contact subscribes to. This is
the reason that each user of mobile calling and SMS services has approximately 1.5 SIM
cards;
Another effect of the on-net and off-net call pricing is that the majority of calls in Uganda
are on-net; for four of the six CSPs, on-net calls account for more than 80% of all calls made
on their networks;
From 2012 to 2013, both on-net and off-net call prices increased; and
Handset prices, including non-smartphone handsets, are expensive for a significant
proportion of the population, which acts to limit the uptake of mobile calling and SMS
services.
1.7 The above observations regarding the pricing of calling and SMS indicates that on-net and off-net
pricing has a significant bearing on consumer behaviour. This observation on its own does not
necessarily imply that on-net and off-net pricing is promotes competition or harms competition. Its
effect on competition can only be determined following consideration of other factors.
1.8 Another service that utilizes on-net and off-net pricing, and that has become important for consumers,
is mobile money. Even though mobile money is not included in the mobile calling and SMS market it
has been included in the SMP assessment of the market because users access both sets of services
using their SIM card. CSPs therefore have a technical mechanism for bundling mobile money with
mobile access, voice and SMS. With respect to the pricing of mobile money services:
CSPs bundle together mobile money services with calling and SMS services; and
CSPs offer pricing plans that differentiate between mobile money transactions that are
between users that on-net and those that off-net, particular offering a discount for on-net
transactions compared with off-net transactions.
1.9 Our concern with on-net and off-net pricing across calling, SMS and mobile money service is that it
may create a barrier or increase the cost of entrants competing with those operators with established
presence in the market and large market shares. Whether or not these retail prices create a barrier
for entrants to compete will depend on the prices CSPs charge other CSPs for interconnection to their
networks.
Cartesian: Mobile Access, National Voice Calls and SMS
Copyright © 2015 Cartesian Ltd. All rights reserved. 7
Key findings regarding market structure
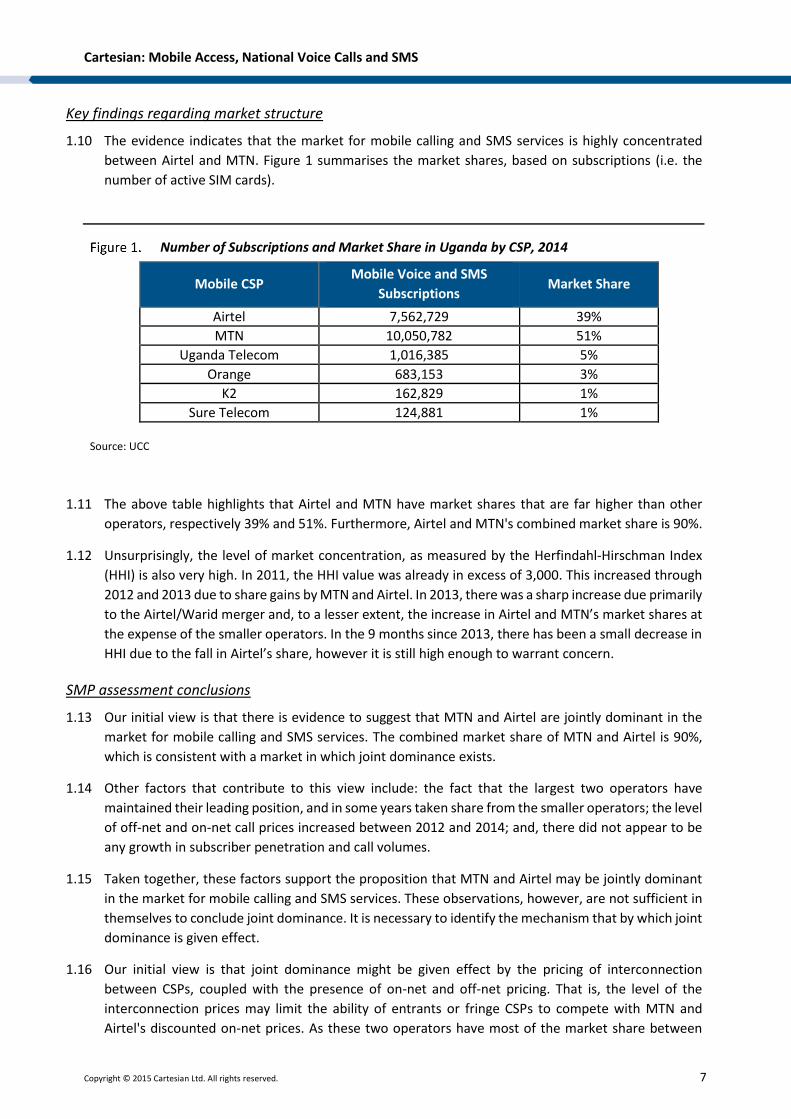
1.10 The evidence indicates that the market for mobile calling and SMS services is highly concentrated
between Airtel and MTN. Figure 1 summarises the market shares, based on subscriptions (i.e. the
number of active SIM cards).
Number of Subscriptions and Market Share in Uganda by CSP, 2014
Mobile CSP Mobile Voice and SMS
Subscriptions Market Share
Airtel 7,562,729 39%
MTN 10,050,782 51%
Uganda Telecom 1,016,385 5%
Orange 683,153 3%
K2 162,829 1%
Sure Telecom 124,881 1%
Source: UCC
1.11 The above table highlights that Airtel and MTN have market shares that are far higher than other
operators, respectively 39% and 51%. Furthermore, Airtel and MTN's combined market share is 90%.
1.12 Unsurprisingly, the level of market concentration, as measured by the Herfindahl-Hirschman Index
(HHI) is also very high. In 2011, the HHI value was already in excess of 3,000. This increased through
2012 and 2013 due to share gains by MTN and Airtel. In 2013, there was a sharp increase due primarily
to the Airtel/Warid merger and, to a lesser extent, the increase in Airtel and MTN’s market shares at
the expense of the smaller operators. In the 9 months since 2013, there has been a small decrease in
HHI due to the fall in Airtel’s share, however it is still high enough to warrant concern.
SMP assessment conclusions
1.13 Our initial view is that there is evidence to suggest that MTN and Airtel are jointly dominant in the
market for mobile calling and SMS services. The combined market share of MTN and Airtel is 90%,
which is consistent with a market in which joint dominance exists.
1.14 Other factors that contribute to this view include: the fact that the largest two operators have
maintained their leading position, and in some years taken share from the smaller operators; the level
of off-net and on-net call prices increased between 2012 and 2014; and, there did not appear to be
any growth in subscriber penetration and call volumes.
1.15 Taken together, these factors support the proposition that MTN and Airtel may be jointly dominant
in the market for mobile calling and SMS services. These observations, however, are not sufficient in
themselves to conclude joint dominance. It is necessary to identify the mechanism that by which joint
dominance is given effect.
1.16 Our initial view is that joint dominance might be given effect by the pricing of interconnection
between CSPs, coupled with the presence of on-net and off-net pricing. That is, the level of the
interconnection prices may limit the ability of entrants or fringe CSPs to compete with MTN and
Airtel's discounted on-net prices. As these two operators have most of the market share between
Cartesian: Mobile Access, National Voice Calls and SMS
Copyright © 2015 Cartesian Ltd. All rights reserved. 8
them, the majority of calls made by customers of the fringe CSPs would be terminated on either
Airtel's and MTN's networks (i.e. off-net), whereas calls made by customers connected to either
Airtel's or MTN's networks are more likely on-net. Therefore, if the level of the interconnection prices
sufficiently high it may limit CSPs off-net prices to compete with Airtel's and MTN's on-net prices.
2 Introduction
2.1 The purpose of this document is to set out an assessment of whether or not there is effective
competition in market for mobile access, national voice calls and SMS within Uganda, ("mobile calling
and SMS market"), particularly whether or not one or more cellular service providers (CSPs) have
significant market power (SMP).
2.2 CSPs with SMP have the potential to increase price or reduce output below the competitive level. This
implies that customers would not derive the same levels of benefits from mobile calling and SMS
service as they would if there were effective competition. Therefore, it is important to identify
whether or not firms have SMP.
2.3 If one or more CSPs are found to have SMP, then it may be appropriate to introduce regulatory
measures. Properly designed and implemented, regulatory measures can ameliorate SMP and thus
enhance market performance and economic efficiency in the relevant market.
2.4 This assessment commences with a description of the definition of the mobile calling and SMS market.
This is followed by an assessment of the market performance focusing on the number in subscriptions,
total volume of usage, and pricing structure and levels, amongst other factors. Market structure is
then examined, which addresses recent developments and the concentration of market shares
amongst CSPs. This is followed by an assessment of the conduct of CSPs in the market, and in turn a
description of the basic market conditions. This report concludes with our initial overall conclusions
regarding this assessment of SMP in the market for mobile access, national voice calls and SMS with
Uganda.
3 Market Definition
3.1 The relevant market for mobile calling and SMS is defined in the report prepared by Cartesian, for the
Uganda Communications Commission (UCC), Review of Uganda Communications Markets: Relevant
Markets Report, dated 29th October 2014 (the “Relevant Markets Report”). The Relevant Markets
Report identifies the mobile voice and SMS market as a priority for SMP assessment.
3.2 The key features of the mobile calling and SMS market identified in the Relevant Markets Report are:
The mobile calling and SMS market is a retail market;
The mobile calling and SMS product includes subscription to a Ugandan mobile network;
The consumer’s mobile device is connected to a mobile network, which for the avoidance
of doubt excludes fixed-wireless networks;
Consumers can make voice calls using their mobile device that is connected to the mobile
network that are carried over the PSTN and terminate within Uganda, which for avoidance
of doubt excludes VoIP calls made over the internet using an over-the-top service provider;
Cartesian: Mobile Access, National Voice Calls and SMS
Copyright © 2015 Cartesian Ltd. All rights reserved. 9
Consumers can receive calls by their mobile device connected to the mobile network;
Consumers can send and receive SMS messages using their mobile device that is connected
to the mobile network;
The retail market includes calling and SMS services and price plans offered to business and
residential customers; and
The geographic scope of the market encompasses the whole of the geographic region of
Uganda and does not differentiate between different regions within Uganda.
3.3 Mobile calling and SMS services are supplied in Uganda by Airtel Uganda, MTN Uganda, Orange
Uganda, Sure Telecom, Uganda Telecom and K2 Telecom. Of these firms: Airtel Uganda, MTN Uganda,
Orange Uganda, Uganda Telecom and Sure Telecom are mobile network operators (MNOs); and, K2
Telecom is a mobile virtual network operator (MVNO) with a wholesale supply agreement with
Orange.
4 Assessment of market performance
Service Penetration and Growth
4.1 Mobile access is an important market not only to the country’s telecom sector but also to the wider
Ugandan economy and society. The market is the main means of communications for a great part of
the population.
4.2 Mobile services currently cover approximately 78% of the population. Most of the coverage is based
on GSM technology, with W-CDMA growing initially in large urban centres and reaching slowly into
rural areas.
4.3 Prepaid customers in Uganda represent 99% of the total subscriptions. Prepaid subscriptions allow
consumers to closely manage their spending on mobile services.
4.4 In June 2014, there were approximately 19M mobile subscriptions in Uganda, where subscriptions
are defined as the number active SIM cards. It has been estimated that currently each user of mobile
services has approximately 1.5 SIM cards. The main reason for the multi-SIM trend is the continuous
promotion of on-net calls. CSPs offer attractive rates for those calls that are originated and terminated
within the same network. As such, multi-SIM ownership is an important factor in the competitive
dynamics of the market.
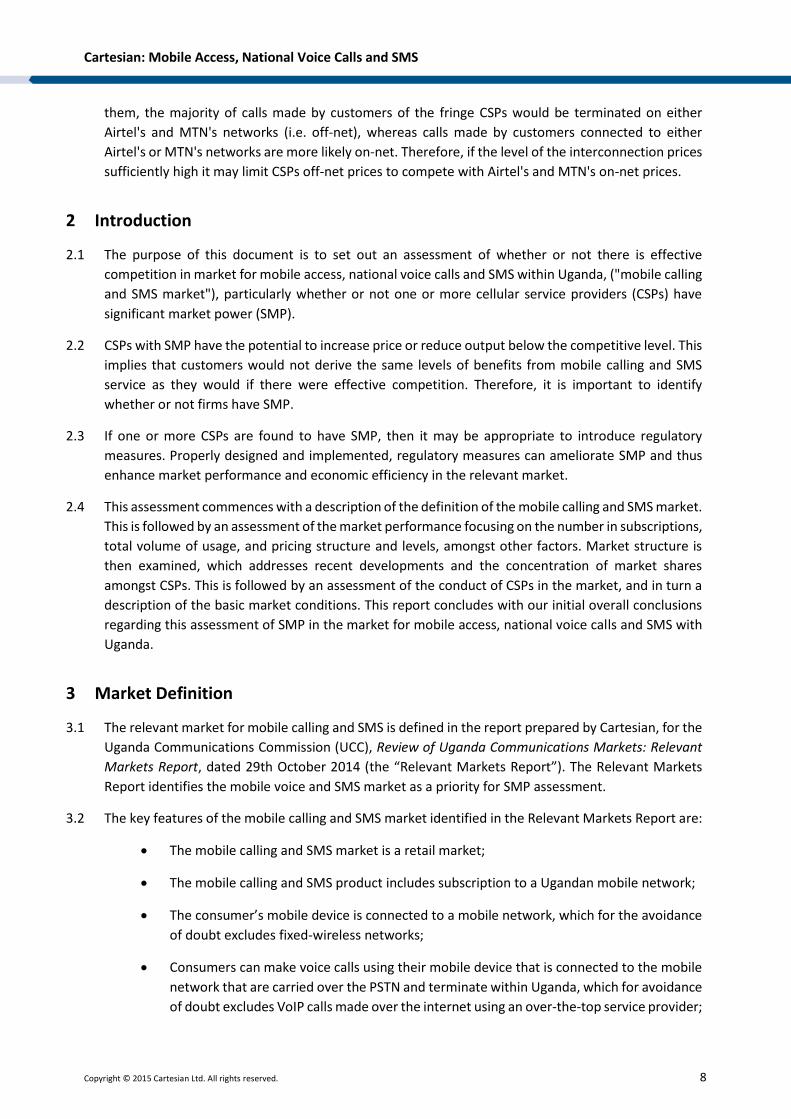
4.5 The volume of subscriptions is growing at a CAGR (2011-2014) of 7%, from 16.6M subscriptions in
2011 to 19M in the second quarter of 2014 (Figure 2). Some CSPs have rationalised their customer
base: disconnecting a number of inactive SIM cards, which reduced the total number of mobile
subscriptions in 2012.1 Prepaid subscriptions account for 99% of the total mobile subscriptions on the
country.2
1 SIM Card Registration in Uganda started on 1 February 2012. SIM cards which have not made or received a call for three months were weeded out. This had an impact on the number of reported subscriptions. . As such this had an impact on the decline in the subscriber base in the country. 2 Source: UCC, 2014.
Cartesian: Mobile Access, National Voice Calls and SMS
Copyright © 2015 Cartesian Ltd. All rights reserved. 10
Mobile Subscriptions in Uganda, Q4 2011 – Q2 2014
Source: UCC
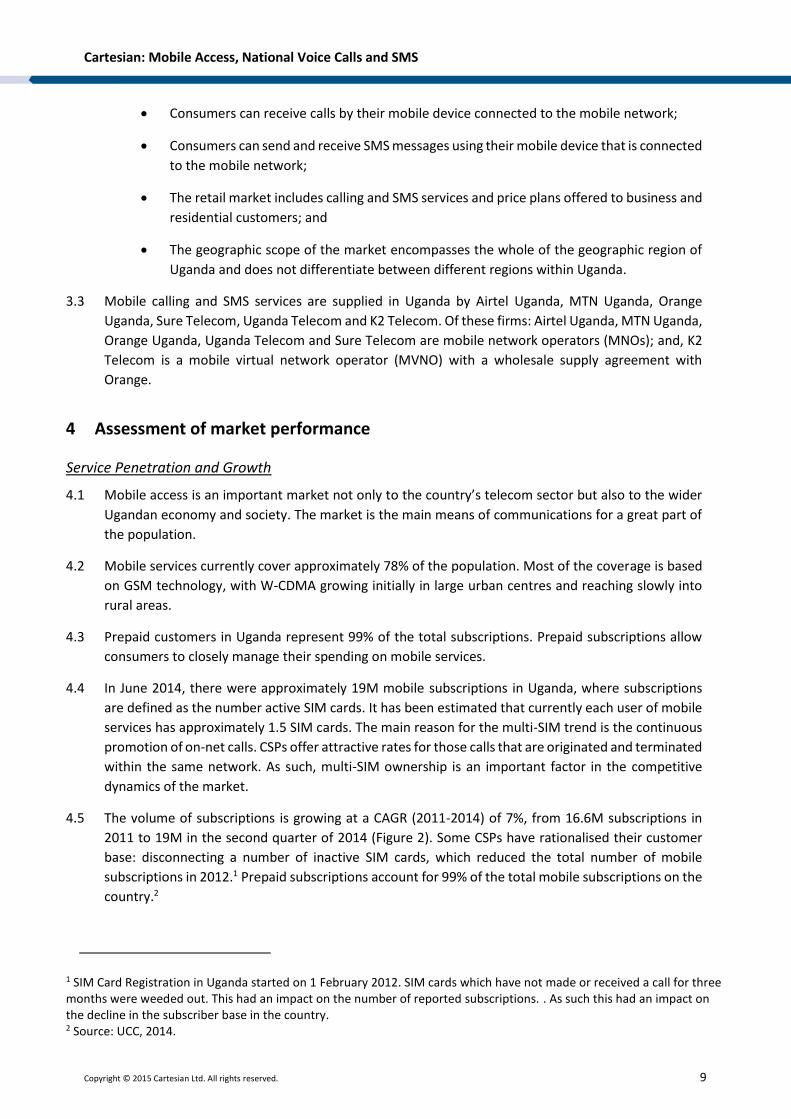
4.6 Measured as a proportion of the population, the penetration of subscriptions in Uganda has increased
over the last three years. In 2012, the service penetration was approximately 45%, reaching 50% in
2014 (see Figure 3).
Mobile Penetration in Uganda, Q4 2011 – Q2 2014
48%
45%
48%
50%
42%
43%
44%
45%
46%
47%
48%
49%
50%
51%
4Q11 4Q12 4Q13 2Q14
Source: UCC, World Bank and Cartesian
4.7 It seems likely that this observed growth in the subscriptions does not reflect actual growth in the
number of users of mobile services, but is being caused by existing subscribers purchasing additional
SIM cards. This proposition is supported by the evidence presented in Figure 6, which shows that the
volume in total voice traffic in Uganda did not grow between 2012/13 and 2013/14. If the number of
17 16
18
19
15
15
16
16
17
17
18
18
19
19
20
4Q11 4Q12 4Q13 2Q14
Mill
ion
s
Cartesian: Mobile Access, National Voice Calls and SMS
Copyright © 2015 Cartesian Ltd. All rights reserved. 11
actual users had increased over these years, then we expect that this would have resulted in an
increase in the volume of total voice traffic.
4.8 As noted above, it has been estimated that each user of the mobile call and SMS services has on
average 1.5 SIM cards. This implies that even though there are 19M subscriptions in 2014 there is
likely to be closer to 12 million actual users of mobile calling and SMS services. It follows, even though
the number of subscriptions (based on active SIMs) for mobile calling and SMS services equates to
50% of the population, the penetration in Uganda of mobile services is closer to 33% of the population,
and hence 67% do not have a mobile subscription. Furthermore, the observed average increase in
subscriptions between 2011 and 2014 of 7% per annum, can attributed a growth in the average
number of SIMs per user from approximately 1.22 per user in 2011 to approximately 1.5 per user in
2014.
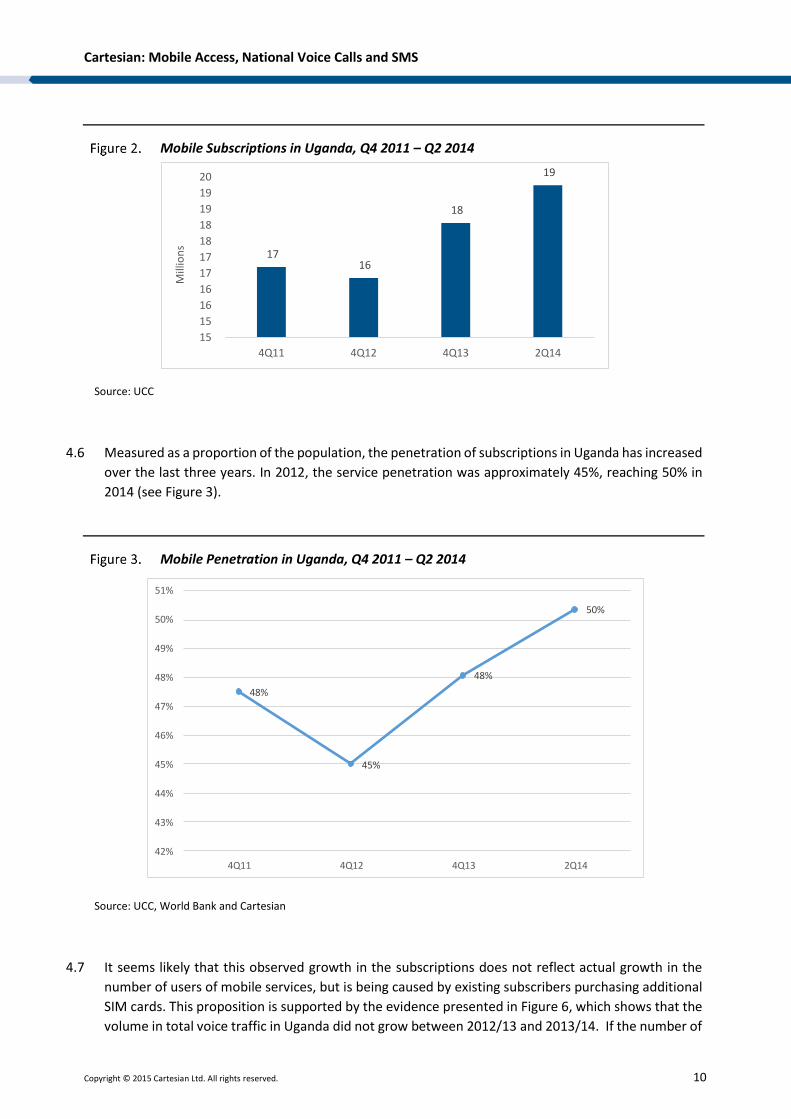
4.9 Uganda’s 50% mobile penetration of subscriptions, or in other words active SIMs, is relatively low
compared with the African average and other East African markets such as Tanzania and Kenya.
However, the Uganda penetration rate is still higher than the overall average for East Africa (see
Figure 4). Consequently, there is still potential to the service to grow and reach levels closer to the
average penetration in Africa.
Mobile Penetration in Selected Countries and Regions, 2014
Country Mobile
penetration Region
Mobile penetration
Uganda 50% East Africa 47%
Eritrea 7% Africa 79%
Ethiopia 26% Latin America 113%
Kenya 71% Asia 85%
Somalia 47%
Sudan 59%
Tanzania 55%
Source: UCC, Ovum
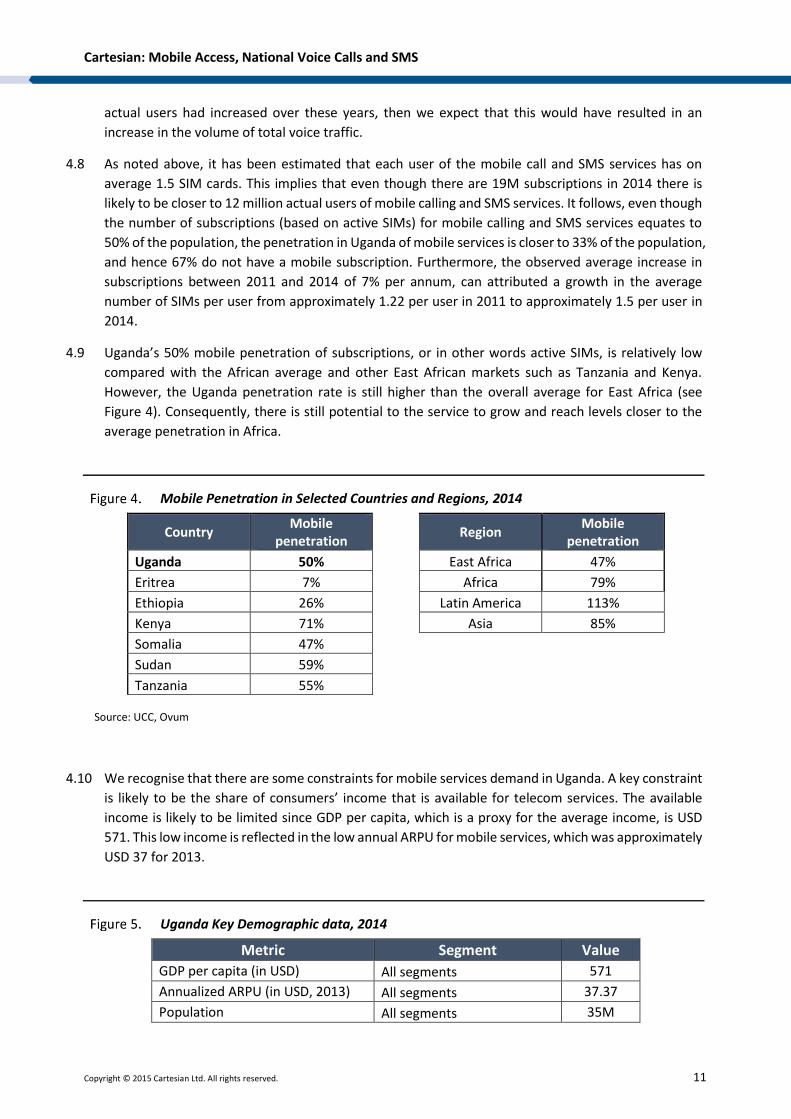
4.10 We recognise that there are some constraints for mobile services demand in Uganda. A key constraint
is likely to be the share of consumers’ income that is available for telecom services. The available
income is likely to be limited since GDP per capita, which is a proxy for the average income, is USD
571. This low income is reflected in the low annual ARPU for mobile services, which was approximately
USD 37 for 2013.
Uganda Key Demographic data, 2014
Metric Segment Value
GDP per capita (in USD) All segments 571
Annualized ARPU (in USD, 2013) All segments 37.37
Population All segments 35M
Cartesian: Mobile Access, National Voice Calls and SMS
Copyright © 2015 Cartesian Ltd. All rights reserved. 12
Rural population share over total All segments 87%
Percentage of population covered with GSM All Segments
70%
Population distribution
0-14 years 49%
15-24 years 21%
25-54 years 26%
55-64 years 2%
65 years and over 2%
Literacy (age 15 and over, who can read and write) All segments
73%
Source: World Bank, Ovum
4.11 Another factor that is likely to affect user uptake of mobile service is the price of handsets. Handset
prices (even for non-smartphones) are expensive for a significant share of the population. The ability
of CSPs to heavily subsidize handsets for prepaid users is limited due to the risk of churn. As the
Ugandan market is predominantly prepaid, the scope for handset subsidies to increase affordability
is therefore constrained.
4.12 The significant youth segment share of the population also inhibits the market growth due to the lack
of financial resources available to teenagers. 49% of the country’s population is formed by early
teenagers and children (population under 18 years old). Of those aged between 7 and 14 years old,
36% are already in some type of employment. Although this is a significant share of the youth
population that is economically active (i.e. has a job), the majority are without any type of
remuneration.
4.13 Moreover, those children and teenagers in employment are frequently responsible for helping to
support their family and will not spend much on themselves. Therefore, the available income to spend
on mobile services for this group will be limited.
4.14 With respect to network coverage, 30% of the population are currently not covered by mobile services.
Most of those without coverage are located in distant rural areas, where there is no commercial
justification for CSPs to build mobile networks. However, 70% of the population are within a GSM
network coverage, which implies that a significant number of consumers live in areas with coverage
but are not using the services.
4.15 Access to electricity is another constraint to mobile growth, since without electricity, consumers are
not able to charge their mobile phones. Only 14% of the Ugandan population is connected to the
electricity grid. Diesel generators are used as an alternative source of electricity by some.
4.16 Consumers represent the major customer segments for mobile services (almost 99% of subscriptions
for some CSPs).3 The majority of businesses in Uganda are non-registered or very small businesses.
Many of these businesses buy services using traditional consumer channels, even if the service usage
will be predominantly for business purposes.
3 Source: CSPs data, 2014.
Cartesian: Mobile Access, National Voice Calls and SMS
Copyright © 2015 Cartesian Ltd. All rights reserved. 13
4.17 Finally, in Uganda, only 20% of the population has access to a bank account, i.e. there are more people
with mobile phones than holding a bank account. Furthermore, only 43% of the population live within
a 5km radius to a financial access point. This gap represents a potential opportunity for CSPs to offer
mobile money services to their customers and also attract new users to their networks.4
Calling and SMS Usage
4.18 Mobile services are the primary means of making and receiving calls for most telecommunications
users in Uganda. Fixed line services are limited in the country due to limited fixed infrastructure and
strong focus from CSPs on positioning the services to business customers.
4.19 Currently there are 19M subscriber SIMs in the country. Mobile voice and SMS revenues are forecast
to be USD 689M in 2014.
4.20 Voice traffic volumes grew between 2008/09 and 2012/13, however in 2013/14 the volumes
contracted. Voice services generated more than 15 billion minutes traffic (national and local) in the
12 months to September 2014 (Figure 6).
Total Voice Traffic in Uganda (million minutes), 2008 - 2014
Source: UCC
4.21 The usage of SMS in Uganda is considerably lower than other benchmarked countries in Africa (Kenya,
Rwanda and Tanzania). There is indication of correlation between SMS price and usage in these
selected African countries (Figure 7).
4 Source: GSMA and World Bank, 2013.
6,478 7,328
12,427 12,847
15,760 15,552
-
2,000
4,000
6,000
8,000
10,000
12,000
14,000
16,000
18,000
2008/09 2009/10 2010/11 2011/12 2012/13 2013/14
Mill
ion
s
Cartesian: Mobile Access, National Voice Calls and SMS
Copyright © 2015 Cartesian Ltd. All rights reserved. 14
4.22 Uganda has the highest price per message (USD cents 1.26) and the lowest usage (7 messages per
user per month). In contrast, Tanzania has the lowest price per message (USD cents 0.022) and the
highest usage of around 80 messages per user per month.
SMS usage and pricing in selected African countries, 20145
Source: CSP and NRA websites, Cartesian
4.23 In assessing SMS usage, it is also interesting to examine the ratio between SMS messages and voice
call minutes. In Uganda, this SMS/Voice ratio is 0.10 which is very low when compared to other African
countries (Figure 8) which are already low by global standards. This indicates that mobile users in
Uganda make more calls relative to sending text messages versus their international peers.
SMS/Voice Minutes Ratio for selected countries and regions, 2014
Country SMS/Voice
Minutes Ratio
Region
SMS/Voice Minutes
Ratio
Uganda 0.10 North America 2.97
Kenya 0.65 Latin America 2.43
Rwanda 0.17 Europe 1.32
Tanzania 0.75 Asia Pacific 2.18
South Africa 0.85 Middle East and Africa 2.16 Source: CSP websites, Ovum, Cartesian
5 The prices are weighted based on market share adjusted for Purchasing Power Parity (PPP). The high correlation coefficient should be treated with some caution due to the small sample size.
Uganda
Tanzania
Kenya
Rwanda
0
0.2
0.4
0.6
0.8
1
1.2
1.4
0 10 20 30 40 50 60 70 80 90
Pri
ce p
er O
n-n
et M
essa
ge (
USD
Cen
ts)
Monthly SMS Usage per Subscription (Number of Messages)
Correl. Coef.: -0.91
Cartesian: Mobile Access, National Voice Calls and SMS
Copyright © 2015 Cartesian Ltd. All rights reserved. 15
4.24 At the average prices in Uganda, it is actually cheaper to make a quick call than to send an SMS. For
example, for the price of an SMS, subscribers can make a 22 seconds on-net call (or an 18 seconds
off-net call).
4.25 Whilst pricing appears to be the most significant factor, the low SMS usage may also be partially driven
by other contributing factors including the literacy level and OTT substitution.
4.26 Uganda’s literacy rate is (73%, see Figure 5), is lower than other African countries such as Kenya (85%),
Botswana (81%), South Africa (86%) and Zimbabwe (90%). This rate limits the number of people that
are likely to send and receive SMS. However as noted above, we estimate that mobile subscribers
account for only 33% of the Ugandan population so this literacy level is not necessarily a constraint.
4.27 OTT substitution is an international trend which has caused SMS volumes to decline dramatically in
some developed countries. To make use of OTT messaging applications, users require a smartphone
and a data connection. In Uganda, OTT services are therefore only available to the 4.2M mobile
internet subscriptions out of the 19M total mobile subscriptions.
4.28 We therefore conclude that price is likely to be the primary reason for the low SMS usage in the
market.
Retail Prices
4.29 CSPs in Uganda offer three main options in terms of price structure for prepaid mobile voice and SMS
services. Customers can choose whether they want to buy the services by minute/message, per
second, or as part of a service bundle including mobile broadband.
4.30 CSPs differentiate on-net from off-net pricing, offering more promotions on calls and SMS originated
and terminated within the same network. This can be seen in Figure 9, below.
Retail Prices for Voice Calls and SMS in Uganda, Q3 2014
Type of call/message Metric MTN Airtel Orange
Uganda Telecom
K2 Telecom
On-net calls UGX/min 300.0 214.3 240.0 300.0 150.0
Off-net calls UGX/min 300.0 300.0 420.0 300.0 250.0
Effective on-net call discount 0% 29% 43% 0% 20%
On-net SMS UGX/text 100.0 88.0 90.0 99.0 N/A
Off-net SMS UGX/text 130.0 88.0 90.0 99.0 N/A
Effective on-net SMS discount 23% 0% 0% 0% N/A Source: CSP websites
4.31 The price of MTN voice and SMS service plans are amongst the highest in the market. The CSP does
not differentiate its published tariff for on-net and off-net for voice calls. However, MTN offers its
MTN Zone tariffs which offers significant discounts depending on the type of call and time of the day.
Cartesian: Mobile Access, National Voice Calls and SMS
Copyright © 2015 Cartesian Ltd. All rights reserved. 16
In some cases, the discount can be as high as 100% (MTN states a minimum discount of 5% for MTN
tariffs). Details of MTN Zone tariffs are not published on MTN’s website.
4.32 K2 started operating in 2013 and it is offering the cheapest voice tariffs in the market, at UGX 150/min.
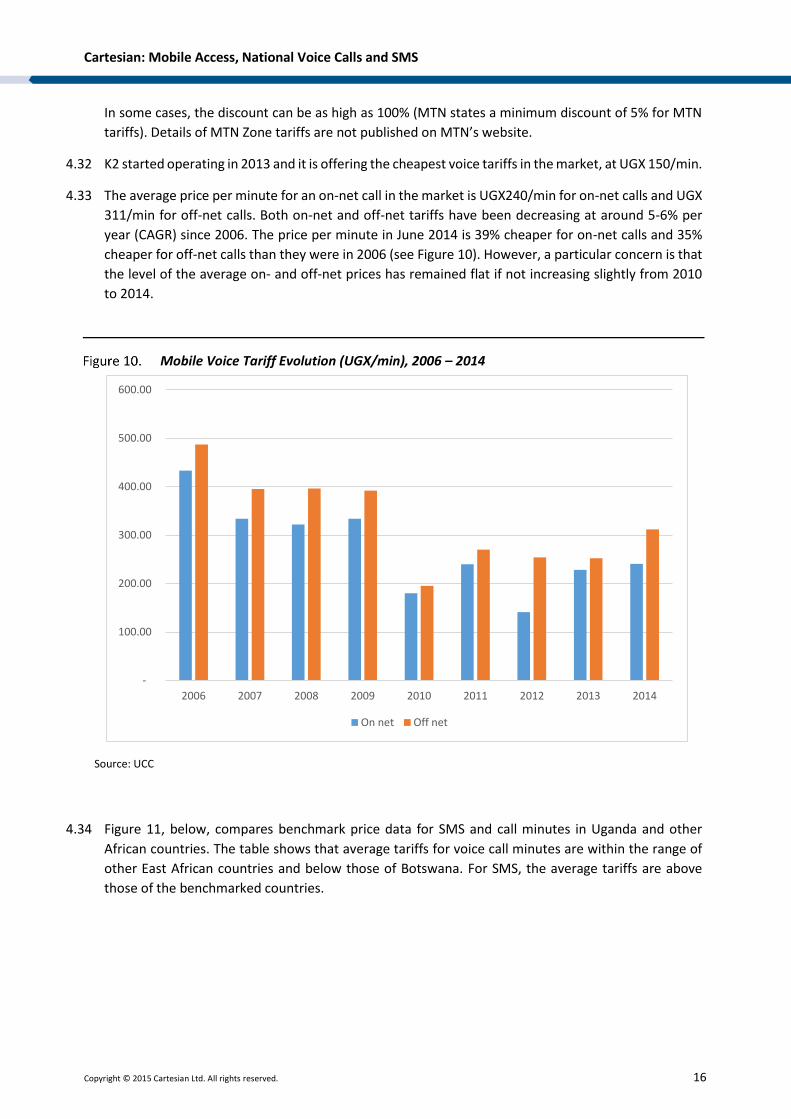
4.33 The average price per minute for an on-net call in the market is UGX240/min for on-net calls and UGX
311/min for off-net calls. Both on-net and off-net tariffs have been decreasing at around 5-6% per
year (CAGR) since 2006. The price per minute in June 2014 is 39% cheaper for on-net calls and 35%
cheaper for off-net calls than they were in 2006 (see Figure 10). However, a particular concern is that
the level of the average on- and off-net prices has remained flat if not increasing slightly from 2010
to 2014.
Mobile Voice Tariff Evolution (UGX/min), 2006 – 2014
Source: UCC
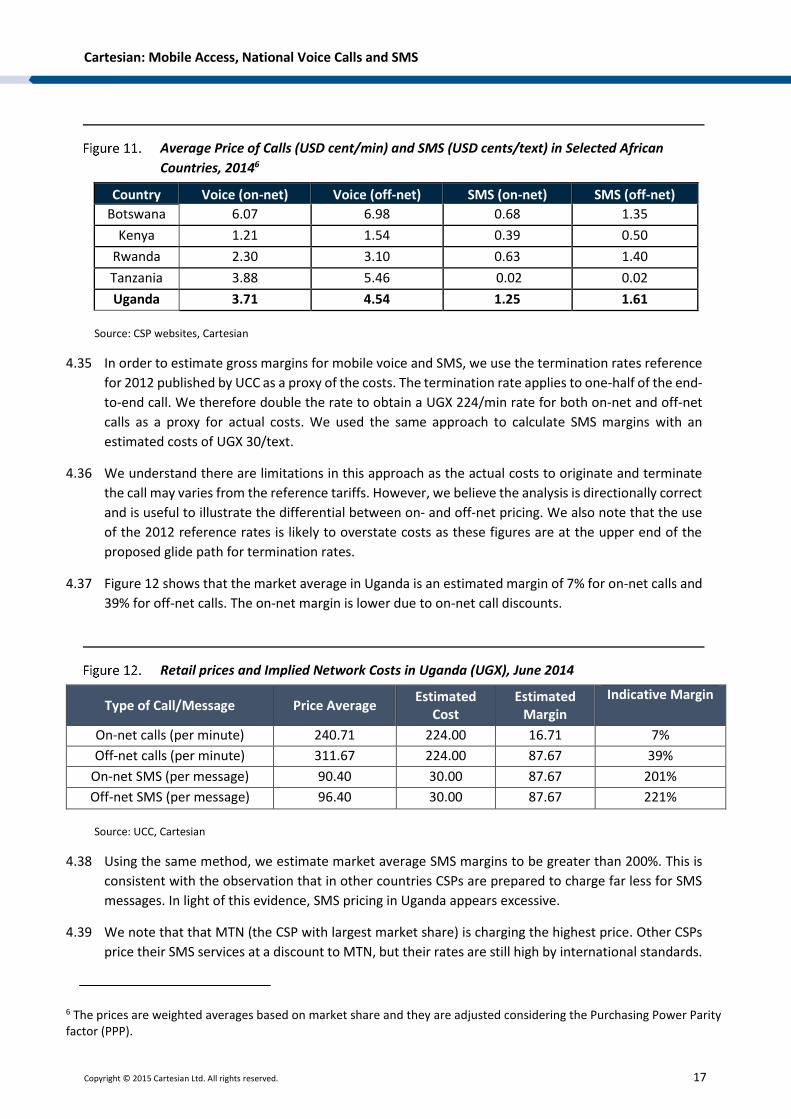
4.34 Figure 11, below, compares benchmark price data for SMS and call minutes in Uganda and other
African countries. The table shows that average tariffs for voice call minutes are within the range of
other East African countries and below those of Botswana. For SMS, the average tariffs are above
those of the benchmarked countries.
-
100.00
200.00
300.00
400.00
500.00
600.00
2006 2007 2008 2009 2010 2011 2012 2013 2014
On net Off net
Cartesian: Mobile Access, National Voice Calls and SMS
Copyright © 2015 Cartesian Ltd. All rights reserved. 17
Average Price of Calls (USD cent/min) and SMS (USD cents/text) in Selected African
Countries, 20146
Country Voice (on-net) Voice (off-net) SMS (on-net) SMS (off-net)
Botswana 6.07 6.98 0.68 1.35
Kenya 1.21 1.54 0.39 0.50
Rwanda 2.30 3.10 0.63 1.40
Tanzania 3.88 5.46 0.02 0.02
Uganda 3.71 4.54 1.25 1.61
Source: CSP websites, Cartesian
4.35 In order to estimate gross margins for mobile voice and SMS, we use the termination rates reference
for 2012 published by UCC as a proxy of the costs. The termination rate applies to one-half of the end-
to-end call. We therefore double the rate to obtain a UGX 224/min rate for both on-net and off-net
calls as a proxy for actual costs. We used the same approach to calculate SMS margins with an
estimated costs of UGX 30/text.
4.36 We understand there are limitations in this approach as the actual costs to originate and terminate
the call may varies from the reference tariffs. However, we believe the analysis is directionally correct
and is useful to illustrate the differential between on- and off-net pricing. We also note that the use
of the 2012 reference rates is likely to overstate costs as these figures are at the upper end of the
proposed glide path for termination rates.
4.37 Figure 12 shows that the market average in Uganda is an estimated margin of 7% for on-net calls and
39% for off-net calls. The on-net margin is lower due to on-net call discounts.
Retail prices and Implied Network Costs in Uganda (UGX), June 2014
Type of Call/Message Price Average Estimated
Cost Estimated
Margin
Indicative Margin
On-net calls (per minute) 240.71 224.00 16.71 7%
Off-net calls (per minute) 311.67 224.00 87.67 39%
On-net SMS (per message) 90.40 30.00 87.67 201%
Off-net SMS (per message) 96.40 30.00 87.67 221%
Source: UCC, Cartesian
4.38 Using the same method, we estimate market average SMS margins to be greater than 200%. This is
consistent with the observation that in other countries CSPs are prepared to charge far less for SMS
messages. In light of this evidence, SMS pricing in Uganda appears excessive.
4.39 We note that that MTN (the CSP with largest market share) is charging the highest price. Other CSPs
price their SMS services at a discount to MTN, but their rates are still high by international standards.
6 The prices are weighted averages based on market share and they are adjusted considering the Purchasing Power Parity factor (PPP).
Cartesian: Mobile Access, National Voice Calls and SMS
Copyright © 2015 Cartesian Ltd. All rights reserved. 18
4.40 Our hypothesis for this high pricing is that mobile voice and SMS are commonly sold together in a
bundle and that consumers primarily focus on the voice call charges when evaluating CSP tariffs. If
this is correct then there are limited incentives for CSPs to reduce the price of SMS in their bundles.
4.41 We also note that many mobile Value Added Services (VAS) use SMS as a communication channel.
The high retail SMS price enables mobile CSPs to increase the profitability of mobile-originated
messages from users for these services. The retail SMS price also acts as a benchmark rate for pricing
bulk SMS from VAS providers to users.
Industry Revenue
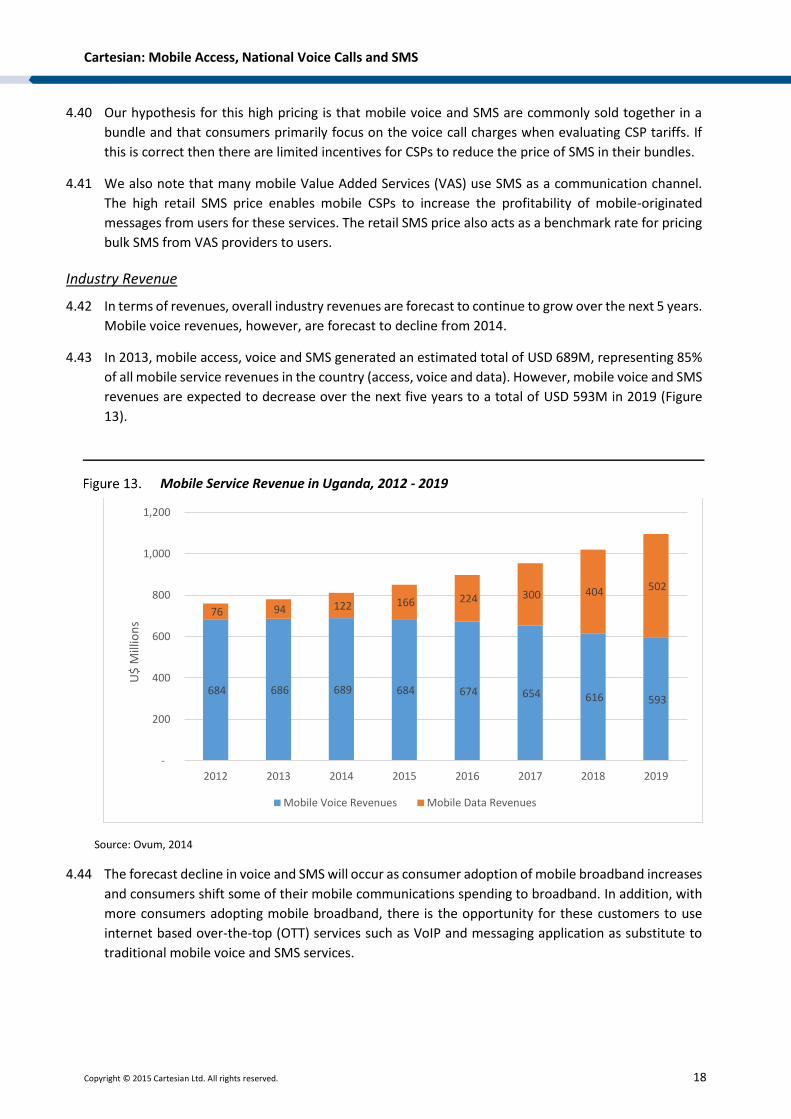
4.42 In terms of revenues, overall industry revenues are forecast to continue to grow over the next 5 years.
Mobile voice revenues, however, are forecast to decline from 2014.
4.43 In 2013, mobile access, voice and SMS generated an estimated total of USD 689M, representing 85%
of all mobile service revenues in the country (access, voice and data). However, mobile voice and SMS
revenues are expected to decrease over the next five years to a total of USD 593M in 2019 (Figure
13).
Mobile Service Revenue in Uganda, 2012 - 2019
Source: Ovum, 2014
4.44 The forecast decline in voice and SMS will occur as consumer adoption of mobile broadband increases
and consumers shift some of their mobile communications spending to broadband. In addition, with
more consumers adopting mobile broadband, there is the opportunity for these customers to use
internet based over-the-top (OTT) services such as VoIP and messaging application as substitute to
traditional mobile voice and SMS services.
684 686 689 684 674 654 616 593
76 94 122 166 224 300 404 502
-
200
400
600
800
1,000
1,200
2012 2013 2014 2015 2016 2017 2018 2019
U$
Mill
ion
s
Mobile Voice Revenues Mobile Data Revenues
Cartesian: Mobile Access, National Voice Calls and SMS
Copyright © 2015 Cartesian Ltd. All rights reserved. 19
Service Quality
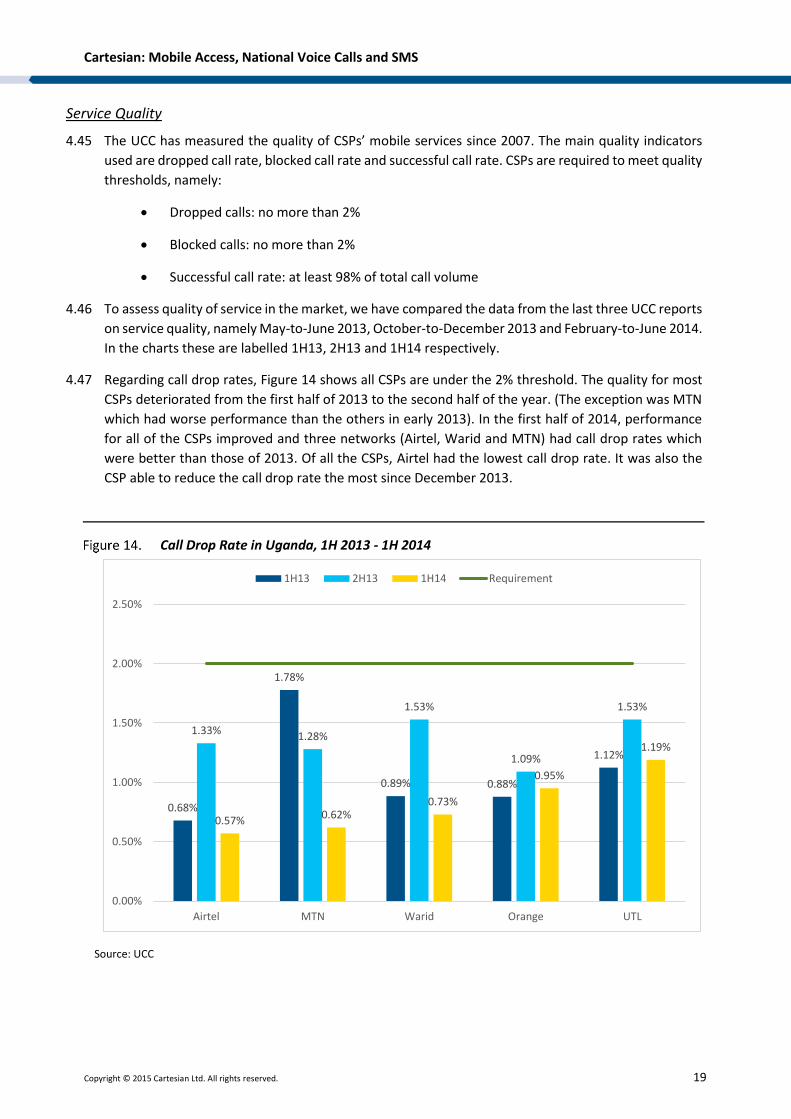
4.45 The UCC has measured the quality of CSPs’ mobile services since 2007. The main quality indicators
used are dropped call rate, blocked call rate and successful call rate. CSPs are required to meet quality
thresholds, namely:
Dropped calls: no more than 2%
Blocked calls: no more than 2%
Successful call rate: at least 98% of total call volume
4.46 To assess quality of service in the market, we have compared the data from the last three UCC reports
on service quality, namely May-to-June 2013, October-to-December 2013 and February-to-June 2014.
In the charts these are labelled 1H13, 2H13 and 1H14 respectively.
4.47 Regarding call drop rates, Figure 14 shows all CSPs are under the 2% threshold. The quality for most
CSPs deteriorated from the first half of 2013 to the second half of the year. (The exception was MTN
which had worse performance than the others in early 2013). In the first half of 2014, performance
for all of the CSPs improved and three networks (Airtel, Warid and MTN) had call drop rates which
were better than those of 2013. Of all the CSPs, Airtel had the lowest call drop rate. It was also the
CSP able to reduce the call drop rate the most since December 2013.
Call Drop Rate in Uganda, 1H 2013 - 1H 2014
Source: UCC
0.68%
1.78%
0.89% 0.88%
1.12%
1.33% 1.28%
1.53%
1.09%
1.53%
0.57% 0.62%0.73%
0.95%
1.19%
0.00%
0.50%
1.00%
1.50%
2.00%
2.50%
Airtel MTN Warid Orange UTL
1H13 2H13 1H14 Requirement
Cartesian: Mobile Access, National Voice Calls and SMS
Copyright © 2015 Cartesian Ltd. All rights reserved. 20
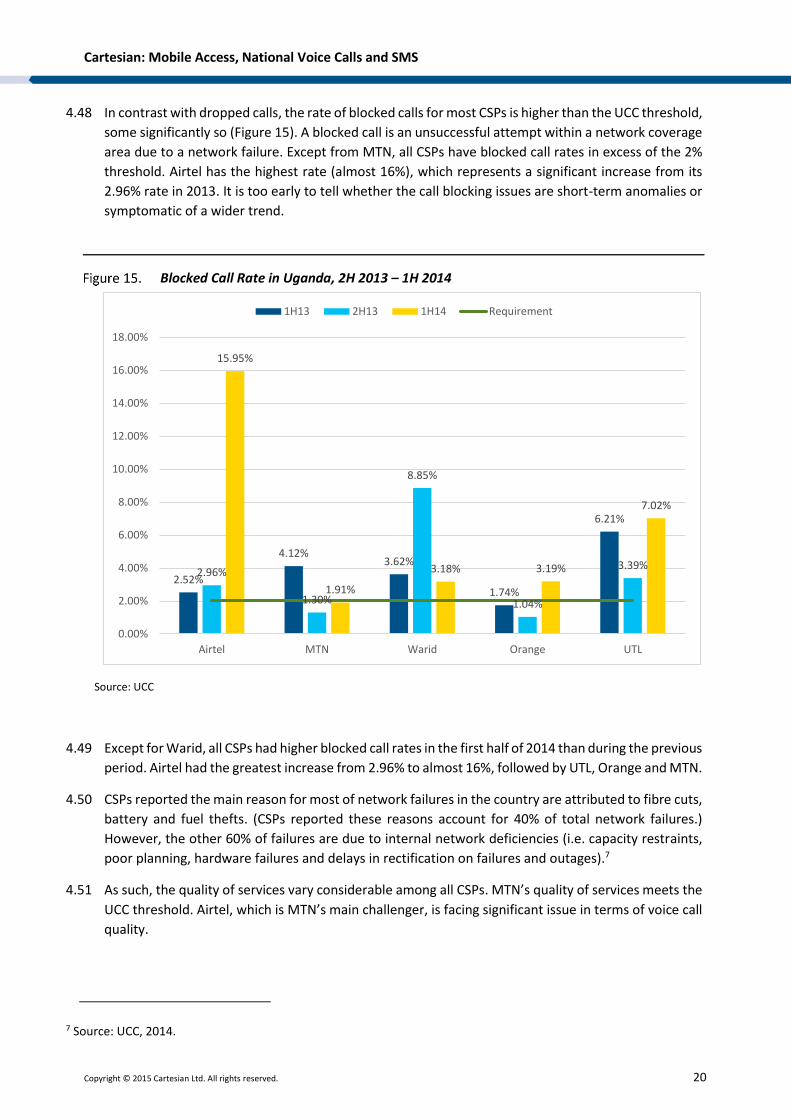
4.48 In contrast with dropped calls, the rate of blocked calls for most CSPs is higher than the UCC threshold,
some significantly so (Figure 15). A blocked call is an unsuccessful attempt within a network coverage
area due to a network failure. Except from MTN, all CSPs have blocked call rates in excess of the 2%
threshold. Airtel has the highest rate (almost 16%), which represents a significant increase from its
2.96% rate in 2013. It is too early to tell whether the call blocking issues are short-term anomalies or
symptomatic of a wider trend.
Blocked Call Rate in Uganda, 2H 2013 – 1H 2014
Source: UCC
4.49 Except for Warid, all CSPs had higher blocked call rates in the first half of 2014 than during the previous
period. Airtel had the greatest increase from 2.96% to almost 16%, followed by UTL, Orange and MTN.
4.50 CSPs reported the main reason for most of network failures in the country are attributed to fibre cuts,
battery and fuel thefts. (CSPs reported these reasons account for 40% of total network failures.)
However, the other 60% of failures are due to internal network deficiencies (i.e. capacity restraints,
poor planning, hardware failures and delays in rectification on failures and outages).7
4.51 As such, the quality of services vary considerable among all CSPs. MTN’s quality of services meets the
UCC threshold. Airtel, which is MTN’s main challenger, is facing significant issue in terms of voice call
quality.
7 Source: UCC, 2014.
2.52%
4.12%3.62%
1.74%
6.21%
2.96%
1.30%
8.85%
1.04%
3.39%
15.95%
1.91%
3.18% 3.19%
7.02%
0.00%
2.00%
4.00%
6.00%
8.00%
10.00%
12.00%
14.00%
16.00%
18.00%
Airtel MTN Warid Orange UTL
1H13 2H13 1H14 Requirement
Cartesian: Mobile Access, National Voice Calls and SMS
Copyright © 2015 Cartesian Ltd. All rights reserved. 21
4.52 In summary, there is evidence of quality issues in the market based on the recent increase of blocked
call rate. Airtel has increased significantly its rate since last year which is now considerably higher than
other CSPs.
Innovation
4.53 Mobile voice and SMS are becoming commoditized services and price is the main differentiator. The
majority of CSP investment in the market is to fill gaps in network coverage and improve the quality
of current voice technology (e.g. increasing W-CDMA footprint).
4.54 Innovation in this market is based on bundling voice and SMS with other services such as broadband
and mobile money within a multi-part tariff.
Market Performance Assessment Conclusions
4.55 From 2006 to 2010, the market seemed to perform well. During this period, retail tariffs decreased
and service adoption has grew. More recently, however, growth in subscriptions appears to have
tailed off. There is evidence that prices have stabilised, and in some instances increased, during the
last two years. K2 has recently entered the market with an aggressive price-leadership strategy,
however this has yet to have an observable impact on the market as a whole.
4.56 Voice tariffs in Uganda are comparable with international benchmarks. Savvy consumers are also able
to optimise their call costs by using multiple SIMs to access on-net tariffs.
4.57 SMS usage is lower than in other African countries demonstrating that there are constraints on service
adoption. Price appears to be the primary factor since Uganda’s SMS prices are 70% more expensive
on average than those in other African countries. CSPs are making extremely high margins if we
consider UCC termination rates as cost references.
4.58 The market mobile penetration has remained flat in the last two years, limited to 51% penetration
over the population based on number of subscriptions (active SIMs). This percentage is lower than
the African average and other East African countries. Affordability (particularly of handsets) and
access to electricity are two constraints to service adoption.
4.59 Finally, there is evidence of quality issues with the provision of mobile voice services. Call block rates
have increased for all CSPs from second half of 2013 to first half of 2014. Airtel had the greatest
increase from 2.96% to almost 16%, followed by UTL, Orange and MTN.
5 Market Structure Assessment
Market Concentration
5.1 Mobile calling and SMS services are supplied in Uganda by Airtel, MTN, Orange, Sure Telecom, Uganda
Telecom (UTL) and K2. Of these firms: Airtel, MTN, Orange, Uganda Telecom and Sure Telecom are
mobile network operators (MNOs); and, K2 is a mobile virtual network operator (MVNO) with a
wholesale supply agreement with Orange.
5.2 MTN is the largest CSP in the market. It is part of the international MTN group, with operations in 22
countries. Another significant CSP is Airtel, which is part of Bharti Airtel group with operations in Africa
and Asia. Airtel acquired Warid in 2013, becoming the second largest CSP in Uganda.
Cartesian: Mobile Access, National Voice Calls and SMS
Copyright © 2015 Cartesian Ltd. All rights reserved. 22
5.3 In 2014, Orange Uganda was acquired by Africell, an African group with presence also in the Gambia
and Sierra Leone. Previously, Orange Uganda had been part of the international Orange S.A. group
(formerly known as France Telecom).
5.4 Sure Telecom Uganda Limited entered the market in early 2014 under the brand name “Smart”. Sure
Telecom is owned by the Aga Khan Fund for Economic Development.
5.5 Finally, K2 launched its services in 2013 as the first MVNO in the country using Orange’s network.
5.6 MTN is the market leader with 51% market share by subscriptions as of September 2014 (Figure 16).
The second largest CSP, Airtel, has 39% of subscriptions. The remaining 8% of the market is shared
among UTL (less than 5%), Orange (3%), K2 (less than 1%) and Sure Telecom (less than 1%).
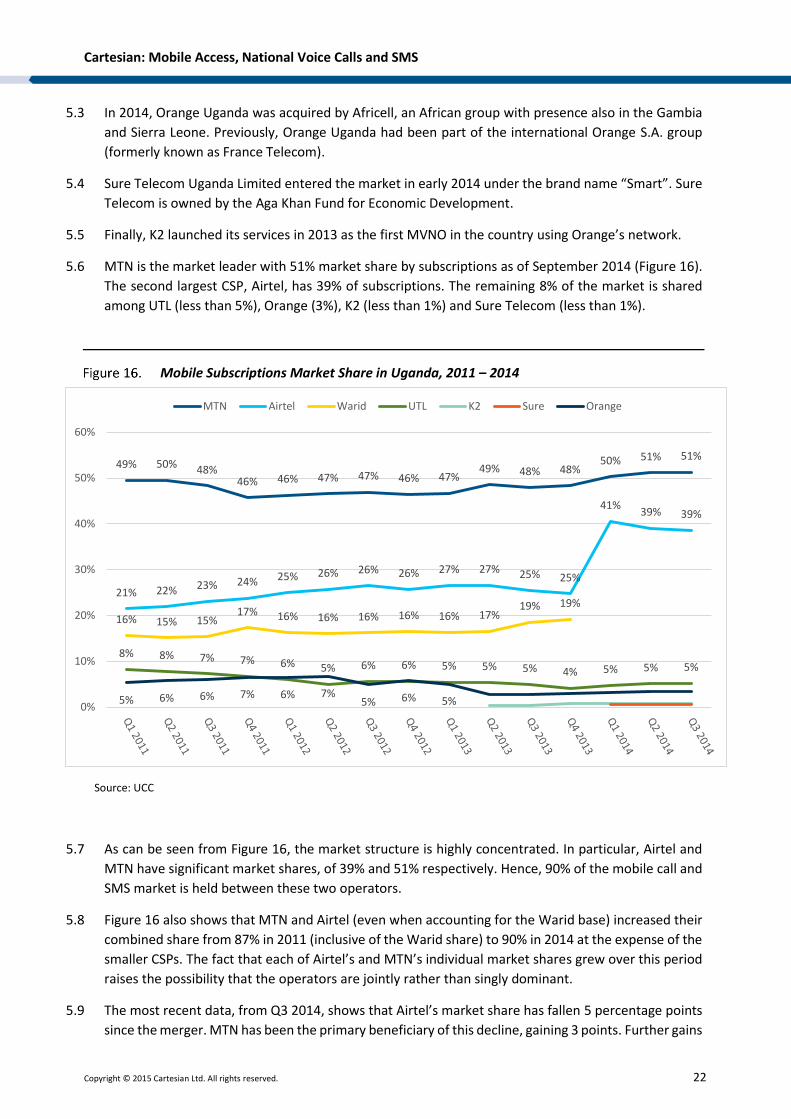
Mobile Subscriptions Market Share in Uganda, 2011 – 2014
Source: UCC
5.7 As can be seen from Figure 16, the market structure is highly concentrated. In particular, Airtel and
MTN have significant market shares, of 39% and 51% respectively. Hence, 90% of the mobile call and
SMS market is held between these two operators.
5.8 Figure 16 also shows that MTN and Airtel (even when accounting for the Warid base) increased their
combined share from 87% in 2011 (inclusive of the Warid share) to 90% in 2014 at the expense of the
smaller CSPs. The fact that each of Airtel’s and MTN’s individual market shares grew over this period
raises the possibility that the operators are jointly rather than singly dominant.
5.9 The most recent data, from Q3 2014, shows that Airtel’s market share has fallen 5 percentage points
since the merger. MTN has been the primary beneficiary of this decline, gaining 3 points. Further gains
49% 50% 48%46% 46% 47% 47% 46% 47%
49% 48% 48%50% 51% 51%
21% 22% 23% 24% 25% 26% 26% 26% 27% 27% 25% 25%
41%39% 39%
16% 15% 15%17% 16% 16% 16% 16% 16% 17%
19% 19%
8% 8% 7% 7% 6% 5% 6% 6% 5% 5% 5% 4% 5% 5% 5%
5% 6% 6% 7% 6% 7%5% 6% 5%0%
10%
20%
30%
40%
50%
60%
MTN Airtel Warid UTL K2 Sure Orange
Cartesian: Mobile Access, National Voice Calls and SMS
Copyright © 2015 Cartesian Ltd. All rights reserved. 23
by MTN at the expense of Airtel could indicate that these two firms are competing against each other
and are not jointly dominant. However, at this stage it is too early to tell.
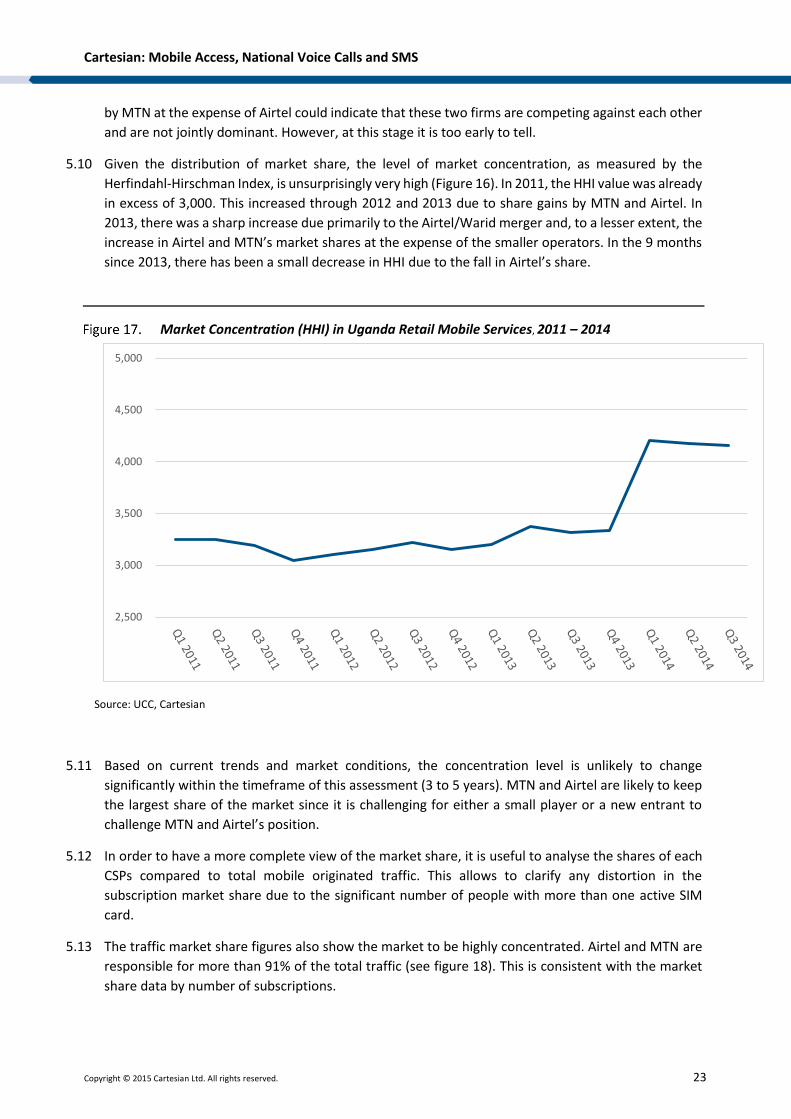
5.10 Given the distribution of market share, the level of market concentration, as measured by the
Herfindahl-Hirschman Index, is unsurprisingly very high (Figure 16). In 2011, the HHI value was already
in excess of 3,000. This increased through 2012 and 2013 due to share gains by MTN and Airtel. In
2013, there was a sharp increase due primarily to the Airtel/Warid merger and, to a lesser extent, the
increase in Airtel and MTN’s market shares at the expense of the smaller operators. In the 9 months
since 2013, there has been a small decrease in HHI due to the fall in Airtel’s share.
Market Concentration (HHI) in Uganda Retail Mobile Services, 2011 – 2014
Source: UCC, Cartesian
5.11 Based on current trends and market conditions, the concentration level is unlikely to change
significantly within the timeframe of this assessment (3 to 5 years). MTN and Airtel are likely to keep
the largest share of the market since it is challenging for either a small player or a new entrant to
challenge MTN and Airtel’s position.
5.12 In order to have a more complete view of the market share, it is useful to analyse the shares of each
CSPs compared to total mobile originated traffic. This allows to clarify any distortion in the
subscription market share due to the significant number of people with more than one active SIM
card.
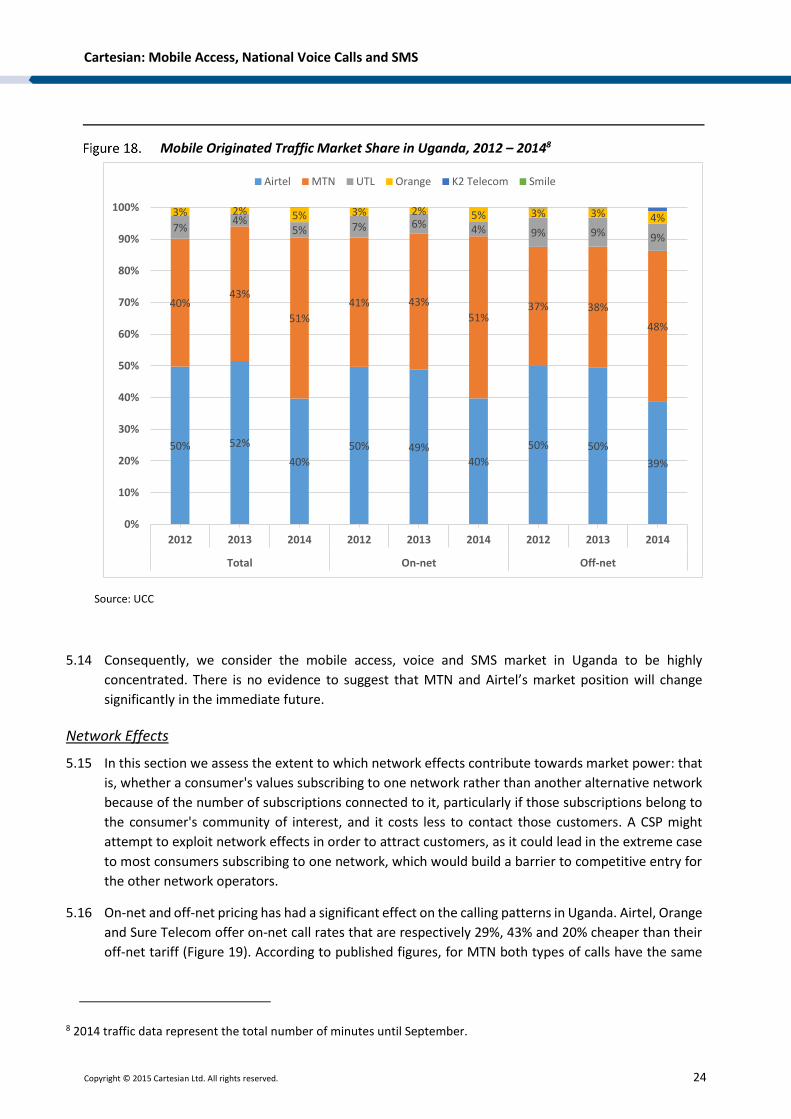
5.13 The traffic market share figures also show the market to be highly concentrated. Airtel and MTN are
responsible for more than 91% of the total traffic (see figure 18). This is consistent with the market
share data by number of subscriptions.
2,500
3,000
3,500
4,000
4,500
5,000
Cartesian: Mobile Access, National Voice Calls and SMS
Copyright © 2015 Cartesian Ltd. All rights reserved. 24
Mobile Originated Traffic Market Share in Uganda, 2012 – 20148
Source: UCC
5.14 Consequently, we consider the mobile access, voice and SMS market in Uganda to be highly
concentrated. There is no evidence to suggest that MTN and Airtel’s market position will change
significantly in the immediate future.
Network Effects
5.15 In this section we assess the extent to which network effects contribute towards market power: that
is, whether a consumer's values subscribing to one network rather than another alternative network
because of the number of subscriptions connected to it, particularly if those subscriptions belong to
the consumer's community of interest, and it costs less to contact those customers. A CSP might
attempt to exploit network effects in order to attract customers, as it could lead in the extreme case
to most consumers subscribing to one network, which would build a barrier to competitive entry for
the other network operators.
5.16 On-net and off-net pricing has had a significant effect on the calling patterns in Uganda. Airtel, Orange
and Sure Telecom offer on-net call rates that are respectively 29%, 43% and 20% cheaper than their
off-net tariff (Figure 19). According to published figures, for MTN both types of calls have the same
8 2014 traffic data represent the total number of minutes until September.
50% 52%
40%
50% 49%40%
50% 50%
39%
40%43%
51%
41% 43%
51%37% 38%
48%
7%4%
5% 7% 6% 4% 9% 9% 9%
3% 2% 5% 3% 2% 5% 3% 3% 4%
0%
10%
20%
30%
40%
50%
60%
70%
80%
90%
100%
2012 2013 2014 2012 2013 2014 2012 2013 2014
Total On-net Off-net
Airtel MTN UTL Orange K2 Telecom Smile
Cartesian: Mobile Access, National Voice Calls and SMS
Copyright © 2015 Cartesian Ltd. All rights reserved. 25
price; however, the MTN Zone tariff offers significant additional discounts to on-net calls (including
free on-net calls).
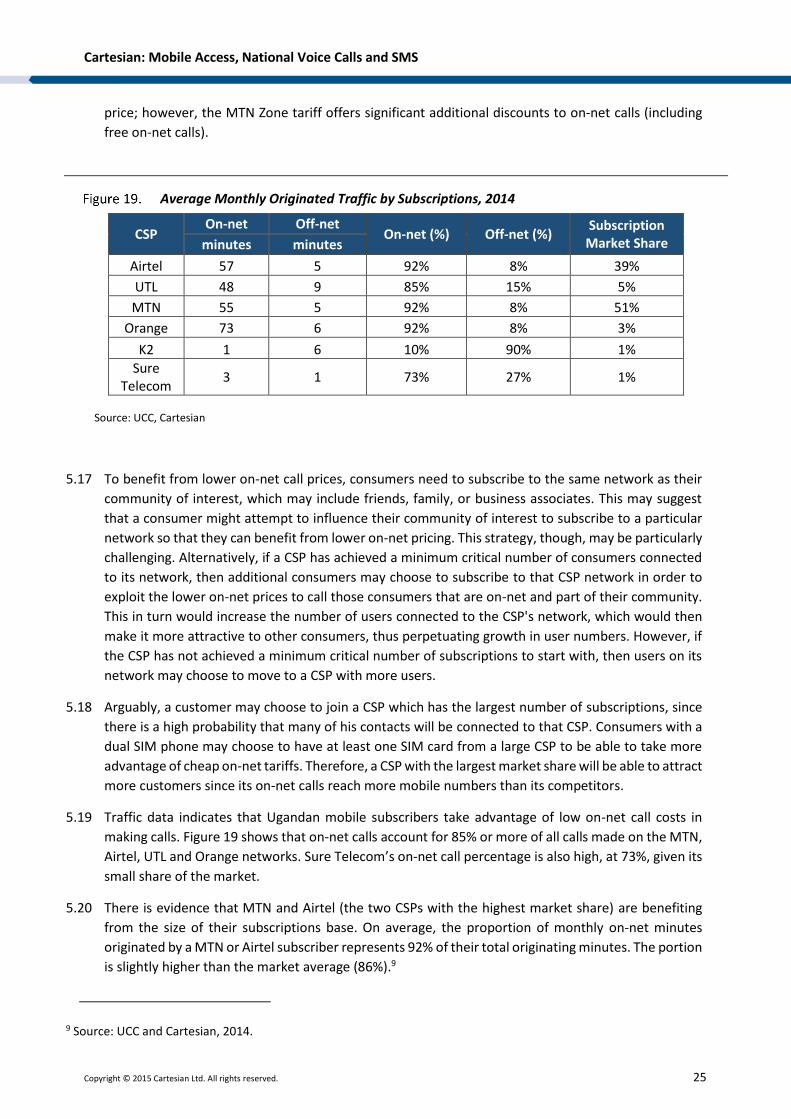
Average Monthly Originated Traffic by Subscriptions, 2014
CSP On-net Off-net
On-net (%) Off-net (%) Subscription
Market Share minutes minutes
Airtel 57 5 92% 8% 39%
UTL 48 9 85% 15% 5%
MTN 55 5 92% 8% 51%
Orange 73 6 92% 8% 3%
K2 1 6 10% 90% 1%
Sure Telecom
3 1 73% 27% 1%
Source: UCC, Cartesian
5.17 To benefit from lower on-net call prices, consumers need to subscribe to the same network as their
community of interest, which may include friends, family, or business associates. This may suggest
that a consumer might attempt to influence their community of interest to subscribe to a particular
network so that they can benefit from lower on-net pricing. This strategy, though, may be particularly
challenging. Alternatively, if a CSP has achieved a minimum critical number of consumers connected
to its network, then additional consumers may choose to subscribe to that CSP network in order to
exploit the lower on-net prices to call those consumers that are on-net and part of their community.
This in turn would increase the number of users connected to the CSP's network, which would then
make it more attractive to other consumers, thus perpetuating growth in user numbers. However, if
the CSP has not achieved a minimum critical number of subscriptions to start with, then users on its
network may choose to move to a CSP with more users.
5.18 Arguably, a customer may choose to join a CSP which has the largest number of subscriptions, since
there is a high probability that many of his contacts will be connected to that CSP. Consumers with a
dual SIM phone may choose to have at least one SIM card from a large CSP to be able to take more
advantage of cheap on-net tariffs. Therefore, a CSP with the largest market share will be able to attract
more customers since its on-net calls reach more mobile numbers than its competitors.
5.19 Traffic data indicates that Ugandan mobile subscribers take advantage of low on-net call costs in
making calls. Figure 19 shows that on-net calls account for 85% or more of all calls made on the MTN,
Airtel, UTL and Orange networks. Sure Telecom’s on-net call percentage is also high, at 73%, given its
small share of the market.
5.20 There is evidence that MTN and Airtel (the two CSPs with the highest market share) are benefiting
from the size of their subscriptions base. On average, the proportion of monthly on-net minutes
originated by a MTN or Airtel subscriber represents 92% of their total originating minutes. The portion
is slightly higher than the market average (86%).9
9 Source: UCC and Cartesian, 2014.
Cartesian: Mobile Access, National Voice Calls and SMS
Copyright © 2015 Cartesian Ltd. All rights reserved. 26
5.21 The proportion of monthly on-net minutes originated by Orange is at the same level as that of MTN
and Airtel. This is a consequence of Orange’s significant discounts for on-net calls. Orange offers the
largest discount on on-net calls in the market (more than 43% compared to off-net calls price).
5.22 Moreover, MTN and Airtel customers also generates more voice minutes than the other CSPs’
customers. This could be a reflection that MTN and Airtel customers have more numbers to call using
on-net calls.
5.23 CSPs have more flexibility to set their on-net calls pricing than they have with off-net ones, since on-
net calls don’t incur interconnection costs. The marginal cost of on-net calls and SMS messages are
less than off-net calls and SMS messages, which allows CSPs to offer more aggressive promotions,
particularly during the hours their network is underutilized. This allows CSPs to offer attractive pricing
to bring new customer to their network with relative small costs.
5.24 However, on-net minutes are only relevant if CSPs are able to offer relative large number of customers
connected to their network (more phone numbers to terminate on-net calls). Otherwise, customer
benefits will only be limited to calls to a very small group of user, which makes on-net minutes less
attractive.
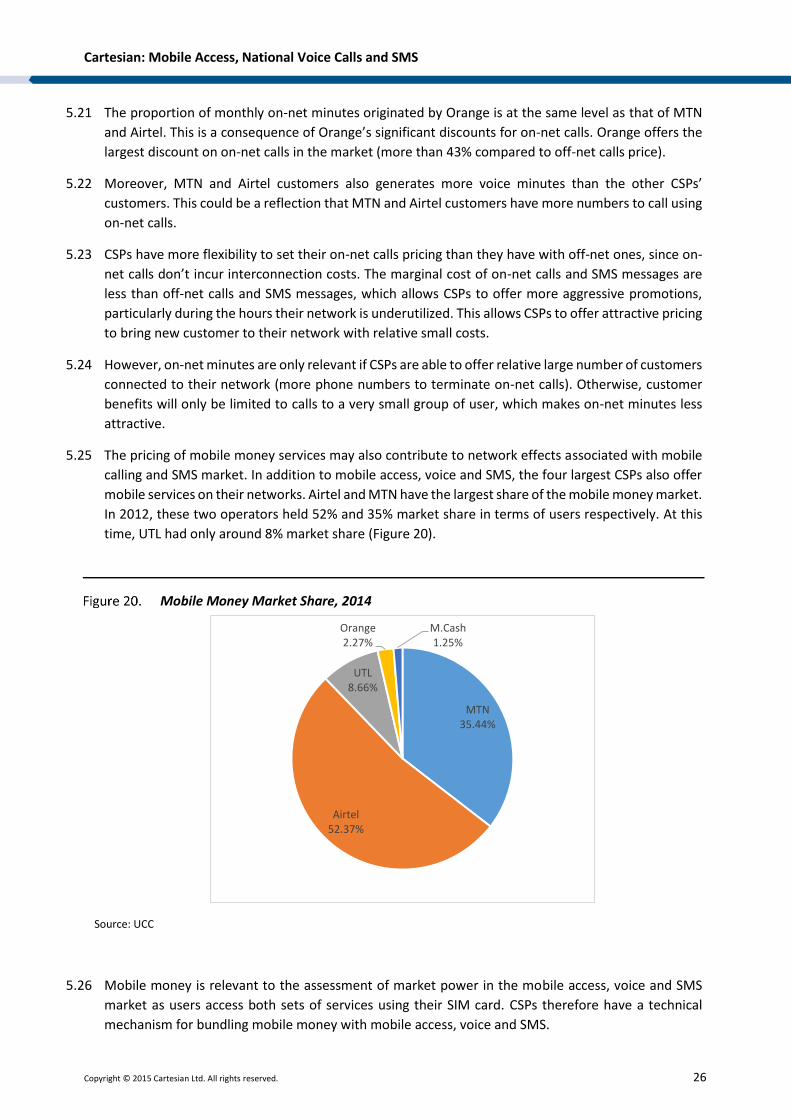
5.25 The pricing of mobile money services may also contribute to network effects associated with mobile
calling and SMS market. In addition to mobile access, voice and SMS, the four largest CSPs also offer
mobile services on their networks. Airtel and MTN have the largest share of the mobile money market.
In 2012, these two operators held 52% and 35% market share in terms of users respectively. At this
time, UTL had only around 8% market share (Figure 20).
Mobile Money Market Share, 2014
Source: UCC
5.26 Mobile money is relevant to the assessment of market power in the mobile access, voice and SMS
market as users access both sets of services using their SIM card. CSPs therefore have a technical
mechanism for bundling mobile money with mobile access, voice and SMS.
MTN35.44%
Airtel52.37%
UTL8.66%
Orange2.27%
M.Cash1.25%
Cartesian: Mobile Access, National Voice Calls and SMS
Copyright © 2015 Cartesian Ltd. All rights reserved. 27
5.27 CSPs are able to promote mobile money services to their customer base. Since they have access to
these customers, CSPs can launch segmented promotions to drive their customers to adopt new
services. Therefore, CSPs with larger customer base will be able to target more customers than CSPs
with small customer base.
5.28 In the opposite direction, CSPs are able to cross-sell access, voice and SMS services to users that join
their network primarily for the mobile money service. The two services are therefore related and it
can be seen that the two CSPs that hold the greatest market share in mobile access, voice and SMS
market are also dominant in the mobile money market.
5.29 Network effects benefit CSPs with a large customer base in mobile money services adoption. The main
reason is that CSPs can charge a lower transaction fee for mobile money transactions within the same
network. MTN and UTL offer lower tariffs for transactions within their network, while Airtel has a
single tariff for both in and off-net transactions. In doing so, CSPs with large mobile money customer
base will become more attractive than those with small base due to more mobile money accounts
connected to their network. For example, a customer will benefit more from low tariffs in large CSPs
since they will be able to transfer to more accounts connected to those CSPs.
5.30 Finally, there is evidence that some CSPs prevent customers using mobile money accounts to pay for
services from other CSPs. For example, a customer using MTN’s mobile money services is unable to
use this account to buy airtime credit from Airtel or Orange. Since mobile money is the main bank
account for its users, this restriction has a significant weight on customers’ decisions regarding their
mobile money services.
5.31 Regarding SMS, there are no differences between the level of on-net and off-net prices offered by
most CSPs. MTN is the only one to differentiate its SMS tariff, offering on-net SMS for 23% less than
off-net SMS
5.32 Based on the above analysis, we conclude that network effects are relevant to the assessment of SMP
in this market. There is evidence that MTN and Airtel are benefiting from their large customer base
to strengthen their competitive position in the market. There is also evidence that the network effects
in mobile money services reinforce this.
Other barriers to entry
5.33 In addition to network effects, there are other potential barriers to enter the mobile access, voice and
SMS market. The most significant barriers are spectrum, network (RAN, core and backhaul), IT systems,
operations, distribution and marketing.
5.34 Spectrum is a scarce resource and the majority of spectrum for mobile services is already assigned to
CSPs in the market. There is no secondary market in Uganda, which means that spectrum will be
assigned to a specific CSP for the entire duration of the spectrum terms and conditions (i.e. 10-15
years). New entrants will therefore have to wait until new spectrum ranges become available.
5.35 In the near-term, some spectrum may be released following Airtel’s acquisition of Warid. The
spectrum available is likely to be in popular ranges such as 900MHz, 1800MHz, 1900MHz and 2.5GHz.
5.36 A second barrier to entry is the financial resources required to cover the significant investment in both
RAN and core networks. As the investment in network is independent from the consumer demand,
which means that CSPs will have these initial high costs even if the usage take up on their network is
low.
Cartesian: Mobile Access, National Voice Calls and SMS
Copyright © 2015 Cartesian Ltd. All rights reserved. 28
5.37 In order to reach their target audience, a new entrant will have to build their retail presence by either
opening their own channels or partnering with an established retailer. In Uganda, independent
retailers have exclusive franchising agreements with established CSPs, which represents a significant
barrier to new CSPs to build their retail footprint.
5.38 Finally, entrants require significant investment in marketing in order to build a new brand and attract
customers to buy from them. Telecom companies are the biggest spenders in terms of advertising in
Uganda; it is a considerable challenge for small or new CSPs to compete against established rivals with
large marketing budgets.
5.39 Market entry barriers for MVNOs are different from those of MNOs. Since MVNOs don’t require
spectrum and network to operate, these CSPs do not face significant upfront costs prior to starting to
grow their customer base.
5.40 The most significant barrier for MVNO entry is securing a wholesale agreement with a host network.
MNOs are often reluctant to provide wholesale access to MVNOs as they view the MVNO as an
additional competitor in the retail market. Because of this, even when access is granted, the financial
terms may make it difficult for the MVNO to build a viable business.
5.41 Other costs for an MVNO entrant include the need to invest significantly in marketing to build a new
brand and be able to compete against established CSPs, which have already well-known brands.
5.42 For both MNOs and MVNOs, interconnection with other CSPs is necessary to offer mobile access voice
and SMS services. There are currently obligations on CSPs in Uganda to interconnect with each other,
which theoretically eliminates interconnections as an entry barrier. However, in practice, CSPs may
not fully cooperate or may take considerable time to deploy the interconnection agreement.
5.43 There is evidence that new entrants in the market have experienced difficulties in obtaining
interconnection with MTN. Cases brought to the attention of the UCC include K2, One Solutions and
Datanet.
Sunk Costs
5.44 The provision of mobile access, voice and SMS is characterized by significant sunk costs. Network
represents the greatest costs for facilities-based market entry. In some cases, spectrum can also
represent a material sunk cost, but in Uganda prices are fixed and are not considerably high.
5.45 Network establishment and setup can be divided into access and core networks. The first requires the
installation of base stations in different locations to provide service coverage to customers. The
second relates to the switching elements of a CSP’s network which provide functions such as location
identification and authentication.
5.46 The access portion of the network requires greatest up-front investment. In order for the service to
be relevant to customers, the network has to have coverage across important and popular locations.
Dues to the mobility characteristics of mobile services, access needs to be available not only where
customers reside, but also in areas where customers would normally travel.
5.47 The recent entry of tower companies into the Ugandan market has allowed CSPs to divest mobile
towers, which would previously have been viewed as sunk costs. Base station electronic costs are still
considered sunk.
Cartesian: Mobile Access, National Voice Calls and SMS
Copyright © 2015 Cartesian Ltd. All rights reserved. 29
5.48 CSPs must also invest in backhaul connections in the access network to link the base stations to the
core. CSPs may choose to lease backhaul connectivity or build their own using either microwave of
fibre links. This will especially be the case in areas where there is no wholesale alternative, or where
it is more strategically advantageous to self-supply rather than acquiring wholesale capacity (e.g. large
urban centres with high population density).
5.49 Backhaul is considered a sunk cost where a CSP has to invest in its own infrastructure. This investment
can vary depending on which technologies are employed. Microwave will be a cheaper option than
fibre, but it suffers significant quality and reach limitations. On the other hand, fibre offers good
capacity and quality, but it requires higher investment.
5.50 In conclusion, there are significant sunk costs related to the provision of mobile access, voice and SMS
services. We believe sunk costs create a considerable investment risk to prospect CSPs entering the
market, since it will be more difficult for these companies to find funding and thus increases their cost
of capital.
Economies of Scale
5.51 Economies of scale play a significant role in the provision of mobile access, voice and SMS services. As
previously mentioned, CSPs face significant upfront investments that require substantial scale and
time to be amortized. Mobile access, voice and SMS services are characterized by significant fixed
costs and relatively low variable costs. Therefore, CSPs with large customer bases will be able to
generate better margins than their smaller competitors.
5.52 In mobile, the cost of the radio access network is driven by two major factors: coverage and capacity.
The costs of providing coverage are fixed costs (i.e. there is a fixed cost for a cell site with minimum
capacity which cannot be avoided). These costs are therefore subject to scale economics: they can be
amortized more widely as demand grows.
5.53 Once the capacity of the fixed-cost, coverage network is exhausted, CSPs must invest in further
capacity. The costs of providing capacity are variable costs (i.e. the cost of capacity upgrades increases
with customer demand). The scale economies available in capacity-driven costs are less significant.
5.54 CSPs that efficiently utilize their network will have a distinct cost advantage over those who have
underutilized network capacity. This allows CSPs to compete more effectively on retail prices or to
benefit from greater margins.
5.55 From a coverage perspective, network coverage can be used as a competitive differentiator in the
retail market. CSPs with greater market share are able to justify wider coverage as they will have more
locations with a viable traffic volume. With the entry of tower companies, the upfront costs of
establishing a new cell site have reduced. However the economics will still be more favourable for a
CSP that can generate more revenue from a cell site, i.e. one that has a more customers.
5.56 Significant recurrent fixed costs include personnel expenses, site lease or maintenance, and customer
care infrastructure (IT, customer care platform, and personnel). Economies of scale allow a CSP to
absorb these overheads with greater facility and improve their margins.
5.57 MTN and Airtel clearly have advantages compared to other smaller CSPs. Since their customer base
accounts for 17.6M subscriptions (91% of the market) they have significantly more scale than Orange
or UTL.
Cartesian: Mobile Access, National Voice Calls and SMS
Copyright © 2015 Cartesian Ltd. All rights reserved. 30
5.58 We consider economies of scale to have significant bearing on market power. MTN and Airtel have
clear advantage from the size of their customer base and operations.
Economies of Scope
5.59 Economies of scope can provide a CSP with reduced unit costs by combining the provision of two or
more services. In the case of mobile voice and SMS, there are a number scenarios which deliver these
types of benefits. CSPs offering mobile voice and SMS alongside mobile broadband or fixed services
can leverage scope economies these to reduce unit costs, provide service bundles, and apply cross-
subsidies.
5.60 Cost items with significant economies of scope potential include:
Radio access network;
Core network;
Backhaul circuits;
Network operations;
General and administrative costs; and,
Marketing costs.
5.61 All CSPs in Uganda that provide mobile broadband also offer voice and SMS services. Where the
mobile broadband service is offered over W-CDMA networks, all three services are delivered using
the same technology. As such, the costs are shared across different business lines (voice and SMS and
mobile broadband), thereby reducing the unit cost.
5.62 In cases which CSPs offer services over different technologies (i.e. GSM, W-CDMA and LTE), there are
still costs that can be shared across the diverse services, thus reducing the unit cost to provide mobile
broadband services.
5.63 The same RAN and core network technologies can be used by a CSP to offer both voice and broadband
services to allow it to benefit from economies of scope. Modern RANs allow GSM and W-CDMA on
the same equipment, and there are newer models that also support LTE.
5.64 W-CDMA core networks are able to support GSM RAN. It is therefore feasible for CSPs to migrate
existing GSM RANs to new W-CDMA and LTE cores. As such, CSPs are able to leverage the investment
in new core technologies and benefit from backwards compatibility in order to support GSM, W-
CDMA and LTE RANs.
5.65 A single passive infrastructure deployment can support GSM, W-CDMA and LTE technologies.
5.66 A single backhaul infrastructure (microwave or leased lines) can support GSM, W-CDMA and LTE RAN
technologies for both voice and mobile broadband services.
5.67 In addition to the economies of scope advantages of network infrastructure, there are also
considerable synergies within the CSPs’ business that can be had. For example, CSPs offering voice
and mobile broadband services have shared customer care, marketing and sales functions.
5.68 There are also benefits for those CSPs offering mobile money services. Since the service use SMS as
its main platform, most of the costs incurred to offer SMS are the same for mobile money.
Cartesian: Mobile Access, National Voice Calls and SMS
Copyright © 2015 Cartesian Ltd. All rights reserved. 31
5.69 Therefore, CSPs are able to leverage their network infrastructure to provide mobile money services.
The services use the same RAN and core network infrastructure as mobile access, voice and SMS
services. CSPs are also able to amortize other common fixed costs across the two services, such as IT,
BSS/OSS and some personnel costs. By providing mobile money services, CSPs are able to reduce the
unit cost of mobile access, voice and SMS services provisioning.
5.70 If offering fixed and mobile services, CSPs can provide both over the same network. In Uganda, the
majority of fixed services are implemented employing fixed-wireless technologies. In most cases, GSM
or W-CDMA is used for both fixed and mobile voice. Therefore, CSPs offering W-CDMA can potentially
leverage the same technology to offer fixed and mobile broadband services.
5.71 In terms of fixed and mobile services, CSPs offering both services can benefit in at least two ways. The
first one is to offer both fixed and mobile services over the same network (i.e. most fixed line services
in Uganda are delivered over fixed-wireless technologies).
5.72 Launching fixed voice services allow CSPs to amortize the investment in mobile networks. However,
in this example, the economies of scope benefits will only be achievable in cases where the demand
does not exceed the network capacity. Otherwise, there are only variable costs that have to be
incurred in order to increase capacity.
5.73 MTN and UTL are able to benefit from economies of scope since both CSPs have mobile and fixed
operations. The two CSPs also offer fixed services using both fibre infrastructure and fixed-wireless
networks (i.e. GSM and W-CDMA). Other costs such as backhaul, network operations, some general
administrative costs and some marketing costs can also be diluted across fixed and mobile since both
services require common infrastructure and organization structure.
5.74 In cases where a fixed and mobile CSP has invested in fibre infrastructure to offer both direct fixed
connectivity (i.e. retail leased lines) this can be used to support its fixed broadband services as
backhaul infrastructure. This will reduce CSPs reliance on wholesale provides and thus reduce the
overall cost to deliver mobile broadband services.
5.75 MTN, UTL and Orange have fibre infrastructure in several areas within Uganda. These operators are
able to leverage their fibre infrastructure in Uganda to provide backhaul for mobile voice and
broadband.
Extent of Vertical Integration
5.76 Vertical integration can offer significant benefits to CSPs with operations in upstream and
downstream markets. Integrated CSPs are able to use their own infrastructure to self-supply essential
inputs to their mobile access, voice and SMS services and reduce the dependency of acquiring this
inputs via wholesale. There are also opportunities for cost savings through vertical integration as
processes and systems can be closely integrated.
5.77 In order to provide mobile access, voice and SMS services, CSPs require a number of upstream inputs,
for example passive infrastructure, backhaul and interconnection are essential.
5.78 Where firms control both downstream and upstream markets there is a risk that they may seek to
leverage their presence in the wholesale market to foreclose competition in the retail market. This
issue is explored in the Market Conduct assessment.
Cartesian: Mobile Access, National Voice Calls and SMS
Copyright © 2015 Cartesian Ltd. All rights reserved. 32
5.79 Self-supply is beneficial in situations where a wholesale alternative is either more expensive than
sourcing the input internally, or not readily available at all. Integrated CSPs are able to leverage assets
from their other operations to reduce costs or simply to have access to specific upstream resources.
The ability to manage the quality of upstream inputs is another significant benefit for vertically
integrated CSPs.
5.80 All CSPs in Uganda will have a mix of self-supply and wholesale acquisition for backhaul capacity. The
decision to self-supply depends on the wholesale infrastructure available and its capacity in different
locations. For example, in regions where there is no fibre infrastructure, CSPs will consider deploying
microwave infrastructure for short distance, or fibre infrastructure in case of long-distance or regions
with significant demand.
5.81 CSPs that already have fibre infrastructure will benefit from not needing to find the additional CAPEX
to build the network. By the same token, the cost of this fibre network is shared across different
services Self-supply enables CSPs to internalise economies of scale and scope, and to achieve a lower
unit cost. However, this is only an efficient alternative if CSPs have sufficient volume, otherwise
wholesale would be a less expensive option.
5.82 MTN, UTL and Orange are currently able to leverage their fibre infrastructure in several locations in
the country to serve their backhaul demand. Since these CSPs already have fibre deployments in
several regions in the countries, they have the benefit of being able to use this network and avoid
extra wholesale costs.
5.83 The differences in the extent of vertical integration between competitors is a significant factor in
determining the market power of firms operating in this market.
Market Structure Assessment Conclusions
5.84 The mobile access, voice and SMS market is highly concentrated. MTN and Airtel are the largest CSPs
with 92% of all subscriptions. The recent reduction in the smaller CSPs' market shares suggest that
this high level of market concentration is unlikely to change in the near term.
5.85 Since there are significant spectrum constrains and funding requirements, we do not expect to see
the entry of new Public Infrastructure Provider (e.g. MNOs) in the market during the timeframe of
this assessment.
5.86 Network effects plays a significant role in the mobile access, voice and SMS market. Since the market
is characterized by low prices and significant discounts for on-net calls, consumers may choose to join
CSPs that have a large number of subscribers. There is a high probability that the majority of a given
consumers’ contacts will be connected to a large CSP.
5.87 Network effects also influence the adoption of mobile money services. Reduced fees for transaction
within a CSP’s network and limitations on the use of mobile money to buy services from the
competition (i.e. buy airtime credit) does influence consumers to select large CSPs. The larger the CSP
is, the more accounts a clients will have available within that network.
5.88 The market has significant fixed costs, so economies of scale offer important benefits to large CSPs by
way of reducing their unit costs. Large CSPs are able to leverage their size in both Uganda and
internationally to take advantage of lower unit costs than other local or smaller CSPs.
Cartesian: Mobile Access, National Voice Calls and SMS
Copyright © 2015 Cartesian Ltd. All rights reserved. 33
5.89 CSPs are also able to reduce their unit cost through economies of scope. CSPs which also offer mobile
broadband, fixed and mobile or mobile access and money services benefit from economies of scope.
CSPs offering more than one service have substantial benefits from spreading their fixed costs across
multiple services.
5.90 In addition, vertically integrated CSPs are able to leverage their operations from other markets to self-
supply upstream inputs. In the case of mobile access, voice and SMS, CSPs with fixed infrastructure
can benefit by self-supply of backhaul.
Cartesian: Mobile Access, National Voice Calls and SMS
Copyright © 2015 Cartesian Ltd. All rights reserved. 34
6 Market Conduct Assessment
Scale and Ability to Access Resources
6.1 Multinational CSPs are able to leverage their scale at group level to support local operations. Benefits
to the local operations may include greater purchasing power, easier and lower cost access to capital,
access to knowledge and experience from other group companies and greater brand recognition. In
some cases group companies may also provide shared services to the local operations, for example a
central procurement department or a central team responsible for negotiating roaming agreements
with international CSPs.
6.2 Uganda’s mobile access, voice and SMS market includes three multinational CSPs (MTN, Airtel and
Africell - operating under the brand name “Orange”). The three multinational CSPs have operations
in several markets (including significant presence in Africa), that generate substantial revenues (Figure
21).
Financial Results from Multinational CSPs present in Uganda, 201310
CSP Global
subscriptions
Number of global
operations
Operations in Africa
Global revenues
EBTIDA margin
Profits after tax
MTN 200M 22 15 USD 11B 43% USD 2.7B
Airtel 221M 20 16 USD 14.7B 31% USD 418M
Africell ~12M 4 ~USD 305M USD 305M
(2012) 41% (2012) N/A
Source: CSP financial statements
6.3 Africell acquired its operations in Uganda from the Orange Group, towards the end of 2014. (Orange
Group was formerly known as France Telecom.) In addition to Uganda, Africell has operations in
Gambia, Sierra Leone and the Democratic Republic of the Congo.
6.4 Africell is a much smaller corporation than Orange Group, which may reduce the benefits of vertical
integration that Orange previously enjoyed. Arguably, Africell will also have different credit conditions
than those of Orange currently has.
6.5 The market therefore now has two strong international groups: MTN and Airtel, each with significant
presence in the African continent. International scale provides some advantage in terms of buyer
power, ability to invest and access to human resources compared to the other mobile CSPs.
6.6 In terms of buyer power, large international groups are able to leverage their global procurement
power to benefit from better discounts when acquiring network equipment, IT infrastructure and
mobile handsets.
10 Africell data from 2012
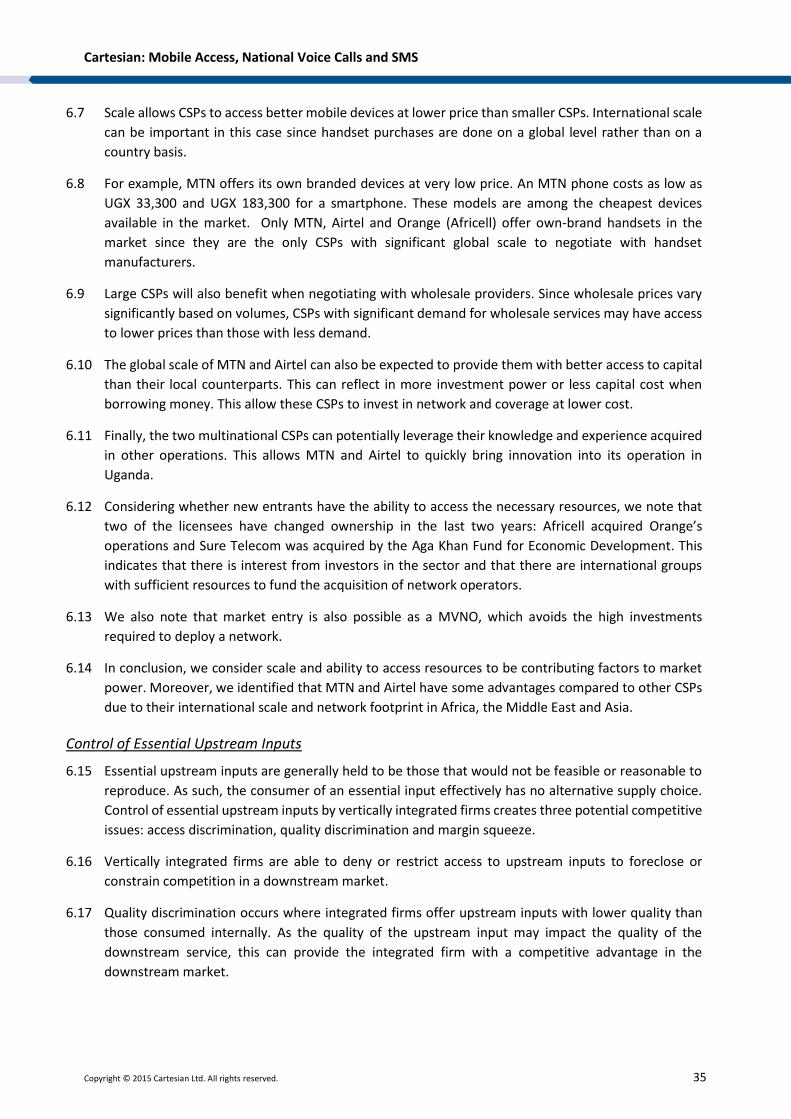
Cartesian: Mobile Access, National Voice Calls and SMS
Copyright © 2015 Cartesian Ltd. All rights reserved. 35
6.7 Scale allows CSPs to access better mobile devices at lower price than smaller CSPs. International scale
can be important in this case since handset purchases are done on a global level rather than on a
country basis.
6.8 For example, MTN offers its own branded devices at very low price. An MTN phone costs as low as
UGX 33,300 and UGX 183,300 for a smartphone. These models are among the cheapest devices
available in the market. Only MTN, Airtel and Orange (Africell) offer own-brand handsets in the
market since they are the only CSPs with significant global scale to negotiate with handset
manufacturers.
6.9 Large CSPs will also benefit when negotiating with wholesale providers. Since wholesale prices vary
significantly based on volumes, CSPs with significant demand for wholesale services may have access
to lower prices than those with less demand.
6.10 The global scale of MTN and Airtel can also be expected to provide them with better access to capital
than their local counterparts. This can reflect in more investment power or less capital cost when
borrowing money. This allow these CSPs to invest in network and coverage at lower cost.
6.11 Finally, the two multinational CSPs can potentially leverage their knowledge and experience acquired
in other operations. This allows MTN and Airtel to quickly bring innovation into its operation in
Uganda.
6.12 Considering whether new entrants have the ability to access the necessary resources, we note that
two of the licensees have changed ownership in the last two years: Africell acquired Orange’s
operations and Sure Telecom was acquired by the Aga Khan Fund for Economic Development. This
indicates that there is interest from investors in the sector and that there are international groups
with sufficient resources to fund the acquisition of network operators.
6.13 We also note that market entry is also possible as a MVNO, which avoids the high investments
required to deploy a network.
6.14 In conclusion, we consider scale and ability to access resources to be contributing factors to market
power. Moreover, we identified that MTN and Airtel have some advantages compared to other CSPs
due to their international scale and network footprint in Africa, the Middle East and Asia.
Control of Essential Upstream Inputs
6.15 Essential upstream inputs are generally held to be those that would not be feasible or reasonable to
reproduce. As such, the consumer of an essential input effectively has no alternative supply choice.
Control of essential upstream inputs by vertically integrated firms creates three potential competitive
issues: access discrimination, quality discrimination and margin squeeze.
6.16 Vertically integrated firms are able to deny or restrict access to upstream inputs to foreclose or
constrain competition in a downstream market.
6.17 Quality discrimination occurs where integrated firms offer upstream inputs with lower quality than
those consumed internally. As the quality of the upstream input may impact the quality of the
downstream service, this can provide the integrated firm with a competitive advantage in the
downstream market.
Cartesian: Mobile Access, National Voice Calls and SMS
Copyright © 2015 Cartesian Ltd. All rights reserved. 36
6.18 Finally, margin squeeze refers to the ability of a vertically integrated firm to set prices in both the
upstream and downstream markets such that competitors consuming the upstream inputs are not
able to profitably compete in the downstream market.
6.19 The main upstream inputs to mobile access, voice and SMS are:
Call termination
Passive infrastructure (towers);
Wholesale leased lines and dark fibre (backhaul);
International voice transit; and
International transmission.
6.20 Termination is an essential input since without it CSPs would be unable to supply calls and SMS
destined to subscribers of other networks. As discussed in the termination market report, each CSP
has a monopoly in the market for terminating calls and SMS to its subscribers.
6.21 Because termination is an essential input controlled by a monopoly provider, CSPs are mandated to
offer termination services to other CSPs. However, in practice, CSPs may not fully cooperate or may
take considerable time to deploy the interconnection agreement. There is evidence that the latest
entrant in the market, K2, experienced difficulties in obtaining interconnection with MTN. Other cases
brought to the attention of the UCC include One Solutions and Datanet.
6.22 For passive infrastructure, the majority of CSPs in Uganda have divested their towers to the two tower
companies in the market, ATC and Eaton Towers. The passive infrastructure market is being reviewed
separately for evidence of SMP. Within the mobile calling and SMS market, passive infrastructure
would be of interest if access to leased towers was controlled by any of the mobile operators.
6.23 In 2011, American Tower Corporation (“American Tower”) and MTN Group Limited (“MTN Group”)
announced a new joint venture (“ATC Uganda”) to acquire the tower assets of MTN in Uganda.
According to the press release, ATC Uganda is to be managed by American Tower and controlled by a
holding company of which American Tower will hold a 51% stake and MTN group holds a 49% stake.
MTN’s investment in ATC Uganda is relevant should MTN have influence over the activities of ATC
Uganda. However, we found no evidence that ATC Uganda is acting to foreclose or distort competition
in the mobile broadband market.
6.24 Backhaul from cell sites to the core network is a necessary input to mobile voice and SMS services.
CSPs use a mix of microwave and fixed network for backhaul, depending on the location of the cell
site, distance and availability of fixed network infrastructure. Microwave links are provided through
self-supply.
6.25 In regions where CSPs need fixed infrastructure, they can build their own fibre or copper network or
they can buy wholesale leased line capacity. The investment in fibre infrastructure only makes sense
for CSPs using the network for additional purposes to backhaul (i.e. fixed broadband offers), since
backhaul alone does not justify the considerable investment cost of fibre.
6.26 MTN, Orange and UTL have their own fixed infrastructure and the three CSPs offer wholesale leased
line capacity. These operators are therefore vertically integrated. At the time of writing, the leased
Cartesian: Mobile Access, National Voice Calls and SMS
Copyright © 2015 Cartesian Ltd. All rights reserved. 37
line market has not been formally assessed for SMP. However, we found no evidence that MTN, UTL
and Orange are denying access to their wholesale inputs to other CSPs.
6.27 There are also alternative providers in Uganda offering dark fibre. UETCL, NITA and Google offer dark
fibre infrastructure in the wholesale market for long distances (i.e. UETCL and NITA) or reach in
metropolitan areas (i.e. Google through C-Squared). CSPs are able to use dark fibre network to serve
their demand for backhaul capacity.
6.28 Suppliers in the international voice transit and international transmission markets are global carriers
such as Tata Communications, BICS and Zain. The retail mobile voice and SMS operators do not control
these upstream inputs.
6.29 In summary, control of the upstream input of mobile termination is a relevant factor in the market
for mobile voice and SMS. This is particular relevant when the differential between retail on and off-
net prices, and the level of interconnection rates is taken into consideration.
6.30 As already noted above, on and off-net pricing is a significant feature of the retail market. With this
in mind, the level of the interconnection prices may limit the ability of smaller CSPs to compete with
MTN and Airtel's discounted on-net prices. As these two operators have most of the market share
between them, most of the calls made by customers of the smaller CSPs would be terminated on
either Airtel's and MTN's networks – i.e. off net – whereas calls made by customers connected to
either Airtel's or MTN's networks are more likely on-net. Therefore, if the level of the interconnection
prices is sufficiently high it may limit the extent to which smaller CSPs’ off-net prices, can compete
with Airtel's and or MTN's on-net prices
Access to Sales and Distribution Channels
6.31 Mobile broadband, mobile access, calls, SMS and handsets are usually all offered by the sales channels
since these products and services can be bundled.
6.32 Independent sales agents partner with retail dealers to sell the products and services in the various
districts in Uganda. For example, Nilecom has over 5,000 agents.
6.33 Retail outlets are normally established in large urban centres. Most telecoms sales are made either
via these independent agents or directly using a mobile phone (i.e. to top up credits over USSD, or
mobile money).
6.34 All CSPs offer direct sales through their website, but due to the low internet penetration in the country,
this channel does not currently generate significant sales.
6.35 In order to attract more dealers and independent agents, CSPs need to present a good commission
policy and scale. Independent agents will be attracted by CSPs that are not only able to offer better
remuneration, but also can provide a product that is relatively “easy” to sell. Arguably, large CSPs with
well-known brands will attract more independent dealers.
6.36 Some CSPs also offer ongoing dealership programs with a focus on developing the dealer relationship.
For example, MTN offers a dealership program that awards the top dealers and agents each year. We
understand that some of the agents have exclusivity terms with MTN.
6.37 Since MTN is the largest CSP in the market, it is able to provide substantial scale to attract more
dealers to sell its products. The two biggest telecom retailer chains, Simba Telecom (30 shops in the
Cartesian: Mobile Access, National Voice Calls and SMS
Copyright © 2015 Cartesian Ltd. All rights reserved. 38
country) and Nilecom (20 shops in the country) only offer MTN products. Nilecom was acquired in
2008 by South African company Cellcom, which is MTN’s biggest dealer in that country.
6.38 In 2010, Simba claimed it was accountable for approximately 21% of MTN’s prepaid turnover. This
gives an idea of how representative sales from dealers and their agents are compared to total CSP
sales.
6.39 Orange has approximately 30 dealers listed on its website, and it doubtless has a significant number
of agents working with these dealers.
6.40 Airtel operates two of its own stores, located in Kampala. Additionally, there are approximately 30
dealers operating Airtel-branded stores in addition to the independent agents.
6.41 With the relatively sizable financial capacity available to large CSPs, they are able to offer a good
number of promotions and large commissions (for the market), which in turn help to attract and retain
a substantial network of retailers and distributers.
6.42 Establishing a retail distribution network in Uganda can be significantly challenging to new players
entering into the market due to the scale of investment to fund attractive commission packages
needed to gain dealer and independent agent partnerships.
6.43 Since internet penetration is very low, it would not be effective for a CSP to enter into the market via
low-cost online channels. It must therefore invest in building its own network of retailers and
independent agents in the country, which can be a prohibitively expensive barrier to market entry.
6.44 The telecoms retail market structure in Uganda clearly favours CSPs that are already established in
the market, limiting the growth potential of new CSPs. MTN is in a particularly advantageous position
as it has established exclusive deals with the largest telecom retailers and independent agents in the
country.
Transparency of Retail Consumer Information
6.45 High prepaid penetration is driving most mobile voice and SMS plan in the country. CSPs are offering
three main type of plans consisting on charging by:
Second;
Minute; and
Bundles including voice, SMS and Data services.
6.46 All CSPs offer the services in a similar way. The variations among CSPs’ offers are based on specific
promotions. For example, MTN offers significant discounts with its MTN Zone tariff, UTL offers
discounts based on top-up volumes, while Airtel offers extra credit for customers so their able to finish
their call and pay for later for the minutes used.
6.47 The price structure is simple and it is in line with prepaid offers in other countries. Per-second charging
also makes the pricing more transparent to customers since they have the exact idea about how much
they are paying per call, even in a very short call (less than one minute).
Cartesian: Mobile Access, National Voice Calls and SMS
Copyright © 2015 Cartesian Ltd. All rights reserved. 39
6.48 Most information regarding plans, tariffs and promotions are easy to find at CSPs’ websites. And there
is no evidence of customers complaining about misleading information on plans and tariffs in the
recent NRA’s quality report.11
6.49 The only exception we found MTN Zone tariffs. Customers on these tariffs are eligible to significant
discounts (i.e. from 5% to 100%) depending on the call type (on-net and off-net) and time of the day
(peak and off-peak hours). The details of the MTN Zone tariff discounts are not published on MTN’s
website. It is possible that other CSPs also have tariffs and offers which are not advertised.
6.50 Informal interactions with a limited number of Ugandan consumers also reveals high awareness of
the relative pricing of the CSPs mobile voice services, particularly the reduced rates available through
on-net calling. This is consistent with the finding that many consumers have more than one SIM.
6.51 In general, transparency of retail pricing in the market is reasonable. However, MTN does not appear
to be open about the details of MTN Zone tariffs. Other CSPs may also have offers and promotions
that are not openly advertised.
Ease of Consumer Switching
6.52 Mobile access, voice and SMS customers in Uganda face few barriers to switch their CSP. The market
is predominantly prepaid (99% of total subscriptions) which means customers have no contract or
lock-in period conditions with CSPs.
6.53 Most handsets in the market are unlocked. As such, customers can easily swap SIM cards from
different CSP anytime they want.
6.54 There are also multi-SIM devices available in the market. These devices allow customers to easily
select between two networks on a per-call basis.
6.55 The lack of mobile number portability (MNP) in Uganda may potentially affect customers as they will
lose their phone number if they switch completely to another CSP. We found anecdotal evidence that
for some consumers, particularly business users, this is an important consideration for retaining a
previous SIM.
6.56 Another limitation to switch CSP is in the case when consumers opt for voice, SMS and mobile
broadband bundles. In this case, depending on the discount benefits consumers have, it will make it
more difficult for them to buy services separately from different CSPs.
6.57 The case above is also true in the case of mobile money services. Since there are benefits to customers
to select a specific CSP for mobile money (e.g. lower tariffs for on-net transfers). Therefore, customers
using both mobile access and mobile money services may be more reluctant to change the CSP for
mobile access and lose the mobile money benefits.
6.58 However, even in the both cases above, customers using bundle or mobile money services are free
and able to buy the services from different CSPs if they prefer to do so since there are no contracts.
Customer can have one SIM card for mobile access, voice and SMS and another one for mobile money
services.
11 Source: UCC, 2014.
Cartesian: Mobile Access, National Voice Calls and SMS
Copyright © 2015 Cartesian Ltd. All rights reserved. 40
6.59 The issue of switching barriers is therefore complex. Factors which suggest that the barriers are low
include the predominance of prepaid subscriptions, the wide availability of dual-SIM phones, the low
price of SIMs (average of US$1 per SIM for practically all CSPs) and the ease for consumers to have
more than one active SIM. Factors which suggest that barriers do exist include the lack of mobile
number portability (MNP) and the coupling of mobile money services with the SIM.
6.60 We believe that for some consumers these factors are interrelated, i.e. they have subscriptions with
more than one CSP to overcome the lack of MNP, or to be able to use the mobile money service of a
CSP that is not their preferred choice for voice and SMS services.
6.61 In conclusion, whilst the ability for consumers to have more than one active SIM provides a means of
overcoming switching barriers in the market, this is not without cost (inconvenience).
Countervailing Buyer Power
6.62 There is no clear evidence of countervailing buying power in the market. The mobile access, voice and
SMS market is characterized as a mass-market service, so CSPs are not dependent on a small number
of large customers.
6.63 Large business customers could potentially have some countervailing buying power as they demand
large volumes of services. There is some evidence of this in the fixed voice and business connectivity
markets, where large corporate customers are able to exert pressure on price and conditions.
6.64 It is possible that a small number of specific corporations might wield some bargaining power when
negotiating with mobile CSPs, but such cases are very limited and do not influence the overall market.
Evidence of Dynamic Competition
6.65 CSPs are investing on more advanced technology (i.e. W-CDMA and HSPA+), increasing coverage,
reducing costs to improve margins and offering bundles and promotional price to differentiate against
competition. CSPs are investing considerable capital in improving their GSM coverage at the same
time as they are deploying W-CDMA and HSPA+ in several areas in the country. MTN, Airtel and
Orange have investing significantly in improving their W-CDMA and HSPA+ coverage and quality in
the country.
6.66 Technology is one of the main ways in which CSPs position themselves to have the most advanced
network and therefore are able to provide better quality services in the market.
6.67 Most of passive infrastructure in the market is now provided via leasing agreements with tower
leasing companies (UTL is the only CSP to self-supply all its passive infrastructure). This development
is a result of CSPs selling their passive infrastructure to reduce costs and turn CAPEX into OPEX.
Therefore, these initiatives aims to improve margins since prices are becoming significantly
competitive.
6.68 Passive infrastructure leasing also allows CSPs to increase their coverage without the CAPEX incurred
in building towers. Coverage is another relevant competitive factor in the market and CSPs with better
coverage position themselves to provide better services than those that cover less areas.
6.69 There are also evidence that CSPs compete through price differentiation and bundling strategies. CSPs
are promoting voice, SMS and data bundles presumably to offer bundles that better meet customers’
needs.
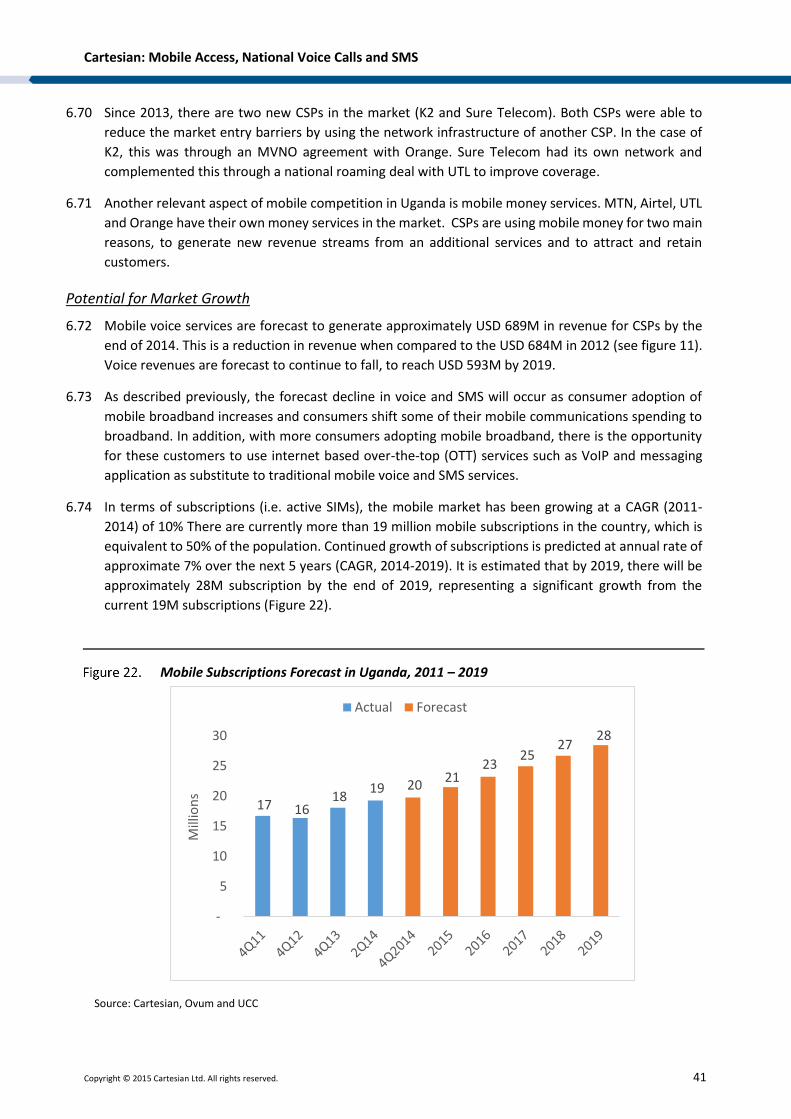
Cartesian: Mobile Access, National Voice Calls and SMS
Copyright © 2015 Cartesian Ltd. All rights reserved. 41
6.70 Since 2013, there are two new CSPs in the market (K2 and Sure Telecom). Both CSPs were able to
reduce the market entry barriers by using the network infrastructure of another CSP. In the case of
K2, this was through an MVNO agreement with Orange. Sure Telecom had its own network and
complemented this through a national roaming deal with UTL to improve coverage.
6.71 Another relevant aspect of mobile competition in Uganda is mobile money services. MTN, Airtel, UTL
and Orange have their own money services in the market. CSPs are using mobile money for two main
reasons, to generate new revenue streams from an additional services and to attract and retain
customers.
Potential for Market Growth
6.72 Mobile voice services are forecast to generate approximately USD 689M in revenue for CSPs by the
end of 2014. This is a reduction in revenue when compared to the USD 684M in 2012 (see figure 11).
Voice revenues are forecast to continue to fall, to reach USD 593M by 2019.
6.73 As described previously, the forecast decline in voice and SMS will occur as consumer adoption of
mobile broadband increases and consumers shift some of their mobile communications spending to
broadband. In addition, with more consumers adopting mobile broadband, there is the opportunity
for these customers to use internet based over-the-top (OTT) services such as VoIP and messaging
application as substitute to traditional mobile voice and SMS services.
6.74 In terms of subscriptions (i.e. active SIMs), the mobile market has been growing at a CAGR (2011-
2014) of 10% There are currently more than 19 million mobile subscriptions in the country, which is
equivalent to 50% of the population. Continued growth of subscriptions is predicted at annual rate of
approximate 7% over the next 5 years (CAGR, 2014-2019). It is estimated that by 2019, there will be
approximately 28M subscription by the end of 2019, representing a significant growth from the
current 19M subscriptions (Figure 22).
Mobile Subscriptions Forecast in Uganda, 2011 – 2019
Source: Cartesian, Ovum and UCC
17 16 18
19 20 21
23 25
27 28
-
5
10
15
20
25
30
Mill
ion
s
Actual Forecast
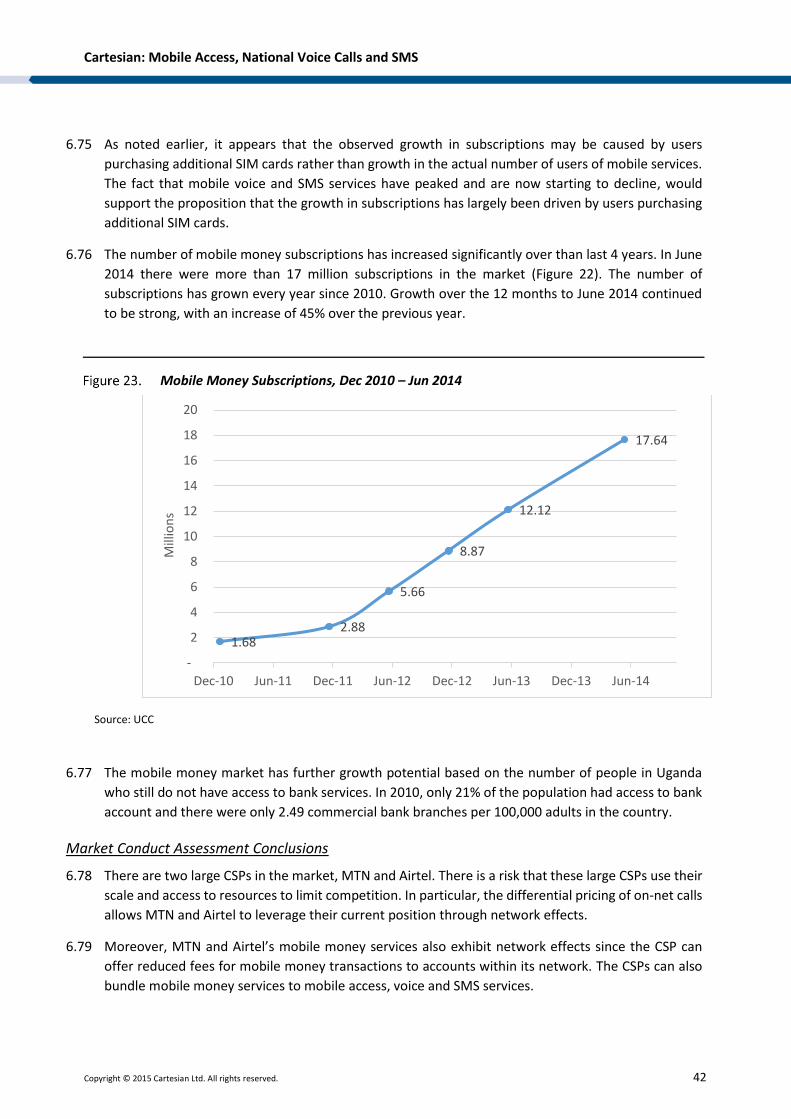
Cartesian: Mobile Access, National Voice Calls and SMS
Copyright © 2015 Cartesian Ltd. All rights reserved. 42
6.75 As noted earlier, it appears that the observed growth in subscriptions may be caused by users
purchasing additional SIM cards rather than growth in the actual number of users of mobile services.
The fact that mobile voice and SMS services have peaked and are now starting to decline, would
support the proposition that the growth in subscriptions has largely been driven by users purchasing
additional SIM cards.
6.76 The number of mobile money subscriptions has increased significantly over than last 4 years. In June
2014 there were more than 17 million subscriptions in the market (Figure 22). The number of
subscriptions has grown every year since 2010. Growth over the 12 months to June 2014 continued
to be strong, with an increase of 45% over the previous year.
Mobile Money Subscriptions, Dec 2010 – Jun 2014
Source: UCC
6.77 The mobile money market has further growth potential based on the number of people in Uganda
who still do not have access to bank services. In 2010, only 21% of the population had access to bank
account and there were only 2.49 commercial bank branches per 100,000 adults in the country.
Market Conduct Assessment Conclusions
6.78 There are two large CSPs in the market, MTN and Airtel. There is a risk that these large CSPs use their
scale and access to resources to limit competition. In particular, the differential pricing of on-net calls
allows MTN and Airtel to leverage their current position through network effects.
6.79 Moreover, MTN and Airtel’s mobile money services also exhibit network effects since the CSP can
offer reduced fees for mobile money transactions to accounts within its network. The CSPs can also
bundle mobile money services to mobile access, voice and SMS services.
1.682.88
5.66
8.87
12.12
17.64
-
2
4
6
8
10
12
14
16
18
20
Dec-10 Jun-11 Dec-11 Jun-12 Dec-12 Jun-13 Dec-13 Jun-14
Mill
ion
s
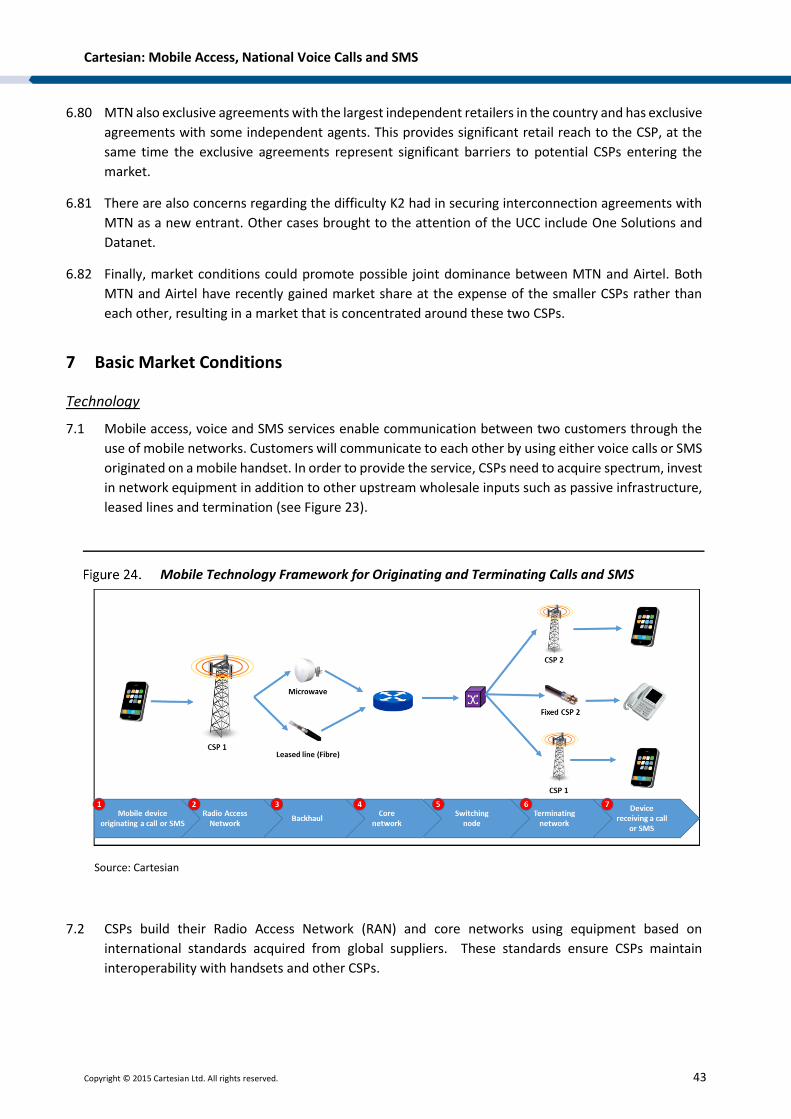
Cartesian: Mobile Access, National Voice Calls and SMS
Copyright © 2015 Cartesian Ltd. All rights reserved. 43
6.80 MTN also exclusive agreements with the largest independent retailers in the country and has exclusive
agreements with some independent agents. This provides significant retail reach to the CSP, at the
same time the exclusive agreements represent significant barriers to potential CSPs entering the
market.
6.81 There are also concerns regarding the difficulty K2 had in securing interconnection agreements with
MTN as a new entrant. Other cases brought to the attention of the UCC include One Solutions and
Datanet.
6.82 Finally, market conditions could promote possible joint dominance between MTN and Airtel. Both
MTN and Airtel have recently gained market share at the expense of the smaller CSPs rather than
each other, resulting in a market that is concentrated around these two CSPs.
7 Basic Market Conditions
Technology
7.1 Mobile access, voice and SMS services enable communication between two customers through the
use of mobile networks. Customers will communicate to each other by using either voice calls or SMS
originated on a mobile handset. In order to provide the service, CSPs need to acquire spectrum, invest
in network equipment in addition to other upstream wholesale inputs such as passive infrastructure,
leased lines and termination (see Figure 23).
Mobile Technology Framework for Originating and Terminating Calls and SMS
Source: Cartesian
7.2 CSPs build their Radio Access Network (RAN) and core networks using equipment based on
international standards acquired from global suppliers. These standards ensure CSPs maintain
interoperability with handsets and other CSPs.
Cartesian: Mobile Access, National Voice Calls and SMS
Copyright © 2015 Cartesian Ltd. All rights reserved. 44
7.3 RAN and core network technologies have evolved since the creation of GPRS and EDGE. In the past
ten years, CSPs globally have been investing in migrating to GSM standards by deploying W-CDMA
and LTE networks. More modern technologies enable a better use of the spectrum.
7.4 The cost of deploying a new mobile technology, however, can be considerable obliging CSPs to
upgrade their RAN and core network and in some cases, acquire new spectrum to be able to offer
mobile services.
7.5 The most popular network technology is GSM, which connects 78% of all mobile subscriptions in the
country.
7.6 Other technologies such as WiMAX and CDMA are present in the market supporting both voice and
broadband. However, although both technologies are mobile ones, they are only used to offer fixed-
wireless services and thus are not included in this market.12
7.7 Moreover, CSPs are investing in new technologies (i.e. WCDMA and LTE) to be able to offer mobile
broadband services in the country. It is expected that W-CDMA subscriptions will represent 22% of
total subscriptions in the country by the end of 2014. Since W-CDMA is also capable of supporting
voice services, CSPs are gradually migrating customers to W-CDMA as their coverage increases.
7.8 It is highly likely that CSPs in Uganda will keep the two technologies since they are able to use GSM
technology to support voice services in areas where there is no W-CDMA coverage. This will allow
CSPs more time to grow their W-CDMA presence without providing any interruption to the provision
of mobile voice and SMS services.
7.9 LTE is a nascent technology in the market; its coverage is currently limited to a small portion on the
population. Whilst there are some early Voice over LTE (VoLTE) deployments in more developed
markets, none of the Ugandan MNOs currently support it on their networks. We believe that VoLTE
will not impact the competition in the mobile access, voice and SMS market during the timeframe of
this assessment.
7.10 LTE may also be used for OTT messaging and voice services, however we expect this to be limited in
scale as compared to OTT use on W-CDMA networks.
7.11 Spectrum is a relevant input in the provision of mobile broadband. CSPs needs to be constantly
investing in ways to optimize the use of their spectrum since it is a scarce resource
7.12 The spectrum allocated for mobile services in Uganda ranges from 450MHz to 3.5MHz. Low frequency
spectrum (e.g. 450MHz) has good propagation characteristics, making it ideal for covering wide area
(i.e. rural areas) and penetrating buildings. However, the capacity available in low frequencies is
limited, so MNOs generally use higher frequency bands.
7.13 The most attractive bands are those between 800MHz and 2.5GHz. CSPs in Uganda use these bands
to offer the majority of mobile voice and broadband services. Beyond 2.5GHz, spectrum is commonly
used for fixed-wireless applications.
7.14 In Uganda, spectrum has historically not been awarded via auction. Instead, allocation is based on
proposals submitted by CSPs for use of available spectrum bands. These proposals include a detailed
12 Includes both fixed and mobile versions of WiMAX.
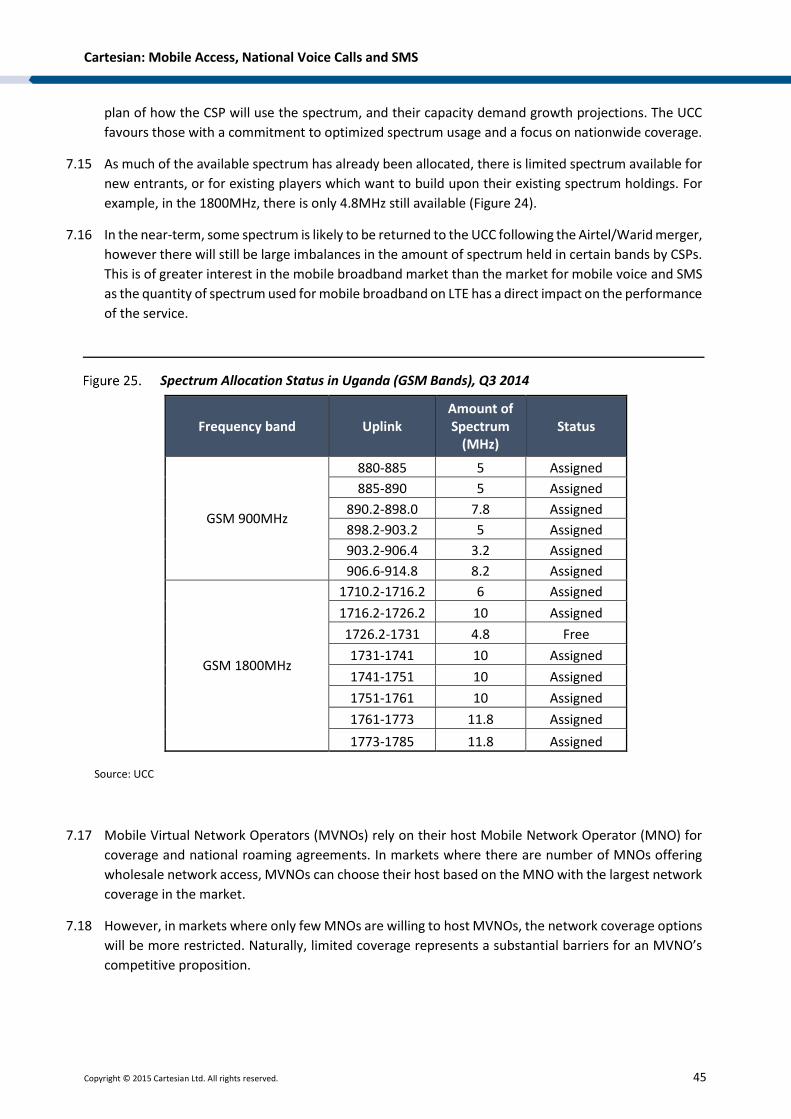
Cartesian: Mobile Access, National Voice Calls and SMS
Copyright © 2015 Cartesian Ltd. All rights reserved. 45
plan of how the CSP will use the spectrum, and their capacity demand growth projections. The UCC
favours those with a commitment to optimized spectrum usage and a focus on nationwide coverage.
7.15 As much of the available spectrum has already been allocated, there is limited spectrum available for
new entrants, or for existing players which want to build upon their existing spectrum holdings. For
example, in the 1800MHz, there is only 4.8MHz still available (Figure 24).
7.16 In the near-term, some spectrum is likely to be returned to the UCC following the Airtel/Warid merger,
however there will still be large imbalances in the amount of spectrum held in certain bands by CSPs.
This is of greater interest in the mobile broadband market than the market for mobile voice and SMS
as the quantity of spectrum used for mobile broadband on LTE has a direct impact on the performance
of the service.
Spectrum Allocation Status in Uganda (GSM Bands), Q3 2014
Frequency band Uplink Amount of Spectrum
(MHz) Status
GSM 900MHz
880-885 5 Assigned
885-890 5 Assigned
890.2-898.0 7.8 Assigned
898.2-903.2 5 Assigned
903.2-906.4 3.2 Assigned
906.6-914.8 8.2 Assigned
GSM 1800MHz
1710.2-1716.2 6 Assigned
1716.2-1726.2 10 Assigned
1726.2-1731 4.8 Free
1731-1741 10 Assigned
1741-1751 10 Assigned
1751-1761 10 Assigned
1761-1773 11.8 Assigned
1773-1785 11.8 Assigned Source: UCC
7.17 Mobile Virtual Network Operators (MVNOs) rely on their host Mobile Network Operator (MNO) for
coverage and national roaming agreements. In markets where there are number of MNOs offering
wholesale network access, MVNOs can choose their host based on the MNO with the largest network
coverage in the market.
7.18 However, in markets where only few MNOs are willing to host MVNOs, the network coverage options
will be more restricted. Naturally, limited coverage represents a substantial barriers for an MVNO’s
competitive proposition.
Cartesian: Mobile Access, National Voice Calls and SMS
Copyright © 2015 Cartesian Ltd. All rights reserved. 46
7.19 In addition to network and spectrum, CSPs rely on a series of wholesale requisites to be able to offer
mobile broadband services. Key upstream requirements are backhaul capacity, termination and
international transit.
7.20 To provide mobile services to their customers, CSPs need backhaul capacity to transmit voice and SMS
traffic between the RAN and core network. Leased lines and microwave are the two main technologies
employed to support backhaul inputs. CSPs will use a mix of their own and wholesale infrastructures,
depending on the cell location and the RAN-to-RAN or RAN-to-core distances.
7.21 SMS and call termination are also other essential upstream inputs to the provision of mobile services.
CSPs need to interconnect to each other in order to terminate calls originated in their network in all
other CSPs network.
7.22 Moreover, CSPs need inputs from Global carriers in terms of international transit and interconnect to
be able to offer international voice and SMS services to their customers. However, international calls
are not included in this market.
7.23 Therefore, there are several upstream markets generating essential inputs to the provision of mobile
access, voice and SMS service.
Cost Conditions
7.24 MNOs have significant costs of entry into the market to provide mobile access, voice and SMS services.
As detailed above, acquiring spectrum and building a mobile network are the two most significant
costs.
7.25 In Uganda, spectrum fees are not significantly high. Spectrum fees are fixed, based on specific
frequency ranges, and determined on a price per MHz basis. For example, 10 MHz on the 1,900 MHz
band was awarded for an annual fee of UGX 100,000,000.13
7.26 The most significant costs to CSPs in offering mobile broadband services are to build RAN and core
networks. For example, CSPs must build their RANs in multiple locations in order to offer wide
coverage to their customers. As such, CSPs will need to invest in passive infrastructure and RAN
equipment to enable them to extend their network coverage across the country.
7.27 As an example of how significant fixed costs are in order to deploy a mobile network, American Tower
Company (ATC) acquired 1,000 cell sites from Mobile Telephone Networks (MTN) in 2013 for a total
of USD 169M, representing an average of USD 169,000 per site. These are passive infrastructure costs,
and do not include RAN and core network equipment.14
7.28 ATC currently owns 1,226 towers across the country, which provides services for all CSPs. These
towers cover approximately 70% of the country’s population (based on current coverage by MTN,
which is ATC’s main client).
7.29 MTN CAPEX in Uganda in 2013 was approximately USD 50.8M (compared to USD 40M in 2012), which
represents 12% of its revenue in the country. Most of this expenditure was to improve GSM and W-
CDMA network coverage and quality. This exemplifies the magnitude of the investment required.15
13 Source: UCC 14 Source: ATC financial report, 2013. 15 Source: MTN financial report, 2013.
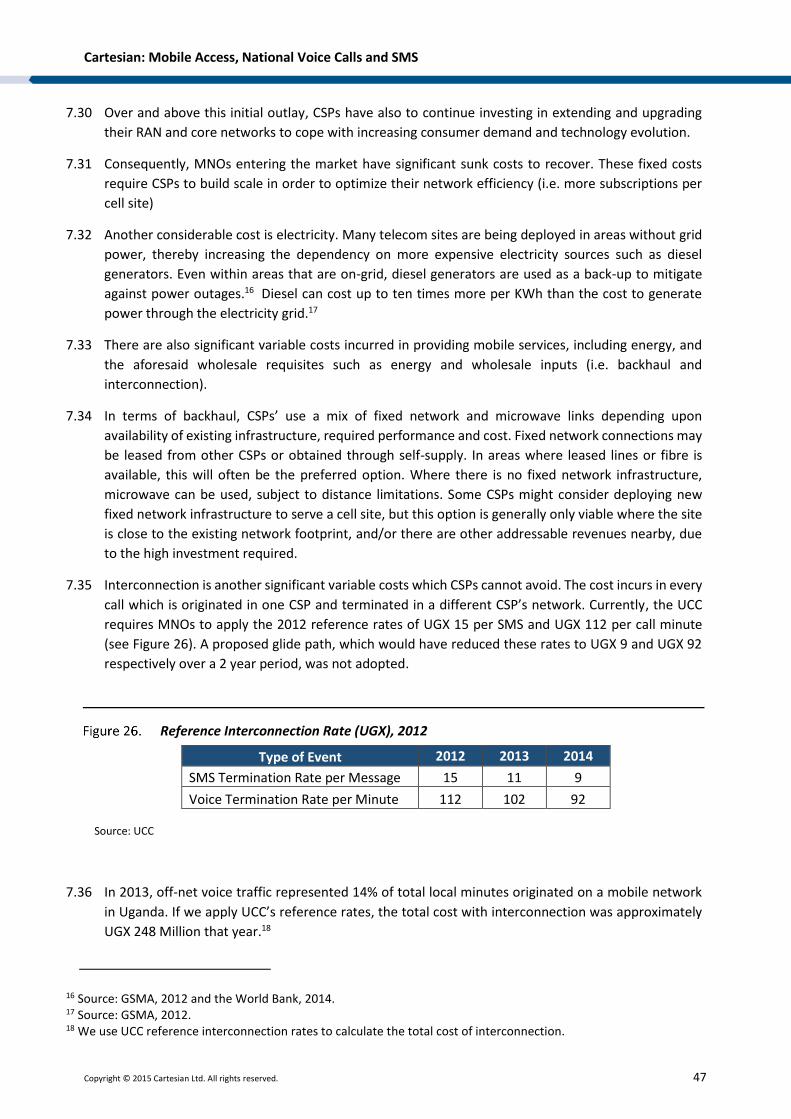
Cartesian: Mobile Access, National Voice Calls and SMS
Copyright © 2015 Cartesian Ltd. All rights reserved. 47
7.30 Over and above this initial outlay, CSPs have also to continue investing in extending and upgrading
their RAN and core networks to cope with increasing consumer demand and technology evolution.
7.31 Consequently, MNOs entering the market have significant sunk costs to recover. These fixed costs
require CSPs to build scale in order to optimize their network efficiency (i.e. more subscriptions per
cell site)
7.32 Another considerable cost is electricity. Many telecom sites are being deployed in areas without grid
power, thereby increasing the dependency on more expensive electricity sources such as diesel
generators. Even within areas that are on-grid, diesel generators are used as a back-up to mitigate
against power outages.16 Diesel can cost up to ten times more per KWh than the cost to generate
power through the electricity grid.17
7.33 There are also significant variable costs incurred in providing mobile services, including energy, and
the aforesaid wholesale requisites such as energy and wholesale inputs (i.e. backhaul and
interconnection).
7.34 In terms of backhaul, CSPs’ use a mix of fixed network and microwave links depending upon
availability of existing infrastructure, required performance and cost. Fixed network connections may
be leased from other CSPs or obtained through self-supply. In areas where leased lines or fibre is
available, this will often be the preferred option. Where there is no fixed network infrastructure,
microwave can be used, subject to distance limitations. Some CSPs might consider deploying new
fixed network infrastructure to serve a cell site, but this option is generally only viable where the site
is close to the existing network footprint, and/or there are other addressable revenues nearby, due
to the high investment required.
7.35 Interconnection is another significant variable costs which CSPs cannot avoid. The cost incurs in every
call which is originated in one CSP and terminated in a different CSP’s network. Currently, the UCC
requires MNOs to apply the 2012 reference rates of UGX 15 per SMS and UGX 112 per call minute
(see Figure 26). A proposed glide path, which would have reduced these rates to UGX 9 and UGX 92
respectively over a 2 year period, was not adopted.
Reference Interconnection Rate (UGX), 2012
Type of Event 2012 2013 2014
SMS Termination Rate per Message 15 11 9
Voice Termination Rate per Minute 112 102 92 Source: UCC
7.36 In 2013, off-net voice traffic represented 14% of total local minutes originated on a mobile network
in Uganda. If we apply UCC’s reference rates, the total cost with interconnection was approximately
UGX 248 Million that year.18
16 Source: GSMA, 2012 and the World Bank, 2014. 17 Source: GSMA, 2012. 18 We use UCC reference interconnection rates to calculate the total cost of interconnection.
Cartesian: Mobile Access, National Voice Calls and SMS
Copyright © 2015 Cartesian Ltd. All rights reserved. 48
7.37 CSPs try to keep interconnection costs to a minimum level by promoting on-net calls to their
customers. On-net calls allow CSPs to internalize termination costs since voice and SMS are originated
and terminated within the same CSP’s network.
7.38 On-net calls also enable CSPs to optimize their infrastructure in cases their network is underutilized.
For example, CSPs can offer free on-net calls and SMS in the evenings when network is not congested.
This will help CSPs to improve the utilization of their network at the same time they promote free or
cheap calls to attract customers to their network.
7.39 The cost structure for MVNOs will be considerably different from that of MNOs. MVNOs have very
little fixed costs since they don’t require their own spectrum and network to be able to provide
services. Instead, MVNOs pay for network access on a variable-cost basis.
7.40 As a consequence, the variable costs of MVNOs are far higher than MNOs. For this reason, the MVNO
business model benefits less from scale economies.
7.41 Marketing, subscriber acquisition and retention are also significant costs for MVNOs. These CSPs have
to differentiate their services, customer care and marketing programs from those of MNOs, since for
MVNOs differentiation in terms of network quality and coverage is not an option.
Basic Market Conditions Conclusions
7.42 The number of players in the market is limited by spectrum availability. Spectrum is a finite resource
whose supply is physically constrained, and allocation thereof is controlled by the Ugandan
government through the sector regulator, Uganda Communications Commission.
7.43 To build and upgrade mobile broadband networks, CSPs require some essential wholesale inputs (i.e.
leased lines and interconnection). These wholesale inputs are often sourced from competitors, which
can potentially present some competitive constrains especially through the pricing of access.
7.44 Moreover, CSPs need significant capital investment to build and improve their networks. Investors
and creditors requires a degree of confidence in the CSPs business plan and its financial health.
7.45 MVNOs face less market entry barriers than MNOs, since they do not require spectrum and network.
However, MVNOs are completely dependent on wholesale inputs and conditions from the host
network operator.
7.46 CSPs are taking advantage of the significant share of the population without access to financial
services. There is significant demand for mobile money services which indirectly influence the overall
mobile market to grow.
8 Overall Conclusion of SMP Assessment
8.1 We have identified features in the structure, conduct and performance of the market for mobile
calling and SMS services that taken together suggest that Airtel and MTN are jointly dominant.
8.2 Firstly, the market structure is highly concentrated and that the level of concentration has increased
recently. In particular, Airtel and MTN have similar, significant market shares, respectively 44% and
48%. Furthermore, Airtel and MTN's combined market share is 92%, which indicates that the mobile
call and SMS market is concentrated between these two operators. The evidence presented in this
Cartesian: Mobile Access, National Voice Calls and SMS
Copyright © 2015 Cartesian Ltd. All rights reserved. 49
report also indicates that the level of market concentration, as measured by the Herfindahl-
Hirschman Index, has been increased over the two years leading up to 2013.
8.3 The merger of Airtel and Warid increased the market concentration, and as a result the combined
market shares of MTN and Airtel (Warid) increased from 88% in 2012 to 92% in 2013, during which
period each of these operators’ individual market share grew by 2 percentage points. The fact that
each operators individual market share grew over this period, while that of the smaller and fringe
CSPs fell by almost the same proportion, raises the possibility that these CSPs (MTN and AIRTEL) are
jointly rather than singly dominate.
8.4 There is no sign that the situation will change in the near future since the market has significant
market entry barriers and the smaller CSPs have not been able to generate any impact in the market.
8.5 Regarding market performance, the level of prices for voice services appears consistent with a
selection of countries from Africa, whilst those for SMS are high. Voice tariffs have decreased from
2006 to 2009, but have appeared to stabilise from 2009 to 2014. In 2013, K2 entered the market
offering the lowest tariffs for both on-net and off-net calls although this does not as yet appear to
have affected the wider market.
8.6 The flat level of the prices from 2009 to 2014 is consistent with the observed lack of growth in the
mobile call volumes. The usage of mobile services as measure by the average total volume of call
minutes does not appear to have increased over the past two years. Furthermore, this lack of growth
in the call volume indicates that observed increase in the number of subscriptions during the same
period, is unlikely to be caused by an increase in the number of actual users of mobile calling and SMS
services, but instead by an increase in the number of SIM cards used by each subscriber.
8.7 Finally, there is evidence of quality problems in service delivery. Call block rates have increased
significantly since the second half of 2013. Continued monitoring of service quality is recommended
to determine whether the increases are transitory or are symptomatic of an industry wide trend.
8.8 Taken together the observed market structure and the lack of progress in market performance are
indicators that Airtel and MTN are jointly dominant.
8.9 An explanation for the possible joint dominance of Airtel and MTN is that it is the result of network
effects that Airtel and MTN exploit with the price differential between on-net and off-net calls coupled
with the level of interconnection prices. The CSPs with large market shares are the greatest
beneficiaries of this effect. A similar network effect is present in the adjacent market for mobile
money, where on-net and off-net transaction fees differ. As mobile money and mobile access for voice,
SMS and data both use the same SIM, CSPs derive benefits from this observed mobile money network
effect. The two CSPs with greatest market share in the mobile access market (MTN and Airtel) also
have greatest share in the mobile money market.
8.10 MTN in particular has a variety of assets that it could exploit in this regard including: leveraging the
network effects of its large subscriber base; using its mobile money service to secure advantage in the
mobile access market (and vice versa); controlling supply of fixed network services for backhaul; and,
controlling access to important sales and distribution channels. The difficulty that K2 had in securing
interconnect with MTN as a new entrant is of concern, as are the cases brought to the attention of
the UCC by One Solutions and Datanet.
Cartesian is a specialist consulting firm of industry experts, focused exclusively on the communications,
technology and digital media sector. For over 20 years, Cartesian has advised clients in strategy
development and assisted them in execution against their goals. Our unique portfolio of professional
services and managed solutions are tailored to the specific challenges faced by executives in these fast-
moving industries. Combining strategic thinking and practical experience, we deliver superior results.
www.cartesian.com
For further information, please contact us at [email protected]