Embed Size (px)
Citation preview
page 1
MestReNova – A quick Guide Dr. K. Bergander, 01.04.2017
MestReNova – A quick Guide
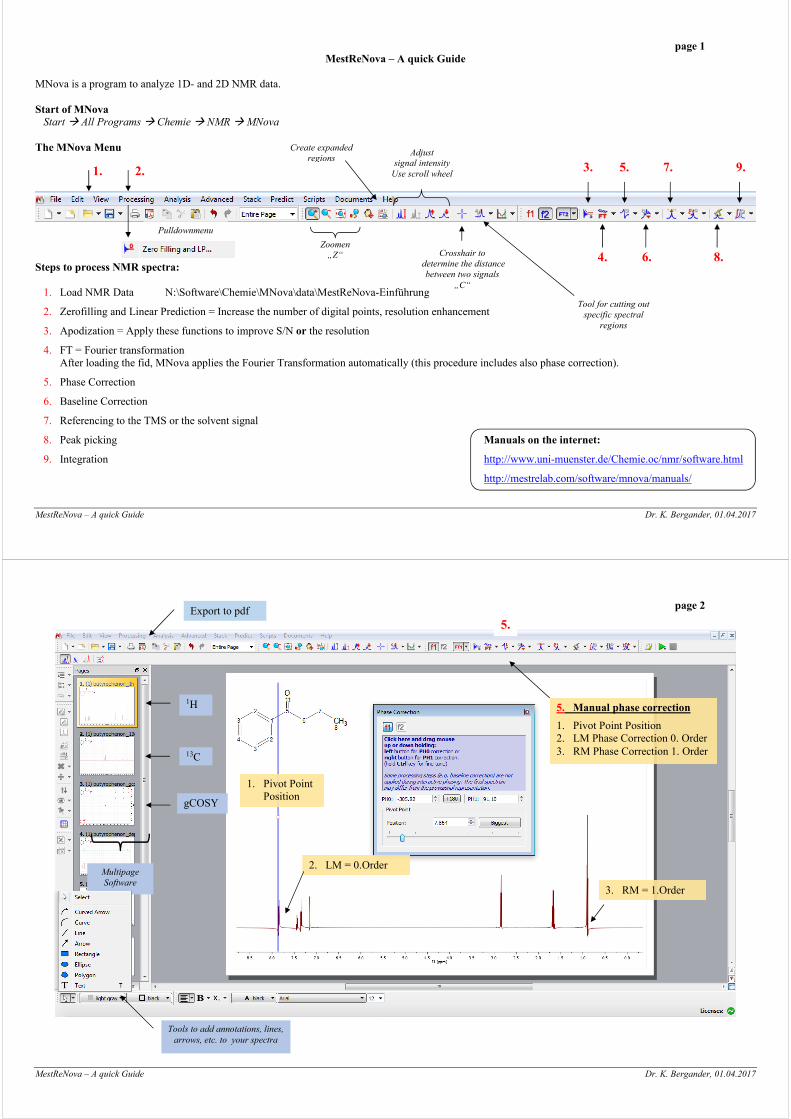
MNova is a program to analyze 1D- and 2D NMR data.
Start of MNova
Start � All Programs � Chemie � NMR � MNova
The MNova Menu
Steps to process NMR spectra:
1. Load NMR Data N:\Software\Chemie\MNova\data\MestReNova-Einführung
2. Zerofilling and Linear Prediction = Increase the number of digital points, resolution enhancement
3. Apodization = Apply these functions to improve S/N or the resolution
4. FT = Fourier transformation
After loading the fid, MNova applies the Fourier Transformation automatically (this procedure includes also phase correction).
5. Phase Correction
6. Baseline Correction
7. Referencing to the TMS or the solvent signal
8. Peak picking Manuals on the internet:
9. Integration http://www.uni-muenster.de/Chemie.oc/nmr/software.html
http://mestrelab.com/software/mnova/manuals/
1. 2.
Adjust
signal intensity
Use scroll wheel
Zoomen
„Z“ Crosshair to
determine the distance
between two signals
„C“
Tool for cutting out
specific spectral
regions
4. 6. 8.
3. 5. 7.
Create expanded
regions 9.
Pulldownmenu
page 2
MestReNova – A quick Guide Dr. K. Bergander, 01.04.2017
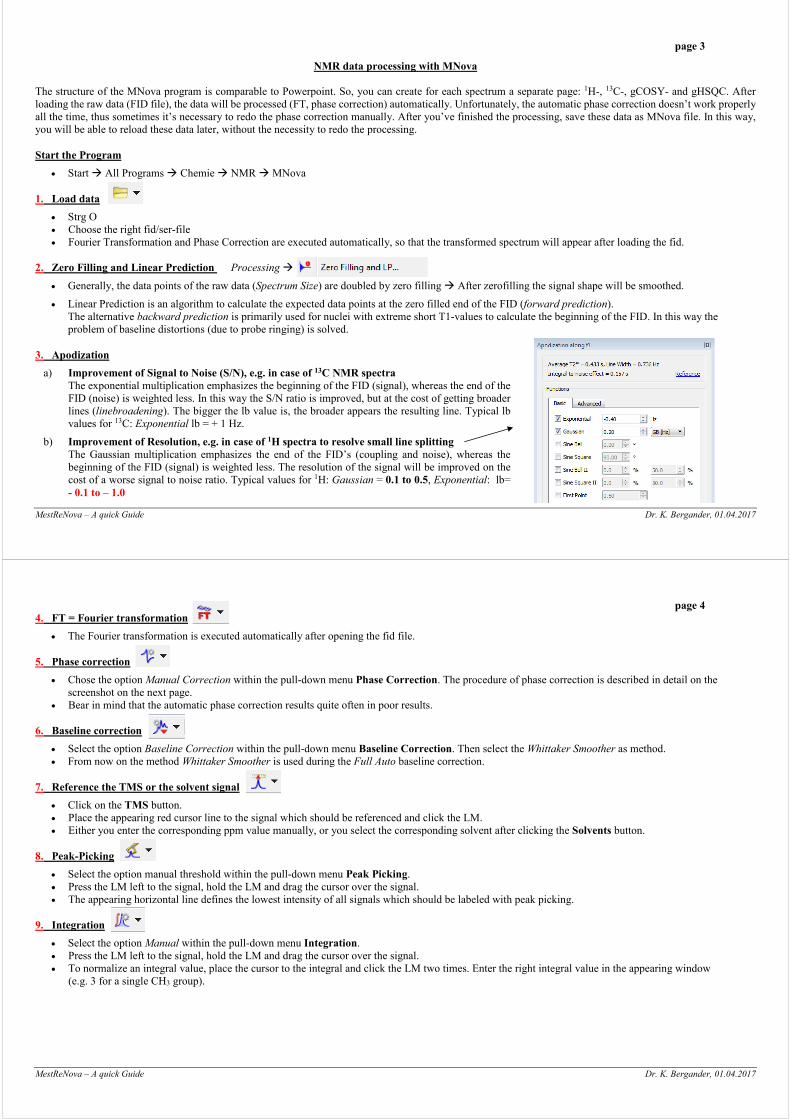
Multipage
Software
1H
13C
gCOSY
DEPT
1. Pivot Point
Position
für die Phasen
5. Manual phase correction
1. Pivot Point Position
2. LM Phase Correction 0. Order
3. RM Phase Correction 1. Order
2. LM = 0.Order
3. RM = 1.Order
Tools to add annotations, lines,
arrows, etc. to your spectra
Export to pdf
5.
page 3
MestReNova – A quick Guide Dr. K. Bergander, 01.04.2017
NMR data processing with MNova
The structure of the MNova program is comparable to Powerpoint. So, you can create for each spectrum a separate page: 1H-, 13C-, gCOSY- and gHSQC. After
loading the raw data (FID file), the data will be processed (FT, phase correction) automatically. Unfortunately, the automatic phase correction doesn’t work properly
all the time, thus sometimes it’s necessary to redo the phase correction manually. After you’ve finished the processing, save these data as MNova file. In this way,
you will be able to reload these data later, without the necessity to redo the processing.
Start the Program
• Start � All Programs � Chemie � NMR � MNova
1. Load data
• Strg O
• Choose the right fid/ser-file
• Fourier Transformation and Phase Correction are executed automatically, so that the transformed spectrum will appear after loading the fid.
2. Zero Filling and Linear Prediction Processing �
• Generally, the data points of the raw data (Spectrum Size) are doubled by zero filling � After zerofilling the signal shape will be smoothed.
• Linear Prediction is an algorithm to calculate the expected data points at the zero filled end of the FID (forward prediction).
The alternative backward prediction is primarily used for nuclei with extreme short T1-values to calculate the beginning of the FID. In this way the
problem of baseline distortions (due to probe ringing) is solved.
3. Apodization
a) Improvement of Signal to Noise (S/N), e.g. in case of 13C NMR spectra
The exponential multiplication emphasizes the beginning of the FID (signal), whereas the end of the
FID (noise) is weighted less. In this way the S/N ratio is improved, but at the cost of getting broader
lines (linebroadening). The bigger the lb value is, the broader appears the resulting line. Typical lb
values for 13C: Exponential lb = + 1 Hz.
b) Improvement of Resolution, e.g. in case of 1H spectra to resolve small line splitting
The Gaussian multiplication emphasizes the end of the FID’s (coupling and noise), whereas the
beginning of the FID (signal) is weighted less. The resolution of the signal will be improved on the
cost of a worse signal to noise ratio. Typical values for 1H: Gaussian = 0.1 to 0.5, Exponential: lb=
- 0.1 to – 1.0
page 4
MestReNova – A quick Guide Dr. K. Bergander, 01.04.2017
4. FT = Fourier transformation
• The Fourier transformation is executed automatically after opening the fid file.
5. Phase correction
• Chose the option Manual Correction within the pull-down menu Phase Correction. The procedure of phase correction is described in detail on the
screenshot on the next page.
• Bear in mind that the automatic phase correction results quite often in poor results.
6. Baseline correction
• Select the option Baseline Correction within the pull-down menu Baseline Correction. Then select the Whittaker Smoother as method.
• From now on the method Whittaker Smoother is used during the Full Auto baseline correction.
7. Reference the TMS or the solvent signal
• Click on the TMS button.
• Place the appearing red cursor line to the signal which should be referenced and click the LM.
• Either you enter the corresponding ppm value manually, or you select the corresponding solvent after clicking the Solvents button.
8. Peak-Picking
• Select the option manual threshold within the pull-down menu Peak Picking.
• Press the LM left to the signal, hold the LM and drag the cursor over the signal.
• The appearing horizontal line defines the lowest intensity of all signals which should be labeled with peak picking.
9. Integration
• Select the option Manual within the pull-down menu Integration.
• Press the LM left to the signal, hold the LM and drag the cursor over the signal.
• To normalize an integral value, place the cursor to the integral and click the LM two times. Enter the right integral value in the appearing window
(e.g. 3 for a single CH3 group).

page 5
MestReNova – A quick Guide Dr. K. Bergander, 01.04.2017
10. Zoomen
11. Vertical Scale
• The easiest way to adjust the vertical scale is done with the scroll wheel.
12. Crosshair to determine line splitting
• It appears an info-box and a blue cursor line.
• Move the blue cursor line to the left signal of the multiplet.
• Press the LM, hold the LM and move the additional appearing line to the next signal.
• The info box will display the line splitting in Hz.
13. Stack two or more spectra on one page (e.g. 13C and DEPT)
• 1st page: Load 13C spectrum (fid)
• 2nd page: Load DEPT
• Mark both pages on the left by using the Strg-key + the LM (� blue border)
• Menu bar on the top: Stack � Stack Spectra
Expand
Zoom out
Full
Scale the most intense
signal to the height of page
Increase signal intensity
erhöhen
Decrease signal intensity
Enter the limits manually
page 6
MestReNova – A quick Guide Dr. K. Bergander, 01.04.2017
14. Selective processing of „stacked“ spectra
• left menu bar
Three methods, to process one spectrum or several spectra simultaneously
• If you use the scroll wheel, the vertical scale of all spectra will be changed simultaneously.
• If you want to change only the active spectrum (blue bar, right to the spectrum), you've to deselect all spectra. To change the active spectrum, point the
cursor to the selected spectrum and press the left mouse button. Then click or .
• If you want to process several spectra simultaneously, you've to select them by clicking the corresponding checkboxes.
15. Cut function
• With the aid of this function you can suppress the display of certain spectral regions (e.g. regions, which show no signal).
• Select the button which shows a signal & scissors on the top menu bar.
• Move the appearing cursor left to the region which you like to suppress, press and hold the LM and drag the mouse over the region to suppress.
Select spectra for processing
Adjust vertical scale selectively
(e.g. carbon only)
Increase vertical scale of selected spectra
13C is activated for processing, so during phase correction only the phase of
the carbon spectrum is changed, but not the phase of the dept spectra.
Decrease vertical scale of selected spectra
Autoscale spectra
page 7
MestReNova – A quick Guide Dr. K. Bergander, 01.04.2017
16. Copy/Paste into other Windows programs (Word, Powerpoint)
• Click with the LM inside the spectrum, so that a green border will appear around the specified spectrum.
• Now you can copy the specified spectrum from MNova to e.g. Word by using Ctrl C and Ctrl V.
17. Create spectral expansions on the top of the page
• Click on the button spectrum & glasses, so that the cursor appears as magnifier and a plus sign.
• Press the LM left to the signal, hold the LM and drag the cursor over the region, which should be expanded.
• If you like, you can process the expanded region after activating this expanded region by clicking the LM inside the expanded region.
18. IUPAC Chemical Shift referencing
If you measure a set of NMR data, firstly, the proton NMR spectrum has to be referenced to the TMS signal (0 ppm). According to the IUPAC recommendation
from 2001, the referencing of all other spectra will then be calculated by the UNIFIED SCALE. Thus, using a suitable secondary reference compound is no longer
recommended!
In case of inaccurate referencing of the proton NMR spectrum by the spectrometer, you have to redo referencing for the whole NMR data set:
1st step: Reference the TMS signal of proton NMR:
• Load the proton NMR spectrum
• Upper menu bar: Analysis ⇒ Reference ⇒ Reference ⇒ Point the cursor to the TMS signal and enter 0
(If no TMS was added to the sample, you can reference the residual protonated solvent signal instead)
2nd step: All other spectra of your sample, which were recorded on the same day and with the same spectrometer (same lockfrequency!), have to be referenced by
using the UNIFIED SCALE relative to the before referenced proton NMR spectrum (see 1st step):
• Load all other spectra of your sample, which have been measured on the same day and spectrometer as the proton NMR spectrum
• Upper menu bar: Analysis ⇒ Reference ⇒ Absolute Reference ⇒
At the top of the appearing dialog box you'll find the proton NMR of your dataset predefined as reference
All other spectra are preselected for absolute referencing
• Click OK
page 8
MestReNova – A quick Guide Dr. K. Bergander, 01.04.2017
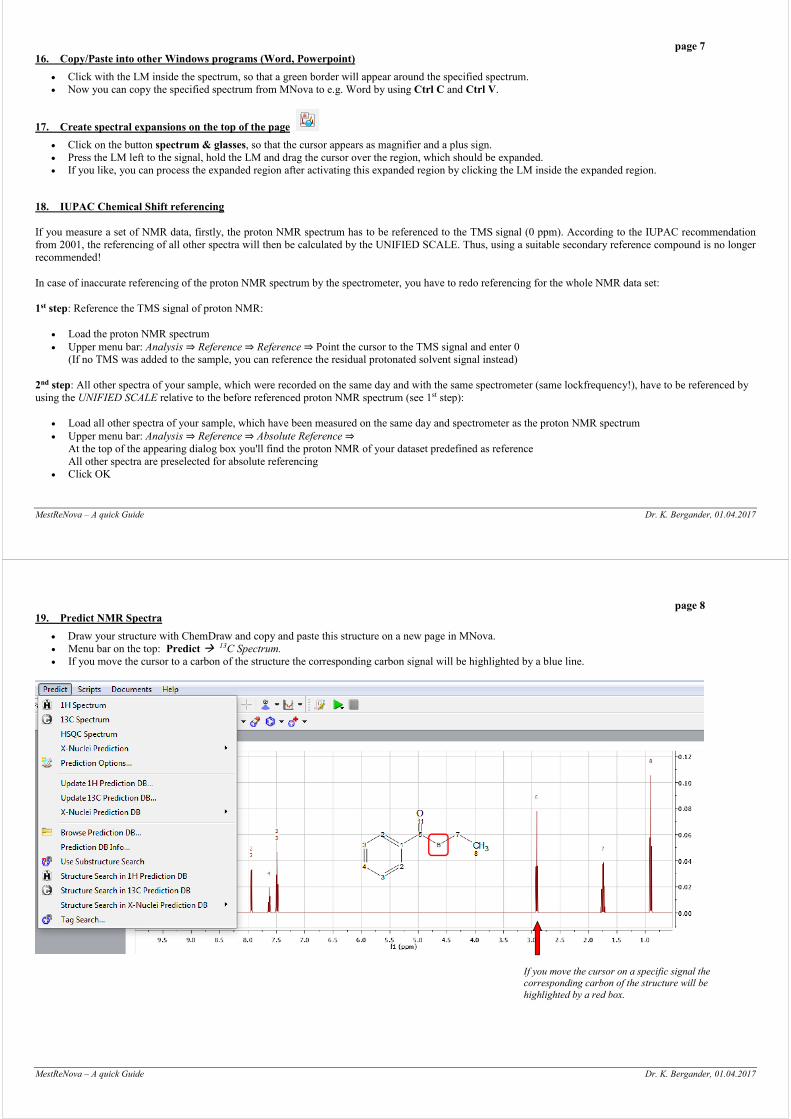
19. Predict NMR Spectra
• Draw your structure with ChemDraw and copy and paste this structure on a new page in MNova.
• Menu bar on the top: Predict � 13C Spectrum.
• If you move the cursor to a carbon of the structure the corresponding carbon signal will be highlighted by a blue line.
If you move the cursor on a specific signal the
corresponding carbon of the structure will be
highlighted by a red box.

page 9
MestReNova – A quick Guide Dr. K. Bergander, 01.04.2017
20. Shortcuts
• Ctrl C / Ctrl V : Copy/Paste e.g. to copy a structure from ChemDraw to a page of MNova or to copy a spectrum from MNova to Word.
• Ctrl O : Open NMR data
• Ctrl M : New page
• Ctrl Z : Undo the last action
• Z : Select the Zoom mode
• C : Select the Crosshair mode
• E : Select the Expand mode
• Hold Space bar : While you’re holding the space bar, the panning mode is selected temporarily. So you can move the displayed spectral region.
• Esc : Leave the last chosen mode
21. 2D spectra with external projections (see screenshot on the next page)
• 1st page : Load 1H spectrum (fid)
• 2nd page : Load 13C spectrum (fid)
• 3rd page : Load gHSQC spectrum (fid oder ser)
• Left menu bar: Select the pull-down menu Show Traces (Icon with 2D-Plot + projections) and select Setup.
• Select the right 1H and 13C projections and define them as vertical and horizontal projection (cp. screenshot).
22. Phase correction of phase sensitive 2D NMR Spectra (1J(C,H) correlation = gHSQC)
• Phase sensitive 2D NMR spectra need a phase correction along the F2 (1H) and the F1 (13C) axis. The main principle
of 2D phase correction is comparable to that one for 1D phase correction. The only difference is that you have to
choose the direction which should be adjusted (F1 or F2) by clicking on the corresponding F1 or F2 button.
page 10
MestReNova – A quick Guide Dr. K. Bergander, 01.04.2017
2D NMR: 1J(C,H)-Korrelation
1. Load ghsqc/fid
2. Select Show Traces
3. Setup
4. Select H for the horizontal trace
5. Select C for the vertical trace
2.
3.
4.
5.

page 11
MestReNova – A quick Guide Dr. K. Bergander, 01.04.2017
Right phase along F1 und F2:
Positive absorption signal in F1 and F2 Negative absorption signal in F1 and F2
e.g. CH3 or CH in gHSQC e.g. diastereotopic CH2 in gHSQC
Phase error along F2: Phase error along F1: Phase error along F1 and F2:
Dispersion signal Dispersion signal along F1 Dispersion signal along F1and F2
Positive and negative parts along F2 Positive and negative parts along F1 Positive and negative parts along F1 and F2
page 12
MestReNova – A quick Guide Dr. K. Bergander, 01.04.2017
23. MNova by Citrix Receiver
Start Citrix-Receiver: https://nwzcitrix.nwz.wwu.de/Citrix/NWZCitrixWeb/
24. Local installation of MNova
see: http://www.uni-muenster.de/Chemie.oc/en/nmr/software.html