Embed Size (px)
Citation preview

MNH PROGRAMME
SUMMATIVE EVALUATION
Volume II
Annex VIII: Value For Money
Assessment
January 2020
Laarstraat 43
B-2840 Reet Belgium

MNH Kenya – Summative Evaluation – Vol 2. Annex VIII
hera / Final summative report / January 2020 i

MNH Kenya – Summative Evaluation – Vol 2. Annex VIII
hera / Final summative report / January 2020 ii
Table of Contents
1 Introduction ................................................................................................................................................... 1
2 Bungoma County Health Expenditure 2014-2018 ......................................................................................... 2
3 DFID MNH budget (overall and for Bungoma County) ................................................................................ 10
3.1 MANI, MANI Bungoma, and MANI CICF ................................................................................................... 10
3.2 CICF and CICF Bungoma ........................................................................................................................... 12
3.3 LSTM – MiH (overall expenditure) ........................................................................................................... 16
3.4 LSTM-MiH in Bungoma ............................................................................................................................ 19
4 Cost-effectiveness analysis .......................................................................................................................... 21
4.1 Additional DFID MNH expenditure vs. domestic MNH expenditure in Bungoma ................................... 21
4.2 Baseline .................................................................................................................................................. 21
4.3 Cost-effectiveness ratios .......................................................................................................................... 22
5 Additional notes on efficiency and sustainability ........................................................................................ 28
5.1 MiH / LSTM .............................................................................................................................................. 28
5.2 MANI HSS Bungoma ................................................................................................................................. 28
5.3 CICF .................................................................................................................................................. 29
List of Figures
Figure 1. Distribution of total health expenditure (THE) by Diseases / conditions, FY 2012/13 and FY
2015/16 ............................................................................................................................................................ 9
Figure 2. MiH Expenditure per Quarter (GBP) ................................................................................................ 18
Figure 3. MiH Expenditure per Quarter (in percentage) ................................................................................ 18
Figure 4. Direct Unit Cost per (direct) trainee (in-service training) (GBP)...................................................... 19
List of Tables
Table 1. Bungoma County budget 2014-2018 (KES) (Government, DPs “on budget”, and Linda Mama) ....... 4
Table 2. Share of health budget of county budget from the “Government’s equitable share of national
revenue” ........................................................................................................................................................... 5
Table 3. Share of health budget of total county budget (Percentage)............................................................. 5
Table 4. Overall Bungoma County health budget 2014-2018 (GBP) (Government, DPs “on budget”, and
Linda Mama) ..................................................................................................................................................... 7
Table 5. Bungoma County Financial Statements (KES) ..................................................................................... 8
Table 6. Bungoma County Financial Statements (KES) by Programme ............................................................ 8
Table 7. Bungoma County: health expenditure and MNH expenditure 2014-2018 (GBP) ............................ 10

MNH Kenya – Summative Evaluation – Vol 2. Annex VIII
hera / Final summative report / January 2020 iii
Table 8. MANI project budget and expenditure 2015-2018 (GBP) ................................................................ 10
Table 9. MANI expenditure per Consortium Partner ..................................................................................... 11
Table 10. MANI-HSS Bungoma expenditure per year (GBP and %) ................................................................ 12
Table 11. MANI-CICF expenditure 2015-2018 (GBP and %) .......................................................................... 12
Table 12. CICF Grants: Category, Duration and budget (GBP) ....................................................................... 12
Table 13. CICF: Expenditure per type of grants .............................................................................................. 14
Table 14. CICF projects in Bungoma (budgets) ............................................................................................... 14
Table 15. CICF Bungoma: Actual Expenditure per year (GBP) ........................................................................ 14
Table 16. MiH expenditure in Bungoma County ............................................................................................ 20
Table 17. Total DFID MNH Bungoma (GBP) ................................................................................................... 20
Table 18. Bungoma County Health Expenditure 2014 - 2018 ........................................................................ 21
Table 19. National and Bungoma MMR in 2014 (baseline) ............................................................................ 22
Table 20. MNH Burden of Disease 2014-2018 (IHME accessed in August 2019) ........................................... 23
Table 21. CEA Bungoma County ..................................................................................................................... 24
Table 22. CEA Bungoma County (GBP, 2015-2018) ........................................................................................ 25
Table 23. CEA Bungoma County (GBP, 2014-2016, Formative Evaluation) ................................................... 26
Table 24. CEA 3MDGF (US$, 2015, Myanmar) ............................................................................................... 27

MNH Kenya – Summative Evaluation – Vol 2. Annex VIII
hera / Final summative report / January 2020 iv
Abbreviations
3MDGF Three Millenium Development Goals Fund (Myanmar)
AIA Appropriation In Aid
ANC Antenatal Care
BEmONC Basic Emergency Obstetric & Neonatal Care
BoD Burden of Disease
CDO Context – Delivery - Outcome
CEA Cost-Effectiveness Analysis
CEmONC Comprehensive Emergency Obstetric & Neonatal Care
CER Cost-Effectiveness Ratio
CHMT County Health Management Team
CHV Community Health Volunteer
CICF County Innovation Challenge Fund
CS Caesarean Section
CSO Civil Society Organisation
CU Community Unit
DALY Disability Adjusted Life Year
Danida Danish Development Aid Agency
DHIS2 On-line health management information system used in Kenya
DP Development Partner
DSF Demand Side Financing
EmONC Emergency Obstetric & Neonatal Care
ESM-UBT Every Second Matters – Uterine Balloon Tamponade
EU European Union
FBO Faith Based Organisation
FGD Focus Group Discussion
GBP British Pound
GDP Gross Domestic Product
FMHC Free Maternal Health Care
HF Health Facility
HMIS Health Management Information System
HRH Human Resources for Health
HSS Health System Strengthening
ICER Incremental Cost-Effectiveness Ratios
ICT Information and Communication Technology
IDA International Development Association (World Bank)
IHME Institute for Health Metrics and Evaluation
INGO International Non-Governmental Organisation
KDHS Kenya Demographic and Health Survey
KEMSA Kenya Medical Supply Authority
KES Kenyan Shilling

MNH Kenya – Summative Evaluation – Vol 2. Annex VIII
hera / Final summative report / January 2020 v
KII Key Informant Interview
KMTC Kenya Medical Training College
LSTM Liverpool School of Tropical Medicine
M&E Monitoring and Evaluation
MANI Maternal and Newborn Initiative
MDG Millennium Development Goal
M&E Monitoring and Evaluation
MGH Massachusetts General Hospital
MICS Multiple Indicator Cluster Survey
MiH Making it Happen
MKU Mount Kenya University
MGH Massachusetts General Hospital
MM Maternal Mortality
MMR Maternal Mortality Ratio
MNCH Maternal, Newborn and Child Health
MNH Maternal and Newborn Health
MoH Ministry of Health
MPDSR Maternal and Perinatal Death Surveillance and Response
NHA National Health Accounts
NHIF National Hospital Insurance Fund
NMR Neonatal Mortality Rate
OR Operational Research
PBF Performance Based Financing
PMB Programme Management Budget
PNC Postnatal Care
QI Quality Improvement
RAG Red-Amber-Green (rating scale)
RMFLF Road Maintenance Fuel Levy Fund
RMNCH Reproductive, Maternal, Neonatal and Child Health
RMNCAH Reproductive, Maternal, Newborn, Child and Adolescent Health
SBA Skilled Birth Attendance
SBCC Social Behavioural Change Communication
SBR Still Birth Rate
SC Sub-county
SCI Save the Children
SCHMT Sub-County Health Management Team
TA Technical Assistance
TBA Traditional Birth Attendant
THE Total Health Expenditure
THS-UC Transforming Health System for Universal Care
ToC Theory of Change

MNH Kenya – Summative Evaluation – Vol 2. Annex VIII
hera / Final summative report / January 2020 vi
ToT Trainer of Trainers
TWG Technical working group
UBT Uterine Balloon Tamponade
U5MR Under Five Mortality Rate
UHC Universal Health Coverage
UN United Nations
US$ United States Dollar
VfM Value for Money
WB World Bank
WDI World Development Indicators (database)
WHO World Health Organization

MNH Kenya – Summative Evaluation – Vol 2. Annex VIII
hera / Final summative report / January 2020 1
1 INTRODUCTION
As mentioned in the inception report (October 2018), this VfM analysis will not repeat the approaches and
metrics used by MANI (HSS-Bungoma) and LSTM: both implementing agencies have their own chain of
results and related indicators as well as their own VfM approach used for their periodic reports to DFID. The
present VFM analysis focuses on efficiency and effectiveness ‘largo sensu’ to address evaluation questions
pertaining to efficiency, cost-effectiveness (for Bungoma county -all interventions consolidated i.e. MANI,
MiH and CICF). It also addresses some aspects of sustainability.
The VFM analysis requires detailed analyses of expenditure and outputs/outcomes in Bungoma county,
including:
• Bungoma county overall financial resources for health and more specifically for MNH, per year (2014-
2018). That information mainly comes from (a) secondary sources (e.g. the Kenya Gazette (Senate
Bills), the County Allocation of Revenue Bills, annual National and County Budget analysis from MoH,
NHIF/Linda Mama financial reports, and CHMT and SCHMT annual reports) and (b) from Bungoma
county financial statements 2015/16 till 2017/18 provided by the county Government.
• DFID MNH additional (incremental) resources to the existing domestic and other external resources,
per implementer (MANI Bungoma, MANI CICF, CICF projects, MiH/LSTM), and per year (from 2014 to
2018).
• Bungoma County and sub-counties MNH outcomes. We use the same baseline values of Maternal
Mortality Ratio and Neonatal Mortality Rate as used for the VfM section of the Formative Evaluation
Report but adapted to 2014. Coverage rates (2014-2018) of deliveries in health facilities in Bungoma
County and sub-counties come from DHIS2.
The information listed above allows for a cost-effectiveness analysis for Bungoma County as a whole, based
on the specific burden of disease (related to MNH), MNH coverage trends, and incremental MNH
expenditure (MANI, LSTM and CICF projects in Bungoma). Cost-effectiveness is evaluated according to WHO
standards whereby an intervention is considered highly cost effective if the estimated cost per DALY averted
is less than the annual per-capita GDP and considered cost-effective if the cost is less than three times the
annual per-capita GDP.
A sensitivity analysis has been applied both to the efficacy rate1 and to the attributability to DFID funding,
with a RAG rating system based on WHO thresholds and on the Kenya GDP per capita 2018 (expressed in
current US$ and converted into GBP).
Beyond the cost-effectiveness analysis that pertains to the three projects/implementers (MANI Bungoma,
MANI-CICF and MiH/LSTM) in a single county (Bungoma), the VfM analysis also addresses some efficiency2
issues separately for each of the 3 components (MiH, MANI HSS, and CICF).
1 An efficacy rate of 100% would mean that there is no maternal/neonatal death/DALY anymore among additional deliveries in health facility since the DFID support, which is very unlikely. We use efficacy rates varying from 25% to 100%. 2 Overall administrative/management/overhead cost on total cost

MNH Kenya – Summative Evaluation – Vol 2. Annex VIII
hera / Final summative report / January 2020 2
2 BUNGOMA COUNTY HEALTH EXPENDITURE 2014-2018
The analysis process is as follows:
• Step 1: Computation of Bungoma County annual budgets and (when available) expenditures
• Step 2: Computation of the share of the overall county budget that is allocated to the health sector
• Step 3: Conversion of financial years into calendar years (to make possible comparisons with DFID
MNH annual budgets/expenditures based on calendar years)
• Step 4: Conversion of KES amounts in GBP (using annual average exchange rates)
• Step 5: Computation of the share of the county health budget allocated to MNH
Data sources for county budget:
• 2013/14: Kenya Gazette Supplement n° 67 (Senate Bills n°1), 7th May 2013
• 2014/15: Kenya Gazette Supplement n° 52 (Senate Bills n°13), 16th April 2014
• 2015/16: Kenya Gazette Supplement n° 41 (Senate Bills n°5), 17th April 2015
• 2016/17: Kenya Gazette Supplement n° 123 (Acts n°22), Acts 2016, 27Th July 2016
• 2017/18: Kenya Gazette Supplement n° 109 (Acts n°23), Acts 2017, 13th July 2017
• 2018/19: Kenya Gazette Supplement n°18 (National Assembly Bills n°7), 6th March 2018
• 2018/19: Kenya Gazette Supplement n° 97 (Acts n°8), Acts 2018, 4th July 2018
• 2018/19: Kenya Gazette Supplement n° 128 , Senate Bills n°29, 12th October 2018
Data sources for health budget as a share of total budget (counties):
• MoH, National and County Budget Analysis FY 2014/15
• MoH, National and County Budget Analysis FY 2015/16
• MoH, National and County Budget Analysis FY 2016/17
• Bungoma County health financial statements 2015/16, 2016/17, and 2017/18 (budget and
expenditure) provided by Bungoma Government
Exchange rates3
2013 2014 2015 2016 2017 2018 2019
GBP / KES 135.79 144.17 150.61 132.05 131.15 131.34 128.15
Explanation on County Budget as published by the Kenya Gazette
County Budgets (e.g. 32% of total national revenues in 2016/17) comprise of:
3 https://www.poundsterlinglive.com accessed early July 2019 (annual mid exchange rate)

MNH Kenya – Summative Evaluation – Vol 2. Annex VIII
hera / Final summative report / January 2020 3
1. Governments’ equitable share of revenue raised nationally based on the revenue sharing formula
(column D of the First Schedule) – Transferred to the respective County Revenue Fund
2. Conditional allocations from national government revenue:
a. Health: Conditional grants for level 5 hospitals (column B of the Second Schedule)
b. Health: Special purpose grants supporting emergency medical services – only Lamu and
Tana River (column C of the Second Schedule) or “Supplement for construction of county
headquarters” (from 2017/18)
c. Health: Conditional allocations for free maternal health care (column D of the Second
Schedule) (transferred to County Governments on a reimbursement basis). This has been
cancelled after the introduction of Linda Mama in 2017/2018. Now the column D includes
the “Conditional allocation for development of Youth Polytechnics”.
d. Health: Conditional allocations to compensate county health facilities for foregone user fees
revenue (column E of the Second Schedule)
e. Health: Conditional allocations for leasing of medical equipment (column F of the Second
Schedule) (managed by the National Government)
f. Conditional allocations from the Road Maintenance Fuel Levy Fund for the repair and
maintenance of county roads (column G of the Second Schedule)
3. Conditional allocations financed by proceeds of loans or grants from development partners to each
county government (column E of the Third Schedule)
a. Health: Conditional allocation financed by a loan from the World Bank to supplement
financing for county health facilities (column B of the Third Schedule). It is now WB-THS-UC
since 2018
b. Health: Conditional allocation financed by a grant from the Government of Denmark to
supplement financing for county health facilities (column C of the Third Schedule, but
column G since 2018)
c. IDA (WB) credit (National Agriculture and Rural Inclusive Growth Project (NARIGP) (Column
C Third Schedule)
d. IDA (WB) Kenya Climate Smart Agriculture Project (KCSAP) (column D of the Third Schedule)
e. IDA (WB) credit: Kenya Devolution Support Project (KDSP) level 1 grant (column E of the
third Schedule – since 2018).
f. IDA (WB) credit : Kenya Urban Support Project (KUSP) (column F of the third Schedule –
since 2018)
g. EU Grant (Instruments for devolution advice and support) (IDEAS) (Column H of Third
Schedule)
h. Conditional allocations to ensure continuation of services financed by loans and grants from
other development partners (column D of the Third Schedule – till 2017) (managed by the
National Government)
MNH Kenya – Summative Evaluation – Vol 2. Annex VIII
hera / Final summative report / January 2020 4
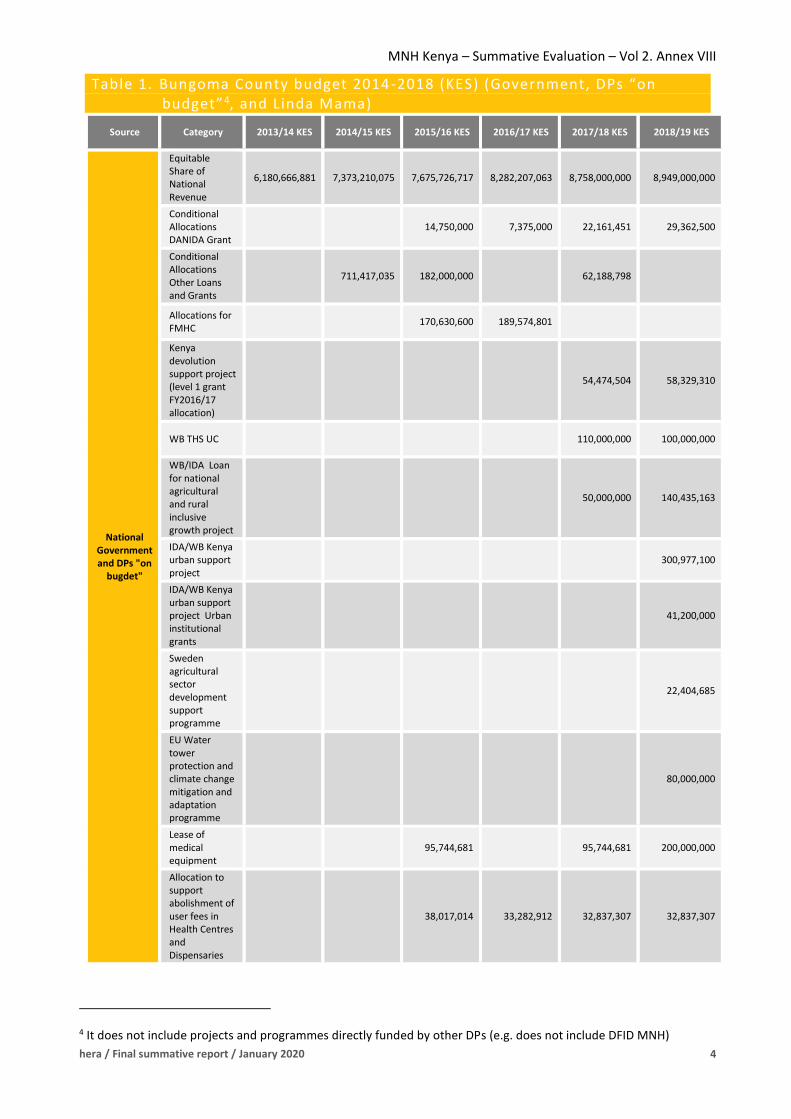
Table 1. Bungoma County budget 2014-2018 (KES) (Government, DPs “on budget”4, and Linda Mama)
Source Category 2013/14 KES 2014/15 KES 2015/16 KES 2016/17 KES 2017/18 KES 2018/19 KES
National Government and DPs "on
bugdet"
Equitable Share of National Revenue
6,180,666,881 7,373,210,075 7,675,726,717 8,282,207,063 8,758,000,000 8,949,000,000
Conditional Allocations DANIDA Grant
14,750,000 7,375,000 22,161,451 29,362,500
Conditional Allocations Other Loans and Grants
711,417,035 182,000,000 62,188,798
Allocations for FMHC
170,630,600 189,574,801
Kenya devolution support project (level 1 grant FY2016/17 allocation)
54,474,504 58,329,310
WB THS UC 110,000,000 100,000,000
WB/IDA Loan for national agricultural and rural inclusive growth project
50,000,000 140,435,163
IDA/WB Kenya urban support project
300,977,100
IDA/WB Kenya urban support project Urban institutional grants
41,200,000
Sweden agricultural sector development support programme
22,404,685
EU Water tower protection and climate change mitigation and adaptation programme
80,000,000
Lease of medical equipment
95,744,681 95,744,681 200,000,000
Allocation to support abolishment of user fees in Health Centres and Dispensaries
38,017,014 33,282,912 32,837,307 32,837,307
4 It does not include projects and programmes directly funded by other DPs (e.g. does not include DFID MNH)

MNH Kenya – Summative Evaluation – Vol 2. Annex VIII
hera / Final summative report / January 2020 5
Source Category 2013/14 KES 2014/15 KES 2015/16 KES 2016/17 KES 2017/18 KES 2018/19 KES
Conditional allocation from the Road Maintenance Fuel Levy Fund (RMFLF)
107,348,422 327,025,699 235,619,376
Conditional allocation to county emergency fund
93,617,021
Conditional allocation for development of youth polytechnics
76276625 65500000
Linda Mama MNH 18,800,000 ?
Total 6,180,666,881 8,084,627,110 8,377,834,455 8,512,439,776 9,607,509,065 10,255,665,441
Linda Mama funding, although not part of the county health budget stricto sensu (reimbursements are
transferred directly to the health facility (HF) account), has been considered, with figures coming from (a)
the analysis of Linda Mama system done by Options in May 2018 (see Annex 1), and (b) from financial
information coming from the Linda Mama and NHIF websites.
Allocation to health for each budget line (see table 2 below):
• For Governments’ equitable share of revenue (first row of county budget) (from MoH budget
analysis: see “ Data source for health budget as a share of total budget (counties)” above).
Table 2. Share of health budget of county budget from the “Government’s equitable share of n ational revenue”
2014 2015 2016 2017 2018
Bungoma 28% 25% 20% 25% 25%
• For all budget lines earmarked to health: 100%
• For Linda Mama line: 100%
• For all other budget lines -2 f) and 3 c)-, etc.: 0%
Table 3. Share of health budget of total county budget (Percentage)
Source Category
% to
health
13/14
% to
health
14/15
% to
health
15/16
% to
health
16/17
% to
health
17/18
% to
health
18/19
National
Government
and DPs "on
budget"
Equitable Share of
National Revenue 28 25 20.15 25.13 25.25 25
Conditional Allocations
DANIDA Grant 100 100 100 100 100 100
Conditional Allocations
Other Loans and Grants 0 0 0 0 0 0
Allocations for FMHC 100 100 100 100 100 100

MNH Kenya – Summative Evaluation – Vol 2. Annex VIII
hera / Final summative report / January 2020 6
Kenya devolution support
project (level 1 grant
FY2016/17 allocation)
0 0 0 0 0 0
WB THS UC 100 100 100 100 100 100
WB/IDA Loan for national
agricultural and rural
inclusive growth project
0 0 0 0 0 0
IDA/WB Kenya urban
support project 0 0 0 0 0 0
IDA/WB Kenya urban
support project Urban
institutional grants
0 0 0 0 0 0
Sweden agricultural sector
development support
programme
0 0 0 0 0 0
EU Water tower
protection and climate
change mitigation and
adaptation programme
0 0 0 0 0 0
Lease of medical
equipment 100 100 100 100 100 100
Allocation to support
abolishment of user fees
in HC and D
100 100 100 100 100 100
Conditional allocation
from RMFLF 0 0 0 0 0 0
Conditional allocation to
county emergency fund 0 0 0 0 0 0
Conditional allocation for
development of youth
polytechnics
0 0 0 0 0 0
Linda Mama MNH 100 100 100 100 100 100
By (a) applying the conversion of financial year into calendar year (2013=half of 2013/14; 2014=half of 2013
+ half of 20145; etc. ; (b) applying the average annual exchange rates GBP/KES; and (c) applying the
percentage of budget allocated to health, we get the following table:
5 The analysis of the Bungoma county financial statements 2015/16 to 2017/18 shows that the recurrent budget execution rate is rather high (>90%), which can be explained by the fact that staff remuneration (« Compensation to Employees ») represents from 71% to 84% of the total recurrent health budget. It allows then to consider that the budget is equally spent during the 12 months of the FY.

MNH Kenya – Summative Evaluation – Vol 2. Annex VIII
hera / Final summative report / January 2020 7
Table 4. Overall Bungoma County health budget 2014-2018 (GBP) (Government, DPs “on budget” 6, and Linda Mama)
Source Category GBP 2013 GBP 2014 GBP 2015 GBP 2016 GBP 2017 GBP 2018
National
Governmen
t and DPs
"on budget"
Equitable
Share of
National
Revenue
6,372,29
1 12,394,705 11,254,105 13,737,136 16,365,664 16,935,606
Conditional
Allocations
DANIDA
Grant
0 0 48,968 83,775 112,606 196,147
Allocations
for FMHC
(Free
Maternal
Health
Care)
0 0 566,465 1,363,898 722,740 0
WB THS UC 0 0 0 0 419,367 799,452
Lease of
medical
equipment
0 0 317,856 362,532 365,020 1,125,874
Allocation
to support
abolishmen
t of user
fees in HC
and D
0 0 126,210 269,973 252,079 250,018
Linda Mama MNH 0 0 0 0 69,225 69,225
Total 6,372,29
1
12,394,70
5
12,313,60
4
15,817,31
4
18,306,70
0
19,376,32
2
Notes: 2013= half year budget; Linda Mama amount is for the second half of 2017 and the first 4 months of 2018
The last step consists in determining the MNH share of the county total health budget. The Bungoma county
financial statements don’t provide this kind of information (see table 5 below):
6 It does not include projects and programmes directly funded by other DPs (e.g. does not include DFID MNH)

MNH Kenya – Summative Evaluation – Vol 2. Annex VIII
hera / Final summative report / January 2020 8
Table 5. Bungoma County Financial Statemen ts (KES)
Budget
2015/16 AE 2015/16
Exec. Rate
Budget 2016/17 AE 2016/17 Exec. Rate
Budget 2017/18 AE 2017/18 Exec. Rate
Gross 1,876,470,979 1,867,809,014 100% 2,229,099,687 2,139,891,458 96% 2,702,721,862 2,602,419,751 96%
Appropriation in Aid (AIA) 250,000,000 181,997,380 73% 210,020,000 224,195,696 107% 271,035,600 271,613,781 100%
Net 1,626,470,979 1,685,811,634 104% 2,019,079,687 1,915,695,762 95% 2,431,686,262 2,330,805,970 96%
Compensation to employees 1,346,434,164 1,231,259,372 91% 1,439,638,804 1,547,250,285 107% 1,719,782,992 1,958,945,411 114%
Maintenance 15,600,000 0 0% 7,500,000 2,841,579 38% 1,305,400 1,010,100 77%
Operations 264,436,815 226,985,624 86% 571,940,883 388,885,760 68% 527,738,117 370,850,459 70%
The budget/expenditure per programme is neither more informative on MNH expenditure (see table below, from the same source: note that totals of both tables
do not match, which comes from errors in the paper documents provided by the Bungoma County Government).
Table 6. Bungoma County Financial Statements (KES) by Programme
Budget
2015/16 % in col.
AE 2015/16 % in col.
Budget 2016/17
% in col.
AE 2016/17 % in col.
Budget 2017/18
% in col.
AE 2017/18 % in col.
Programme 1: general administration and planning and support services
1,730,900,000 83% 1,668,809,014 99% 2,036,213,921 84% 1,874,189,641 88% 2,519,493,142 93% 2,233,560,781 97%
Programme 2: Preventive promotive and rehabilitative
5,100,000 0% 3,100,000 0% 140,908,712 6% 35,397,500 2% 11,408,800 0% 0 0%
Programme 3: Curative health services
325,600,000 16% 10,200,000 1% 216,345,027 9% 204,292,832 10% 153,913,120 6% 63,792,172 3%
Programme 4: Health Research
11,400,000 1% 0 0% 3,992,968 0% 3,201,884 0% 8,000,000 0% 2,153,860 0%
Programme 5: Maternal and child health
1,100,000 0% 1,100,000 0% 22,569,600 1% 22,569,600 1% 9,907,600 0% 0 0%
Total 2,074,100,000 100% 1,683,209,014 100% 2,420,030,228 100% 2,139,651,458 100% 2,702,722,662 100% 2,299,506,813 100%

MNH Kenya – Summative Evaluation – Vol 2. Annex VIII
hera / Final summative report / January 2020 9
The Kenya National Health Accounts (NHA) 2015/167 presents total health expenditure by group of “disease
conditions”8 (Figure 1 below):
Figure 1. Distribution of total health expenditure (THE) by Diseases / conditions, FY 2012/13 and FY 2015/16
According to the NHA 2015/16, the total Reproductive Health (RH) expenditure represents 12.1% of Total
Health Expenditure (THE). This ratio seems consistent with other studies already mentioned in the VfM
analysis of the Formative Evaluation report: the ratio is 14% in Ethiopia9 (and 11% for Child Health: THEch on
THE), and 16.4% in Afghanistan10. Country case studies done by Carlyn Mann et al show the following ratios:
• Reproductive and Maternal Health expenditure on THE: from 8% in Malawi to 20% in Tanzania
• Child Health Expenditure on THE: from 8% in Tanzania to 22% in Malawi.
• A Public Health Expenditure Review done in Tanzania11 shows that Reproductive and Child Health
represent 31% of Local Government Health Expenditure.
For cost-effectiveness analysis (CEA) purpose, we decided to keep the NHA 2015/16 rate of 12.1% (RH/MNH)
for each year of the study. On the one hand, it could be an overestimation: (1) MNH expenditure per capita
may be lower than the national average in the counties and sub-counties supported by the DFID MNH
programme 12; and (2) RH is broader than MNH. On the other hand, the DFID MNH budget exceeds the strict
limits of maternal and neonatal health: e.g. infrastructure, green technology, HSS/capacity building at
national and county level (e.g. training in leadership and governance, health financing, HMIS, HRH
management, etc.) go far beyond MNH. If we try to estimate the share of MNH expenditure on RH
expenditure, we should then as well estimate the share of the DFID MNH budget that was exclusively spent
7 Ministry of Health, 2017. Kenya National Health Accounts 2015/16. Nairobi : Ministry of Health. 8 HIV/AIDS, TB, Malaria, Reproductive Health (RH), NCDs, nutritional deficiencies, vaccine-preventable diseases, diarrhoeal diseases and respiratory infections. 9 Ethiopia Federal Ministry of Health. April 2014. Ethiopia’s Fifth National Health Accounts 2010/2011. Addis Ababa, Ethiopia. 10 Islamic Republic of Afghanistan, Ministry of Public Health. Afghanistan National Health Accounts with Sub-Accounts for Reproductive Health 2011-2012. October 2013. 11 Directorate of Policy and Planning, Ministry of Health and Social Welfare. July 2012. Health Sector Public Expenditure Review, 2010/11. Dar es Salaam, Tanzania and Health Systems 20/20 project, Abt Associates Inc. 12 It happens quite often that domestic budget does not increase when substantial external aid is present

MNH Kenya – Summative Evaluation – Vol 2. Annex VIII
hera / Final summative report / January 2020 10
for MNH: this would lead to somewhat artificial calculations (and quasi impossible at this stage). Therefore,
the attribution of incremental impact to the DFID programme will take into consideration the DFID MNH
budget compared to county MNH expenditure calculated as 12.1% of total county health expenditure
(excluding DFID contribution) table below).
Table 7. Bungoma County: health expenditure and MNH expenditure 2014 -2018 (GBP)
Expenditure 2014 2015 2016 2017 2018
Total Health (GBP) 12,394,705 12,313,604 15,817,314 18,306,700 19,376,322
MNH (GBP) 1,499,759 1,489,946 1,913,895 2,215,111 2,344,535
Bungoma population 1,609,749 1,627,374 1,719,013 1,774,180 1,637,392
Total health per capita (GBP) 7.70 7.57 9.20 10.32 11.83
MNH per capita (GBP) 0.93 0.92 1.11 1.25 1.43
3 DFID MNH BUDGET (OVERALL AND FOR BUNGOMA COUNTY)
3.1 MANI, MANI BUNGOMA, AND MANI CICF
OPTIONS provided us with the 2 following tables (see below): budget and actual expenditure per phase and
per category of cost, and cost per partner (as part of the total inputs and expenses of table 7).
Table 8. MANI project budget and expenditure 2015-2018 (GBP)
GBP Inception Implement-
ation Extension Total
Current
Amendment
Revised
Total
Programme
Spend up to
Dec 2018
Inputs
Long Term
Input Days 110,369 3,044,524 1,135,980 4,290,873 980,077 5,270,950 6,319,019
Short Term
Input Day 268,624 1,746,053 110,480 2,125,157 103,635 2,228,792 1,016,300
Management
Input Day 28,051 486,680 54,702 569,433 70,800 640,233 770,250
Total Cost of
Fees 407,044 5,277,257 1,301,162 6,985,463 1,154,512 8,139,975 8,105,569
Expenses
Total Travel
Costs 31,538 290,839 58,976 381,353 54,416 435,769 241,960
Total Living
Costs 24,542 278,190 23,183 325,915 20,020 345,935 119,944
Total
Equipment
Costs
66,400 346,003 261,277 673,680 6,462 680,142 429,465
Total Activity
Costs 139,155 1,653,469 1,792,624 810,123 2,602,747 2,713,661
Of which PBF 704,405
Total Other
Costs 42,030 592,522 634,552 118,583 753,135 872,835
Total Cost of
Expenses 303,665 3,161,023 343,436 3,808,124 1,009,604 4,817,728 4,377,865

MNH Kenya – Summative Evaluation – Vol 2. Annex VIII
hera / Final summative report / January 2020 11
GBP Inception Implement-
ation Extension Total
Current
Amendment
Revised
Total
Programme
Spend up to
Dec 2018
Total Fees &
Expenses
(output
based)
710,709 8,438,280 1,644,598 10,793,587 2,164,116 12,957,703 12,483,434
Total CICF
and vouchers
(reimbursable
)
576,364 11,408,794 1,250,000 13,235,158 -3,283,324 9,951,834 9,507,261
Of which
vouchers
(DSF)
884,703
Total Cost 1,287,073 19,847,074 2,894,598 24,028,745 -1,119,208 22,909,537 21,990,695
Table 9. MANI expenditure per Consortium Partner
GBP and % Fees Expenses Total % to CICF
% to
Bungoma
County
% for other
KPMG 2,087,108 134,110 2,221,218 100%
Population Council 402,191 87,555 489,746 80% 20%
IHPMR 159,127 71,946 231,073 100%
Mannion Daniels 806,790 121,449 928,239 100%
AMREF 357,566 432,531 790,097 100%
CARE 357,911 392,197 750,108 100%
Internews 563,209 563,209 40% 40% 20%
Additional data and assumptions provided by Options and or collected/elaborated by the evaluation team
were necessary to do an annual apportionment of expenditure between the following components: HSS
Bungoma, overall CICF, and CICF in Bungoma.
• Expenditure per year: Inception phase = Q1 and Q2 2015; implementation phase : from Q3 2015 to
Q4 2017 (thus, 10 Quarters); Extension phase (and current amendment): 2018.
• Apportionment between phases: 6% for inception phase, 76% for implementation phase, 18% for
extension phase. Flat apportionment per Quarter inside each phase.
• We have grouped LT and ST input days, management days, travel costs and living costs under a single
category of cost “Input”.
• The cost of KPMG represents 70% of the total CICF management cost (according to Options), the
remaining being equally shared between Options and Population Council (15% each). As the cost of
KPMG is GPB million 2.2 (and KPMG being 100% on CICF), we deduce that the total CICF
management cost represents GBP 3,412,249 (including also the CICF cost of Internews).
The apportionment is presented in the tables below (Bungoma HSS and CICF).

MNH Kenya – Summative Evaluation – Vol 2. Annex VIII
hera / Final summative report / January 2020 12
Table 10. MANI-HSS Bungoma expenditure per year (GBP and %)
GBP 2015 2016 2017 2018 Total %
Inputs (LT & ST days,
management days, travel
costs and living costs)
1,072,708 1,536,738 1,536,738 909,040 5,055,224 51%
Equipment 91,132 130,554 130,554 77,227 429,466 4%
Activity 426,360 610,794 610,794 361,308 2,009,256 20%
Performance base
financing (PBF) 149,473 214,132 214,132 126,667 704,405 7%
Demand side financing
(DSF) 187,732 268,941 268,941 159,089 884,703 9%
Other 185,214 265,333 265,333 156,955 872,835 9%
Total 2,112,619 3,026,492 3,026,492 1,790,286 9,955,889 100%
Table 11. MANI-CICF expenditure 2015-2018 (GBP and %) 2015 2016 2017 2018 Total
Management cost 740,458 1,173,814 1,173,814 324,164 3,412,249
KPMG 482,004 764,099 764,099 211,016 2,221,218
Options 104,784 166,108 166,108 45,873 482,873
Population Council 104,784 166,108 166,108 45,873 482,873
Internews 48,887 77,498 77,498 21,402 225,284
Expenditure on CICF Fund 1,871,095 2,966,160 2,966,160 819,143 8,622,558
Total 2,611,553 4,139,973 4,139,973 1,143,307 12,034,806
% Management cost 28% / 39.5%
3.2 CICF AND CICF BUNGOMA
The table below shows the list of CICF grants by round, category (innovation or scaling up), with the duration
in months and the total expenditure (up to December 2018).
Table 12. CICF Grants: Category, Duration and budget (GBP)
Round I/S Grant Duration
(months)
Total
(Contract
Amount)
Unexpended
funds (e.g.
grant close
or realised
savings)
Total
(Adjusted
Project
Amounts)
1 I Health E-net (CICF-INN-R1-GA-
001) 01-01-2016 / 30-06-2018 29 249,851 2,174 247,677
1 S IRC (CICF-SCL-R1-GA-002) 01-
12-2015 / 30-10-2017 22 1,000,000 26,838 973,162
1 I
Malteser International (CICF-
INN-R1-GA-003) 15-10-2015 /
30-04-2018
30 249,875 - 249,875

MNH Kenya – Summative Evaluation – Vol 2. Annex VIII
hera / Final summative report / January 2020 13
1 I MKU (CICF-INN-R1-GA-004) 01-
11-2015 / 30-04-2019 41 338,575 - 338,575
1 S
Pathfinder International (CICF-
SCL-R1-GA-005) 15-10-2015 /
31-12-2017
26 999,858 79,033 920,825
1 I RCTP-FACES (CICF-INN-R1-GA-
006) 15-10-2015 / 30-04-2018 30 249,884 30,964 218,920
1 I PATH (CICF-INN-R1-GA-007) 01-
01-2016 / 31-03-2019 38 665,000 609 664,391
2 I
Gertrude Children's' Hospital
(CICF-INN-R2-GA-001) 01-03-
2016 / 30-06-2018
27 242,496 142 242,354
2 S
Afya Research Africa (CICF-SCL-
R2-GA-002) 01-03-2016 / 31-
03-2019
36 938,642 - 938,642
2 I APHRC (CICF-INN-R2-GA-003)
15-02-2016 / 31-05-2018 27 246,507 25,333 221,174
2 I RCTP-FACES (CICF-INN-R2-GA-
004) 01-03-2016 / 31-03-2019 36 368,885 - 368,885
2 S
Save the Children International
(CICF-SCL-R2-GA-005) 01-04-
2016 / 30-04-2018
24 822,271 - 822,271
2 S MGH (CICF-SCL-R2-006) 01-06-
2016 / 31-03-2019 33 821,086 - 821,086
3 I
Center for Public Health and
Development (CICF-INN-R3-GA-
002) 01-07-2017 / 31-03-2019
20 425,608 - 425,608
3 I
Afya Research Africa (CICF-INN-
R3-GA-003) 01-07-2017 / 31-
03-2019
20 399,954 - 399,954
3 I
Lexlink Consulting (CICF-INN-R3-
GA-004) 01-07-2017 / 31-03-
2019
20 170,346 - 170,346
3 I
Management Sciences for
Health, Inc. (CICF-INN-R3-GA-
005) 01-08-2017 / 30-04-2019
20 421,903 - 421,903
3 I APHRC (CICF-INN-R3-GA-006)
01-08-2017 / 30-04-2019 20 355,626 - 355,626
Total 8,966,366.43 165,093.33 8,801,273.10

MNH Kenya – Summative Evaluation – Vol 2. Annex VIII
hera / Final summative report / January 2020 14
Table 13. CICF: Expenditure per type of grants
# Grants Total months Contract
Amount
Adjusted Project
Amounts %
Innovation 13 358 4,384,510 4,325,287 49%
Scaling 5 141 4,581,857 4,475,986 51%
Total 18 499 8,966,366 8,801,273 100%
The CICF grants for Bungoma are listed in Tables 14 and 15. As the MGH project (UBT) covers 4 counties, we
divided the actual expenditure by 4 to get the share of Bungoma (there was no other available information
to use another method of apportionment).
Table 14. CICF projects in Bungoma (budgets)
Rd. Grantee Project County Budget(£)
1 (I) Mount Kenya
University (MKU)
Collaborative new-born support project (new-
born care units and training/mentoring) Bungoma 338,575
2
(S/I)
Save the Children
(SCI)
1. Increasing access to quality care for preterm
and low birth weight babies through kangaroo
mother care
2. Improving the monitoring of labour through
the use of a digital partograph
Bungoma 822,271
2 (S)
Massachusetts
General Hospital
(MGH)
Every second matters for mothers and babies -
uterine balloon tamponade 4 counties
821,086 (total
budget for the 4
counties: so, a
theoretical
budget of
205,271 for
Bungoma)
Total
1,981,932 (or
1,366117 if MGH
limited to
Bungoma)
Table 15. CICF Bungoma: Actual Expenditure per year (GBP)
2016 2017 2018 Total
MGH 23,893 95,370 40,000 159,262
MKU 97,816 97,816 97,816 293,448
SCI 221,255 295,007 295,007 811,270
Total 342,964 488,193 432,823 1,263,980
Management Cost (OPTIONS, KPMG, POP.
COUNCIL, INTERNEWS) (28% of total or 39.5% of
direct expenditure)
135,471 192,836 170,965 499,272
Grand Total 478,435 681,030 603,788 1,763,252

MNH Kenya – Summative Evaluation – Vol 2. Annex VIII
hera / Final summative report / January 2020 15
We decided to consider all CICF projects in Bungoma (whether innovation or scaling projects) as contributing
to Bungoma HSS13 (quoted from the CICF evaluation report):
• “The Collaborative Newborn Support Project was an innovation project designed as an
implementation research study to address the high rate of neonatal mortality in Bungoma County
which was estimated at 32/1,000 in 2015. The project was implemented by Mount Kenya University
(MKU), a private university located in Thika, Kiambu County and the Fountain Africa Trust (FAT), a
local NGO based in Webuye, Bungoma County in collaboration with the Bungoma County Ministry of
Health and the Kenya Paediatric Association (KPA). The interventions included: (1) Upgrading and
refurbishing eight new-born care units; (2) Training of staff in the eight hospitals using a new-born
care training package developed by the KPA; including the provision of job-aids; (3) Radio spots, a
weekly radio information and call-in programme, and community theatre skits with information
about new-born care; (4) Establishment of a telehealth platform for NBU staff to consult with
paediatricians in Bungoma (there is one paediatrician in Bungoma) and at MKU; (5) An individualised
telephone follow-up service with advice and reminders on new-born care for all mothers who
delivered in the eight hospitals”. All these interventions can be considered as having supported HHS
in Bungoma County with potential impact on MNH outcomes.
• KMC: “In April 2016, Save the Children International (SCI) received a Round 2 CICF scaling grant to
accelerate the implementation of KMC in 18 health facilities in Bungoma county, to support the MoH
in finalising and disseminating national guidelines for KMC and to increase the use of KMC through
awareness raising in the mass media. The first two objectives were pursued in cooperation with the
MoH at county and national level; for the third component, SCI worked in collaboration with BBC
Media Action, an international organisation affiliated with the British Broadcasting Corporation. The
grant was shared with an innovation project implemented by SCI for the piloting of an electronic
partograph in selected hospitals of Bungoma County. The project ended after a cost extension in
December 2018. Funding for the support of KMC in Bungoma County and for the piloting of the e-
partograph had already ended earlier, but the extension was granted for SCI to provide technical
support to the MoH and to work with partners on the revision of national guidelines for quality
obstetric and perinatal care. The CICF KMC grant to SCI contributed to the improvement of new-born
care in Bungoma County, together with the CICF grant to MKU and the health systems support
provided by the MANI programme. The contribution to national policies and guidelines was also
confirmed in interviews, although all MoH documents that mention KMC available on the MoH
website predate the initiation of the project, and several other large organisations, including UNICEF,
were active in the promotion of KMC”. All these interventions can be considered as having supported
HHS in Bungoma County with potential impact on MNH outcomes (even the training on using
partographs).
• UBT: “In June 2016, the MGH was awarded a CICF scaling grant to introduce and promote the uptake
of the ESM-UBT kit in maternity care facilities initially in Turkana, Garissa, Kakamega and Bungoma
Counties, later scaled up to 12 counties. The grant ended after a no-cost and a cost extension in
March 2019 with a total grant budget of GBP 821,086. The grant-funded project was implemented by
the Kisumu Medical and Educational Trust (KMET), an organisation that specialised in promoting
reproductive health with a focus on adolescent girls and young women in partnership with the MoH
and medical training institutions. Early collaboration with the MoH resulted in a draft communiqué
issued by the MoH and UNFPA in 2014 entitled ‘Ending preventable maternal and mortality in Kenya:
13 See the CICF evaluation report under a separate cover.

MNH Kenya – Summative Evaluation – Vol 2. Annex VIII
hera / Final summative report / January 2020 16
Accelerating use of uterine balloon tamponade to improve management of post-partum
haemorrhage in the 47 counties in Kenya.’ The Kenya Obstetrical and Gynaecological Society
endorsed the use of UBT in 2016 and recommended that all counties ‘operationalise training,
procurement and provision of the technology in all health facilities where it is needed’. Interviewed
staff reported that according to data extracted from facility registers, 654 kits had been used at the
time of the evaluation. They estimated that the rate of under-reporting is high, because inventory
monitoring indicated that the number was likely to be above 1,000. Introduction of the kits in the
eight counties that are additional to the CICF portfolio was funded by other international partners.
The Kenya Medical Supplies Authority (KEMSA) has included ESM-UBT kits in its range of products
and several counties have included the procurement of the kits in their health budgets. The CICF-
funded project had a research arm that included the follow-up of women treated with UBT after
discharge from the maternity ward. The scope of the in-service training provided by KMET in
collaboration with MoH has also increased to comprehensively cover the management of PPH, and
negotiations with medical training colleges are on-going to include this as a pre-service training
module. In meetings with the evaluation team CHMT officials in Kakamega and Bungoma County
confirmed that the counties were committed to rolling out UBT to all health facilities providing
maternity services and have included the ESM-UBT kits in their procurement plan. Facilities visited by
the evaluation team in November 2018 and in April 2019 reported that kits were in stock.
Uncontrolled PPH is not a common event, so the reported number of times the kits had been used
were generally in the low one-digit range. The project to scale-up UBT in Kenya was highly successful,
providing timely input to bring an on-going effort by multiple national and international partners to
scale. The technology is appropriate and has the potential to contribute to a reduction of maternal
mortality in Kenya. The portfolio of interventions supported by CICF which included health worker
training in collaboration with the MoH, advocacy at central and county level, support to budget
planning at county level, and business planning for the production and commercialisation of the
ESM-UBT kits triangulated well with programmes of other international partners to generate an
outcome that has a high probability of being sustainable. No need to say that ESM-UBT should be
considered as having supported MNH-HSS In Bungoma with potential impact on MNH outcomes.
3.3 LSTM – MIH (OVERALL EXPENDITURE)
The figures below show the MiH Quarterly (actual) expenditure by category of cost since Q2 2014 until Q4
2018 in GBP and in percentage. It illustrates that the “Start-up and Office running costs” have increased
until Q4 2016 (almost proportionally to the level of in-service training activities) but did not decrease
accordingly when those activities were finished: it is thus difficult to consider those costs as pure fixed cost.
The “Start-up and Office running cost” + “Management fee” (MF) represent 42% of the total expenditure for
the whole duration of the programme, but varies from 15% (Q3 2014) to 70% (Q4 2017): that efficiency rate
(and the variations between Quarters) can be considered as normal taking stock of the nature of the
programme. However, the relatively high absolute (and relative) costs of the “start-up and office running
costs” in the last six quarters of the programme, while main training activities had mostly closed, may require
some further explanation by LSTM. One assumption is that human resource investment for pre-service
training and operational research is partly or fully captured under this category.
The expenditure per category of cost also shows that the MiH moved from a programme that was initially
more focused on training, to one that put more emphasis on generating evidence and learning from
implementation (hence 7% of the original budget was allocated to M&E, supervision and operational

MNH Kenya – Summative Evaluation – Vol 2. Annex VIII
hera / Final summative report / January 2020 17
research (OR)). Indeed, once training targets were achieved the focus shifted to generating evidence, with
the cost category “M&E and OR” becoming more substantial14. That could also explain the observation that
the “Start up and Office running cost” don’t really decrease after Q2 2017 (when the training activities were
almost finished).
Once training targets were reached LSTM submitted a request to deliver more training from efficiency
savings in April 2018, this was approved in October 2018 by which time LSTM had started reducing staff
numbers and eventually restructured the team to get a better balance between activities and LOE in
April/May 2019. Most M&E, support supervision and OR activities were completed towards the end of 2018.
There is nothing to contradict the main Value for Money (VfM) results from the LSTM Quarterly reports, e.g.
“Value for money (VfM) is being achieved by minimising input costs (economy) and maximising the efficiency
and effectiveness of the project, through the following measures:
• Quarterly spot-checks of cost items claimed by CMNH-LSTM Kenya (alongside continuing use of the
quarterly financial tracker which allows scrutiny of each transaction made under the programme);
• Programme management and financial internal control spot-check visits are made to the CMNH-
LSTM Kenya office on a regular basis;
• Continual review of UK-based staff and volunteer travel, meaning activities maximised in-country for
each flight made;
• Volunteer UK faculty continue to be used to deliver EmONC training courses in-country, giving their
time and expertise pro bono;
• The model of phasing out the use of UK faculty and increasing use of in-country faculty as the
programme progresses means that fewer costs are incurred for international travel; and
• Building the capacity of in-country teams has continued through training, coaching and mentoring,
resulting in even greater competence and reducing the need for UK-based staff to undertake
international travel to address issues in-country”.
14 The « M&E » budget line also includes the cost of supportive supervision that started in 2016.

MNH Kenya – Summative Evaluation – Vol 2. Annex VIII
hera / Final summative report / January 2020 18
Figure 2. MiH Expenditure per Quarter (GBP)
Figure 3. MiH Expenditure per Quarter (in percentage)

MNH Kenya – Summative Evaluation – Vol 2. Annex VIII
hera / Final summative report / January 2020 19
Error! Reference source not found.4 below shows the direct cost per trainee (in-service): around GBP 500
(USD 63615). The investment cost (equipment, set-up of the training systems, etc.) explains the high cost
during the two first Quarters (as well as the low number of trainees at the start of the programme). This
(direct) unit cost per trainee comprises mainly of Accommodation and Subsistence for trainers and trainees
as well as trainers fees. In terms of international comparisons, it compares favourably with e.g. the cost of
short courses (Supply Chain Management) provided by the Regional Centre of Excellence for Vaccines,
Immunization and Health Supply Chain Management (RCE-VIHSCM, University of Rwanda): full cost of
US$ 1,716 per trainee, of which US$1,000 for tuition fee (5 days course, 2 trainers and 2 facilitators).
Figure 4. Direct Unit Cost per (direct) trainee ( in -service training) (GBP)
3.4 LSTM-MIH IN BUNGOMA
289 staff16 from Bungoma county have been trained by LSTM (from 2014 to 2016), of which 255 ( 88% )
through EmONC in service-training modalities (direct training), 14 in MPDSR/QI, 6 in QA and Data
Management, and 14 through ToT. According to LSTM, the direct expenditure17 for Bungoma training
activities represented GBP 88,70318 (0.9% of the total expenditure 2014-2018, or 2.4 % of total expenditure
for in-service training). The (direct) unit cost per trainee (in-service training) ranges from GBP 296 to 358,
which also compares favourably with other regional training and research organisations (see previous
section).
15 www.xe.com (27 May 2019) 16 Figures vary between several files received, but some files were including trainees from other counties (trainings were organised for staff coming from different sub-counties (within and outside Bungoma county). 17 Cost of trainers and trainees, transportation, subsistence and accommodation, etc. 18 2014: GBP 40,438; 2015: GBP 15,410; 2016: GBP 32,854
3,108
1,470
430 492572
356504
350 379 370
773
466 410
1,433
513
0
500
1,000
1,500
2,000
2,500
3,000
3,500
Q2 2014 Q3 2014 Q4 2014 Q1 2015 Q2 2015 Q3 2015 Q4 2015 Q1 2016 Q2 2016 Q3 2016 Q4 2016 Q1 2017 Q2 2017 Q3 2017 Total
GB
P

MNH Kenya – Summative Evaluation – Vol 2. Annex VIII
hera / Final summative report / January 2020 20
The (uncomplete and not 100% reliable) breakdown by sub county (provided by LSTM) shows that the sub-
counties supported by MANI have been privileged compared to the other sub counties, e.g. 11 trainees
(EmONC in service -training) in Mount Elgon vs. 32 trainees in Sirisia. It may be due to the difference of total
staff between sub-counties, but it is also certainly since MANI asked LSTM to train additional staff (because
some already trained staff had left). The evaluation team estimated a loss of in-service EmONC training
between 25% and 50% over a period of 1-2 years, based on the Bungoma data.
Table 16. MiH expenditure in Bungoma County
MiH Bungoma (GBP) 2014 2015 2016 Total
In-service 39,501 15,005 30,116 84,622
TOT 937 937
MPDSR/QI training 405 185 590
M&E and OR 2,553 2,553
Total 40,439 15,410 32,854 88,703
Start-up and Office running cost &
Management fee as % on activity costs
(based on quarterly financial reports)
20% 33% 38% 29%
Start-up and Office running cost &
Management fee cost 8,088 5,085 12,485 25,658
Grand total 48,526 20,496 45,339 114,361
The table below summarises the DFID MNH support to Bungoma county from the different components:
MANI HSS Bungoma; MiH Bungoma; and CICF Bungoma.
Table 17. Total DFID MNH Bungoma (GBP)
GBP 2014 GBP 2015 GBP 2016 GBP 2017 GBP 2018 GBP Total
MANI HSS Bungoma 2,112,619 3,026,492 3,026,492 1,790,286 9,955,889
MiH Bungoma 48,526 20,496 45,339 114,361
CICF Bungoma 478,435 681,030 603,788 1,763,252
Total 48,526 2,133,115 3,550,266 3,707,522 2,394,074 11,833,502
Population (6 SC) 1,041,954 1,038,944 1,111,753 1,164,325 1,070,236
Per capita (GBP) 0.05 2.05 3.19 3.18 2.24

MNH Kenya – Summative Evaluation – Vol 2. Annex VIII
hera / Final summative report / January 2020 21
4 COST-EFFECTIVENESS ANALYSIS
The basic principle of the Incremental Cost-Effectiveness Ratio (ICER) method is to divide the DFID MNH
programme expenditure by the incremental number of DALYs averted. The number of DALYs averted is
computed based on the increase of coverage rates. The objective of the cost-effectiveness analysis is to
provide comparisons between ICER as calculated in the VfM report of the formative evaluation and the
present VfM report (summative evaluation)19: some improvement is expected since the effects of additional
funding in HSS on health outcomes are likely to be lagged.
4.1 ADDITIONAL DFID MNH EXPENDITURE VS. DOMESTIC MNH EXPENDITURE IN BUNGOMA
The table below summarises the substantial support from DFID to MNH in Bungoma county, especially from
2015 to 2018 (between 51% to 65% of total annual MNH expenditure). See Sections above for detailed
calculations and methods. It is to be noted that (a) the county budget is for all the SC, (b) the MANI HSS
budget is for 6 SC, (c) the CICF in Bungoma covered all SC, and (d) the MiH covered all the SC, but with a
special focus on “MANI SC”. It proved totally impossible to calculate the exact expenditure from all
components (MiH, CICF, and specially the SC budget) for the 6 SC supported by MANI HSS. We therefore
must accept a certain margin of error in the cost-effectiveness calculations.
Such assistance for one county in a rather limited area (MNH) can give hope for a substantial impact.
Table 18. Bungoma County Health Expenditure 2014 - 2018
GBP 2014 GBP 2015 GBP 2016 GBP 2017 GBP 2018
County Health Expenditure
Total Health 12,394,705 12,313,604 15,817,314 18,306,700 19,376,322
MNH (12.1%) 1,499,759 1,489,946 1,913,895 2,215,111 2,344,535
DFID MNH Expenditure
MANI HSS Bungoma (6SC) 2,112,619 3,026,492 3,026,492 1,790,286
MiH Bungoma 48,526 20,496 45,339
CICF Bungoma 478,435 681,030 603,788
Total DFIF MNH Bungoma 48,526 2,133,115 3,550,266 3,707,522 2,394,074
Total DFID + County MNH 1,548,285 3,623,061 5,464,161 5,922,633 4,738,609
Share of DFID on total 3% 59% 65% 63% 51%
4.2 BASELINE
1. MATERNAL MORTALITY RATIO
The Maternal Mortality Ratio (MMR) (maternal deaths per 100,000 live births) varies considerably between
sources/models:
• The KDHS2014 provides an MMR of 360, which is for the period 2007-2014
• The UN modelled estimate is 525 in 2014 (WDI)
19 Therefore, contrary to appraisal exercises, the purpose of the cost-effectiveness analysis is not to enable choices between concurrent options.

MNH Kenya – Summative Evaluation – Vol 2. Annex VIII
hera / Final summative report / January 2020 22
• The UNFPA MMR for 2010 is 495, with estimates per Region and County20 (sole source of MMR data
per County):
Nairobi: 212
Western Region: 319
Bungoma: 259
We decided to use a tentative national baseline MMR (year 2014) of 400 (an in-between the UN modelled
estimate of 525, UNFPA 2009/10 figures (495) and KDHS 2007-2014 figures (362), and to compute the MMR
per County based on the variances from UNFPA 2010 data but taking the Western Region ratio of 319 instead
of the Bungoma County ratio (259) that seems rather inconsistent with the other MNH indicators of that
County compared to other similar counties. We will thus use a MMR of 258 for Bungoma (baseline 2014).
Table 19. National and Bungoma MMR in 2014 (baseline)
UNFPA MMR (Based on national
average of 495/100,000 in 2009)
MMR computed on national
average of 400 in 2014 (baseline)
National 495 400
Bungoma 319 258
2. NEONATAL MORTALITY RATE
NMR data are more consistent among data sources/models:
• The World Bank WDI NMR21 data:
Year 2010 2011 2012 2013 2014 2015
NMR 25.9 25.1 24.3 23.6 22.9 22.2
• KDHS2014 comprises of NMR22 (national level and per region) per Region:
National: 22
Western Region: 19
We decided to use the KDHS2014 NMR rate of the the Western Region and to apply it for Bungoma for our
baseline 2014: 19/1000
4.3 COST-EFFECTIVENESS RATIOS
This section presents the cost-effectiveness analysis for the DFID MNH programme in Bungoma county. It is
based on specific county BoD, variation of coverage trends (deliveries in HFs), and incremental health
expenditure (i.e. total DFID MNH support to Bungoma County (MANI HSS, MANI CICF , and LSTM/MiH).
The most common approach for cost-effectiveness, promoted by the World Health Organization’s Choosing
Interventions that are Cost–Effective (WHO-CHOICE) project, involves the use of thresholds based on per
capita gross domestic product (GDP) : an intervention that, per disability-adjusted life-year (DALY) avoided,
20 The Policy Brief No. 38 (October 2013 -Population Studies and Research Institute, National Council for Population and Development, UNFPA) 21 NMR: number of deaths of infants 0-27 days per 1,000 live births. 22 KDHS2014 NMR are for the period 2009-2014

MNH Kenya – Summative Evaluation – Vol 2. Annex VIII
hera / Final summative report / January 2020 23
costs less than three times the national annual GDP per capita is considered cost–effective, whereas one
that costs less than once the national annual GDP per capita is considered highly cost–effective.
The table below shows the deaths and DALYs related to maternal and neonatal disorders in Kenya from 2014
to 2018 (data 2014 to 2017 are from IHME accessed in August 2019, and 2018 data are calculated on the
variation 2016-2017). The first part of the table shows absolute figures (total deaths and DALYS for the whole
country) while the second part of the table shows the figures per 100,000 population (which thus considers
the demographic increase). We will use these figures to translate the number of deaths averted into DALYs
averted.
Table 20. MNH Burden of Disease 2014-2018 (IHME accessed in August 2019 ) Maternal disorders (absolute numbers)
Deaths DALYs Quotient DALY/Death Annual change
(Deaths)
Annual change
(DALYs)
2014 3,966.43 243,297.14 61.34
2015 3,962.46 243,062.54 61.34 -0.10% -0.10%
2016 3,993.02 244,948.66 61.34 0.77% 0.78%
2017 3,990.42 245,141.62 61.43 -0.07% 0.08%
2018 3,987.82 245,334.73 61.52 -0.07% 0.08%
Neonatal disorders (absolute numbers)
Deaths DALYs Quotient DALY/Death Annual change
(Deaths)
Annual change
(DALYs)
2014 17,579.37 1,764,853.55 100.39
2015 17,505.17 1,771,833.52 101.22 -0.42% 0.40%
2016 17,256.60 1,764,455.73 102.25 -1.42% -0.42%
2017 16,978.27 1,755,556.10 103.40 -1.61% -0.50%
2018 16,704.43 1,746,701.36 104.57 -1.61% -0.50%
Maternal disorders (figures per 100,000 pop)
Deaths DALYs Quotient DALY/Death Annual change
(Deaths)
Annual change
(DALYs)
2014 8.81 540.44 61.34
2015 8.59 527.09 61.36 -2.50% -2.47%
2016 8.46 518.81 61.33 -1.51% -1.57%
2017 8.26 507.26 61.41 -2.36% -2.23%
2018 8.06 495.97 61.50 -2.36% -2.23%
Neonatal disorders (figures per 100,000 pop)
Deaths DALYs Quotient DALY/Death Annual change
(Deaths)
Annual change
(DALYs)
2014 39.05 3,920.33 100.39
2015 37.96 3,842.32 101.22 -2.79% -1.99%
2016 36.55 3,737.18 102.25 -3.71% -2.74%
2017 35.13 3,632.38 103.40 -3.89% -2.80%
2018 33.77 3,530.52 104.56 -3.89% -2.80%

MNH Kenya – Summative Evaluation – Vol 2. Annex VIII
hera / Final summative report / January 2020 24
The table below23 shows the cost per DALY averted: GBP 328 for the whole period of intervention (2015-
2018), ranging from GBP 11424 in 2018 to GBP 741 in 2017 (all “highly cost-effective” if compared to the GDP
per capita – GBP 1,286 in 2018-25). The year 2014 is used as baseline to reflect the fact that the substantial
support to Bungoma county started in 2015: thus all 2014 initial values and rates/ratios are kept the same
in the following years. The coverage increase in HF deliveries is then translated into maternal and neonatal
deaths averted, and then into DALYs averted.
Table 21. CEA Bungoma County
BUNGOMA 2014
(baseline) 2015 2016 2017 2018
Total 2015/18
Population 1,041,954 1,038,944 1,111,753 1,164,325 1,070,236
Expected deliveries 41,195 38,597 41,135 44,823 41,740
BoD Baseline (what if expected deaths and DALYs remained at the 2014 level?) in the 6 MANI sub-counties
MMR (258/100,000)
258 258 258 258 258
NMR (19/1000) 19.0 19.0 19.0 19.0 19.0
Expected maternal deaths
106 100 106 116 108 429
Quotient maternal DALY/Death
61.34 61.34 61.34 61.34 61.34
Expected maternal DALYs
6,519 6,108 6,510 7,094 6,606 26,317
Expected neonatal deaths
783 733 782 852 793 3,160
Quotient neonatal DALY/Death
100.39 100.39 100.39 100.39 100.39
Expected neonatal DALYs
78,576 73,620 78,461 85,496 79,615 317,193
Actual data Bungoma County : Coverage increase (6 MANI SC)
Delivery in health facility coverage rate
55.4% 59.6% 63.0% 60.8% 79.7%
Coverage increase (on 2014 baseline)
4.3% 7.6% 5.4% 24.4%
Impact of coverage increase (100% efficacy) (6 MANI SC)
Maternal deaths averted
4.25 8.12 6.25 26.23 45
Neonatal deaths averted
31.3 59.8 46.0 193.1 330
Total deaths averted
35.5 67.9 52.2 219.4 375
Maternal DALYS averted
260 498 383 1,609 2,750
Neonatal DALYs averted
3,139 6,001 4,618 19,389 33,147
Total DALYs averted
3,399 6,499 5,001 20,998 35,897
Cost-effectiveness (GBP) (100% attributability
DFID MNH expenditure Budget (GBP) (MiH and CICF in
2,133,115 3,550,266 3,707,522 2,394,074 11,784,977
23 Population, expected deliveries, and coverage rates are from Kenya DHIS2 (accessed during July-August 2019). The DHIS 2 figures are for the 6 sub-counties supported by MANI in Bungoma. Population figures don’t seem very consistent (100,000 inhabitants less in 2018 than in 2017 !), but it is the most robust source of data that we could find . 24 The DFID MNH business case was based on a CER of GBP 100 per DALY averted. 25 But based on efficacy and attributability rates of 100% (see below)

MNH Kenya – Summative Evaluation – Vol 2. Annex VIII
hera / Final summative report / January 2020 25
BUNGOMA 2014
(baseline) 2015 2016 2017 2018
Total 2015/18
to DFID additional funding)
Bungoma County and MANI in the 6 SC)
Total MNH expenditure (DFID + County)(GBP)
3,623,061 5,464,161 5,922,633 4,738,609 19,748,464
DFID MNH expenditure/Total MNH expenditure
59% 65% 63% 51% 60%
Cost per DALY averted (GBP)
628 546 741 114 328
Cost per death averted
60,065 52,290 70,965 10,914 31,425
The tables below show the sensitivity analyses both to the efficacy rate (from 25% to 100%) and to the
attributability rate (from 25% to 100%), with a RAG rating system based on WHO thresholds and on the
Kenya GDP per capita 2018 being US$ 1,710 (current US$26 = GBP 1,286 (2018): green if the cost per DALY
averted is less than the GDP per capita (highly cost-effective), amber if the cost per DALY averted is less than
3 times the GDP per capita (cost-effective), red if the cost per DALY averted is greater than 3 times the GDP
per capita (not cost-effective).
• The efficacy rate reflects the direct impact of HF deliveries compared to home deliveries: an efficacy
rate of 100% would mean that facility-based deliveries imply 100% less morbidity/mortality than
home deliveries, or there is no maternal/neonatal death/DALY anymore among additional deliveries
in health facility ( which is very unlikely ). An efficacy rate of 0% would mean that the increase of HF
deliveries has no impact at all on maternal deaths/DALYs.
• The attributability rate reflects the percentage of the outcomes that can be attributed to the
additional funding coming from the DFID MNH programme. An attributability rate of 100% would
mean that each additional death/DALY averted is due to the incremental funding coming from the
programme (and not to any other intervention or domestic funding).
The simulation shows that CE ratios remain “highly effective” or “effective” except in the case where both
rates are lower or equal to 25% (i.e. the additional DFID budget does not contribute to more than 25% of
the increased coverage and outcomes (the rest being attributed to other causes), and the efficacy rate of
HF deliveries is lower than 25% meaning that the benefits of HF deliveries compared to home deliveries are
much lower than expected). It is reasonable to assume that both rates are in the region of 50% which would
place the value for money assessment of the MNH programme in Bugoma County in the region between
cost effectiveness and highly cost effectiveness.
Table 22. CEA Bungoma County (GBP , 2015-2018)
Efficacy Attributability
25% 50% 75% 100%
25% 5,253 2,626 1,751 1,313
50% 2,626 1,313 875 657
75% 1,751 875 584 438
100% 1,313 657 438 328
26 WB data, accessed July 2019

MNH Kenya – Summative Evaluation – Vol 2. Annex VIII
hera / Final summative report / January 2020 26
The Bungoma CE ratios are much better than the ones calculated for the formative evaluation VfM report
where there were no “highly cost-effective” ratios whatever the efficacy and attributability rates were (see
Table below from the Formative Evaluation report):
Table 23. CEA Bungoma County (GBP, 2014-2016, Formative Evaluation) Cost per DALY averted
(US$) Attributability
Efficacy 18% 36% 54%
25% 17,570 8,785 5,857
50% 8,785 4,392 2,928
75% 5,857 2,928 1,952
100% 4,392 2,196 1,464
This improvement may reflect (1) the importance attached to VfM (for all the “Es”) from the different
implementers and (2) the fact that the effects of some investments in HSS on health outcomes are likely
lagged (e.g. infrastructure, green energy, PBF which may produce their full impact several months or years
after the start of their implementation).
It must be noted however that WHO thresholds as commonly used to rate the cost-effectiveness ratios are
rather “generous” in the sense that most of the MNCH projects/interventions (well implemented) are likely
to be rated as at least cost-effective (if not “highly cost-effective”). Some recent studies question those WHO
thresholds (e.g. one study published in 201527 suggests “ that cost-effectiveness thresholds representing
likely health opportunity costs tend to be below the lower bound suggested by WHO of 1x GDP per capita.
Hence, many previous and existing recommendations about which interventions are cost-effective that are
based on the WHO threshold are likely to do more harm than good… This suggests that current interventions
acceptable at a 1x GDP per capita threshold (or even below it) may be displacing more health than they
generate”.
Anyway, the Bungoma CE ratios 2015-18 now compare favourably28 with most of the 3MDGF 2015 CE ratios
in the different Regions/Townships in Myanmar, especially if we consider that the 3MDGF expenditure
includes all INGOs costs but does not include the overall management of the programme (UNOPS cost),
while the analysis of the DFID MNH in Bungoma includes all costs/expenditures. The 3MDG, a multi-donor
fund (8 DPs including DFID) managed by UNOPS (fund holder), comprised of 3 components: (1) MNCH, (2)
HSS, and (3) support to HIV/AIDS, Malaria and TB vertical programmes. The MNCH component budget
amounted to US$ 200 million for 5 years, covering around 4 million people in most vulnerable/remote/hard
to reach Townships (=districts). NGOs received grants (on a competitive process) from the fund holder
(UNOPS) to implement the programme in their respective Townships. The 3MDG conditional cash transfer
(demand side financing scheme) sub-component represented more than 25% of the overall MNCH
expenditure. The BoD in the targeted Townships is comparable to the BoD of Bungoma.
The table below shows the CE ratios per Region (several Townships are covered in each Region). The
attribution to the impact (DALYs avoided) of the 3MDGF has been set to 75%. The 201529 CE ratio (cost per
27 Jessica Ochalek, James Lomas, Karl Claxton. Cost Per DALY Averted Thresholds for Low- and Middle-Income Countries : Evidence from Cross-Country Data. University of York. CHE Research Paper 122. December 2015. 28 Contrary to the results of the VFM analysis in the Formative Evaluation Report 29 2015=third year of implementation

MNH Kenya – Summative Evaluation – Vol 2. Annex VIII
hera / Final summative report / January 2020 27
DALY averted) ranged from US$ 257 (Magway Region) to US$ 1,832 (Chin Region - specific terrain
(mountainous area and very low population density).
Table 24. CEA 3MDGF (US$, 2015, Myanmar)
Region
Additional
DALYs averted
(2015)
Contribution of
3MDGF to
additional
DALYs averted
(75%)
3MDGF Actual
Expenditure
2015 (US$)
Cost per DALY
averted US$
(100% efficacy)
Cost per DALY
averted US$
(50% efficacy)
Chin 8,337 6,253 5,727,029 916 1,832
Magway 29,109 21,832 2,807,040 129 257
Kayah 12,156 9,117 2,141,302 235 470
Ayeyarwady 16,149 12,112 7,183,514 593 1,186
Total 65,751 49,314 17,858,886 362 724

MNH Kenya – Summative Evaluation – Vol 2. Annex VIII
hera / Final summative report / January 2020 28
5 ADDITIONAL NOTES ON EFFICIENCY AND SUSTAINABILITY
5.1 MIH / LSTM
Efficiency issues have already been addressed in the Section 3.3. above:
• The LSTM “Start-up and Office running cost” increased until Q4 2016 (almost proportionally to the
level of in-service training activities) but did not decrease accordingly when those activities were
finished: they then move from a nature of variable cost to a nature of fixed cost.
• The “Start-up and Office running cost” + “Management fee” (MF) represent 42% of the total
expenditure for the whole duration of the programme, but varies from 15% (Q3 2014) to 70% (Q4
2017): that efficiency rate (and the variations between Quarters) can be considered as normal taking
stock of the nature of the programme. However, the relatively high absolute (and relative) costs of
the “start-up and office running costs” in the last six quarters of the programme, while main training
activities had mostly closed, may require some further explanation by LSTM. One assumption is that
human resource investment for pre-service training and operational research is partly or fully
captured under this category.
• Once training targets were reached LSTM submitted a request to deliver more training from
efficiency savings in April 2018; this was approved in October 2018 by which time LSTM had started
reducing staff numbers and eventually restructured the team to get a better balance between
activities and LOE in April/May 2019. Most M&E, support supervision and OR activities were
completed towards the end of 2018.
Our main conclusion was that there is nothing to contradict the main Value for Money (VfM) results from
the LSTM Quarterly reports, e.g. “Value for money (VfM) is being achieved by minimising input costs
(economy) and maximizing the efficiency and effectiveness of the project, through a series of measures”.
However, it seems that Kenya, whether at national or county level, is not yet able (financially and
institutionally) to take over EmONC in-service and pre-service training in their own institutions with their
own staff, organisations and domestic funding. The building of the capacity of in-country teams supported
by LSTM through training, coaching and mentoring, resulting in even greater competence and reducing the
need for UK-based staff to undertake international travel to address issues in-country was therefore not
enough. After almost 10 years of implementation (in Kenya and in other countries), the MiH programme was
not able to produce a sustainable training system in Kenya that could be implemented locally and financed
with domestic resources.
5.2 MANI HSS BUNGOMA
The Section 3.1. above showed that the “management cost”30 of MANI HSS Bungoma represented 51% of
total expenditure. We could find exactly the same ratios during the 3MDGF in Myanmar (from 2013 to 2017)
where the INGOs Programme Management Budget (PMB) (for HSS at Township level) represented exactly
half of the total expenditure (PMB + activities). Thus, there is no specific efficiency issue for the MANI HSS
Bungoma component of the DFID MNH programme.
The strong evidence that the MANI project in Bungoma County was effective, cost-effective and generated
value for money requires, however, a more contextualised analysis. The evaluation confirmed that a large
30 Inputs (LT & ST days, management days, travel costs and living costs)

MNH Kenya – Summative Evaluation – Vol 2. Annex VIII
hera / Final summative report / January 2020 29
investment in a project that comprehensively supported health systems with large financial investments and
intensive on-site technical and policy assistance can effectively and verifiably improve maternal and
neonatal health. But women in Bungoma County die in childbirth every week, they did so before the start of
the MANI project and they continue to do so after the project closed. An analysis of the effectiveness and
cost-effectiveness of the DFID investment in MNH in Bungoma County can therefore not be restricted to the
short period from 2015 to 2018. It also has to consider the sustained changes that were initiated with MANI
support.
The sustainability analysis that is presented in the main evaluation report confirms that many of the systems
and processes introduced in the county with MANI support continue and are likely to continue having an
effect on improved maternal and neonatal health. But many did not, because of the reduced fiscal space for
MNH programming in Bungoma County after the end of the project31, and in some cases because they were
not sufficiently appropriated to continue without the technical support by the MANI project team.
New financing sources for MNH opened for the county after the end of the MANI project, for instance
through Linda Mama and through the World-Bank managed THS-UHC programme. But it was already evident
at the time of the evaluation mission that effective low-cost activities such as reimbursing boda-boda
transport to health facilities for delivery, telephone follow-up for missed ANC appointments and
performance-based stipends for CHCs and birth companions only continued in some health facilities,
presumably on initiative of engaged health staff who, as is common practice, will soon rotate to other
assignments in other facilities. Key activities like the monthly or quarterly meetings of health facility
managers to review and discuss MNH outcome data, which contributed greatly to catapulting Bungoma
County to the head of the national MPDSR table already ceased. Performance-based financing, which
contributed to a major extent to improved productivity and quality of MNH care, was discontinued and may
or may not be revived with revenue generated by facilities from the Linda Mama scheme.
The important lesson learnt by the MANI project is that comprehensive HSS delivered with on-site technical
support is effective and cost effective. There may be a more painful lesson in store, namely that three years
of this type of support is not sufficient to generate sustained gains in maternal and neonatal health. It is too
early to come to such a conclusion. For now we have to rely on hope rather than evidence that it will not be
reached.
5.3 CICF
With a management cost of less than 40 percent which, according to an estimate provided by Options and
KPMG, was used to about 50 percent for technical assistance and capacity building, management of the CICF
programme can be considered as highly cost-efficient. This assessment still holds when the management
costs incurred by the grantees are added. They were generally budgeted in the range of 15 percent of the
grant value plus the cost of project personnel which, depending on the type of grant, can be allocated in
differing proportions to management or activity costs.
Cost-efficiency in management is, however, not the same a cost-effectiveness. In order to assess the cost-
effectiveness of the CICF programme, a single metric would be required for aggregating the results of all
grants, from a digitalised supervision tool in Nairobi to motorcycle ambulances in Turkana. It would also
have to include the lessons learnt from piloting innovative solutions that were found to be not feasible or
practicable. Such a single metric does, of course, not exist.
31 Between 2015 and 2018, the DFID MNH programme covered between 51% and 65% of MNH expenditures in Bungoma County (See Table 18)

MNH Kenya – Summative Evaluation – Vol 2. Annex VIII
hera / Final summative report / January 2020 30
As documented in the CICF programme evaluation report, the grants awarded by the programme generated
many solutions for improved MNH, some of which such as KMC, UBT or human milk banking are well on
their way of being fully integrated in national MNH policies and programmes. Others, such as improved
newborn care in Bungoma County, public/private/community partnerships for primary care in remote areas
of Homa Bay or solar-powered CEmONC facilities in Turkana have filled important gaps in MNH service
coverage in these counties.
The question about cost-effectiveness can therefore only be answered by considering the counter-factual,
i.e. the costs incurred by the support of these contributions to MNH in Kenya through a funding mechanism
that differed from a challenge fund.
Challenge funds, according to a definition shared by a number of international agencies including DFID are
‘competitive mechanisms to allocate financial support to innovative projects, to improve market outcomes
with social returns that are higher/more assured than private benefits, but with the potential for commercial
viability’32. This definition applies only to a small proportion of grants issued under the CICF. Market
outcomes with social returns could be, for instance, generated by KMET, the organisation in Kisumu that
markets condom-based uterine balloon devices to the public and private sector, by Lexlink, a consulting
company in Nairobi that is developing a digitalised supervision tool for MNH services which has raised the
interest of county health departments, and Afya Research Africa, a private sector health care provider
operating a network of rural health facilities in collaboration with communities and the public sector.
Supporting the expansion of these initiatives can be clearly attributed to the challenge funding approach.
For most of the other grant-funded projects, there are clear counterfactual options. Supporting international
NGOs to roll-out KMC in Kenya, to establish a human milk bank in a high-volume maternity hospital in Nairobi
or to implement a number of supply- and demand-side interventions to improve maternity services in
Turkana does not meet any criteria of challenge funding. Several of these grant-funded interventions were
already integrated in the UNICEF-component of the initial MNH programme or could have readily been
integrated in the MANI project. In hindsight, it is impossible to determine whether this approach would have
been as effective or as cost-effective as programming under CICF.
In the final analysis, the cost-effectiveness of a challenge fund depends on the emergence of at least one
brilliant idea that takes the county, region or world in storm. But brilliant ideas are rare and something like
the Grameen Bank or the M-Pesa system can only be invented once. The majority of grants issued by the
CICF did not have the necessary profile to generate such brilliant ideas which may have been related to a
reluctance in risk-taking buy the Grant Selection Committee. The final assessment of the cost effectiveness
of the CICF programme is therefore mixed: An efficiently managed portfolio of grants that generated a
number of positive results and many lessons learnt, but rather moderate innovation outcomes.
32 Ompa C (2013). Understanding challenge funds. ODI Report

MNH Kenya – Summative Evaluation – Vol 2. Annex VIII
hera / Final summative report / January 2020 31
ANNEX 1. LINDA MAMA ANALYSIS BY OPTIONS
From Options, May 201833:
“In April 2017, the Ministry of Health’s Free Maternity Service (FMS) was transferred to the NHIF under the
brand name ‘Linda Mama: Boresha Jamii’. Phase 1 (from April 2017) commenced with the faith-based and
private sectors; from July 2017, under Phase 2, the public sector was added. From March 2018, Linda Mama
introduced Phase 3 to include antenatal care (ANC) and post-natal care (PNC). For all Linda Mama services,
benefits are ‘portable’ (e.g. mothers do not need to receive services from the same provider/site). Currently,
it is estimated that 502 ‘low cost’ private and faith-based facilities are contracted while approximately 4,000
public sector facilities nationally are reported to be accredited as part of the scheme. Reimbursement rates
under Linda Mama are tiered to level of care and by sector. Table 1 presents the tariffs for ANC, delivery
(normal and caesarean) and PNC. In comparison, normal delivery under the NHIF national scheme is
reimbursed at KES 10,000 (US$97). Public-sector tariffs are lower given that these are additional to line-item
budgets such as salaries and consumables.
As of March 2018, approximately 40% of the health facilities in Bungoma county were accredited with Linda
Mama. The NHIF has a target of accrediting all public health facilities (currently 120 are accredited with 47
pending). For the private sector there is no target, with only 12 private facilities accredited to date (with one
in process). Accreditation is simple for public health facilities and entails a written request by the County
Director of Health to the NHIF branch office, listing the public health facilities to be included. For private
providers, they must be registered with the NHIF and comply with various norms and standards.[3]
Performance-to-date under Linda Mama in Bungoma county has significant potential for growth. It was
reported in the April 7th, 2018 breakfast meeting that 9,776 women have registered (as of the end of
March 2018), with 4,906 women delivering normally and 639 delivering through cesarean section.
Approximately Ksh 12 million had been paid with Ksh 6.8 million pending. A county manager summed
up Linda Mama growth in the breakfast meeting, “by the look of things [the public sector] have woken
up.”
There is some market segmentation with private providers having more mixed clientele than their public
counterparts. The private providers estimated that 75–90% of their patients were on the NHIF SupaCover
with the remainder covered through Linda Mama and private insurance, with very few fee-paying. One
private provider noted that some women on Linda Mama can afford to be on the NHIF SupaCover and should
33 https://medium.com/@options_int/implementing-linda-mama-in-bungoma-county-7b27136d30a9

MNH Kenya – Summative Evaluation – Vol 2. Annex VIII
hera / Final summative report / January 2020 32
be directed to do so, “[we need to] help those people that can pay to realise that they should be paying.” In
the public sector the number of NHIF clients was reported to be much less but growing.
In Bungoma county, all facilities — both public and private — can receive reimbursements directly to
their bank account. This is a significant enabler for the programme in the public sector as facilities can
benefit directly from the ‘fruit’ of Linda Mama. Bungoma county is one of the few counties in Kenya to
allow for this as, in many other counties, reimbursements from the NHIF and Linda Mama are pooled in
the county revenue account (CRF) and may get delayed or diverted.
Linda Mama has benefitted from the MANI project in Bungoma County. This has included facility-based
performance-based financing (PBF) and transportation vouchers for pregnant women to reach health
facilities. Both interventions have laid a solid foundation for Linda Mama as facilities have forged stronger
community linkages and health workers have developed skills and experience in autonomous decision making
on PBF, channeling reimbursements towards initiatives that promote quality and access to MNH services.
While the MANI project plans to exit Bungoma County at the end of the year, supporting community
awareness and facility readiness for uptake of Linda Mama is a key part of the programme’s exit strategy.
As such, the project team sees Linda Mama as “…the beginning of a journey toward UHC.”
Bungoma County is well poised to deliver on the promise of Linda Mama. Linda Mama represents a
tremendous opportunity for expectant mothers, who previously may not have been able to deliver in a
facility (one such mother was met as part of the case study). As expectant mothers can designate a
facility, healthy competition between providers also represents potential for driving up clinical quality
and client-centred care within facilities and across providers. As public providers have some autonomy
and authority over how reimbursements are spent, they can benefit from the Linda Mama ‘fruit’. As a
flagship programme for the county, the DoH leadership is also poised to deliver on the promise of Linda
Mama. The passionate support of the County First Lady has also provided foundation for success. This
is bearing results as Bungoma County is reported to be leading on Linda Mama in the country.
While a strong foundation has been laid, there is still much that can be done to deliver on the Linda Mama
promise. These are not unique to Bungoma and are of relevance to other counties, the Ministry of Health and
the NHIF.
Develop strategies to encourage mothers to transit from Linda Mama to NHIF as part of plans for UHC. Like
the Linda Mama model facility, this may include subsidy for indigent households while encouraging those
who can afford to pay, to get on SupaCover.
Exploit opportunities to integrate sensitization and procedural orientation on Linda Mama into existing and
planned health worker and community engagement. Linda Mama should not be viewed as separate, but
integral to other reproductive, maternal and neo-natal initiatives. Consider additional guidance on referrals,
treatment of other delivery complications and mother or infant illness which is not currently catered for in
the reimbursement schedule.
Provide procedural clarity to health workers and mothers on ANC and PNC packages, so that these are
delivered consistently and completely. Reinforce the inclusion of post-partum family planning (PPFP) within
the PNC package. Consider a separate reimbursement, or a top up to one of the PNC visits, to cater for this
service. The effective inclusion of modern PPFP in Linda Mama would allow Kenya a viable strategy for
improving its uptake, which is estimated at only 16% at six months, despite an estimated 64% of women
delivering in health facilities.[5] This suggests a missed opportunity for post-partum mothers.

MNH Kenya – Summative Evaluation – Vol 2. Annex VIII
hera / Final summative report / January 2020 33
Remove or reduce bottlenecks for the utilization of Linda Mama reimbursements in the public sector. While
funds are received directly into public facility back accounts, all AIE must be approved by the Chief Officer.
Consider allowing hospital chief executives and sub-county medical officers AIE as a means of reducing
reliance on one approval point.
·Strengthen leadership and management of Linda Mama by the County DoH. Consider regular Linda Mama
management review meetings that include the NHIF, county health managers and the private sector so that
problems are identified, and remedial actions implemented. Build county level leadership that seeks to more
firmly define the role of Linda Mama and the transition of women from the programme on to SupeCover as
part of the county’s UHC plans.”

![MNH SHAKTI LIMITED - Mahanadi Coalfields Report - 2016-17-MNH... · 2018-08-22 · MNH SHAKTI LIMITED [ 1 ] Notice is hereby given that the 9th Annual General Meeting of MNH Shakti](https://img.pdfslide.us/doc/110x75/5f057dc67e708231d41339e2/mnh-shakti-limited-mahanadi-report-2016-17-mnh-2018-08-22-mnh-shakti.jpg)
![MNH SHAKTI LIMITED Report - 2016-17-MNH… · MNH SHAKTI LIMITED [ 3 ] STATUS OF LAND ACQUISITION: For Talabira III Coal Block- 1530.170 Ha of land was acquired under CBA (A&D) Act,](https://img.pdfslide.us/doc/110x75/5fc9a12937f19e6798663575/mnh-shakti-limited-report-2016-17-mnh-mnh-shakti-limited-3-status-of-land.jpg)