Embed Size (px)
Citation preview
203
Audrey CHARBONNIER-VOIRINM@n@gement vol. 14 no. 2, 2011, 119-156
M@n@gement
Copies of this article can be made free of charge and without securing permission, for purposes of teaching, research, or library reserve. Consent to other kinds of copying, such as that for creating new works, or for resale, must be obtained from both the journal editor(s) and the author(s).
M@n@gement is a double-blind refereed journal where articles are published in their original language as soon as they have been accepted.For a free subscription to M@n@gement, and more information:http://www.management-aims.com
© 2010 M@n@gement and the author(s).
Audrey CHARBONNIER-VOIRIN 2011The development and partial testing of the psychometric properties of a measurement scale of organizational agilityM@n@gement, 14(2), 119-156.
M@n@gement est la revue officielle de l’AIMS
M@n@gement is the official journal of AIMS
ISSN: 1286-4892
Emmanuel Josserand, HEC, Université de Genève (Editor in Chief)Jean-Luc Arrègle, Université du Luxembourg (editor)Stewart Clegg, University of Technology, Sydney (editor)Olivier Germain, U. du Québec à Montréal (editor, book reviews)Karim Mignonac, Université de Toulouse 1 (editor)Philippe Monin, EM Lyon Business School (editor)Jose Pla-Barber, Universidad de València (editor)Linda Rouleau, HEC Montréal (editor)Michael Tushman, Harvard Business School (editor)Martin G. Evans, University of Toronto (editor emeritus)Bernard Forgues, EM Lyon Business School (editor emeritus)Thibaut Bardon, Université Paris-Dauphine, CREPA - HEC, Université de Genève (managing editor)Florence Villesèche, HEC, Université de Genève (managing editor)Walid Shibib, Université de Genève (editorial assistant)
A s s o c i a t i o n I n t e r n a t i o n a l e d e M a n a g e m e n t S t r a t é g i q u e
120
The development and partial testing of the psychometric properties of a measurement scale of organizational agility
M@n@gement vol. 14 no. 2, 2011, 119-156
The development and partial testing of the psychometric properties of a mea-surement scale of organizational agility
Audrey CHARBONNIER-VOIRIN [email protected]
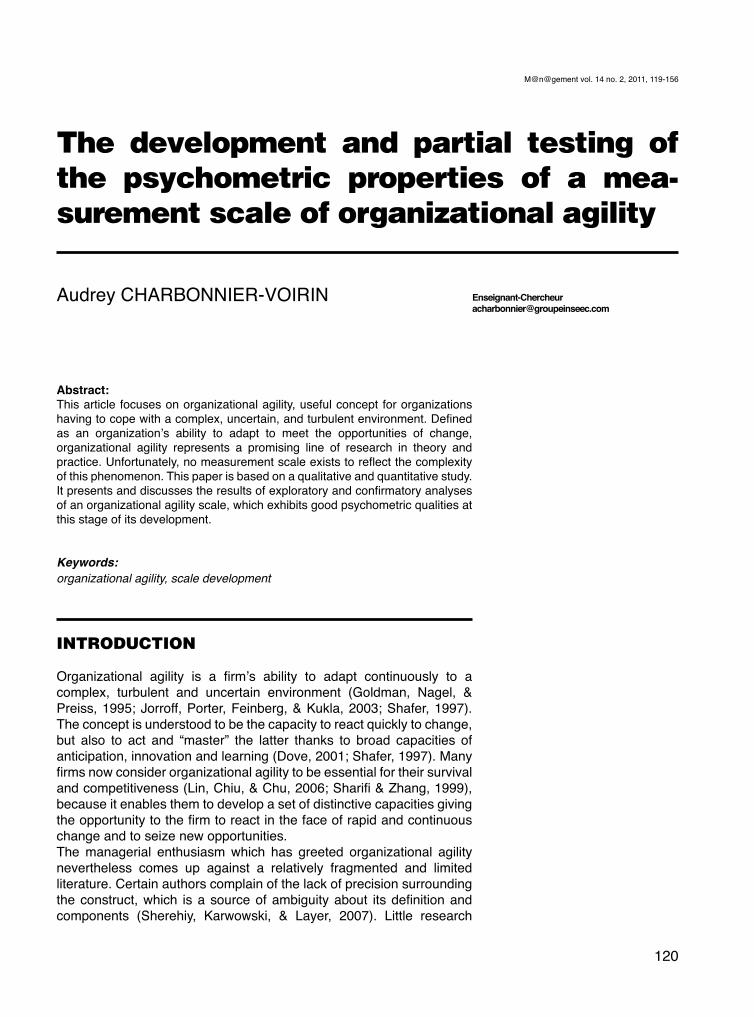
Abstract: This article focuses on organizational agility, useful concept for organizations having to cope with a complex, uncertain, and turbulent environment. Defined as an organization’s ability to adapt to meet the opportunities of change, organizational agility represents a promising line of research in theory and practice. Unfortunately, no measurement scale exists to reflect the complexity of this phenomenon. This paper is based on a qualitative and quantitative study. It presents and discusses the results of exploratory and confirmatory analyses of an organizational agility scale, which exhibits good psychometric qualities at this stage of its development.
Keywords: organizational agility, scale development
INTRODUCTION
Organizational agility is a firm’s ability to adapt continuously to a complex, turbulent and uncertain environment (Goldman, Nagel, & Preiss, 1995; Jorroff, Porter, Feinberg, & Kukla, 2003; Shafer, 1997). The concept is understood to be the capacity to react quickly to change, but also to act and “master” the latter thanks to broad capacities of anticipation, innovation and learning (Dove, 2001; Shafer, 1997). Many firms now consider organizational agility to be essential for their survival and competitiveness (Lin, Chiu, & Chu, 2006; Sharifi & Zhang, 1999), because it enables them to develop a set of distinctive capacities giving the opportunity to the firm to react in the face of rapid and continuous change and to seize new opportunities. The managerial enthusiasm which has greeted organizational agility nevertheless comes up against a relatively fragmented and limited literature. Certain authors complain of the lack of precision surrounding the construct, which is a source of ambiguity about its definition and components (Sherehiy, Karwowski, & Layer, 2007). Little research
121
Audrey CHARBONNIER-VOIRINM@n@gement vol. 14 no. 2, 2011, 119-156
deals with the concept as a whole, but several studies opt to examine specific facets of it. Kassim and Zain (2004) thus analyze the agility of information systems and technologies whereas Lin and his colleagues (2006) study the agile supply chain. Other researchers such as Dyer and Shafer (1999) or Breu, Hemingway, Strathern and Bridger (2001) explore the agility of human resources. When research is devoted to the global construct of organizational agility, it is rarely accompanied by suggestions as to how the concept can be operationalized or by measurement tools (Gunasekaran, 1999; Sharifi, Barclay, Colqhoun, & Dann, 2001; Yusuf, Sarhadi, & Gunasekaran, 1999). Even if tools for measurement or checklists exist, some are not freely available (Barrand, 2006). Most research suggests tools which have not been tested empirically (Goldman, et al., 1995; Shafer, 1997). This study intends to respond to these limitations by developing and testing a new tool for measuring organizational agility, created in conformity with Churchill’s paradigm (1979). The methodology is based firstly on a literature review and a qualitative study carried out on 22 directors and human resources managers of French companies in order to clarify the construct of organizational agility, take account of its multidimensional nature, and generate a first series of items. Following this, a quantitative methodology is used to test the validity and reliability of the tool using exploratory and confirmatory factor analyses performed on two independent samples (N1=102 and N2=135). The results obtained yield a rich and coherent set of eleven dimensions. The scale presents internal consistency reliability and satisfactory convergent and discriminant validity. The results of the confirmatory analyses show that the scale is well adjusted to the collected data. From a methodological point of view, this study shows quantitative stage of validation of a measurement tool for organizational agility; this will, in future, make it possible to shed further light on the concept, better define its antecedent variables and comprehend its consequences.Following the presentation of the conceptual framework of organizational agility and existing measurement tools, the second part develops the various stages of the measurement scale’s creation. The discussion presents the contributions and limitations of this study as well as the avenues for further research which result.
ORGANIZATIONAL AGILITY: THEORETICAL PERSPECTIVES
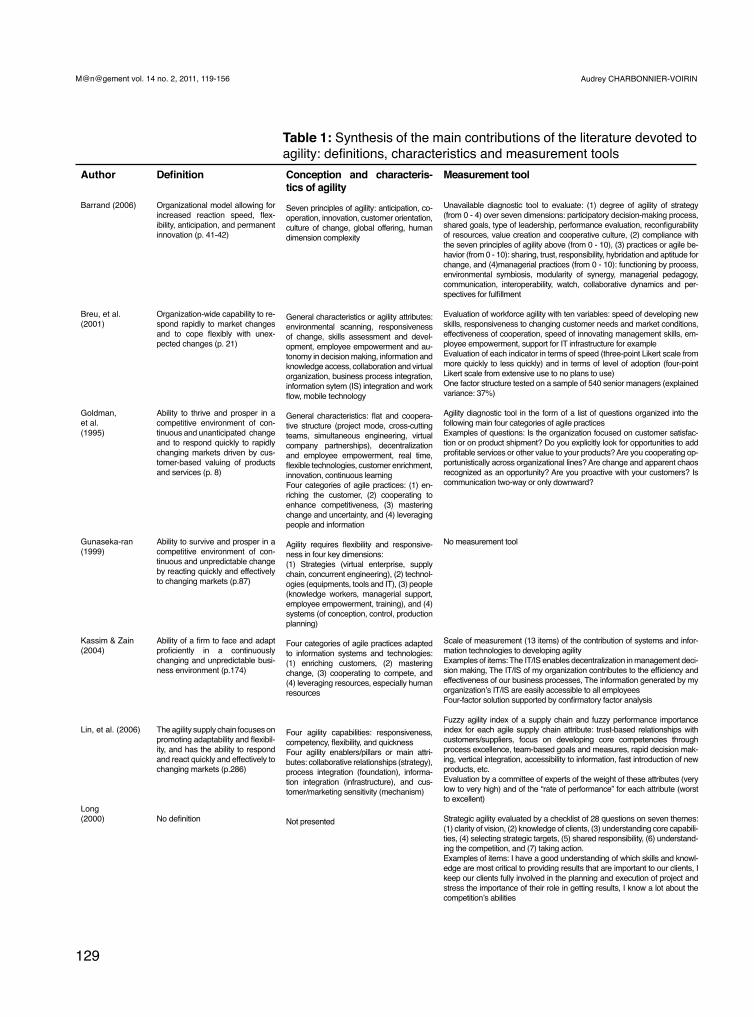
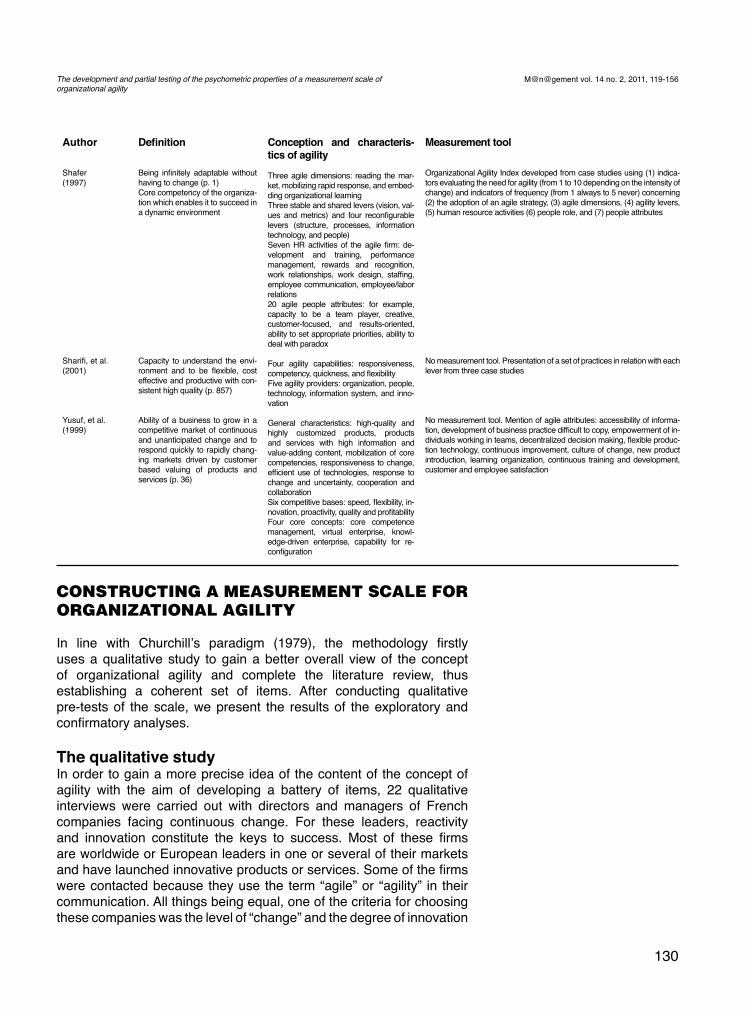
In order to elaborate a measurement tool for organizational agility, it is first necessary to define the construct precisely and determine its characteristics. This first part presents the contribution of the literature dedicated to organizational agility. Table 1 presents a summary of the definitions, theoretical content and evaluation tools of organizational agility. This part also introduces the limitations and theoretical difficulties inherent to organizational agility, and highlights the challenges of creating a measurement scale for this construct.
122
The development and partial testing of the psychometric properties of a measurement scale of organizational agility
M@n@gement vol. 14 no. 2, 2011, 119-156
How the construct emergedThe concept of organizational agility was identified by four researchers at the University of Lehigh (Goldman, Preiss, Nagel, & Dove, 1991) who had been requested by the American Congress to write a circumstantial report on the strategy of industrial firms in the 21st century. This report determined that the current system of mass production was not sufficient to ensure incremental improvement given the evolution of the competition, especially in Asia, which had developed a high degree of flexibility. The report concluded that a new system of production must be invented, one that would be based on organizational agility, in order to meet the needs generated by these new factors of competitiveness. Shortly after the report, the AMEF (Agile Manufacturing Enterprise Forum)1 was created to encourage and spread this viewpoint throughout American firms. In practice, the biggest American firms, especially in the IT and telephony sectors, had adopted the concept of agility in the mid-1990s. Thus, in the early 2000s, Microsoft portrayed itself widely in its advertising slogan as an “agile business”, directing its whole discourse towards adopting the agile model, both for the company and for its clients. Companies such as IBM and Google also relied on this model to increase their competitiveness (Dyer & Shafer, 1999) and several consulting firms recommended solutions which would improve their clients’ agility, particularly in the information systems sector. Although large industrial and service groups often use the terms “agile” or “agility” in their communication, there is rarely any consensus as to what the term actually means in concrete terms (Sherehiy, et al., 2007). Research is rarely dedicated to developing the whole concept of organizational agility, and when this does occur, such efforts are rather ambiguous when it comes to defining the concept and its components (Shafer, 1997; Sherehiy, et al., 2007); this lack of precision further restricts the potential for operationalization.
The theoretical content of organizational agilityA definition of organizational agilityMany authors define organizational agility generally as the aptitude of an organization to adapt rapidly to environmental changes (Breu, et al., 2001; Gunasekaran, 1999; Kassim & Zain, 2004; Yusuf, et al., 1999). Organizational agility is always related to the environment and the market (see table 1). Above all, it corresponds to the capability of an organization to cope efficiently with changing market conditions and a chaotic environment (Barrand, 2006; Joroff, et al., 2003). According to Goldman and colleagues (1995: 8), it is a deliberate response which enables the firm to thrive and prosper in a competitive environment whose market opportunities are constantly changing in unpredictable ways.Only seldom do authors posit a precise operational definition of organizational agility (Sherehiy, et al., 2007). When we look at the inherent capabilities of agility, this appears in the first place to be the ability to react quickly and efficiently to environmental changes (technological developments, customer expectations, or competitors’
1. The AMEF was created in late 1991 at the instigation of the Iacocca Institute (University of Lehigh). Working groups were set up (Enter-prise Development Group), made up of direc-tors, researchers and trade-union and govern-ment representatives. These groups worked on the best practices and innovative practices to be implemented to develop organizational agil-ity. Several activity sectors were represented (automobile, electronics, telecommunications, multimedia, computers and information technol-ogies, insurance, pharmaceuticals and health etc.) and companies such as Motorola, Dell Computer, Lexmark and 3M took an active part in this program and set up action plans aimed at improving their own agility. The AMEF also published reports in order to disseminate the results of their research and activities. Today, other associations, like the « Agile Alliance » (http://www.agilealliance.org/), seek to promote methods and projects for organizational agility, but they are essentially aimed at the domain of software development.
123
Audrey CHARBONNIER-VOIRINM@n@gement vol. 14 no. 2, 2011, 119-156
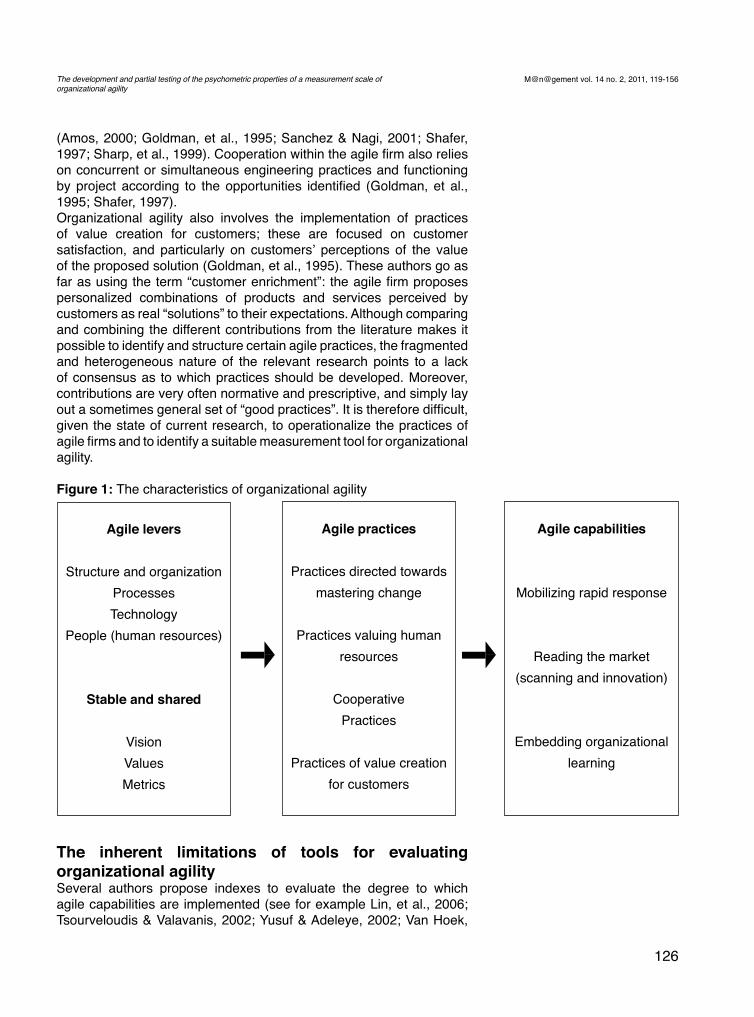
strategies, for example). Several authors also highlight the proactive side of agility, inasmuch as it represents the aptitude to exploit change as an opportunity (Dove, 2001; Doz & Kosonen, 2007; Jamrog, McCann, Lee, Morrison, Selsky, & Vickers, 2006; Kidd, 1994; Sharifi & Zhang, 1999). Indeed, it is a question of anticipating and seizing on new opportunities, or instigating “breakthroughs” by innovation (Breu, et al., 2001; Dyer & Shafer, 2003; Yusuf, et al., 1999). “Thus the concept of the agile organization came to be the description of an organizational model which enabled not only improved reaction time (in the sequence “observation + decision”), but also flexibility and even more, anticipation and continuous innovation, notably through an exceptional understanding with all actors, both within and outside the firm” (Barrand, 2006: 41-42). Several authors note the importance of synergy, resulting from internal and external cooperation, in the development of organizational agility (Goldman, et al., 1991, 1995; Sharp, Irani, & Desai, 1999; Sanchez & Nagi, 2001).This study proposes to define organizational agility as a response capability which is intentionally sought out and developed by the organization in order to enable it to act efficiently in a changing environment characterized in particular by complexity, turbulence, and uncertainty. Agility corresponds to the organization’s capacity for permanent adaptability, which it attains not only by reacting rapidly to change but also through its potential of action in anticipating and seizing the opportunities offered by change, in particular through anticipation, innovation, and learning.Thus, organizational agility appears as a latent and multidimensional construct (Goldman, et al., 1991, 1995; Tsourvelousdis & Valavanis, 2002) whose content it is worth rendering more explicit in order to propose a measurement tool which is more likely to give an adequate representation of its various dimensions. The characteristics of organizational agilitySeveral authors have tried to develop “conceptual models” for agility. These aim to specify the circumstances which lead a firm to seek organizational agility (agility driver: see, for example, Lin, et al., 2006; Sharifi & Zhang, 1999; Sharifi, et al., 2001), agility capabilities (Amos, 2000 Lin, et al., 2006; Shafer, 1997; Sharifi & Zhang, 1999; Sharifi, et al., 2001; Yusuf, et al., 1999) and agility practices or agility attributes (Barrand, 2006; Breu, et al., 2001 ; Dyer & Shafer, 1999; Yusuf, et al., 1999; Kassim & Zain, 2004) as well as agility providers or agility enablers at the level of the infrastructure of the agile firm (Dyer & Shafer, 1999; Shafer, 1997; Sharifi & Zhang, 1999; Sharifi, et al., 2001; Lin, et al., 2006). Inasmuch as the literature on the subject is fragmented and heterogeneous and sometimes suffers from a lack of consensus as to what exactly these different elements contain, this article proposes a synthesis of the characteristics of the agile enterprise as shown in figure 1. This figure shows the levers which constitute the agile firm’s infrastructure and which can be mobilized to set up and ensure that agile practices succeed. These practices represent the most operational level of organizational agility and go hand in hand with the development of agile capabilities.
124
The development and partial testing of the psychometric properties of a measurement scale of organizational agility
M@n@gement vol. 14 no. 2, 2011, 119-156
Agile capabilities are essential strategic abilities which enable the firm to respond to change (Sharifi & Zhang, 1999) and establish its competitive bases (Yusuf, et al., 1999). But various terms are used to name these capabilities: responsiveness, anticipation, adaptation or reconfiguration, efficiency, flexibility, quickness, innovation, knowledge management, learning (Amos, 1998; Dove, 2001; Kidd, 1994; Sharifi & Zhang, 1999; Sharifi, et al., 2001). Comparing these works leads us to consider, along with Shafer (1997), that these aptitudes can be synthesized into three key and interrelated organizational capabilities.The first capability is the organization’s aptitude to mobilize a rapid response to change. This is based on reactive flexibility and the optimization of existing resources (Charbonnier-Voirin, 2010). The second organizational capability is the aptitude to read the market. This enables the firm to explore and detect potential or emerging developments through its watch capabilities (Sanchez & Nagi, 2001). It also denotes the organization’s capacity to transform available information into projects which create value thanks to sufficient capacity for improvization and innovation (Shafer, 1997; Shafer, et al., 2001; Sharifi & Zhang, 1999). Finally, the third capability is the aptitude to integrate organizational learning. This capacity for efficient management and the implementation of knowledge (Dove, 2001) corresponds in particular to the ability to adjust human capabilities and qualitatively align them with the organization’s strategic perspectives through the exchanging of experience, knowledge transfer and record-time skills development (Shafer, 1997).Thus, organizational agility is an integrative construct of different pieces of research on flexibility which are rarely considered together; the construct combines the reactive, offensive and qualitative dimensions of flexibility. The study of flexibility turns out to be problematic in that this term groups together various practices and different forms; moreover, these are sometimes presented as opposing concepts along Manichean lines (internal versus external flexibility, qualitative or functional versus quantitative flexibility, strategic versus operational flexibility , defensive, passive or reactive flexibility versus offensive or proactive flexibility). Thus, conceptualizations of flexibility are relatively inoperative and marked by ambiguity and excessive differentiation (El Akremi & Devos, 2004). Organizational agility appears to be a response to these weaknesses in that it lays out a unified coherent framework of the most frequently studied dimensions of flexibility which are adopted in order to deal with highly complex, turbulent and uncertain environments. In order to contribute to the development of organizational agility, the agile enterprise’s infrastructure is made up of reconfigurable levers conceived to ensure the success of agile practices. There is a relative consensus about these reconfigurable levers, which can be deployed when circumstances change: these are (1) the firm’s structure and organization, (2) its processes, (3) technology, including information technology and (4) human resources (Amos, 2000; Dyer & Shafer, 1999, 2003; Shafer, 1997; Sharifi & Zhang, 1999; Sharifi, et al., 2001). Some
125
Audrey CHARBONNIER-VOIRINM@n@gement vol. 14 no. 2, 2011, 119-156
of these authors also note that it is important for the agile firm to rely on stable levers which ensure the organization’s continuity and identity in order to generate the necessary cohesion for transformations to take place: a shared vision and values as well as common performance metrics (Amos, 2000; Shafer, 1997). The levers support the development, implementation and adjustment of those agile practices (also called agile attributes) which represent the most operational level of organizational agility. The literature displays a wide lack of consensus concerning these practices. Indeed, some authors like Sharifi and Zhang (1999) do no more than mention their existence. Others, like Yusuf and colleagues (1999), propose lists of attributes which nevertheless remain general (accessibility of information, introduction of new products, rapid formation of partnerships, continuous improvement, short conception/production deadlines, decentralized decision making, etc). Lin and colleagues (2006) note the vague and ambiguous nature of such attributes. Some authors, on the other hand, specify practices related to only one domain, for example those inherent to technologies and information systems (Kassim & Zain, 2004). Given these limitations, the proposal of certain authors (Goldman, et al., 1995; Kassim & Zain, 2004; Mates, Gundry, & Bradish, 1998) to structure these agile practices into four main complementary categories allows an initial clarification. The four categories are as follows: (1) practices directed towards mastering change, (2) practices promoting the value of human resources, (3) cooperative practices and (4) practices to create value for customers (or to enrich customers).The practices directed at mastering change essentially aim to give teams the means to develop their reactivity and proactivity through processes of scanning and innovation but also through being able to function “in real time” by communicating information and knowledge related to the organization’s vision, its environment and the strategic action plans underlying individual and collective objectives (Dyer & Shafer, 1999; Shafer, et al., 2001). The agile enterprise also makes use of practices promoting the value of human resources; these emphasize empowerment in order to enable employees to adopt the autonomy and responsibility necessary for dealing rapidly and efficiently with the many unpredictable situations that arise, the volume of information that must be handled and the decisions to be taken (Amos, 2000; Breu, et al., 2001; Dyer & Shafer, 1999; Goldman & Nagel, 1993; Kidd, 1994; Shafer, 1997; Shafer, et al., 2001; Van Oyen, Gel, & Hopp, 2001). This policy of empowerment and continuous change also presupposes that the employees’ repertoire of skills will be enriched and increased (Wright & Snell, 1998) through the creation of conditions for continuous learning (Dove, 2001; Shafer, et al., 2001). Several authors also highlight the importance of recognizing the impact of individual and collective action on global performance in order to maintain the motivation (Burke & Terry, 2004; Dyer & Shafer, 1999). Cooperative practices, both inside and outside the firm, also occupy a crucial place within the agile enterprise in order to reduce response times, improve their offering and increase the firm’s potential for innovation
126
The development and partial testing of the psychometric properties of a measurement scale of organizational agility
M@n@gement vol. 14 no. 2, 2011, 119-156
(Amos, 2000; Goldman, et al., 1995; Sanchez & Nagi, 2001; Shafer, 1997; Sharp, et al., 1999). Cooperation within the agile firm also relies on concurrent or simultaneous engineering practices and functioning by project according to the opportunities identified (Goldman, et al., 1995; Shafer, 1997). Organizational agility also involves the implementation of practices of value creation for customers; these are focused on customer satisfaction, and particularly on customers’ perceptions of the value of the proposed solution (Goldman, et al., 1995). These authors go as far as using the term “customer enrichment”: the agile firm proposes personalized combinations of products and services perceived by customers as real “solutions” to their expectations. Although comparing and combining the different contributions from the literature makes it possible to identify and structure certain agile practices, the fragmented and heterogeneous nature of the relevant research points to a lack of consensus as to which practices should be developed. Moreover, contributions are very often normative and prescriptive, and simply lay out a sometimes general set of “good practices”. It is therefore difficult, given the state of current research, to operationalize the practices of agile firms and to identify a suitable measurement tool for organizational agility.
Figure 1: The characteristics of organizational agility
The inherent limitations of tools for evaluating organizational agilitySeveral authors propose indexes to evaluate the degree to which agile capabilities are implemented (see for example Lin, et al., 2006; Tsourveloudis & Valavanis, 2002; Yusuf & Adeleye, 2002; Van Hoek,
Agile levers
Structure and organizationProcessesTechnology
People (human resources)
Stable and shared
VisionValuesMetrics
Agile practices
Practices directed towards mastering change
Practices valuing human resources
Cooperative Practices
Practices of value creation for customers
Agile capabilities
Mobilizing rapid response
Reading the market (scanning and innovation)
Embedding organizational learning
127
Audrey CHARBONNIER-VOIRINM@n@gement vol. 14 no. 2, 2011, 119-156
Harrison, & Christopher, 2001). For this they use a set of global indicators which make it possible to estimate the costs and response times of firms facing change (for example: reaction time towards change, capacity to anticipate change, rate of innovation, spending on research and development or training, technological capability, customer satisfaction, individuals’ flexibility, degree of decentralization of decision making). On this subject, Tsourvelousdis and Valavanis (2002) note that it is more difficult to make a precise evaluation of organizational agility because of the vague and multidimensional nature of the construct. Lin and colleagues (2006) also underline the imprecise nature of these indicators because of the complexity of the phenomenon2.Moreover, these indicators are difficult to interpret in the absence of elements of comparison. Since they are meant to calculate a “global agility score” based on aggregation (Sherehiy, et al., 2007), they offer no true information as to the means of action and practices which firms should develop in order to improve their level of agility.Measurement tools have already been developed by consultants. One example is that of Long (2000), who puts forward a Strategic Agility Checklist for directors; this evaluates the clarity of strategic vision, clients’ knowledge, understanding of the firm’s and the competition’s key competencies, the selection of strategic targets and empowerment practices in place for employees. Barrand (2006), in his activity as a consultant, also uses a three-stage diagnostic tool for agility “which enables the firm to ask the key questions about strategy, the organization and behavior before envisaging change towards more agility” (Barrand, 2006: 111), but only the questionnaire dimensions are given. Such diagnostic tools are hard, if not impossible, to access, and they sometimes seem biased; their scientific validity can be questioned since we have no information on the methodology used for their construction or their psychometric qualities. The works of Goldman and colleagues (1995) and Shafer (1997) offer interesting ideas for operationalization, but these are also limited. Both these tools collect an undifferentiated set of organizational principles, practices and competencies which is sometimes abstract. They have not been tested and are consequently not supported by empirical results. Moreover, they appear to be difficult to use. More specifically, Goldman and colleagues (1995) offer as a synthesis over 80 open questions which may be asked in the context of an agility audit. Several of these present difficulties: certain questions require the respondent to choose between practices which it seems difficult to set against each other (for example: “Are you focusing management attentions on core competencies or on factory efficiency?” or “Is quality measured in defect rates or customer delight over time?”). Others seem hard to understand (“Is the organization focused on customer satisfaction or on product shipment?”). Besides this, several questions appear difficult to adapt “to any organization” because of their level of precision, because the implication is that they are aimed at evaluating the agility of large firms with sophisticated offerings. It also appears that a firm can develop its agility without necessarily incorporating certain practices. Thus, questions such as “Do your products have an
2. Lin et al. (2006) propose using fuzzy logic which consists of evaluating agility through global attributes (for example, the degree of accessibility to information, the degree of de-centralized decision making, the existence of a culture of change) using one interval response modes to describe an approximate state of the variable.
128
The development and partial testing of the psychometric properties of a measurement scale of organizational agility
M@n@gement vol. 14 no. 2, 2011, 119-156
automatic self-diagnostic capability when they malfunction or begin to fail?” or “Are you using the virtual company model to achieve vertical integration?” do not always seem relevant. As for the measurement tool proposed by Shafer (1997), that author identifies almost 150 items for evaluating agile capabilities as well as the reconfigurable and stable levers of which many are devoted to human resources. The items require the firm to have already given some thought to the concept of agility (as shown in such items as “The idea of competing through agility is an integral part of the organization’s strategic intent”). The questionnaire makes no distinction in its evaluation between strategic capabilities, the components of the firm’s infrastructure, policies, tools, and practices, as well as the role of all the firm’s internal and external actors. These items are often general and are formulated in identical terms no matter which aspect is being evaluated (for example: “The core processes are designed to be easily reconfigured as often as changing business conditions require”; “Performance management systems and programs are rapidly and efficiently reconfigured as often as changing conditions require”; “Work and jobs are rapidly and efficiently reconfigured as often as changing conditions require”). Moreover, certain practices commonly presented in the literature are being either neglected or absent from this tool, including practices related to cooperation or value creation for customers. Thus, even though several authors have sought to develop approaches aimed at evaluating an organization’s degree of agility, their lack of consensus and precision regarding the characteristics of the agile enterprise as well as the multidimensional nature of agility have only limited suggestions for measurement tools. The evaluation tools have not usually been tested and are therefore rarely supported by empirical results (Sherehiy et al., 2007). The inherent weaknesses (or non-availability) of existing evaluation tools combined with the stage at which research has thus far arrived therefore limit the possibilities of measuring the practices of the agile enterprise. Nevertheless, constructing a measurement tool for organizational agility is a major issue from both theoretical and managerial viewpoints. It is theoretically relevant because it encourages future research into agility, and pertinent in managerial terms because such a tool would give firms concrete variables for action. For this reason, this paper aims to put forward a reliable measurement scale of organizational agility by considering it as a latent multidimensional construct which is not directly observable and which requires a set of agile practices to be determined. In light of this, it is necessary to carry out a qualitative study to test the facts and principles brought to light in the literature, to ensure the relevance of these to the challenges firms (particularly French firms) face, and above all to define their content clearly. The methodology used is based on Churchill’s paradigm (1979) and on more recent works dealing with developing scales (Roussel, 2005).
129
Audrey CHARBONNIER-VOIRINM@n@gement vol. 14 no. 2, 2011, 119-156
Table 1: Synthesis of the main contributions of the literature devoted to agility: definitions, characteristics and measurement tools
Author
Barrand (2006)
Breu, et al. (2001)
Goldman, et al. (1995)
Gunaseka-ran (1999)
Kassim & Zain (2004)
Lin, et al. (2006)
Long (2000)
Definition
Organizational model allowing for increased reaction speed, flex-ibility, anticipation, and permanent innovation (p. 41-42)
Organization-wide capability to re-spond rapidly to market changes and to cope flexibly with unex-pected changes (p. 21)
Ability to thrive and prosper in a competitive environment of con-tinuous and unanticipated change and to respond quickly to rapidly changing markets driven by cus-tomer-based valuing of products and services (p. 8)
Ability to survive and prosper in a competitive environment of con-tinuous and unpredictable change by reacting quickly and effectively to changing markets (p.87)
Ability of a firm to face and adapt proficiently in a continuously changing and unpredictable busi-ness environment (p.174)
The agility supply chain focuses on promoting adaptability and flexibil-ity, and has the ability to respond and react quickly and effectively to changing markets (p.286)
No definition
Conception and characteris-tics of agility
Seven principles of agility: anticipation, co-operation, innovation, customer orientation, culture of change, global offering, human dimension complexity
General characteristics or agility attributes: environmental scanning, responsiveness of change, skills assessment and devel-opment, employee empowerment and au-tonomy in decision making, information and knowledge access, collaboration and virtual organization, business process integration, information sytem (IS) integration and work flow, mobile technology
General characteristics: flat and coopera-tive structure (project mode, cross-cutting teams, simultaneous engineering, virtual company partnerships), decentralization and employee empowerment, real time, flexible technologies, customer enrichment, innovation, continuous learningFour categories of agile practices: (1) en-riching the customer, (2) cooperating to enhance competitiveness, (3) mastering change and uncertainty, and (4) leveraging people and information
Agility requires flexibility and responsive-ness in four key dimensions:(1) Strategies (virtual enterprise, supply chain, concurrent engineering), (2) technol-ogies (equipments, tools and IT), (3) people (knowledge workers, managerial support, employee empowerment, training), and (4) systems (of conception, control, production planning)
Four categories of agile practices adapted to information systems and technologies: (1) enriching customers, (2) mastering change, (3) cooperating to compete, and (4) leveraging resources, especially human resources
Four agility capabilities: responsiveness, competency, flexibility, and quicknessFour agility enablers/pillars or main attri-butes: collaborative relationships (strategy), process integration (foundation), informa-tion integration (infrastructure), and cus-tomer/marketing sensitivity (mechanism)
Not presented
Measurement tool
Unavailable diagnostic tool to evaluate: (1) degree of agility of strategy (from 0 - 4) over seven dimensions: participatory decision-making process, shared goals, type of leadership, performance evaluation, reconfigurability of resources, value creation and cooperative culture, (2) compliance with the seven principles of agility above (from 0 - 10), (3) practices or agile be-havior (from 0 - 10): sharing, trust, responsibility, hybridation and aptitude for change, and (4)managerial practices (from 0 - 10): functioning by process, environmental symbiosis, modularity of synergy, managerial pedagogy, communication, interoperability, watch, collaborative dynamics and per-spectives for fulfillment
Evaluation of workforce agility with ten variables: speed of developing new skills, responsiveness to changing customer needs and market conditions, effectiveness of cooperation, speed of innovating management skills, em-ployee empowerment, support for IT infrastructure for exampleEvaluation of each indicator in terms of speed (three-point Likert scale from more quickly to less quickly) and in terms of level of adoption (four-point Likert scale from extensive use to no plans to use)One factor structure tested on a sample of 540 senior managers (explained variance: 37%)
Agility diagnostic tool in the form of a list of questions organized into the following main four categories of agile practices Examples of questions: Is the organization focused on customer satisfac-tion or on product shipment? Do you explicitly look for opportunities to add profitable services or other value to your products? Are you cooperating op-portunistically across organizational lines? Are change and apparent chaos recognized as an opportunity? Are you proactive with your customers? Is communication two-way or only downward?
No measurement tool
Scale of measurement (13 items) of the contribution of systems and infor-mation technologies to developing agility Examples of items: The IT/IS enables decentralization in management deci-sion making, The IT/IS of my organization contributes to the efficiency and effectiveness of our business processes, The information generated by my organization’s IT/IS are easily accessible to all employeesFour-factor solution supported by confirmatory factor analysis
Fuzzy agility index of a supply chain and fuzzy performance importance index for each agile supply chain attribute: trust-based relationships with customers/suppliers, focus on developing core competencies through process excellence, team-based goals and measures, rapid decision mak-ing, vertical integration, accessibility to information, fast introduction of new products, etc. Evaluation by a committee of experts of the weight of these attributes (very low to very high) and of the “rate of performance” for each attribute (worst to excellent)
Strategic agility evaluated by a checklist of 28 questions on seven themes: (1) clarity of vision, (2) knowledge of clients, (3) understanding core capabili-ties, (4) selecting strategic targets, (5) shared responsibility, (6) understand-ing the competition, and (7) taking action. Examples of items: I have a good understanding of which skills and knowl-edge are most critical to providing results that are important to our clients, I keep our clients fully involved in the planning and execution of project and stress the importance of their role in getting results, I know a lot about the competition’s abilities
130
The development and partial testing of the psychometric properties of a measurement scale of organizational agility
M@n@gement vol. 14 no. 2, 2011, 119-156
CONSTRUCTING A MEASUREMENT SCALE FOR ORGANIZATIONAL AGILITY
In line with Churchill’s paradigm (1979), the methodology firstly uses a qualitative study to gain a better overall view of the concept of organizational agility and complete the literature review, thus establishing a coherent set of items. After conducting qualitative pre-tests of the scale, we present the results of the exploratory and confirmatory analyses.
The qualitative study In order to gain a more precise idea of the content of the concept of agility with the aim of developing a battery of items, 22 qualitative interviews were carried out with directors and managers of French companies facing continuous change. For these leaders, reactivity and innovation constitute the keys to success. Most of these firms are worldwide or European leaders in one or several of their markets and have launched innovative products or services. Some of the firms were contacted because they use the term “agile” or “agility” in their communication. All things being equal, one of the criteria for choosing these companies was the level of “change” and the degree of innovation
Author
Shafer (1997)
Sharifi, et al. (2001)
Yusuf, et al. (1999)
Definition
Being infinitely adaptable without having to change (p. 1)Core competency of the organiza-tion which enables it to succeed in a dynamic environment
Capacity to understand the envi-ronment and to be flexible, cost effective and productive with con-sistent high quality (p. 857)
Ability of a business to grow in a competitive market of continuous and unanticipated change and to respond quickly to rapidly chang-ing markets driven by customer based valuing of products and services (p. 36)
Conception and characteris-tics of agility
Three agile dimensions: reading the mar-ket, mobilizing rapid response, and embed-ding organizational learningThree stable and shared levers (vision, val-ues and metrics) and four reconfigurable levers (structure, processes, information technology, and people)Seven HR activities of the agile firm: de-velopment and training, performance management, rewards and recognition, work relationships, work design, staffing, employee communication, employee/labor relations20 agile people attributes: for example, capacity to be a team player, creative, customer-focused, and results-oriented, ability to set appropriate priorities, ability to deal with paradox
Four agility capabilities: responsiveness, competency, quickness, and flexibilityFive agility providers: organization, people, technology, information system, and inno-vation
General characteristics: high-quality and highly customized products, products and services with high information and value-adding content, mobilization of core competencies, responsiveness to change, efficient use of technologies, response to change and uncertainty, cooperation and collaborationSix competitive bases: speed, flexibility, in-novation, proactivity, quality and profitabilityFour core concepts: core competence management, virtual enterprise, knowl-edge-driven enterprise, capability for re-configuration
Measurement tool
Organizational Agility Index developed from case studies using (1) indica-tors evaluating the need for agility (from 1 to 10 depending on the intensity of change) and indicators of frequency (from 1 always to 5 never) concerning (2) the adoption of an agile strategy, (3) agile dimensions, (4) agility levers, (5) human resource activities (6) people role, and (7) people attributes
No measurement tool. Presentation of a set of practices in relation with each lever from three case studies
No measurement tool. Mention of agile attributes: accessibility of informa-tion, development of business practice difficult to copy, empowerment of in-dividuals working in teams, decentralized decision making, flexible produc-tion technology, continuous improvement, culture of change, new product introduction, learning organization, continuous training and development, customer and employee satisfaction
131
Audrey CHARBONNIER-VOIRINM@n@gement vol. 14 no. 2, 2011, 119-156
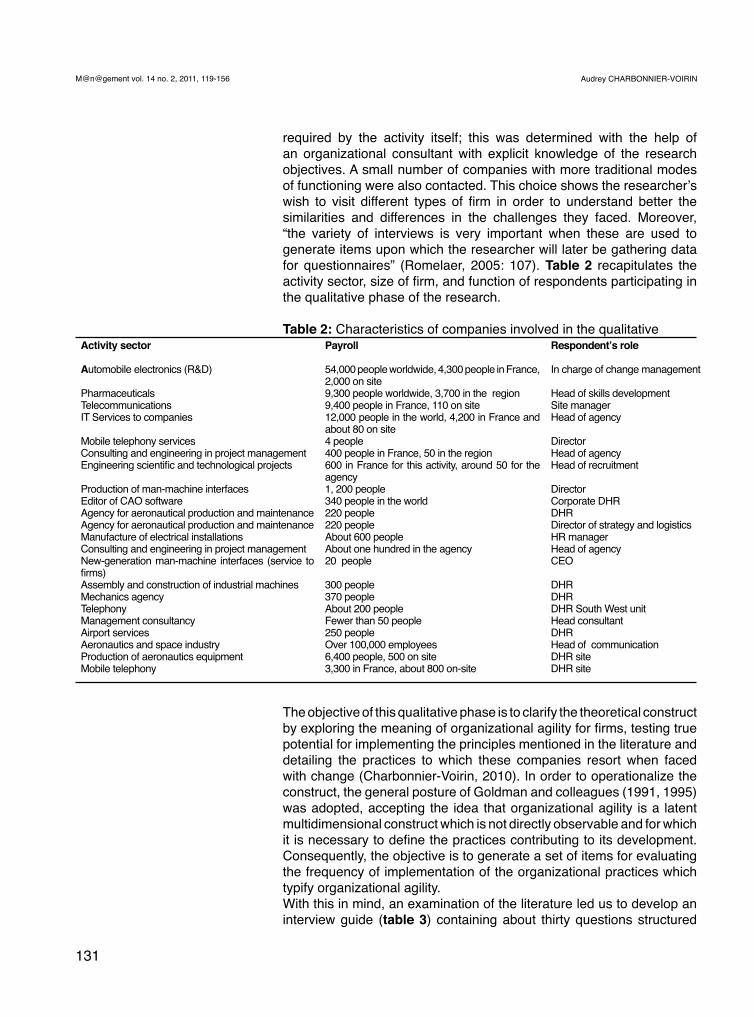
required by the activity itself; this was determined with the help of an organizational consultant with explicit knowledge of the research objectives. A small number of companies with more traditional modes of functioning were also contacted. This choice shows the researcher’s wish to visit different types of firm in order to understand better the similarities and differences in the challenges they faced. Moreover, “the variety of interviews is very important when these are used to generate items upon which the researcher will later be gathering data for questionnaires” (Romelaer, 2005: 107). Table 2 recapitulates the activity sector, size of firm, and function of respondents participating in the qualitative phase of the research.
Table 2: Characteristics of companies involved in the qualitative
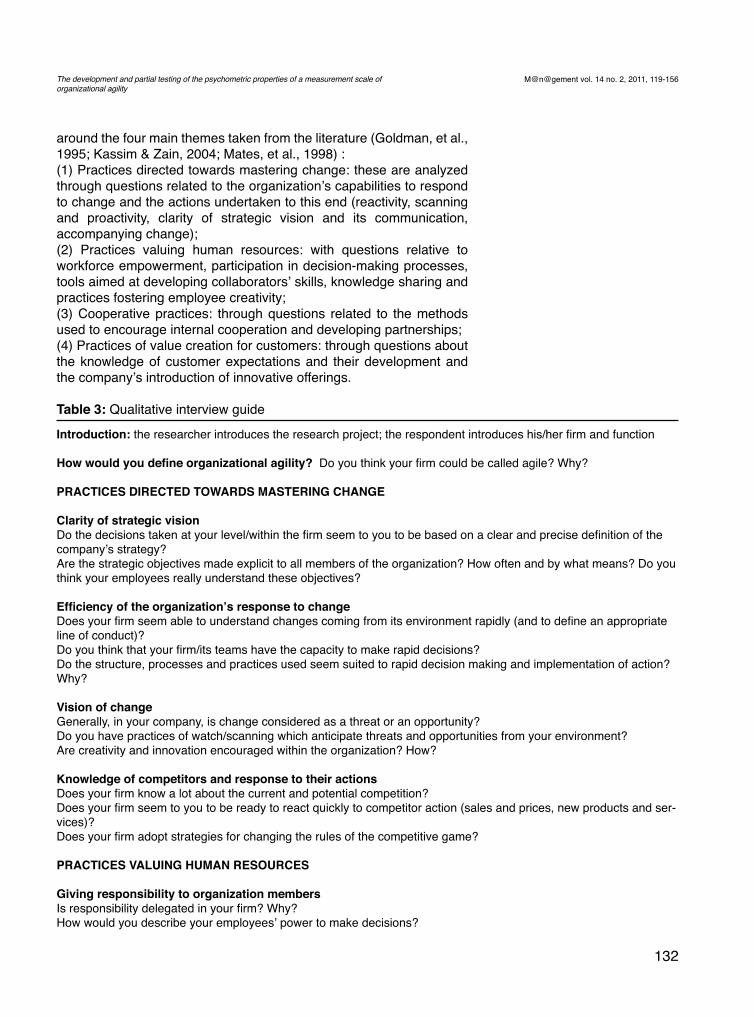
The objective of this qualitative phase is to clarify the theoretical construct by exploring the meaning of organizational agility for firms, testing true potential for implementing the principles mentioned in the literature and detailing the practices to which these companies resort when faced with change (Charbonnier-Voirin, 2010). In order to operationalize the construct, the general posture of Goldman and colleagues (1991, 1995) was adopted, accepting the idea that organizational agility is a latent multidimensional construct which is not directly observable and for which it is necessary to define the practices contributing to its development. Consequently, the objective is to generate a set of items for evaluating the frequency of implementation of the organizational practices which typify organizational agility.With this in mind, an examination of the literature led us to develop an interview guide (table 3) containing about thirty questions structured
Activity sector
Automobile electronics (R&D)
PharmaceuticalsTelecommunicationsIT Services to companies
Mobile telephony servicesConsulting and engineering in project management Engineering scientific and technological projects
Production of man-machine interfacesEditor of CAO softwareAgency for aeronautical production and maintenanceAgency for aeronautical production and maintenanceManufacture of electrical installationsConsulting and engineering in project management New-generation man-machine interfaces (service to firms) Assembly and construction of industrial machines Mechanics agencyTelephonyManagement consultancyAirport servicesAeronautics and space industryProduction of aeronautics equipmentMobile telephony
Payroll
54,000 people worldwide, 4,300 people in France, 2,000 on site9,300 people worldwide, 3,700 in the region9,400 people in France, 110 on site 12,000 people in the world, 4,200 in France and about 80 on site4 people400 people in France, 50 in the region600 in France for this activity, around 50 for the agency 1, 200 people340 people in the world 220 people220 people About 600 people About one hundred in the agency 20 people
300 people370 peopleAbout 200 peopleFewer than 50 people250 peopleOver 100,000 employees6,400 people, 500 on site3,300 in France, about 800 on-site
Respondent’s role
In charge of change management
Head of skills development Site managerHead of agency
DirectorHead of agencyHead of recruitment
DirectorCorporate DHRDHRDirector of strategy and logisticsHR manager Head of agencyCEO
DHRDHRDHR South West unitHead consultantDHRHead of communicationDHR siteDHR site
132
The development and partial testing of the psychometric properties of a measurement scale of organizational agility
M@n@gement vol. 14 no. 2, 2011, 119-156
around the four main themes taken from the literature (Goldman, et al., 1995; Kassim & Zain, 2004; Mates, et al., 1998) :(1) Practices directed towards mastering change: these are analyzed through questions related to the organization’s capabilities to respond to change and the actions undertaken to this end (reactivity, scanning and proactivity, clarity of strategic vision and its communication, accompanying change); (2) Practices valuing human resources: with questions relative to workforce empowerment, participation in decision-making processes, tools aimed at developing collaborators’ skills, knowledge sharing and practices fostering employee creativity;(3) Cooperative practices: through questions related to the methods used to encourage internal cooperation and developing partnerships; (4) Practices of value creation for customers: through questions about the knowledge of customer expectations and their development and the company’s introduction of innovative offerings.
Table 3: Qualitative interview guide
Introduction: the researcher introduces the research project; the respondent introduces his/her firm and function
How would you define organizational agility? Do you think your firm could be called agile? Why?
PRACTICES DIRECTED TOWARDS MASTERING CHANGE
Clarity of strategic vision Do the decisions taken at your level/within the firm seem to you to be based on a clear and precise definition of the company’s strategy? Are the strategic objectives made explicit to all members of the organization? How often and by what means? Do you think your employees really understand these objectives?
Efficiency of the organization’s response to changeDoes your firm seem able to understand changes coming from its environment rapidly (and to define an appropriate line of conduct)? Do you think that your firm/its teams have the capacity to make rapid decisions?Do the structure, processes and practices used seem suited to rapid decision making and implementation of action? Why?
Vision of change Generally, in your company, is change considered as a threat or an opportunity?Do you have practices of watch/scanning which anticipate threats and opportunities from your environment? Are creativity and innovation encouraged within the organization? How?
Knowledge of competitors and response to their actions Does your firm know a lot about the current and potential competition?Does your firm seem to you to be ready to react quickly to competitor action (sales and prices, new products and ser-vices)?Does your firm adopt strategies for changing the rules of the competitive game?
PRACTICES VALUING HUMAN RESOURCES
Giving responsibility to organization membersIs responsibility delegated in your firm? Why? How would you describe your employees’ power to make decisions?
133
Audrey CHARBONNIER-VOIRINM@n@gement vol. 14 no. 2, 2011, 119-156
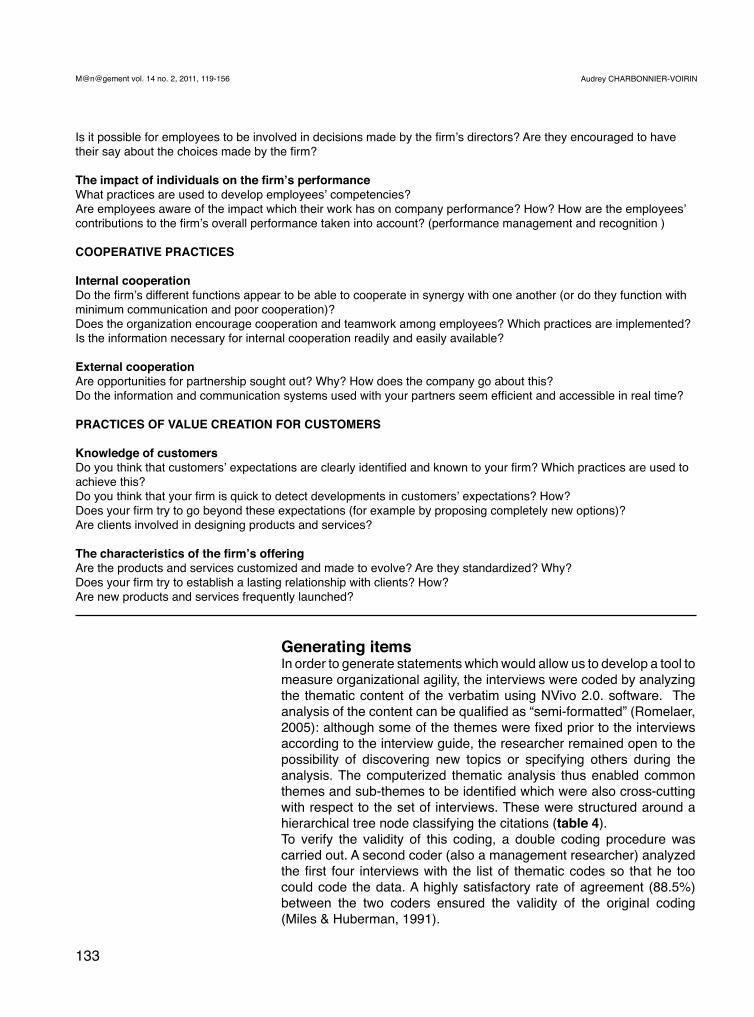
Generating itemsIn order to generate statements which would allow us to develop a tool to measure organizational agility, the interviews were coded by analyzing the thematic content of the verbatim using NVivo 2.0. software. The analysis of the content can be qualified as “semi-formatted” (Romelaer, 2005): although some of the themes were fixed prior to the interviews according to the interview guide, the researcher remained open to the possibility of discovering new topics or specifying others during the analysis. The computerized thematic analysis thus enabled common themes and sub-themes to be identified which were also cross-cutting with respect to the set of interviews. These were structured around a hierarchical tree node classifying the citations (table 4). To verify the validity of this coding, a double coding procedure was carried out. A second coder (also a management researcher) analyzed the first four interviews with the list of thematic codes so that he too could code the data. A highly satisfactory rate of agreement (88.5%) between the two coders ensured the validity of the original coding (Miles & Huberman, 1991).
Is it possible for employees to be involved in decisions made by the firm’s directors? Are they encouraged to have their say about the choices made by the firm?
The impact of individuals on the firm’s performanceWhat practices are used to develop employees’ competencies? Are employees aware of the impact which their work has on company performance? How? How are the employees’ contributions to the firm’s overall performance taken into account? (performance management and recognition )
COOPERATIVE PRACTICES
Internal cooperationDo the firm’s different functions appear to be able to cooperate in synergy with one another (or do they function with minimum communication and poor cooperation)? Does the organization encourage cooperation and teamwork among employees? Which practices are implemented? Is the information necessary for internal cooperation readily and easily available?
External cooperation Are opportunities for partnership sought out? Why? How does the company go about this?Do the information and communication systems used with your partners seem efficient and accessible in real time?
PRACTICES OF VALUE CREATION FOR CUSTOMERS
Knowledge of customers Do you think that customers’ expectations are clearly identified and known to your firm? Which practices are used to achieve this? Do you think that your firm is quick to detect developments in customers’ expectations? How?Does your firm try to go beyond these expectations (for example by proposing completely new options)? Are clients involved in designing products and services?
The characteristics of the firm’s offeringAre the products and services customized and made to evolve? Are they standardized? Why? Does your firm try to establish a lasting relationship with clients? How? Are new products and services frequently launched?
134
The development and partial testing of the psychometric properties of a measurement scale of organizational agility
M@n@gement vol. 14 no. 2, 2011, 119-156
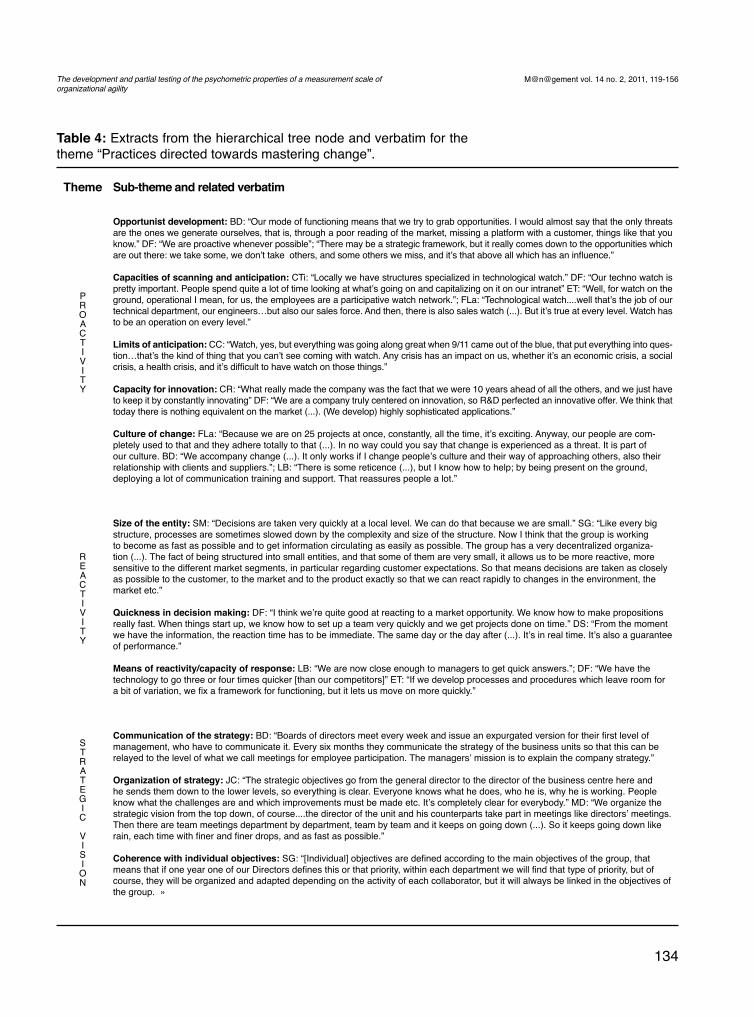
Table 4: Extracts from the hierarchical tree node and verbatim for the theme “Practices directed towards mastering change”.
Theme
PROACTIVITY
REACTIVITY
STRATEGIC
VISION
Sub-theme and related verbatim
Opportunist development: BD: “Our mode of functioning means that we try to grab opportunities. I would almost say that the only threats are the ones we generate ourselves, that is, through a poor reading of the market, missing a platform with a customer, things like that you know.” DF: “We are proactive whenever possible”; “There may be a strategic framework, but it really comes down to the opportunities which are out there: we take some, we don’t take others, and some others we miss, and it’s that above all which has an influence.”
Capacities of scanning and anticipation: CTi: “Locally we have structures specialized in technological watch.” DF: “Our techno watch is pretty important. People spend quite a lot of time looking at what’s going on and capitalizing on it on our intranet” ET: “Well, for watch on the ground, operational I mean, for us, the employees are a participative watch network.”; FLa: “Technological watch....well that’s the job of our technical department, our engineers…but also our sales force. And then, there is also sales watch (...). But it’s true at every level. Watch has to be an operation on every level.”
Limits of anticipation: CC: “Watch, yes, but everything was going along great when 9/11 came out of the blue, that put everything into ques-tion…that’s the kind of thing that you can’t see coming with watch. Any crisis has an impact on us, whether it’s an economic crisis, a social crisis, a health crisis, and it’s difficult to have watch on those things.”
Capacity for innovation: CR: “What really made the company was the fact that we were 10 years ahead of all the others, and we just have to keep it by constantly innovating” DF: “We are a company truly centered on innovation, so R&D perfected an innovative offer. We think that today there is nothing equivalent on the market (...). (We develop) highly sophisticated applications.”
Culture of change: FLa: “Because we are on 25 projects at once, constantly, all the time, it’s exciting. Anyway, our people are com-pletely used to that and they adhere totally to that (...). In no way could you say that change is experienced as a threat. It is part of our culture. BD: “We accompany change (...). It only works if I change people’s culture and their way of approaching others, also their relationship with clients and suppliers.”; LB: “There is some reticence (...), but I know how to help; by being present on the ground, deploying a lot of communication training and support. That reassures people a lot.”
Size of the entity: SM: “Decisions are taken very quickly at a local level. We can do that because we are small.” SG: “Like every big structure, processes are sometimes slowed down by the complexity and size of the structure. Now I think that the group is working to become as fast as possible and to get information circulating as easily as possible. The group has a very decentralized organiza-tion (...). The fact of being structured into small entities, and that some of them are very small, it allows us to be more reactive, more sensitive to the different market segments, in particular regarding customer expectations. So that means decisions are taken as closely as possible to the customer, to the market and to the product exactly so that we can react rapidly to changes in the environment, the market etc.”
Quickness in decision making: DF: “I think we’re quite good at reacting to a market opportunity. We know how to make propositions really fast. When things start up, we know how to set up a team very quickly and we get projects done on time.” DS: “From the moment we have the information, the reaction time has to be immediate. The same day or the day after (...). It’s in real time. It’s also a guarantee of performance.”
Means of reactivity/capacity of response: LB: “We are now close enough to managers to get quick answers.”; DF: “We have the technology to go three or four times quicker [than our competitors]” ET: “If we develop processes and procedures which leave room for a bit of variation, we fix a framework for functioning, but it lets us move on more quickly.”
Communication of the strategy: BD: “Boards of directors meet every week and issue an expurgated version for their first level of management, who have to communicate it. Every six months they communicate the strategy of the business units so that this can be relayed to the level of what we call meetings for employee participation. The managers’ mission is to explain the company strategy.”
Organization of strategy: JC: “The strategic objectives go from the general director to the director of the business centre here and he sends them down to the lower levels, so everything is clear. Everyone knows what he does, who he is, why he is working. People know what the challenges are and which improvements must be made etc. It’s completely clear for everybody.” MD: “We organize the strategic vision from the top down, of course....the director of the unit and his counterparts take part in meetings like directors’ meetings. Then there are team meetings department by department, team by team and it keeps on going down (...). So it keeps going down like rain, each time with finer and finer drops, and as fast as possible.”
Coherence with individual objectives: SG: “[Individual] objectives are defined according to the main objectives of the group, that means that if one year one of our Directors defines this or that priority, within each department we will find that type of priority, but of course, they will be organized and adapted depending on the activity of each collaborator, but it will always be linked in the objectives of the group. »
135
Audrey CHARBONNIER-VOIRINM@n@gement vol. 14 no. 2, 2011, 119-156
The verbatim related to each of the categories were examined in order to generate a first list of items. This preliminary version was submitted to six researchers in the management sciences and four professionals (directors and department heads) who had been told that the objective was to measure the frequency of practices implemented by organizations to develop their agility. Having fixed the scale’s response modes, (a seven-point frequency scale with: 1.Never, 2.Very rarely, 3.Quite rarely, 4.Undecided, 5.Quite often, 6.Very often and 7.Always), there was a discussion on the content of the list. The researchers and professionals examined the face or content validity of the scale (Evrard, Pras, Roux, Choffray, & Dussaix, 1997; Roussel, 2005). The many remarks gathered during this phase resulted in the removal or replacement of items judged “non-specific” to agile firms or insufficiently discriminating (for example “Employees can acquire new knowledge and know-how” or “The company listens to its customers”), or too abstract (for example “The organization sets up progress plans for all employees”. The item “The company easily adjusts its resources to adapt to changes” was thus modified to: “Our resources (material, financial, human) are easily deployed to respond to opportunities and threats encountered”). Attention was also paid to items considered too specific (for example “Employees are considered as a participative network for watch”), that is, not suitable for every organizational context. The most redundant items were also eliminated. The suggestions allowed the proposed version to be simplified and thereby improved (for example the item “The firm easily delegates responsibilities to lower hierarchical levels” was replaced by “Responsibilities are delegated to lower hierarchical levels”, and the item “Partnerships constitute a possibility for development which the firm uses a lot” was modified to become “To develop our activity, we intend to reinforce our partnerships”). The items were thus reworked until a consensus between “evaluators” emerged on a list of 70 items. The scale was then administered face-to-face with 16 managers from different companies. The questionnaire dedicated to organizational agility is in fact meant to be filled in by managers who are heads of departments or teams. The qualitative phase of the research showed that managers were the best placed to give an overall evaluation of the organizational practices implemented within the entity for which they were responsible; this was due to their hierarchical position and their knowledge of the missions, objectives and strategic orientations of their organization (Schneider & Reichers, 1983). Moreover, the very functioning of the agile firm means that the company is divided into small autonomous cooperative units which act according to common goals and objectives. Indeed, the idea is to place each operational entity within a system of reduced complexity and closer to customers, thereby increasing reactivity and adaptability (Barrand, 2006). Organizational agility is then the fruit of the combined assessments of the main managers responsible for the firm under examination. Their remarks led us to reformulate a number of items for greater clarity so that they would be suitable for all types of organization. Certain items on which respondents frequently hesitated were also made more specific (The term “operational” for example, was added to the following
136
The development and partial testing of the psychometric properties of a measurement scale of organizational agility
M@n@gement vol. 14 no. 2, 2011, 119-156
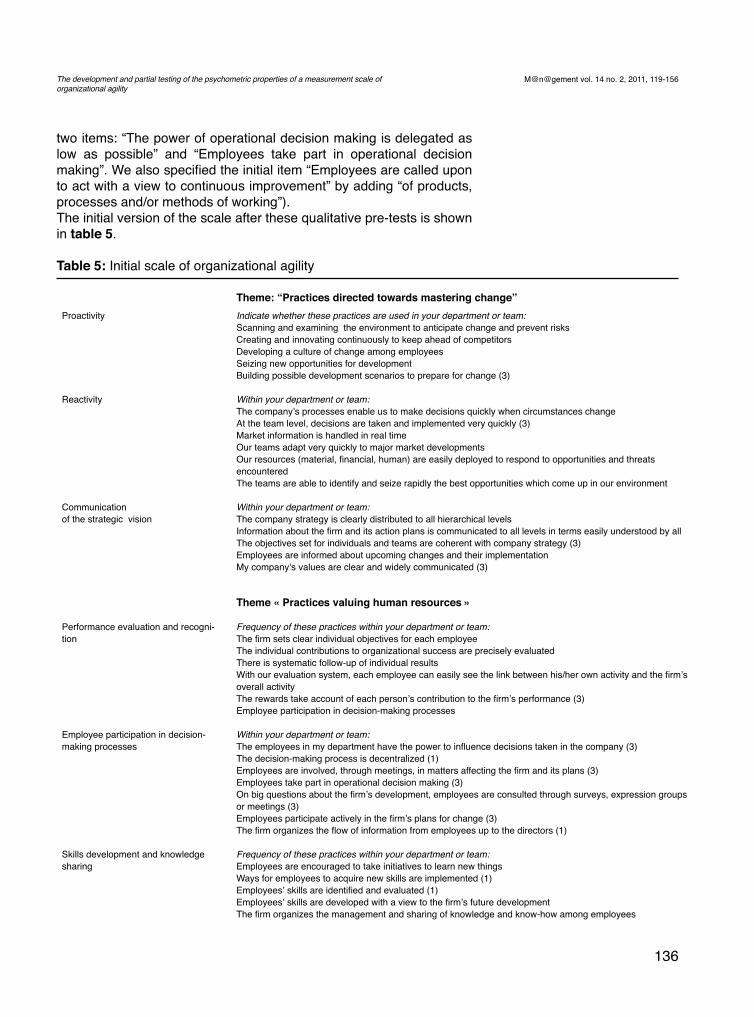
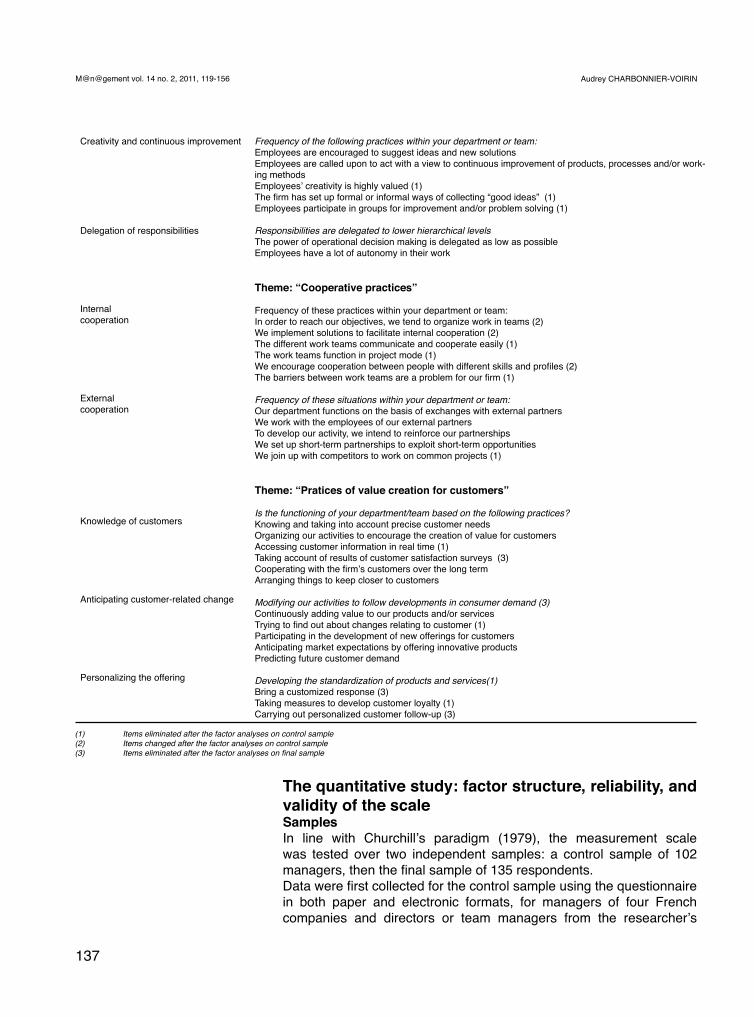
two items: “The power of operational decision making is delegated as low as possible” and “Employees take part in operational decision making”. We also specified the initial item “Employees are called upon to act with a view to continuous improvement” by adding “of products, processes and/or methods of working”). The initial version of the scale after these qualitative pre-tests is shown in table 5.
Table 5: Initial scale of organizational agility
Theme: “Practices directed towards mastering change”Proactivity
Reactivity
Communicationof the strategic vision
Performance evaluation and recogni-tion
Employee participation in decision-making processes
Skills development and knowledge sharing
Indicate whether these practices are used in your department or team:Scanning and examining the environment to anticipate change and prevent risksCreating and innovating continuously to keep ahead of competitors Developing a culture of change among employees Seizing new opportunities for development Building possible development scenarios to prepare for change (3)
Within your department or team:The company’s processes enable us to make decisions quickly when circumstances change At the team level, decisions are taken and implemented very quickly (3)Market information is handled in real time Our teams adapt very quickly to major market developments Our resources (material, financial, human) are easily deployed to respond to opportunities and threats encounteredThe teams are able to identify and seize rapidly the best opportunities which come up in our environment
Within your department or team:The company strategy is clearly distributed to all hierarchical levels Information about the firm and its action plans is communicated to all levels in terms easily understood by all The objectives set for individuals and teams are coherent with company strategy (3)Employees are informed about upcoming changes and their implementationMy company’s values are clear and widely communicated (3)
Theme « Practices valuing human resources »
Frequency of these practices within your department or team:The firm sets clear individual objectives for each employee The individual contributions to organizational success are precisely evaluatedThere is systematic follow-up of individual resultsWith our evaluation system, each employee can easily see the link between his/her own activity and the firm’s overall activityThe rewards take account of each person’s contribution to the firm’s performance (3)Employee participation in decision-making processes
Within your department or team:The employees in my department have the power to influence decisions taken in the company (3)The decision-making process is decentralized (1)Employees are involved, through meetings, in matters affecting the firm and its plans (3)Employees take part in operational decision making (3)On big questions about the firm’s development, employees are consulted through surveys, expression groups or meetings (3)Employees participate actively in the firm’s plans for change (3)The firm organizes the flow of information from employees up to the directors (1)
Frequency of these practices within your department or team:Employees are encouraged to take initiatives to learn new things Ways for employees to acquire new skills are implemented (1)Employees’ skills are identified and evaluated (1)Employees’ skills are developed with a view to the firm’s future development The firm organizes the management and sharing of knowledge and know-how among employees
137
Audrey CHARBONNIER-VOIRINM@n@gement vol. 14 no. 2, 2011, 119-156
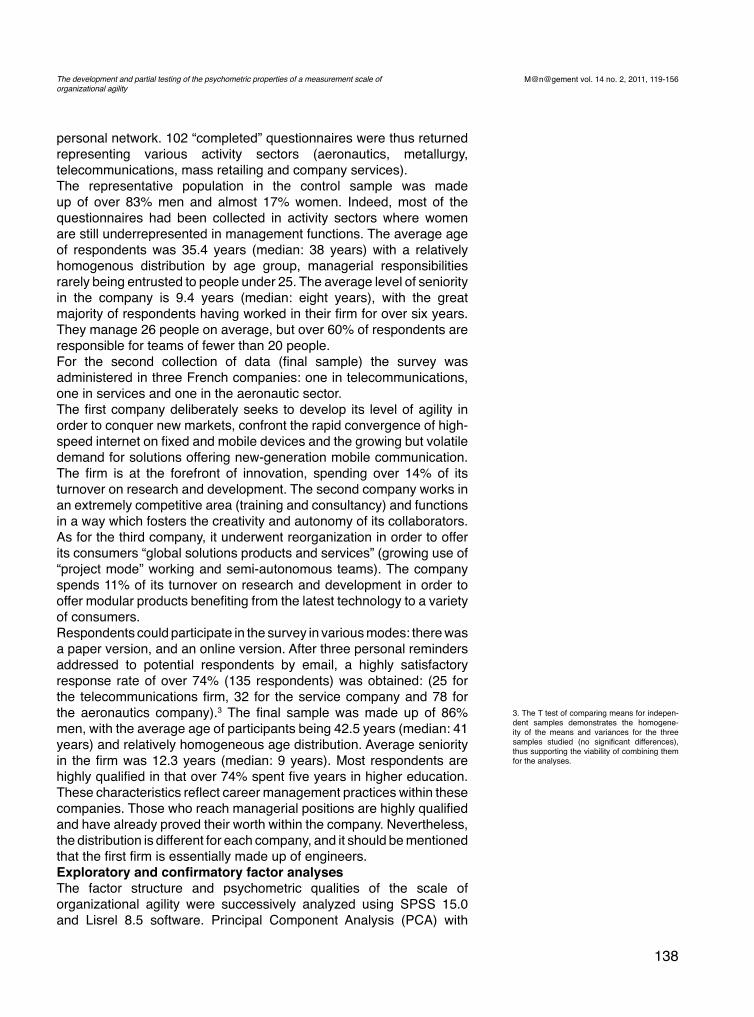
The quantitative study: factor structure, reliability, and validity of the scaleSamplesIn line with Churchill’s paradigm (1979), the measurement scale was tested over two independent samples: a control sample of 102 managers, then the final sample of 135 respondents.Data were first collected for the control sample using the questionnaire in both paper and electronic formats, for managers of four French companies and directors or team managers from the researcher’s
Creativity and continuous improvement
Delegation of responsibilities
Internal cooperation
External cooperation
Knowledge of customers
Anticipating customer-related change
Personalizing the offering
Frequency of the following practices within your department or team:Employees are encouraged to suggest ideas and new solutionsEmployees are called upon to act with a view to continuous improvement of products, processes and/or work-ing methodsEmployees’ creativity is highly valued (1)The firm has set up formal or informal ways of collecting “good ideas” (1)Employees participate in groups for improvement and/or problem solving (1)
Responsibilities are delegated to lower hierarchical levelsThe power of operational decision making is delegated as low as possible Employees have a lot of autonomy in their work
Theme: “Cooperative practices”
Frequency of these practices within your department or team:In order to reach our objectives, we tend to organize work in teams (2)We implement solutions to facilitate internal cooperation (2)The different work teams communicate and cooperate easily (1)The work teams function in project mode (1)We encourage cooperation between people with different skills and profiles (2)The barriers between work teams are a problem for our firm (1)
Frequency of these situations within your department or team:Our department functions on the basis of exchanges with external partnersWe work with the employees of our external partnersTo develop our activity, we intend to reinforce our partnerships We set up short-term partnerships to exploit short-term opportunitiesWe join up with competitors to work on common projects (1)
Theme: “Pratices of value creation for customers”
Is the functioning of your department/team based on the following practices? Knowing and taking into account precise customer needsOrganizing our activities to encourage the creation of value for customers Accessing customer information in real time (1)Taking account of results of customer satisfaction surveys (3)Cooperating with the firm’s customers over the long termArranging things to keep closer to customers
Modifying our activities to follow developments in consumer demand (3)Continuously adding value to our products and/or servicesTrying to find out about changes relating to customer (1)Participating in the development of new offerings for customersAnticipating market expectations by offering innovative products Predicting future customer demand
Developing the standardization of products and services(1)Bring a customized response (3)Taking measures to develop customer loyalty (1)Carrying out personalized customer follow-up (3)
(1) Items eliminated after the factor analyses on control sample(2) Items changed after the factor analyses on control sample (3) Itemseliminatedafterthefactoranalysesonfinalsample
138
The development and partial testing of the psychometric properties of a measurement scale of organizational agility
M@n@gement vol. 14 no. 2, 2011, 119-156
personal network. 102 “completed” questionnaires were thus returned representing various activity sectors (aeronautics, metallurgy, telecommunications, mass retailing and company services). The representative population in the control sample was made up of over 83% men and almost 17% women. Indeed, most of the questionnaires had been collected in activity sectors where women are still underrepresented in management functions. The average age of respondents was 35.4 years (median: 38 years) with a relatively homogenous distribution by age group, managerial responsibilities rarely being entrusted to people under 25. The average level of seniority in the company is 9.4 years (median: eight years), with the great majority of respondents having worked in their firm for over six years. They manage 26 people on average, but over 60% of respondents are responsible for teams of fewer than 20 people.For the second collection of data (final sample) the survey was administered in three French companies: one in telecommunications, one in services and one in the aeronautic sector. The first company deliberately seeks to develop its level of agility in order to conquer new markets, confront the rapid convergence of high-speed internet on fixed and mobile devices and the growing but volatile demand for solutions offering new-generation mobile communication. The firm is at the forefront of innovation, spending over 14% of its turnover on research and development. The second company works in an extremely competitive area (training and consultancy) and functions in a way which fosters the creativity and autonomy of its collaborators. As for the third company, it underwent reorganization in order to offer its consumers “global solutions products and services” (growing use of “project mode” working and semi-autonomous teams). The company spends 11% of its turnover on research and development in order to offer modular products benefiting from the latest technology to a variety of consumers. Respondents could participate in the survey in various modes: there was a paper version, and an online version. After three personal reminders addressed to potential respondents by email, a highly satisfactory response rate of over 74% (135 respondents) was obtained: (25 for the telecommunications firm, 32 for the service company and 78 for the aeronautics company).3 The final sample was made up of 86% men, with the average age of participants being 42.5 years (median: 41 years) and relatively homogeneous age distribution. Average seniority in the firm was 12.3 years (median: 9 years). Most respondents are highly qualified in that over 74% spent five years in higher education. These characteristics reflect career management practices within these companies. Those who reach managerial positions are highly qualified and have already proved their worth within the company. Nevertheless, the distribution is different for each company, and it should be mentioned that the first firm is essentially made up of engineers.Exploratory and confirmatory factor analysesThe factor structure and psychometric qualities of the scale of organizational agility were successively analyzed using SPSS 15.0 and Lisrel 8.5 software. Principal Component Analysis (PCA) with
3. The T test of comparing means for indepen-dent samples demonstrates the homogene-ity of the means and variances for the three samples studied (no significant differences), thus supporting the viability of combining them for the analyses.
139
Audrey CHARBONNIER-VOIRINM@n@gement vol. 14 no. 2, 2011, 119-156
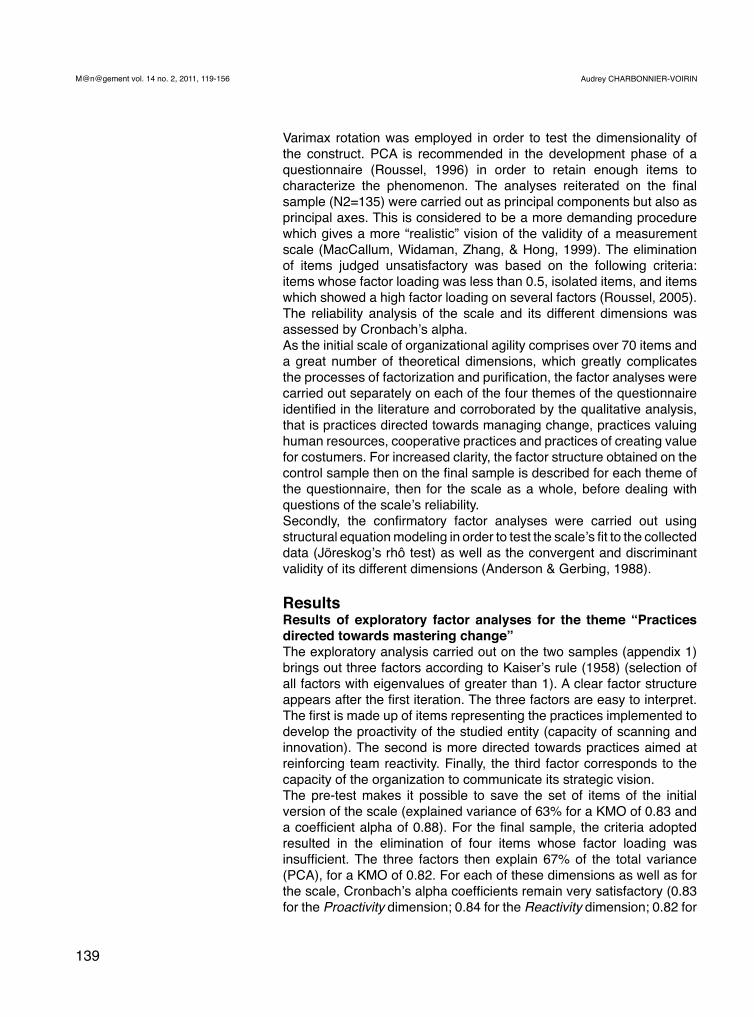
Varimax rotation was employed in order to test the dimensionality of the construct. PCA is recommended in the development phase of a questionnaire (Roussel, 1996) in order to retain enough items to characterize the phenomenon. The analyses reiterated on the final sample (N2=135) were carried out as principal components but also as principal axes. This is considered to be a more demanding procedure which gives a more “realistic” vision of the validity of a measurement scale (MacCallum, Widaman, Zhang, & Hong, 1999). The elimination of items judged unsatisfactory was based on the following criteria: items whose factor loading was less than 0.5, isolated items, and items which showed a high factor loading on several factors (Roussel, 2005). The reliability analysis of the scale and its different dimensions was assessed by Cronbach’s alpha. As the initial scale of organizational agility comprises over 70 items and a great number of theoretical dimensions, which greatly complicates the processes of factorization and purification, the factor analyses were carried out separately on each of the four themes of the questionnaire identified in the literature and corroborated by the qualitative analysis, that is practices directed towards managing change, practices valuing human resources, cooperative practices and practices of creating value for costumers. For increased clarity, the factor structure obtained on the control sample then on the final sample is described for each theme of the questionnaire, then for the scale as a whole, before dealing with questions of the scale’s reliability.Secondly, the confirmatory factor analyses were carried out using structural equation modeling in order to test the scale’s fit to the collected data (Jöreskog’s rhô test) as well as the convergent and discriminant validity of its different dimensions (Anderson & Gerbing, 1988).
Results Results of exploratory factor analyses for the theme “Practices directed towards mastering change”The exploratory analysis carried out on the two samples (appendix 1) brings out three factors according to Kaiser’s rule (1958) (selection of all factors with eigenvalues of greater than 1). A clear factor structure appears after the first iteration. The three factors are easy to interpret. The first is made up of items representing the practices implemented to develop the proactivity of the studied entity (capacity of scanning and innovation). The second is more directed towards practices aimed at reinforcing team reactivity. Finally, the third factor corresponds to the capacity of the organization to communicate its strategic vision.The pre-test makes it possible to save the set of items of the initial version of the scale (explained variance of 63% for a KMO of 0.83 and a coefficient alpha of 0.88). For the final sample, the criteria adopted resulted in the elimination of four items whose factor loading was insufficient. The three factors then explain 67% of the total variance (PCA), for a KMO of 0.82. For each of these dimensions as well as for the scale, Cronbach’s alpha coefficients remain very satisfactory (0.83 for the Proactivity dimension; 0.84 for the Reactivity dimension; 0.82 for
140
The development and partial testing of the psychometric properties of a measurement scale of organizational agility
M@n@gement vol. 14 no. 2, 2011, 119-156
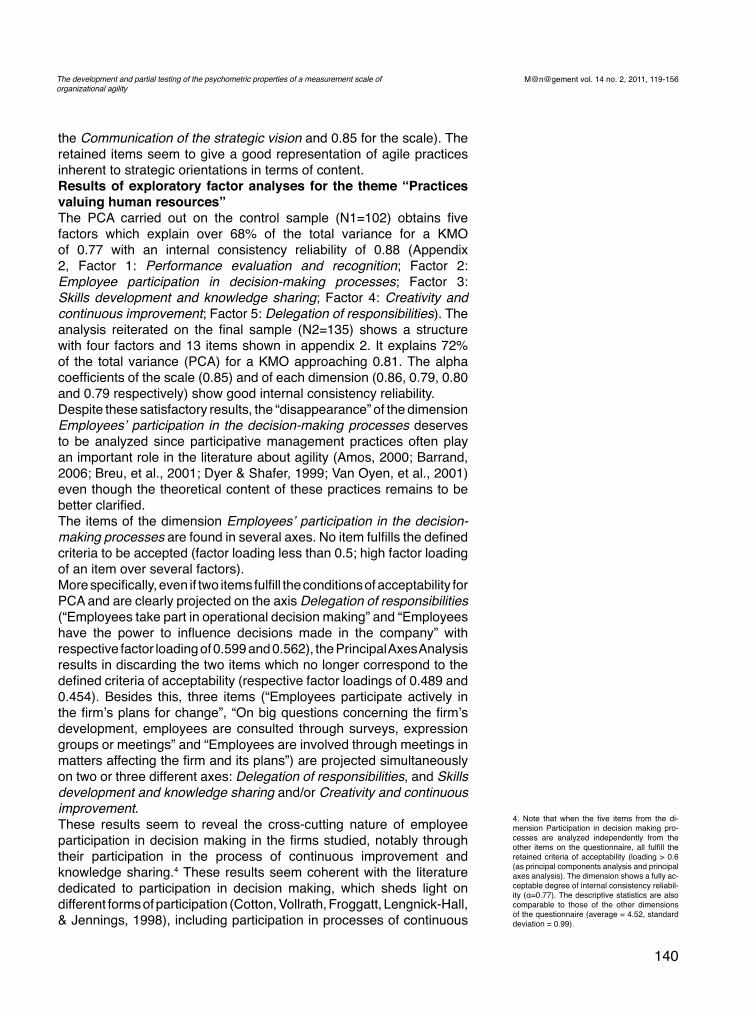
the Communication of the strategic vision and 0.85 for the scale). The retained items seem to give a good representation of agile practices inherent to strategic orientations in terms of content.Results of exploratory factor analyses for the theme “Practices valuing human resources”The PCA carried out on the control sample (N1=102) obtains five factors which explain over 68% of the total variance for a KMO of 0.77 with an internal consistency reliability of 0.88 (Appendix 2, Factor 1: Performance evaluation and recognition; Factor 2: Employee participation in decision-making processes; Factor 3: Skills development and knowledge sharing; Factor 4: Creativity and continuous improvement; Factor 5: Delegation of responsibilities). The analysis reiterated on the final sample (N2=135) shows a structure with four factors and 13 items shown in appendix 2. It explains 72% of the total variance (PCA) for a KMO approaching 0.81. The alpha coefficients of the scale (0.85) and of each dimension (0.86, 0.79, 0.80 and 0.79 respectively) show good internal consistency reliability. Despite these satisfactory results, the “disappearance” of the dimension Employees’ participation in the decision-making processes deserves to be analyzed since participative management practices often play an important role in the literature about agility (Amos, 2000; Barrand, 2006; Breu, et al., 2001; Dyer & Shafer, 1999; Van Oyen, et al., 2001) even though the theoretical content of these practices remains to be better clarified. The items of the dimension Employees’ participation in the decision-making processes are found in several axes. No item fulfills the defined criteria to be accepted (factor loading less than 0.5; high factor loading of an item over several factors). More specifically, even if two items fulfill the conditions of acceptability for PCA and are clearly projected on the axis Delegation of responsibilities (“Employees take part in operational decision making” and “Employees have the power to influence decisions made in the company” with respective factor loading of 0.599 and 0.562), the Principal Axes Analysis results in discarding the two items which no longer correspond to the defined criteria of acceptability (respective factor loadings of 0.489 and 0.454). Besides this, three items (“Employees participate actively in the firm’s plans for change”, “On big questions concerning the firm’s development, employees are consulted through surveys, expression groups or meetings” and “Employees are involved through meetings in matters affecting the firm and its plans”) are projected simultaneously on two or three different axes: Delegation of responsibilities, and Skills development and knowledge sharing and/or Creativity and continuous improvement. These results seem to reveal the cross-cutting nature of employee participation in decision making in the firms studied, notably through their participation in the process of continuous improvement and knowledge sharing.4 These results seem coherent with the literature dedicated to participation in decision making, which sheds light on different forms of participation (Cotton, Vollrath, Froggatt, Lengnick-Hall, & Jennings, 1998), including participation in processes of continuous
4. Note that when the five items from the di-mension Participation in decision making pro-cesses are analyzed independently from the other items on the questionnaire, all fulfill the retained criteria of acceptability (loading > 0.6 (as principal components analysis and principal axes analysis). The dimension shows a fully ac-ceptable degree of internal consistency reliabil-ity (α=0.77). The descriptive statistics are also comparable to those of the other dimensions of the questionnaire (average = 4.52, standard deviation = 0.99).
141
Audrey CHARBONNIER-VOIRINM@n@gement vol. 14 no. 2, 2011, 119-156
improvement inherent to the movements of total quality management (see for example Kitapçi & Sezen, 2007; Pereira & Osburn, 2007). In this respect, the notion of employee participation remains within the questionnaire through certain items which are very clearly attached to the dimension of Creativity and continuous improvement (For example, “Employees are called upon to act with a view to continuous improvement of products, processes and/or working methods” or “Employees are encouraged to suggest ideas and new solutions”). This element reveals the “participative culture” of those companies in the sample through the process of quality, innovation and continuous improvement, especially in the aeronautic and telecommunications companies. Furthermore, the attachment of certain items to the dimension Skills development and knowledge sharing can be explained by the fact that, at the organizational level, participation can be thought of as a mechanism of information exchange, creation and transfer of knowledge (Locke, Alavi, & Wagner, 1997). The participation process intensifies and enriches relations within the organization, gets individuals together and provides opportunities to communicate, exchange information and develop organizational learning (Locke, et al., 1997). Furthermore, employee participation exists at different levels, depending on their work, their department (or team) and their organization (Bakan, Suseno, Pinnington, & Money, 2004). Regarding these different elements, this theoretical dimension should be clarified. One possibility would be to formulate new items clearly referring to different forms of employee participation: in processes of quality and continuous improvement, in the organization of work and related decisions, in knowledge transfer, in strategic decision making or more informally through interactions with managers (see for example Cotton, et al., 1988).Results of exploratory factor analyses for the theme “Cooperative practices” The exploratory analyses carried out on the control sample enabled the restitution of two factors (appendix 3), the first being made up of items representing aspects of internal cooperation while the second is directed towards the implementation of practices encouraging external cooperation (partnerships). This solution explains almost 63% of the total variance for a KMO of 0.71. Nevertheless, even if the scale shows an acceptable coefficient alpha (0.73), the more than mediocre level of the alpha for the dimension of Internal cooperation (0.64) required that we reassess its content in order to retain this dimension, which has a theoretical interest for the comprehension of the construct. The objective, therefore, is to reformulate the statements, notably with a view to simplifying them. The item “Reaching objectives requires organizing work in teams” was modified to become “In order to reach our objectives, we tend to organize work in teams”. The item “Processes are implemented to facilitate internal cooperation was modified” to become: “We implement solutions to facilitate internal cooperation”. Finally, the item “Cooperation between people with different profiles and a variety
142
The development and partial testing of the psychometric properties of a measurement scale of organizational agility
M@n@gement vol. 14 no. 2, 2011, 119-156
of skills is encouraged” was reformulated thus: “We encourage cooperation between people with different skills and profiles”. It seems that these modifications result in a clear improvement of the obtained solution. Indeed, the analyses reiterated on the final sample allow for the maintenance of all the items. The two-factor structure henceforth explains 74% of the total variance (PCA), for a KMO of 0.74. The coefficients alpha are also satisfactory. The scale obtains an alpha of 0.85. The alpha for the first dimension (Internal cooperation) is 0.84 and that for the second (External cooperation) is 0.87.Results of exploratory factor analyses for the theme “Practices of value creation for customers” The exploratory analysis carried out on the control sample restitutes two factors. The first factor represents practices enabling knowledge of customers, whereas the second reflects the effort to anticipate customer’s evolutions. The items related to the sub-theme Personalizing the offering are projected on the first factor. This result appears coherent in as much as the formulation of these statements (“Carry out individualized customer follow-up” and “Bring a customized response”) is compatible with the means the firm allocates for customer satisfaction. The retained solution (appendix 4) obtains a KMO of 0.89 and explains almost 68% of the variance. Although the reliability is satisfactory (respectively 0.89 for factor 1, 0.90 for factor 2 and 0.93 for the scale), an overlap between the two dimensions should be noted, as this foreshadows a problem of discriminant validity. In fact, several items have high factor loadings over two factors. This solution was nevertheless retained with a view to the final survey, aiming to clarify the factor structure related to this theme. When the analyses were replicated on the final sample, no difficulty was encountered concerning the overlap between the dimensions. On the other hand, the elimination criteria require that henceforth four items presenting very mediocre results be eliminated. The analysis thus restitutes the two factors obtained previously (appendix 4), which explain 72,5% of the variance (PCA) for a KMO of 0.82. The examination of the coefficients alpha of the scale (0.84) and of each dimension (respectively 0.84 and 0.85 for factors 1 and 2) attests to the scale’s reliability. Results of exploratory factor analyses for the scale When the 39 items are integrated simultaneously into the factor analysis, they are projected on the 11 factors identified previously (factor loading > 0.5, no overlap between dimensions). The solution explains 74.4% of the variance for a KMO of 0.82. Overall, the scale obtains a highly satisfactory alpha of 0.80. These results attest to the reliability of the overall scale of organizational agility. Table 6 presents the descriptive statistics of the different dimensions (N=135).
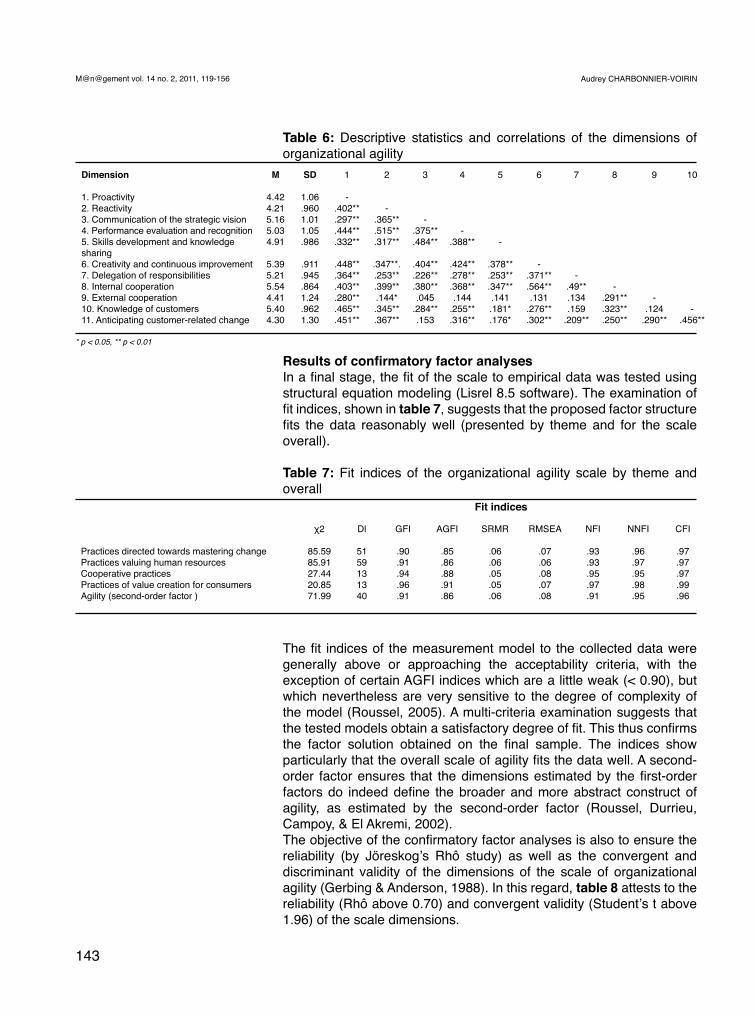
143
Audrey CHARBONNIER-VOIRINM@n@gement vol. 14 no. 2, 2011, 119-156
Table 6: Descriptive statistics and correlations of the dimensions of organizational agility
Results of confirmatory factor analysesIn a final stage, the fit of the scale to empirical data was tested using structural equation modeling (Lisrel 8.5 software). The examination of fit indices, shown in table 7, suggests that the proposed factor structure fits the data reasonably well (presented by theme and for the scale overall).
Table 7: Fit indices of the organizational agility scale by theme and overall
The fit indices of the measurement model to the collected data were generally above or approaching the acceptability criteria, with the exception of certain AGFI indices which are a little weak (< 0.90), but which nevertheless are very sensitive to the degree of complexity of the model (Roussel, 2005). A multi-criteria examination suggests that the tested models obtain a satisfactory degree of fit. This thus confirms the factor solution obtained on the final sample. The indices show particularly that the overall scale of agility fits the data well. A second-order factor ensures that the dimensions estimated by the first-order factors do indeed define the broader and more abstract construct of agility, as estimated by the second-order factor (Roussel, Durrieu, Campoy, & El Akremi, 2002).The objective of the confirmatory factor analyses is also to ensure the reliability (by Jöreskog’s Rhô study) as well as the convergent and discriminant validity of the dimensions of the scale of organizational agility (Gerbing & Anderson, 1988). In this regard, table 8 attests to the reliability (Rhô above 0.70) and convergent validity (Student’s t above 1.96) of the scale dimensions.
Dimension
1. Proactivity2. Reactivity3. Communication of the strategic vision 4. Performance evaluation and recognition 5. Skills development and knowledge sharing6. Creativity and continuous improvement 7. Delegation of responsibilities8. Internal cooperation 9. External cooperation10. Knowledge of customers11. Anticipating customer-related change
M
4.424.215.165.034.91
5.395.215.544.415.404.30
SD
1.06.9601.011.05.986
.911
.945
.8641.24.9621.30
1
-.402**.297**.444**.332**
.448**
.364**
.403**
.280**
.465**
.451**
2
-.365**.515**.317**
.347**..253**.399**.144*.345**.367**
3
-.375**.484**
.404**
.226**
.380**.045
.284**.153
4
-.388**
.424**
.278**
.368**.144
.255**
.316**
5
-
.378**
.253**
.347**.141.181*.176*
6
-.371**.564**.131
.276**
.302**
7
-.49**.134.159
.209**
8
-.291**.323**.250**
9
-.124
.290**
10
-.456**
* p < 0.05, ** p < 0.01
Fit indices
Practices directed towards mastering changePractices valuing human resources Cooperative practicesPractices of value creation for consumers Agility (second-order factor )
χ2
85.5985.9127.4420.8571.99
Dl
5159131340
GFI
.90
.91
.94
.96
.91
AGFI
.85
.86
.88
.91
.86
SRMR
.06
.06
.05
.05
.06
RMSEA
.07
.06
.08
.07
.08
NFI
.93
.93
.95
.97
.91
NNFI
.96
.97
.95
.98
.95
CFI
.97
.97
.97
.99
.96
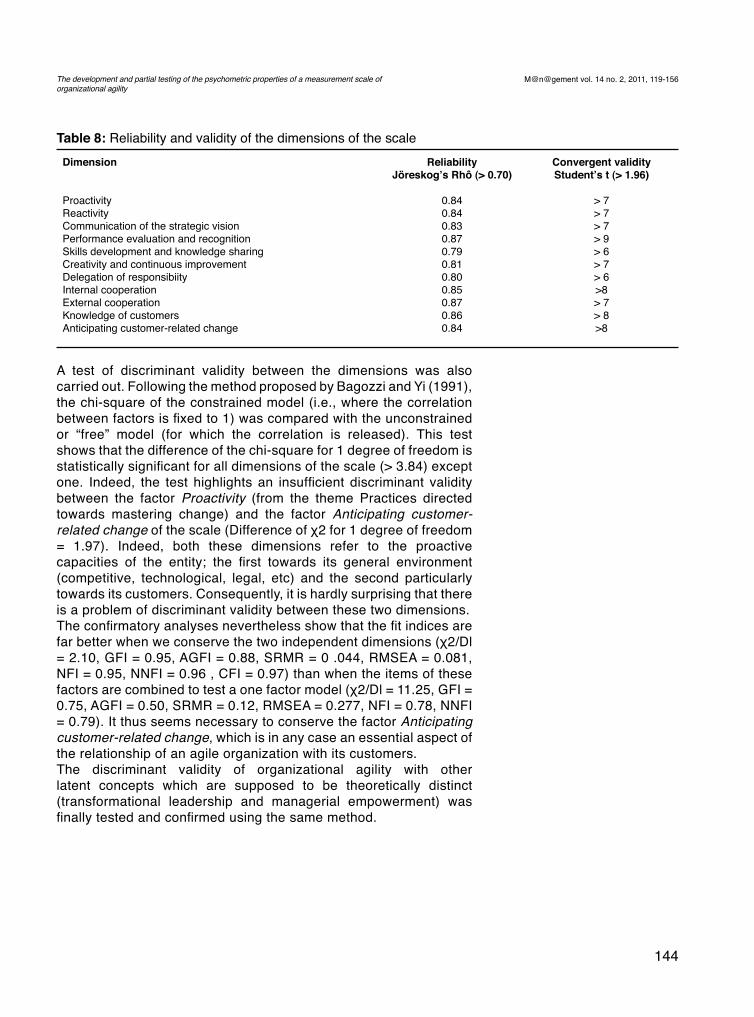
144
The development and partial testing of the psychometric properties of a measurement scale of organizational agility
M@n@gement vol. 14 no. 2, 2011, 119-156
Table 8: Reliability and validity of the dimensions of the scaleDimension
ProactivityReactivityCommunication of the strategic vision Performance evaluation and recognitionSkills development and knowledge sharingCreativity and continuous improvement Delegation of responsibiity Internal cooperation External cooperation Knowledge of customersAnticipating customer-related change
ReliabilityJöreskog’s Rhô (> 0.70)
0.840.840.830.870.790.810.800.850.870.860.84
Convergent validityStudent’s t (> 1.96)
> 7> 7> 7> 9> 6> 7> 6>8> 7> 8>8
A test of discriminant validity between the dimensions was also carried out. Following the method proposed by Bagozzi and Yi (1991), the chi-square of the constrained model (i.e., where the correlation between factors is fixed to 1) was compared with the unconstrained or “free” model (for which the correlation is released). This test shows that the difference of the chi-square for 1 degree of freedom is statistically significant for all dimensions of the scale (> 3.84) except one. Indeed, the test highlights an insufficient discriminant validity between the factor Proactivity (from the theme Practices directed towards mastering change) and the factor Anticipating customer-related change of the scale (Difference of χ2 for 1 degree of freedom = 1.97). Indeed, both these dimensions refer to the proactive capacities of the entity; the first towards its general environment (competitive, technological, legal, etc) and the second particularly towards its customers. Consequently, it is hardly surprising that there is a problem of discriminant validity between these two dimensions. The confirmatory analyses nevertheless show that the fit indices are far better when we conserve the two independent dimensions (χ2/Dl = 2.10, GFI = 0.95, AGFI = 0.88, SRMR = 0 .044, RMSEA = 0.081, NFI = 0.95, NNFI = 0.96 , CFI = 0.97) than when the items of these factors are combined to test a one factor model (χ2/Dl = 11.25, GFI = 0.75, AGFI = 0.50, SRMR = 0.12, RMSEA = 0.277, NFI = 0.78, NNFI = 0.79). It thus seems necessary to conserve the factor Anticipating customer-related change, which is in any case an essential aspect of the relationship of an agile organization with its customers.The discriminant validity of organizational agility with other latent concepts which are supposed to be theoretically distinct (transformational leadership and managerial empowerment) was finally tested and confirmed using the same method.
145
Audrey CHARBONNIER-VOIRINM@n@gement vol. 14 no. 2, 2011, 119-156
DISCUSSION
Theoretical contributionsDespite the enthusiasm of several researchers and practitioners for organizational agility, very little work has in fact focused on the construct as a whole; research has mostly been limited to proposing measurement tools and potential means of modelization. For this reason, the influence of organizational agility on various organizational variables, mainly organizational efficiency and performance, has remained largely hypothetical. This paper seeks to make up for the main gaps in existing studies by attempting to integrate the various theoretical contributions in an attempt to bring some precision to the concept of agility. This is therefore an essential first step towards a better understanding of the concept, and makes it possible to clarify the multidimensional construct of organizational agility, in particular by means of a qualitative study, with the aim of offering a measurement scale likely to represent the practices which contribute to developing the agile firm’s capabilities of reactivity, reading the market, and organizational learning. Although it remains necessary to check the stability of the structure of this scale on other samples (firms from other sectors of activity and/or from other countries in particular), at this stage in its development the scale shows satisfactory psychometric qualities. A rich and coherent set of eleven dimensions, yielded over two independent samples (N1=102 et N2=135), allows for the merging and synthesizing of hitherto disparate and fragmented contributions from the literature devoted to organizational agility, while also making certain neglected aspects of the concept more specific. The exploratory factor analyses show that the scale presents a highly satisfactory level of reliability. The confirmatory analyses, carried out using the method of structural equations, reveals a good fit with the collected data as well as the convergent and discriminant validity of the scale’s dimensions. This tool thus opens the way for new research on organizational agility. More specifically, it may constitute the starting point for a renewed theoretical and empirical reflection on its origins and consequences; this could be undertaken in ways which differentiate between each dimension by taking into account the multi-dimensionality of the construct. This tool could be used to predictive ends, and thus favor empirical research on the explicative power of organizational agility.
Practical implicationsOur results are also likely to interest practitioners, essentially in the area of organizational audit. It could allow for the construction of a pragmatic tool for organizational diagnosis, a tool which would represent the essential characteristics of the agile firm and thus make it possible to evaluate the mode of functioning of a firm seeking to develop towards this model. The themes covered seem to be of a sufficient level of abstraction for the tool to be generalized to organizations of various sizes and activity sectors.
146
The development and partial testing of the psychometric properties of a measurement scale of organizational agility
M@n@gement vol. 14 no. 2, 2011, 119-156
In terms of its practical uses, this tool makes it possible to ask key questions at the level of organizational functioning to evaluate a firm’s current degree of organizational agility and envisage changes to increase this. The scale thus offers a way of determining the internal strengths and weaknesses of a firm facing a chaotic environment and wishing to evolve towards an agile organization model. In particular, it is an opportunity either to ensure the efficiency of deployment or to point up potential brakes on the successful implementation of a current or future project for organizational change (for example, underdeveloped practices for promoting the value of human resources, a lack of clarity in internal communication of strategic orientations, the organizational means which need to be developed to improve teams’ reactivity and proactivity, and weaknesses as to knowledge of internal or external clients). The fact that the scale was created with a view to being informed by leaders (or managers) of different entities within firms also makes it possible to obtain a more precise diagnosis adapted to the specific challenges of different departments or work teams. The synthesis of results firstly involves aggregating the responses of the interviewees to establish a score for each of the dimensions. This score makes it possible to evaluate the organization’s agility potential and to point out the gaps representing the distance between the organization and the ideal type (Weber, 1965). The diagnosis also makes it necessary to study the individual responses in order to judge the homogeneity and coherence of the organizational practices implemented within the different operational entities. The results must then be discussed with directors and those in charge in order to point to “critical areas”, establish their causes and envisage potential levers for improvement depending on the objectives for the firm’s development.
Limitations and Future ResearchThis work offers a generic measurement scale for organizational agility whose content has yet to be adapted or specified depending on the particularities of the firm in which it is used. It also needs to be accompanied by reflection on the challenges facing the participating organization and the practices implemented in response to them (in terms of the size of firm, sector of activity, culture, customers, and the country (or countries) of implantation, for example). Moreover, although the results encourage us to think that the scale created is a satisfactory tool for evaluating organizational agility, there remain uncertainties as to whether this tool manages to capture every facet likely to represent the construct. In particular, the theoretical factor Employee participation in the decision-making processes could only be retained as a completely separate dimension after the factor analyses, although items referring to this notion remain in the final scale (notably concerning the participation of employees in continuous improvement processes). Regarding this result, the analyses seem firstly to reveal that employee participation in decision-making processes is cross-cutting, through the attachment of certain items to several factors. Employee participation can indeed take different forms (Cotton, et al., 1988) and express itself
147
Audrey CHARBONNIER-VOIRINM@n@gement vol. 14 no. 2, 2011, 119-156
at several levels (towards work, the department, the organization: see for example Bakan, et al., 2004). In this respect, it would be relevant for future research to integrate new items representing these different levels and forms of participation. Thus, certain items could enrich the existing dimensions (for example, concerning employee participation in processes of continuous improvement and innovation, or about employee involvement in the process of organizational learning, especially through knowledge sharing and skill development). Regarding the different levels of participation, and in order to remain coherent with the orientation of the questionnaire, which evaluates the implementation of a set of practices within each entity of the organization (team or department), it would be useful for items to seek to measure employee participation in decision-making processes inherent to their own department or team and concerning their work (with items measuring the influence of employees on decisions relating to their work or within their team or department). With regard to more strategic decision-making processes related to the organization (future plans and firm development), it would seem pertinent to evaluate the participation of the whole of an operational unit rather than that of individual employees. “Real” strategic decision making is in fact usually carried out by the board of directors and heads of different operational units (Barrand, 2006). Employee participation at this level would rather be exercised informally and indirectly (Cotton, et al., 1988) via those in charge, who act somewhat as spokesmen for the entity for which they are responsible.It seems that additional research is necessary for understanding organizational agility, and in particular its underlying practices. More specifically, one or several case studies could be useful for reflecting on the conditions under which the model’s propositions could be applied. Such case studies would certainly provide explanations to possible contradictions or tensions inside the described mechanisms (for example the “desired” or possible degree of employee involvement in the strategic decision-making process, as well as the tools and means set up to organize their participation, the limit between efficient communication and a phenomenon of over-information harmful to the firm’s functioning, the optimal frequency of manager feedback to employees in order to align time constraints with efficiency, the durable effects of non-monetary recognition on personnel motivation, and the influence of the activity sector on the practices implemented). It is also essential to note that different “levels” of agility exist, one of which is the behavioral level represented by the agile behaviors of individuals (Amos, 2000; Breu, et al., 2001; Dyer & Shafer, 2003; Joroff, et al., 2003; Goldman, et al., 1995; Shafer, 1997; Van Oyen, et al., 2001). “A company is agile if its decision-making process is agile and if the principles of agility are widely accepted and shared. This must crystallize into agile behaviors” (Barrand, 2006: 130-131). One of the basic postulates is that it is the individuals who make up the firm who contribute to the development of the three capacities of reading the market, mobilizing rapid response and embedding organizational learning; they do this by adopting behaviors which demonstrate their
148
The development and partial testing of the psychometric properties of a measurement scale of organizational agility
M@n@gement vol. 14 no. 2, 2011, 119-156
autonomy, adaptability and creativity (Amos, 2000; Dyer & Shafer, 2003; Goldman, et al., 1995; Shafer, 1997; Shafer, et al., 2001; Sherehiy, et al., 2007). The employees thus constitute the crucial element enabling the firm to increase its capacity of transformation and innovation. “The men and women making up the agile firm are - through their intimate knowledge of the customers and environment, their continuously sharpened savoir-faire, their imagination and the initiatives they are allowed to take to satisfy the customer in original ways - the main source of differentiation and performance of the firm” (Badot, 1999: 51). A particularly interesting avenue of research would thus be to evaluate at the same time organizational agility and behavioral agility in order to carry out a complete diagnosis of agility and determine the influence of agile practices on agile behaviors. Moreover, although this paper has responded to the initial objective of creating a reliable measurement tool for organizational agility, the nomological validity of the scale should be tested. It thus seems of utmost importance in future to examine possible links between agility and organizational performance or efficiency. Indeed, the literature on agility implies that it is an efficient, or perhaps even the most efficient, mean to face an environment of continuous change, complexity and uncertainty. However, such a postulate has not yet been tested and deserves to be the object of future research. The use of this scale could contribute by encouraging the carrying out of surveys making it possible to clarify the nomological network of organizational agility.
Audrey Charbonnier-Voirin is assistant professor of human resource management at INSEEC Bordeaux Business School. Her current research interests include people management and work performance, the role of line managers, and organizational agility.
Acknowledgements: I am grateful to the editor Philippe Monin and the reviewers for their insightful comments and the quality of their recommendations. I should also like to thank Assâad El Akremi, associate professor at Université de Toulouse 1 – Capitole (France), for his helpful assistance during the final stages of revision.
149
Audrey CHARBONNIER-VOIRINM@n@gement vol. 14 no. 2, 2011, 119-156
REFERENCES
. Anderson, J. C., & Gerbing, D. W. (1988). Structural equation modeling in practice: A review and recommended two-step approach. Psychological Bulletin, 103(3), 411-423.
. Amos, J. W. (1998). Transformation to agility: Manufacturing in the marketplace of unanticipated change. New York: Garland Publishing.
. Amos, J. W. (2000). Agility as an organizational competence. In R. Sanchez & A. Heene (eds.), Advances in Applied Business Strategy: Implementing competence-based strategies (pp.1-31). Greenwich, CT: JAI Press.
. Badot, O. (1999). Analyse critique de la théorie du « design organisationnel » : Le cas des sociétés de commercialisation de services de radiotéléphonie mobile de type GSM en France. Revue de gestion des ressources humaines, n° 29-30, 49-61.
. Bagozzi, R. P., & Yi, Y. (1991). Multitrait-multimethod matrices in consumer research. Journal of Consumer Research, 17(4), 426-439.
. Bakan, I., Suseno, Y., Pinnington, A., & Money, A. (2004). The influence of financial participation and participation in decision-making on employee job attitudes. International Journal of Human Resource Management, 15(3), 587-616.
. Barrand, J. (2006). Le Manager agile, Vers un nouveau management pour affronter la turbulence. Dunod, Paris.
. Breu, K., Hemingway, C. J., Strathern, M., & Bridger, D. (2001). Workforce agility: The new employee strategy for the knowledge economy. Journal of Information Technology, 17(1), 21-31.
. Burke, L. A., & Terry, B. (2004). At the intersection of economics and HRM: An argument for variable pay schemes. American Business Review, 22(1), 88-92.
. Charbonnier-Voirin, A. (2010). La dimension humaine de l’entreprise agile. Éditions Universitaires Européennes.
. Churchill, G. A. (1979). A paradigm for developing better measures of marketing constructs. Journal of Marketing Research, 16(1), 64-73.
. Cotton, J. L., Vollrath, D. A., Froggatt, K. L., Lengnick-Hall, M. L., & Jennings, K. R. (1988). Employee participation: diverse forms and different outcomes. Academy of Management Review, 13(1), 8-22.
. Dove, R. (2001). Response Ability: The Language, Structure, and Culture of the Agile Enterprise. New York: Wiley.
. Doz, Y., & Kosonen, M. (2007).Strategic renewal: Building strategic agility. International Strategic Management Society Conference. San Diego, CA.
. Dyer, L., & Shafer, R. A. (1999). From human resource strategy to organizational effectiveness: Lessons from research on organizational agility. In M. A. Wright, L. Dyer, J. Boudreau & G. Milkovich, Strategic human resource management in the 21st century, Research in Personnel and Human Resource Management, Supplement 4 (pp. 145-174). Greenwich, CT: JAI Press.
. Dyer, L., & Shafer, R. A. (2003). Dynamic organizations: Achieving marketplace and organizational agility with people. Working Paper, Cornell University.
. El Akremi, A., & Devos, V. (2004). Flexibilité et gestion des compétences : Dualité des nouveaux modes de régulation. In A. El Akremi & M. De Nanteuil-Miribel, La société flexible :travail, emploi, organisation en débat (pp. 243-266). Paris : Editions Erès.
. Evrard, Y., Pras, B., Roux, E., Choffray, J. M., & Dussaix, A. M. (1997). Market, études et recherches en marketing, fondements, méthodes. Paris : Nathan.
. Gerbing, D. W., & Anderson, J. C. (1988). An updated paradigm for scale development incorporating unidimensionality and its assessment. Journal of Marketing Research, 25(2), 186-192.
150
The development and partial testing of the psychometric properties of a measurement scale of organizational agility
M@n@gement vol. 14 no. 2, 2011, 119-156
. Goldman, S. L., Preiss, K. (Eds.), Nagel, R.N., & Dove, R. (1991). 21st Century Manufacturing Enterprise Strategy: An Industry-Led View (2 vol.). Bethlehem, PA: Iacocca Institute at Lehigh University.
. Goldman, S. L., & Nagel, R. N. (1993). Management, technology and agility: The emergence of a new era in manufacturing, International Journal of Technology Management, 8(1-2), 18-38.
. Goldman, S. L., Nagel, R. N., & Preiss, K. (1995). Agile competitors and virtual organizations: Strategies for enriching the customer. New York: Van Nostrand Reinhold.
. Gunasekaran, A. (1999). Agile manufacturing: A framework for research and development. International Journal of Production Economics, 62(1-2), 87-105.
. Jamrog, J. J., McCann, J. E., Lee, J. M., Morrison, C. L., Selsky, J. W., & Vickers, M. (2006). Agility and resilience in the face of continuous change: A global study of current Trends and future possibilities 2006-2016. New York: American Management Association.
. Joroff, M. L., Porter, W. L., Feinberg, B., & Kukla, C. (2003). The agile workplace. Journal of Corporate Real Estate, 5(4), 293-311.
. Kaiser, H. F. (1958). The varimax criterion for analytic rotation in factor analysis. Psychometrika, 23(3), 187-200.
. Kassim, N. M., & Zain, M. (2004). Assessing the measurement of Organizational Agility. The Journal of American Academy of Business, 4(1), 174-177.
. Kitapçi, H., & Sezen, B. (2007). The effects of participation in decision making, individual improvement efforts and training on the quality of the product design process. Production Planning & Control, 11(1), 3-8.
. Kidd, P. T. (1994). Agile Manufacturing: Forging New Frontiers. Reading, MA: Addison-Wesley.
. Lin, C. T., Chiu, H., & Chu, P. Y. (2006). Agility index in the supply chain. International Journal of Production Economics, 100(2), 285-299.
. Locke, E., Alavi, M., & Wagner, J. A. (1997). Participation in decision making: an information exchange perspective. In G. R. Ferris (Ed.), Research in Personnel and Human Resource Management, 15, 293-331.
. Long, C. (2000). Measuring your strategic agility: A checklist. Consulting to Management, 11(3), 25-28.
. MacCallum, R. C., Widaman, K. F., Zhang, S., & Hong, S. (1999). Sample size in factor analysis. Psychological Methods, 4, 84-89.
. Mates, G., Gundry, J., & Bradish, P. (1998). Agile Networking: Competing through the Internet and Intranets. Upper Saddle River, NJ: Prentice Hall PTR.
. Miles, M. B., & Huberman, M. (1991). Analyse des données qualitatives : Recueil de nouvelles méthodes. Bruxelles: De Boeck Université.
. Pereira, G. M., & Osburn, H. G. (2007). Effects of participation in decision making on performance and employee attitudes: A quality circles meta-analysis. Journal of Business & Psychology, 22(2), 145-153.
. Romelaer, P. (2005). L’entretien de recherche. In P. Roussel & F. Wacheux, Management des Ressources Humaines : Méthodes de recherche en sciences humaines et sociales (Chapitre 4, pp. 101-134). Bruxelles : De Boeck.
. Roussel, P. (1996). Rémunération, motivation et satisfaction au travail. Paris : Economica.
. Roussel, P., Durrieu, F., Campoy, E., & El Akremi, A. (2002), Méthodes d’équations structurelles : Recherche et applications en gestion. Paris : Economica.
. Roussel, P. (2005). Méthodes de développement d’échelles pour questionnaires d’enquête. In P. Roussel & F. Wacheux., Management des Ressources Humaines : Méthodes de recherche en sciences humaines et sociales (pp. 245-276). Bruxelles : De Boeck.
151
Audrey CHARBONNIER-VOIRINM@n@gement vol. 14 no. 2, 2011, 119-156
. Sanchez, L. M., & Nagi, R. (2001). A review of agile manufacturing systems. International Journal of Production Research, 39(16), 3561-3600.
. Shafer, R. A. (1997). Creating organizational agility: The human resource dimension. Unpublished Ph.D. dissertation, Cornell University.
. Shafer, R. A., Dyer, L., Kilty, J., Amos, J., & Ericksen, J. (2001). Crafting a human resources strategy to foster organizational agility: A case study. Human Resource Management, 40(3), 197-211.
. Sharifi, H., & Zhang, Z. (1999). A methodology for achieving agility in manufacturing organisations: An introduction. International Journal of Production Economics, 62(1-2), 7-22.
. Sharifi, H., Barclay, I., Colqhoun, G., & Dann, Z. (2001). Agile manufacturing: A management and operational framework. Journal of Engineering Manufacture, 215(6), 857-869.
. Sharp, J. M., Irani, Z., & Desai, S. (1999). Working towards agile manufacturing in the UK industry. International Journal of Production Economics, 62(1-2), 155-169.
. Sherehiy, B., Karwowski, W., & Layer, J. K. (2007). A review of enterprise agility: Concepts, frameworks, and attributes. International Journal of Industrial Ergonomics, 37(5), 445-460.
. Schneider, B., & Reichers, A. E. (1983). On the etiology of climates. Personnel Psychology, 36(1), 19-39.
. Tsourveloudis, N. C., & Valavanis, K. P. (2002). On the measurement of enterprise agility. Journal of Intelligent and Robotic Systems, 33(3), 329-342.
. Van Hoek, R. I., Harrison, A., & Christopher, M. (2001).Measuring agile capabilities in the supply chain. International Journal of Operations and Production Management, 21(1-2), 126-147.
. Van Oyen, M. P., Gel, E. G. S, & Hopp, W. J (2001). Performance opportunity for workforce agility in collaborative and noncollaborative work system. IIE Transactions, 33(9), 761-778.
. Weber, M. (1965). Essais sur la théorie de la science (1904-1917). Paris, Plon.
. Wright, P. M., & Snell, S. A. (1998). Toward a unifying framework for exploring fit and flexibility in strategic human resource management. Academy of Management Review, 23(4), 756-772.
. Yusuf, Y. Y., Sarhadi, M., & Gunasekaran, A. (1999). Agile manufacturing: The drivers, concepts and attributes. International Journal of Production Economics, 62(1-2), 33-43.
. Yusuf, Y. Y., & Adeleye, E. O. (2002). A comparative study of lean and agile manufacturing with related survey of current practices in the UK. International Journal of Production Research, 40(17), 4545-456.
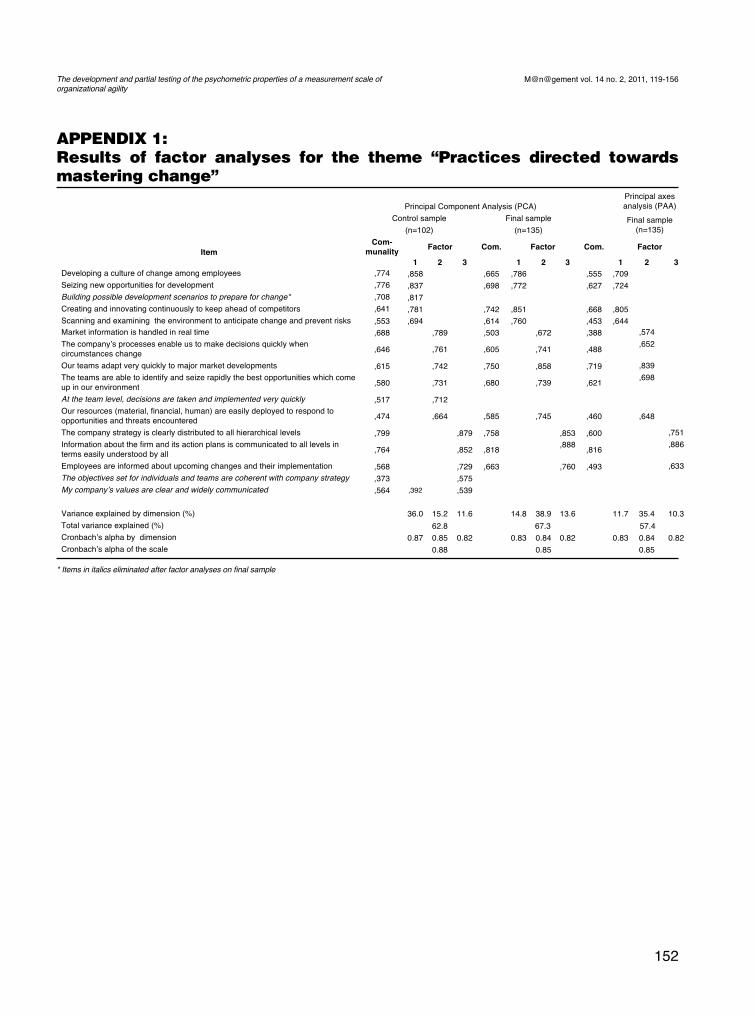
152
The development and partial testing of the psychometric properties of a measurement scale of organizational agility
M@n@gement vol. 14 no. 2, 2011, 119-156
APPENDIX 1: Results of factor analyses for the theme “Practices directed towards mastering change”
*Itemsinitalicseliminatedafterfactoranalysesonfinalsample
Appendix 1: Results of factor analyses for the theme “Practices directed towards mastering change” * Items in italics eliminated after factor analyses on final sample
Principal Component Analysis (PCA)
Principal axes
analysis (PAA)
Control sample
(n=102)
Final sample
(n=135)
Final sample
(n=135)
Com-
munality Factor Com. Factor Com. Factor
Item
1 2 3 1 2 3 1 2 3
Developing a culture of change among employees ,774 ,858 ,665 ,786 ,555 ,709
Seizing new opportunities for development ,776 ,837 ,698 ,772 ,627 ,724
Building possible development scenarios to prepare for change* ,708 ,817
Creating and innovating continuously to keep ahead of competitors ,641 ,781 ,742 ,851 ,668 ,805
Scanning and examining the environment to anticipate change and prevent risks ,553 ,694 ,614 ,760 ,453 ,644
Market information is handled in real time ,688 ,789 ,503 ,672 ,388 ,574
The company!s processes enable us to make decisions quickly when
circumstances change ,646 ,761 ,605 ,741 ,488
,652
Our teams adapt very quickly to major market developments ,615 ,742 ,750 ,858 ,719 ,839
The teams are able to identify and seize rapidly the best opportunities which come
up in our environment ,580 ,731 ,680 ,739
,621
,698
At the team level, decisions are taken and implemented very quickly ,517 ,712
Our resources (material, financial, human) are easily deployed to respond to
opportunities and threats encountered ,474 ,664 ,585 ,745 ,460 ,648
The company strategy is clearly distributed to all hierarchical levels ,799 ,879 ,758 ,853 ,600 ,751
Information about the firm and its action plans is communicated to all levels in
terms easily understood by all ,764 ,852 ,818
,888
,816
,886
Employees are informed about upcoming changes and their implementation ,568 ,729 ,663 ,760 ,493 ,633
The objectives set for individuals and teams are coherent with company strategy ,373 ,575
My company!s values are clear and widely communicated ,564 ,392 ,539
Variance explained by dimension (%)
36.0
15.2
11.6
14.8
38.9
13.6
11.7
35.4
10.3
Total variance explained (%) 62.8 67.3 57.4
Cronbach!s alpha by dimension 0.87 0.85 0.82 0.83 0.84 0.82 0.83 0.84 0.82
Cronbach!s alpha of the scale 0.88 0.85 0.85
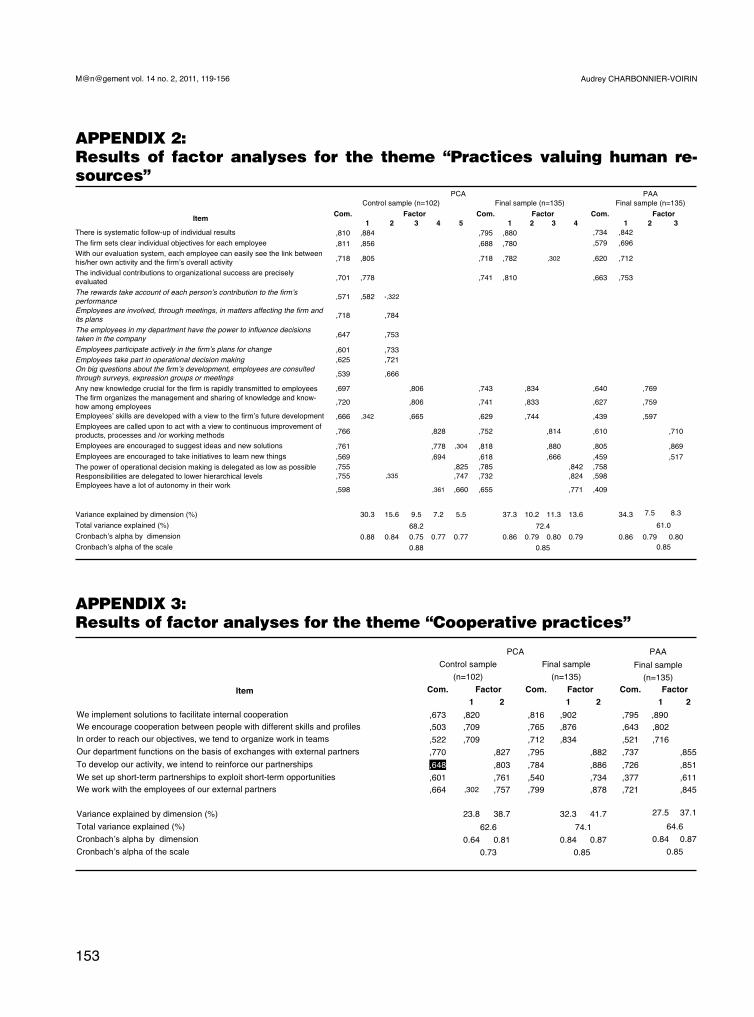
153
Audrey CHARBONNIER-VOIRINM@n@gement vol. 14 no. 2, 2011, 119-156
APPENDIX 2: Results of factor analyses for the theme “Practices valuing human re-sources”
APPENDIX 3: Results of factor analyses for the theme “Cooperative practices”
Appendix 2: Results of factor analyses for the theme “Practices valuing human resources”
PCA PAA
Control sample (n=102) Final sample (n=135) Final sample (n=135)
Com. Factor Com. Factor Com. Factor Item
1 2 3 4 5 1 2 3 4 1 2 3 4
There is systematic follow-up of individual results ,810 ,884 ,795 ,880 ,734 ,842
The firm sets clear individual objectives for each employee ,811 ,856 ,688 ,780 ,579 ,696
With our evaluation system, each employee can easily see the link between
his/her own activity and the firm!s overall activity ,718 ,805 ,718 ,782 ,302 ,620 ,712
The individual contributions to organizational success are precisely
evaluated ,701 ,778 ,741 ,810 ,663 ,753
The rewards take account of each person!s contribution to the firm!s
performance ,571 ,582 -,322
Employees are involved, through meetings, in matters affecting the firm and
its plans ,718 ,784
The employees in my department have the power to influence decisions
taken in the company ,647 ,753
Employees participate actively in the firm!s plans for change ,601 ,733
Employees take part in operational decision making ,625 ,721
On big questions about the firm!s development, employees are consulted
through surveys, expression groups or meetings ,539 ,666
Any new knowledge crucial for the firm is rapidly transmitted to employees ,697 ,806 ,743 ,834 ,640 ,769
The firm organizes the management and sharing of knowledge and know-
how among employees ,720 ,806 ,741 ,833 ,627
,759
Employees! skills are developed with a view to the firm!s future development ,666 ,342 ,665 ,629 ,744 ,439 ,597
Employees are called upon to act with a view to continuous improvement of
products, processes and /or working methods ,766 ,828 ,752 ,814 ,610
,710
Employees are encouraged to suggest ideas and new solutions ,761 ,778 ,304 ,818 ,880 ,805 ,869
Employees are encouraged to take initiatives to learn new things ,569 ,694 ,618 ,666 ,459 ,517
The power of operational decision making is delegated as low as possible ,755 ,825 ,785 ,842 ,758 ,838
Responsibilities are delegated to lower hierarchical levels ,755 ,335 ,747 ,732 ,824 ,598 ,742
Employees have a lot of autonomy in their work
,598 ,361 ,660 ,655 ,771 ,409
,599
Variance explained by dimension (%)
30.3
15.6
9.5
7.2
5.5
37.3
10.2
11.3
13.6
34.3
7.5
8.3
10.9
Total variance explained (%) 68.2 72.4 61.0
Cronbach!s alpha by dimension 0.88 0.84 0.75 0.77 0.77 0.86 0.79 0.80 0.79 0.86 0.79 0.80 0.79
Cronbach!s alpha of the scale 0.88 0.85 0.85
Appendix 3: Results of factor analyses for the theme “Cooperative practices”
PCA PAA
Control sample
(n=102)
Final sample
(n=135)
Final sample
(n=135)
Com. Factor Com. Factor Com. Factor Item
1 2 1 2 1 2
We implement solutions to facilitate internal cooperation ,673 ,820 ,816 ,902 ,795 ,890
We encourage cooperation between people with different skills and profiles ,503 ,709 ,765 ,876 ,643 ,802
In order to reach our objectives, we tend to organize work in teams ,522 ,709 ,712 ,834 ,521 ,716
Our department functions on the basis of exchanges with external partners ,770 ,827 ,795 ,882 ,737 ,855
To develop our activity, we intend to reinforce our partnerships ,648 ,803 ,784 ,886 ,726 ,851
We set up short-term partnerships to exploit short-term opportunities ,601 ,761 ,540 ,734 ,377 ,611
We work with the employees of our external partners ,664 ,302 ,757 ,799 ,878 ,721 ,845
Variance explained by dimension (%)
23.8
38.7
32.3
41.7
27.5
37.1
Total variance explained (%) 62.6 74.1 64.6
Cronbach!s alpha by dimension 0.64 0.81 0.84 0.87 0.84 0.87
Cronbach!s alpha of the scale 0.73 0.85 0.85
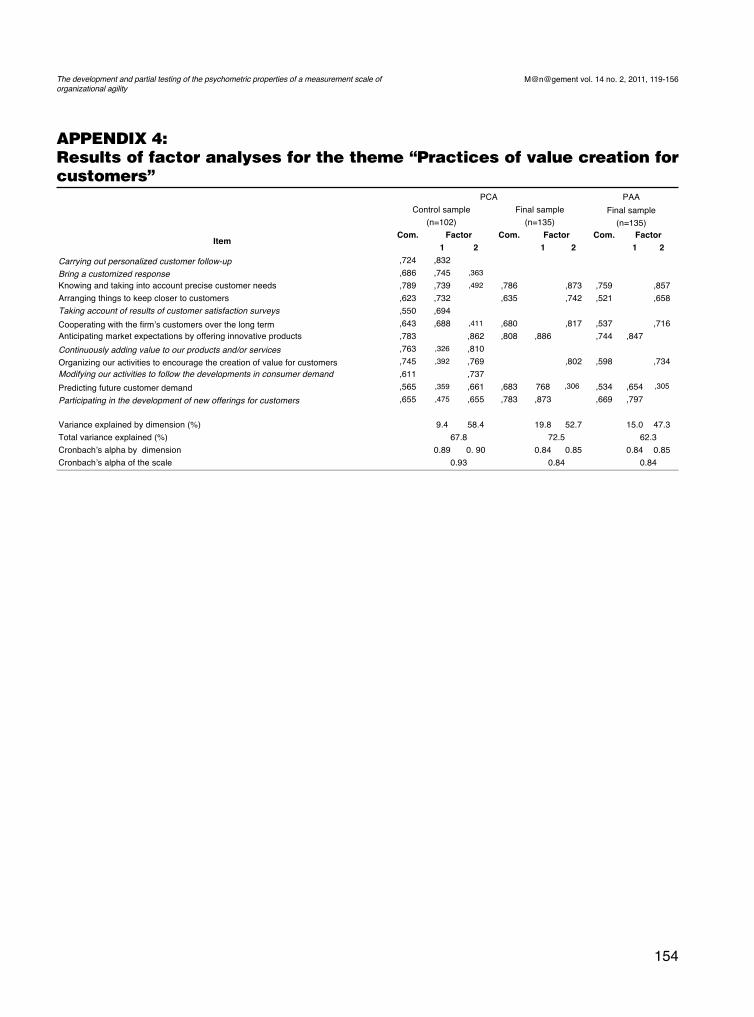
154
The development and partial testing of the psychometric properties of a measurement scale of organizational agility
M@n@gement vol. 14 no. 2, 2011, 119-156
APPENDIX 4: Results of factor analyses for the theme “Practices of value creation for customers”
Appendix 4: Results of factor analyses for the theme “Practices of value creation for customers”
PCA PAA
Control sample
(n=102)
Final sample
(n=135)
Final sample
(n=135)
Factor Com. Factor Com. Factor Item
Com.
1 2 1 2 1 2
Carrying out personalized customer follow-up ,724 ,832
Bring a customized response ,686 ,745 ,363
Knowing and taking into account precise customer needs ,789 ,739 ,492 ,786 ,873 ,759 ,857
Arranging things to keep closer to customers ,623 ,732 ,635 ,742 ,521 ,658
Taking account of results of customer satisfaction surveys ,550 ,694
Cooperating with the firm!s customers over the long term ,643 ,688 ,411 ,680 ,817 ,537 ,716
Anticipating market expectations by offering innovative products ,783 ,862 ,808 ,886 ,744 ,847
Continuously adding value to our products and/or services ,763 ,326 ,810
Organizing our activities to encourage the creation of value for customers ,745 ,392 ,769 ,802 ,598 ,734
Modifying our activities to follow the developments in consumer demand ,611 ,737
Predicting future customer demand ,565 ,359 ,661 ,683 768 ,306 ,534 ,654 ,305
Participating in the development of new offerings for customers ,655 ,475 ,655 ,783 ,873 ,669 ,797
Variance explained by dimension (%)
9.4
58.4
19.8
52.7
15.0
47.3
Total variance explained (%) 67.8 72.5 62.3
Cronbach!s alpha by dimension 0.89 0. 90 0.84 0.85 0.84 0.85
Cronbach!s alpha of the scale 0.93 0.84 0.84

155
Audrey CHARBONNIER-VOIRINM@n@gement vol. 14 no. 2, 2011, 119-156

156
The development and partial testing of the psychometric properties of a measurement scale of organizational agility
M@n@gement vol. 14 no. 2, 2011, 119-156