Embed Size (px)
Citation preview
Name
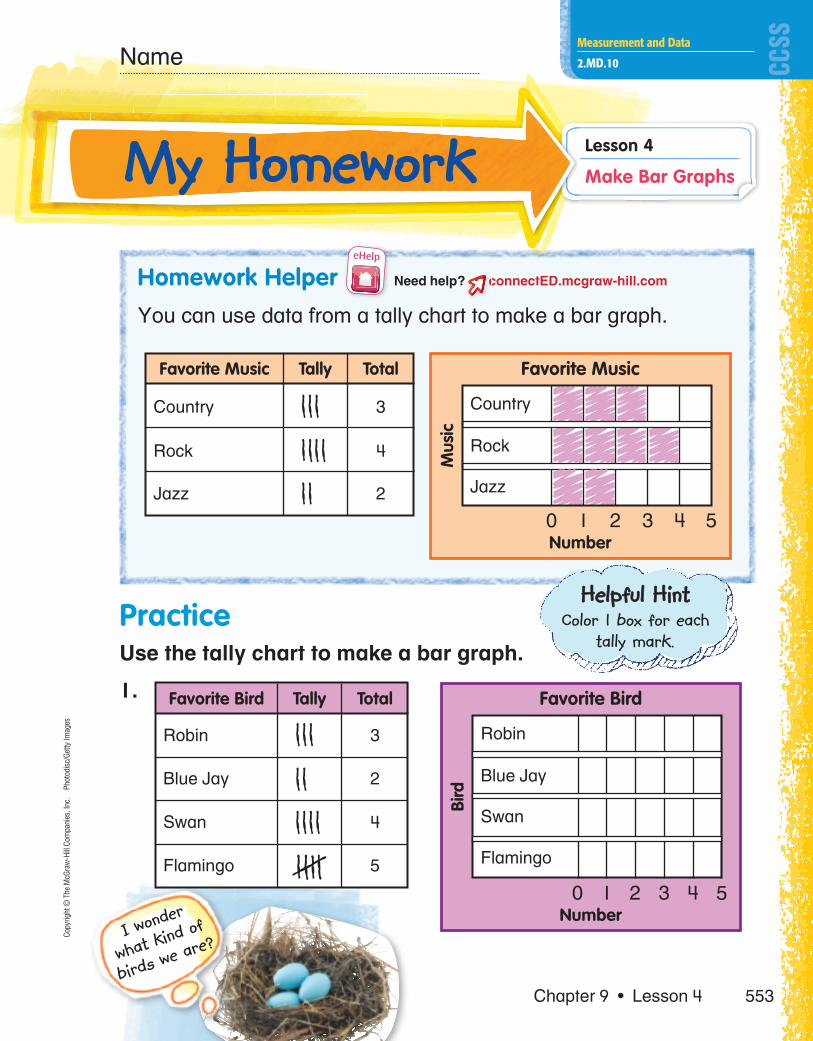
Make Bar Graphs s
Lesson 4My HomeworkMy Homework
Homework Helper Need help? connectED.mcgraw-hill.com
You can use data from a tally chart to make a bar graph.
Country 3
Rock
Jazz
Tally TotalFavorite Music
4
2
Jazz
Rock
Country
Favorite Music
0 1 2 3 4 5
Mus
ic
Number
eHelp
c
PracticeUse the tally chart to make a bar graph.
1.
Robin 3
Blue Jay
Swan
Tally TotalFavorite Bird
2
4
Flamingo 5
Swan
Flamingo
Blue Jay
Robin
Favorite Bird
0 1 2 3 4 5
Bird
NumberI wonde
r
what kind o
f
birds we are
?
Helpful HintHelpful HintColor 1 box for each
tally mark.
Chapter 9 • Lesson 4 553
Copy
right
© T
he M
cGra
w-H
ill Co
mpa
nies
, Inc
. Ph
otod
isc/
Getty
Imag
es
Measurement and Data
2.MD.10
553_554_C09_L04_116069.indd 553553_554_C09_L04_116069.indd 553 6/1/11 8:06 AM6/1/11 8:06 AM

Math at Home Help your child make a bar graph of the type of weather
he or she sees for a week.
Use the tally chart to make a bar graph.
2.
Red 4
Blue
Pink
Tally TotalFavorite Color
5
4
Green 2
Pink
Green
Blue
Red
Favorite Color
0 1 2 3 4 5
Colo
r
Number
Use the data to fill in the bar graph.
3. 15 people voted on their
favorite field trip. 2 voted for
the symphony. 5 voted for
the zoo. The same number
voted for the museum and
the aquarium.
Aquarium
Symphony
Zoo
Museum
Field Trip
0 1 2 3 4 5
Fiel
d Tr
ip
Number
Vocabulary CheckVocab
4. Circle the bar graph.
Chocolate 5
White
Strawberry
Tally TotalFavorite Milk
2
3
Favorite Vacation
Beach
Camping
Water park
Key: Each picture = 1 vote
Ketchup
Mustard
Onion
Favorite Topping
0 1 2 3 4 5
Topp
ing
Number
554 Chapter 9 • Lesson 4
Copy
right
© T
he M
cGra
w-H
ill Co
mpa
nies
, Inc
.
553_554_C09_L04_116069.indd 554553_554_C09_L04_116069.indd 554 1/22/13 9:51 AM1/22/13 9:51 AM