Embed Size (px)
Citation preview

February 2017
MMG Corporate Update

2
Disclaimer
The information contained in this presentation is intended solely for your personal reference and may not be reproduced, redistributed or passed on, directly or indirectly, to any other person (whether within or outside your organisation/firm) or published, in whole or in part, for any purpose. No representation or warranty express or implied is made as to, and no reliance should be placed on, the fairness, accuracy, completeness or correctness of the information or opinions contained in this presentation. It is not the intention to provide, and you may not rely on this presentation as providing, a complete or comprehensive analysis of the Company’s financial or trading position or prospects. The information contained in this presentation should be considered in the context of the circumstances prevailing at the time and has not been, and will not be, updated to reflect material developments which may occur after the date of the presentation. None of the Company nor any of its respective affiliates, advisors or representatives shall have any liability whatsoever (in negligence or otherwise) for any loss or damage howsoever arising from any use of this presentation or its contents or otherwise arising in connection with this presentation.
This presentation includes forward-looking statements. Forward-looking statements include, but are not limited to, the company’s growth potential, costs projections, expected infrastructure development, capital cost expenditures, market outlook and other statements that are not historical facts. When used in this presentation, the words such as "could," “plan," "estimate," "expect," "intend," "may," "potential," "should," and similar expressions are forward-looking statements. Although MMG believes that the expectations reflected in these forward-looking statements are reasonable, such statements involve risks and uncertainties and no assurance can be given that actual results will be consistent with these forward-looking statements.
This presentation may contain certain information derived from official government publications, industry sources and third parties. While we believe inclusion of such information is reasonable, such information has not been independently verified by us or our advisers, and no representation is given as to its accuracy or completeness.
This presentation does not constitute an offer or invitation to purchase or subscribe for any securities in the United States or any other jurisdiction and no part of it shall form the basis of or be relied upon in connection with any contract, commitment or investment decision in relation thereto, nor does this presentation constitute a recommendation regarding the securities of the Company. This presentation is not for distribution in the United States. Securities may not be offered or sold in the United States absent registration or exemption from registration under the US Securities Act. There will be no public offering of the Company’s securities in the United States.

1. MMG Overview
2. Company Highlights
3. Appendix
a) 4Q 2016 Production Report
b) 1H 2016 Interim Results
c) Mineral Resources and Ore Reserves
Contents
3

4
MMG Overview
An emerging copper major
Operations in Peru, Africa, Asia and Australia – including the world class Las Bambas asset
Industry leading ramp up at Las Bambas
Headquartered in Melbourne, with dual listing structure on the Hong Kong Exchange and ASX

5
Company Highlights
Las Bambas is a transformational and world class copper asset 1
Dugald River is one of the largest and high grade zinc development projects globally 2
Access to long-term debt and majority shareholder support – core competitive advantages 3
A history of operational excellence – continue to raise the bar 4
Core commodities have attractive long-term outlook – copper and zinc 5
Leading international management team with sound corporate governance 6

1. MMG Overview

1.00
1.50
2.00
2.50
3.00
3.50
Feb-16 Apr-16 Jun-16 Aug-16 Oct-16 Dec-16
MMG (1208-HK) LME Copper (rebased) LME Zinc (rebased)
Overview of MMG
1. Market data as at 24 February 2017 2. Based off closing share price of HK$2.05 per share and HKDUSD exchange rate of 0.1290 (as at 1
November 2016) 3. Assumes total borrowings (including prepayments) of US$10,405 million and cash and cash equivalents
of US$216 million (as at 30 June 2016)
MMG is a mid-tier global resources company that mines, explores and develops base metals projects around the world.
Overview
Founded in 2009, MMG is a diversified base metals company with four operating mines and one development project located across four continents
Headquartered in Melbourne (Australia), with a primary listing on the HKEx (1208 HK) and a secondary listing on the ASX (MMG ASX)
Primary exposure to copper and zinc, with smaller exposures to gold, silver, lead and molybdenum
MMG’s flagship asset, the Las Bambas copper mine, reached commercial production on 1 July 2016 and is expected to be world’s seventh largest copper mine by 2017
Share Price HK$3.44
Shares Outstanding 7,935m
Market Capitalisation US$3,518m
Net Debt3 US$10,189m
Enterprise Value US$13,707m
Share price performance (last 12 months1) Rebased to MMG (HK$)
Shareholder base
Capitalisation summary
73.7%
11.7%
12.2%
2.4%
China Minmetals Corporation
Private investors
Institutional investors
Corporate stakeholders
+132%
+62%
+27%
7

Overview of portfolio
We have a globally diversified portfolio of base metals producing and development projects
8
AUSTRALIA
OPERATIONS
DEVELOPMENT PROJECTS
CORPORATE OFFICES
LAOS
DRC SOUTH AMERICA
KINSEVERE
ROSEBERY
HONG KONG
DUGALD RIVER
SEPON
JOHANNESBURG LAS BAMBAS
MELBOURNE
VIENTIANE
HIGH LAKE
IZOK LAKE
LAS BAMBAS 2017 production guidance: 420,000 – 460,000 tonnes of copper in copper concentrate 2017 C1 guidance: US$0.85 – US$0.95/lb
KINSEVERE 2017 production guidance: 75,000 – 80,000 tonnes of copper cathode 2017 C1 guidance: US$1.30 – US$1.45/lb
SEPON 2017 production guidance: 65,000 – 75,000 tonnes of copper cathode 2017 C1 guidance: US$1.25 – US$1.40/lb
ROSEBERY 2017 production guidance: 65,000 – 75,000 tonnes of zinc in zinc concentrates and 18,000 – 25,000 tonnes of lead in lead concentrate 2017 Zinc C1 guidance: US$0.25 – US$0.35/lb

9
Emerging base metals player positioned for growth
1. Represents mid-point of 2017 peer company guidance. 2. Cash costs shown including by-product credits. Southern Copper and Hudbay do not provide cash cost guidance so based on most recent actuals.
2017 copper C1 cash cost guidance1, 2
US$/lb Cu
2017 copper production guidance1
Kt, Cu With the support of our majority shareholder, MMG’s objective is to be valued as one of the world’s top, mid-tier miners by 2020.
Overview
Continue to squeeze efficiencies from operations
Maintain tight cost focus to deliver shareholder returns
Las Bambas – commercial production achieved on 1 July 2016, with significant growth options
Dugald River – committed to developing project to deliver high quality exposure to zinc at a time of shrinking global supply
Will seek to improve share market liquidity and reduce gearing
Well positioned to invest in growth
0200400600800
1,0001,2001,4001,600
Free
port
McM
oRan
Sout
hern
Cop
per
Anto
faga
sta
Firs
tQ
uant
um
MM
G
Teck
Lund
in
Hud
bay
0.00
0.30
0.60
0.90
1.20
1.50
Teck
Lund
in
Anto
faga
sta
Firs
tQ
uant
um
Free
port
McM
oRan
MM
G
Hud
bay
Sout
hern
Cop
per

Our values: we mine for progress
1. Total Recordable Injury Frequency per million hours worked 2. Las Bambas safety data incorporated into MMG from January 2015
We place safety at the centre of everything we do and we believe that nothing is so important that it cannot be done safely
Safety our first value – TRIF1 of 1.9 per million hours worked in 2016 represents lowest yearly TRIF ever recorded
Fatality of contracted driver engaged by Las Bambas mine in Peru, following a road accident in July 2016. Fatality of contractor at Las Bambas mine site following uncontrolled release of water in December 2016
Member of International Council on Mining and Metals (ICMM) – committed to ICMM 10 principles of Sustainable Development
In 2015, MMG’s TRIF safety performance was the 4th highest of all ICMM members globally. Average TRIF for ICMM members was 5.13 per million hours worked
Global partnership with UNICEF for child rights/health, committed development partner with national governments
US$63.5 million investment in social development programs in 2015 – focus on Lao PDR, DRC and Peru
4.1
3.0
2.4 2.3 2.1 1.9
2011 2012 2013 2014 2015 2016
TRIF1,2
Safety performance
10

2. Company Highlights

12
Source: Wood Mackenzie Base Metals Markets Tool (Q4 2016) 1. Only includes mines producing copper as primary commodity
2017 forecast production capability1 Las Bambas is a transformational world class copper asset
Overview
Largest greenfield copper development in the past 10 years
Targeting 2 million tonnes of copper in copper concentrate production over first 5 years
Total project acquisition and construction cost of ~US$9.7 billion
Ownership: 62.5% MMG (operator), 22.5% Guoxin, 15.0% CITIC Metal
2016 production of 330,227 tonnes of copper in copper concentrate
2017 production guidance: 420,000 – 460,000 tonnes copper in copper concentrate
Long life asset: initial 20+ year mine life producing copper, gold, silver and molybdenum
Over 2 billion tonnes in copper ore resources
Exploration upside exists with only ~10% of the tenement explored
Las Bambas – size, scale and life 1
Contained copper ‘000 tonnes
0 250 500 750 1,000 1,250
Antamina
Chuquicamata
El Teniente
Las Bambas
Collahuasi
Cerro Verde
Buenavista(Cananea)
Morenci
PT FreeportIndonesia
Escondida

13
1. Production volumes include expected pre and post-commercial production volumes at Las Bambas 2. McNulty and MMG data 3. Large-scale greenfield copper development projects since 2013. Mid-point of guidance shown
Las Bambas reached 97% of design capacity in 6 months, coming in ahead of schedule and below cost guidance
McNulty curve for plant ramp up2 1st year production for greenfield copper project3
(guidance vs actual)
0
10
20
30
40
50
60
70
80
90
100
110
0 10 20 30 40
Des
ign
Perf
orm
ance
(%)
Time (months since commissioning)
Type 1
Type 2
Type 3
Type 4
MMG Values – We do what we say
1 Las Bambas – successful development
0
50
100
150
200
250
300
350
Cop
per (
kt)
Guidance Outcome

Bottom quartile costs achieved within 6 months progressing towards steady state C1 cost target of US$0.85 – 0.95/lb in 2017 Transport logistics chain identified as a key project risk1
All trucking operations were suspended twice during 2H16 due to separate safety and community unrest issues.
Transport capability delivered in line with rapid mine ramp up (740 tonnes per day of concentrate in January 2016, 3,000 tonnes per day in June 2016 and up to 5,000 tonnes per day in Nov/Dec 2016 to reduce inventory build up at site)
Regional unrest is likely to continue in Peru and may lead to temporary transport disruptions from time to time. Surplus trucking capacity will be maintained on stand-by so that any short term disruptions do not impact mine production.
Las Bambas – low cost position
14
1
Cost to Concentrate Freight TC/RC By-product credits C1 Cost
Breakdown of 2017 C1 cost guidance
Mining
Processing
Maintenance
Transport
G&A
US$0.85 – 0.95/lb
1. Temporary disruptions to the logistics chain from time to time are expected
Transport / logistics

Dugald River – size, scale and life
At full production Dugald River will be one of the ten largest zinc mines globally
Overview
Wholly-owned zinc deposit located in Queensland
Highest-grade zinc project currently being developed
Expected to commence first production in 1H CY18
MMG announced optimised mine plan in June 2016 which supports throughput of 1.7 Mtpa
Large scale and long life – annual production of 170 kt Zn over estimated 25 year mine life
Strong cash flow generation potential – steady state C1 costs of US$0.68 – 0.78/lb
Remaining capex of US$600 – 620m from July 2015
Project is 45% complete (as at 31 December16) with all major contractors mobilised on site and key milestones tracking in line with schedule
2019 forecast production capability1
2
Contained zinc ‘000 tonnes Source: a selection of top 12 zinc producers from the Wood Mackenzie Base Metals Markets Tool (Q4 2016) 1. Only includes mines producing zinc and lead as primary commodities
15
0 100 200 300 400 500 600
Tara
Gamsberg
Sindesar Khurd
Dugald River
Cerro Lindo
San Cristobal
McArthur River
Mount Isa Pb/Zn
Red Dog
Rampura-Agucha

16
Dugald River – high grade zinc project
Dugald River is a large, long life and high grade zinc project
Grade (%)
Source: Wood Mackenzie Base Metals Cost data (Q4 2016) and MMG estimates Note: Grade shown reflects average over life of mine and mine life reflects production profiles as per Wood Mackenzie estimates. Bubble size represents average annual zinc production. Dashed lines reflect restarted projects
2
Mine Life (years)
Dugald River
Dairi
Balmat Restart
Montana Tunnels Restart
Scotia Restart Shalkiya Restart
Asmara
Rey De Plata Restart
Prairie Creek
Tulsequah Gamsberg
Ozernoe Mehdiabad
Olympias
Citronen
Pilbara
Tala Hamza
Patricia (Paguanta)
Pine Point Restart
Khnaiguiyah
New Base Case Projects
New Probable / Possible Projects
Restarted Base Case Projects
Restarted Probable / Possible Projects
0
2
4
6
8
10
12
14
16
0 5 10 15 20 25

17
A core competitive advantage of MMG remains its access to long-term debt from Chinese banks and funding support from its majority shareholder (CMC1)
MMG's capital structure has a number of competitive advantages:
− Long dated, low cost debt sourced from Chinese government supported banks
− Debt servicing capacity benefits from attractive interest rates and long dated principal repayments in existing facilities
− Support from majority shareholder, CMC, including loans and guarantees
Capital markets flexibility through primary listing on HKEx and secondary listing on ASX
Debt repayment has commenced:
− US$300m of proceeds from Rights Issue used for early prepayment of corporate facility in December 2016
− Proceeds from sale of Golden Grove (~US$210m) will also be used to repay corporate debt facilities maturing in 2017
Long term debt – competitive advantage
1. China Minmetals Corporation
Las Bambas Acquisition Facility, 7 yrs, not exceeding LIBOR +3.3% Las Bambas Project Facility, 18 yrs, not exceeding LIBOR +3.55% Dugald River, 13 yrs MMG Corporate Debt
0
1,000
2,000
3,000
4,000
5,000
6,000
2017 2018 2019 - 2021 2022 - 2032
Amortisation schedule US$ million
3

18
Operational excellence – maximise asset utilisation
Operating approach is based on improving output by maximising asset utilisation
Summary
Squeeze the assets: operating approach targets consistent improvement in utilisation
Continue to raise the bar: improved Maximum Sustainable Production Rates (MSPR) each year
Las Bambas: Ramp up of greenfield project ahead of industry practice
− H1 2016 represented ramp up to nameplate capacity, and operating slightly above in H2
− Opportunity loss is now being measured against a target higher than nameplate as MSPR improved in Q3 and Q4
Kinsevere: Sustaining high utilisation of the MSPR (i.e. minimal opportunity loss)
− Maintained maximum asset utilisation to deliver another record annual production, well above nameplate capacity
145 tpd
218 tpd 222 tpd 238 tpd 238 tpd
2012 2013 2014 2015 2016Actual Production Opportunity Loss Nameplate
Las Bambas Asset Utilisation vs. MSPR
Kinsevere Asset Utilisation vs. MSPR
4
1130 tpd 1130 tpd 1368 tpd 1449 tpd
Q1 16 Q2 16 Q3 16 Q4 16Actual Production Opportunity Loss Nameplate

Executive team – global experience
Vice-President of China Minmetals Corporation (CMC) Chairman of China Minmetals Non-
ferrous Metals Company Limited (CMN) President of CMN Director of Hunan Nonferrous Metals
Holding Group Co., Ltd. (HNG)
25+ years of experience in the Natural Resources sectors CEO and MD Macmahon Holdings CFO Woodside Petroleum Senior financial roles BHP Billiton
30+ years mining experience in iron ore, gold, copper and nickel. CEO BHP Billiton Mitsubishi Alliance President BHP Billiton Nickel West President BHP Billiton Cerro Matoso
Nickel Senior operations roles Vale
Director of CMNH and Jiangxi Tungsten Director Copper Partners
Investment and HNG Vice President and CFO of
China Minmetals Non-Ferrous
20+ years of government, media, community and investor relations General Manager Media and
Reputation Foster’s Group. Group Manager Public Affairs
WMC Resources
Executive General Manager Services and Strategic Planning Myer Limited 7+ years BHP Billiton 6+ years Pratt Group 11+ years WMC Resources
Chief Executive Officer Mr Jerry Jiao
Chief Financial Officer Mr Ross Carroll
Chief Operating Officer Mr Marcelo Bastos
EGM China & Strategy Mr Xu Jiqing
EGM Stakeholder Relations Mr Troy Hey
EGM Business Support Mr Greg Travers
5
19

20
Why invest in MMG?
Las Bambas project delivered with industry leading ramp up. Long life, world top 10 copper mine in the first quartile of the cost curve
Strong growth pipeline – Dugald River zinc mine to commence production in 1H18 and actively pursuing further accretive growth opportunities
Access to long-term debt and majority shareholder support – core competitive advantages
Track record of operational excellence
Leading international management team

Appendix

A. 4Q 2016 Production Report
23
Key highlights from 4Q 2016 Production Report
4Q 2016 production summary Key highlights Total copper production of 503,510 tonnes in 2016 vs. guidance of
415,000–477,000 tonnes. Zinc production was 119,575 tonnes vs. guidance of 120,000–135,000 tonnes.
Las Bambas produced 330,227 tonnes of copper in copper concentrate.
Kinsevere delivered a record year in 2016 for safety, volume and cost. This was the third consecutive production record for Kinsevere.
Sepon 4Q16 production was its strongest for 2016, up 10% on pcp and 12% on 3Q16.
Australian operations delivered their strongest quarter for the year in 4Q16.
Cost improvement initiatives continue across all sites, group and support functions.
MMG expects to produce 560,000–615,000 tonnes of copper and 65,000–72,000 tonnes of zinc in 2017.
Guidance excludes Golden Grove which is expected to be sold effective 1 January 2017, subject to final approvals.
4Q 16
4Q 16 vs
4Q 15
4Q 16 vs
3Q 16
YTD
YTD 16 vs
YTD 15
COPPER CATHODE (tonnes)
Kinsevere 20,807 2% 5% 80,650 1%
Sepon 22,527 10% 12% 78,492 -12%
Total 43,334 6% 9% 159,142 -6%
COPPER (contained metal in concentrate, tonnes)
Las Bambas 105,491 N/A -1% 330,227 N/A
Golden Grove 4,101 -32% 116% 12,194 -53%
Rosebery 505 -24% 25% 1,948 -34%
Total 110,097 1537% 2% 344,369 1088%
ZINC (contained metal in concentrate, tonnes)
Golden Grove 13,959 -43% 134% 38,128 -31%
Rosebery 21,424 4% 7% 81,447 -12%
Total 35,383 -21% 36% 119,575 -19%
LEAD (contained metal in concentrate, tonnes)
Golden Grove 1,658 -23% 224% 3,963 -42%
Rosebery 7,103 33% 14% 26,005 22%
Total 8,761 17% 29% 29,968 6%

24
Las Bambas
Copper – production 420,000 – 460,000 tonnes
Copper – C1 costs US$0.85 – 0.95 / lb
Rosebery
Zinc – production 65,000 – 72,000 tonnes
Zinc – C1 costs US$0.25 – 0.35 / lb
Lead – production 18,000 – 25,000 tonnes
Sepon
Copper – production 65,000 – 75,000 tonnes
Copper – C1 costs US$1.25 – 1.40 / lb
Kinsevere
Copper – production 75,000 – 80,000 tonnes
Copper – C1 costs US$1.30 – 1.45 / lb
Guidance for 2017
Kinsevere – sustained improvements
1. EBITDA includes revenue, operating expenses and other income and expense items
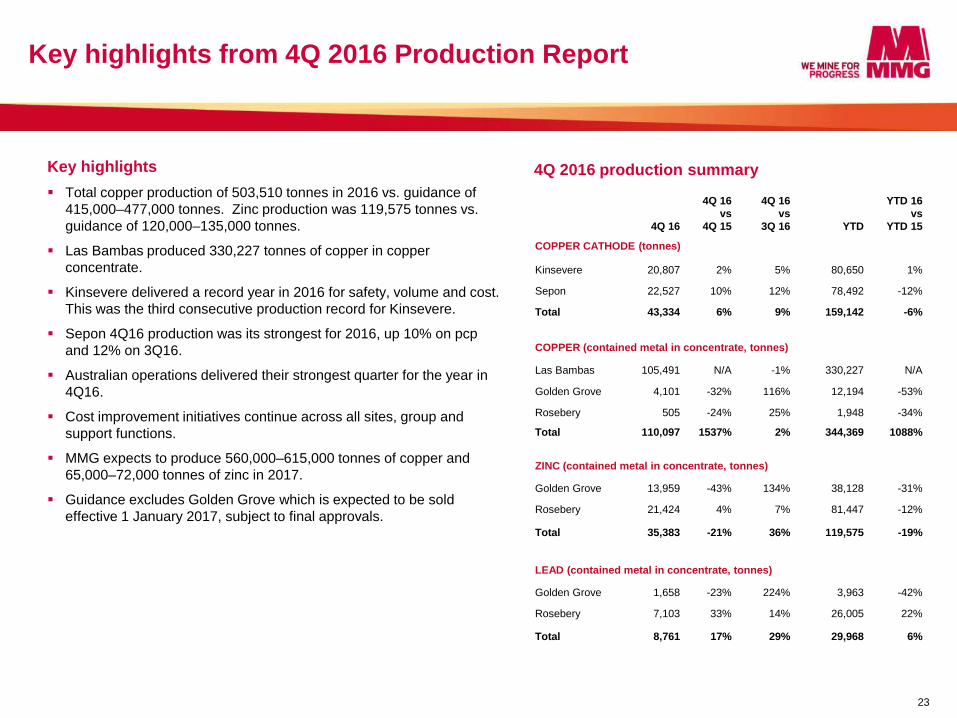
Production up 1% to 80, 650 tonnes of copper cathode in 2016
2016 was a record year for safety, volume and cost
Operational efficiencies, stable electricity, increases to mill throughput
10% of power sourced from diesel in 2016 down from 26% in 2015
C1 cost improvement driven by continued high production rates, stable grid power availability and a strong focus on efficiency
36
62 70 80 81
0
20
40
60
80
2012 2013 2014 2015 2016
Copper cathode production kt
25
Financials
US$ million FY16* FY15 %
Revenue 418.1
EBITDA1 131.8
EBIT (58.3)
EBITDA margin (%) 32
Production 80,650 80,169 1%
C1 costs – copper (US$ / lb) 1.30 1.48 (12%)
* FY16 financials released on 8 March 2017
Power utilisation
99%
52% 46% 40% 60%
71% 71% 77% 90% 90%
1%
48% 54% 60% 40%
29% 29% 23% 10% 10%
1H12 2H12 1H13 2H13 1H14 2H14 1H15 2H15 1H16 2H16Grid Diesel

Sepon – transition to tail of proven Cu resources
1. EBITDA includes revenue, operating expenses and other income and expense items
Transition to lower grade and more complex ores. 2016 ore milled grades of 3.7% vs. 4.9% in 2015.
Focus on operational efficiencies and cost controls to offset higher mining and processing. Copper ore mined was 61% higher in 2016 than in 2015.
Ore variability continues
Milling grades converge towards reserve grade
Expect to produce 65 – 75 kt of copper cathode at a C1 of US$1.24 – 1.40/lb in 2017
64 79 86 90 89 89
79
2010 2011 2012 2013 2014 2015 2016
Copper cathode production kt
Financials
US$ million FY16* FY15 %
Revenue 496.9
EBITDA1 248.8
EBIT 134.4
EBITDA margin (%) 50
Production 78,492 89,253 (12%)
C1 costs – copper (US$ / lb) 1.32 1.07 23%
* FY16 financials released on 8 March 2017
26

27
Australian Operations
1. EBITDA includes revenue, operating expenses and other income and expense items
Production of 14,142 tonnes of copper in copper concentrate, down 50% on 2015 due to reduced throughput strategy at Golden Grove (reduced throughput from 1.6 Mtpa to 1 Mtpa to preserve value of the resource while exploration continues)
Production of zinc in zinc concentrate down 19% on 2015 due to lower ore grades at Rosebery, with deeper ore bodies being accessed
C1 cost reduction at Rosebery due to strong 4Q production and higher by-product credits as a result of higher prices
Golden Grove sold to EMR for US$210m, settlement to occur in 1Q17. Sale process for Century mine assets ongoing
Zinc in zinc concentrate production kt
120 – 135
Financials US$ million FY16* FY15 %
Revenue 422.3
EBITDA1 98.6
EBIT (12.6)
EBITDA margin (%) 23 -
Production
Zinc (tonnes) 119,575 147,235 (19)
Lead (tonnes) 29,968 28,159 6
Copper (tonnes) 14,142 28,984 (51)
C1 costs – Rosebery zinc (US$/lb) 0.12 0.30 (60)
C1 costs – GG copper (US$/lb) 1.78 1.83 (3)
* FY16 financials released on 8 March 2017
152
107 112 122 147
120
2011 2012 2013 2014 2015 2016
22 28
34 31 26
14
2011 2012 2013 2014 2015 2016
Copper in copper concentrate production kt

C. Mineral Resources & Ore Reserves

Mineral Resources
Project Copper Zinc Lead Silver Gold Molybdenum Nickel
kt kt kt moz moz kt kt
Las Bambas 12,787 189 2.7 352.4
Kinsevere 1,439
Sepon 651 1.4
Dugald River 79 7,719 1,178 66
Rosebery 58 1,768 611 72 0.9
Golden Grove 380 1,156 89 28 0.6
Century
High Lake 347 536 50 37 0.6
Izok Lake 342 1,910 209 34 0.1
Avebury 259.9
Total 16,083 13,089 2,137 426 6.3 352.4 259.9
Copper and zinc Mineral Resources of 16.1Mt and 13.1Mt respectively
Mineral Resources – Contained Metal (100% asset basis) As at 30 June 2016
The information referred to in this presentation has been extracted from the report titled Mineral Resources and Ore Reserves Statement as at 30 June 2016 published on 18 October 2016 and is available to view on www.mmg.com. MMG confirms that it is not aware of any new information or data that materially affects the information included in the Mineral Resources and Ore Reserves Statement and, in the case of estimates of Mineral Resources or Ore Reserves, that all material assumptions and technical parameters underpinning the estimates in the Mineral Resources and Ore Reserves Statement continue to apply and have not materially changed. MMG confirms that the form and context in which the Competent Person’s findings are presented have not been materially modified from the Mineral Resources and Ore Reserves Statement
29

30
Ore Reserves
Copper and zinc Ore Reserves of 8.8Mt and 3.4Mt respectively
Ore Reserves – Contained Metal (100% asset basis) As at 30 June 2016
The information referred to in this presentation has been extracted from the report titled Mineral Resources and Ore Reserves Statement as at 30 June 2016 published on 18 October 2016 and is available to view on www.mmg.com. MMG confirms that it is not aware of any new information or data that materially affects the information included in the Mineral Resources and Ore Reserves Statement and, in the case of estimates of Mineral Resources or Ore Reserves, that all material assumptions and technical parameters underpinning the estimates in the Mineral Resources and Ore Reserves Statement continue to apply and have not materially changed. MMG confirms that the form and context in which the Competent Person’s findings are presented have not been materially modified from the Mineral Resources and Ore Reserves Statement
Project Copper Zinc Lead Silver Gold Molybdenum
kt kt kt moz moz kt
Las Bambas 7,710 119 2.0 205.2
Kinsevere 577
Sepon 379
Dugald River 2,736 440 36 0.0
Rosebery 13 447 165 20 0.2
Golden Grove 82 222 29 8 0.3
Total 8,761 3,405 634 183 2.5 205.2


![Article Chuquicamata Underground [Hormazabal Et Al 2009]](https://img.pdfslide.us/doc/110x75/55cf8c855503462b138d3e5c/article-chuquicamata-underground-hormazabal-et-al-2009.jpg)