Embed Size (px)
Citation preview
MM3FC Mathematical Modeling 3LECTURE 10
Times
Weeks 7,8 & 9.Lectures : Mon,Tues,Wed 10-11am,
Rm.1439Tutorials : Thurs, 10am, Rm. ULT.
Clinics : Fri, 8am, Rm.4.503Dr. Charles Unsworth,Department of Engineering Science, Rm. 4.611
Tel : 373-7599 ext. 82461Email : [email protected]
This LectureWhat are we going to cover &
Why ?• Spectral Analyser. (Understand the DSP behind a spectrum analyser)
• Discrete Fourier Transform (DFT). (From understanding the spectrum analyser
we will learn a DFT can be represented as a filter bank)
• Calculating a DFT. Determine the ‘Magnitude spectrum’ of a
complicated digitised sequence.
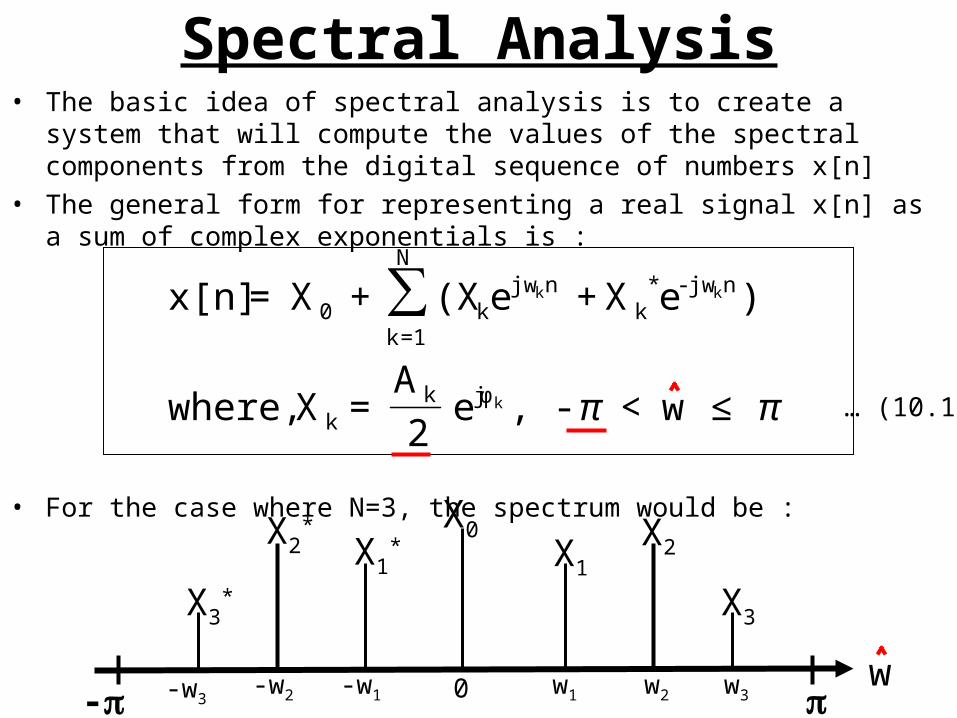
Spectral Analysis• The basic idea of spectral analysis is to create a system that will
compute the values of the spectral components from the digital sequence of numbers x[n]
• The general form for representing a real signal x[n] as a sum of complex exponentials is :
• For the case where N=3, the spectrum would be :
ππ ≤w<- ,e2
A= X where,
)eX +e(X+X=x[n]
k
kk
jφkk
njw-*k
N
1=k
njwk0 ∑
0 w2 w3-w2-w3
X0X1
* X1
X2X2*
X3X3*
-w1 w1 -w
… (10.1)
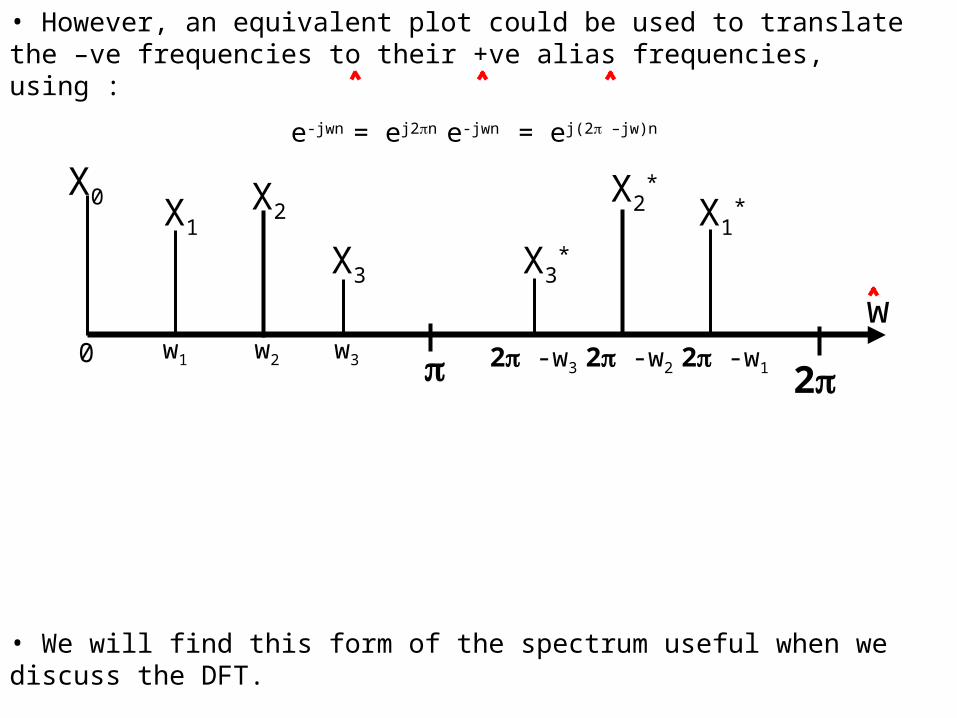
• However, an equivalent plot could be used to translate the –ve frequencies to their +ve alias frequencies, using :
e-jwn = ej2n e-jwn = ej(2 –jw)n
• We will find this form of the spectrum useful when we discuss the DFT.
0 w2 w3 2 -w22 -w3
X0X1
*X1X2
X2*
X3 X3*
2 -w1w1 2
w
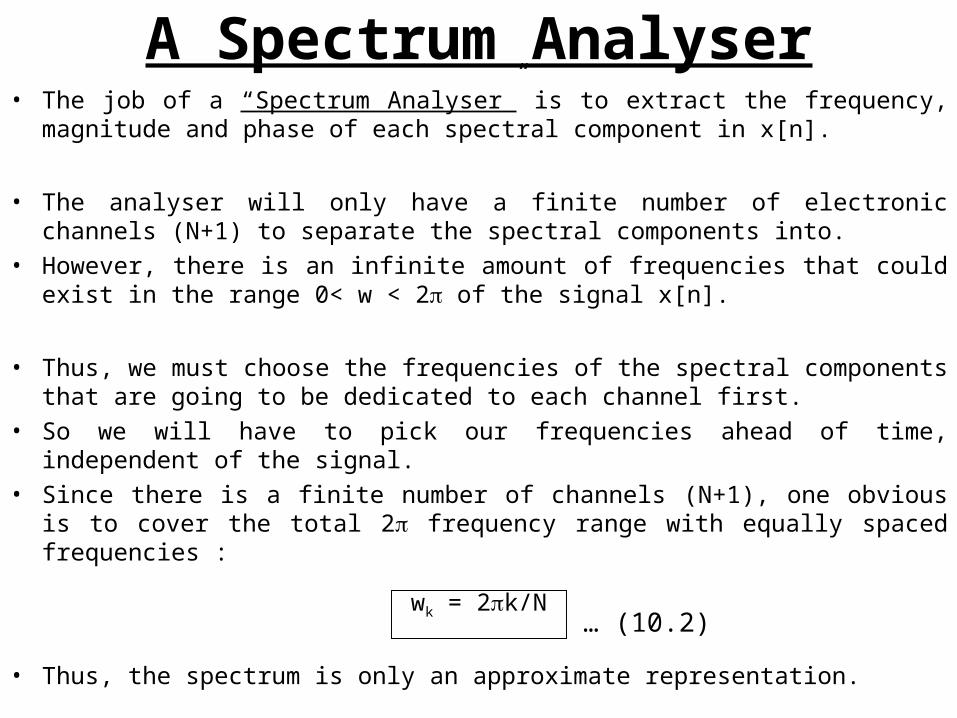
A Spectrum Analyser• The job of a “Spectrum Analyser” is to extract the frequency,
magnitude and phase of each spectral component in x[n].
• The analyser will only have a finite number of electronic channels (N+1) to separate the spectral components into.
• However, there is an infinite amount of frequencies that could exist in the range 0< w < 2 of the signal x[n].
• Thus, we must choose the frequencies of the spectral components that are going to be dedicated to each channel first.
• So we will have to pick our frequencies ahead of time, independent of the signal.
• Since there is a finite number of channels (N+1), one obvious is to cover the total 2 frequency range with equally spaced frequencies :
wk = 2k/N
• Thus, the spectrum is only an approximate representation.
… (10.2)
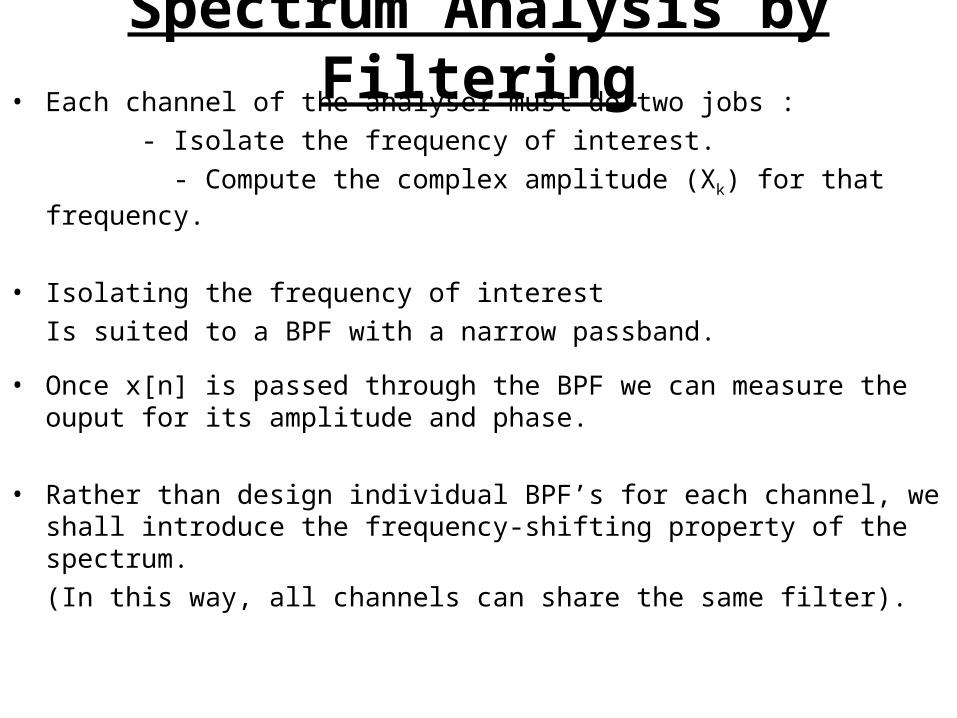
Spectrum Analysis by Filtering• Each channel of the analyser must do two jobs :
- Isolate the frequency of interest. - Compute the complex amplitude (Xk) for that frequency.
• Isolating the frequency of interestIs suited to a BPF with a narrow passband.
• Once x[n] is passed through the BPF we can measure the ouput for its amplitude and phase.
• Rather than design individual BPF’s for each channel, we shall
introduce the frequency-shifting property of the spectrum.(In this way, all channels can share the same filter).
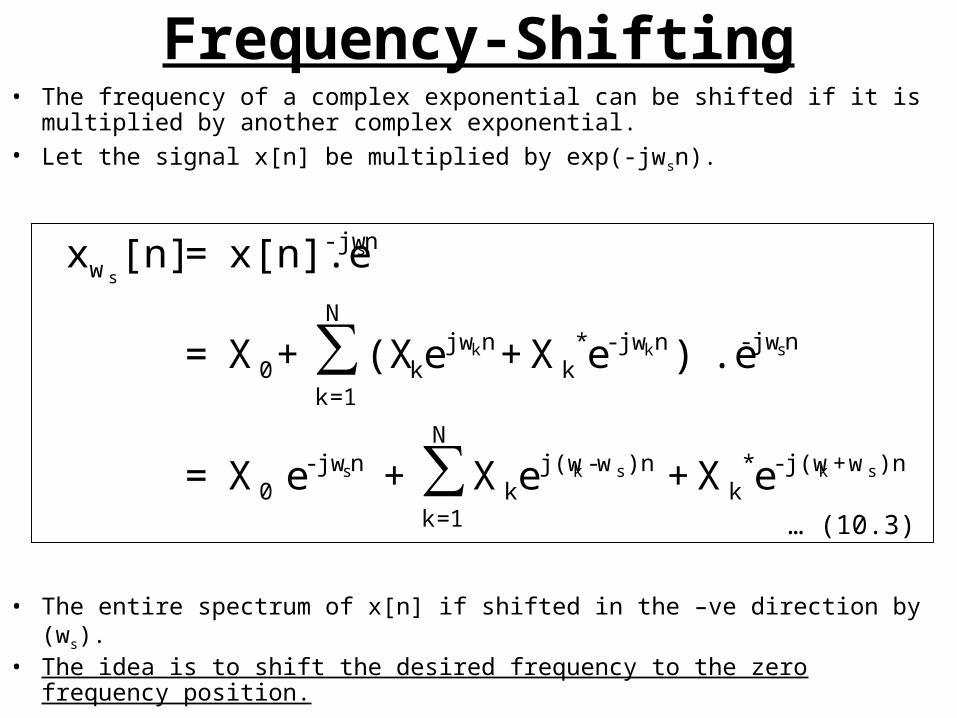
Frequency-Shifting• The frequency of a complex exponential can be shifted if it is
multiplied by another complex exponential.• Let the signal x[n] be multiplied by exp(-jwsn).
• The entire spectrum of x[n] if shifted in the –ve direction by (ws).• The idea is to shift the desired frequency to the zero frequency
position.
)nw+j(w-*k
N
1=k
)nw-j(wk
njw-0
njw-njw-*k
N
1=k
njwk0
n-jww
sksks
skk
s
s
eX +eX+eX=
.e )eX +e(X+X=
x[n].e=[n]x
∑
∑
… (10.3)
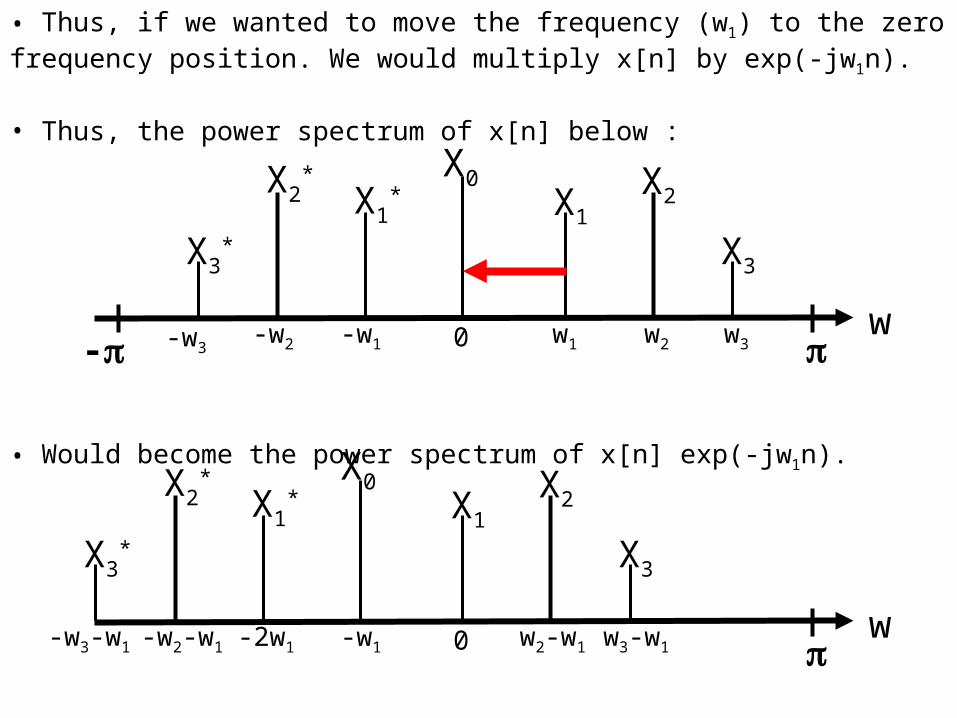
• Thus, if we wanted to move the frequency (w1) to the zero frequency position. We would multiply x[n] by exp(-jw1n).
• Thus, the power spectrum of x[n] below :
• Would become the power spectrum of x[n] exp(-jw1n).
0 w2 w3-w2-w3
X0X1
* X1
X2X2*
X3X3*
-w1 w1 -w
0 w3-w1-2w1-w2-w1
X0X1
* X1
X2X2*
X3X3*
-w1 w-w3-w1 w2-w1
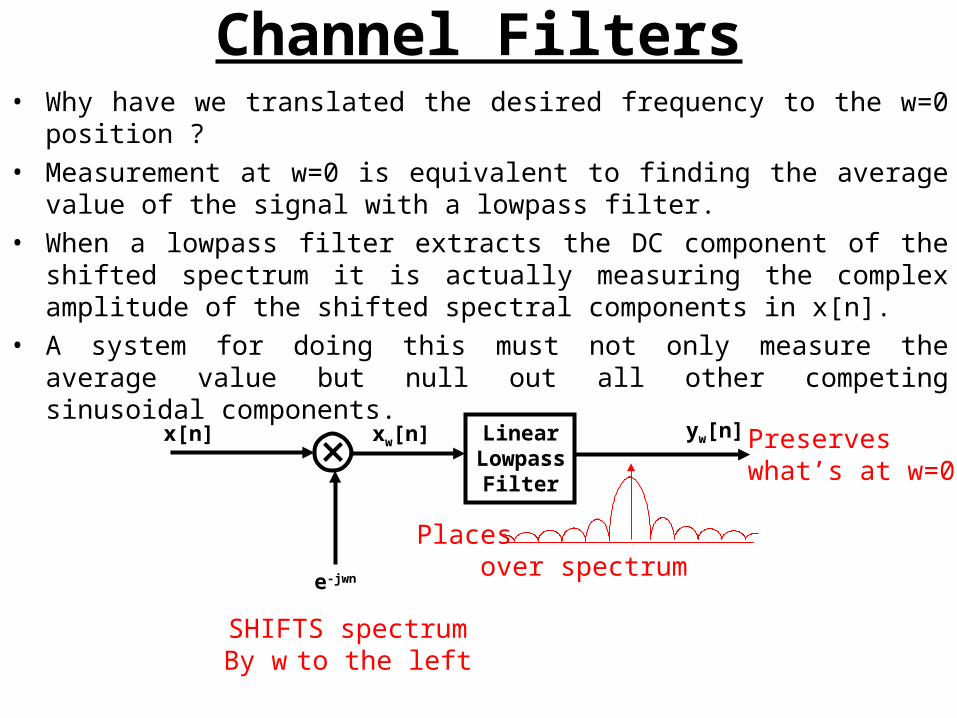
Channel Filters• Why have we translated the desired frequency to the w=0 position
?• Measurement at w=0 is equivalent to finding the average value of
the signal with a lowpass filter.• When a lowpass filter extracts the DC component of the shifted
spectrum it is actually measuring the complex amplitude of the shifted spectral components in x[n].
• A system for doing this must not only measure the average value but null out all other competing sinusoidal components.
x[n] xw[n] LinearLowpass
Filter
e-jwn
yw[n]
SHIFTS spectrumBy w to the left
Places over spectrum
Preserveswhat’s at w=0
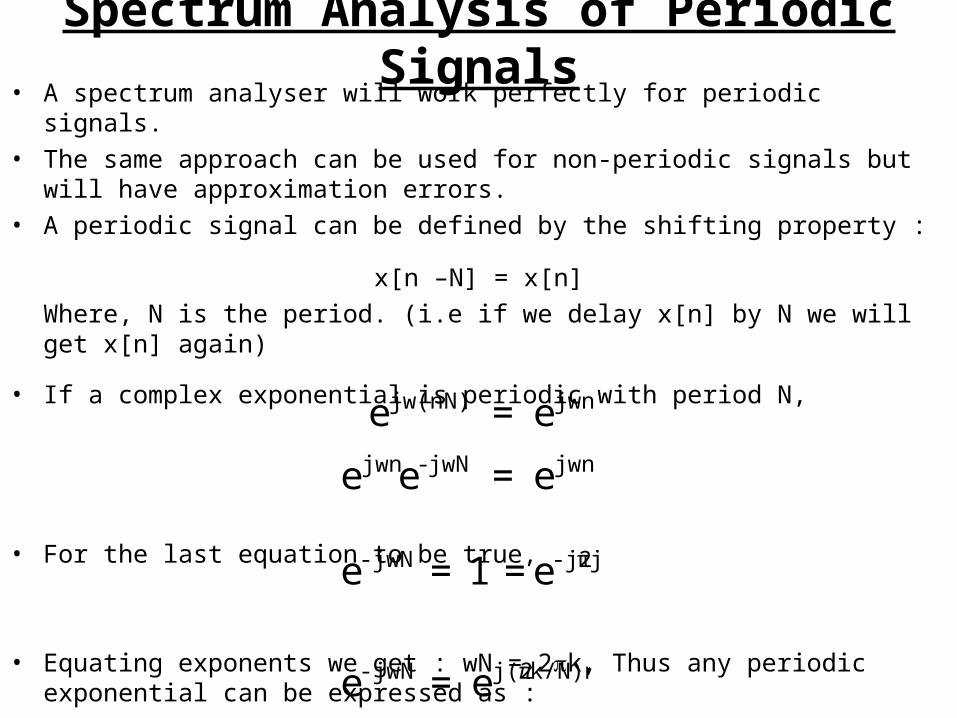
Spectrum Analysis of Periodic Signals
• A spectrum analyser will work perfectly for periodic signals.• The same approach can be used for non-periodic signals but will
have approximation errors.• A periodic signal can be defined by the shifting property :
x[n –N] = x[n]Where, N is the period. (i.e if we delay x[n] by N we will get x[n] again)
• If a complex exponential is periodic with period N,
• For the last equation to be true,
• Equating exponents we get : wN = 2k, Thus any periodic
exponential can be expressed as :
jwnjwN-jwn
jwnN)-jw(n
e=ee
e=e
-j2πj-jwN e =1=e
k/N)nj(2-jwN e=e π
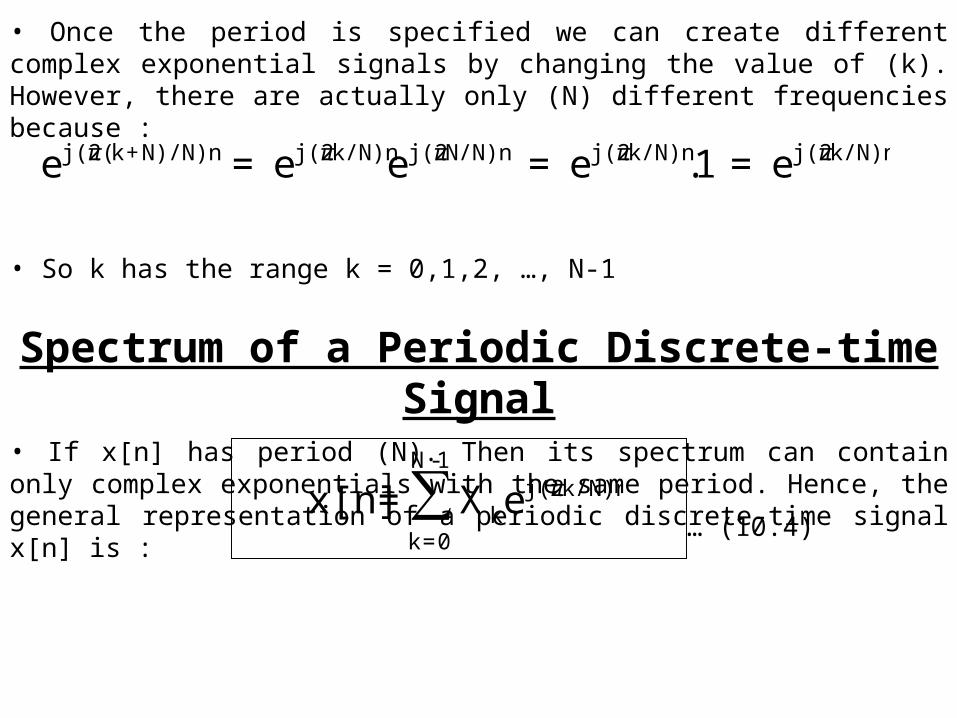
• Once the period is specified we can create different complex exponential signals by changing the value of (k). However, there are actually only (N) different frequencies because :
• So k has the range k = 0,1,2, …, N-1
Spectrum of a Periodic Discrete-time Signal
• If x[n] has period (N). Then its spectrum can contain only complex exponentials with the same period. Hence, the general representation of a periodic discrete-time signal x[n] is :
• The range is from 0 to (N-1) as there are only N different frequencies.• The frequencies are all multiples of a common fundamental frequency
w = 2/N
k/N)nj(2k/N)nj(2N/N)nj(2k/N)nj(2N)/N)n+k(j(2 e=1.e=ee=e πππππ
k/N)nj(21-N
0=kkeX = x[n] ∑ π
… (10.4)
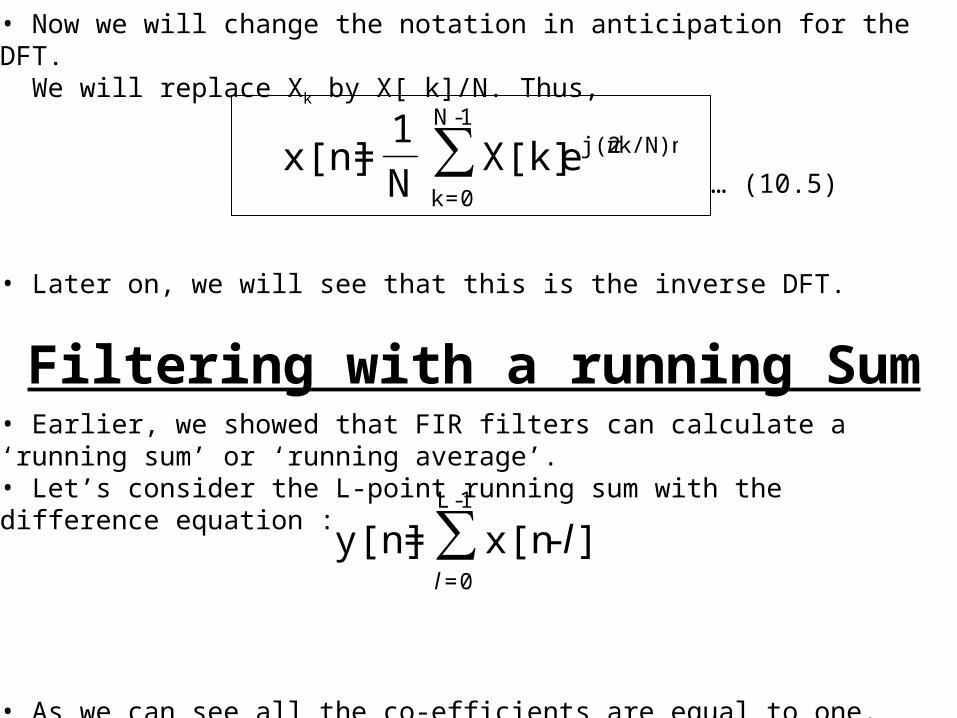
• Now we will change the notation in anticipation for the DFT. We will replace Xk by X[ k]/N. Thus,
• Later on, we will see that this is the inverse DFT.
Filtering with a running Sum• Earlier, we showed that FIR filters can calculate a ‘running sum’ or ‘running average’.• Let’s consider the L-point running sum with the difference equation :
• As we can see all the co-efficients are equal to one.
k/N)nj(21-N
0=k
e X[k]N
1 = x[n] ∑ π
∑1-L
0=
] -x[n = y[n]l
l
… (10.5)
0 0.1-0.1 0.5-0.5 -0.2
Frequency response of aRunning sum filter Null
NullGain = 10
0 0.1-0.1 0.5-0.5 -0.2
855
10
5x10 = 50
Normalised frequency /2
0 0.1-0.1 0.5-0.5 -0.2
855
Spectral component of interest
Spectral component of interestIs magnified by the gain of 10.All other components are nulled.
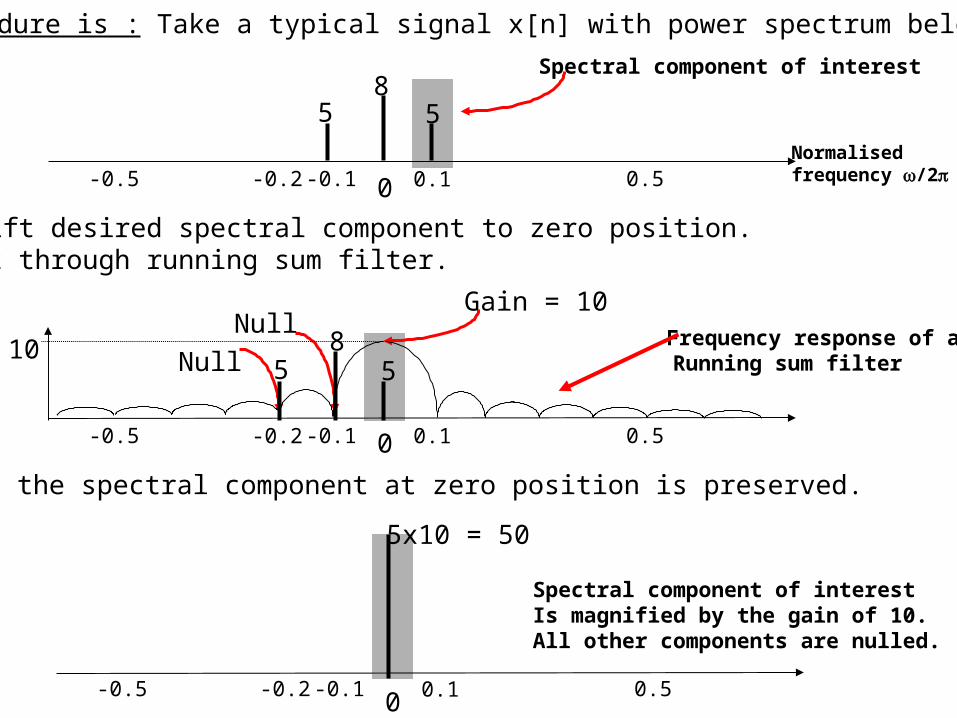
• Procedure is : Take a typical signal x[n] with power spectrum below
• Shift desired spectral component to zero position.• Put through running sum filter.
• Only the spectral component at zero position is preserved.
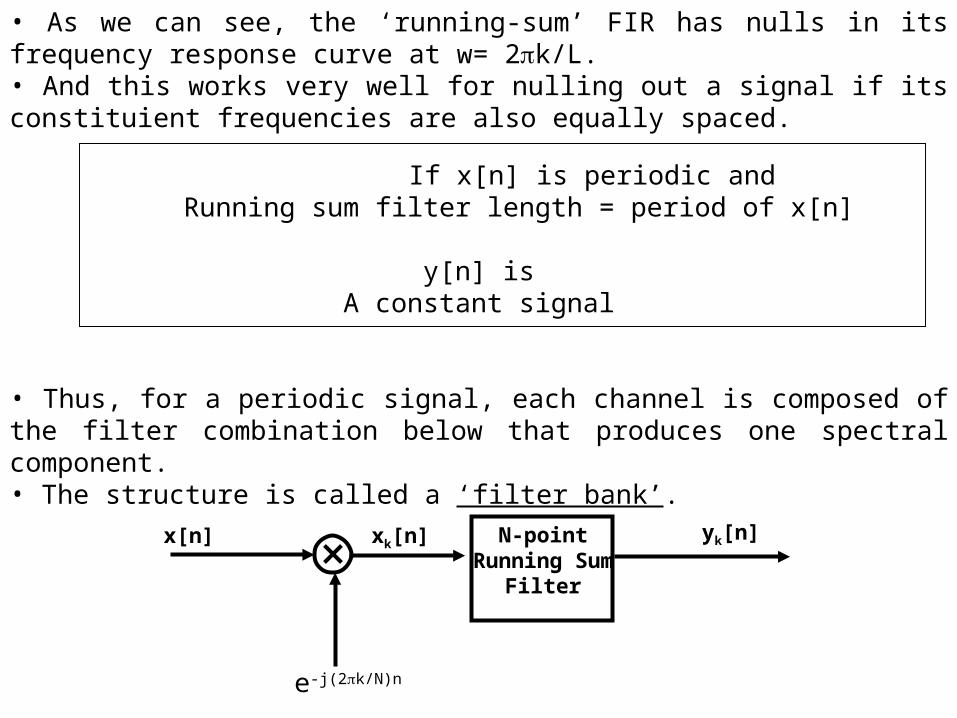
• As we can see, the ‘running-sum’ FIR has nulls in its frequency response curve at w= 2k/L.• And this works very well for nulling out a signal if its constituient frequencies are also equally spaced.
If x[n] is periodic and Running sum filter length = period of x[n]
y[n] isA constant signal
• Thus, for a periodic signal, each channel is composed of the filter combination below that produces one spectral component.• The structure is called a ‘filter bank’.
x[n] xk[n] N-pointRunning Sum
Filter
e-j(2k/N)n
yk[n]
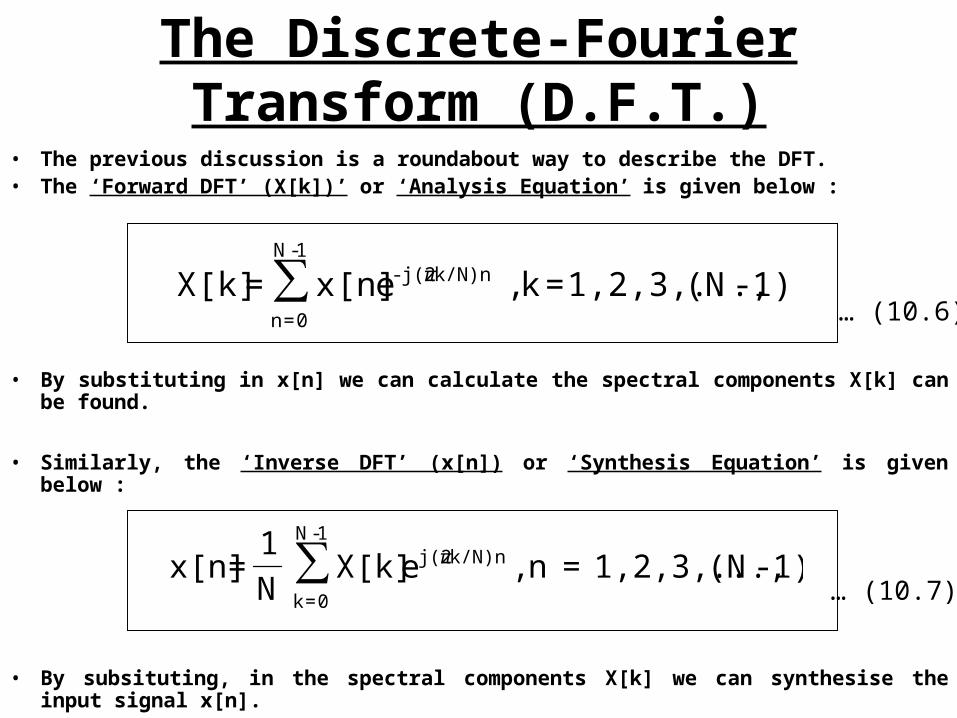
The Discrete-Fourier Transform (D.F.T.)
• The previous discussion is a roundabout way to describe the DFT.• The ‘Forward DFT’ (X[k])’ or ‘Analysis Equation’ is given below :
• By substituting in x[n] we can calculate the spectral components X[k] can be found.
• Similarly, the ‘Inverse DFT’ (x[n]) or ‘Synthesis Equation’ is given below :
• By subsituting, in the spectral components X[k] we can synthesise the input signal x[n].
1)-(N1,2,3,..., =k , e x[n] = X[k] k/N)nj(2-1-N
0=n
∑ π
1)-(N1,2,3,...,=n, e X[k]N
1 = x[n] k/N)nj(2
1-N
0=k
∑ π
… (10.6)
… (10.7)
x[n]
e-j(0)n
x0[n] N-pointRunning Sum
Filter
y0[n] = X[0]
e-j(2/N)n
x1[n] N-pointRunning Sum
Filter
y1[n] = X[1]
xk[n] N-pointRunning Sum
Filter
e-j(2k/N)n
yk[n] = X[k]
xN-1[n] N-pointRunning Sum
Filter
e-j(2(N-1)/N)n
yN-1[n] = X[N-1]
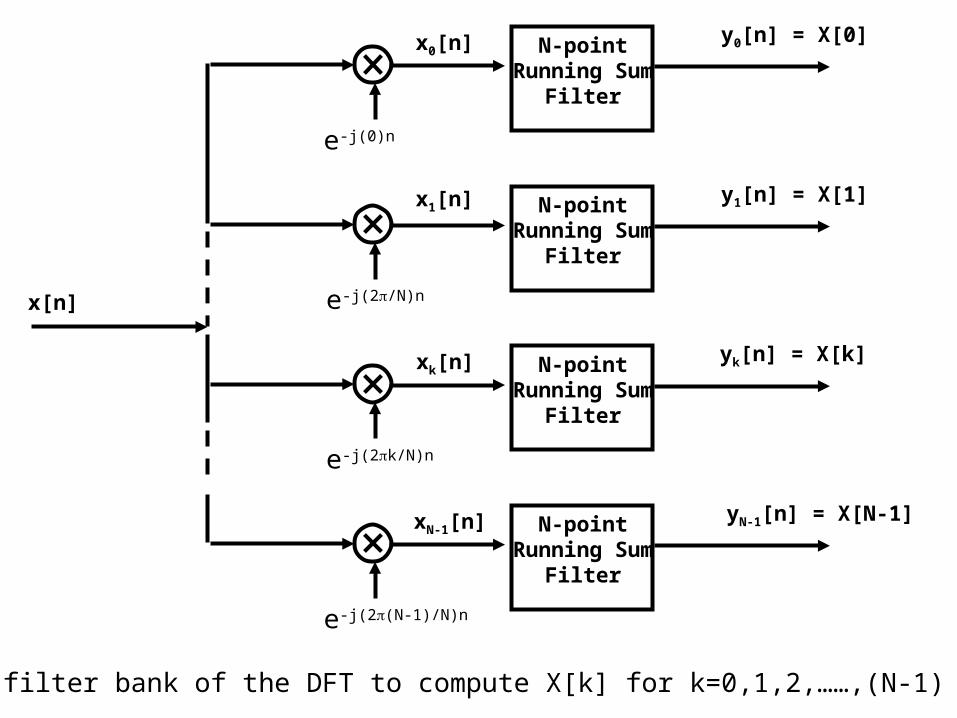
• The filter bank of the DFT to compute X[k] for k=0,1,2,……,(N-1)
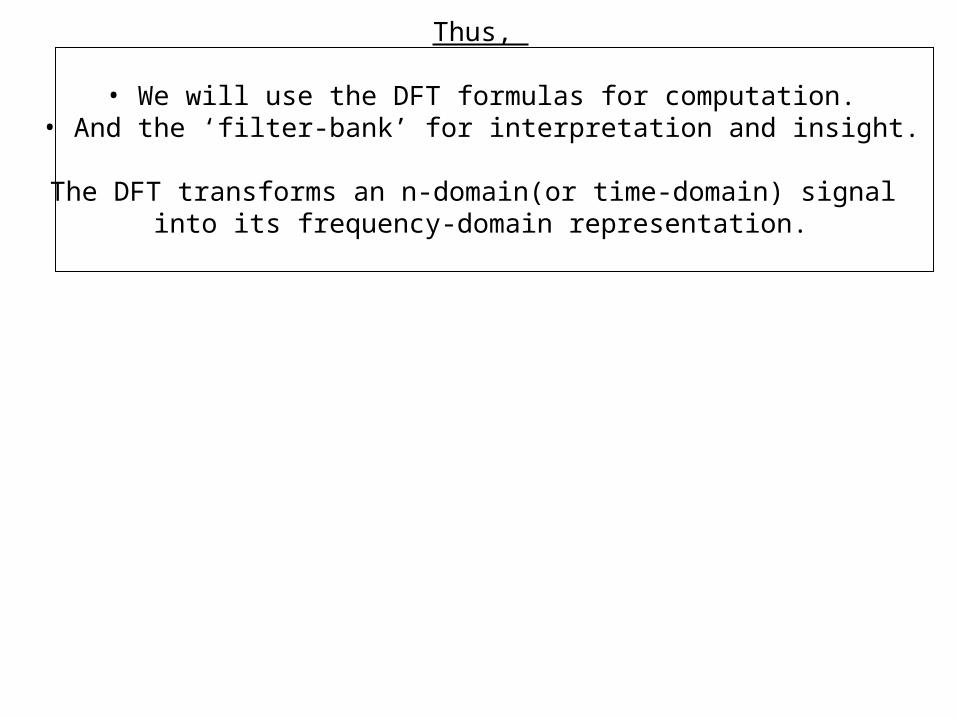
Thus,
• We will use the DFT formulas for computation.• And the ‘filter-bank’ for interpretation and insight.
The DFT transforms an n-domain(or time-domain) signal into its frequency-domain representation.
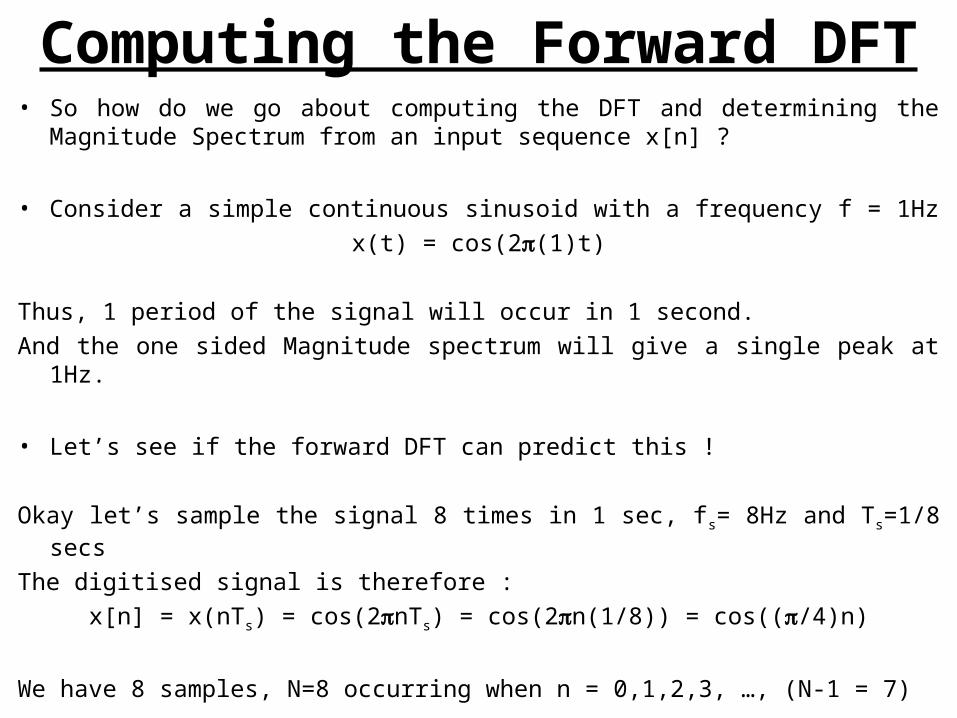
Computing the Forward DFT• So how do we go about computing the DFT and determining the
Magnitude Spectrum from an input sequence x[n] ?
• Consider a simple continuous sinusoid with a frequency f = 1Hz x(t) = cos(2(1)t)
Thus, 1 period of the signal will occur in 1 second. And the one sided Magnitude spectrum will give a single peak at 1Hz.
• Let’s see if the forward DFT can predict this !
Okay let’s sample the signal 8 times in 1 sec, fs= 8Hz and Ts=1/8 secs
The digitised signal is therefore : x[n] = x(nTs) = cos(2nTs) = cos(2n(1/8)) = cos((/4)n)
We have 8 samples, N=8 occurring when n = 0,1,2,3, …, (N-1 = 7)
/4 /2 3/4 5/4 3/2 7/4 2
Ts
1
} 2
10, ,
2
1-1,- ,
2
1-0, ,
2
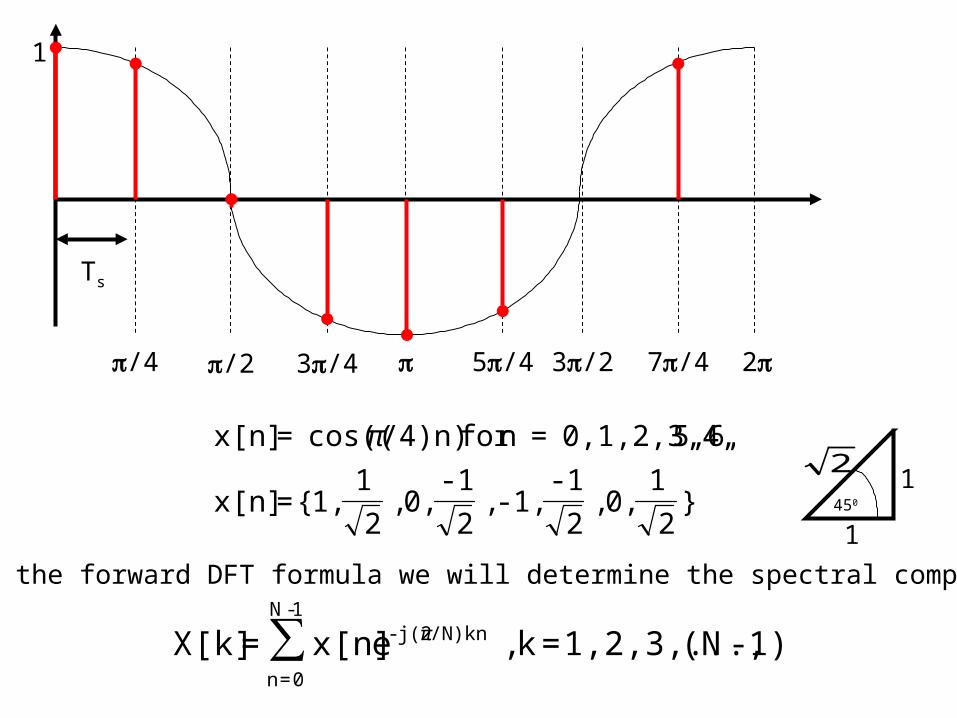
11, { =x[n]
5,6,70,1,2,3,4,=nfor /4)n)cos((=x[n] π
• Using the forward DFT formula we will determine the spectral components.
1)-(N1,2,3,..., =k , e x[n] = X[k] /N)knj(2-1-N
0=n
∑ π
1
12
450
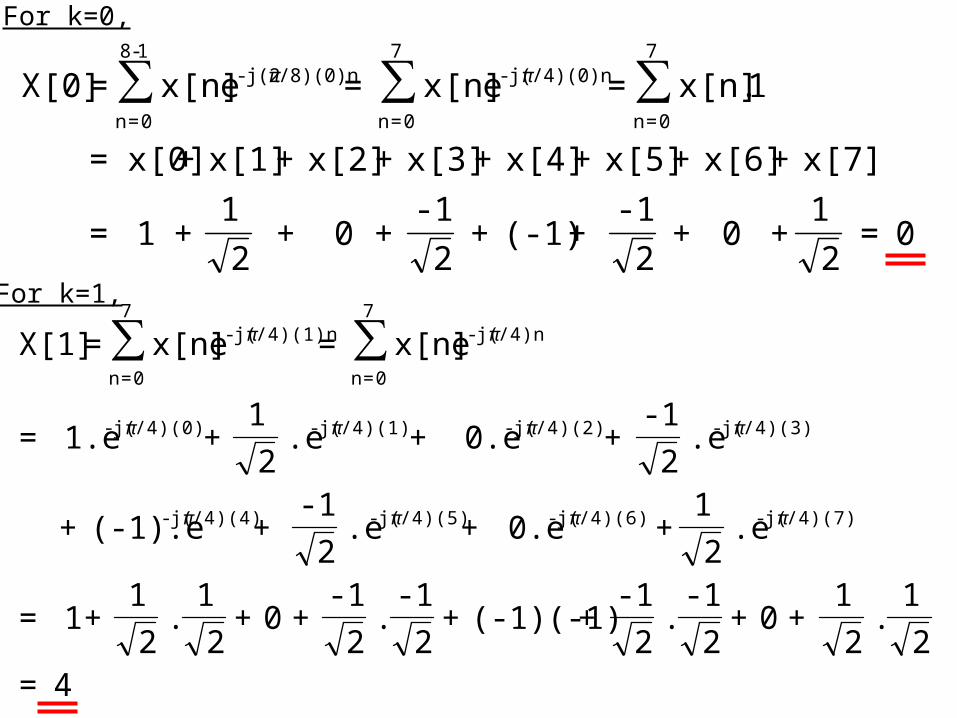
For k=0,
0=2
1 + 0 +
2
1- + (-1) +
2
1- + 0 +
2
1+ 1 =
x[7]+x[6]+x[5]+x[4]+x[3]+x[2]+x[1]+ x[0]=
1. x[n] =e x[n] = e x[n] = X[0] ∑∑∑7
0=n
/4)(0)nj(-7
0=n
/8)(0)nj(2-1-8
0=n
ππ
4=2
1.
2
1 +0+
2
1-.
2
1- +(-1)(-1)+
2
1-.
2
1-+0+
2
1.
2
1+ 1 =
.e2
1 + 0.e + .e
2
1- + (-1).e +
.e2
1- + 0.e + .e
2
1+ 1.e =
e x[n] = e x[n] = X[1]
/4)(7)j(-/4)(6)j(-/4)(5)j(-/4)(4)j(-
/4)(3)j(-/4)(2)j(-/4)(1)j(-/4)(0)j(-
/4)nj(-7
0=n
/4)(1)nj(-7
0=n
∑∑
ππππ
ππππ
ππ
For k=1,
1
2
1
2
1
2
1-
2
1-
0
-1
0
4
π2
π
4
3π
π
4
5π
2
3π 4
7π
0
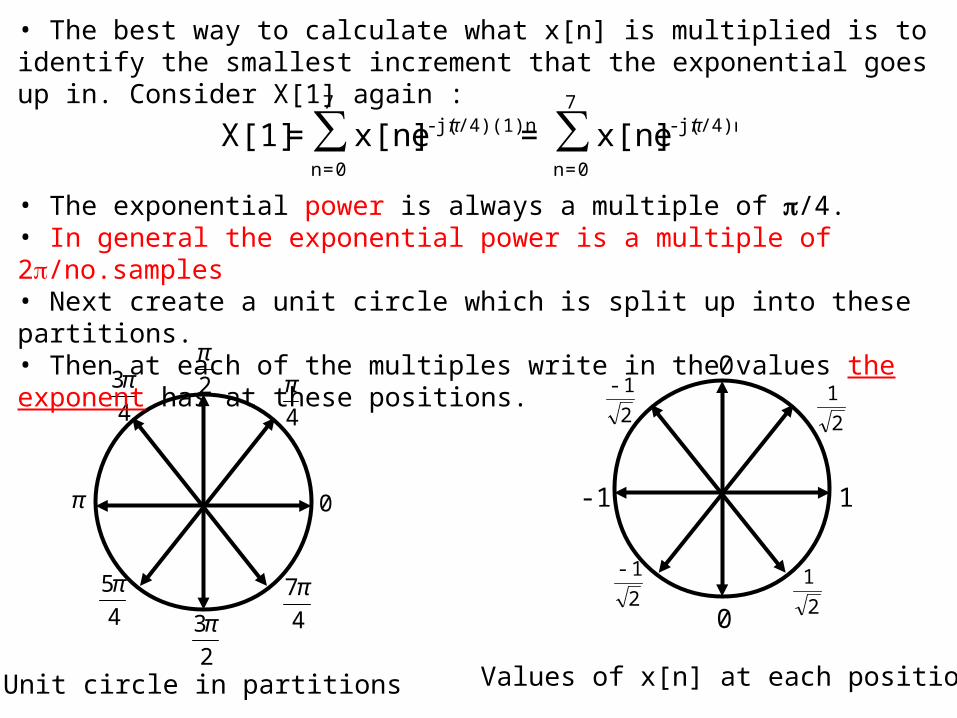
• The best way to calculate what x[n] is multiplied is to identify the smallest increment that the exponential goes up in. Consider X[1] again :
/4)nj(-7
0=n
/4)(1)nj(-7
0=n
e x[n] = e x[n] = X[1] ∑∑ ππ
• The exponential power is always a multiple of /4. • In general the exponential power is a multiple of 2/no.samples• Next create a unit circle which is split up into these partitions.• Then at each of the multiples write in the values the exponent has at these positions.
Unit circle in partitions Values of x[n] at each position
0=)0.(2
1 +0.(-1)+ )0.(
2
1- +(-1)(-1)+ )0.(
2
1-+0.(-1)+ )0.(
2
1+ 1 =
.e2
1 + 0.e + .e
2
1- + (-1).e +
.e2
1- + 0.e + .e
2
1+ 1.e =
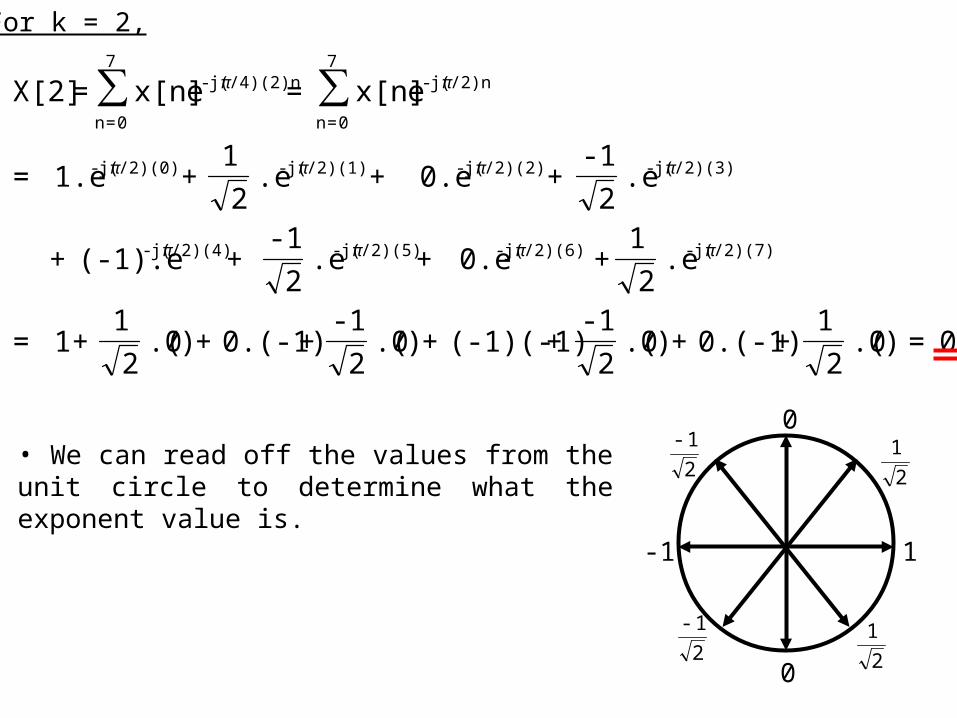
e x[n] = e x[n] = X[2]
/2)(7)j(-/2)(6)j(-/2)(5)j(-/2)(4)j(-
/2)(3)j(-/2)(2)j(-/2)(1)j(-/2)(0)j(-
/2)nj(-7
0=n
/4)(2)nj(-7
0=n
∑∑
ππππ
ππππ
ππ
For k = 2,
1
2
1
2
1
2
1-
2
1-
0
-1
0
• We can read off the values from the unit circle to determine what the exponent value is.
0=2
1-.
2
1 +0.(0)+
2
1.
2
1- +(-1)(-1)+
2
1.
2
1-+0.(0)+
2
1-.
2
1+ 1 =
.e2
1 + 0.e + .e
2
1- + (-1).e +
.e2
1- + 0.e + .e
2
1+ 1.e =
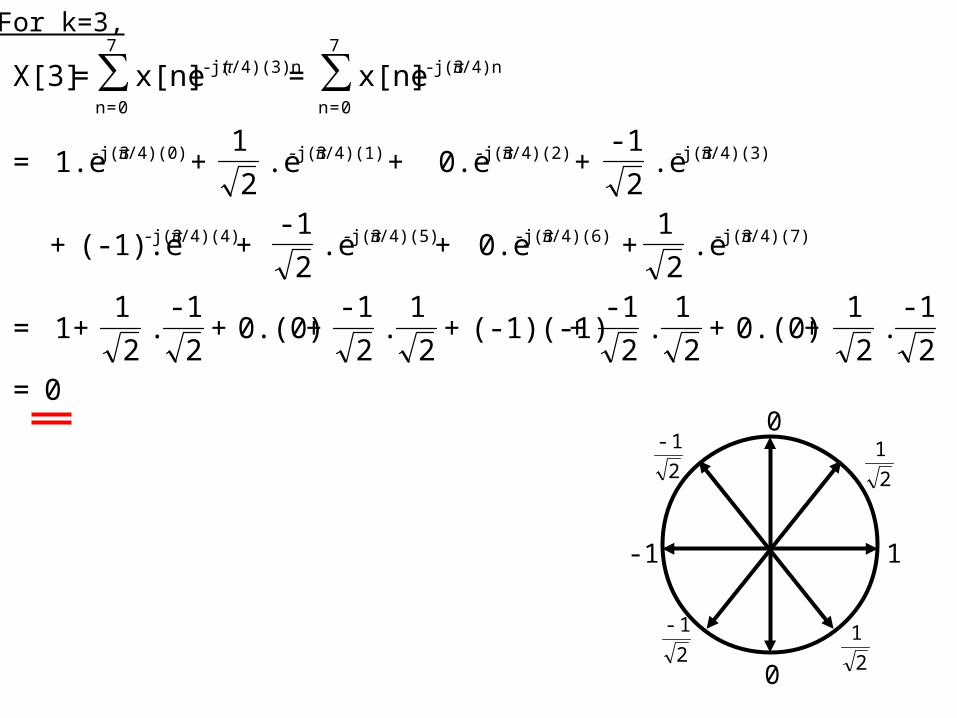
e x[n] = e x[n] = X[3]
/4)(7)j(3-/4)(6)j(3-/4)(5)j(3-/4)(4)j(3-
/4)(3)j(3-/4)(2)j(3-/4)(1)j(3-/4)(0)j(3-
/4)nj(3-7
0=n
/4)(3)nj(-7
0=n
∑∑
ππππ
ππππ
ππ
For k=3,
1
2
1
2
1
2
1-
2
1-
0
-1
0
/4 /2 3/4 5/4 3/2 7/4 2Ts
1
/4 /2 3/4 5/4 3/2 7/4 2Ts
1
/4 /2 3/4 5/4 3/2 7/4 2Ts
1
9/4
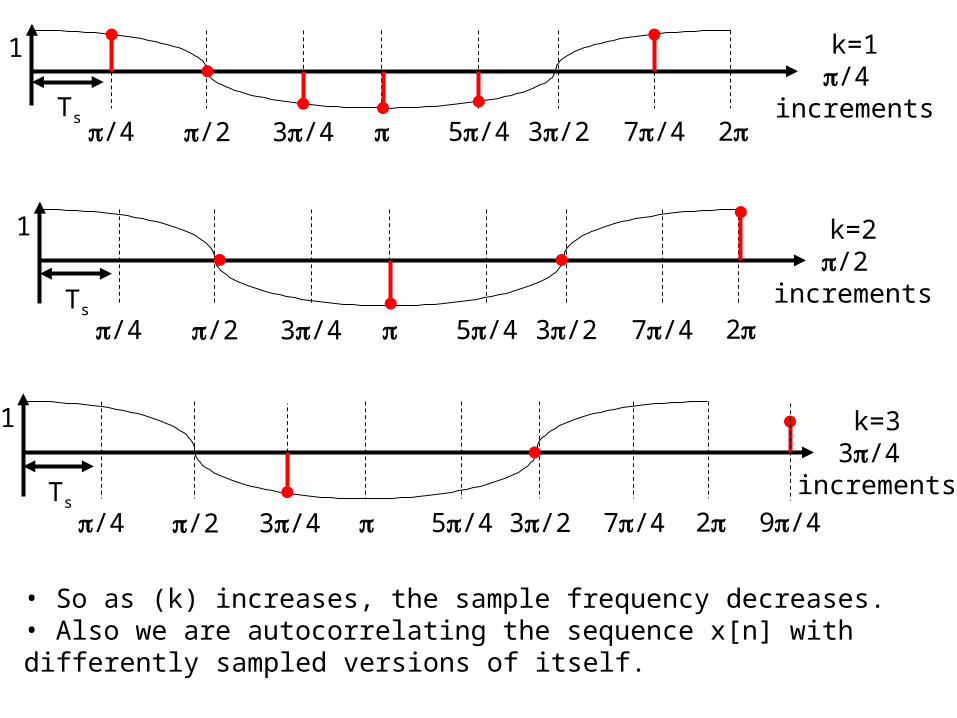
k=1/4
increments
k=2/2
increments
k=33/4
increments
• So as (k) increases, the sample frequency decreases.• Also we are autocorrelating the sequence x[n] with differently sampled versions of itself.
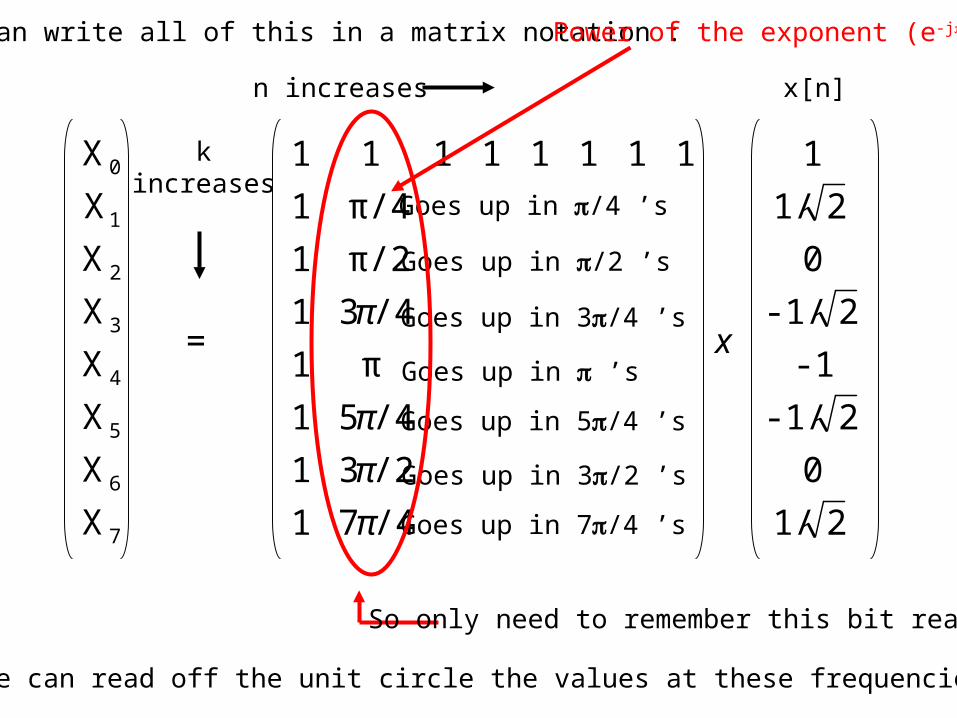
• We can write all of this in a matrix notation :
21/
0
21/-
1-
21/-
0
21/
1
/471
/231
/451
π1
/431
π/21
π/41
11111111
=
X
X
X
X
X
X
X
X
7
6
5
4
3
2
1
0
x
π
π
π
π
Goes up in /4 ’s
Goes up in /2 ’s
Goes up in 3/4 ’s
Goes up in ’s
Goes up in 5/4 ’s
Goes up in 3/2 ’s
Goes up in 7/4 ’s
kincreases
n increases x[n]
So only need to remember this bit really.
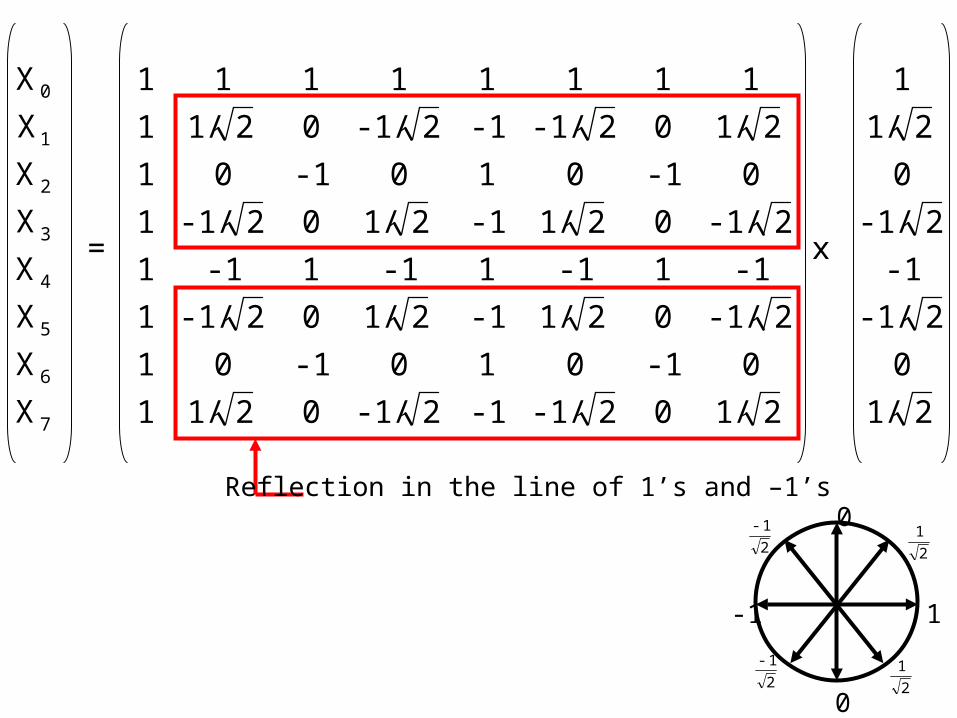
• Now we can read off the unit circle the values at these frequencies.
Power of the exponent (e-j/4)
21/
0
21/-
1-
21/-
0
21/
1
x
21/021/-1-21/-021/1
01-0101-01
21/-021/1-21/021/-1
1-11-11-11-1
21/-021/1-21/021/-1
01-0101-01
21/021/-1-21/-021/1
11111111
=
X
X
X
X
X
X
X
X
7
6
5
4
3
2
1
0
Reflection in the line of 1’s and –1’s
1
2
1
2
1
2
1-
2
1-
0
-1
0
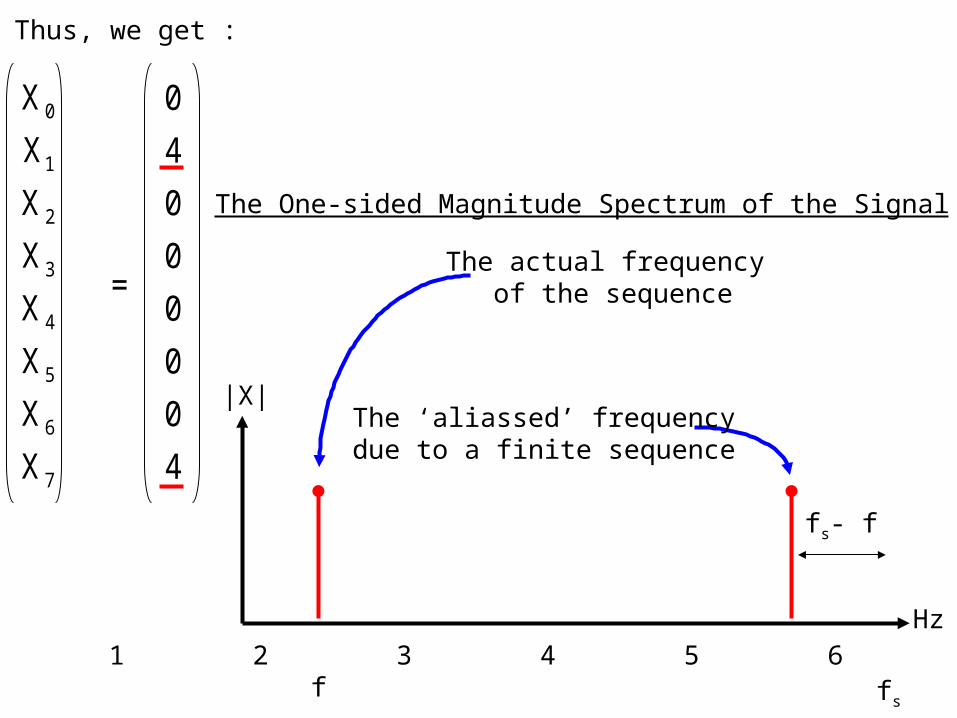
• Thus, we get :
4
0
0
0
0
0
4
0
=
X
X
X
X
X
X
X
X
7
6
5
4
3
2
1
0
0 1 2 3 4 5 6 7 8 Hz
fs
fs- f
f
|X|
The actual frequency of the sequence
The ‘aliassed’ frequencydue to a finite sequence
The One-sided Magnitude Spectrum of the Signal
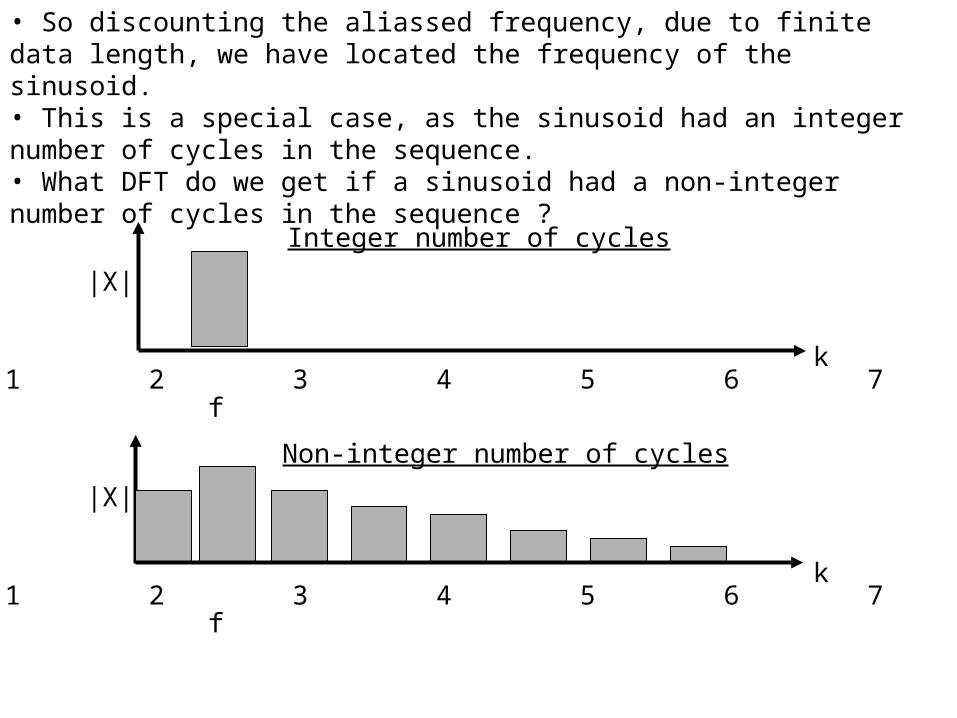
• So discounting the aliassed frequency, due to finite data length, we have located the frequency of the sinusoid. • This is a special case, as the sinusoid had an integer number of cycles in the sequence.• What DFT do we get if a sinusoid had a non-integer number of cycles in the sequence ?
• Thus, for a non-integer number of cycles in the sequence, ‘ leakage’ at the outputs occurs. However, the main component still has the most power in it.
0 1 2 3 4 5 6 7 k
f
|X|
Integer number of cycles
0 1 2 3 4 5 6 7 k
f
|X|
Non-integer number of cycles

So endeth the course … !
Good luck in the exams, folks !!!