Embed Size (px)
Citation preview
TECHNICAL REPORT RS-81-7
AN EVALUATION OF PARTICLE IMPACT NOISEDETECTION (PIND) TESTING
Dr. David KernsMAJ Dicky LoveDr. Victor Ruwe
System Enginee½ng DirectorateUS Army Missile Laboratory EL "CT" r•
FEB 2 51982
August 1981 A
~MM~ MEISL COMMAN
Approved for ptublic release; distribution unlimited.
REPRODUCED FROMBEST AVAILABLE COPY
SM1 FOFW 1. 2 AX f0 PREMOtA EDITION IS Q8ErS8
D1940SIT N W4SThUCTIOV4S
ORST1110 TMu %4OIT 10,11 IT 4 NO LONGER NEEDED. DO NOTPumN IT TO TIll ORIGINTOR.
DWSLAPMER
TNS FIWNSS IN Wth REPORT ARE NOT TOURW CONSTRUED AS ANOPP=A& 90EPARTMENT OPt THE AWMY POWTION UNLES 9O OEMIO-MATED NY OTW.Sl A&MINGR=0E POCtAWNU.
TRADE NAMES
WE OF TRADIE NAMES OR MANUACTURERS 1 THU REPORT DOESNOT CONIITITMtE AN OFFICIAL ENDOREMNT Oft APPOVAL OFTHE UM OF SUICH COERMICIAL. HAIMMAfE OR GOUThAPE.
UnclassifiedSECURITY CLASSIFICATION OF THIS PAGE (Whomen Drot Bntered)
OPAGE READ INSTRUCTIONSREPORT DOCUMEtiTATION PAGE BEFORE COMPLETING FORM
1. REPORT NUMBER L2. GOVI ACCESSION NO. 3. RECIPIENT'S CATALOG NUMBER
TR-RS-81-7 __ __ __ __.__ __-_"_.
4. TITLE (ad Subiltle) S. TYPE OF REPORT & PERIOD COVERED
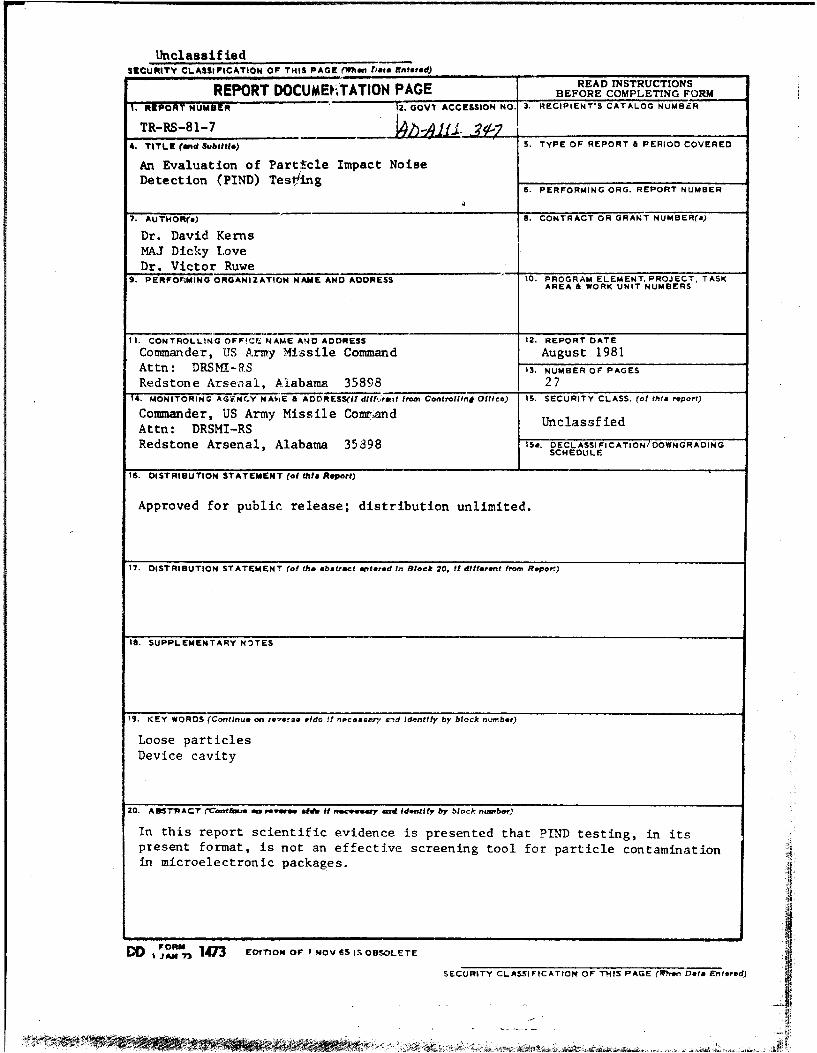
An Evaluation of Particle Impact NoiseDetection (PIND) Test.ing
6. PERFORMING ORG. REPORT NUMBER
7. AUTHOR(e) S. CONTRACT OR GRANT NUMBER(e)
Dr. David KernsMAJ Dicky LoveDr. Victor Ruwe
9. PERFORIMING ORGANIZATION NAME AND ADDRESS 10. PROGRAM ELEMENT. PROJECT, TASKAREA 6 WORK UNIT NUMBERS
I1. CONTROLLING OFF!C[I- NAME AND ADDRESS 12. REPORT DATE
Commander, US Army Missile Command August 1981Attn: DRSM!-RS 13. NUMBER OF PAGES
Redstone Arsenal, Alabama 35898 2714. MONITORING AGENC.Y NAdIE G ADDRESS(Ildiffr,,twit from Controllin Office) 15. SECURITY CLASS. (of this report)
Commander, US Army Missile Cowand UnclassfiedAttn: DRSMI-RSRedstone Arsenal, Alabama 35898 11S. ECLASS FICATION/DOWNGRADING
SCHEDULE
16. DISTRIBUTION STATEMENT (of thia Report)
Approved for public release; distribution unlimited.
17. DISTRIBUTION STATEMENT (of the abetroct entered In Block 20. It different from Repor')
IS. SUPPLEMENTARY NOTES
19. KEY WORDS (Continue on r. vedoo s Ide ne!aeerocz' cd Identify by block number)
Loose particlesDevice cavity
20. AMSTRACT rCo m sm reft If is~swy amd fdorutify by block number)
In this report scientific evidence is presented that PIND testing, in itspresent format, is not an effective screening tool for particle contaminationin microelectronic packages.
DD0Fo 1473 EOtT1O. OF NOV SS IS OBSOLETE
SECURITY CLASSIFICATION OF THIS PAGE (Wh.en Dore Entered) IT

TABLE OF CONTENTS
PAGE NO.
I. INTRODUCTION . ........................................... 2
II. PRINCIPLES OF PIND TESTING ............................... 3
III. RESULTS OF INDUSTRY EXPERIENCE AND STUDIES .............. 5
A) National Bureau of Standards Study ................... 5
",) Adolphsen/NASA Goddard Space Flight Center Study ..... 10
C) Teledyne Study ....................................... 12
IV. SUMMARY AND RECOMMENDATIONS ............................. 14
BIBLIOGRAPHY ............................................ 15
APPENDIX I. Method 2020.1 ...................................... 17
0,
I T j
fX3
N-SPECTED C,2
i.
|1
I' - 2
I. INTRODUCTION
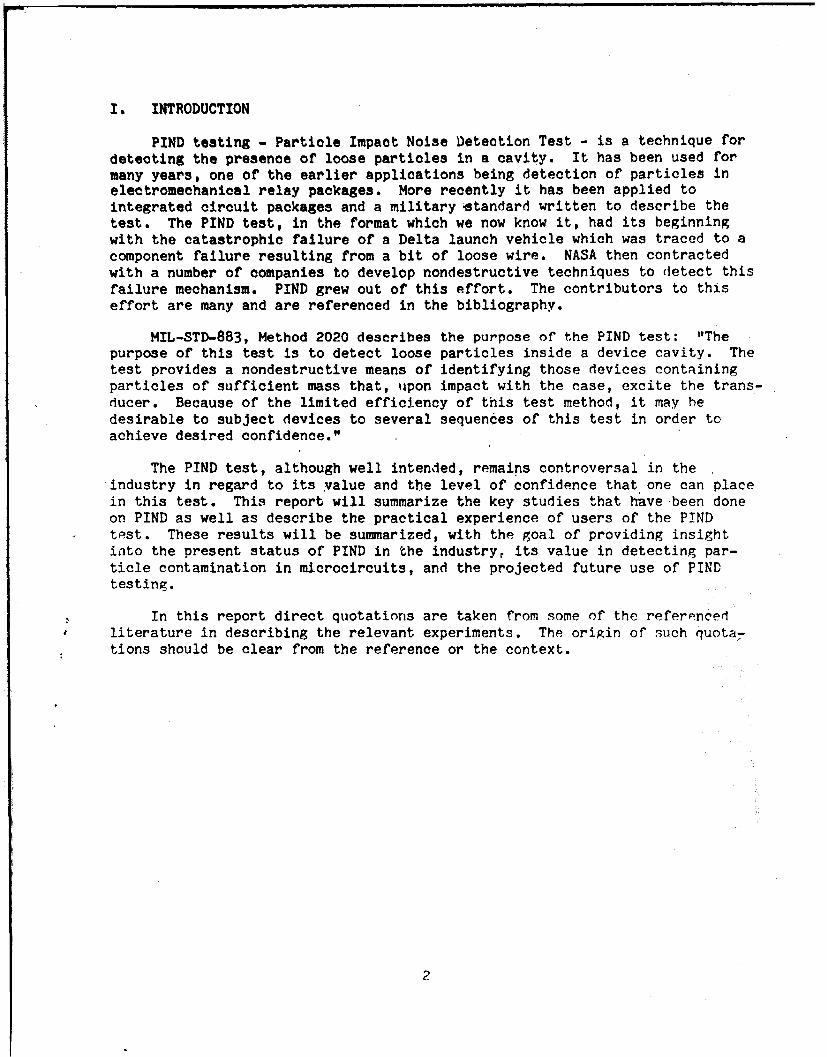
PIND testing - Particle Impact Noise Detection Test - is a technique fordetecting the presence of loose particles in a cavity. It has been used formany years, one of the earlier applications being detection of particles inelectromechanical relay packages. More recently it has been applied tointegrated circuit packages and a military etandard written to describe thetest. The PIND test, in the format which we now know it, had its beginningwith the catastrophic failure of a Delta launch vehicle which was traced to acomponent failure resulting from a bit of loose wire. NASA then contractedwith a number of companies to develop nondestructive techniques to detect thisfailure mechanism. PIND grew out of this effort. The contributors to thiseffort are many and are referenced in the bibliography.
MIL-STD-883, Method 2020 describes the purpose of the PIND test: "Thepurpose of this test is to detect loose particles inside a device cavity. Thetest provides a nondestructive means of identifying those devices containingparticles of sufficient mass that, upon impact with the case, excite the trans-ducer. Because of the limited efficiency of this test method, it may hedesirable to subject devices to several sequences of this test in order toachieve desired confidence."
The PIND test, although well intended, remains controversal in theindustry in regard to its value and the level of confidence that one can placein this test. This report will summarize the key studies that have been doneon PIND as well as describe the practical experience of users of the PINDtest. These results will be summarized, with the goal of providing insightinto the present status of PIND in the industry, its value in detecting par-ticle contamination in microcircuits, and the projected future use of PINDtesting.
In this report direct quotations are taken from some of the referpncedliterature in describing the relevant experiments. The origin of such quota-tions should be clear from the reference or the context.
2
II, PRINCIPLES OF PINL TESTING
The bisic mechanism by which 1IND testing operates is the detection ofacoustic energy which is produced when loose particles strike the interior ofa package being shaken. A cavity within a microelectronic component can con-tain small conductive particles as a result of incomplete cleaning or generalprocessing. These particles can cause a maifunction or catastrophic failureof the circuit if an unwanted electrical path is produced; thus detection ofsuch particles is desirable.
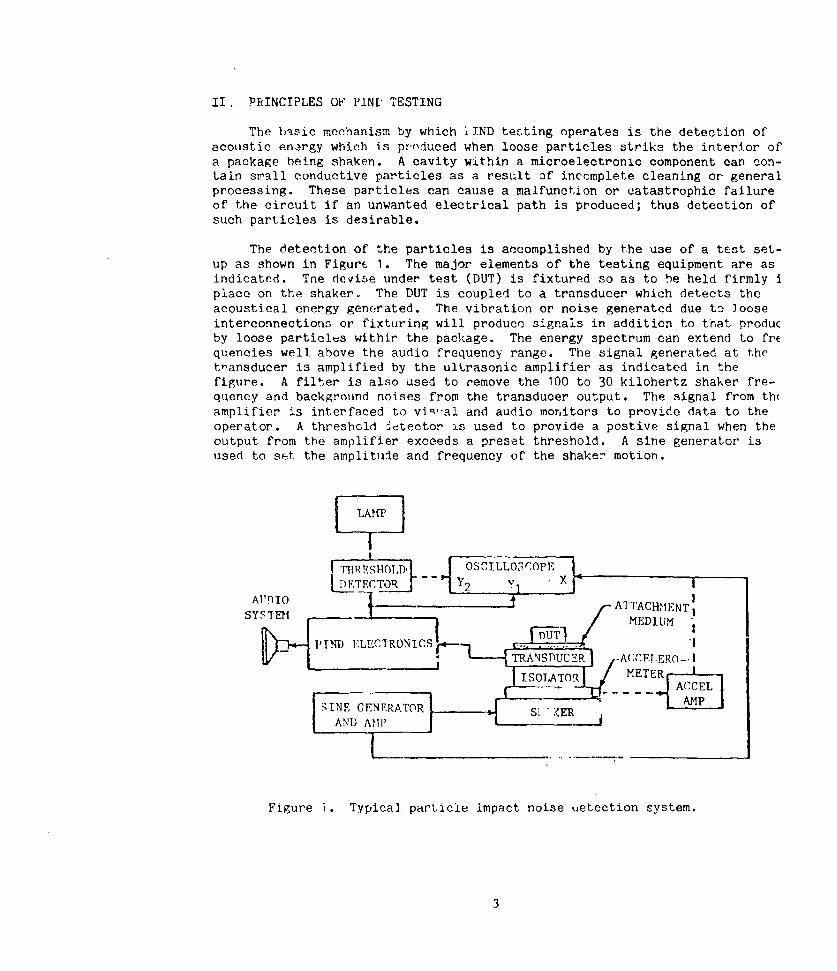
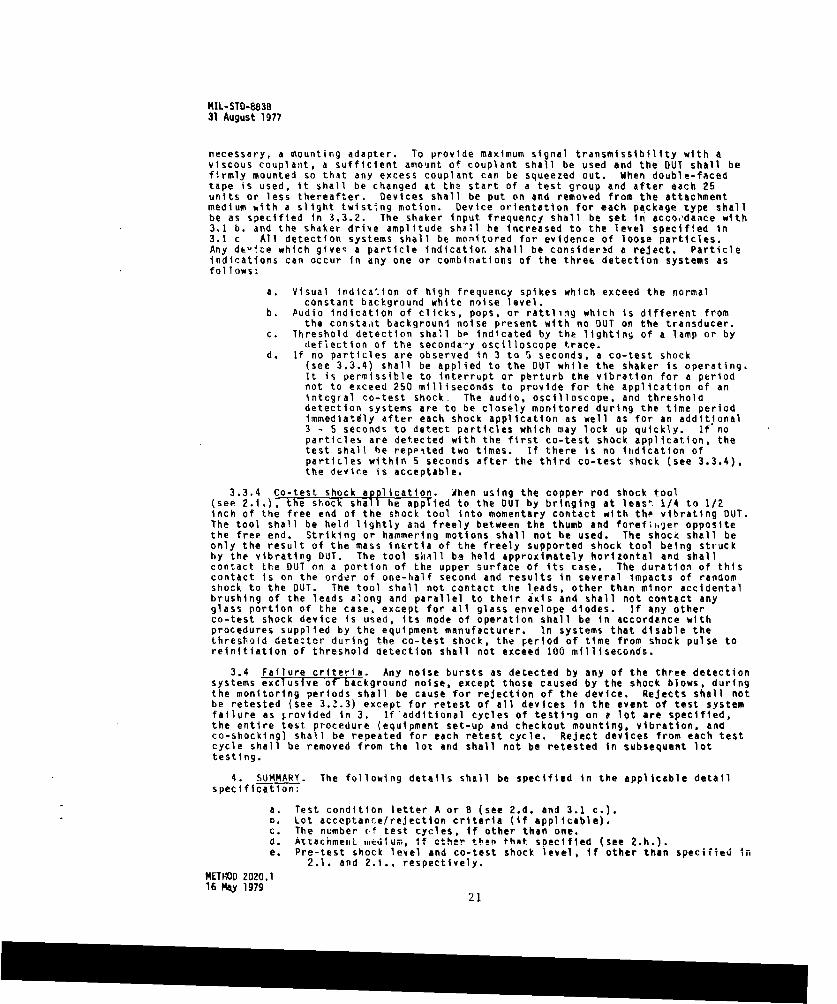
The detection of the particles is accomplished by the use of a test set-up as shown in Figurt 1. The major elements of the testing equipment are asindicated. The devise under test (DUT) is fixtured so as to be held firmly iplace on the shaker. The DUT is coupled to a transducer which detects theacoustical energy generated. The vibration or noise generated due to looseinterconnections or fixturing will produce signals in addition to that producby loose particles withir the package. The energy spectrum can extend to frEquencies well above the audio frequency range. The signal generated at thetransducer is amplified by the ultrasonic amplifier as indicated in thefigure. A filter is also used to remove the 100 to 30 kilohertz shaker fre-quency and background noises from the transducer output. The signal from th(amplifier is interfaced to vi-,al and audio monitors to provide data to theoperator. A threshold i;tector is used to provide a postive signal when theoutput from the amplifier exceeds a preset threshold. A sine generator isused to set the amplitude and frequency of the shaker motion.
EThR!SHOLD _ OS..ILLO&;:OPE
Y ETECTR xAUDIO •ATTACHMENT
SYST-E - MEDIUM
r 7_9PINT) E"LECTRONICS ]4-
TRANSDUCER .ACCELERO-- I
ISOLATOR METER IACEL
,SINE GENERATOR, AP
ANDT AMP
Figure i. Typical particle impact noise u.etection system.
3

The Lest method 2020.1 is included as an appendix to this report. Thepurpose of the test methou is:
"1. PURPOSE. The purpose of this test is to detect loose par-ticles inside a device cavity. This test provides a nondestruc-tive means of identifying those devices containing particles ofsufficient mass that, upon impact with the case, excite thetransducer. Because o? the. limited efficiency of the testmethod, it may be desirable to subject devices to several sequen-ce3 of this test in order to achieve desired confidence."
The test method requires a test sequence of:
"3.3 Test Sequence
a. Pre-test shook
b. Vibration 3-5 secouids
c. Co-test shock
d. Vibration 3-5 seconds
e. Co-test shock
f. Vibration 3-5 seconds
g. Co-test shock
h. Vibration 3-5 seconds
i. Test for acceptance"
The main feature of this test sequence is the application of a co-testshock to produce sufficient energy to dislodge particles within the cavity.This shoo'k is produced by a copper rod brought to momentary contact with thevibrating DUT.
The rejection of devices is determined by the deteotion of noise burstsabove the background noise either by audio indication, visual indication on ascope or exceeding a threshold detector limit. The details of the method arecontained in Appendix I.
4
III. RESULTS OF INDUSTRY EXPERIENCE AND STUDIES
A. National Bureau of Standards (NBS) Study
In an exhaustive study performed in 1978 by the National Bureau ofStandards (NBS) for NASA, an attempt was made to work exclusively withcontrolled samples. Using deliberately "seeded" packages and totallyparticle-free packages as controls, several hundred packages were examined.Variables included: a) Particle size and shape b) Presence/absence/magnitideof co-shock c) Acceleration of shaking d) Package type and e) Four differentPIND machine manufaiturers or configurations. NBS has an excellent reputationfor implementing controlled experiments and this 62-page detailed report is noexception. Yet, analyzing known conditons, they detect particles in delibera-tely contaminated packages with only 40 to 60% success and, conversely,detected "particles" in the known clean samples in 10-20% of the packages.
Some direct quotes from the Executive Summary of this report:
"The work described constitutes an evaluation of the test proce-dures and apparatus specified in MIL-STD-883, Test Method 2020,Particle Impact Noise Detection Test."
"The intent of the work was not to proviue in any sense a defini-tive study of PIND procedures, nor was it to devise an excep-tionally ingenious method that would solve the "the" PIND problem.As an index to the state cf knowledge in the PIND area, considerthe following; It has been estimated that a thorough examinationof one aspect of PIND--the role of electrostatic mechanisms in theimmobilization and release of particles--would require over fiveman years to achieve basic understanding with no guarantee of anyinformation being developed that could be used directly in PINDtesting (although it is likely that information that could be usedby microelectronic device designers would be generated)."
It would appear that NBS is suggesting there is a fundamental measurementproblem with this technique. Continuing to quote from this NBS report:
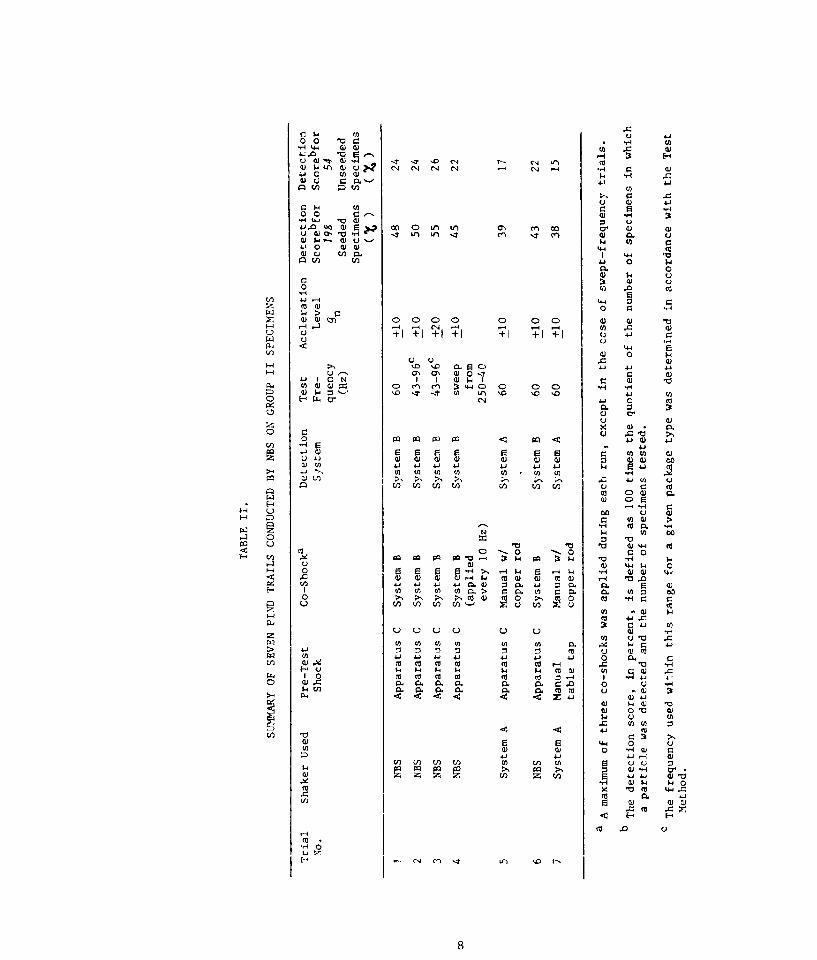
"These second-stage tests were carried out on 252 specimen devi-ces, representing siý package types and a number of different seedparti'cle sizes in several materials (see Table I for detailedlist); these devices were characterized by the commercial supplieras either intentionally seeded with a single particle or free fromany particle that could result in detection in a PIND run. (Itshould be noted that particles such as aluminum sphere 0.025 mm indiameter have a low enough mass -- nominally 0.02 pg -- that thesupolier, in common with other test operators, did not regard TestMethod 2020 procedures as adequate for their detection, even iffree.) These seeded and unseeded specimens were th3 subject ofseven trials in the NBS laboratory and, later, of three additionaltrials in the supplier's facility (Appendix I constitutes detailedinformation on the results from each trail; summaries are pre-sented in Table II for NBS and Table III for the supplier.)"
5

"After several of the NBS trials were completed, it became obviousthat according to the supplier's characterization (seeded orunseeded) the NBS results were showing low detection scores forseeded specimens and, even less understandably, detections inunseeded ones. There were a number of possible explanations;these are examined in detail in 2.1.4. Although it was notpossible to arrive at a definitive explanation of the anomalies,it -s likely that some event affected the specimens between thetime they were tested prior to shipment to NBS by the supplier andthe time of the first NBS trial. It is noteworthy that the threepost-NBS trials conducted by the supplier (at his suggestion, inan attempt to resolve uncertainties) are in better agreement withthe NBS results that with is initial characterization."
This further illustrates that PIND test reproducibility is poor. NBSalso said.
"The chief recommendation applying to the development of the TestMethod, given in 4.1, is that semi-automatic apparatus be used toavoid difficulties with operator fatigue, judged to be severe in aproduction line testing operation. It should be pointed out,however, that the NBS results, even when corrected as suggested in3.1, do not show high detecability scores even for the specialparticles used as seeds, which may not be (indeed probably arenot) typical of the free particles enclosed in sealedmicroelectronic devices on the production line. As devicegeometries grow smaller, the size of an "acceptable" conductingparticle will drop, yet there is no guarantee that the mechanismsproducing particles will compensate by generating small particles,although if this were the case, present-+day PIND procedures wouldnot be likely to detect them. The point is simply that the PINDart is an uncertain one; the relatively limited NBS trials(compared to operators who have tested tens of thousands ofdevices) can perhaps best serve to provide a caution related tooverreliance on PIND as a method of qualification."
The fact that the National Bureau of Standards has to refer to PINDtesting to the MIL-SPEC method as an "uncertain" "art" based on their owndetailed analysis is one of the most significant of the numerous indictmentsof the technique.
Following are the data tables referenced in the above NBS comments,illustrating the inconsistencies in the method.

TABLE I.
GROUP I SPECIMENS
NUMBER PACKAGE PARTIr;LE CHARACTERIZATIONOF TYPE NOMINAL CALCULATED
SPECIMENS MATERIAL SHAPE DIAMETER NOMINALMASS
(mm) ( in) kpig)
2 TO-5 Gold Sphere 0.102 0.004 10.6
2 TO-5 Gold Sphere 0.051 0.002 1.3
2 TO-5 Lead Sphere 0.152 0.006 21.1
2 TO-5 Lead Sphere 0.076 0.003 2.6
2 TO-5 Lead Sphere 0.025 0.001 .1
I TO-5 Unseeded
2 TO-18 Gold Sphere 0.102 0.004 10.6
"2 TO-18 Gold Sphere 0.051 0.002 1.3
2 TO-18 Lead Sphere 0.152 0.006 21,1
2 TO-18 Lead Sphere 0.076 0.003 2.6
2 TO-1 Lead Sphere 0.025 0.001 .1
I TO-18 Unseeded
I aFlatpack Gold Sphere 0.051 0.002 1.3
I Flatpack Gold Sphere 0.102 0.002 10.6
1 Flatpack Lead Sphere 0.076 0.003 2.6
a With metal lid, 6.4 x 3.3 mm (0.25 x 0.13 in), 14 lead
7
"444- 413~ C C420 0~ ' m4 v 4)
U~~ 4w 11 U- - c4 V
014 (4A '-
'toi0 ) ft? 0X n I ' e ' 4u7 -- n In 'r m 'ren 43 0(V 14y M) r- I CJ., 0 4343 44cc
W. 0
43 4co 43 C
0 0U .0 0
0 Q+1 +1 +1+1 +1 + 1 ~+1 (u 4
A4 '21 E~w 0 p04
W '0 ' .0 u-i r. 4-ow Q ," 0' 0' 4 0DtC 43
0 Er' o' (NJ 0 C
0' =
C U) w 43t4< 43' 0'4.oo 43 wC' rA W (
m 44 C 4CA~( 0~42- 4
43 43 4 4 3 3 4 5 44 00
43WW Q 44 44 44 40444 1 4ý- 0 ' 0 r: H0 40) Q UW WA A 'A cu CA WI CA U V C
w 43 0l.w P. = PH ;> 610 Uo 043 HrH V) En En4 u>nuc
z f
Ln.' 1pm Mr 4 CU 0
-34 '44 0 cH . D2 0 "4 ,44 04 4 ' 33 t-
Lo 4 3 1
H> (UU.P4 $-0 4 CU0
v) Qc U C 4CU Uf E-4
caU C U C U U 0 5 C 4
'-' i -, " C '2 43C

00 V)
+1'- 00 0)F l
4.0 4)c 'o n
40 C- ac 54J 0-- 0J 0)
06
;:j al V) cn.- .
.10 fa
LfSC)
CU --
I-70
L, 4.)U
Lei4 4) +1 ms- m
C, aJ~V) ) 0 '
>4 0-- 5
I.) 4-)I
CL OJ o1 >l 0 cm
LU (U W4
=3. 0L 4 ) +jC a
LA
to C :; cn-
4' C)- 4-) L7) C0V)) 4.o4
oj C A C) CAL:
fo lu > U
- LU L)
)L 0D -Sm S04 CA
I- 01 4-' 4-) cC'
Cý 0 ' >O >0 = r
CC 4' U
.04
O C.)04. C' C *-
(D St) 2' 29
B. Adolphsen/NASA Goddard Space Flight Center Study
A tuost recent and complete study of the validity of PIND testing was per-formed by John Adolphsen of NASA Goddard. He performed a large round-robinexperiment to determine the sensitivity of detection of particles not per-manently attached and to see how they depend upon a number of variables suchas particles size, shape and composition, package style, test method, attach-ment method, or test equipment. To assure positive knowledge of the truedetection capability of testers, particles of different materials and sizeswere seeded into a variety of package styles, while other packages were leftunseeded. About one hundred aerospace companies, including users, test labs,and semiconductor manufacturers, then agreed to participate in a round-robinprogram to PIND test these devices and demonstrate the effectivity of thismeans of particle detection at the operational level. The goals for theprogram were: (1) to test the effectiveness of PIND on a broad base oftesters, users, test labs and semiconductor manfacturers to determine whatvariability exists in the industry as a whole; (2) test the MIL-STD testmethod itself, by determining if operational problems or deficiencies exist inthe requirements, apparatus, or procedures and to determine if one of the twovariations of the test is superior to the other; (3) suggest modifications tothe test method, if so included, based on round-robin results; (4) provideinformation on the effects of several variables, such as: package style, par-ticle size, size and shape, operator experience, test equipment, accelerationlevels, and shaker operating frequency: (5) provide information to testinggroups on their ability to detect particles, both absolutely and relative tothe capability of others, (6) decrease the subjectivity of statements maderegarding PIND effectiveness; (7) provide information to potential buyers ofPIND testing and their advisors regarding the effectiveness and cost effec-tiveness of PIND testing.
It was decided to split 297 pieces into three equal groups for concurrenttesting. Each testing company was asked to test their sample group of 99pieces in at least two ways, i.e., strictly in accordance with conditions "A"and with condition "B" of test method 2020.
In addition, if they normally did not test in accordance with method2020, they were asked to do it in their third way, also. If a company wantedto test in any single way more then once, they were invited to do so, but wereasked to retest the whole group, not just those survivors to the previoustests. The rar;.. <' package styles included six mcnoli'hic and five hybridstyles. The :•:iton of the seeding material included gold, aluminum, leador silicon-a' n. The seeded material varied in size and shape and alsowith tne sj.ze of Lhe package. Apn *or variant employed was the method whichwas used to attach the device under test to the equipment. Water solublejelly, alcohol jelly, or double sided sticky tape.
Several workers have suggested thr.t there may be a "memory" effect whicha device acquires with repeated testing. This memory effect acts to decreasethe detectability of a particle tn a package. If this effect exists, it mightadversely influence the scoring of those companies at the end of the round-robin. If the effect is sufficiently large, is should be obvious by plottingcompany results in chronological order of testing.
10

Although the round-robin is not yet complete, and some data are sparse,or not yet computer formatted and analyzed, some conclusions can be crawn atthis time. Adjustment of scores, after accurately determining if particlesare present in packages, many modify some scores, but changes are not expectedto be major.
1) The most obvious conclusion is that PIND testing may be better or worsethan some expected to be demonstrated, but it ic not as gocd a screen test zamost other MIL type screens. Average detection scores in the low or mid 40'sfor PIND testing compare poorly with scores in the 90's for many MIL screens.
2) The range in detection scores from cotpany to company is disturbinglywide. The implications of blind selection of a company to perform PINDtesting may assume an unacceptably high risk. Alternatively, extensivetraining and qualification of tasting companies may be necessary.
3) Detection sensitivity is highly package style dependent, and is thelowest for ceramic body packages.
4) As intuitively expected, detection capahility increases with particlesize.
5) For the itifferenr' material seeded here, detection sensitivity does notappear to vary significantly.
6) Testing using condition "A" of test method 2020 appears to be superiorto other method-,, but further data and in-depth analyses are necessary beforerecommending its use in all cases.
7) Although no data were presented to support this conclusion, the dif-ferences in detection sensitivity between couplants is minor.
Aldophsen then recommended that comp- Les which exhibit poor detectionscores should emphasize training and motivation with their personnel who per-form these tests. He also recommended that potential testers should be testedand qualified to perform PIND testing prior to imposition of PIND testing andaward of contracts. He also recommended the use of seeded packages to be usedas calibration standards. And finally he concluded with a recommendation thatPIND testing should be used in programs whoer criticality of missions washigh.
In further discussions with Mr. Adolphsen he has mentioned that his studyshowed there is about 3 to 4 superiority for conditions "A" testing over con-dition "B" testing. Another interesting aspect from a later discussion withMr. Adolphsen was that of the companies who scored high on detection, whichmeans that for packages which were seeded, they found many of them to showpositive presence of particles, those same companies also scored high on theseeded. In other words, from the manufacturer's standpoint, he would bethrowing away good devices.
11

Further tests by John Adolphsen have observed and substantiated thememory effect which was first mentioned by John Slocum at McDonnell-Douglas.As a result of corrections due to the memory effect mentioned, John Adolphsenfeels that the score or the detectibility for PIND testing should be correctedto the vicinity of 44% rather than the previously mentioned 30%; however, thisis still a disturbingly low detectibility figure.
C. Teledyne Study
The Teledyne Study was much more critical of the entire test method. Inthis study 60 hybrids were fabricated. Thirty wepe in smaller flat packs andthe othe- 30 were in larger flat packs. The packages were seeded with threesizes of silicon particles and three sizes of lead-tin solder particles. Thesilicon particles and the eolder particles ranged from 0.001 inch to 0.020inch. Each part was tested three times and the results are tabulated in TableI'. as shown below. The conclusions that Dr. David comes to are summarized inthe following tabulations:
1. The escape rate for conductive particles was 40%;
2. The escape rate for non-conductive particles was 2%;
3. The false alarm rate ranged from 5 to 10%;
4. The correlation coefficient wa3 0.6.
A further problem arose as a result of the testing in terms of induceddamage at a rate of 10%. Dr. David questions the value of the entire test andclaims it to be marginal at best. He further states that the test ic mostsuccessful in detecting non-conducting partiUles which are typlcally not ofinterest in the hybrid circuit field. He further insists that with the highfalse alarm rate, sample testing with lot jeopardy is merely a form of Russianroulette. resting until less than 1% of units fail is Russian roulette playedan infinite number of times; it is very difficult to win that game. He alsopoints out the added problems of increased tcst and extended schedule alongwith the concomitant frustration.
David then concluded with the recommendations that:
1. The use of co-shock devices built into the shaker assembly rather thana copper rod or dental tool, would reduce the amount of induced damage.
2. The use of a threshold detector set at a high level far above thesystem noise level would serve to reduce the excess number of false alarms.
3. Repeated PIND testing would reduce the escape rate.
4. He recommends the use of coating the internal surfaces of hybridcircuits with a dielectric material to give positive protection against shortscaused by conductive particles.
12

TABLE IV. PIND Test Results
Escape Rate Correlation Coefficient
Package/Parti cle
Type/Category Test 1 Test 2. Test 3 1 to 2 2 to 3
SFP .001"Si 60% 100% 100% 0.2 1.0
SFP .005Si 40% 40% 60% 1.0 0.6
SFP .020"Si 0% 20% 40% 0.6 0.6
SFP .001"PbSn 100% 100% 100% 1.0 1.0
SFP .005"PbSn 100% 75% 0% 0.5 -0.5
SFP .020"PbSn 20% 40% 40% -0.2 1.0
LFP .001"Si 60% 40% 60% -0.2 0.6
LFP .005"Si 0% 0% 0% 1.0 1.0
LFP .020"Si 25% 25% 0% 1.0 0.5
LFP .001"PbSn 60% 60o 40% 0.2 -0.2
LPF .005"PbSn n% 20% 20% 0.6 1.0
LPF .020"PbSn 0% 0% 0% 1.0 1.0
Combined 3% 44% 40% 0.54 0.65
SFP = Small Flat Pack
LFP = Large Flat Pack
13

IV. SUMMARY AND RECOMMENDATIONS
It is clear, statistically, practically, and demonstrably, that the pre-sent PIND technique is ineffective and even potentially detrimental in applica-tion to the particle problem. Unfortunately, in the rush to provideparticle-free packages into high-rel applications, it is now obvious by manyunbiased studies, that the PIND method might confirm the presence of particlesno better than about 50% of the time and will cause rejection of particle freecomponents up to 25%; in addition, it may be inducing some damage in the cir-cuit. With the probability of successful event-prediction in the range of 50%,the test should not be utilized.
Elimination of the test has more advantages than its application: we woulda) not falsely detect and reject 10-25% of the good devices b) not create devi-ces with particles where there were previously none and c) not have gonethrough the cost, expense, and time lost for a PIND test.
It has been shown that in its present format the PIND te.st is a largelysubjective test, with wide variations in results from one test system toanother, and with unacceptable escape rates and false alarm rates for aMIL-SPEC. These rates were confirmed in several independent investigations ina rigorous manner by well-respected technical organizations. The test eqdipmentand procedures need further improvements and refinements to obtain reproduc-ible results. The following steps are recommended to alleviate the presentserious problem:
1) Stop using PIND testing, except possibly for extremely high reliabilityrequirements such as satellites. Recognize it is ineffective, as a generalMIL-SPEC, potentially even contributing to the problem. Suspend the MIL-STDmethod 2020.1 indefinitely.
2) Enforce cleanliness in the pre-seal areas of assembly operations. Thesource of most conductive particles is known, as is the processes and processcontrols to eliminate triem.
3) Apply a rigorous cleaning step just prior to the sealing operation.Such cleaning processes are well known and practical.
4) Require that all solid state devices with closely spaced conductor runsbe covered with an insulated layer.
5) Require that no shallow angle bonding be allowed.
6) Continue to investigate improved methods of particle detection.
If these items are implemented, the ultimate reliability of all electroniccomponents as regards particulate contamination wil). be considerably improved,and the utilization of the proven unacceptable PIND test will be unnecessary.
14
BIBLIOGRAPHY
Adolphsen, J. W., "The Effectivity of PIND Testing" Proc 1979 ISTFA, LosAngeles
Adolphsen, J. W., Kagdis, William A., and Timmins, Albert R. A Survey ofParticle Contamination in Electronic Devices, NASA Goddard Space Fight CenterDocument X-311-76-266 (Preprint), December 1976.
Angleton, J. L. and Webster, S. L., "Techniques for Standardization ofParticle Noise in Electronic Packages," 12th Annual Proceedings, ReliabilityPhysics, 1974.
Antonopolis, R. G., ":Techniques for Posc-PIND-Test Examination of ParticleContamination in Semiconductor Devices," Proc. ATFA 1977.
Caruso, Salvadore V., Some aspeots of contamination detection, analyses, andcontrol in microcircuits for the NASA Shuttle program - 28th ElectronicComponents Conference Preceedings 197 8 -p2 8 -32.
David, R. F. S., "Practical Limitations of PIND Testing" Proceedings of the1978 Electronic Components Conference.
Fisher, H. Dwight, Analysis of volatile contaminants in microcircuits-SolidState Technology-June 1978-p 6 8-82.
Himmel, R. P., 'Contamination Control in Hybrid Microelectronic Modules, Part2: Selection and Evaluation of Coating Materials," NASA Contractor Report,NASA CR-144102, April, 1975.
Isaacson, M., Interaction ef 25 keV electronic with the nucleic acid, bases,adenine, thymine and uracil. J. Chem. Phys. 56 (1972) 1803-1811.
Jelliion, James L., Effect of surface contamination on the bondability of golc- 25th Electronic Components Conference Proceedings 1975.
Jellison, James L., Johnson, D. R. and Hosking, F. Micael, Statisticalinterpretation of Meniscograph Solderability tests IEEE Transaction on PHP-Vo:12 No 2 June 1976-.p126-133.
Kale, V. S. and Riley, T. J., "A Production Coating Process for HybridMicrocircuits," Proceedings of the 27th Electronic Components Conference, May1977.
Landon, V. D., "The Distribution of Amplitude with Time in Fluctuation Noise,IRE Proceedings, 29 (1941) pp. 55-55.
Lang, 13., Secondary electron spectroscope of platinum and carbon surfaces,3UV. "c4 66, (1977) -5P7-541,
15
LeGressus, C., Massignon, D., Sopizet, R., et al. Apports de la spectroscopiedes elcetronis secondaires et des electronics Auger a la physique do la fiabi-lity en microelectronique, Illeme Congres National de Fiability - 14/+7Septembre 1876, Centre de Fiability CNET-Lannion-France p 82-100.
LeGressus, C., M~s'ignon, D., Sopizet, R., Low beam current density AugerSpectroscopy and surface analysis, Surface Sciences 68 (1077) 338-345.
LeGressus, G., Sopizet, R., Spectroscopie d'electronis lents a haute resolu-tion spatiale-Le Vide-March 1979-83-138.
Levwn, Stephen S., -Screening Procedure for adhesion degradation due to solderleaching in thick-fi.m hybrid microcircuits-Report ECOM-73-0326F-October 1975.
McCullough, Ralph, "Hermeticity and Particle Impace Noise Test Techniques,"14th Annual Proceedings, Reliability Physics, 1976.
McCullogh, R., "Screening Techniques for Intermittent Shorts," 10th AnnualProceedings, Reliability Physics, 1972.
Miller, Barry, "Cures sought for Parts Contamination," Aviation Week & SpaceTechnology, Vol. 106, No. 15 pp. 44 ff (11 April 1977).
National Bureau of -tandards Report NBSIR 78-1590 (NASA), Loose-ParticleDetection in Microelectronic Devices.
Operation Manual, Model BW-LPD-AlO00 Particle Impact Noise Detection System,B and W Engineering Serviecs, February 1977.
"Particle Impact Noise Detection Test," Mehtod 2020, Department of DefenseMIL-STD-883, Test Methods and Procedures for Microelectronics.
Rickabough, L. J., and Ionic Contamination Detection System (I.C.D.S.) withimproved Performance for Quantizing Residual Ionic Species IEEE Transactionson components, hybrids and manufacturing technology-Vol CHMT2 No.1, March1979-p 134-139.
Riga, Georgio, TP-5 Discoloration and bondability-11th Annual Pro'-idings -Reliability Physics 1973 p 26-32.
Schreir, L. A., "Automated Shock in PIND Testing," Proceedings of the 27thElectronics Components Conference, May 1977.
Tissier, G. - Dela teneur en or des joints brases - Courrier TechnologiqueTHOMSOM-CSF N 39 Oct/Nov 1976 et N 40 Jan. 1977.
Val, C-rflIticouche serigraphis a bases de conducteur cuivre - Revue techniqueTHOMSON-CSF - Vol 11 N 2 - Juin 1979-p259-280.
16
APPENDIX I.METHOD 2020.1
17
Mil-,STO-883931 kAuist 1977
METHOD 2020.1
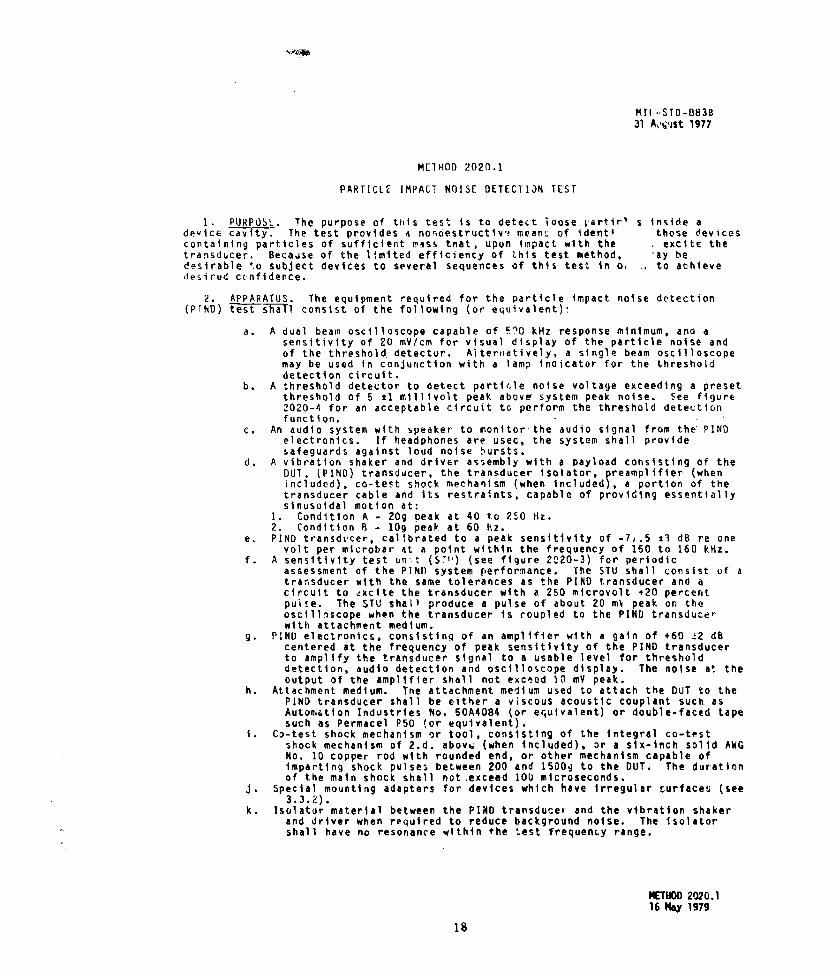
PARTICLE IMPACT NOISE DETECTION TEST
1. PURPOSE. The purpose of tiis test is to detect loose Vartir' s inside adewice cavity. The test provides a nonoestructlv't meant; of ident' those devicescontaining particles of sufficient mass tnat, upon impact with the excite thetransducer. Becadse of the limited efficiency of this test method, -ay bedesirable to subject devices to several sequences of this test in o, .. to achievedesired ccnfidence.
2. APPARATUS. The equipment required for the particle impact noise detection(PTND) test shall consist of the following (or equivalent).
a. A dual beam oscilloscope capable of F10 kHz response minimum, ana asensitivity of 20 mV/cm for visual display of the particle noise andof the threshold, detector. Alternatively, a single beam oscilloscopemay be used in conjunction with a lamp inaicator for the thresholddetection circuit.
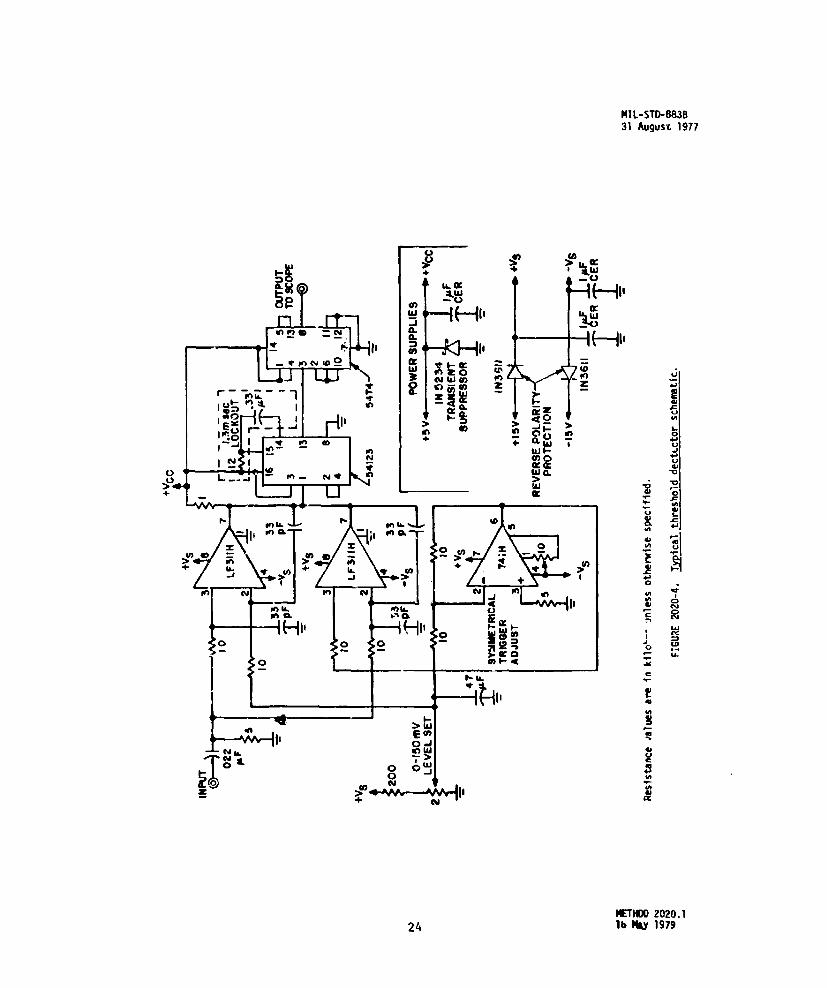
b. A threshold detector to detect partitle noise voltage exceeding a presetthreshold of 5 ±1 millivolt peak above system peak noise. See figure2020-4 for an acceptable circuit to perform the threshold detectionfunction.
c. An audio system with speaker to monitor-the audio signal from the PINDelectronics. If headphones are used, the system shall providesafeguards against loud noise 5ursts.
d. A vibration shaker and driver assembly with a payload consisting of theDOUT. (PIND) transducer, the transducer isolator, preamplifier (whenincluded), co-test shock mechanism (when included), a portion of thetransducer cable and its restraints, capable of providing essentiallysinusoidal motion at:
1. Condition A - 20g peak at 40 to 2S0 Hz.2. Condition B - lOg peak at 60 iz.
e. PIND transdvcer, calibrated to a peak sensitivity of -7,.5 ±3 dB re onevolt per microbar at a point within the frequency of 150 to 160 kHz.
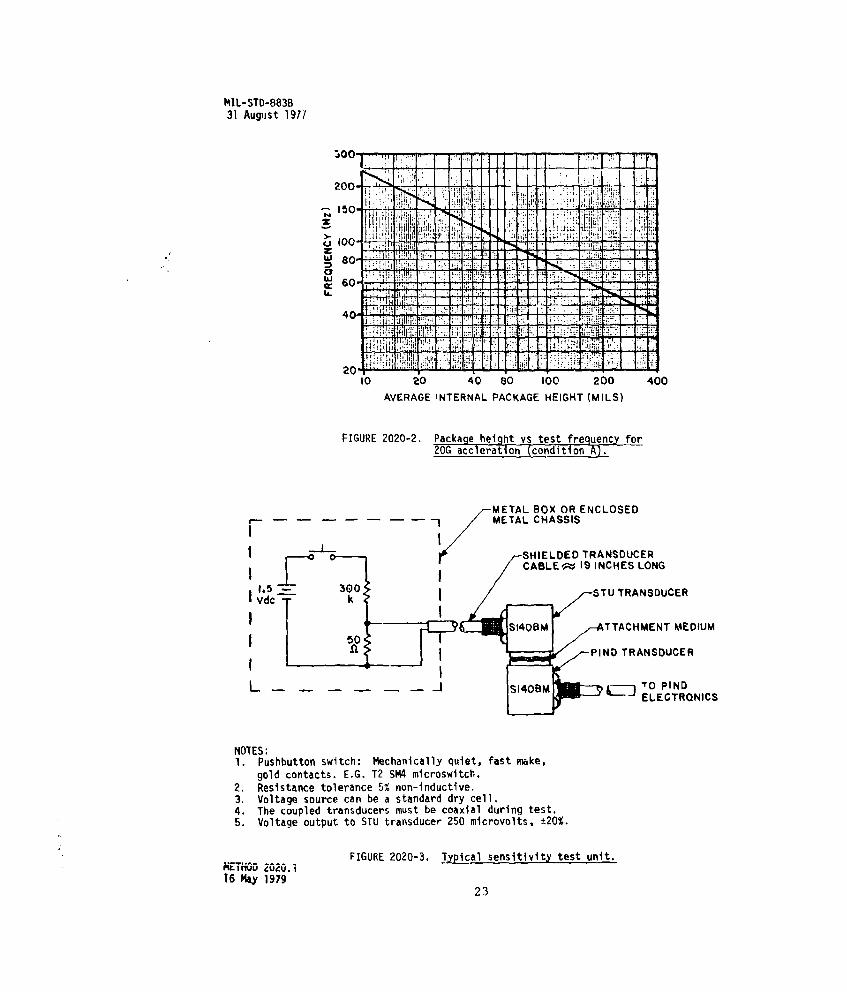
f. A sensitivity test un;t (S70) (see figure 2020-3) for periodicassessment of the PIND system performance. The STU shall consist uf atransducer with the same tolerances as the PIND transducer and acircuit to •xcite the transducer with a 250 microvolt t20 percentpulse. The STU shall produce a pulse of about 20 mV peak on theoscilloscope when the transducer is coupled to the PIND transducerwith attachment medium.
g. PIND electronics, consisting of an amplifier with a gain of +60 12 dBcentered at the frequency of peak sensitivity of the PIND transducerto amplify the transducer signal to a usable level for thresholddetection, audio detection and oscilloscope display. The noise at theoutput of the amplifier shall not exceed 10 mV peak.
h. Attachment medium. The attachment medium used to attach the DUT to thePIND transducer shall be either a viscous acoustic couplant such asAutomation Industries No. 50A4084 (or equivalent) or double-faced tapesuch as Permacel P50 (or equivalent).
I. Co-test shock mechanism or tool, consisting of the integral co-testshock mechanism of 2.d. abovu (when included), or a six-inch solid AWGNo. 10 copper rod with rounded end, or other mechanism capable ofimparting shock pulses between 200 and 15009 to the DOUT. The durationof the main shock shall not.exceed 10O microseconds.
j. Special mounting adapters for devices which have irregular surfaces (see3.3.2).
k. Isolator material between the PIND transducer and the vibration shakerand driver when required to reduce background noise. The isolatorshall have no resonance within the test frequenLy range.
METHOD 2020.1
16 Ky 197918

MIL-STO-883B31 August 1977
1. A pre-test shock fixture capable of imparting shock pulses between 500and 1800g to the DUT. The duration of the main shock shall not exceed100 microseconds. A co-test shock mechanism integral to the :hakerand driver may be used for this purpose.
3. PROCEDURES.
3.1 Testleguipment set-up. The test Aquipment shall be connected as indicated infigure 2RO _ a, setup In a low background noise area, Critical settings toprovide proper detection sensitivity, unless otherwise specified. are as follows:
a. Audio output volume shall be adjusted to a comfortable noise leveloutput.
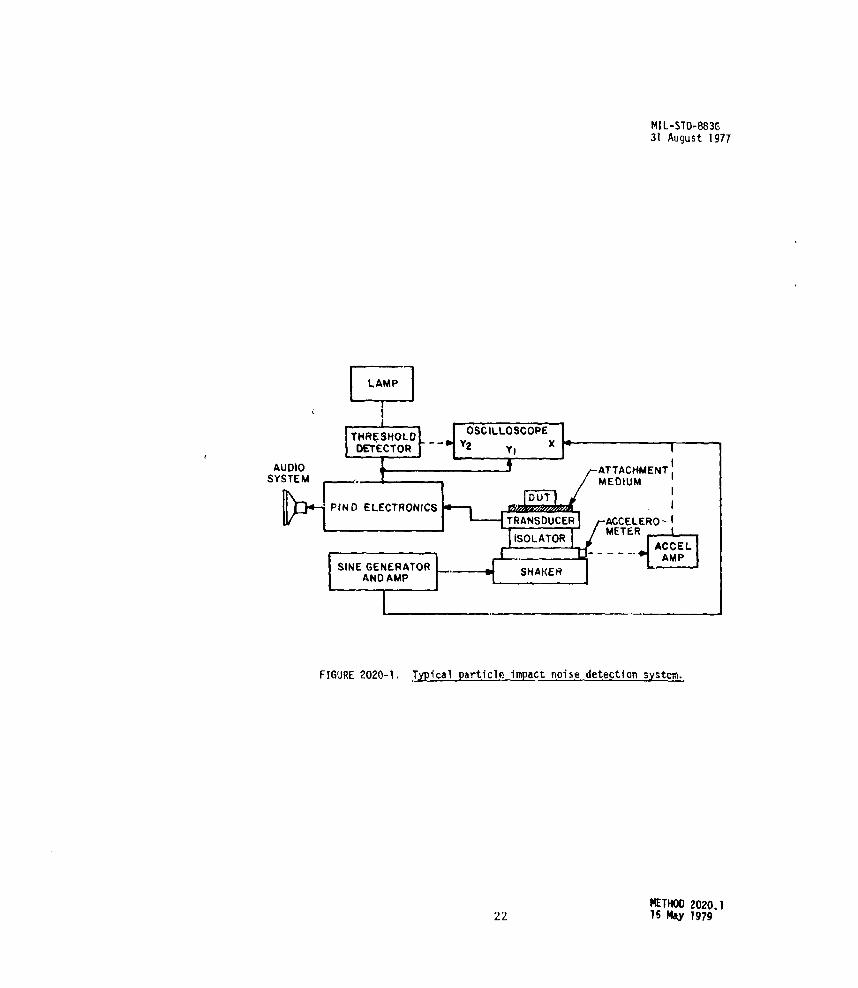
b. Shaker drive frequency shall be adjusted in accordance with figure2020-2 for condition A. or at 60 Hz for condition B.
c. Shaker drive amplitude shall be 209 (condition A) or 109 (condition B)with OUT and mounting adapter (if any) in place.
d. Oscilloscope vertical deflection primary beam sensitivity (displaying'IND electronics outrut) shall he 20 millivolts/centimeter. Secondary
beam sensitivity (if displaying threshold detector output) shallprciuce approximately a 2 centimeter deflection difference oetween thetwo states of the threshold detector. The secondary beam display(without horizontal deflection) shall be centered vertically andapproximately 1 centimeter to the left or right of the primary beamdisplay.
e. Oscilloacope horizontal deflection shall be adjusted to 4 cm and shallobtain drive from the sine generator/amplifiar, amplifiedaccelerometer, or a time base (2 ms/cm) triggered from theaccelerometer output.
3.2 Test equipment checkout. The Lest equipment checkout shall be performed toassure proper system operation, when any of the following occurs:
a. After a change of vibration frequency.b. System shut-down for any reason.c. Chanue of operators.d. Work shift change.e. Prior to and after testing group(s) of devices or every 4 hours during
the test operating period, whichever comes first. System deficienciesshall be corrected prior to test. Failure of the system to meetcheckout requirements shall require retest of ll devices testedsubsequent tc the last successful system checkout.
3.2.1 Shaker drive system checkout. The drive system shall achieve the shakerfrequency spec ifeT n 3.1 b. and the shaker amplitude specified In 3.1 c. If avisual displacement monitor Is affixed to the transducer, it may be used foramplitudes between 0.04 and 0.12 inch (1.02 and 3.05 mm). An accelerometer may beused over the entire range of amplitudes and shall be used below amplitudes of0.040 inch (1.02 mm).
3.2.2 Detection sse hkout. With the shaker deenergized, the STU transducershall be mounted face-to-c and coaxial with the PIND transducer using therecommended attachment medium. The STU shall be activated several times to varifylow level signal pulse visual and threshold detection on the oscilloscope(approximately 20 millivolt peak or 10 millivolt peak above system noise).
NOTE: Not every application of the STU will produce the required amplitude butthe majority of applications will do so.
3.2.3 System noise verification. For proper system operation, no extraneousneis• car be permitted to eyist in the system. During proper operation, the normalsystem noise, as observed on the oscilloscope, will appear as a fairly constant bandand must not excerd 10 millivolts zero to peak. Extraneous noise is defined as noisein the system other than the permissible background noise that is present with nodevice on the transducer. Such ncise can be due to a number of sources which -ust beeliminated or their effects guardet' against, since those non-sgnal fi oiSe spi•e; c;ntrigger the threshold detector and appear As signals on the othtr indicators. Commonsources of external noise are fluoriscent lighting, high voltage discharge andespecially, less than optimum installation and support of the transducer cabling.
METHOD 2020.1 1916 Nay 1979
MIL-STD-883B31 August 1977
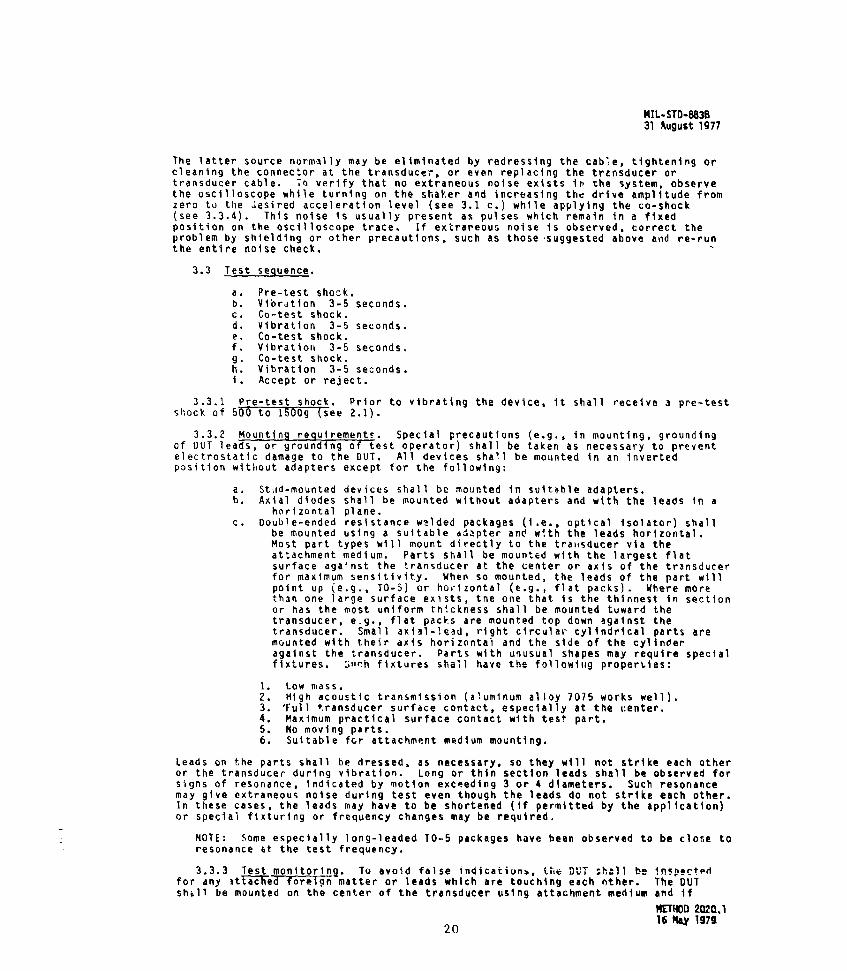
The latter source normally may be eliminated by redressing the cable, tightening orcleaning the connector at the transducer, or even replacing the trznsducer ortransducer cable. To verify that no extraneous noise exists in the system, observethe oscilloscope while turning on the shaker and increasing the drive amplitude fromzero to the desired acceleration level (see 3.1 c.) while applying the co-shock(see 3.3.4). This noise is usually present as pulses which remain in a fixedposition on the oscilloscope trace. If extrareous noise is observed, correct theproblem by shielding or other precautions, such as those suggested above and re-runthe entire noise check.
3.3 Test sequence.
a. Pre-test shock.b. Vibration 3-5 seconds.c. Co-test shock.d. Vibration 3-5 seconds.e. Co-test shock.f. Vibration 3-5 seconds.g. Co-test shock.h. Vibration 3-5 seconds.I. Accept or reject.
3.3.1 Pre-test shock. Prior to vibrating the device, It shall receive a pre-testshock of 500 to ISOOg (see 2.1).
3.3.2 Mounting requirements. Special precautions (e.g., in mounting, groundingof OUT leads, or grounding of test operator) shall be taken as necessary to preventelectrostatic damage to the DUT. All devices shall be mounted in an invertedposition without adapters except for the following:
a. Stuid-mounted devices shall be mounted in suitable adapters.b. Axial diodes shall be mounted without adapters and with the leads in a
horizontal plane.c. Double-ended resistance walded packages (i.e., optical isolator) shall
be mounted using a suitable adapter and with the leads horizontal.Most part types will mount directly to the traiisducer via theattachment medium. Parts shall be mounted with the largest flatsurface against the transducer at the center or axis of the transducerfor maximum sensitivity. When so mounted, the leads of the part willpoint up (e.g., TO-5) or horizontal (e.g., flat packs). Where morethan one large surface exists, the one that is the thinnest in sectionor has the most uniform thickness shall be mounted tuward thetransducer, e~g., flat packs are mounted top down against thetransducer. Small axial-lead, right circular- cylindrical parts aremounted with their axis horizontal and the side of the cylinderagainst the transducer. Parts with unusual shapes may require specialfixtures. 3,ch fixtures shall have the followiiig properties:
1. Low mass.2. High acoustic transmission (aluminum alloy 7075 works well).3. 'Full transducer surface contact, especially at the center.4. Maximum practical surface contact with test part.5. No moving parts.6. Suitable for attachment medium mounting.
Leads on the parts shall be dressed, as necessary, so they will not strike each otheror the transducer during vibration. Long or thin section leads shall be observed forsigns of resonance, indicated by motion exceeding 3 or 4 diameters. Such resonancemay give extraneous noise during test even though the leads do not strike each other.In these cases, the leads may have to be shortened (if permitted by the application)or special flxturing or frequency changes may be required.
NOTE: Some especially long-leaded TO-5 packages have been observed to be close toresonance at the test frequency.
3.3.3 Test monitoring. To avoid false indicatius., the DUT shall be 1nspertodfor any attached foreign matter or leads which are touching each nther. The DUTshell be mounted on the center of the transducer using attachment medium and if
METHOD 2020,1
20 16 may 1971
MIL-STD-883B31 August 1977
necessary, a mounting adapter. To provide maximum signal transmissibility with aviscous couplant, a sufficient amount of couplant shall be used and the OUT shall befirmly mounted so that any excess couplant can be squeezed out. When double-facedtape is used, it shall be changed at thý start of a test group and after each 25units or less thereafter. Devices shall be put on and removed from the attachmentmedium with a slight twisting motion. Device orientation for each package type shallbe as specified in 3.3.2. The shaker input frequency shall be set in acco,'dance with3.1 b. and the shaker drive amplitude shall be increased to the level specified in3.1 c All detection systems shall be monitored for evidence of loose particles.Any dt-uce which gives a particle indication shall be consider3d a reject. Particleindications can occur in any one or combinations of the three detection systems asfollows:
a. Visual indica^ion of high frequency spikes which exceed the normalconstant background white noise level.
b. Audio indication of clicks, pops, or rattling which is different fromthe constat background noise present with no OUT on the transducer.
c. Threshold detection shall ba indicated by the lighting of a lamp or bydeflection of the seconda-y oscilloscope trace.
d. If no particles are observed in 3 to 5 seconds, a co-test shock(see 3.3.4) shall be applied to the OUT while the shaker is operating.It is permissible to interrupt or pbrturb the vibration for a periodnot to exceed 250 milliseconds to provide for the application of anintcgral co-test shock. The audio, oscilloscope, and thresholddetection systems are to be closely monitored during the time periodimmediatdly after each shock application as well as for an additional3 - 5 seconds to detect particles which may lock up quickly. If noparticles are detected with the first co-test shock application, thetest shall be repeited two times. If there is no itidication ofparticles within 5 seconds after the third co-test shock (see 3.3.4),the device is acceptable.
3.3.4 Co-test shock application. Ahen using the copper rod shock tool(see 2.i.), the shock shall be applied to the OUT by bringing at least 1/4 to 1/2inch of the free end of the shock tool into momentary contact with thp vibrating OUT.The tool shall be held lightly and freely between the thumb and forefit,jer oppositethe free end. Striking or hammering motions shall not be used. The shock shell beonly the result of the mass inertia of the freely supported shock tool being struckby the vibrating OUT. The tool s'hAll be held approximately horizontal and shallcontact the OUT on a portion of the upper surface of its case. The duration of thiscontact is on the order of one-half second and results in several impacts of randomshock to the OUT. The tool shall not contact the leads, other than minor accidentalbrushing of the leads along and parallel to their axis and shall not contact anyglass portion of the case, except for all glass envelope diodes. If any otherco-test shock device is used, its mode of operation shall be in accordance withprocedures supplied by the equipment manufacturer, In systems that disable thethreshold detector during the co-test shock, the period of time from shock pulse toreinitiation of threshold detection shall not exceed 100 milliseconds.
3.4 Failure criteria. Any noise bursts as detected by any of the three detectionsystems exclusive of background noise, except those caused by the shock blows, duringthe monitoring periods shall be cause for rejection of the device. Rejects shall notbe retested (see 3.Z.3) except for retest of all devices In the event of test systemfailure as rrovided in 3, If additional cycles of testling on a lot are specified,the entire test procedure (equipment set-up and checkout mounting, vibration, andco-shocking) shall be repeated for each retest cycle. Reject devices from each testcycle shall be removed from the lot and shall not be retested in subsequent lottesting.
4. SUMMARY. The following details shall be specified in the applicable detailspecification:
a. Test condition letter A or B (see 2.d. and 3.1 c.).D. Lot acceptance/rejection criteria (if applicable).c. The number 0 test cycles, if other than one.d. AttachmentL ,,n'lum, If other then that specified (see 2.h.).e. Pre-test shock level and co-test shock level, if other than specified In
2.1. and 2.i., respectively.METHOD 20ZO.116 May 1979
21
MIL-STD-883E31 August 1977
LAMP
THEHL O0SCILLOSCOPE x.- -CTO Y2 YI | -
AUDIO ATAHMN
/YTUMEDIUM I
PIND ELECTRONICS
SINE GENERATOR SHAKER
FIGURE 2020-1. Typical particle impact noise detection system.
METHOD 2020.1
22 16 May 1979
thIL-STD-883B31 Auguist 1977
200-
~~'j:
S60-
20 ,10 20 40 80 100 200 400
AVERAGE iNTERNAL PACKAGE HEIGHT (MILS)
FIGURE 2020-2. Pcaehit stest fre uency for
METAL BOX OR ENCLOSEDS-I METAL CHASSIS
SHIELDED TRANSDUCER
FJ~ CAIBLE,; IS INCHES LONG
'Vdc0 STU TRANSDUCER
vckS140BM TTACHMENT MEDIUM
50I PIND TRANSDUCER
L J C-_ TO -S4B jY PINDELECTRONICS
NOTES:1. Pushbutton switch: Mechanically quiet, fast make,
gold contacts. E.G. T2 SM4 microswltch.2. Resistance tolerance 5% non-inductive.3. Voltage source can be a standard dry cell.4. The coupled transducers must be coaxial during test.5. Voltage output to STU transducer 250 microvolts, t20%.
RET00202~iFIGURE 2020-3. Typial sensitivity test unit.
16 May 197923
Ml L-STD-883B31 August 1977
ý R 0)
o 4 "--- .
" (-4,
2 '- -'0 in
a.J
E __ SI - L.*~ OD CL U
--- 41Q) 0 4'
e-Wa.
W C
- - In > V
O°i
0 -- C
91n (Y ey
H1, Ii •
I2
2. Ib 0 4
0
.4-i
NETHOC 2020.1
24 lb Msy 1979
DISTRIBUTION
No. ofCopies
ConumanderUTS Air Force Materials LabATTN: AFWAL/)4LTE/MAJ John ErbacherWright-Patterson Air Force Base, Ohio 45433
CommanderUS Army Materiel Development & Readiness CommandATTN: DRCMT/ Mr. Fred J. Michel5001 Eisenhower AvenueAlexandria, VA 22333
Naval Materiel CommandATTN: Mr. William HoldenCode (MAT 061k)Washington, D. C. 20360
Walter BrunkeAIAA1290 Avenue of the AmericasNew York, New York 10104
CommanderUSA ERADCCMATTN: DELET-R/Mr. Dave RuppeFt. Monmouth, ,',J. 07703
Naval Electronic, Systems CommandATTN: Mr. Raymonn PillElex 504-51Washington, D. C. 20360
Naval Ocean Systems CenterATTN: Mr. Richard A. GambleCode 9254271 Catalina Blvd.San Diego, CA 92152
Naval Weapons CenterATTN: Mr. Jim AabyCode 3318China Lake, CA 93555
Naval Avionics CenterATTN: Mr. Jim. Saxman6000 East 21st StreetIndianapolis, IN 46218
25
No. ofCopies
CPT Richard Preston
593 Warm Springs DriveFairborn, OH 45324
Commander
US Air Force Materiels LabATTN: Mr. Donnie SaundersU. S. P. 0. 33592
Wright-Patterson Air Force Base, OH 45433
Commander
US Air Force Materials LabATTN: AFWAL-MLTC/Mr. Gerald HaynesWright-Patterson Air Force Base, OH 45433
Commander
US Air Force Materials LabATTN: AFWAL-MLTC/Dr. Russo
Wright-Patterson Air Force Base, OH 45433
Commander
US Air Force Matcrials LabATTN: AFWAL-MLTC/Mr. Nate TupperWright-Patterson Air Force Base, OH 45433
Dr. Al Robinson
Battelle Columbus Laboratories
505 King AvenueColumbus, OH 43201
CommanderUS Army Materiel Development & Readiness Command
ATTN: DRCMT/Mr. George Schuck5001 Eisenhowev AveneuAlexandria, VA 22333
CommanderUSA ERADCOM
ATTN: DELET-R/Mr. Randy ReitmeyerFt. Monmouth, N. J. 07703
Commander
US Army Missile CommandUS Army Missile LaboratoryATTN: DRSMI-RSTRedstone Arsenal., AL 35898 25
26
CommanderUS Army Missile Comimand
US Army Missile Laboratzry
ATTN: DRSMI-RSI
DRSMI-UDRSMI-XGI DRSMIIDRSMI-T
DRSMI-XBDRSMI-O 13
DRSMI -RPR 1
DRSMI-RPT (Record Copy)
DRSMI-RPT (Reference copy)1
DRCPM-VI1DRCP14-CFDRCPM-MPDRCPM-HADRCPM-P E
T)RCPM-TOIDRCPM-IIDDRCPM-ROLI
Redstone Arsenal, AL 35898
27