Embed Size (px)
Citation preview

International Journal of Civil Engineering, Vol. 13, No. 3, Transaction A: Civil Engineering, September 2015
Technical Note
A dynamic model for the interaction of the cable bridge and train system
M.M. Jalili1,*, A.H. Orafa
2
Received: December 2013, Revised: April 2014, Accepted: December 2014
Abstract
The vibration of cable-stayed bridges subjected to the passage of high-speed trains is studied in this article. The moving
train includes a number of wagons, each of which is modeled as a four-axle system possessing 48 degrees of freedom. The car
model is nonlinear and three-dimensional and includes nonlinear springs and dampers of primary and secondary suspensions,
dry friction between different parts and also clearances and mechanical stops. Two parallel rails of the track are modeled as
Euler-Bernoulli beams on elastic points as rail pads. The rail irregularities are assumed to be stationary random and ergodic
processes in space, with Gaussian amplitude probability densities and zero mean values. The bridge deck is modeled as a plate
supported by some cables. The current model is validated using several numerical models reported in the literature of the
earlier researcher.
Keywords: Rail vehicle dynamics, Euler-Bernoulli beam, Levy method, Random rail irregularities.
1. Introduction
To meet the economic, social and recreational needs of
the community for safe and efficient transportation
systems, more and more cable bridges have been built
throughout the world. Cable-stayed bridges were often
constructed for crossing wide rivers and deep valleys or
existing urban structures because of their economic and
aesthetic advantages. The investigation of the cable bridge
vibration under moving train using different models has
been widely reported in the literature. For most of the
previous studies the cable-stayed bridge has been modeled
as a planar system. Au et al. [1] used 2-D model to study
bridge vibration due to random rail irregularities. They
studied effects of number of random samples, damping,
class of railway, track quality and initial motion of train
vehicles on bridge vibration. Using a planar model for
vehicle/ bridge, the vibration reduction of cable bridges
excited by high-speed trains is studied by Yau and Yang
[2]. 2-D models cannot simulate lateral vibration of the
bridge. In addition wagon derailment and hunting
vibration cannot be investigated by these models.
For the 3-D models, the finite element method has been
used as the main tool for bridge simulation. For instance,
using FEM, the vibration of coupled train and cable-stayed
* Corresponding author: [email protected]
1 Assistant professor, Mechanical Engineering Department, Yazd
University, PO Box 89195-741, Yazd, Iran
2 PhD Student, Mechanical Engineering Department, Yazd
University, PO Box 89165-741, Yazd, Iran
bridge systems in cross winds has been investigated by Xu
et al. [3]. Also, the dynamic stability of trains moving over
bridges shaken by earthquakes has been studied by Yang
and Wu [4]. Using this model the maximum allowable
speed for the train to run safely has been obtained under the
specified ground acceleration.
In this article, an analytical solution is presented for
simulation of the coupled system. A 3-D model of the
cable-stayed bridge, rails and passenger wagon is
developed. Equations of motion of this model are derived.
Using the proposed model, the effects of wagon
parameters, lateral position of the rails and the rail
irregularities on vehicle/track dynamics are studied.
2. System Model
2.1. The train model
A 3-D model of a 2- axle passenger wagon with 48
DOF is developed here. All parts of primary and
secondary suspension systems with their nonlinear
characteristics, friction between moving elements, the
effect of wheel flange contact with the rail, wheel rail
nonlinear contact forces, kinematics constraint of bogie
center plate, and the contact forces between side pads and
bogie frame are considered in this model. Schematic of
wagon model is shown in Figure 1. Basic dynamic
parameters of wagon are presented in Table 1.
Structure -
Steel

348 M.M. Jalili, A.H. Orafa
Fig. 1 Schematic view of the wagon model: (1) wagon body, (2) bolster, (3) secondary suspension system, (4) bogie, (5) primary suspension
system, (6) wheelset, and (7) rail
Table 1 Main parameters of the car body
Notation Parameter Value
Wagon body
cM
Wagon body mass 20000 kg
cxI
Wagon mass moment of inertia about X axis 32268 kg m2
cyI
Wagon mass moment of inertia about Y axis 1125000 kg m2
czI
Wagon mass moment of inertia about Z axis 1125000 kg m2
Bolster
bolM
Bolster body mass 630 kg
bolxI
Bolster mass moment of inertia about X axis 160 kg m2
bolyI
Bolster mass moment of inertia about Y axis 100 kg m2
bolzI
Bolster mass moment of inertia about Z axis 160 kg m2
Bogie
bogM
Bogie body mass 500 kg
bogxI
Bogie mass moment of inertia about X axis 250 kg m2
bogyI
Bogie mass moment of inertia about Y axis 150 kg m2
bogzI
Bogie mass moment of inertia about Z axis 300 kg m2
wheelset
wM
Wheelset body mass 1180 kg
wxI
Wheelset mass moment of inertia about X axis 680 kg m2
wyI
Wheelset mass moment of inertia about Y axis 73 kg m2
wzI
Wheelset mass moment of inertia about Z axis 680 kg m2
wr Wheel radius 0.46 m
Primary Suspension
zK
Vertical stiffness 6500 kN/m
,x yK K
Lateral and longitudinal Stiffness 6500 kN/m
zC
Vertical damping 10 kNs/m
,x yC C
Lateral and longitudinal damping 9 kNs/m
Secondary Suspension

International Journal of Civil Engineering, Vol. 13, No. 3, Transaction A: Civil Engineering, September 2015 349
zK
Vertical stiffness 2555 kN/m
,x yK K
Lateral and longitudinal Stiffness 1500 kN/m
zC
Vertical damping 30 kNs/m
,x yC C
Lateral and longitudinal damping 20 kNs/m
Considering the nature of this problem, use of 3-
dimensional wheelset model is essential. Determination of
the correct contact point between wheel and rail and the
exact value of the contact force between the two members
are the major issues in 3-D modeling of the wheelset. To
determine normal contact force between the wheel and
rail, a flexible wheel–rail contact model based on semi-
Hertzian methods and the virtual penetration theory has
been used [5]. Also in order to determine the tangential
forces, the FASTSIM algorithm has been used.
The connection link between wagons is considered to
be hooks and draft gears [6]. The buffers at each side of
the cars have also been included in the model to account
for the absorption of the excess energy in inter-wagon
force transmissions (Fig. 2). The degrees of freedom for
the wagon components are listed in Table 2.
Fig. 2 Model of connection between wagons
Table 2 Degrees of freedom of each part of the wagon
longitudinal lateral vertical roll pitch yaw
Car body * * * * * *
Bogie frame * * * * * *
Bolster - - - * * *
Wheel set * * * * * *
Table 3 Av , coefficient related to line grade[1]
Line Grade vA
Line Grade vA
1 815.52 10 4 82.75 10 2 88.84 10 5 81.55 10 3 84.91 10 6 80.88 10
2.2. The bridge model
Figure 3 shows the bridge model adopted in the present
study. The bridge deck is modeled as a plate supported by
some cables. Also the bridge towers are modeled as a
beam in lateral and a bar in vertical direction. Rails are
modeled as Euler-Bernoulli beams on elastic points as rail
pads (Fig. 4).
Fig. 3 3D model of the bridge

350 M.M. Jalili, A.H. Orafa
Fig. 4 Side view of the system model
2.3. Irregularities model
Rail irregularities generally have a random distribution,
and are considered as one of the major source of wagon
vibration and wheelset derailment. The major causes of
these irregularities are: incompatible substrate conditions,
weather conditions, rail age and excessive train
commutation on rails [7].
The random rail irregularities are assumed to be
stationary random and ergodic processes in space, with
Gaussian amplitude probability densities and zero mean
values. They are characterized by their respective one-
sided power spectral density functions rrG where
is the route frequency. Fryba [8] has summarized
various commonly used power spectral density functions.
In the present study, the power spectral density functions
based on the results of measurements on US railway tracks
is adopted, with the empirical formula for evaluation of
irregularities as:
2 2 2
2 1
4 2 2
2
v
rr
AG
(1)
Where 1
1 0.0233 m and 1
2 0.131m and the
parameter vA is a coefficient related to line grade, as
shown in Table [1].
A sample function of rail irregularities can be
generated numerically using the following series:
1
cosN
d
k k k
k
r x a x
(2)
Where ka is the amplitude of the cosine wave, k is a
frequency within the interval ,l u in which the power
spectral density function is defined, k is a random phase
angle with uniform probability distribution in the interval
0,2 , x is the global coordinate measured from the
start of the rail section and N is the total number of terms
used to generate the rail irregularities function. The
parameters ka and k are computed using equations
Eq.(3) and Eq.(4):
2k rr ka G
(3)
12k l k
(4)
u l N
(5)
In which u and l are the upper and lower limits of
the frequency, and N is a sufficiently large integer. Using
equations Eq. (1-5), random rail irregularities in each line
grade can be generated.
3. Equations of Motion
3.1. Deck equation of motion
Describing the bridge deck as a plate, the vertical
vibration of the bridge deck is given by:
4 4 4 2
4 2 2 4 21
( , , ) ( , , ) ( , , ) ( , , ) 12 ( )
k
Kzs s s s s s
ts r s
ks s
w x y t w x y t w x y t h w x y tF F
x x y y D t D
(6)
Where
1
[ ( ( , , ) ( , )) ( ( , , ) ( , ))] ( ) ( )f
k k k k k k
N
r s f s f r r f f s f r r f f r
f
F K w x y t w x t C w x y t w x t x x y y
(7)
(8)
11 33
1
2
21 43
1
3
12 34
2 1
4
22 44
3 1
( ( ) ( )) ( )sin( )
( ( ) ( )) ( )sin( )
( ( ) ( )) ( )sin( )
( ( ) ( )) ( )sin(
C
C
C
C
C
C
C
z
ts
N
c cc c
c c
N
c cc c
c N c
N
c cc c
c N c
N
c cc
c N c
F
E AC y C y b x x
L
E AC y C y b x x
L
E AC y C y b x x
L
E AC y C y b x x
L
)c

International Journal of Civil Engineering, Vol. 13, No. 3, Transaction A: Civil Engineering, September 2015 351
in which
1
2
3
4
( ,0, )sin( ) ( )cos( ) ( )sin( )
( ,0, )sin( ) ( )cos( ) ( )sin( )
( , , )sin( ) ( )cos( ) ( )sin( )
( , , )sin( ) ( )cos( ) (
k k
k k
k k
k k
x z
k s c c t c t c
x z
k s c c t c t c
x z
k s c c t c t c
x z
k s c c t c t
C w x t w H w H
C w x t w H w H
C w x b t w H w H
C w x b t w H w H
)sin( )c
(9)
And
3
212(1 )
s ss
s
E hD
(10)
Using Levy method, the solution of homogenous form
of Eq. (6) can be expressed as [9]:
( , , ) ( ) ( ) ( ) sin( ) ( ) ( )s m mn mn mn mn
mw x y t X x Y y T t x Y y T t
a
(11)
Substituting Eq. (11) into homogenous form of Eq. (6)
yields:
4 2 (2) (4)[( ) 2( ) ]sin( ) 0s smn mn mn
s
hm m mY T Y T Y T Y T x
a a D a
(12)
Using Separation of variables, vibration frequencies
can be found as:
(2) (4)
4 2 2[( ) 2( ) ]s mn mn mnmn
s s mn mn mn
D Y Y Tm m
h a a Y Y T
(13)
and finally a differential equation can be derived as
follows:
(4) 2 (2) 2 42( ) ( ( ) ) 0s smn mn mn mn
s
hm mY Y Y
a D a
(11)
The bending moments and the shearing forces for the
two free edges at y=0 and y=b are equal to zero. So the
boundary conditions are:
2 2
(2) 2
2 20,0,0,
( ) ( ( ) ) 0s sy s s s mn s mny b
y by b
w w mM D D Y Y
y x a
(15)
3 3(3) 2 '
3 20,0,0,
( (2 ) ) ( (2 )( ) ) 0s sy s s s mn s mny b
y by b
w w mQ D D Y Y
y x y a
(16)
Ymn and ωmn can be achieved by Substituting the
solution of Eq. (14) into Eq. (15) and Eq. (16) and solving
the obtained homogeneous system.
Solution of Eq. (6) Can be written in the form of Eq.
(11). With same Xm and Ymn from homogenous solution.
Substituting Eq. (11) into Eq. (6) yields:
(4) (2) (2) (4)
1 1 1 1 1 1 1 1
1
2
1( )
y y y yx x x x
k
N N N NN N N N
s sm mn mn m mn mn m mn mn m mn mn
m n m n m n m ns
Kz
ts r s
ks
hX Y T X Y T X Y T X Y T
D
F FD
(17)
Multiplying Eq. (17) By “Xk (x)Ykh(y)” and then
applying integral in the plate area yields the second-order
ordinary differential equations of the plate vertical
vibration in terms of the generalized coordinate Tmn(t) as
follows:

352 M.M. Jalili, A.H. Orafa
3 2 4 5 1 6
1 2
11 33
11 2
2
21 43
1
3
12 34
2 1
2( )
1( ( ( ) (0) ( ) ( ))sin( )
( ( ) (0) ( ) ( ))sin( )
( ( ) (0) ( ) (
C
C
C
C
C
smn mn
s s
N
c cm c mn m c mn c
cs s c
N
c cm c m c mn c
c N c
N
c cm c m c mn
c N c
D B B B B B BT T
h B B
E AC X x Y C X x Y b
h B B L
E AC X x Y C X x Y b
L
E AC X x Y C X x Y
L
4
22 44
3 1
1 11 2
))sin( )
( ( ) (0) ( ) ( ))sin( ))
1[ ( ( , , ) ( , )) ( ( , , ) ( , ))] ( ) ( )
C
C
f
k k k k k
c
N
c cm c m c mn c
c N c
NK
f s f r r f f s f r r f m f mn r
k fs s
b
E AC X x Y C X x Y b
L
K w x y t w x t C w x y t w x t X x Y yh B B
(18)
Where
2 2 (4)
1 2 30 0 0
'' '' (4)
4 5 60 0 0
a b a
m mn m m
a b b
m m mn mn mn mn
B X dx B Y dy B X X dx
B X X dx B Y Y dy B Y Y dy
(19)
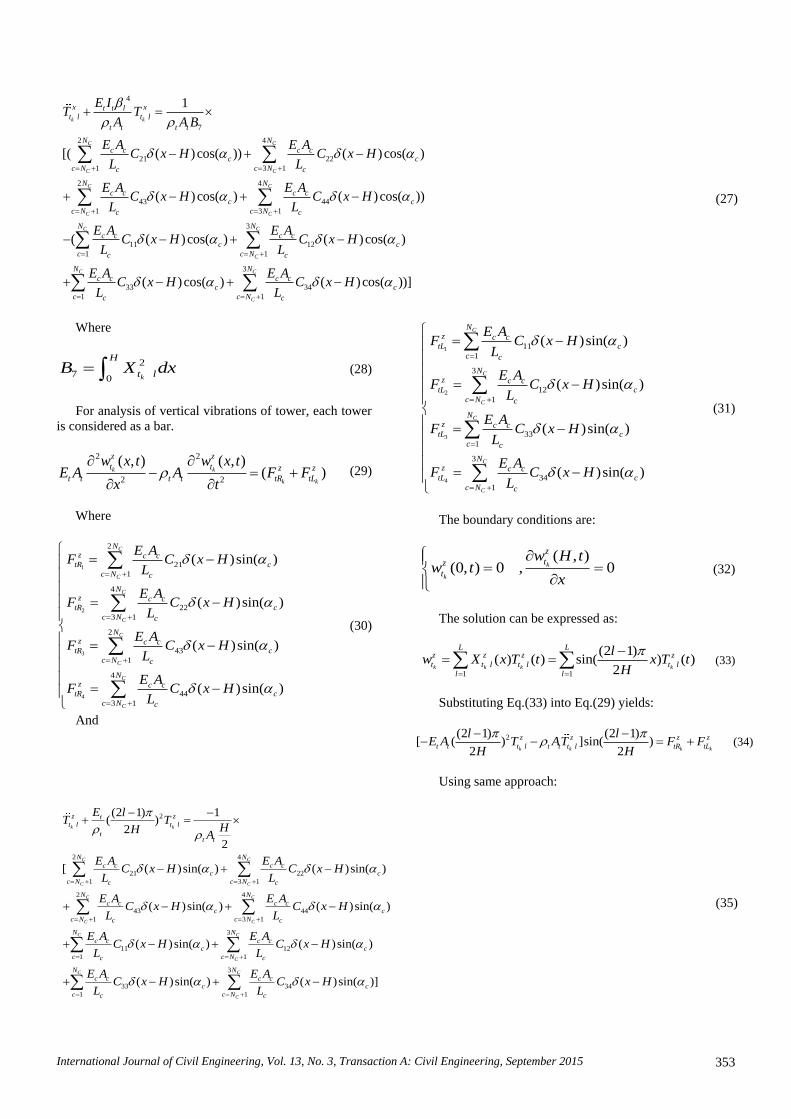
3.2. Tower equation of motion
Describing each tower as an Euler-Bernoulli beam, the
lateral vibration of tower is given by:
4 2
2 2
( , ) ( , )( )k k
k k
x x
t t x x
t t t t tR tL
w x t w x tE I A F F
x t
(20)
in which
1
2
3
4
2
21
1
4
22
3 1
2
43
1
4
44
3 1
( ) cos( )
( ) cos( )
( ) cos( )
( ) cos( )
C
C
C
C
C
C
C
C
Nx c c
tR c
c N c
Nx c c
tR c
c N c
Nx c c
tR c
c N c
Nx c c
tR c
c N c
E AF C x H
L
E AF C x H
L
E AF C x H
L
E AF C x H
L
(21)
and
1
2
3
4
11
1
3
12
1
33
1
3
34
1
( ) cos( )
( ) cos( )
( ) cos( )
( ) cos( )
C
C
C
C
C
C
Nx c c
tL c
c c
Nx c c
tL c
c N c
Nx c c
tL c
c c
Nx c c
tL c
c N c
E AF C x H
L
E AF C x H
L
E AF C x H
L
E AF C x H
L
(22)
In order to solve the homogenous form of differential
equation in Eq.(20); the solution can be expressed as:
( ) ( )k k k
x x x
t l t l t lw X x T t
(23)
Where
1 2 3 4cos( ) sin( ) cosh( ) sin( )k
x
t l l l l lX A x A x A x A x
(24)
And; the boundary conditions are:
2 3
2 3
(0, )(0, ) 0 0
( , ) ( , )0 0
k
k
k k
x
tx
t
x x
t t
w tw t
x
w H t w H t
x x
(25)
Using Eq.(23) and boundary conditions; Ai and βl can
be found. As so, Eq.(20) can be written follows:
(4) ( )
k k k k k k
x x x x x x
t t t l t l t t t l t l tR tLE I X T A X T F F
(26)
Using same method as explained in previous section,
the second-order ordinary differential equation yields:
International Journal of Civil Engineering, Vol. 13, No. 3, Transaction A: Civil Engineering, September 2015 353
4
7
2 4
21 22
1 3 1
2 4
43 44
1 3 1
11
1
1
[( ( ) cos( )) ( ) cos( )
( ) cos( ) ( ) cos( ))
( ( ) cos( )
k k
C C
C C
C C
C C
C
x xt t lt l t l
t t t t
N N
c c c cc c
c N c Nc c
N N
c c c cc c
c N c Nc c
N
c cc
c c
E IT T
A A B
E A E AC x H C x H
L L
E A E AC x H C x H
L L
E AC x H
L
3
12
1
3
33 34
1 1
( ) cos( )
( ) cos( ) ( ) cos( ))]
C
C
C C
C
N
c cc
c N c
N N
c c c cc c
c c Nc c
E AC x H
L
E A E AC x H C x H
L L
(27)
Where
2
70 k
H
t lB X dx
(28)
For analysis of vertical vibrations of tower, each tower
is considered as a bar.
2 2
2 2
( , ) ( , )( )k k
k k
z z
t t z z
t t t t tR tL
w x t w x tE A A F F
x t
(29)
Where
1
2
3
4
2
21
1
4
22
3 1
2
43
1
4
44
3 1
( )sin( )
( )sin( )
( )sin( )
( )sin( )
C
C
C
C
C
C
C
C
Nz c c
tR c
c N c
Nz c c
tR c
c N c
Nz c c
tR c
c N c
Nz c c
tR c
c N c
E AF C x H
L
E AF C x H
L
E AF C x H
L
E AF C x H
L
(30)
And
1
2
3
4
11
1
3
12
1
33
1
3
34
1
( )sin( )
( )sin( )
( )sin( )
( )sin( )
C
C
C
C
C
C
Nz c c
tL c
c c
Nz c c
tL c
c N c
Nz c c
tL c
c c
Nz c c
tL c
c N c
E AF C x H
L
E AF C x H
L
E AF C x H
L
E AF C x H
L
(31)
The boundary conditions are:
( , )(0, ) 0 , 0k
k
z
tz
t
w H tw t
x
(32)
The solution can be expressed as:
1 1
(2 1)( ) ( ) sin( ) ( )
2k k k k
L Lz z z z
t t l t l t l
l l
lw X x T t x T t
H
(33)
Substituting Eq.(33) into Eq.(29) yields:
2(2 1) (2 1)[ ( ) ]sin( )
2 2k k k k
z z z z
t t t l t t t l tR tL
l lE A T AT F F
H H
(34)
Using same approach:
2
2 4
21 22
1 3 1
2 4
43 44
1 3 1
11
1
(2 1) 1( )
2
2
[ ( )sin( ) ( )sin( )
( )sin( ) ( )sin( )
( )sin(
k k
C C
C C
C C
C C
C
z ztt l t l
tt t
N N
c c c cc c
c N c Nc c
N N
c c c cc c
c N c Nc c
N
c c
c c
E lT T
HHA
E A E AC x H C x H
L L
E A E AC x H C x H
L L
E AC x H
L
3
12
1
3
33 34
1 1
) ( )sin( )
( )sin( ) ( )sin( )]
C
C
C C
C
N
c cc c
c N c
N N
c c c cc c
c c Nc c
E AC x H
L
E A E AC x H C x H
L L
(35)

354 M.M. Jalili, A.H. Orafa
3.3. Rail equation of motion
Describing each rail as an Euler-Bernoulli beam, the
vertical vibration of rail is given by:
4 2
4 2
( , ) ( , )k k
k k
r r
r r r r sr wr
w x t w x tE I A F F
x t
(36)
in which
1
[ ( ( , , ) ( , )) ( ( , , ) ( , ))] ( )f
k k k k k
N
sr f s f r r f f s f r r f f
f
F K w x y t w x t C w x y t w x t x x
(37)
4
1
( ( ))k
v
wr w w w
w
F F x v t L
(38)
The boundary conditions are:
2
2
2
2
(0, )(0, ) 0 0
( , )( , ) 0 0
k
k
k
k
r
r
r
r
w tw t
x
w a tw a t
x
(39)
The solution can be determined as:
1 1
( ) ( ) sin( ) ( )k k k k
L L
r r l r l r l
l l
lw X x T t x T t
a
(40)
Substituting Eq.(40) into Eq.(36) yields:
(4)
1 1k k k k k k
L L
r r r l r l r r r l r l sr wr
l l
E I X T A X T F F
(41)
The second-order ordinary differential equations of the
rail can be found as follows:
4
8
1 19 9 9
1 1( ( )) [ ( ( , , ) ( , ))
( ( , , ) ( , ))] ( )
f
k k k k k
k k k
N
r rr l r l w r l w w f s f r r f
w fr r r r r r
f s f r r f r l f
BE IT T F X x v t L K w x y t w x t
A B A B A B
C w x y t w x t X x
(42)
where
(4) 4
8 90 0
( ) ,2 2k k k k
a a
r l r l r l r l
l a aB X X dx B X X dx
a
(43)
3.4. Equation of motion of the vehicle
Two coordinate systems are attached to the centers of
masses of the model parts. One fixed to the part and
rotates with it (denoted by the index “r”), and the other one
is fixed at the initial position of the object (denoted by the
index “o”). Also as shown in Figure 2 a coordinate system
is fixed to the bridge deck as reference.
Using Figure 5, the relationship between components
of an arbitrary vector in rotating and initial coordinate
systems can be given as:
Fig. 5 Coordinate transformation
, , ,
1 0 0 cos 0 sin cos sin 0
0 cos sin 0 1 0 sin cos 0
0 sin cos sin 0 cos 0 0 1
o
r x y zR R R R
(44)

International Journal of Civil Engineering, Vol. 13, No. 3, Transaction A: Civil Engineering, September 2015 355
Also angular velocity can be obtained as:
ˆ ˆ ˆ
ˆ ˆˆ ˆ ˆ( cos sin ) ( cos sin )
ˆ ˆ ˆ( cos sin )
ˆˆ ˆ( cos cos sin cos sin )
ˆ ˆ( sin cos cos ) ( cos sin cos )
ˆ( sin )
k j i
k j i i k
k j i
i j k
i j
k
(45)
And angular accelerations are:
sin cos cos cos sin cos
cos sin
cos sin sin cos sin sin
cos cos
sin cos
x
y
z
(46)
For each wagon part, the equations of motion can be written as [10]:
o oF mw
(47)
r
r r r r r r r r r rdHM I I I M I
dt
(48)
The complete system equations are obtained by
combining the equations of motions of deck, towers, rails
and the wagon parts. Considering the initial conditions
(wagon velocity and position), the equations of motions
are solved numerically using Runge-Kutta method. In this
method the system equations are converted into state
variables. Both displacements and velocities at time t t
are treated as unknown and then can be obtained from the
information of the time t [11].
4. Results and Discussions
In order to study the effects of various parameters on
the behavior of a vehicle–bridge interaction, Evripos
bridge in Greece is chosen as a case study. The main
parameters of the rails and the bridge used in the
simulation are listed in Tables 4-5 [12].
Table 4 Main parameters of the track
Notation Parameter Value
rE
Elastic modulus of rail 205.9 Gpa
rI
Rail second moment of area 3.217×10⁵ m4
r Rail density 7860 kg m-3
rA
Rail cross-section area 7.715×10⁻³ m2
fK
Fastener stiffness 6.5×10⁷ N m-1
fC
Fastener damping 6.5×10⁴ N s m-1
fL
Sleeper spacing 0.79 m
rL
Rail gage 1.5 m
cN
Number of cables 10
Table 5 Main parameters of the bridge
Notation Parameter Value
a Bridge length 395 m
b Bridge width 13.5 m
sH
Deck thickness 0.45 m
tH
Tower height 35 m
cD
Diameter of each strand in one
cable 15.24×10⁻³ m
s Density of deck 7860 kg m-3
s Poisson's ratio of deck 0.29
sE
Deck module of elasticity 205.9 Gpa

356 M.M. Jalili, A.H. Orafa
Figure 6 shows the maximum amplitude of rail
vibration with respect to the lateral rail location on the
bridge. According to this figure rails vibration is
minimized if the rails centerline locates on the centerline
of the cable bridge.
Effects of the height and cross section dimensions of
the tower on maximum amplitude of deck vibration are
investigated in Figure 7. The results show that with
decrease in tower cross sectional area, maximum rail
displacement increases. Also according to this figure there
is an optimum tower height in which the maximum rail
displacement will be minimum.
Fig. 6 Maximum amplitude of rail vibration respect to the lateral rail location
Fig. 7 Effects of tower height on maximum displacement of rail
Effects of number of cables and number of strands in
each cable on maximum displacement of rail are shown in
Figure 8. The results show that with increase of these
parameters the rail displacement decrease and the bridge
become more rigid.
Fig. 8 Effects of number of cables and number of strands in each cable on maximum displacement of rail

International Journal of Civil Engineering, Vol. 13, No. 3, Transaction A: Civil Engineering, September 2015 357
Vertical displacement of the rail and Vertical position
of wagon center of mass when the train passes over the
bridge are presented in Figures 9 and 10, respectively.
According to these figures maximum vibration of wagon
position and rail displacement occur when the wagon
reaches the middle of the bridge.
Fig. 9 Vertical displacement of rail
Fig. 10 Vertical position of wagon center of mass
The comfort of the passenger coach in a running train
can be assessed using the Sperling factor defined as:
2 3( / )
0.896( ( ))
z
wgw cm sSperling factor F f
f (49)
Where f is the frequency in Hz; and F(f) is the
modification coefficient of frequency. When vertical
vibration is concerned,
2
0.325 0.5 5.9
400( ) 5.9 20
1 20
f
F f ff
f
(50)
The allowable value of vehicle comfort is 3.0 for
vertical vibrations [3].
The acceleration response of the car body is random
due to random rail irregularities and it contains a wide
range of vibration frequencies. Thus, the Sperling comfort
index is calculated for a series of frequencies based on the
Fourier spectrum of the acceleration response time history.
Acceleration response of the car body for different wagon
speeds and line grades is presented in Figures 11 and 12.
Using these results Sperling comfort index is
calculated and presented in Figure 13. It can be seen that
the Sperling index is less than 2, indicating that the ride
comfort is satisfactory.

358 M.M. Jalili, A.H. Orafa
Fig. 11 Acceleration response of the car body for different wagon speeds
Fig. 12 Acceleration response of the car body for different line grades
Fig. 13 Sperling comfort index of the car body
5. Validation of the model
Example 1: To validate the model illustrated in this
paper its predictions of the responses are compared with
the responses are reported by Xu et al. [3] for the case
where there are no cross wind forces. The vertical
displacement response of bridge girder at mid-span
evaluated by the current model and that of presented Xu et
al. [3] are shown in Figures 14(a) and (b) respectively.
According to these figures, the difference of the maximum
amplitudes of the two results is about 5.5%. Therefore the
prediction of the responses by the current model is in good
agreement with the responses reported by Xu et al. [3].
Example 2: Yau and Yang [2] reported their results of
the finite element simulation on the study of vertical
interaction between the high speed trains and the cable
bridges. In this research the train has been modeled as a
series of sprung masse, the bridge deck and towers by
nonlinear beam-column elements, and the stay cables by
truss elements with Ernst’s equivalent modulus. Using the
finite element procedure, the impact factor I has been

International Journal of Civil Engineering, Vol. 13, No. 3, Transaction A: Civil Engineering, September 2015 359
solved for the midpoint of the arrival span and departure
span of the cable-stayed bridge. Figures 15 show the
comparison of the impact factor I with respect to the speed
parameter S from the reference and the calculated impact
factor using the current model. It can be seen from Figures
15(a) and (b), that the numerical results predicted by the
present model are in reasonable agreement with the results
calculated by finite element method.
(a)
(b)
Fig. 14 Vertical displacement response of bridge girder at mid-span
(a)
(b)
Fig. 15 Impact factor of the cable-stayed bridge

360 M.M. Jalili, A.H. Orafa
Example 3: The model developed by Au et al. [1] has
been used for validation of the dynamic model of wagon
and bridge interaction as reported in this paper. In that
paper, the impact factor of deck moment was obtained
using 2D model analyzed by the FEM. Figure 16 shows
the comparison of the impact factor calculated using the
current model with the results presented by Au et al. [1].
According to this figure the magnitude of the impact factor
of the current model has a certain deviation compared with
the values obtained by Au et al. [1] and the maximum
error is about 5.8%.
Fig. 16 Comparison of the impact factor for 2D and 3D models
6. Conclusion
In this paper a 3-D nonlinear models of cable bridge
and wagon have been used to investigate the interaction of
the cable bridge and train system. The current model has
been validated using several numerical models reported in
the literature by other researchers. Using this model; the
effects of wagon velocity, lateral position of the rails and
rail irregularities on wagon/bridge vibration and passenger
comfort have been studied.
List of Symbols
A Cross section area α
Geometric slope
C Fastener damping in
vertical direction υ Poisson's ratio
D
Flexural rigidity Density
E Module of elasticity ω Angular velocity
F
Force ( )r Relative frame
H Tower height ( )x Horizontal direction
I Second moment of area ( )y Lateral direction
K Fastener stiffness in
vertical direction ( )z
Vertical direction
L Length or distance between
different elements ( )b bogie
N Number of. ( )c Cth cable
a Bridge length ( )f Fth fastener
b Bridge width ( )k Kth rail or tower
d Diameter of. ( )o Initial frame
h Deck thickness ( )r Rail
m Mass ( )tR Right side of tower
v Velocity ( )rs
Rail to bridge deck
w Displacement ( )rw
Rail to wheel
( )s Bridge deck ( )ts Tower to bridge deck
( )sr
Bridge deck to rail
( )w Wth wheel set
( )st
Bridge deck to tower
( )wg Wagon
( )t Tower ( )wr Wheel to rail
( )tL Left side of tower
References
[1] Au FTK, Wang JJ, Cheung YK. Impact study of cable-
stayed railway bridges with random rail irregularities,
Engineering Structures, 2001, Vol. 24, pp. 529-541.
[2] Yau JD, Yang YB. Vibration reduction for cable-stayed
bridges traveled by high-speed trains, Finite Elements in
Analysis and Design, 2004, Vol. 40, pp. 341-359.
[3] Xu YL, Zhang N, Xia H. Vibration of coupled train and
cable-stayed bridge systems in cross winds, Engineering
Structures, 2004, Vol. 26, pp. 1389-1406.

International Journal of Civil Engineering, Vol. 13, No. 3, Transaction A: Civil Engineering, September 2015 361
[4] Yang YB, Wu YS. Dynamic stability of trains moving over
bridges shaken by earthquakes, Journal of Sound and
vibration, 2002, Vol. 258, pp. 65-94.
[5] Jalili MM, Salehi H. Wheel/rail contact model for rail
vehicle dynamics, Comptes Rendus Mecanique, 2011, Vol.
339, pp. 700-707.
[6] Durali M, Jalili MM. A New criterion for assessment of
train derailment risk, Proc. IMechE Part K: Journal of
Multi-Body Dynamics, 2011, Vol. 224, pp. 83-101.
[7] Iyengar RN, Jaiswal OR. Random Field modeling of
railway track irregularites, Journal of Transportation
Engineering,1995, pp. 303-308.
[8] Fryba L. Dynamics of railway bridges, Thomas Telford,
London, 1996.
[9] Xiang Y, Zhao YB, Wei GW. Levy solutions for vibration
of multi-span rectangular plates, International Journal of
Mechanical Sciences, 2002, Vol. 44, pp. 1195-1218.
[10] Durali M, Shadmehri B. Nonlinear analysis of train
derailment in severe braking, Journal of Dynamic Systems,
Measurement, and Control, 2003, Vol. 125, pp. 48-53.
[11] Garg VK, Dukkipati RV. Dynamics of Railway Vehicle
Systems, Academic Press, Canada, 1984.
[12] Virlogeux M. Recent evolution of cable stayed bridges,
Engineering Structures, 1999, Vol. 21, pp. 737-755.


![A mathematical model for determination of structural value of …ijce.iust.ac.ir/article-1-617-en.pdf · with the requirements of the ASTM D4694-07 standard [12]. The FWD test equipment](https://img.pdfslide.us/doc/110x75/611b71ce37985f097852231d/a-mathematical-model-for-determination-of-structural-value-of-ijceiustacirarticle-1-617-enpdf.jpg)