Embed Size (px)
Citation preview

IndustrializationArillo
Leano
Morrin
Tiu

INDUSTRIALIZATION
The process in which a society or country (or world) transforms itself
from a primarily agricultural society into one based on the manufacturing
of goods and services.
Individual manual labor is often replaced by mechanized mass production
and craftsmen are replaced by assembly lines.
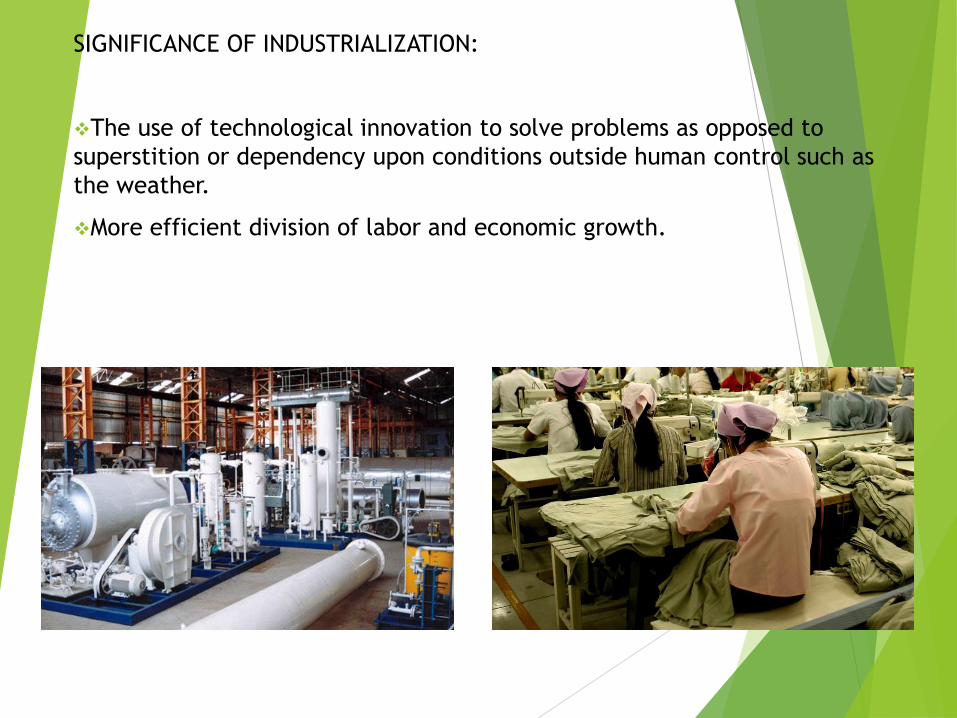
SIGNIFICANCE OF INDUSTRIALIZATION:
The use of technological innovation to solve problems as opposed to
superstition or dependency upon conditions outside human control such as
the weather.
More efficient division of labor and economic growth.
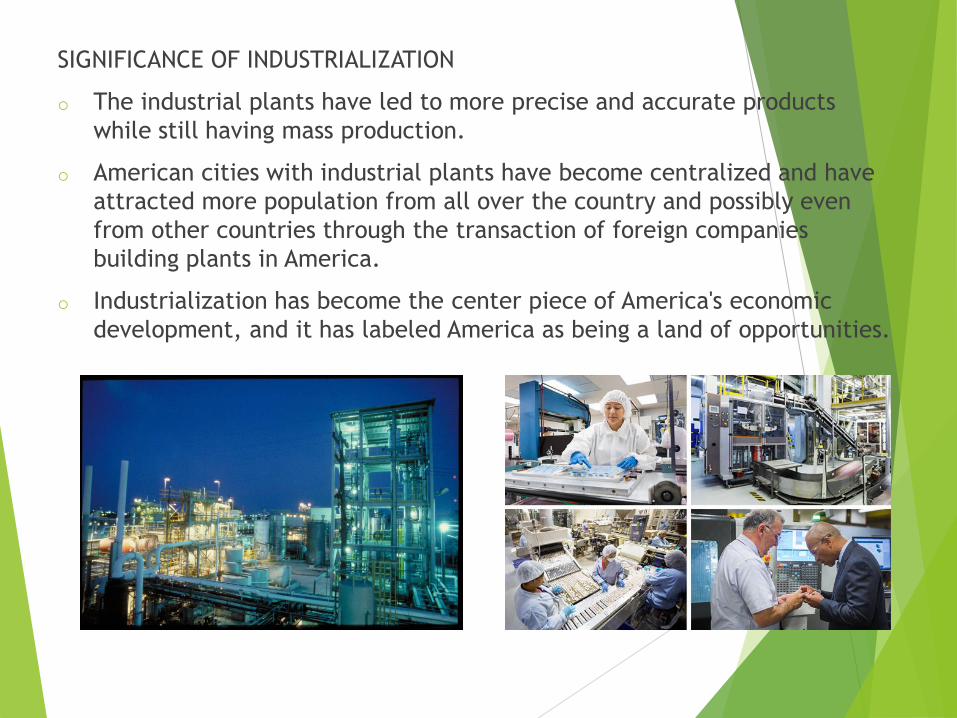
SIGNIFICANCE OF INDUSTRIALIZATION
o The industrial plants have led to more precise and accurate products
while still having mass production.
o American cities with industrial plants have become centralized and have
attracted more population from all over the country and possibly even
from other countries through the transaction of foreign companies
building plants in America.
o Industrialization has become the center piece of America's economic
development, and it has labeled America as being a land of opportunities.
STAGESOF
INDUSTRIALIZATION

Rostow's Stages of Growth
Traditional society
Preconditions for take-off
Take-off
Drive to maturity
Age of High mass consumption

Traditional society
characterized by subsistence agriculture or hunting and gathering; almost
wholly a "primary" sector economy
limited technology
A static or 'rigid' society: lack of class or individual economic mobility, with
stability prioritized and change seen negatively
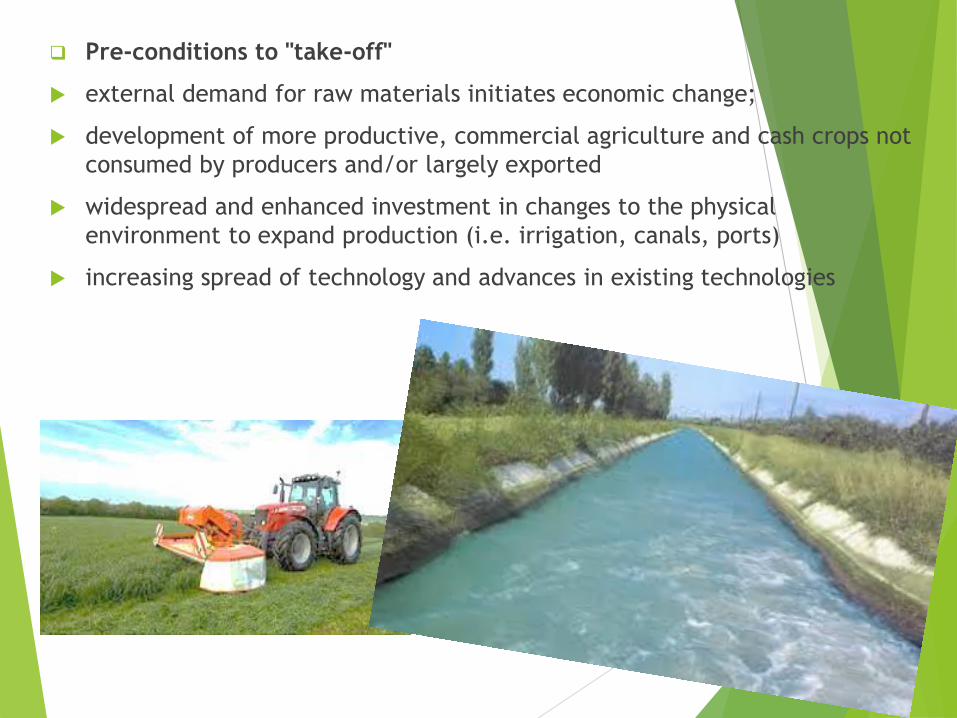
Pre-conditions to "take-off"
external demand for raw materials initiates economic change;
development of more productive, commercial agriculture and cash crops not
consumed by producers and/or largely exported
widespread and enhanced investment in changes to the physical
environment to expand production (i.e. irrigation, canals, ports)
increasing spread of technology and advances in existing technologies
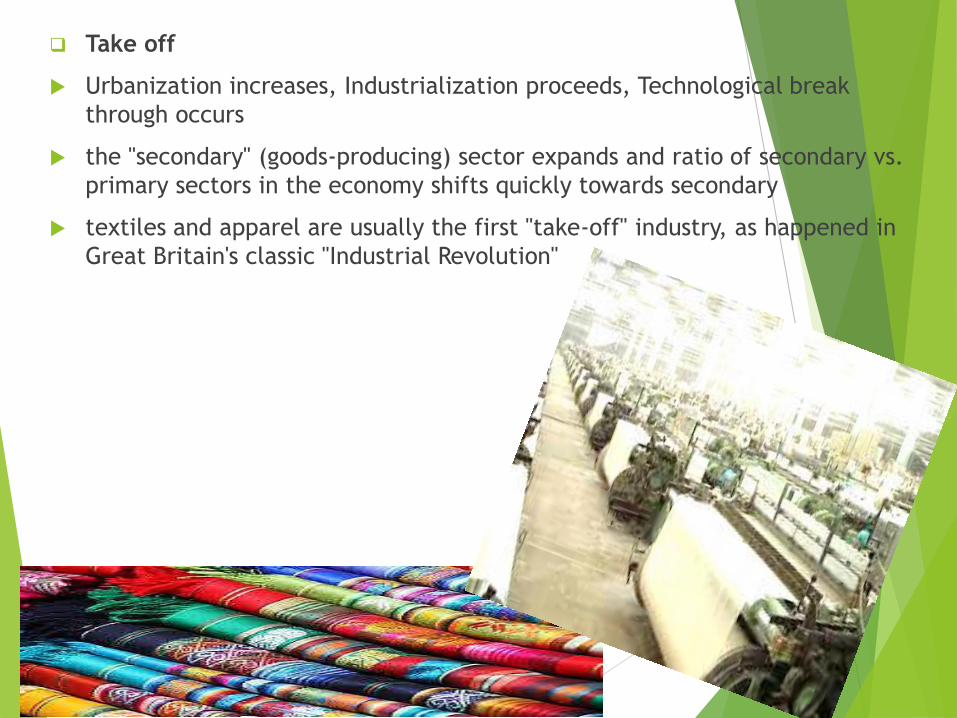
Take off
Urbanization increases, Industrialization proceeds, Technological break
through occurs
the "secondary" (goods-producing) sector expands and ratio of secondary vs.
primary sectors in the economy shifts quickly towards secondary
textiles and apparel are usually the first "take-off" industry, as happened in
Great Britain's classic "Industrial Revolution"

Drive to maturity
diversification of the industrial base; multiple industries expand and new
ones take root quickly
manufacturing shifts from investment-driven (capital goods) towards
consumer durables and domestic consumption
rapid development of transportation infrastructure
large-scale investment in social infrastructure (schools, universities,
hospitals, etc
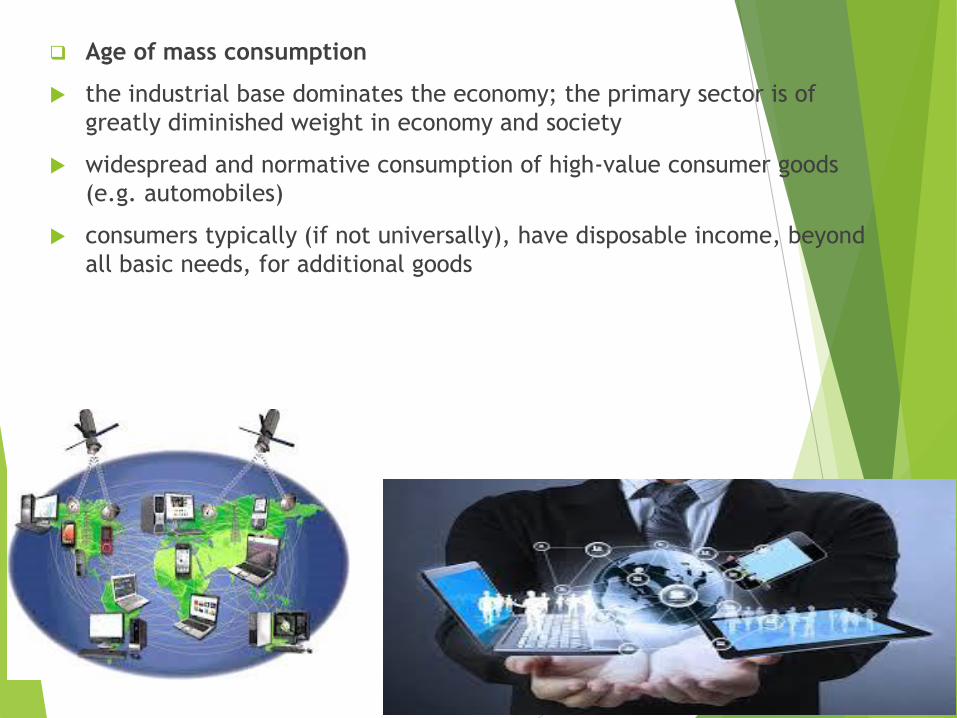
Age of mass consumption
the industrial base dominates the economy; the primary sector is of
greatly diminished weight in economy and society
widespread and normative consumption of high-value consumer goods
(e.g. automobiles)
consumers typically (if not universally), have disposable income, beyond
all basic needs, for additional goods


• Colin Clark's sector model of an economy undergoing technological change. In later stages, the Quaternary sector of the economy grows.

List of countries according
to industrialization

Top 10: First World Countries in terms of their Gross National Income
The GNI based on purchasing-power-parity (PPP) per capita in int'l Dollars.
# Country Region GNI per
Capita
1 Luxembourg Western Europe 66 821
2 Norway Northern Europe 41 941
3 United States North America 41 557
4 Ireland Northern Europe 40 003
5 Bermuda (overseas territory of the UK) North America *36 000
6 Iceland Northern Europe 35 686
7 Denmark Northern Europe 34 718
8 San Marino Southern Europe *34 600
9 Canada North America 34 444
10 Switzerland Western Europe 33 168
Sources: IMF -- International Monetary Fund, World Economic Outlook Database, April 2005
(*) CIA The World Factbook (covers countries not mentioned by the IMF, information may refer to 2004 or earlier.)
Slightly different figures you will find at The World Bank Group

Third World Countries in Terms of their Gross National Income (GNI)
Countries with the least gross national income based on purchasing-power-parity (PPP) per capita in int'l Dollars.
Simplified the GNI PPP is the average annual income earned by a citizen of a country.
That means for example, a citizen of Malawi can spend $ 1.6 a day to make a living,
a citizen of Eritrea $ 2.5, the average US citizen spends $ 114 daily.
Below countries with an average yearly income per capita and year under $ 1000,
poorest nations first.
Rank Country
Region
GNI per capita
1 Timor-Leste South-East Asia *400
2 Malawi Eastern Africa 596
3 Somalia Eastern Africa *600
4 Democratic Republic of the Congo Middle Africa 675
5 Tanzania Eastern Africa 720
6 Yemen Middle East 745
7 Burundi Eastern Africa 753
8 Afghanistan Central Asia *800
9 Guinea-Bissau Western Africa 856
10 Ethiopia Eastern Africa 859
11 Niger Western Africa 896
12 Liberia Western Africa *900
13 Sierra Leone Western Africa 901
14 Madagascar Eastern Africa 911
15 Zambia Eastern Africa 911
16 Eritrea Eastern Africa 917
Sources: IMF -- International Monetary Fund, World Economic Outlook Database, April 2005
(*) CIA The World Factbook (covers countries not mentioned by the IMF, information may refer to 2004 or earlier.)
Slightly different figures you will find at The World Bank Group

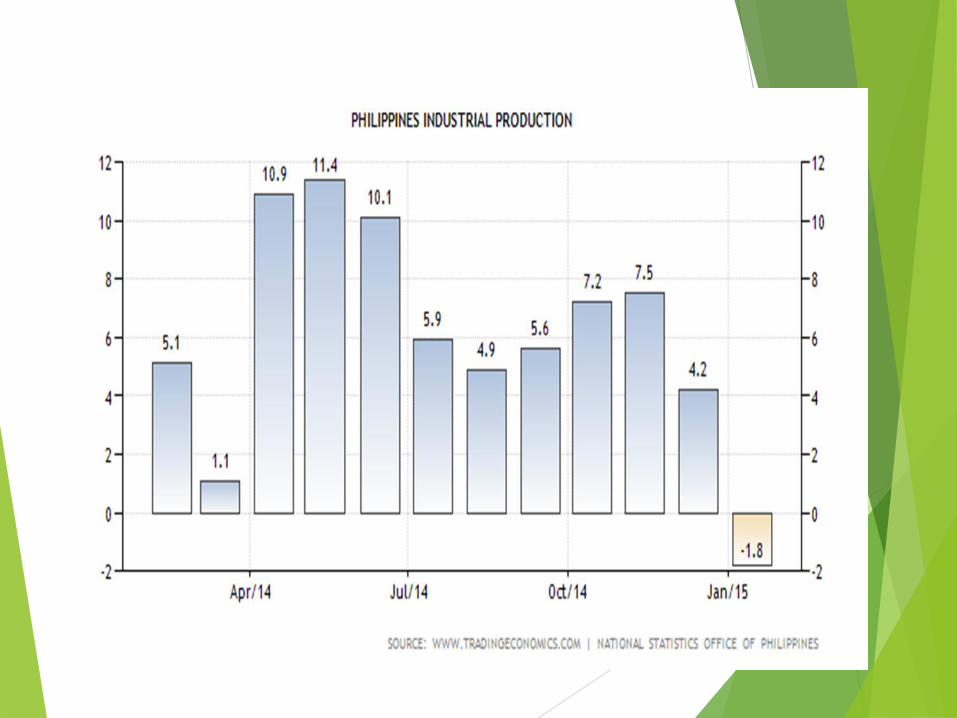
PHILIPPINE INDUSTRIALIZATION SITUATIONS AND ISSUES
Industrial Production in Philippines decreased 1.8
percent in January of 2015 over the same month in the
previous year. Industrial Production in Philippines
averaged 9.22 percent from 1986 until 2014, reaching
an all time high of 68.60 percent in April of 1988 and a
record low of -26.60 percent in January of 2009.
Industrial Production in Philippines is reported by the
National Statistics Office of Philippines.

Philippines is the 2nd fastest
growing country in Asia
The Gross Domestic Product (GDP) in Philippines
expanded 6.90 percent in the fourth quarter of 2014
over the same quarter of the previous year. GDP Annual
Growth Rate in Philippines averaged 5.09 percent from
2001 until 2014, reaching an all time high of 8.90
percent in the second quarter of 2010 and a record low
of 0.50 percent in the third quarter of 2009. GDP Annual
Growth Rate in Philippines is reported by the Philippine
National Statistical Coordination Board.