Embed Size (px)
Citation preview
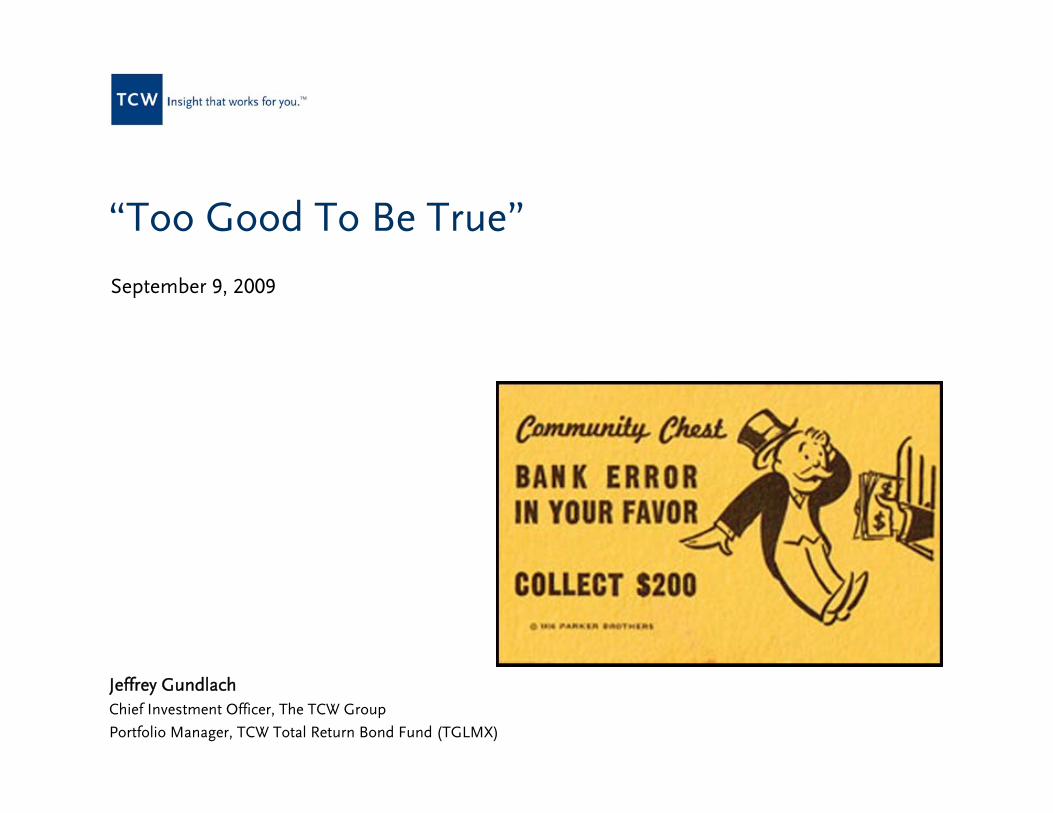
“Too Good To Be True”
September 9, 2009
Jeffrey GundlachChief Investment Officer, The TCW Group
Portfolio Manager, TCW Total Return Bond Fund (TGLMX)

2
Too Good to be TrueJeffrey Gundlach
Table of Contents
I. Market Overview
II. Fixed Income Market Valuations
III. Housing Market Update
The information contained herein may include estimates, projections, and other “forward-looking” statements.Actual events may differ substantially from those presented herein. TCW assumes no duty to update any such statements.
Any opinions expressed are current only as of the time made and are subject to change without notice. The views expressed hereinare solely those of the author and do not represent the views of TCW as a firm or of any other portfolio manager or employee of TCW.

I. Market Overview
4
Too Good to be TrueJeffrey Gundlach
4
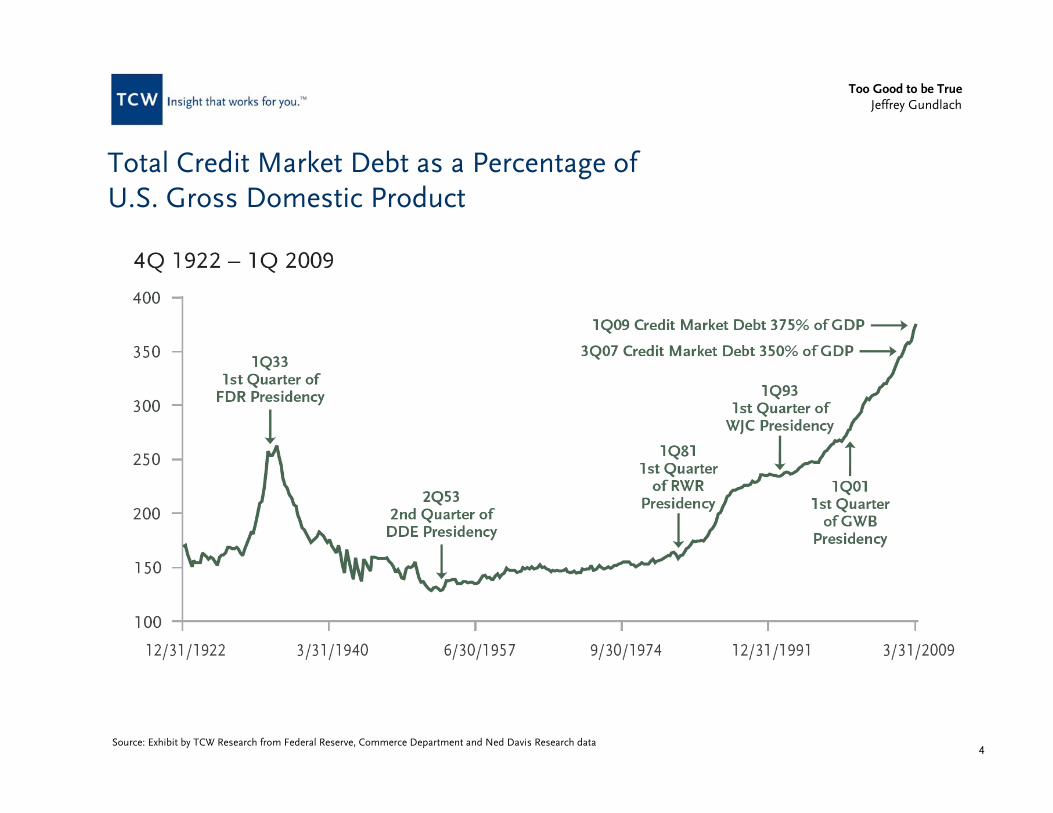
Total Credit Market Debt as a Percentage of U.S. Gross Domestic Product
Source: Exhibit by TCW Research from Federal Reserve, Commerce Department and Ned Davis Research data

Cash For Clunkers Program
Most Purchased – Toyota CorollaMost Traded-In “clunker” – Ford Explorer

6
Too Good to be TrueJeffrey Gundlach
6
U.S. Liability Map
The Federal Government Post CrisisHow exposed are public finances?
Certain Conditional Uncertain
ContractualObligation
Policy Commitment
PotentialPolicy
commitment
How
firm
is th
e co
mm
itmen
t?
FederalGovernment
Debt($9.0 trillion, FY10)
ContingentLiabilities
(guarantees)($5.0 trillion+) Public Sector
PensionLiabilities
($5.4 trillion, FY07)
Social Security and Medicare
($46 trillion, FY07)Value of expenses versus revenues
over the next 75 years under unchanged policiesState/Local
Government Debt($3 trillion+, FY10)
Net cost of Recapitalization(Depends on Asset Values-Initial Injection
of $700 billion+?)
U.S. GDP$14 trillion
Source: Moody’s, U.S. Treasury

7
Too Good to be TrueJeffrey Gundlach
7
U.S. Government Current Liabilities and Unfunded Promises-To-Pay($ Trillions)
$3.6 $3.9 $4.3 $4.6 $4.9 $5.1 $5.8 $8.5
$26.5
$43.3$46.4
$50.1$52.8
$56.5
$63.4
$30.1
$0
$10
$20
$30
$40
$50
$60
$70
$80
FY2002 FY2003 FY2004 FY2005 FY2006 FY2007 FY2008 FY2009E
Current Liabilities & Unfunded Promises of the U.S. Government
Publicly Held Debt
Source: TCW Research, U.S. Treasury

8
Too Good to be TrueJeffrey Gundlach
Nominal GDP
Source: Bloomberg Financial Services

9
Too Good to be TrueJeffrey Gundlach
$0
$500
$1,000
$1,500
$2,000
$2,500
1960
1962
1964
1966
1968
1970
1972
1974
1976
1978
1980
1982
1984
1986
1988
1990
1992
1994
1996
1998
2000
2002
2004
2006
Healthcare Expenditures 1960 – 2007($ Billions)
Source: Federal Reserve
2007$2.24
Ten Years Ago – 1997$1.12
Twenty Years Ago – 1987$513

10
Too Good to be TrueJeffrey Gundlach
Healthcare Expenditures Percentage of GDP
Source: Federal Reserve
0%
2%
4%
6%
8%
10%
12%
14%
16%
18%
1960
1962
1964
1966
1968
1970
1972
1974
1976
1978
1980
1982
1984
1986
1988
1990
1992
1994
1996
1998
2000
2002
2004
2006
200716.2%

11
Too Good to be TrueJeffrey Gundlach
S&P 500 – Last Seven Years
Source: Bloomberg Financial Services

12
Too Good to be TrueJeffrey Gundlach
S&P 500 vs. TGLMX – Last 10 Years
Source: Bloomberg Financial Services
13
Too Good to be TrueJeffrey Gundlach
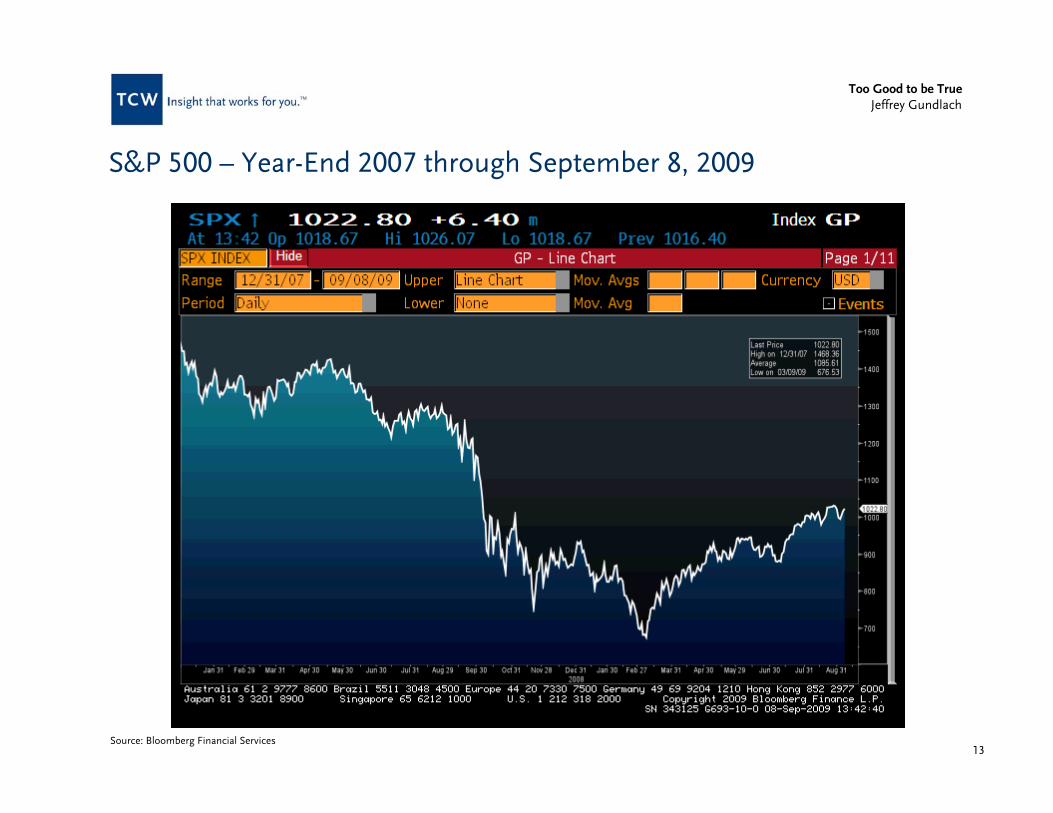
S&P 500 – Year-End 2007 through September 8, 2009
Source: Bloomberg Financial Services

14
Too Good to be TrueJeffrey Gundlach
U.S. Dollar Index Futures – Last Seven Years
Source: Bloomberg Financial Services

15
Too Good to be TrueJeffrey Gundlach
U.S. Dollar Index Futures – Year End 2007 through September 8, 2009
Source: Bloomberg Financial Services

16
Too Good to be TrueJeffrey Gundlach
Gold – Year End 2007 through September 8, 2009
Source: Bloomberg Financial Services, CMX-Commodity Exchange, Inc.

17
Too Good to be TrueJeffrey Gundlach
Commodity Prices – Last Seven Years
Source: Bloomberg Financial Services, Commodities Research Bureau

18
Too Good to be TrueJeffrey Gundlach
Commodity Prices – Year-End 2007 through September 4, 2009
Source: Bloomberg Financial Services, Commodities Research Bureau

II. Fixed Income Market Valuations

20
Too Good to be TrueJeffrey Gundlach
10-Year U.S. Treasury vs. Fed Funds
Source: Bloomberg Financial Services. Data ending September 4, 2009.
!8.00%
!6.00%
!4.00%
!2.00%
0.00%
2.00%
4.00%
6.00%
1/31/1971
1/31/1973
1/31/1975
1/31/1977
1/31/1979
1/31/1981
1/31/1983
1/31/1985
1/31/1987
1/31/1989
1/31/1991
1/31/1993
1/31/1995
1/31/1997
1/31/1999
1/31/2001
1/31/2003
1/31/2005
1/31/2007
1/31/2009

21
Too Good to be TrueJeffrey Gundlach
Merrill Corporate IndexYield Spread to the Merrill Treasury IndexDecember 1985 to September 4, 2009
0.00%
1.00%
2.00%
3.00%
4.00%
5.00%
6.00%
7.00%
Dec-85Dec-86
Dec-87Dec-88
Dec-89Dec-90
Dec-91Dec-92
Dec-93Dec-94
Dec-95Dec-96
Dec-97Dec-98
Dec-99Dec-00
Dec-01Dec-02
Dec-03Dec-04
Dec-05Dec-06
Dec-07Dec-08
Yield Spread Average Yield Spread
Source: Merrill Lynch Indices, Bloomberg

22
Too Good to be TrueJeffrey Gundlach
Merrill ABS Floating IndexYield Spread to 1 Month LIBORSeptember 1994 to September 4, 2009
0.00%
1.00%
2.00%
3.00%
4.00%
5.00%
6.00%
7.00%
8.00%
9.00%
10.00%
Oct-94Oct-95
Oct-96Oct-97
Oct-98Oct-99
Oct-00Oct-01
Oct-02Oct-03
Oct-04Oct-05
Oct-06Oct-07
Oct-08
Yield Spread Average Yield Spread
Source: Merrill Lynch Indices, Bloomberg

23
Too Good to be TrueJeffrey Gundlach
Merrill CMBS Fixed Rate IndexYield Spread to the Merrill Treasury IndexDecember 1997 to September 4, 2009
0.00%
2.00%
4.00%
6.00%
8.00%
10.00%
12.00%
Dec-97Dec-98
Dec-99Dec-00
Dec-01Dec-02
Dec-03Dec-04
Dec-05Dec-06
Dec-07Dec-08
Yield Spread Average Yield Spread
Source: Merrill Lynch Indices, Bloomberg

24
Too Good to be TrueJeffrey Gundlach
Merrill High Yield IndexYield Spread to the Merrill Treasury IndexDecember 1985 to September 4, 2009
0.00%
2.00%
4.00%
6.00%
8.00%
10.00%
12.00%
14.00%
16.00%
18.00%
20.00%
Dec-85Jun-87
Dec-88Jun-90
Dec-91Jun-93
Dec-94Jun-96
Dec-97Jun-99
Dec-00Jun-02
Dec-03Jun-05
Dec-06Jun-08
Yield Spread Average Yield Spread
Source: Merrill Lynch Indices, Bloomberg

25
Too Good to be TrueJeffrey Gundlach
Merrill Mortgage IndexYield Spread to the Merrill Treasury IndexDecember 1985 to September 4, 2009
0.00%
0.50%
1.00%
1.50%
2.00%
2.50%
3.00%
3.50%
Dec-85Jun-87
Dec-88Jun-90
Dec-91Jun-93
Dec-94Jun-96
Dec-97Jun-99
Dec-00Jun-02
Dec-03Jun-05
Dec-06Jun-08
Yield Spread Average Yield Spread
Source: Merrill Lynch Indices, Bloomberg

III. Housing Market Update

27
Too Good to be TrueJeffrey Gundlach
27
S&P/Case Shiller 20-City Monthly CompositeJanuary 2000 – June 2009
Source: Prepared by TCW from data from Standard & Poor’s
75
100
125
150
175
200
225
Jan!00
Jul!00
Jan!01
Jul!01
Jan!02
Jul!02
Jan!03
Jul!03
Jan!04
Jul!04
Jan!05
Jul!05
Jan!06
Jul!06
Jan!07
Jul!07
Jan!08
Jul!08
Jan!09
!25
!20
!15
!10
!5
0
5
10
15
20
S&P/Case!Shiller"20!City"Index YoY"% "Chg
July 2006207
June 2009141
Decline of 31% from peak through February 2009
Aug 200417.1% YoY
June 2009-15.4% YoY

28
Too Good to be TrueJeffrey Gundlach
28Source: Prepared by TCW from data from Standard & Poor’s and Mortgage Bankers Association
S&P/Case Shiller National Quarterly House Price Index vs. MBA Survey Subprime Delinquencies as % of Subprime Mortgage Loans
60
80
100
120
140
160
180
200
Mar-98
Sep-98
Mar-99
Sep-99
Mar-00
Sep-00
Mar-01
Sep-01
Mar-02
Sep-02
Mar-03
Sep-03
Mar-04
Sep-04
Mar-05
Sep-05
Mar-06
Sep-06
Mar-07
Sep-07
Mar-08
Sep-08
Mar-09
Hou
se P
rice
Inde
x
10
12
14
16
18
20
22
24
26
28
% S
ubpr
ime
Loan
Cou
nt
S&P/Case Shiller House Price Index Subprime Delinquencies % of Subprime Mortgages Outstanding
S&P/Case-Shille r HPIPeak @ 190 2Q06
Subprime Delqs25.4% 2Q09
RecessionMarch-Nov 2001
Subprime De lqs 10.3%2Q00, 4Q04, 2Q05
Subprime De lqs15.0% 2Q02
RecessionStarts
Dec 2007
Positive HPAduring 2001 recession
S&P/Case-Shille r HPI@ 133 2Q09

29
Too Good to be TrueJeffrey Gundlach
60
80
100
120
140
160
180
200
Mar-98
Sep-98
Mar-99
Sep-99
Mar-00
Sep-00
Mar-01
Sep-01
Mar-02
Sep-02
Mar-03
Sep-03
Mar-04
Sep-04
Mar-05
Sep-05
Mar-06
Sep-06
Mar-07
Sep-07
Mar-08
Sep-08
Mar-09
Hou
se P
rice
Inde
x
1
2
3
4
5
6
7
% P
rime
Loan
Cou
nt
S&P/Case Shiller House Price Index Prime Delinquencies % of Prime Mortgages Outstanding
Prime Delqs6.4% 2Q09
RecessionMarch-Nov 2001
Prime Delqs2.9% 2Q01
RecessionStarts
Dec 2007
Positive HPAduring 2001 recession
S&P/Case-Shiller HPIPeak @ 190 2Q06
S&P/Case-Shiller HPI@ 133 2Q09
29Source: Prepared by TCW from data from Standard & Poor’s and Mortgage Bankers Association
S&P/Case Shiller National Quarterly House Price Index vs. MBA Survey Prime Delinquencies as % of Prime Mortgage Loans

30
Too Good to be TrueJeffrey Gundlach
Source: TCW Research and Deutsche Bank ABX 2006-2 AAA tranche data through September 4, 2009.1. The boxes in the chart represent typical stages of market cycles. However, this is not a prediction of when the stages will begin or end, or of valuation, or of when any TCW Strategy will invest or realize on investments.
The Four Stages Of Market Opportunity – Senior Tranche
$25.0
$35.0
$45.0
$55.0
$65.0
$75.0
$85.0
$95.0
1/2/2007
5/2/2007
9/2/2007
1/2/2008
5/2/2008
9/2/2008
1/2/2009
5/2/2009
9/2/2009
Price
Belief
Concern
Liquidation
Recovery
• Significant repricing of mortgage credit risk is currently underway- Creating credit pockets of inefficiency, and - Discounting of select credit
• Some mortgage and mortgage-related assets have become “very cheap” as a result1

31
Too Good to be TrueJeffrey Gundlach
ABX 2006-2 A-Tranche
$0.0
$10.0
$20.0
$30.0
$40.0
$50.0
$60.0
$70.0
$80.0
$90.0
$100.0
Jan-07Mar-07
May-07
Jul-07Sep-07
Nov-07Jan-08
Mar-08May-0
8Jul-08
Sep-08Nov-08
Jan-09Mar-09
May-09
Jul-09Sep-09
Pri
ce
Source: TCW Research and JP Morgan ABX 2006-2 A tranche data through September 4, 2009.

32
Too Good to be TrueJeffrey Gundlach
0.0%
5.0%
10.0%
15.0%
20.0%
25.0%
30.0%
35.0%
40.0%
45.0%
50.0%
1/1/20
00
6/1/20
00
11/1/200
0
4/1/20
01
9/1/20
01
2/1/20
02
7/1/20
02
12/1/200
2
5/1/20
03
10/1/200
3
3/1/20
04
8/1/20
04
1/1/20
05
6/1/20
05
11/1/200
5
4/1/20
06
9/1/20
06
2/1/20
07
7/1/20
07
12/1/200
7
5/1/20
08
10/1/200
8
3/1/20
09
8/1/20
09
32
Subprime Securitized Mortgage Serious Delinquency Levels (60++)
Constant Default Rate (CDR)60++
15.1%
44.3%
Source: LoanPerformance data and TCW as of August 1, 2009 Note: Serious delinquencies refers to 60++ days late on first liens only. CDR on first liens only. Subprime is defined as FICO <675. Based as a percentage of unpaid principal balance.

33
Too Good to be TrueJeffrey Gundlach
0.0%
5.0%
10.0%
15.0%
20.0%
25.0%
30.0%
1/1/
2000
7/1/
2000
1/1/
2001
7/1/
2001
1/1/
2002
7/1/
2002
1/1/
2003
7/1/
2003
1/1/
2004
7/1/
2004
1/1/
2005
7/1/
2005
1/1/
2006
7/1/
2006
1/1/
2007
7/1/
2007
1/1/
2008
7/1/
2008
1/1/
2009
7/1/
2009
33
Subprime Securitized Mortgages Serious Delinquency Levels (Foreclosures + REO + Bankruptcy)
Foreclosure + REO + Bankruptcy
15.1%
24.9%Constant Default Rate (CDR)
Source: LoanPerformance data and TCW as of August 1, 2009 Note: Foreclosure+REO+Bankruptcy, CDR on first liens only. Subprime is defined as FICO <675. Based as a percentage of unpaid principal balance.
34
Too Good to be TrueJeffrey Gundlach
34
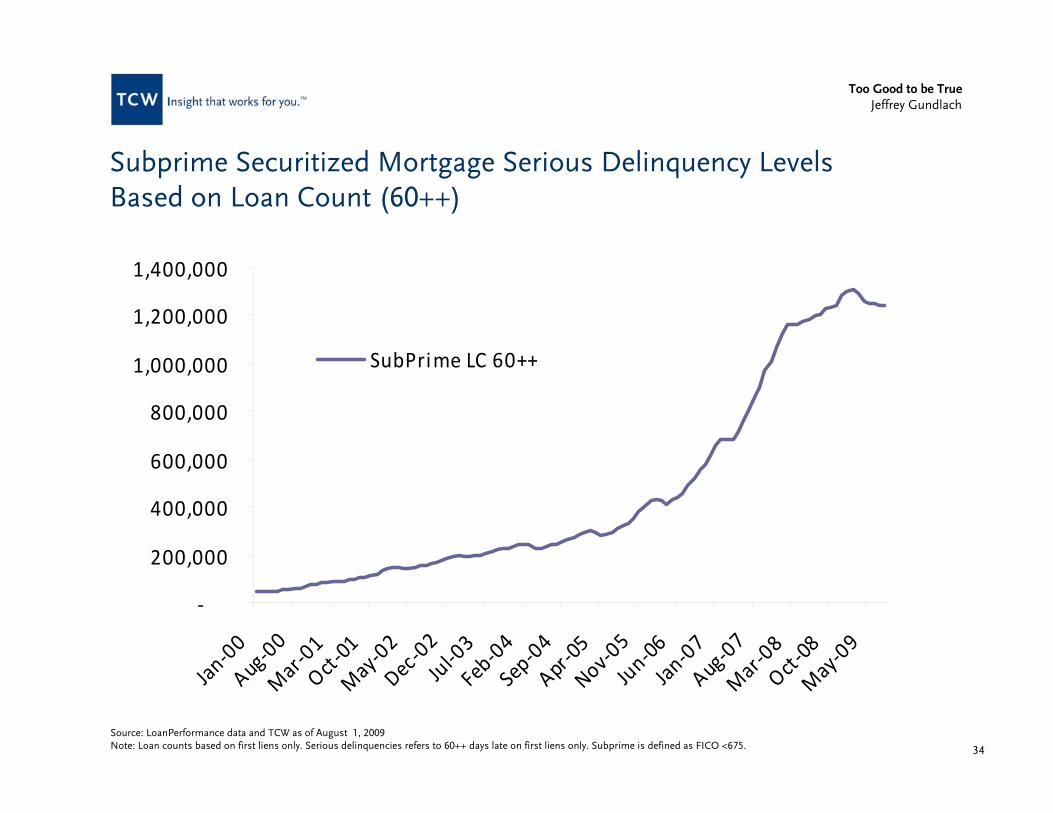
Subprime Securitized Mortgage Serious Delinquency LevelsBased on Loan Count (60++)
!
200,000
400,000
600,000
800,000
1,000,000
1,200,000
1,400,000
Jan!00
Aug!00
Mar!01
Oct!01
May!02
Dec!02
Jul!03
Feb!04
Sep!04
Apr!05
Nov!05
Jun!06
Jan!07
Aug!07
Mar!08
Oct!08
May!09
SubPrime"LC"60++
Source: LoanPerformance data and TCW as of August 1, 2009 Note: Loan counts based on first liens only. Serious delinquencies refers to 60++ days late on first liens only. Subprime is defined as FICO <675.

35
Too Good to be TrueJeffrey Gundlach
0.0%
5.0%
10.0%
15.0%
20.0%
25.0%
30.0%
1/1/
2000
7/1/
2000
1/1/
2001
7/1/
2001
1/1/
2002
7/1/
2002
1/1/
2003
7/1/
2003
1/1/
2004
7/1/
2004
1/1/
2005
7/1/
2005
1/1/
2006
7/1/
2006
1/1/
2007
7/1/
2007
1/1/
2008
7/1/
2008
1/1/
2009
7/1/
2009
35
Alt-A Securitized Mortgage Serious Delinquency Levels (60++)
Constant Default Rate (CDR)60++
10.6%
24.4%
Source: LoanPerformance data and TCW as of August 1, 2009 Note: Serious delinquencies refers to 60++ days late on first liens only. CDR based on first liens only. Alt-A is defined as FICO 675-725, LTV >=75. Based as a percentage of unpaid principal balance.

36
Too Good to be TrueJeffrey Gundlach
0.0%
2.0%
4.0%
6.0%
8.0%
10.0%
12.0%
14.0%
16.0%
18.0%
1/1/20
00
7/1/20
00
1/1/20
01
7/1/20
01
1/1/20
02
7/1/20
02
1/1/20
03
7/1/20
03
1/1/20
04
7/1/20
04
1/1/20
05
7/1/20
05
1/1/20
06
7/1/20
06
1/1/20
07
7/1/20
07
1/1/20
08
7/1/20
08
1/1/20
09
7/1/20
09
36
Alt-A Securitized Mortgages Serious Delinquency Levels (Foreclosures + REO + Bankruptcy)
Constant Default Rate (CDR)Foreclosure + REO + Bankruptcy
10.6%
15.4%
Source: LoanPerformance data and TCW as of August 1, 2009 Note: Foreclosure + REO + Bankruptcy, CDR based on first liens only. Alt-A is defined as FICO 675-725, LTV >=75. Based as a percentage of unpaid principal balance.

37
Too Good to be TrueJeffrey Gundlach
37
Alt-A Securitized Mortgage Serious Delinquency LevelsBased on Loan Count(60++) vs. Constant Default Rate (CDR)
!
100,000
200,000
300,000
400,000
500,000
600,000
700,000
Jan!00
Aug
!00
Mar!01
Oct!01
May!02
Dec!02
Jul!0
3
Feb!04
Sep!04
Apr!05
Nov
!05
Jun!06
Jan!07
Aug
!07
Mar!08
Oct!08
May!09
Al t!A"LC"60++
Source: LoanPerformance data and TCW as of August 1, 2009 Note: Loan counts based on first liens only. Serious delinquencies refers to 60++ days late on first liens only. Alt-A is defined as FICO 675-725, LTV >=75.

38
Too Good to be TrueJeffrey Gundlach
0.0%
1.0%
2.0%
3.0%
4.0%
5.0%
6.0%
7.0%
1/1/
2000
7/1/
2000
1/1/
2001
7/1/
2001
1/1/
2002
7/1/
2002
1/1/
2003
7/1/
2003
1/1/
2004
7/1/
2004
1/1/
2005
7/1/
2005
1/1/
2006
7/1/
2006
1/1/
2007
7/1/
2007
1/1/
2008
7/1/
2008
1/1/
2009
7/1/
2009
38
Prime Securitized Mortgage Serious Delinquency Levels (60++)
Constant Default Rate (CDR)60++
2.1%
6.2%
Source: LoanPerformance data and TCW as of August 1, 2009 Note: Serious delinquencies refers to 60++ days late on first liens only. CDR based on first liens only. Prime is defined as FICO >725 and LTV <75.Based as a percentage of unpaid principal balance.

39
Too Good to be TrueJeffrey Gundlach
0.0%
0.5%
1.0%
1.5%
2.0%
2.5%
3.0%
3.5%
4.0%
1/1/20
00
7/1/20
00
1/1/20
01
7/1/20
01
1/1/20
02
7/1/20
02
1/1/20
03
7/1/20
03
1/1/20
04
7/1/20
04
1/1/20
05
7/1/20
05
1/1/20
06
7/1/20
06
1/1/20
07
7/1/20
07
1/1/20
08
7/1/20
08
1/1/20
09
7/1/20
09
39
Prime Securitized Mortgages Serious Delinquency Levels (Foreclosures + REO + Bankruptcy)
Constant Default Rate (CDR)Foreclosure + REO + Bankruptcy
2.1%
3.7%
Source: LoanPerformance data and TCW as of August 1, 2009 Note: Foreclosure + REO + Bankruptcy, CDR based on first liens only. Prime is defined as FICO >725 and LTV <75.Based as a percentage of unpaid principal balance.

40
Too Good to be TrueJeffrey Gundlach
!
5,000
10,000
15,000
20,000
25,000
30,000
35,000
Jan!00Jul!00
Jan!01Jul!01
Jan!02Jul!02
Jan!03Jul!03
Jan!04Jul!04
Jan!05Jul!05
Jan!06Jul!06
Jan!07Jul!07
Jan!08Jul!08
Jan!09Jul!09
Prime"LC"60++
40
Prime Securitized Mortgages Serious Delinquency Levels (60++) Based on Loan Count
Source: LoanPerformance data and TCW as of August 1, 2009 Note: Loan counts based on first liens only. Serious delinquencies refers to 60++ days late on first liens only. Prime is defined as FICO >725, LTV <75.

41
Too Good to be TrueJeffrey Gundlach
0.00%
5.00%
10.00%
15.00%
20.00%
25.00%
30.00%
35.00%
40.00%
45.00%
1/1/20
05
6/1/20
05
11/1/200
5
4/1/20
06
9/1/20
06
2/1/20
07
7/1/20
07
12/1/200
7
5/1/20
08
10/1/200
8
3/1/20
09
8/1/20
09
Source: Loan Performance data based on FICO and LTV. August servicing reported as of September 4, 2009. Prime: FICO > 725 and LTV <75Alt-A: FICO 675-725; and FICO > 725 and LTV >= 75Subprime: FICO < 675
Historical Voluntary Prepayment Rates (VPR) on First Liens Securitized Mortgages
7.59%
2.47%
21.7%
Alt-A
Prime
Subprime

42
Too Good to be TrueJeffrey Gundlach
0%
10%
20%
30%
40%
50%
60%
70%
80%
2005
!01
2005
!04
2005
!07
2005
!10
2006
!01
2006
!04
2006
!07
2006
!10
2007
!01
2007
!04
2007
!07
2007
!10
2008
!01
2008
!04
2008
!07
2008
!10
2009
!01
2009
!04
2009
!07
Prime Alt"A Sub"Prime
January 2005 – August 2009
Loss Severities on First Liens
56.4%
66.4%
41.9%
Source: Loan Performance data based on FICO and LTV. August servicing reported as of September 4, 2009. Prime: FICO > 725 and LTV <75Alt-A: FICO 675-725; and FICO > 725 and LTV >= 75Subprime: FICO < 675

43
Too Good to be TrueJeffrey Gundlach
Mortgage Refinancing Index
Source: Bloomberg Financial Services
44
Too Good to be TrueJeffrey Gundlach
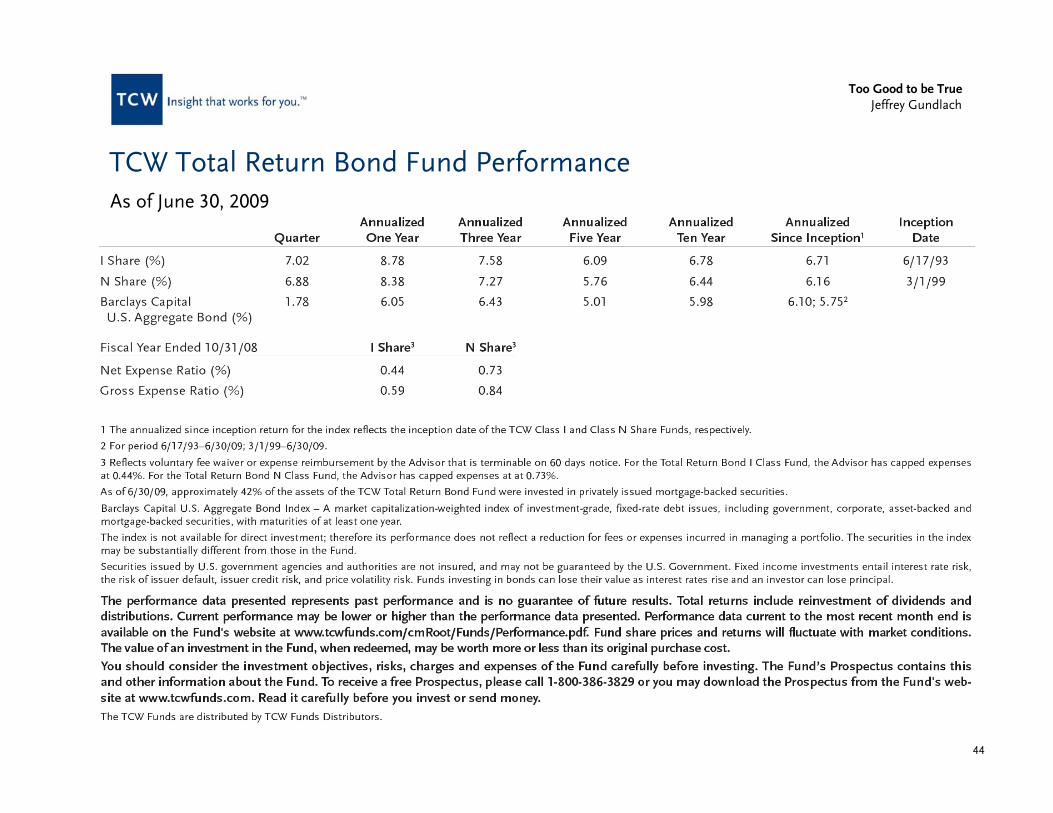
TCW Total Return Bond Fund PerformanceAs of June 30, 2009

45
Too Good to be TrueJeffrey Gundlach
A Word About Risk
• Interest rate risk refers to the possibility that the value of the Fund’s portfolio investments may fall since fixed income securities generally fall in value when interest rates rise.
– Extension risk is the possibility that rising interest rates may cause owners of the underlying mortgagesto pay off their mortgages at a slower than expected rate. This particular risk may effectively change a security whichwas considered short or intermediate term into a long-term security. Long-term securities generally drop in value more dramatically in response to rising interest rates than short or intermediate-term securities.
– Prepayment risk refers to the possibility that falling interest rates may cause owners of the underlying mortgages topay off their mortgages at a faster than expected rate. This tends to reduce returns since the funds prepaid will haveto be reinvested at the then lower prevailing rates.
• Liquidity risk refers to the possibility that the Fund may lose money or be prevented from earning capital gains if it cannotsell a security at the time and price that is most beneficial to the Fund.
• Market risk is the possibility that the returns from the types of securities that the Fund invests in will underperform returnsfrom the various general securities markets or different asset classes.
• Credit risk refers to the loss in the value of a security based on a default in the payment of principle and/or interest of the security, or the perception of the market of such default. The value of the Fund’s share price will fluctuate up or down basedon the value of the portfolio holdings, which can be affected by these risks.
The information contained herein may include estimates, projections, and other “forward-looking” statements. Actual events may differ substantially from those presented herein. TCW assumes no duty to update any such statements.
Any opinions expressed are current only as of the time made and are subject to change without notice. The views expressed herein are solely those of the author and do not represent the views of TCW as a firm or of any other portfolio manager or employee of TCW.
The primary risks affecting this Fund are “interest rate risk” (including “extension risk” and “prepayment risk”), “liquidity risk,” “market risk,” and “credit risk.”

46
Too Good to be TrueJeffrey Gundlach
Biography
Jeffrey GundlachChief Investment OfficerThe TCW Group, Inc.
Mr. Gundlach is the Chief Investment Officer and a member of the Board of Directors of the TCW Group, Inc. In addition, he oversees fixed income investments as Chairman of the TCW Multi-Strategy Fixed Income Committee and is the Co-Founder and lead portfolio manager of the Mortgage-Backed Securities group. His investment strategies have been featured in leading publications including the New York Times, the Wall Street Journal, Barrons, Forbes and Institutional Investor. In 2007, Morningstar named Mr. Gundlach Fixed Income Fund Managerof the Year and Standard & Poor’s/BusinessWeek gave its Excellence in Fund Management Awardto TGLMX, the only bond fund to win the prestigious award five years in a row. Mr. Gundlach joined the firm in 1985, prior to which he was associated with Transamerica Corporation's Los Angeles based Property/Casualty Insurance division. He worked in the Finance Department as Senior Loss Reserve, Analyst, responsible for investment discount and funding strategies. He is a graduate of Dartmouth College summa cum laude holding a BA in Mathematics and Philosophy. He attended Yale University as a PhD candidate in Mathematics.

47
Too Good to be TrueJeffrey Gundlach
Questions and Answers
Conference Call Attendees:
• If you have a question, please press star then 1 (*1) on your touch tone phone.
• If you wish to be removed from the queue, please press star then 2 (*2).
• If you are using a speakerphone, you may need to pick up the handset firstbefore pressing the numbers.
Webcast Attendees:
• For those of you wishing to submit a question via the Webcast, please enteryour question in the Question and Answer block to the left of this screen andpress submit.


![Gundlach Presentation: Penny For Your Thoughts [SLIDES]](https://img.pdfslide.us/doc/110x75/55cf96ee550346d0338eb3ce/gundlach-presentation-penny-for-your-thoughts-slides.jpg)