Embed Size (px)
Citation preview

MJPower engineeringMJPower engineeringMJPower engineeringMJPower engineering
2200 Instruction book

General overview:
The program uses Tabbed pages to seperate the individual functions.
Example: How to perform a basic Test session:
Click the Test tab.
When the Test page opens, click the Start Test button:
A warning to clear area around Dyno will appear:
Click OK to start test session:
A page with gauges showing RPM - Speed - A/F ratios etc. will show throughout the test runs :

After the test session,the Weather station data are automatically stored with the test session and the Remarks page opens .
Here you can enter make, model, owner and remarks data into the Test Session 1 edit windows.
If you want to save the session now just click the "Save Test session 1" button.
Click the Graph tab to view the graphs for the runs just performed.

Graph page.
Viewing Graphs:
On this screen are all the options necessary to display the graphs. You can watch from 1 to 4 run graphs at the same time.
The select buttons are arranged in 4 groups (red-blue-green-purple), each group relating to a separate test session and the color of its graph.
Inside each group the buttons are used to select which of the up to 4 runs in the test sequence you want to display.
Beneath the 4 groups, you find the checkboxes that determines how to show the graphs, as Horsepower, Torque or both, also you find the boxes to copy the number 1 test session (red) to any of the other test session boxes and
the clear check to deselect showing graphs from that box.
On the left side is the Speed/Rpm checkbox, to choose between the graphs being shown as roller speed (Kph/Mph) or engine Rpm related.
You can of course only display a graph as related to Rpm if you have Rpm data registered with the testrun.
There’s a series of buttons to choose between a set of pre-selected speed/rpm/power ranges, if you need a specific range you can either use the Zoom feature or set a specific value on the “Parameters” page.
When you view the Torque graph as roller speed related, the screen can also display a wind resistance curve, helping you to estimate the true topspeed of the bike tested. The display of and the parameters for this curve can
be changed with the Set air and roller resistance function.
When you are ready with the selection, you view the graphs by pressing the Refresh screen button.

In the bottom left corner is the "All" button that allows you to view all 4 runs simultaneously from Test session 1.
This will give you a quick overview of the test sequence and help you to determine which individual run is most representative for either viewing and/or comparing with other tests.
Run 1 - 2 - 3 - 4 are shown in the colors red - pink - orange - yellow.
The button has now changed name to "One", press it again and you are back to the default view of the graphs.
You can zoom in on a part of the graphs by holding down the left mouse button and move the mouse around, just release the left button when the selection is right, and to return to the un-zoomed display just press the
Refresh screen button orclick the right mousebutton in the Graph window.
Mark zoom area:
Release left mouse button and view zoomed area.

By moving the mouse while holding down the right mouse button, a vertical line and a digital readout is shown; move the mouse left/right and the horsepower, torque + Bmep under the line's crossing point with the graph is
displayed.
To use the above mentioned 2 functions, the mouse pointer needs to be inside the black graph window.
To printout the graphs, just press the "Print" button, and then select how many lines of remarks that are to be printed with the graphs, after that the standard windows printer dialog box is shown.

Test Page descriptionTest Page descriptionTest Page descriptionTest Page description.
Starting from the top left :
1. % Decel. Brake, enables the optional Eddy-brake to be used as an ordinary brake to slow down the roller after a Run, and the % setting determines how much force should the Eddy-brake apply if activated.
2. % Brake load, how much force should the Eddy-brake apply during a Run if activated.
3. Hold’n Go Rpm, the Rpm that the Hold’n Go function will lock at with the Eddy Brake untill the Run is started.
4. Use Hold’n Go, this function will lock the Rpm at the above selected level, this enables the user to turn the Throttle untill the desired position is reached and first then start the Run.
5. Rpm redline, this number determines the Rpm at which the Rpm gauge needle will change color to res.
6. Test parameters,
No RPM registration, select this option to run the test session without the Rpm pickup active.
720 - 360 - 180 and User defined degrees, sets the duration crank degrees between each impulse the Rpm pickup registers.
7. Test session buttons.
7a. If you don't want to register Rpm, just use the default setting of no Rpm registration and press the "Start test" button.
If you have selected an Ignition Impulse Degree the top Button will change Caption and read: "Start Test with RPM reg." this means you must have the Rpm Pick-up connected to the Bike.
7b.You can also use the "Pre-record RPM test" function.
Start with running the bike on the dyno in the gear you will use for the following roll-on and fast accelleration runs with the Rpm pick-up connected to the ignition system.
With the roller turning, speed up the bike until you get a steady reading on the computer screens rpm meter, hold it there and then press the remote button once.
Now the Crank/Roller relation is calculated and registred, and for the rest of the test sequence the rpm needle is displayed based on this calculation.
This means that the rpm pickup is only used during the first registration and is ignored for the rest of the test sequence.

7c. For everyday use the "Preset RPM test" function is very usefull, no need to connect anything to the Bike just use the Bikes own Tacho to get the Rpm from.
Start with running the bike on the dyno in the gear you will use for the following roll-on and fast accelleration runs.
With the roller turning, speed up the bike until you reach the RPM preset number written in box just above the Button, hold it steady there and press the remote button once.
Now the Crank/Roller relation is calculated and registrered by the software, and for the rest of the test sequence the rpm needle is displayed based on this calculation.
(change the number to what is appropiate for the Bike your testing, something around 2/3 of the rev limit is usually fine).
7d.To register Rpm from the bike you need to connect the Rpm pick-up to the primary Ignition coil wire and then select the correct interval in Crankshaft degrees between each ignition impulse; eg. for 1 impulse per Crankshaft revolution select 360 Degrees.
It is advisable to check the set-up first by using the "Rev. Counter check" function, this will display the Rpm counter and by rev'ing the engine you can check if everything is working okay without having to actually start a test session.
Starting from the top right :
1. MJPower Link Button. Opens the Ecu Link function.
2. Use Channel 10 for Throttle Position recording. If channel 10 is connected to the Throttle potentiometer on the Bike the Set 0% and Set 100% Buttons will adjust the 0 and 100 % settings to the voltage read from the Bike when the Throttle Grip is hold at those two positions while the Buttons are pressed.
3. Record from analog channels.
Select the analog channels that will be active during the test session.
Channels 1 and 6 are dedicated to the horizontal Lambda display on the Test screen.
4. View analog recordings.
Opens the analog graph window.

Full throttle testing.Full throttle testing.Full throttle testing.Full throttle testing.
Flow diagram of an ordinary Test session:
Our advice is to allways make your roll-on and fast-acceleration runs in topgear.

Today with wideband Lambda data available there's no real reason to make all-gear runs anymore, when we develop race and street engines allmost all the relevant data for optimizing the bike comes from analyzing the roll-on runs and only rarely from the fast-acceleration runs.
How to make a full throttle roll-on run.
Run the bike in topgear at the lowest rpm were the engine is running steady and accepts smooth opening of the throttle to full gas within app. 1000 - 2000 rpm.
Press the remote button and accellerate with full throttle opening as fast as the motor will accept it without stuttering, to the rev-counters redline or untill the rpm limiter cuts out the ignition.
How to make a fast acceleration run.
Accelerate the bike steadily in topgear up to approximately 1000 rpm over were it has its maximum torque, then when you have steady at that point, let go of the throttle grip and let the engine decellerate about 1000 rpm and give full throttle again as fast as you can.
A fast acceleration run starting at 9000 rpm and then overlayed on a roll-on run from the same bike.
The delay from 9000 to 9800 before catching up with the roll-on runs curve is typical for a vacuum carburettor equipped bike, a modern fuel injection engine will usually show allmost no delay before the curves are similar.
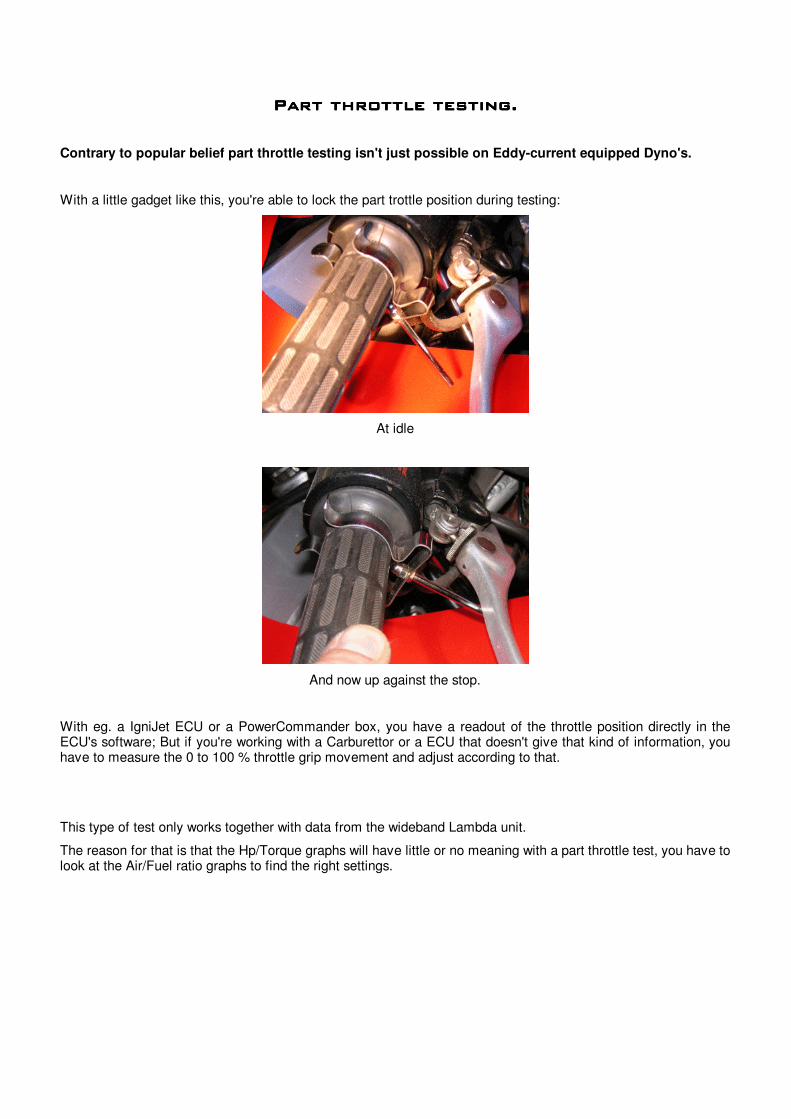
PartPartPartPart throttle testing. throttle testing. throttle testing. throttle testing.
Contrary to popular belief part throttle testing isn't just possible on Eddy-current equipped Dyno's.
With a little gadget like this, you're able to lock the part trottle position during testing:
At idle
And now up against the stop.
With eg. a IgniJet ECU or a PowerCommander box, you have a readout of the throttle position directly in the ECU's software; But if you're working with a Carburettor or a ECU that doesn't give that kind of information, you have to measure the 0 to 100 % throttle grip movement and adjust according to that.
This type of test only works together with data from the wideband Lambda unit.
The reason for that is that the Hp/Torque graphs will have little or no meaning with a part throttle test, you have to look at the Air/Fuel ratio graphs to find the right settings.

Shown here is a Cbr 600 -05 with a Laser exhaust and a PowerCommander box.
The red graphs are the original settings and the blue ones are after optimizing the part throttle fuel settings to the desired A/F 12.6 to 12.9:
80 % throttle and up to about 13.000 Rpm, when part throttle testing you lower the Rpm the run stops at relatively to the throttle position, you can usually feel when the acceleration fades and use that as a guideline.
20 % throttle and up to about 8.000 Rpm.
And just for comparison the 100 % throttle before and after runs

File handlingFile handlingFile handlingFile handling
Here you'll find the functions to save and read tests.
The first time you use this function after starting the program, it will start with the folder open that was specified in the Setup page -> Name of initial test folder function.
Loading test sessions:
To load a test session, you navigate to the folder were the file is located, then mark the file in the right window and click on the button that corresponds to the test session location into which you want to load it.
The 6.xx version of the MJP dyno software uses a new file format with a .z6p extension to the filename and cannot read the file formats from early MJP dyno versions.
Saving a test session:
To save a test session, press the Save session 1 button and a standard Windows Save As dialog box will be displayed:
Here you can move to the folder you want to save the test session in.
We strongly advise that you make a folder hierarchy that follows the bike make, model and year closely, to make later recognition easy.
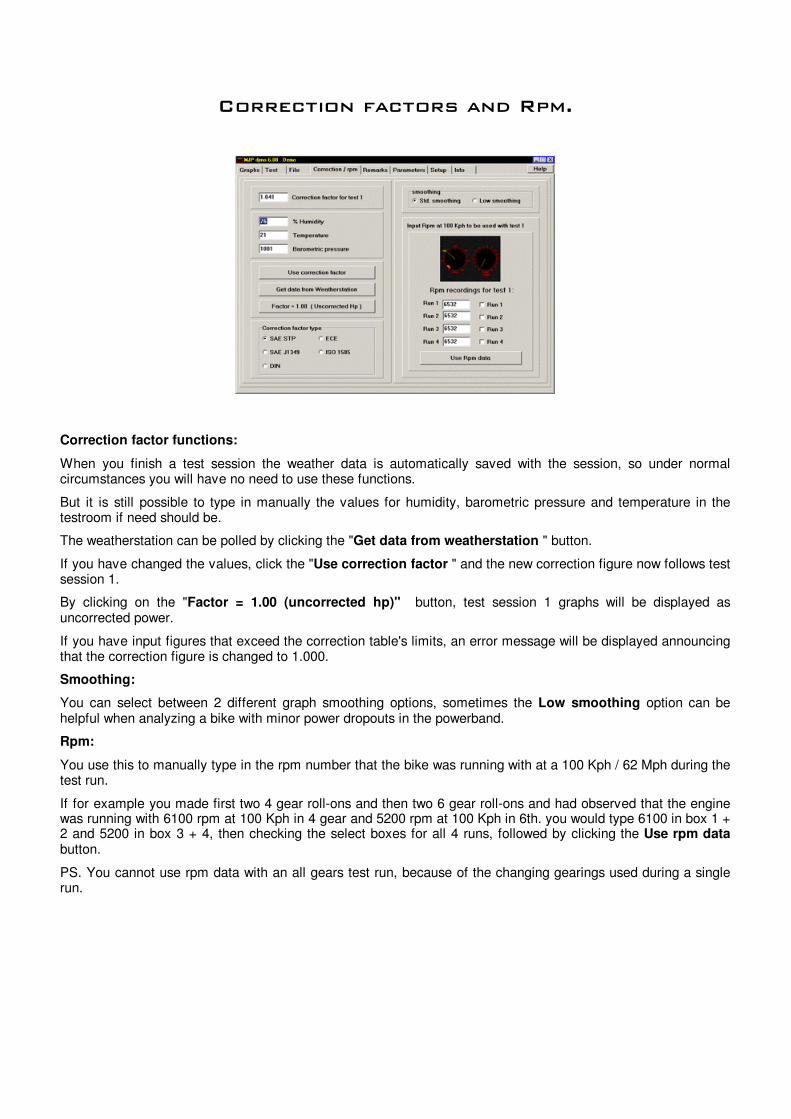
Correction factors and Rpm.
Correction factor functions:
When you finish a test session the weather data is automatically saved with the session, so under normal circumstances you will have no need to use these functions.
But it is still possible to type in manually the values for humidity, barometric pressure and temperature in the testroom if need should be.
The weatherstation can be polled by clicking the "Get data from weatherstation " button.
If you have changed the values, click the "Use correction factor " and the new correction figure now follows test session 1.
By clicking on the "Factor = 1.00 (uncorrected hp)" button, test session 1 graphs will be displayed as uncorrected power.
If you have input figures that exceed the correction table's limits, an error message will be displayed announcing that the correction figure is changed to 1.000.
Smoothing:
You can select between 2 different graph smoothing options, sometimes the Low smoothing option can be helpful when analyzing a bike with minor power dropouts in the powerband.
Rpm:
You use this to manually type in the rpm number that the bike was running with at a 100 Kph / 62 Mph during the test run.
If for example you made first two 4 gear roll-ons and then two 6 gear roll-ons and had observed that the engine was running with 6100 rpm at 100 Kph in 4 gear and 5200 rpm at 100 Kph in 6th. you would type 6100 in box 1 + 2 and 5200 in box 3 + 4, then checking the select boxes for all 4 runs, followed by clicking the Use rpm data button.
PS. You cannot use rpm data with an all gears test run, because of the changing gearings used during a single run.

Remarks.
When you have finished a test session, the program automatically shifts to the Remarks page making it more intuitive to remember to type in Remarks.
You can only type in remarks to test session 1, test session 2, 3 and 4 are read only.
The Save Test session 1 Button opens the Save File Dialog directly.
Make it a habit to always type descriptive remarks to the tests you make.
Instead of typing in the motorcycle make you can choose it from the Bike make dropdown list.

Analog display.
In this window you can view the recordings from the 10 analog channels together with their corresponding graphs.
If you have several different left side scales, you can switch between them by marking the corresponding Left scale -> Channel X button.
The righthand mouse button has the same finction here as in the Graph window, hold it down and move the mouse and you get a digital display up with Speed and Rpm.
It's possible to zoom the window horizontally, and to change the power graphs representation from power to speed translation with the V. scale selection.
Because the horizontal scale in this window is timebased, you can move the graphs independently of each other with the left/right Move test 1-4 arrow buttons to syncronize them with each other. The Reset tests button resets all the tests to their original positions.
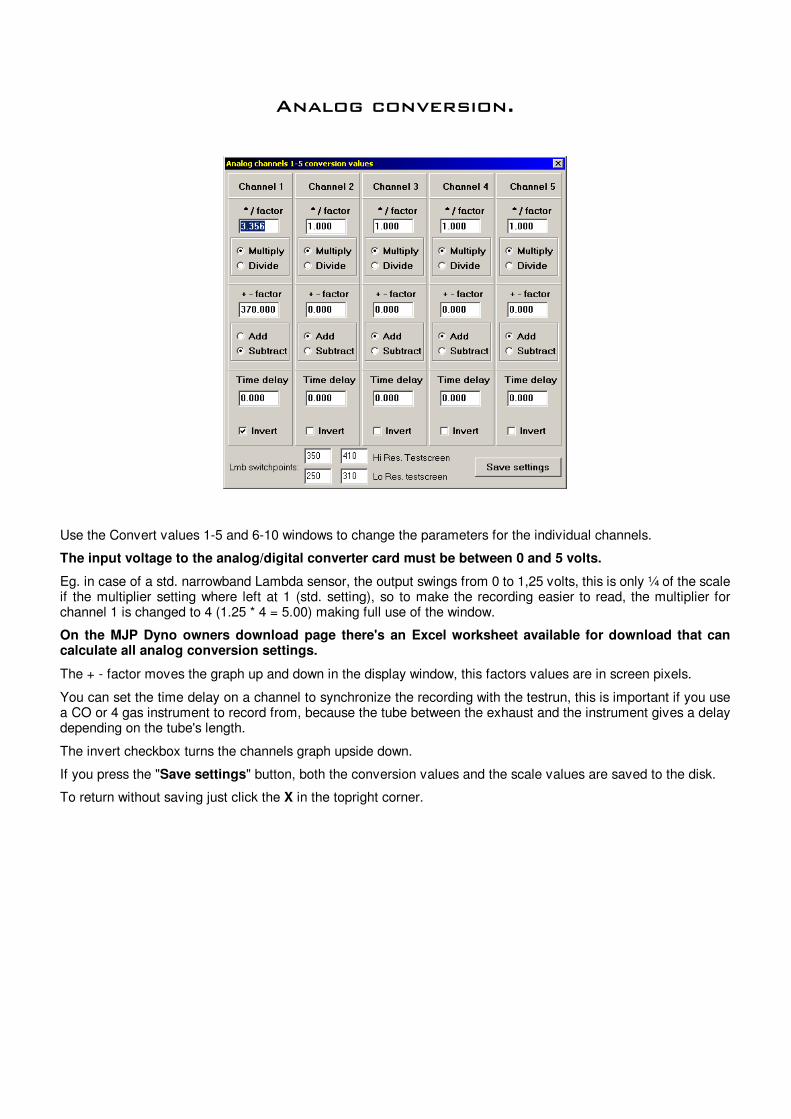
Analog conversion.
Use the Convert values 1-5 and 6-10 windows to change the parameters for the individual channels.
The input voltage to the analog/digital converter card must be between 0 and 5 volts.
Eg. in case of a std. narrowband Lambda sensor, the output swings from 0 to 1,25 volts, this is only ¼ of the scale if the multiplier setting where left at 1 (std. setting), so to make the recording easier to read, the multiplier for channel 1 is changed to 4 (1.25 * 4 = 5.00) making full use of the window.
On the MJP Dyno owners download page there's an Excel worksheet available for download that can calculate all analog conversion settings.
The + - factor moves the graph up and down in the display window, this factors values are in screen pixels.
You can set the time delay on a channel to synchronize the recording with the testrun, this is important if you use a CO or 4 gas instrument to record from, because the tube between the exhaust and the instrument gives a delay depending on the tube's length.
The invert checkbox turns the channels graph upside down.
If you press the "Save settings" button, both the conversion values and the scale values are saved to the disk.
To return without saving just click the X in the topright corner.

Analog window scales.
Settings displayed here are for the NTK Wideband Lambda.
Here you can change the left side scale in analog the window to suit the type of recordings you make.
The Channel 1 box, sets the Lambda scale text and its position on the Speedo screen in pixels from the left side of the monitor.
If you press the "Save settings" button, both the conversion values and the scale values are saved to the disk.
To return without saving just click the X in the topright corner.

Parameters.
Graph scheme coordinates:
If you need specific graph window coordinates you can type them in manually in here.
It is possible to enter a negative value in the Start Hp window, this way you can observe the engine braking force during decelleration.
Or you can select the Add negative Hp to Graph option to have the deceleration force added to the Hp graph.
The selection of torque displayed asFt.Lbs. instead of Nm is done here.
Another feature is the Bmep graph (Brake mean effective pressure, readout in Psi.).
Brake Mean Effective Pressure (BMEP) is an effective yardstick for comparing the performance of one engine to another, and for evaluating performance.
The definition of BMEP is: the average (mean) pressure which, if imposed on the pistons evenly during each power stroke, would produce the measured (brake) power output.
Note that BMEP is purely theoretical and has little to do with actual cylinder pressures. It is simply an effective comparison tool for Engine Tuners..
A special feature is the ability to display a combined air and rolling resistance curve together with roller torque graph (torque related to speed).
In this example the predicted topspeed is 236 Kph
The default values are meant to simulate the power needed to drive a Honda Cbr 900.
Use this to predict the theoretic topspeed of the motorcycle by viewing the crossover point where the yellow wind resistance curve crosses the torque graph in top gear.
The Airresistance examples drop down box holds some values for different types of bikes.
The Calculator button displays a simple calculator and the Race and Display power as text functions are described separately.
Check boxes to select Hi-Res Testscreen and to enable the optional Eddy Brake are placed here, and their status is saved with the “Save Setup File” button on the Setup page.

Setup.
On this you can input the data that will customize the dyno software to your needs.
Most of the options are self explanatory, but here are some of the more special options:
The MJP weatherstation needs to be adjusted once or twice a year, this is explained in a separate Chapter.
Graph linewidth for printing. the higher number you choose, the wider the printed graph lines will be on the Paper.
Print owner name, if enabled it will print a line with the dyno owners name and phone number below the graph print window.
Print header if you don't use pre-printed paper with a header, you have the ability to let your printer printout the mjpprint.bmp file at the top of the paper. This is an ordinary .bmp file you can edit in any paint program.
Show power as KW changes the display of power from horsepower to kilowatt.
Show speed as Mph changes the display of speed from Kph to Mph.
Use Fahrenheit and Inch Hg boxes select either Celcius/Fahrenheit and Millibar/Inches of Hg as the standards for weatherstation units.
Dyno Series, select the Dyno type you have.
Roller type check if the Dyno is std. or heavy roller equipped and if it has the Eddy-brake unit added.
Roller specifications is set according to the Dyno's extra equipment: disc brake, starter motor, both or none at all.
Path to to test folder on Harddisk; the folder that will be displayed the first time you open the "File" page. It is very important that the folder referred to in this line exists on the computers harddisk, otherwise you won't be able to run a test etc. since the Windows operating system won't allow the low-level access of the computer hardware by the Dyno program.
Advanced setup and Hi-res T. screen setup is explained separately.
Testscr. Pos X. and Y. Sets the top left corner of the Speedometer screen in relation to the top left corner of your Display.
Remember to press Save setup file button when you change something.

AdAdAdAdvanced setupvanced setupvanced setupvanced setup
Dyno electronics and Weatherstation I/O address are the Dyno/Analog cards addresses on the computers internal ISA-bus, both the addresses here and the addresses selected by the jumpers on the print boards must be equal.
Test button delay, in the upper box is the auto generated value displayed, the faster the computer the higher this number will be. If you want the delay before the program jumps to the next step during testing when pressing the remote testbutton to be either shorter or longer, it is possible to change this by choosing a higher (longer delay) or lower (shorter delay) number than the auto generated one and checking the Use optimized testbutton delay box.
The same explanation can be used for the Analog recording delay options, only here the delay changed is the microseconds of delay the A/D card needs between 2 successive accesses. It will probably never be necessary to change this, but on a very slow computer with all 10 analog channels recording simultaneously, the time available could be on the short side and a shorter delay could be useful (the std. delay is a very safe setting and can usually be reduced significantly without problems)
Temperature func. check just polls the analog card for a temperature reading, if the temperature is displayed ok, it's safe to assume the delay is not yet too short.
Disable interrupts , when checked the computer disregards other background programs attempts to access the computer; sometimes a printer driver will try to check if the printer has paper, enough ink etc. every single second even if no one is using it, this can be avoided by checking this option.
Type 2 weatherstation . Because there are 2 types of barometric pressure sensors used in the MJP weatherstations, this checkbox to selects the type you have.
The Type 2 box have been used since 1999.
Check analog voltages , here you can poll each of the 10 analog channels for a read out of what voltage that is present at its terminal (the limits of the analog card is 0 to +5 volts).
This can eg. be very useful when you calibrate the NTK Wideband Lambda to 4.00 Volt.

Hi-res setup.
Here the selection of type of display for the individual analog channels are done; as well as the scale text for the Dials and Bar columns.
Press the "Save" button, to save values to the disk.
To return without saving click the Close box.
Lambda LookLambda LookLambda LookLambda Look----up Tableup Tableup Tableup Table
Shown here is the Values for the NTK wideband Lambda.
This Table holds thedigital Values shown on the Test Screen during testing.

Power as text.
You can use this function to view the graph data as text, and to print out this data.
If you view a graph related to Rpm in the graph window, the text function will display the data as Rpm-Hp/torque, and a graph related to speed will be displayed as Kph/Mph-Hp/torque.
Remember that you have to see the graph first in the graph window before you can use the text function to display the data.
If you see the data as Rpm related, you can change the step between the data from: no step, 125 rpm, 250 rpm and 500 rpm.
Race function
This function takes the exact distance the roller makes from the start speed you have set, to when the fastest "bike" reaches the end speed.
It then displays the speed and distance each "bike" has reached.
Because the function uses the roller data exactly as they are, there are no compensation for the correctionfactor or vehicle weight, so use this race function only to compare before and after tests on the same bike or bikes of nearly the same weight.
Important: Before you set the start and end speed, you have to look closely at the power graphs to select the area of the graphs that you will use for the "race".It's extremely easy to get confusing results if you don't select a meaningful part of the graphs.

Connection box.
Front side:
Power On / Off, turns off the 5 volt supply to the Roller and Rpm pickup.
Rpm mode switch, default position is down for ordinary rpm signal use. In the up position only every second rpm impulse is sent to the computer, this mode is intended for use with eg. Harley dual-fire ignitions.
Layout and description of the sockets and pins on the rearside of the MJP Connection/weatherstaion box.
Sockets:
Pin description:

Rpm pickup.Rpm pickup.Rpm pickup.Rpm pickup.
MJP primary wire rpm pickup.
Do NOT connect the clamp to the high voltage wire between coil and sparkplug.
Normally the sensitivity adjuster can be left in the middle position, but if the rpm needle is jumping around, first try to turn the pickup around, so the wire goes through the clamp the other way.
If you need to adjust the sensitivity level, do this by using the Rpm counter check function, this will display the Rpm counter and you can rev the engine up to see if everything is working okay, without having to actually start an test with the need to rotate the rear wheel during the check.
If the pickup has problems with getting a good continuous rpm signal throughout the rev range, the best solution is to use the prerecord rpm test procedure :
Here You run the bike on the dyno, in the gear you will use for the roll-on and fast acceleration runs with the RPM pickup connected to the ignition system. And with the roller turning, speed up the bike until you get a steady reading on the computer screens rpm meter, hold it there and then press the testbutton once.
Now the rpm/roller relation is calculated and you are ready to run the test as usual, and for the rest of the test sequence the computer screens rpm needle is displayed based on this calculation.
This means that the rpm pickup is only used during the first registration and is ignored for the rest of the test sequence.
If you run an engine up into the rev limiter during a test run, the rpm needle on the screen can jump around, this is normal because the rev limiter cuts off ignition pulses.

MJPower engineering
Bits and pieces. When you first install the software the default correction factor standard is the SAE Stp, if you want to compare HP output with other dyno’s, you have to check what kind of correction standard the other dyno is using and use the same standard . The choice of standard is saved with the program initialisation file. The most common comparison will probably be with the Dynojet 150 dyno ( the red one with aluminium plate covers ), to do this you check the SAE J1349 box and press the “Use correction factor” button. The difference between STP and J1349 is that the J1349 standard shows ca. 4% less Hp, depending on actual weather conditions. See the accompanying paper for additional information about correction standards.
MJPower engineering’s internet homepage and email address: Homepage: www.mjpdyno.com Email: [email protected] You can download the latest MJP software from our homepage. Click on the Support page to go to the owner download page, were you’ll find the latest version of the program and a history of changes made. Password to access the download page: dynoowner Password to install the setup file you download: 2100 / 2200 software: zxc 1100 software: qwe

Power Correction Factors
The power output of an internal combustion engine is significantly influenced by barometric pressure, ambient air temperature, and air humidity. lower ambient barometric pressure reduces the density of the air, thus reduces the amount of oxygen filling the
cylinder for each cycle, resulting in lower power output. Conversely, higher barometric pressure increases power.
lower ambient air temperature results in increased density of the air, thus increases the amount of oxygen filling
the cylinder for each cycle, resulting in higher power output. Conversely, higher air temperature reduces power output.
lower air humidity (= less water vapour) leaves more room for oxygen per cubic foot of air, thus increases the
amount of oxygen filling the cylinder for each cycle, resulting in higher power output. Conversely, higher air humidity reduces power output.
Several Standards organisations have determined methods for estimating engine power under reference conditions.
The best known organisations are: ISO (International Standards Organisation), world-wide SAE (Society of Automotive Engineers), USA ECE (European Community), Europe JIS (Japanese Institute for Standardisation), Japan DIN (Deutsche Industrie Norm), Germany
There are power correction standards for gasoline and Diesel engines, for applications in road vehicles, stationary engines, or marine engines, etc. For a motorcycle dynamometer, relevant standards are those generally intended for gasoline engines in road vehicles and those specific to motorcycles.
NOTE—Power correction standards try to estimate what engine power would be under reference conditions. They cannot actually calculate exactly what power output would be. The greater the difference between the ambient conditions during the test and the reference conditions, the greater the error in the estimate. Most power correction standards include limits on their applicability. This limit is typically +/- 7%. This means if the correction factor is greater than (>) 1.070 or less than (<) 0.930, the corrected power numbers are not officially considered to be acceptable, and the test should be performed again under conditions which are closer to the reference conditions.
For private applications this is less of a problem, and the corrected power numbers are still the best basis for comparisons. However, please keep this into consideration when comparing test results obtained under considerably different test conditions. SAE—The SAE standard applied is the SAE J1349 standard of June 1990. Power is corrected to reference
conditions of 990 MB. of dry air and 25 C. STP—The STP (also called STD) standard is another power correction standard determined by the SAE. This
standard has been stable for a long time and is widely used in the performance industry. Power is corrected to reference conditions of 1013 MB. of dry air and 15.5 C. Because the reference conditions include higher pressure and cooler air than the SAE J1349 standard, these corrected power numbers will always be about 4 % higher than the SAE J1349 power numbers.
ECE—The ECE standard is based on the European Directives. Power is corrected to reference conditions of 990
MB. of dry air and 25 C. DIN—The DIN standard is determined by the German automotive industry. Power is corrected to reference
conditions of 993 MB. of dry air and 20 C. With the advent of European legislation and standards, national standards such as the DIN (formerly widely used) are now less significant.
NOTE There is a tendency for all those standards to converge. The only world-wide power correction standards at this time are the ones determined by ISO. For internal combustion engines in road vehicles, this is the ISO 1585 standard. The current SAE J 1349 and ECE standards are nearly identical to the ISO 1585 standard.

Shortcut keys:
F1 = Show Help.
F2 = Update Graph screen.
F3 = Start Test.
F4 = Show Analog display window.
F5 = Save file function.
F6 = Race function.
F7 = Show Text display window.
F8 = Show Calculator.
F9 = Print out Graphs.
Jumper settings.
Jumper settings on the weatherstation A/D card and their I/O addresses .
If the address setting on your A/D card conflicts with other hardware in the computer, you have to change the A/D cards settings.
If the values from the weatherstation are erratic, you might have to change these address settings.