Embed Size (px)
Citation preview
PREFACE
The Meteorological Data of Mizoram for the Year 2009 is now
brought out by the Directorate of Economics and Statistics, Mizoram.
Rainfall record are based on daily rainfall report collected from 20
centres spreading throughout the State, however the data on temperature
and humidity are of Aizawl City only.
Statistical Calculation and analytical compilation of the reports
from various centers has been done by Technical Wing of Directorate of
Economics and Statistics. My special thanks goes to all District Research
Officers (E & S), various Block Development Officers, D.A.O.; A.E.O;
S.D.A.O and Chief Engineer, Project Pushpak, Aizawl for their co-
operation and timely report without which this report would not have
been brought out.
I do hope that the Data contain in this report will be of immense
help to all users and also serve as an important indicators. Suggestion
for its improvement are always welcome.
( NGUNLALA CHINZAH ) Director, Economics & Statistics Mizoram : Aizawl.
Contents Page No.
1. Pre-view……………………………………………….. … 1 2. Month-wise Average Rainfall in Mizoram ……………… 2 3. District-wise Average Monthly Rainfall………………… 3 4. District - wise Monthly Average Rainfall of Mizoram 2007- 2009........................................................................... 4 5. Reporting Centre-wise Annual Rainfall in Mizoram……... 5 6. Centre-wise Monthly Rainfall record (Jan-Dec)………….. 6-9 7. Weather Report of Aizawl City for the year 2009………… 10 8. Average Rainfall during different seasons in Mizoram & Temperature during different seasons in Aizawl City……. 11 9. Month-wise Relative Humidity in Aizawl City…………... 12 10. Month-wise maximum-minimum average Temperature in Aizawl City……………………………………………. 13 11.Chart showing Monthly Rainfall in Mizoram (2007-2009).. 14 12. Chart showing District-wise Annual Rainfall (2007-2009).. 15 13. Chart showing Minimum & Maximum Average Temperatures of Aizawl City (2009) & Month-wise Relative Humidity of Aizawl City (2009)…………………. 16
1
PRE – VIEW
Mizoram comes under the direct influence of the South-West Monsoon, as such it generally receives an adequate amount of rainfall. The rainy season (summer monsoon) generally start from the month of April, it then rains heavily from May to September and lasted till late October. The winter season i.e. November to February is generally dry, this season receives very little rainfall. During 2009, Mizoram receives an annual rainfall of 2094.85mm. Heaviest rainfall of 468.20mm being received during the month of August while there was no rainfall during the month of December. 78.25% of the total annual rainfall is received during the five months of May, June, July, August and September. The amount of rainfall is also more or less evenly spread throughout the State. HIGHLIGHTS
1. Average Annual Rainfall in Mizoram during 2009 (January – December) = 2094.85 mm.
2. Total No. of Rainfall Collecting Centre during 2009 = 20 3. District-wise No. of Collecting Centre :
1) Mamit - 3 2) Kolasib - 2 3) Aizawl - 4 4) Champhai - 4 5) Serchhip - 1 6) Lunglei - 3 7) Lawngtlai - 2 8) Saiha - 1 Total : - 20
4. Month with heaviest rainfall in Mizoram during 2009. Month : August Amount : 468.20 mm
5. Month receiving lowest rainfall in Mizoram during 2009. Month : December Amount : NIL
6. District with heaviest rainfall during 2009.. District : Saiha District Amount : 3244.90 mm
7. District with lowest rainfall during 2009. District : Serchhip District Amount : 1486.52 mm
8. Name of Centre recording highest Annual rainfall during 2009. Centre : Mamit Amount : 3683.32 mm
9. Name of Centre recording lowest Annual rainfall during 2009. Centre : Khawzawl Amount : 1043.10 mm
2
MONTH-WISE AVERAGE RAINFALL IN MIZORAM
Average Rainfall ( in mm) Sl No. MONTH
2007 2008 2009
1 2 3 4 5
1 January 0.0 66.24 0.35
2 February 58.17 20.12 2.40
3 March 23..94 36.23 22.50
4 April 217.02 57.90 141.45
5 May 379.76 192.28 160.55
6 June 482.48 272.47 331.10
7 July 425.37 366.07 318.91
8 August 439.29 411.54 468.20
9 September 603.17 329.62 360.45
10 October 216.25 122.48 164.70
11 November 116.17 17.85 41.75
12 December 1.25 0.0 0.0
ANNUAL 246.91 157.73 167.70

3
DISTRICT-WISE AVERAGE MONTHLY RAINFALL (JAN-DEC) 2007-2009
Average Monthly Rainfall (in mm) Sl. No. DISTRICT
2007 2008 2009 1 2 3 4 5
1 Mamit 232.95 182.44 221.84
2 Kolasib 243.26 168.41 142.53
3 Aizawl 219.08 149.19 139.71
4 Champhai 239.58 147.03 130.52
5 Serchhip 245.21 155.74 123.88
6 Lunglei 286.29 155.09 192.82
7 Lawngtlai 248.88 160.77 174.87
8 Saiha 255.48 165.28 270.41

4 DISTRICT – W ISE MONTHLY AVERAGE RAINFALL OF MIZORAM DURING 2007 - 2009 ( in mm )
Sl No.
Name of District
Year Jan Feb Mar April May June July Aug Sept Oct Nov Dec
1 2 3 4 5 6 7 8 9 10 11 12 13 14
2007 0.0 37.33 76.50 266.66 348.50 425.33 349.36 411.16 605.66 207.83 67.00 0.0
2008 48.25 13.50 105.00 279.50 242.00 223.75 647.25 216.00 285.50 257.00 0.0 0.0 1 Mamit
2009 2.33 0.17 48.50 297.67 206.50 379.67 289.47 577.53 549.33 252.91 58.00 0.0
2007 0.0 67.65 27.90 269.90 293.50 415.20 315.95 510.00 693.50 216.75 108.65 0.0
2008 27.50 9.65 72.30 34.30 146.75 334.60 363.20 571.75 217.70 243.20 0.0 0.0 2 Kolasib
2009 0.0 21.00 51.10 171.80 198.75 314.00 314.35 321.90 246.60 60.90 10.00 0.0
2007 0.0 73.37 18.50 283.25 321.97 508.03 341.47 376.80 605.30 130.80 107.45 10.00
2008 36.65 44.75 30.78 107.53 248.46 256.18 262.98 343.78 327.25 101.40 30.50 0.0 3 Aizawl
2009 0.0 1.38 26.78 152.47 169.65 219.50 279.05 426.25 223.53 168.53 9.50 0.0
2007 0.0 66.37 8.50 227.02 485.45 448.35 451.00 393.57 475.17 193.40 126.10 0.0
2008 77.93 8.53 20.95 17.50 145.10 255.38 294.15 433.48 381.38 108.30 30
21.65 0.0 4 Champhai
2009 0.0 0.0 12.25 84.38 102.65 282.23 187.55 386.10 329.58 157.20 24.25 0.0
2007 0.0 58.50 12.50 270.00 348.00 524.50 446.00 372.50 485.50 303.55 121.50 0.0
2008 94.50 7.50 27.00 27.00 194.50 219.00 330.52 478.02 346.35 131.95 31.00 0.0 5 Serchhip
2009 0.0 0.0 13.00 66.40 147.00 258.04 292.06 420.40 120.40 126.00 34.02 0.0
2007 0.0 47.10 28.33 160.93 378.00 558.83 548.86 584.86 813.43 229.10 86.03 0.0
2008 61.67 9.43 19.00 19.00 186.00 256.37 393.00 498.37 328.70 88.77 16.77 0.0 6 Lunglei
2009 0.0 0.0 0.0 86.80 102.37
102.37 398.63 502.67 539.33 431.13 163.73 89.33 0.0
2007 0.0 35.00 11.00 86.00 423.00 560.00 525.50 421.10 579.50 200.50 145.00 0.0
2008 116.00 18.50 12.00 12.00 193.00 314.50 419.00 391.40 326.90 137.90 0.0 0.0 7 Lawngtlai
2009 0.0 0.0 12.50 104.60 179.00 376.45 334.85 467.35 418.65 163.00 42.05 0.0
2007 0.0 93.50 8.30 173.53 410.76 609.40 486.20 329.36 560.53 218.40 220.73 0.0
2008 112.50 81.20 20.00 20.00 176.90 382.45 406.50 351.85 372.90 99.60 18.00 0.0 8 Saiha
2009 0.0 0.0 21.80 109.00 292.70 641.20 545.00 765.00 604.80 167.40 119.80 0.0
5
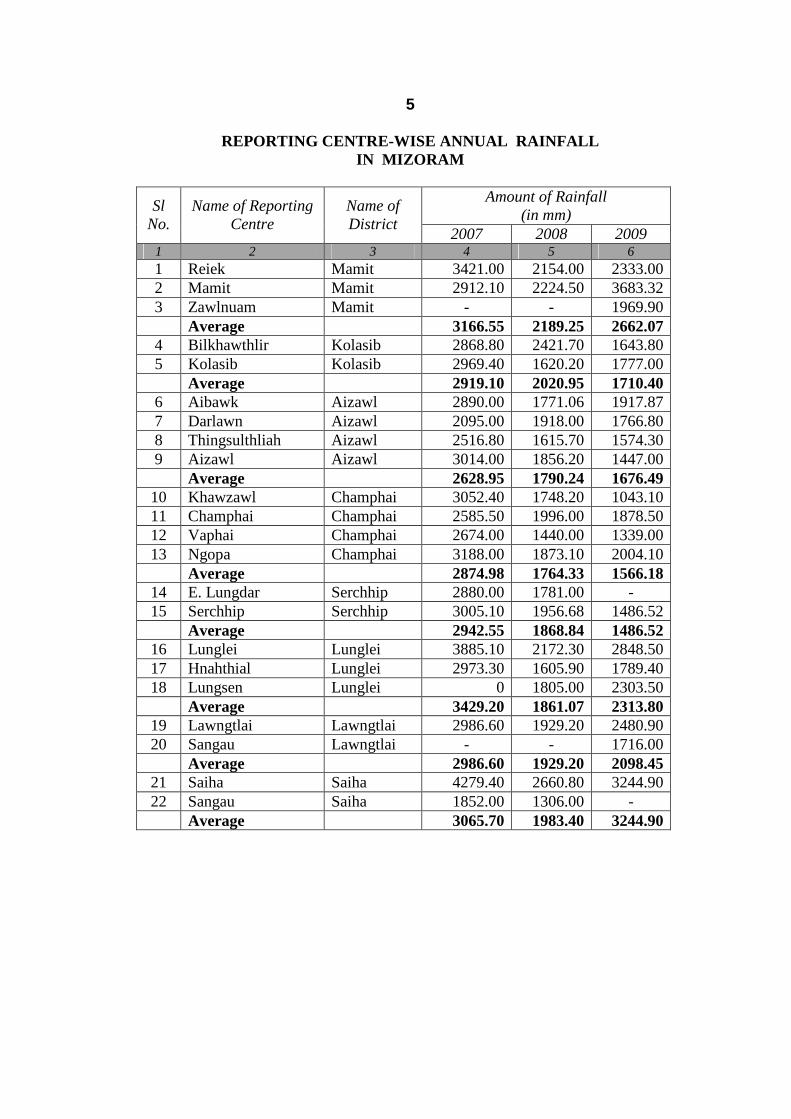
REPORTING CENTRE-WISE ANNUAL RAINFALL IN MIZORAM
Amount of Rainfall
(in mm) Sl
No. Name of Reporting
Centre Name of District
2007 2008 2009 1 2 3 4 5 6
1 Reiek Mamit 3421.00 2154.00 2333.00 2 Mamit Mamit 2912.10 2224.50 3683.32 3 Zawlnuam Mamit - - 1969.90 Average 3166.55 2189.25 2662.07 4 Bilkhawthlir Kolasib 2868.80 2421.70 1643.80 5 Kolasib Kolasib 2969.40 1620.20 1777.00 Average 2919.10 2020.95 1710.40 6 Aibawk Aizawl 2890.00 1771.06 1917.87 7 Darlawn Aizawl 2095.00 1918.00 1766.80 8 Thingsulthliah Aizawl 2516.80 1615.70 1574.30 9 Aizawl Aizawl 3014.00 1856.20 1447.00 Average 2628.95 1790.24 1676.49
10 Khawzawl Champhai 3052.40 1748.20 1043.10 11 Champhai Champhai 2585.50 1996.00 1878.50 12 Vaphai Champhai 2674.00 1440.00 1339.00 13 Ngopa Champhai 3188.00 1873.10 2004.10 Average 2874.98 1764.33 1566.18
14 E. Lungdar Serchhip 2880.00 1781.00 - 15 Serchhip Serchhip 3005.10 1956.68 1486.52 Average 2942.55 1868.84 1486.52
16 Lunglei Lunglei 3885.10 2172.30 2848.50 17 Hnahthial Lunglei 2973.30 1605.90 1789.40 18 Lungsen Lunglei 0 1805.00 2303.50 Average 3429.20 1861.07 2313.80
19 Lawngtlai Lawngtlai 2986.60 1929.20 2480.90 20 Sangau Lawngtlai - - 1716.00 Average 2986.60 1929.20 2098.45
21 Saiha Saiha 4279.40 2660.80 3244.90 22 Sangau Saiha 1852.00 1306.00 - Average 3065.70 1983.40 3244.90
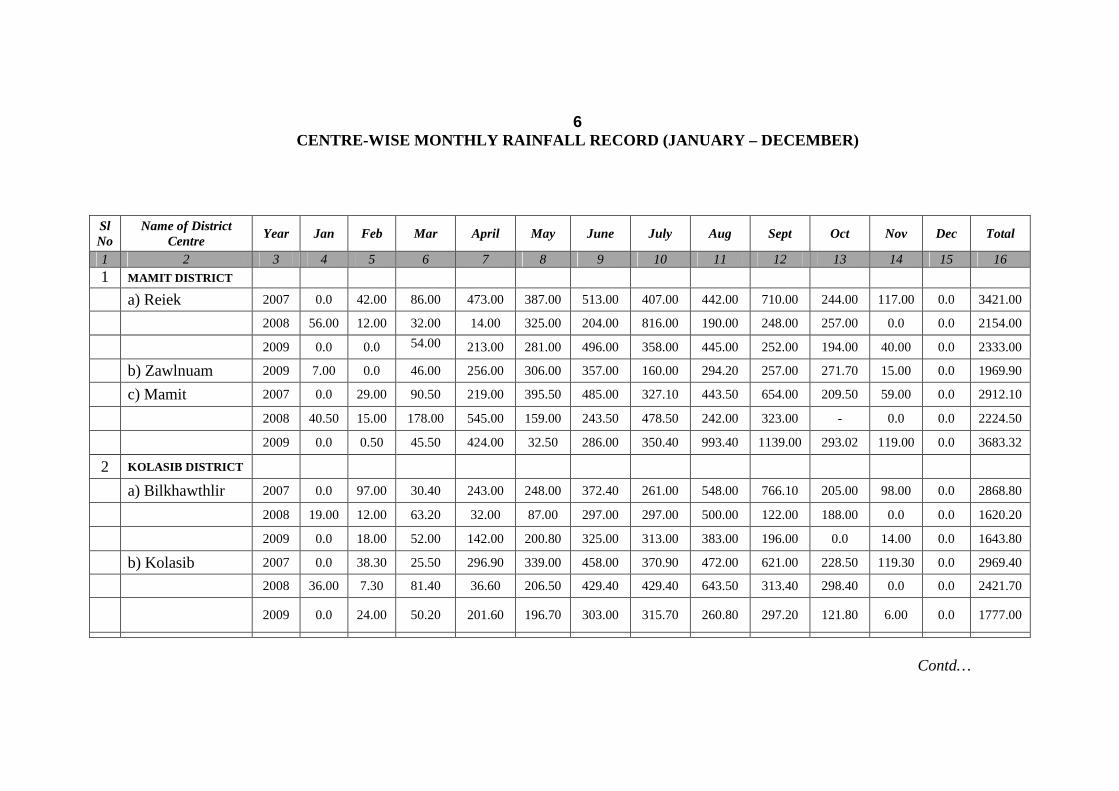
6 CENTRE-WISE MONTHLY RAINFALL RECORD (JANUARY – DECE MBER)
Contd…
Sl No
Name of District Centre
Year Jan Feb Mar April May June July Aug Sept Oct Nov Dec Total
1 2 3 4 5 6 7 8 9 10 11 12 13 14 15 16
1 MAMIT DISTRICT a) Reiek 2007 0.0 42.00 86.00 473.00 387.00 513.00 407.00 442.00 710.00 244.00 117.00 0.0 3421.00
2008 56.00 12.00 32.00 14.00 325.00 204.00 816.00 190.00 248.00 257.00 0.0 0.0 2154.00
2009 0.0 0.0 54.00
213.00 281.00 496.00 358.00 445.00 252.00 194.00 40.00 0.0 2333.00
b) Zawlnuam 2009 7.00 0.0 46.00 256.00 306.00 357.00 160.00 294.20 257.00 271.70 15.00 0.0 1969.90
c) Mamit 2007 0.0 29.00 90.50 219.00 395.50 485.00 327.10 443.50 654.00 209.50 59.00 0.0 2912.10
2008 40.50 15.00 178.00 545.00 159.00 243.50 478.50 242.00 323.00 - 0.0 0.0 2224.50
2009 0.0 0.50 45.50 424.00 32.50 286.00 350.40 993.40 1139.00 293.02 119.00 0.0 3683.32
2 KOLASIB DISTRICT
a) Bilkhawthlir 2007 0.0 97.00 30.40 243.00 248.00 372.40 261.00 548.00 766.10 205.00 98.00 0.0 2868.80
2008 19.00 12.00 63.20 32.00 87.00 297.00 297.00 500.00 122.00 188.00 0.0 0.0 1620.20
2009 0.0 18.00 52.00 142.00 200.80 325.00 313.00 383.00 196.00 0.0 14.00 0.0 1643.80
b) Kolasib 2007 0.0 38.30 25.50 296.90 339.00 458.00 370.90 472.00 621.00 228.50 119.30 0.0 2969.40
2008 36.00 7.30 81.40 36.60 206.50 429.40 429.40 643.50 313.40 298.40 0.0 0.0 2421.70
2009 0.0 24.00 50.20 201.60 196.70 303.00 315.70 260.80 297.20 121.80 6.00 0.0 1777.00

7 CENTRE-WISE MONTLY RAINFALL RECORD (JANUARY – DECEM BER)
(in mm) Sl
No Name of Centre/District Year Jan Feb Mar April May June July Aug Sept Oct Nov Dec Total
1 2 3 4 5 6 7 8 9 10 11 12 13 14 15
3 AIZAWL DISTRICT
a) Aibawk 2007 0.0 60.00 19.00 187.00 344.00 599.00 366.00 393.00 657.00 184.00 81.00 0.0 2890.00
2008 29.00 35.00 89.00 86.13 150.92 276.40 327.70 235.40 326.01 203.50 17.00 0.0 1771.06
2009 0.0 0.0 29.00 78.17 230.00 230.50 283.00 618.00 248.70 163.00 38.00 0.0 1917.87
b) Darlawn 2007 0.0 81.00 17.00 217.00 402.00 245.10 336.00 300.00 310.00 58.00 119.00 10.00 2095.00
2008 19.00 83.00 17.00 262.00 432.00 216.00 277.00 318.00 192.00 87.00 15.00 0.0 1918.00
2009 0.0 5.50 19.00 207.20 202.20 235.00 318.00 468.00 186.00 125.90 0.0 0.0 1766.80
c) Thingsulthliah 2007 0.0 47.50 5.00 410.00 219.90 322.10 256.90 424.20 630.00 104.20 96.80 0.0 2516.80
2008 50.60 0.0 2.10 21.00 151.90 273.30 279.00 435.70 377.00 25.10 0.0 0.0 1615.70
2009 0.0 0.0 24.10 98.50 44.40 244.50 266.20 498.00 253.40 145.20 0.0 0.0 1574.30
d) Aizawl 2007 0.0 51.00 33.00 319.00 322.00 358.00 407.00 390.00 824.00 177.00 133.00 0.0 3014.00
2008 48.00 61.00 15.00 61.00 259.00 259.00 173.00 386.00 414.00 90.00 90.00 0.0 1856.20
2009 0.0 0.0 35.00 226.00 202.00 168.00 249.00 121.00 206.00 240.00 0.0 0.0 1447.00
4 CHAMPHAI DISTRICT
a) Khawzawl 2007 0.0 111.60 4.10 237.50 728.90 397.00 369.00 371.20 505.70 221.60 105.40 0.0 3052.40
2008 52.70 7.10 22.80 0.0 102.40 273.30 340.90 442.30 348.40 112.70 45.60 0.0 1748.20
2009 0.0 0.0 0.0 0.0 0.0 96.00 20.90 267.10 430.20 203.40 25.50 0.0 1043.10
b) Champhai 2007 0.0 12.90 0.0 172.60 523.90 404.00 330.00 373.10 451.00 202.00 116.00 0.0 2585.50
2008 80.00 7.00 33.00 2.00 132.00 297.00 406.00 470.00 390.00 138.00 41.00 0.0 1996.00
2009 0.0 0.0 18.00 112.30 113.00 378.00 271.30 448.00 300.00 197.00 40.90 0.0 1878.50
Contd…
8
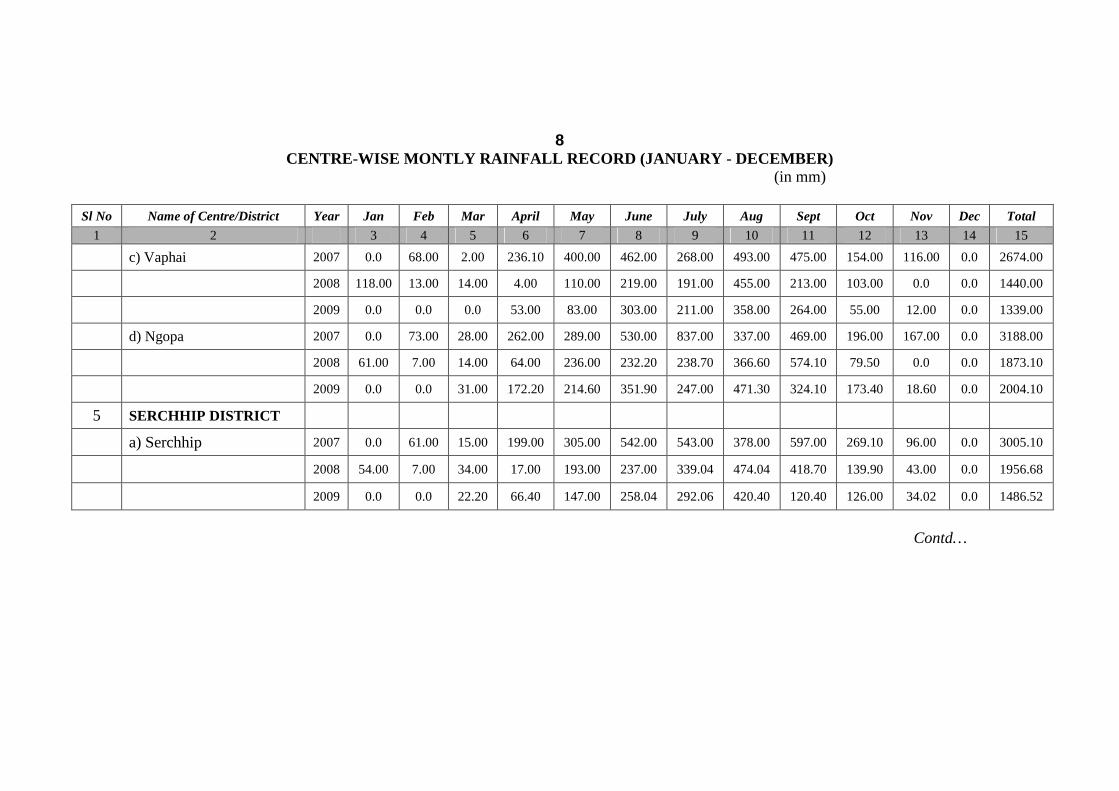
CENTRE-WISE MONTLY RAINFALL RECORD (JANUARY - DECEM BER) (in mm)
Sl No Name of Centre/District Year Jan Feb Mar April May June July Aug Sept Oct Nov Dec Total
1 2 3 4 5 6 7 8 9 10 11 12 13 14 15
c) Vaphai 2007 0.0 68.00 2.00 236.10 400.00 462.00 268.00 493.00 475.00 154.00 116.00 0.0 2674.00
2008 118.00 13.00 14.00 4.00 110.00 219.00 191.00 455.00 213.00 103.00 0.0 0.0 1440.00
2009 0.0 0.0 0.0 53.00 83.00 303.00 211.00 358.00 264.00 55.00 12.00 0.0 1339.00
d) Ngopa 2007 0.0 73.00 28.00 262.00 289.00 530.00 837.00 337.00 469.00 196.00 167.00 0.0 3188.00
2008 61.00 7.00 14.00 64.00 236.00 232.20 238.70 366.60 574.10 79.50 0.0 0.0 1873.10
2009 0.0 0.0 31.00 172.20 214.60 351.90 247.00 471.30 324.10 173.40 18.60 0.0 2004.10
5 SERCHHIP DISTRICT
a) Serchhip 2007 0.0 61.00 15.00 199.00 305.00 542.00 543.00 378.00 597.00 269.10 96.00 0.0 3005.10
2008 54.00 7.00 34.00 17.00 193.00 237.00 339.04 474.04 418.70 139.90 43.00 0.0 1956.68
2009 0.0 0.0 22.20 66.40 147.00 258.04 292.06 420.40 120.40 126.00 34.02 0.0 1486.52
Contd…
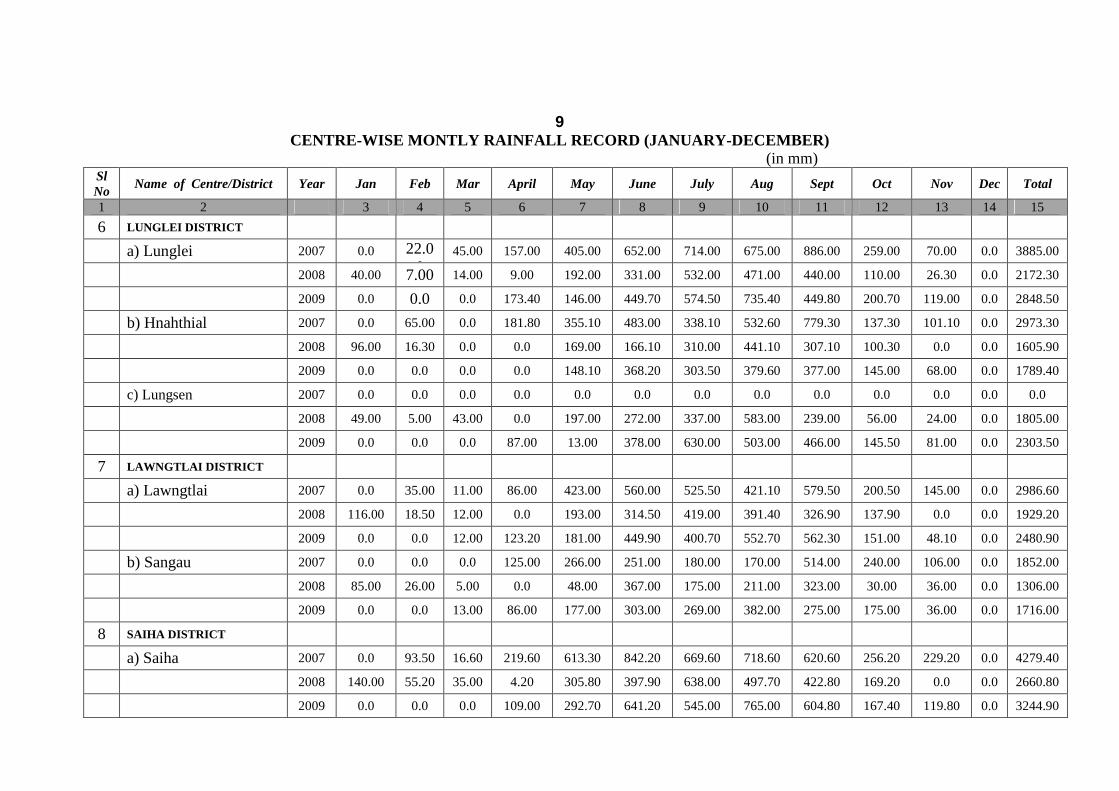
9 CENTRE-WISE MONTLY RAINFALL RECORD (JANUARY-DECEMBE R)
(in mm) Sl No
Name of Centre/District Year Jan Feb Mar April May June July Aug Sept Oct Nov Dec Total
1 2 3 4 5 6 7 8 9 10 11 12 13 14 15
6 LUNGLEI DISTRICT
a) Lunglei 2007 0.0 22.00
45.00 157.00 405.00 652.00 714.00 675.00 886.00 259.00 70.00 0.0 3885.00
2008 40.00 7.00 14.00 9.00 192.00 331.00 532.00 471.00 440.00 110.00 26.30 0.0 2172.30
2009 0.0 0.0 0.0 173.40 146.00 449.70 574.50 735.40 449.80 200.70 119.00 0.0 2848.50
b) Hnahthial 2007 0.0 65.00 0.0 181.80 355.10 483.00 338.10 532.60 779.30 137.30 101.10 0.0 2973.30
2008 96.00 16.30 0.0 0.0 169.00 166.10 310.00 441.10 307.10 100.30 0.0 0.0 1605.90
2009 0.0 0.0 0.0 0.0 148.10 368.20 303.50 379.60 377.00 145.00 68.00 0.0 1789.40
c) Lungsen 2007 0.0 0.0 0.0 0.0 0.0 0.0 0.0 0.0 0.0 0.0 0.0 0.0 0.0
2008 49.00 5.00 43.00 0.0 197.00 272.00 337.00 583.00 239.00 56.00 24.00 0.0 1805.00
2009 0.0 0.0 0.0 87.00 13.00 378.00 630.00 503.00 466.00 145.50 81.00 0.0 2303.50
7 LAWNGTLAI DISTRICT
a) Lawngtlai 2007 0.0 35.00 11.00 86.00 423.00 560.00 525.50 421.10 579.50 200.50 145.00 0.0 2986.60
2008 116.00 18.50 12.00 0.0 193.00 314.50 419.00 391.40 326.90 137.90 0.0 0.0 1929.20
2009 0.0 0.0 12.00 123.20 181.00 449.90 400.70 552.70 562.30 151.00 48.10 0.0 2480.90
b) Sangau 2007 0.0 0.0 0.0 125.00 266.00 251.00 180.00 170.00 514.00 240.00 106.00 0.0 1852.00
2008 85.00 26.00 5.00 0.0 48.00 367.00 175.00 211.00 323.00 30.00 36.00 0.0 1306.00
2009 0.0 0.0 13.00 86.00 177.00 303.00 269.00 382.00 275.00 175.00 36.00 0.0 1716.00
8 SAIHA DISTRICT
a) Saiha 2007 0.0 93.50 16.60 219.60 613.30 842.20 669.60 718.60 620.60 256.20 229.20 0.0 4279.40
2008 140.00 55.20 35.00 4.20 305.80 397.90 638.00 497.70 422.80 169.20 0.0 0.0 2660.80
2009 0.0 0.0 0.0 109.00 292.70 641.20 545.00 765.00 604.80 167.40 119.80 0.0 3244.90

10
WEATHER REPORT OF AIZAWL CITY FOR THE YEAR 2009
NO. OF DAYS CLEAR CLOUDY RAINY Sl.
No. MONTH
2008 2009 2008 2009 2008 2009 1 2 3 4 5 6 7 8
1 January 26 31 2 0 3 0
2 February 24 28 3 0 2 0
3 March 23 30 8 1 0 0
4 April 25 22 2 4 3 4
5 May 13 22 10 3 8 6
6 June 7 21 9 7 14 2
7 July 5 17 14 3 12 11
8 August 5 14 11 5 15 12
9 September 8 15 10 5 12 10
10 October 16 20 5 4 10 7
11 November 28 28 0 2 2 0
12 December 31 31 0 0 0 0
TOTAL 211 279 74 34 81 52
11
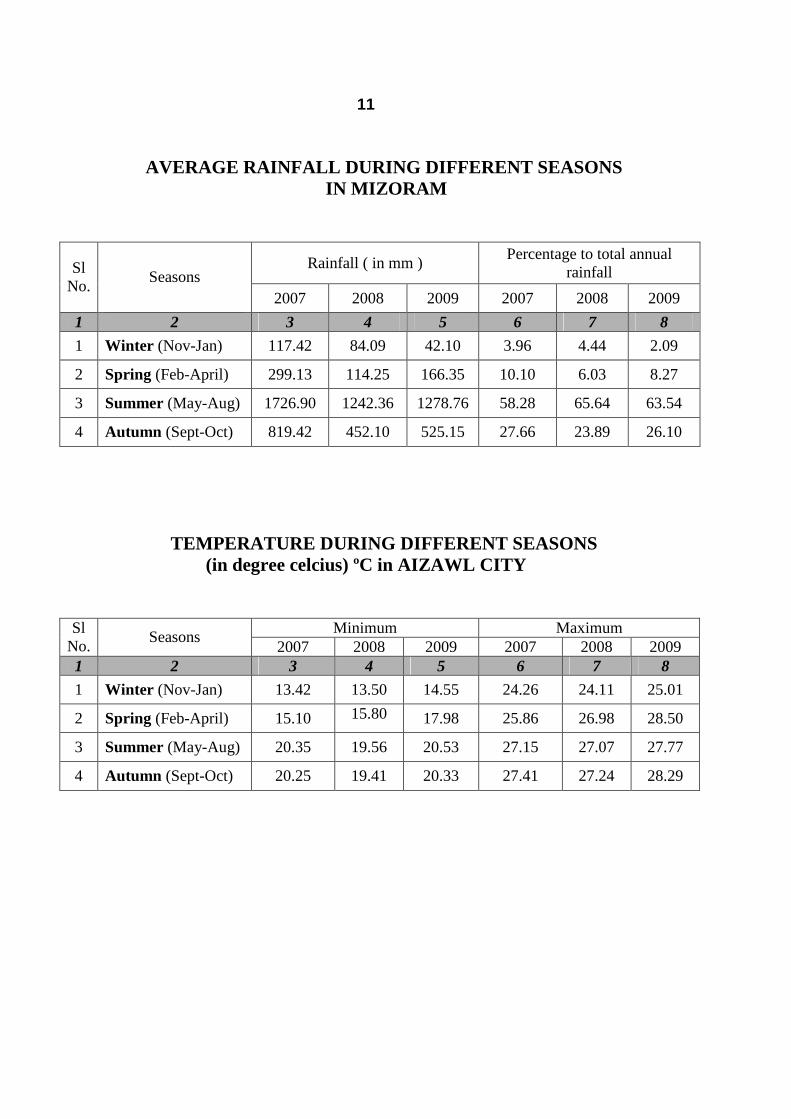
AVERAGE RAINFALL DURING DIFFERENT SEASONS IN MIZORAM
Rainfall ( in mm ) Percentage to total annual
rainfall Sl No.
Seasons 2007 2008 2009 2007 2008 2009
1 2 3 4 5 6 7 8
1 Winter (Nov-Jan) 117.42 84.09 42.10 3.96 4.44 2.09
2 Spring (Feb-April) 299.13 114.25 166.35 10.10 6.03 8.27
3 Summer (May-Aug) 1726.90 1242.36 1278.76 58.28 65.64 63.54
4 Autumn (Sept-Oct) 819.42 452.10 525.15 27.66 23.89 26.10
TEMPERATURE DURING DIFFERENT SEASONS (in degree celcius) ºC in AIZAWL CITY
Minimum Maximum Sl No.
Seasons 2007 2008 2009 2007 2008 2009
1 2 3 4 5 6 7 8
1 Winter (Nov-Jan) 13.42 13.50 14.55 24.26 24.11 25.01
2 Spring (Feb-April) 15.10 15.80
17.98 25.86 26.98 28.50
3 Summer (May-Aug) 20.35 19.56 20.53 27.15 27.07 27.77
4 Autumn (Sept-Oct) 20.25 19.41 20.33 27.41 27.24 28.29

12
MONTH-WISE RELATIVE HUMIDITY IN AIZAWL CITY
Relative Humidity in %
Maximum Minimum Sl
No. Month
2007 2008 2009 2007 2008 2009
1 2 3 4 5 6 7 8
1 January 87 95 82 54 38 52
2 February 88 94 70 49 51 34
3 March 91 93 84 32 48 20
4 April 96 85 96 50 47 44
5 May 96 98 98 51 62 64
6 June 98 100 97 81 68 75
7 July 100 100 97 84 87 74
8 August 100 100 100 81 80 78
9 September 100 100 98 61 70 70
10 October 100 100 96 59 64 64
11 November 100 98 100 76 58 55
12 December 85 88 86 50 58 57
Average 95 96 92 61 61 57
13
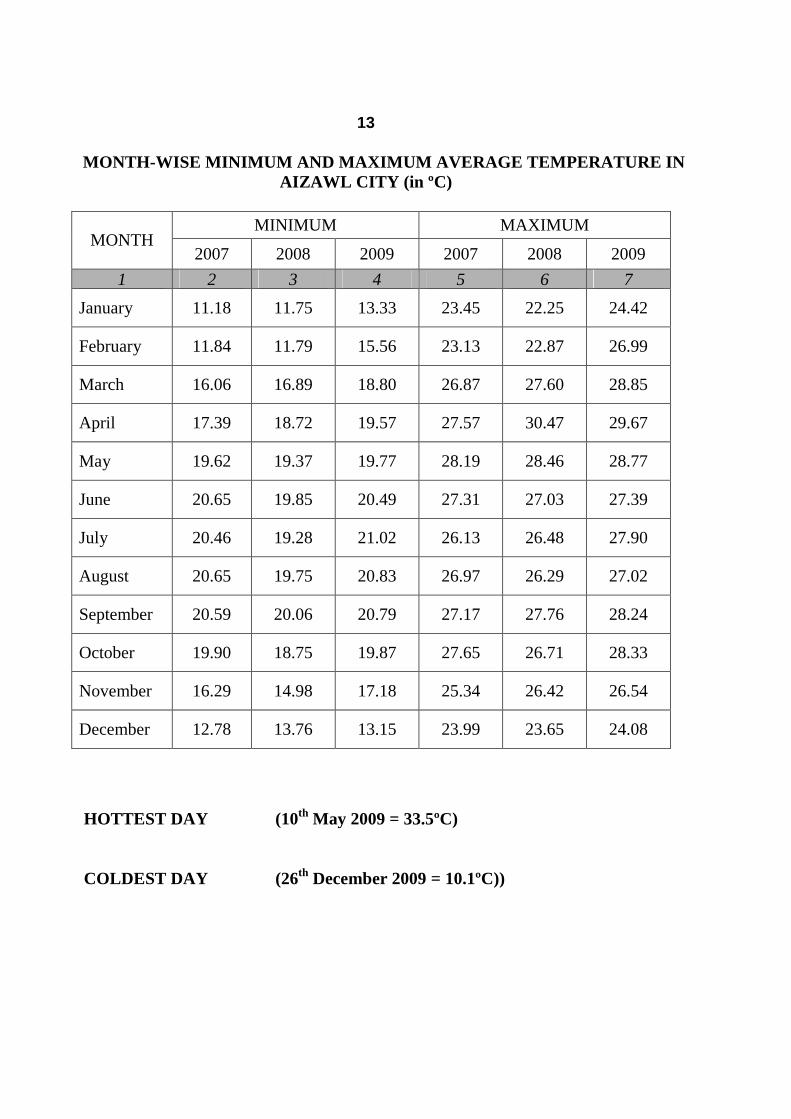
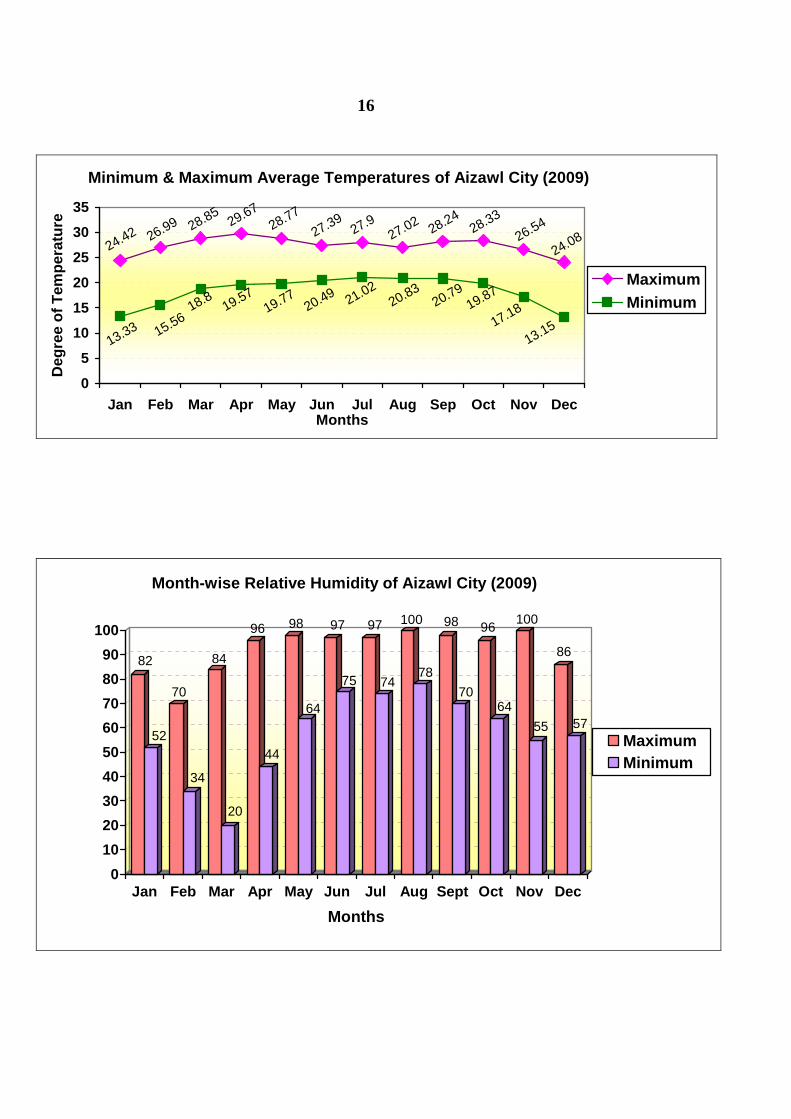
MONTH-WISE MINIMUM AND MAXIMUM AVERAGE TEMPERATURE IN
AIZAWL CITY (in ºC)
MINIMUM MAXIMUM MONTH
2007 2008 2009 2007 2008 2009
1 2 3 4 5 6 7
January 11.18 11.75 13.33 23.45 22.25 24.42
February 11.84 11.79 15.56 23.13 22.87 26.99
March 16.06 16.89 18.80 26.87 27.60 28.85
April 17.39 18.72 19.57 27.57 30.47 29.67
May 19.62 19.37 19.77 28.19 28.46 28.77
June 20.65 19.85 20.49 27.31 27.03 27.39
July 20.46 19.28 21.02 26.13 26.48 27.90
August 20.65 19.75 20.83 26.97 26.29 27.02
September 20.59 20.06 20.79 27.17 27.76 28.24
October 19.90 18.75 19.87 27.65 26.71 28.33
November 16.29 14.98 17.18 25.34 26.42 26.54
December 12.78 13.76 13.15 23.99 23.65 24.08
HOTTEST DAY (10th May 2009 = 33.5ºC)
COLDEST DAY (26th December 2009 = 10.1ºC))
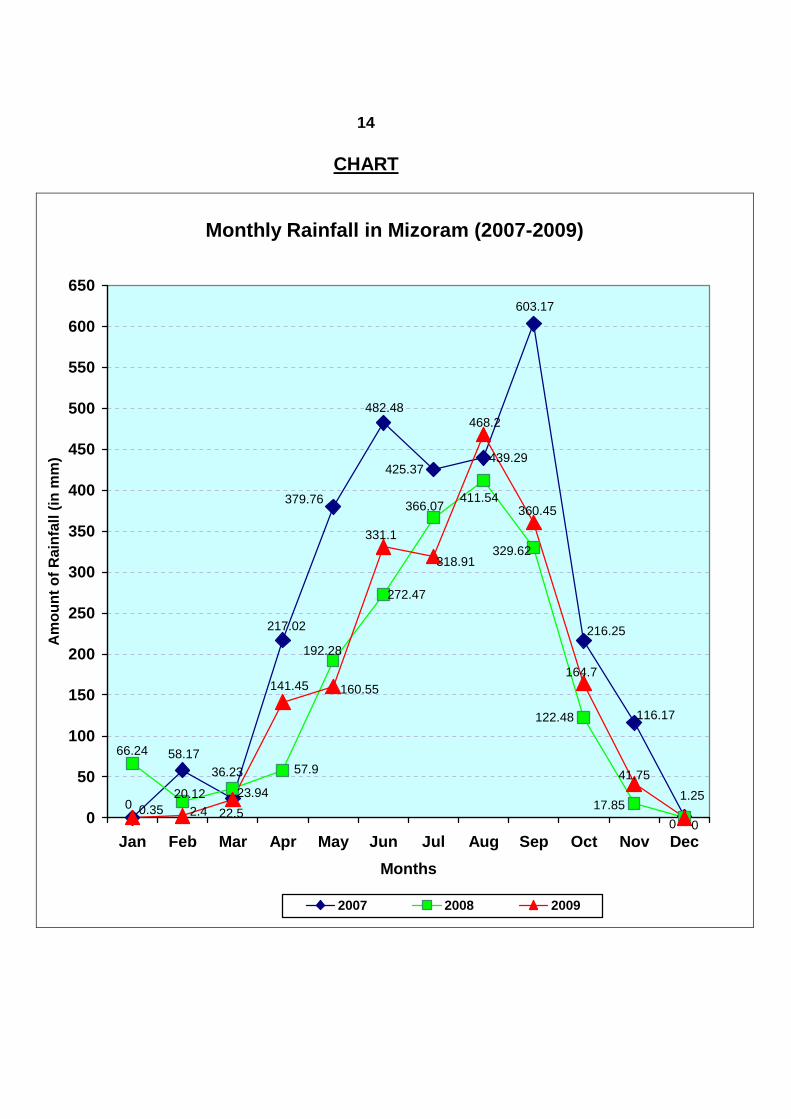
14
CHART
Monthly Rainfall in Mizoram (2007-2009)
023.94
58.17
217.02
1.25
116.17
216.25
603.17
439.29425.37
482.48
379.76
0
17.85
122.48
329.62
411.54366.07
272.47
192.28
57.936.23
20.12
66.24
0
41.75
164.7
360.45
468.2
318.91
331.1
160.55141.45
22.52.40.350
50
100
150
200
250
300
350
400
450
500
550
600
650
Jan Feb Mar Apr May Jun Jul Aug Sep Oct Nov Dec
Months
Am
ou
nt
of
Rai
nfa
ll (i
n m
m)
2007 2008 2009
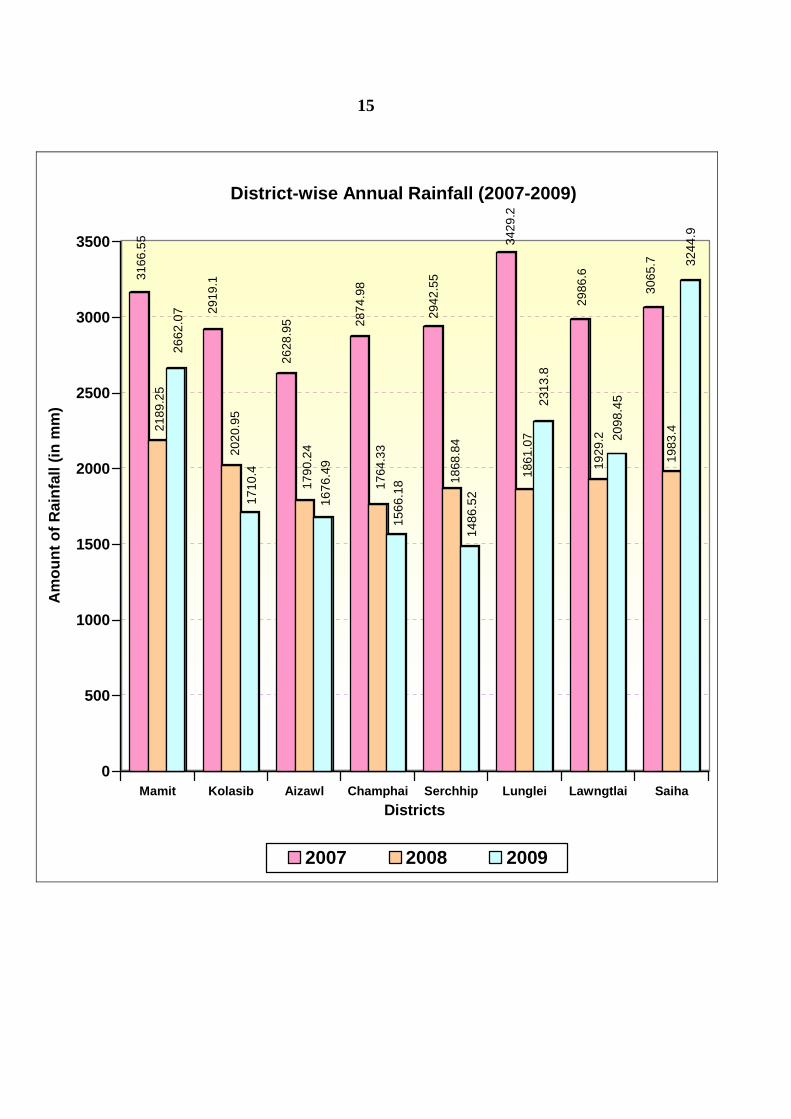
15
3166
.55
2189
.25
2662
.07 29
19.1
2020
.95
1710
.4
2628
.95
1790
.24
1676
.49
2874
.98
1764
.33
1566
.18
2942
.55
1868
.84
1486
.52
3429
.218
61.0
723
13.8
2986
.619
29.2 20
98.4
5
3065
.7
1983
.4
3244
.9
0
500
1000
1500
2000
2500
3000
3500
Am
ou
nt
of
Rai
nfa
ll (i
n m
m)
Mamit Kolasib Aizawl Champhai Serchhip Lunglei Lawngtlai Saiha
Districts
District-wise Annual Rainfall (2007-2009)
2007 2008 2009
16
Minimum & Maximum Average Temperatures of Aizawl City (2009)
24.0826.5428.3328.24
27.0227.927.3928.77
29.6728.85
26.99
24.42
13.1517.1819.8720.79
20.8321.02
20.4919.77
18.8
15.56
13.33
19.57
0
5
10
15
20
25
30
35
Jan Feb Mar Apr May Jun Jul Aug Sep Oct Nov DecMonths
Deg
ree
of
Tem
per
atu
re
MaximumMinimum
82
52
70
34
84
20
96
44
98
64
97
75
97
74
100
78
98
70
96
64
100
55
86
57
0
10
20
30
40
50
60
70
80
90
100
Jan Feb Mar Apr May Jun Jul Aug Sept Oct Nov Dec
Months
Month-wise Relative Humidity of Aizawl City (2009)
MaximumMinimum


![TAXATION DEPARTMENT MIZORAM - zotax.nic.in Schedules wef 1.1.2012.pdfTAXATION DEPARTMENT MIZORAM MIZORAM VALUE ADDED TAX VAT SCHEDULES ... Bakery products including biscuits [unbranded]](https://img.pdfslide.us/doc/110x75/5ab78cf57f8b9aa6018b93d5/taxation-department-mizoram-zotaxnicin-schedules-wef-112012pdftaxation-department.jpg)