Embed Size (px)
Citation preview
Quality Assurance and Safety of Crops & Foods, December 2013; 5 (4): 311-323 Wageningen Academic P u b l i s h e r s
ISSN 1757-8361 print, ISSN 1757-837X online, DOI 10.3920/QAS2012.0166 311
1. Introduction
The determination of the rheological properties of wheat flour dough is essential for the successful manufacturing of bread because they affect the behaviour of dough during mechanical handling, thereby influencing the quality of the finished product (Khatkar et al., 2002a,b). Different empirical methods based on the farinograph, mixograph, extensograph and alveograph are employed to assess the baking quality of wheat flours. These instruments illustrate dough properties only in the cold phase of the bread making process, i.e. during mixing and post fermentation. The Mixolab (Chopin Technologies, Villeneuve la Garenne, France) is a new instrument and has the potential to assess the dough rheological properties as well as bread making quality at room and elevated temperatures. Therefore, this instrument provides useful information on dough characteristics, α-amylase activity and starch properties.
These thermo mechanical measurements provide better screening of wheat varieties for evaluation of dough rheological and bread making quality. Angioloni and Collar (2009) used a Mixolab to explore the significance of structuring/prebiotic blends on bread dough rheological performance during various stages of bread making simulation. The Mixolab has been used previously to determine the cookie making and cake making properties of wheat flour as mentioned below. Abdel et al. (2010), Huang et al. (2010) and Jia et al. (2011) also used the Mixolab to determine the effects of cumin and ginger as antioxidants on dough mixing properties and cookie quality, effects of transglutaminase on Mixolab thermomechanical characteristics of oat dough and to study the effect of almond skin flour on dough rheology and texture of cookies, respectively. It was also used for the evaluation of pasta making quality of wheats (Manthey et al., 2006) and to investigate the effects of hydrocolloids (Rosell et
Mixolab thermomechanical characteristics of dough and bread making quality of Indian wheat varieties
V. Dhaka and B.S. Khatkar
Guru Jambheshwar University of Science and Technology, Department of Food Technology, Hisar 125001, India; [email protected]
Received: 25 April 2012 / Accepted: 27 December 2012 © 2013 Wageningen Academic Publishers
RESEARCH PAPERAbstract
Gluten viscoelasticity and starch pasting property are major determinants in the end use quality of wheat. The significance of rheology and the impact of dough rheological properties on the bread quality have led to the development of a large number of rheological tests. The rheological, thermo mechanical characteristics and bread making potential of wheat varieties from India were investigated using the Mixolab which has the capability of measuring dough development and starch pasting behaviour sequentially in a single analysis. Correlations were calculated from the Mixolab parameters sodium dodecyl sulphate sedimentation volume, gluten index, protein content and bread quality parameters. The results indicated that the specific loaf volume (SLV) was significantly correlated with Mixolab dough development time (r2=0.880), dough stability (r²=0.942), protein weakening (C2) (r²=0.890) and the glutenin/gliadin ratio (r²=0.802) indicating the dependence of SLV on protein quality. Varieties having subunits 2* or 1 and 5+10 were found to have higher SLV except variety PBW 373. The prediction equation obtained showed that the dough stability and C2 are promising parameters of Mixolab for predicting the bread making quality of Indian wheat varieties.
Keywords: bread making quality, mixolab, rheological properties, specific loaf volume
V. Dhaka and B.S. Khatkar
312 Quality Assurance and Safety of Crops & Foods 5 (4)
al., 2007) and flax seed on the rheological properties of dough (Tulbek and Hall, 2006). Kahraman et al. (2008) and Ozturk et al. (2008) tested the possibility of using Mixolab to predict the cake baking and cookie quality of different wheat flours, respectively. Bonet et al. (2006) investigated the effectiveness of transglutaminase for the formation of heteropolymers of wheat and wheat exogenous proteins using a Mixolab. Pena et al. (2006) found that the Mixolab dough development time, stability, and breakdown parameters showed high correlation with the dough strength parameters of the Alveograph when testing whole grain flour. All these studies were correlated with products such as cakes, cookies where a lower protein in wheat flour and lesser gluten development is required. However, there are limited research reports on the evaluation of the bread making quality of wheat varieties using Mixolab thermo mechanical applications.
In the present study, a Mixolab was used with baking test to evaluate the bread making potential of wheat flours obtained from diverse Indian wheat varieties. The Mixolab was selected for this study because while carrying out rheological tests, the dough can be heated up to 90 °C, and then cooled if desired. This function makes the Mixolab unique, by allowing through a single test to obtain information on water absorption capacity and kneading stability, as well as gelatinisation temperature, amylase activity and starch retrogradation. Efforts have also been made to understand the effects of gluten and glutenin quantity and quality of diverse wheat varieties. This information can thus be used for a better understanding of the bread making potential of flours.
2. Materials and methods
Raw material
Fifteen Indian wheat (Triticum aestivum) varieties were procured from agricultural universities, IARI regional centres, DWR, Karnal and Central State Farm, Hisar, India, chosen for their diversity of bread making performances. The grains were cleaned manually and stored in a deep freezer (-18 °C) till further use. Grain length and width was measured by using a Vernier calliper. Thousand kernel weight (TKW) was determined by measuring the weight of 100 seeds and multiplying the weight obtained by a factor of 10. Hectolitre weight (HLW) was determined using Aqua TR (Chopin Technologies). Wheat varieties were tempered to 15.5% moisture content for 48 h. An extra 0.5% moisture was added 30 min prior to milling. The grains of individual varieties were milled on a Chopin laboratory mill (Model CD1, Villeneuve la Garenne, France) into flour. The flour obtained was stored at -18 °C and thawed for 2 h prior to any analysis.
Analysis of wheat flour
The flour samples of all wheat varieties were analysed for their moisture, protein (N × 5.7), ash, falling number, wet gluten (WG), dry gluten (DG) and gluten index (GI) according to standard AACC-I approved methods. The sodium dodecyl sulphate (SDS) sedimentation volumes of flour samples were estimated according to the method of Axford et al. (1978). Damaged starch contents of the flour samples were determined using an amperometric method (SD-Matic, Chopin Technologies, Villeneuve la Garenne, France). Triplicate measurements were carried out for the chemical analysis and the results were averaged.
Gliadins and glutenins were isolated from gluten using a modified Osborne (1907) method. Gluten was separated from dough by manual washing at a temperature of 15 °C. The gluten was then freeze-dried and ground to a uniform powder. Freeze dried gluten powder (50 g) from each variety was suspended in 1 l of 70% (v/v) ethanol and stirred on magnetic stirrer for 3 h at room temperature (~22 °C) followed by centrifugation at 1000×g for 30 min in cooling centrifuge at 4 °C. The supernatant was collected and the pellet was again extracted with 70% ethanol. The extraction was repeated two more times for a total of three extractions. The precipitant was collected as glutenin and the supernatant was subjected to rotary evaporator at 30 °C to remove ethanol to get the gliadins. The gliadin and glutenin fractions, thus, obtained were freeze dried and powdered.
Thermo mechanical properties
Thermo mechanical properties were studied using the Mixolab. The Mixolab determines a comprehensive qualitative profile of wheat flour and plots, in real time, the torque (expressed in Nm) produced by the passage of the dough between two kneading arms when submitted to both shear stress and a temperature constraint. The Mixolab is capable of determining physical dough properties like mixing behaviour, dough strength and stability along with the pasting properties. The Chopin+ protocol involving a constant mixing speed of 80 rpm was used to assess the dough rheology. During the first stage commotion of spherical protein particles occurs leading to the unfolding of proteins and the formation of a three dimensional network which has gas retaining properties. In this stage hydration of flour components also take place. The parameters that are obtained from the curve are water absorption (%) or the percentage of water required for the dough to produce a torque of 1.1±0.05 Nm, dough development time (min) or the time to reach the maximum torque at 30 °C, and dough stability (min) or the elapsed time at which the torque produced is kept at 1.1 Nm. The second stage is marked by an increase in dough temperature from 30 to 90 °C (8-23 min) and a significant decrease in torque, which
Mixolab thermomechanical characteristics of dough from Indian wheat varieties
Quality Assurance and Safety of Crops & Foods 5 (4) 313
is accredited to mechanical weakening (Nm) or thermal destabilisation of the protein network. The rise of dough temperature leads to protein denaturation involving the release of a large quantity of water. As the temperature further increases the protein alterations are shrouded by the properties of starch. Now, the starch molecules absorb water, swells and amylose leaches out in the aqueous phase, resulting in increase in viscosity as well as torque (stage 3). Thereafter, a constant temperature of 90 °C for 7 min is maintained, which allows for the enzymatic action on starch granules demonstrating a reduction in dough viscosity (stage 4). In the last stage, as the temperature decreases from 90 to 50 °C over 10 min and then is held for 50 °C for 5 min, the torque increases due to retrogradation of starch molecules.
Key parameters derived from the Mixolab curve are water absorption (%), dough development (C1), protein weakening, i.e. decrease in dough consistency due to excessive mixing (C2), starch gelatinisation, i.e. starch granules swell and absorb water and amylose molecules to leach out resulting in an increase in the viscosity (C3), amylase activity (C4), and starch gelling (C5).
Deformation mechanical test
Uniaxial extensibility of gluten of different wheat varieties was assessed by the Kieffer dough and gluten extensibility rig developed by Stable Micro Systems for the TA.XT plus Texture Analyser. Gluten was extracted following the standard procedure and was rolled into a cylindrical shape and placed over three or four channels of the Teflon coated block. Prior to the placement of gluten, the Teflon-coated block was prepared by placing non-adhesive Teflon strips which were coated with silicon oil in the channels. Once the gluten was placed in the Teflon-coated block, the upper half of the block was placed in position and tightly clamped, which distributed the gluten over three to four channels, to yield gluten strips of uniform geometry. The gluten was rested for 40 min at 25 °C prior to the test. The gluten strips were then separated from the Teflon strips, positioned across the Kieffer rig dough holder, and immediately tested on the TA.XT plus at a hook speed of 3.3 mm/s and a trigger force of 1 g (Ktenioudaki et al., 2010). The resistance to extension (g) and extensibility (mm) were determined in tension mode by recording the peak force and the distance at the maximum and the extension limit.
Extraction of glutenin fractions
Total glutenins were extracted according to Khatkar (2006). 0.5 M NaCl solution was added to 1 g of flour sample to remove albumins and globulins. The pellet was dispersed in distilled water three times to remove the residual salt and then the flour was suspended in 70% ethanol and stirred with a magnetic stirrer to remove gliadins. The sample
solution was then centrifuged at 15,000×g for 30 min. The procedure was repeated twice and the residue was further used for glutenin extraction. The residue obtained was then suspended in 5 ml of 50% (v/v) propan-2-ol, 0.08 M Tris-HCl (pH 8.0), 1% (w/v) dithiothreitol. Then the samples were kept in a water bath at temp of 60 °C for 90 min with intermittent shaking and the tubes were vortexed after every 15 min. The tubes were centrifuged (15,000×g for 30 min at 20 °C) and supernatant was recovered.
To the supernatant 20 ml pure acetone was added to achieve a final concentration of 80% (v/v) to precipitate total glutenins. The precipitate was centrifuged (15,000×g for 30 min at 20 °C). The total glutenin residue was dried in an oven at 60 °C for 5-10 min, and solubilised in 2 ml of SDS sample buffer.
Electrophoretic analysis
Electrophoresis was run using the slab gel apparatus of M/S ATTO (model no. AE-6220; ATTO Corporation, Tokyo, Japan). Glass plates (with 1 mm thick spacers) were thoroughly cleaned with ethanol, dried and assembled in the gel casting assembly with a 12% polyacrylamide separating gel containing 1.35% bis-acrylamide cross-linker according to the procedure of Laemelli (1970). Flours (40 mg) and proteins (4 mg) were suspended in SDS sample buffer (1.0 ml) containing 62.5 mM Tris/ HCl (pH 6.8), 2% (w/v) SDS, 10% (v/v) glycerol, 0.001% (w/v) bromophenol blue and 5% (v/v) 2-mercaptoethanol. The flour/ protein buffer mixtures were vortexed for 2 min and allowed to stand at room temperature for 3 h. The flour buffer mixtures were centrifuged, and the supernatants were heated for 3 min in a boiling water bath. The protein buffer samples were heated directly for 3 min in a boiling water bath. After cooling to room temperature, 15 µl of sample were loaded into the wells. Two gels were run simultaneously at constant current of 40 mA for 4 h or until the sample dye reached the end of the gel. Electrophoresis was stopped and gel was stained overnight in the staining solution (60% distilled water, 30% methanol, 10% acetic acid and 0.1% G-250 Coomassie Brilliant Blue). After staining the gels were transferred to a de-staining solution (60% distilled water, 30% methanol and 10% acetic acid).
Densitometric analysis of gels
Relative amounts of high and low molecular weight glutenin subunits were determined by densitometric scanning of SDS-PAGE gels of reduced proteins. First the gel was positioned in a sample holder which was further filled with water up to the surface of gel to minimise the scattering of light. After that the gel was covered with a holding plate and placed on the scanner. The proteins in the individual lane were analysed by using Labworks Image Acquisition
V. Dhaka and B.S. Khatkar
314 Quality Assurance and Safety of Crops & Foods 5 (4)
and Analysis Software, version 1.4. (UVP Inc., Upland, CA, USA).
Bread making and quality evaluation
Breads of fifteen wheat varieties were prepared according to the procedure described by Finney (1984) with little modification. The ingredients used were: flour (100 g, 14% moisture basis), compressed yeast (5.3 g), salt (1.5 g), sugar (6.0 g), fat (3.0 g), malted barley flour (0.075 g) and ascorbic acid (100 mg/kg, flour basis). Salt, sugar, ascorbic acid and yeast were added in solution form. Yeast was added as a suspension, which was mixed well each time before dispensing. Doughs were mixed in a Farinograph (100 g capacity). Water absorption and the development time were determined using the Chopin+ protocol of the Mixolab. An additional 2 ml water was added and mixing time with 1 min longer than dough development time was used for baking.
After mixing, doughs were placed in bowls, and covered with a wet muslin cloth and fermented for 90 min at 35 °C and 98% RH. Doughs were moulded after 52, 77 and 90 min in a dough moulder. After final moulding, the dough was divided into four equal proportions and placed in lightly greased tins (internal dimensions for 30 g bread pan: bottom 24.6×52.8 mm; top 32.1×61.2 mm; height 23.5 mm) and proved for 36 min at 35 °C and 98% RH. After adequate proving, doughs were baked for 13 min at 232 °C. After removing from the oven, loaves were placed on a wire grid for about 2 h for cooling and then weight and volume were determined. Loaf volumes were measured by rapeseed displacement to calculate specific loaf volume by dividing volume of bread by its weight.
Statistical analyses
The experimental data were analysed using SPSS software (SPSS Inc., Armonk, NY, USA) and Microsoft Office Excel 2007 (Redmond, WA, USA). Means and standard error were derived with Microsoft Office Excel 2007 whereas correlations between various parameters were assessed by Pearson’s test (significant levels at P<0.01 and P<0.05) in all cases using SPSS software. Correlations between the Mixolab parameters and flour quality characteristics (like protein, WG content, DG content, GI, damaged starch, falling number, SDS sedimentation volumes) as well as bread quality characteristics (specific volume, loaf volume and bread firmness) were determined. All determinations were made at least in triplicate.
The data were also assessed using the principal component analysis (PCA) technique because of its ability to reduce the complexity of data sets to a small number of independent (orthogonal) principal components representing linear combinations of the original variables. This approach allows
grouping of variables, the association between groups of variables and a more basic understanding of the primary components contributing to the underlying variability of a data set.
3. Results and discussion
Grain quality
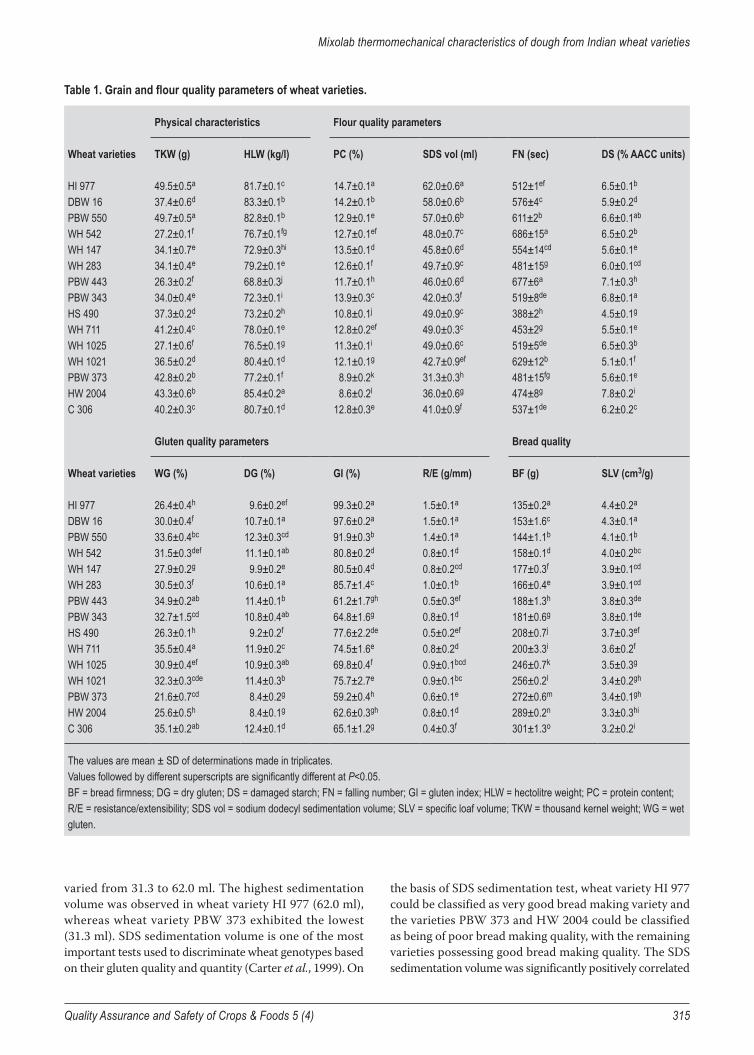
Table 1 displays the grain quality characteristics of fifteen wheat varieties. The grain quality parameters, i.e. TKW and HLW, varied significantly among varieties. TKW is a useful tool for the assessment of the potential milling yield. The kernel size contributes directly towards the improvement of grain yield as well as milling yield. The data show that the variety PBW 443 had the minimum TKW (26.3 g), while the maximum value (49.5 g) was observed for the variety HI 977. The present study suggests that the wheat varieties possessing better grain weight offer great potential for better milling yield and wide variation in grain weight can be exploited by the wheat breeders to improve this trait in the new genotypes. HLW depends on the shape, size and soundness of grains and should be more than 76 kg/l for industrial use. It represented a wide range from a minimum of 68.8 kg/l to a maximum 85.4 kg/l with the average value of 77.9 kg/l. The difference in the HLW may be attributed to the difference in climatic conditions, cropping practices and genetic makeup of the varieties.
Flour quality and dough rheological properties
The results of flour quality and dough rheological properties are presented in Table 1. The protein content of wheat varieties in this study ranged from 8.6 to 14.7% with an average value of 12.2%. Flours suitable for bread making are those made from hard wheat and generally have high protein content in the range of 11 to 14% (Ktenioudaki et al., 2010). The highest protein content was noted in HI 977 and lowest in HW 2004. Protein content and composition of wheat is the most important criteria in determination of wheat quality (Bilgin and Korkut, 2005). Protein content is a character determining water absorbing ability, dough stability, dough resistance and elasticity. The importance of protein content also lies in the ability of gluten to produce dough with the desired rheological properties. Moreover, higher amounts of good quality protein are required for gas retention and dough rise during fermentation or early stages of baking. Protein content was significantly correlated with the SDS sedimentation value (r²=0.622). A similar correlation coefficient between protein content and SDS sedimentation values has been reported by Faergestad et al. (2000) As expected, the flour protein content was found to be correlated with specific loaf volume of bread (r²=0.601).
Highly significant differences were noted in respect of SDS sedimentation volume (Table 1). Sedimentation values
Mixolab thermomechanical characteristics of dough from Indian wheat varieties
Quality Assurance and Safety of Crops & Foods 5 (4) 315
varied from 31.3 to 62.0 ml. The highest sedimentation volume was observed in wheat variety HI 977 (62.0 ml), whereas wheat variety PBW 373 exhibited the lowest (31.3 ml). SDS sedimentation volume is one of the most important tests used to discriminate wheat genotypes based on their gluten quality and quantity (Carter et al., 1999). On
the basis of SDS sedimentation test, wheat variety HI 977 could be classified as very good bread making variety and the varieties PBW 373 and HW 2004 could be classified as being of poor bread making quality, with the remaining varieties possessing good bread making quality. The SDS sedimentation volume was significantly positively correlated
Table 1. Grain and flour quality parameters of wheat varieties.
Physical characteristics Flour quality parameters
Wheat varieties TKW (g) HLW (kg/l) PC (%) SDS vol (ml) FN (sec) DS (% AACC units)
HI 977 49.5±0.5a 81.7±0.1c 14.7±0.1a 62.0±0.6a 512±1ef 6.5±0.1b
DBW 16 37.4±0.6d 83.3±0.1b 14.2±0.1b 58.0±0.6b 576±4c 5.9±0.2d
PBW 550 49.7±0.5a 82.8±0.1b 12.9±0.1e 57.0±0.6b 611±2b 6.6±0.1ab
WH 542 27.2±0.1f 76.7±0.1fg 12.7±0.1ef 48.0±0.7c 686±15a 6.5±0.2b
WH 147 34.1±0.7e 72.9±0.3hi 13.5±0.1d 45.8±0.6d 554±14cd 5.6±0.1e
WH 283 34.1±0.4e 79.2±0.1e 12.6±0.1f 49.7±0.9c 481±15g 6.0±0.1cd
PBW 443 26.3±0.2f 68.8±0.3j 11.7±0.1h 46.0±0.6d 677±6a 7.1±0.3h
PBW 343 34.0±0.4e 72.3±0.1i 13.9±0.3c 42.0±0.3f 519±8de 6.8±0.1a
HS 490 37.3±0.2d 73.2±0.2h 10.8±0.1j 49.0±0.9c 388±2h 4.5±0.1g
WH 711 41.2±0.4c 78.0±0.1e 12.8±0.2ef 49.0±0.3c 453±2g 5.5±0.1e
WH 1025 27.1±0.6f 76.5±0.1g 11.3±0.1i 49.0±0.6c 519±5de 6.5±0.3b
WH 1021 36.5±0.2d 80.4±0.1d 12.1±0.1g 42.7±0.9ef 629±12b 5.1±0.1f
PBW 373 42.8±0.2b 77.2±0.1f 8.9±0.2k 31.3±0.3h 481±15fg 5.6±0.1e
HW 2004 43.3±0.6b 85.4±0.2a 8.6±0.2l 36.0±0.6g 474±8g 7.8±0.2i
C 306 40.2±0.3c 80.7±0.1d 12.8±0.3e 41.0±0.9f 537±1de 6.2±0.2c
Gluten quality parameters Bread quality
Wheat varieties WG (%) DG (%) GI (%) R/E (g/mm) BF (g) SLV (cm3/g)
HI 977 26.4±0.4h 9.6±0.2ef 99.3±0.2a 1.5±0.1a 135±0.2a 4.4±0.2a
DBW 16 30.0±0.4f 10.7±0.1a 97.6±0.2a 1.5±0.1a 153±1.6c 4.3±0.1a
PBW 550 33.6±0.4bc 12.3±0.3cd 91.9±0.3b 1.4±0.1a 144±1.1b 4.1±0.1b
WH 542 31.5±0.3def 11.1±0.1ab 80.8±0.2d 0.8±0.1d 158±0.1d 4.0±0.2bc
WH 147 27.9±0.2g 9.9±0.2e 80.5±0.4d 0.8±0.2cd 177±0.3f 3.9±0.1cd
WH 283 30.5±0.3f 10.6±0.1a 85.7±1.4c 1.0±0.1b 166±0.4e 3.9±0.1cd
PBW 443 34.9±0.2ab 11.4±0.1b 61.2±1.7gh 0.5±0.3ef 188±1.3h 3.8±0.3de
PBW 343 32.7±1.5cd 10.8±0.4ab 64.8±1.6g 0.8±0.1d 181±0.6g 3.8±0.1de
HS 490 26.3±0.1h 9.2±0.2f 77.6±2.2de 0.5±0.2ef 208±0.7j 3.7±0.3ef
WH 711 35.5±0.4a 11.9±0.2c 74.5±1.6e 0.8±0.2d 200±3.3i 3.6±0.2f
WH 1025 30.9±0.4ef 10.9±0.3ab 69.8±0.4f 0.9±0.1bcd 246±0.7k 3.5±0.3g
WH 1021 32.3±0.3cde 11.4±0.3b 75.7±2.7e 0.9±0.1bc 256±0.2l 3.4±0.2gh
PBW 373 21.6±0.7cd 8.4±0.2g 59.2±0.4h 0.6±0.1e 272±0.6m 3.4±0.1gh
HW 2004 25.6±0.5h 8.4±0.1g 62.6±0.3gh 0.8±0.1d 289±0.2n 3.3±0.3hi
C 306 35.1±0.2ab 12.4±0.1d 65.1±1.2g 0.4±0.3f 301±1.3o 3.2±0.2i
The values are mean ± SD of determinations made in triplicates.Values followed by different superscripts are significantly different at P<0.05.BF = bread firmness; DG = dry gluten; DS = damaged starch; FN = falling number; GI = gluten index; HLW = hectolitre weight; PC = protein content; R/E = resistance/extensibility; SDS vol = sodium dodecyl sedimentation volume; SLV = specific loaf volume; TKW = thousand kernel weight; WG = wet gluten.
V. Dhaka and B.S. Khatkar
316 Quality Assurance and Safety of Crops & Foods 5 (4)
(r²=0.829) with the specific loaf volume of bread. Similar results were reported by other researchers (Axford et al., 1978; Blackman and Gill, 1980; De Villiers and Laubscher, 1995; Dexter et al., 1980; Krattiger and Law, 1991; Lorenzo and Kronstad, 1987; McDermott and Redman, 1977; Moonen et al., 1982; Pickney et al., 1957). There has been evidence to suggest that the SDS sedimentation test singularly gives the best prediction of bread baking potential and strength for hard wheat (Greenaway et al., 1966; Moonen et al., 1982). In the past few years the SDS sedimentation test has been investigated on different wheat types in numerous studies and countries (Axford et al., 1979; Matuz, 1998; Morris et al., 2007; O’Brien and Ronalds, 1979; Takata et al., 2001). It has gained wide acceptance as a useful, small-scale test in bread wheat breeding programmes to give a good indication of differences in both protein content and gluten quality, the two most important factors influencing bread baking quality (Axford et al., 1978; Carter et al., 1999; De Villiers and Laubscher, 1995), especially in genotypes with a protein content up to approximately 13%, where high SDS sedimentation volume has been associated with stronger gluten and good quality (Carter et al., 1999). The SDS sedimentation volume was also positively correlated with GI and R/E ratio of gluten.
The gluten proteins impart unique bread making properties to wheat. Wheat varieties varied significantly (P<0.05) for their wet and dry gluten contents as shown in Table 1. The values for WG ranged from 21.6 to 35.5%. The highest amount of WG was found in the straight grade flour of
wheat variety WH 711, whereas the lowest was found in PBW 373. The mean values for DG ranged from 8.4 to 12.4%. Wheat variety HW 2004 showed the lowest DG content, i.e. 8.37%, whereas variety C 306 had the highest, 12.43%. A significant positive correlation (r²=0.948) was observed between WG and DG content.
The R/E ratio of the gluten of different wheat varieties ranged from 0.41 and 1.49. Varieties HI 977 and DBW 16 exhibited the higher R/E ratio (1.5 each). The lower R/E ratio was recorded for varieties C 306, i.e 0.41. Several authors have also highlighted the need to assess dough extensibility when screening for end-use quality among wheat breeding lines (Anderssen et al., 2004; Nash et al., 2006; Suchy et al., 2000; Treml et al., 2006).
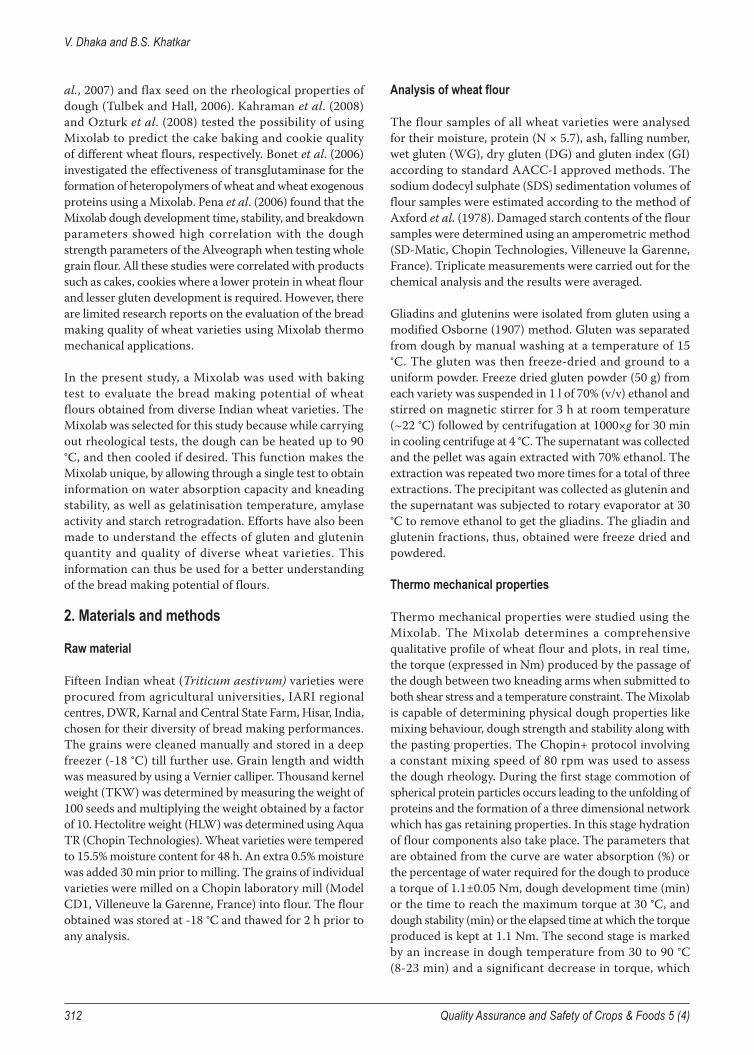
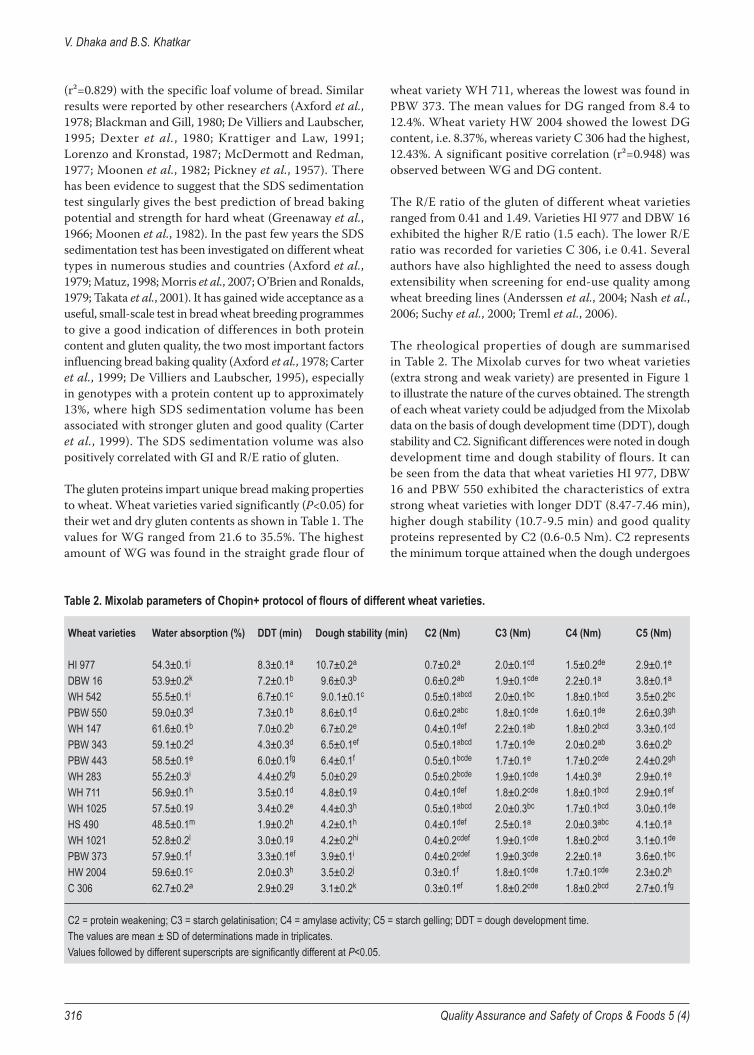
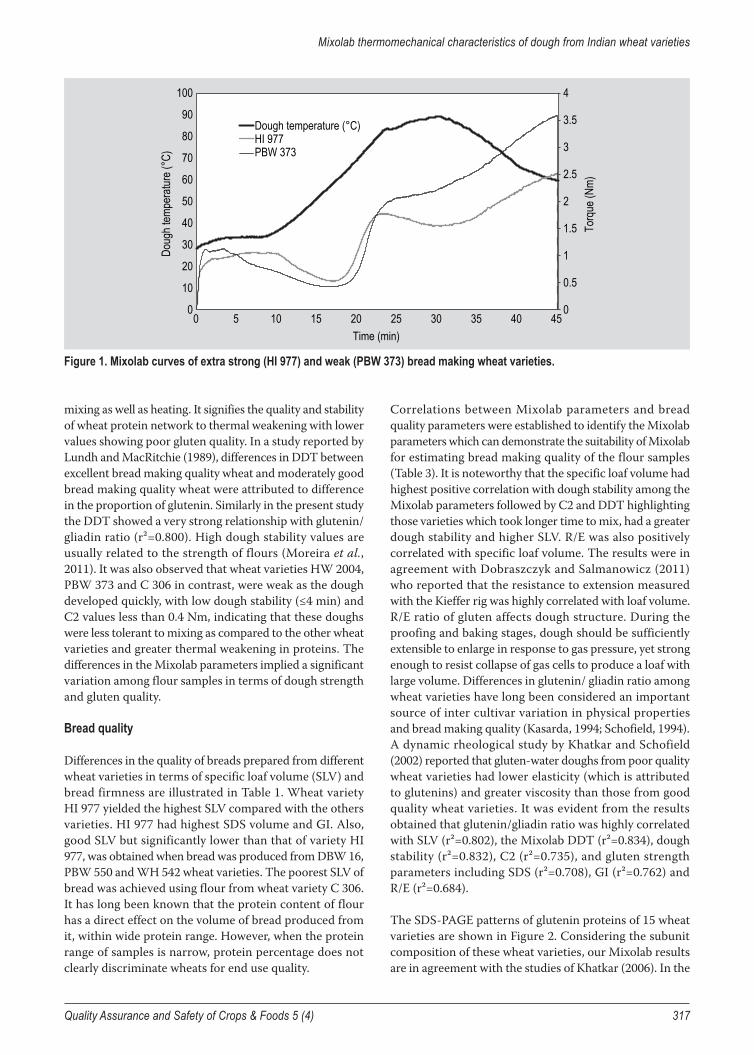
The rheological properties of dough are summarised in Table 2. The Mixolab curves for two wheat varieties (extra strong and weak variety) are presented in Figure 1 to illustrate the nature of the curves obtained. The strength of each wheat variety could be adjudged from the Mixolab data on the basis of dough development time (DDT), dough stability and C2. Significant differences were noted in dough development time and dough stability of flours. It can be seen from the data that wheat varieties HI 977, DBW 16 and PBW 550 exhibited the characteristics of extra strong wheat varieties with longer DDT (8.47-7.46 min), higher dough stability (10.7-9.5 min) and good quality proteins represented by C2 (0.6-0.5 Nm). C2 represents the minimum torque attained when the dough undergoes
Table 2. Mixolab parameters of Chopin+ protocol of flours of different wheat varieties.
Wheat varieties Water absorption (%) DDT (min) Dough stability (min) C2 (Nm) C3 (Nm) C4 (Nm) C5 (Nm)
HI 977 54.3±0.1j 8.3±0.1a 10.7±0.2a 0.7±0.2a 2.0±0.1cd 1.5±0.2de 2.9±0.1e
DBW 16 53.9±0.2k 7.2±0.1b 9.6±0.3b 0.6±0.2ab 1.9±0.1cde 2.2±0.1a 3.8±0.1a
WH 542 55.5±0.1i 6.7±0.1c 9.0.1±0.1c 0.5±0.1abcd 2.0±0.1bc 1.8±0.1bcd 3.5±0.2bc
PBW 550 59.0±0.3d 7.3±0.1b 8.6±0.1d 0.6±0.2abc 1.8±0.1cde 1.6±0.1de 2.6±0.3gh
WH 147 61.6±0.1b 7.0±0.2b 6.7±0.2e 0.4±0.1def 2.2±0.1ab 1.8±0.2bcd 3.3±0.1cd
PBW 343 59.1±0.2d 4.3±0.3d 6.5±0.1ef 0.5±0.1abcd 1.7±0.1de 2.0±0.2ab 3.6±0.2b
PBW 443 58.5±0.1e 6.0±0.1fg 6.4±0.1f 0.5±0.1bcde 1.7±0.1e 1.7±0.2cde 2.4±0.2gh
WH 283 55.2±0.3i 4.4±0.2fg 5.0±0.2g 0.5±0.2bcde 1.9±0.1cde 1.4±0.3e 2.9±0.1e
WH 711 56.9±0.1h 3.5±0.1d 4.8±0.1g 0.4±0.1def 1.8±0.2cde 1.8±0.1bcd 2.9±0.1ef
WH 1025 57.5±0.1g 3.4±0.2e 4.4±0.3h 0.5±0.1abcd 2.0±0.3bc 1.7±0.1bcd 3.0±0.1de
HS 490 48.5±0.1m 1.9±0.2h 4.2±0.1h 0.4±0.1def 2.5±0.1a 2.0±0.3abc 4.1±0.1a
WH 1021 52.8±0.2l 3.0±0.1g 4.2±0.2hi 0.4±0.2cdef 1.9±0.1cde 1.8±0.2bcd 3.1±0.1de
PBW 373 57.9±0.1f 3.3±0.1ef 3.9±0.1i 0.4±0.2cdef 1.9±0.3cde 2.2±0.1a 3.6±0.1bc
HW 2004 59.6±0.1c 2.0±0.3h 3.5±0.2j 0.3±0.1f 1.8±0.1cde 1.7±0.1cde 2.3±0.2h
C 306 62.7±0.2a 2.9±0.2g 3.1±0.2k 0.3±0.1ef 1.8±0.2cde 1.8±0.2bcd 2.7±0.1fg
C2 = protein weakening; C3 = starch gelatinisation; C4 = amylase activity; C5 = starch gelling; DDT = dough development time.The values are mean ± SD of determinations made in triplicates.Values followed by different superscripts are significantly different at P<0.05.
Mixolab thermomechanical characteristics of dough from Indian wheat varieties
Quality Assurance and Safety of Crops & Foods 5 (4) 317
mixing as well as heating. It signifies the quality and stability of wheat protein network to thermal weakening with lower values showing poor gluten quality. In a study reported by Lundh and MacRitchie (1989), differences in DDT between excellent bread making quality wheat and moderately good bread making quality wheat were attributed to difference in the proportion of glutenin. Similarly in the present study the DDT showed a very strong relationship with glutenin/ gliadin ratio (r²=0.800). High dough stability values are usually related to the strength of flours (Moreira et al., 2011). It was also observed that wheat varieties HW 2004, PBW 373 and C 306 in contrast, were weak as the dough developed quickly, with low dough stability (≤4 min) and C2 values less than 0.4 Nm, indicating that these doughs were less tolerant to mixing as compared to the other wheat varieties and greater thermal weakening in proteins. The differences in the Mixolab parameters implied a significant variation among flour samples in terms of dough strength and gluten quality.
Bread quality
Differences in the quality of breads prepared from different wheat varieties in terms of specific loaf volume (SLV) and bread firmness are illustrated in Table 1. Wheat variety HI 977 yielded the highest SLV compared with the others varieties. HI 977 had highest SDS volume and GI. Also, good SLV but significantly lower than that of variety HI 977, was obtained when bread was produced from DBW 16, PBW 550 and WH 542 wheat varieties. The poorest SLV of bread was achieved using flour from wheat variety C 306. It has long been known that the protein content of flour has a direct effect on the volume of bread produced from it, within wide protein range. However, when the protein range of samples is narrow, protein percentage does not clearly discriminate wheats for end use quality.
Correlations between Mixolab parameters and bread quality parameters were established to identify the Mixolab parameters which can demonstrate the suitability of Mixolab for estimating bread making quality of the flour samples (Table 3). It is noteworthy that the specific loaf volume had highest positive correlation with dough stability among the Mixolab parameters followed by C2 and DDT highlighting those varieties which took longer time to mix, had a greater dough stability and higher SLV. R/E was also positively correlated with specific loaf volume. The results were in agreement with Dobraszczyk and Salmanowicz (2011) who reported that the resistance to extension measured with the Kieffer rig was highly correlated with loaf volume. R/E ratio of gluten affects dough structure. During the proofing and baking stages, dough should be sufficiently extensible to enlarge in response to gas pressure, yet strong enough to resist collapse of gas cells to produce a loaf with large volume. Differences in glutenin/ gliadin ratio among wheat varieties have long been considered an important source of inter cultivar variation in physical properties and bread making quality (Kasarda, 1994; Schofield, 1994). A dynamic rheological study by Khatkar and Schofield (2002) reported that gluten-water doughs from poor quality wheat varieties had lower elasticity (which is attributed to glutenins) and greater viscosity than those from good quality wheat varieties. It was evident from the results obtained that glutenin/gliadin ratio was highly correlated with SLV (r²=0.802), the Mixolab DDT (r²=0.834), dough stability (r²=0.832), C2 (r²=0.735), and gluten strength parameters including SDS (r²=0.708), GI (r²=0.762) and R/E (r²=0.684).
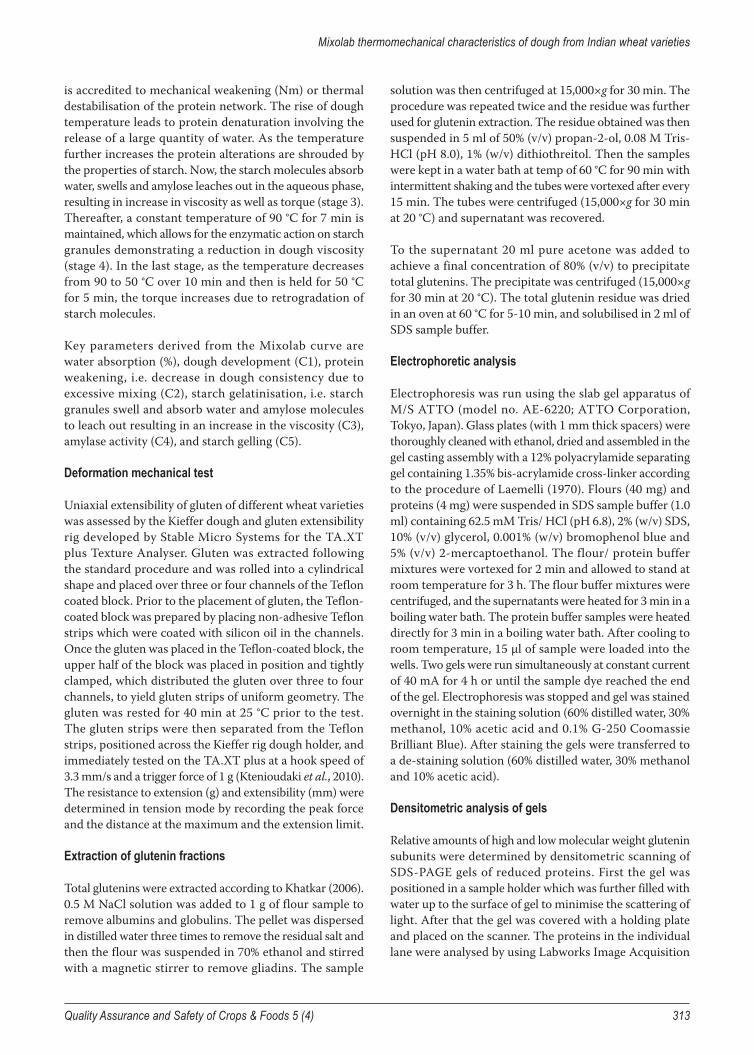
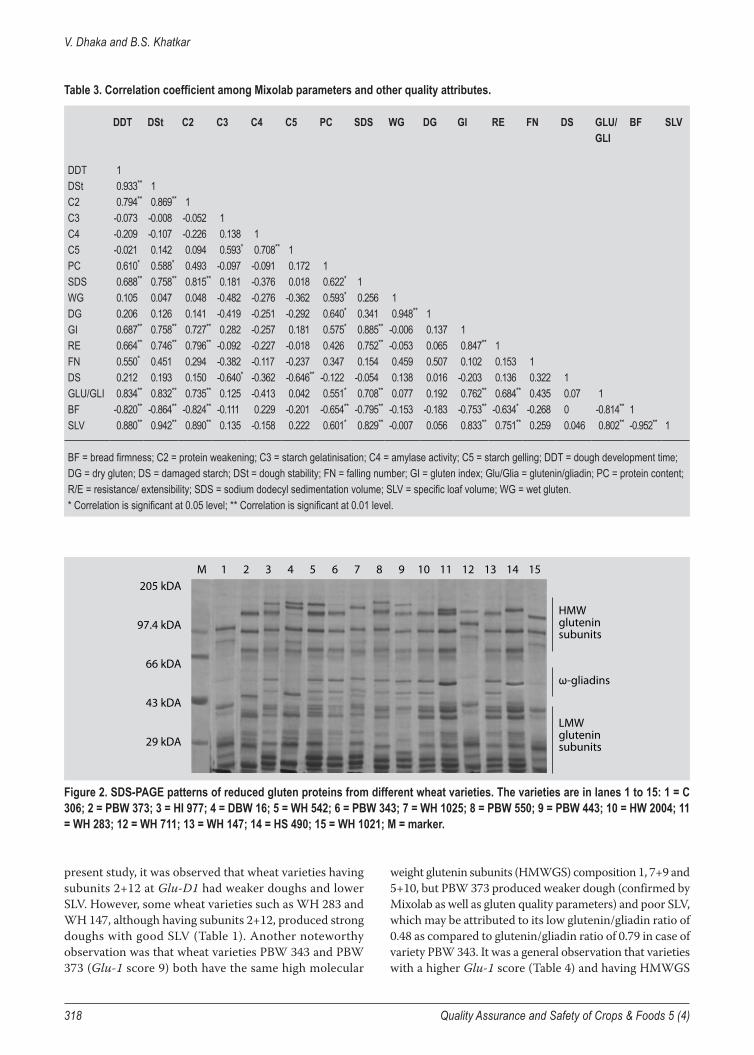
The SDS-PAGE patterns of glutenin proteins of 15 wheat varieties are shown in Figure 2. Considering the subunit composition of these wheat varieties, our Mixolab results are in agreement with the studies of Khatkar (2006). In the
0
0.5
1
1.5
2
2.5
3
3.5
4
0
10
20
30
40
50
60
70
80
90
100
0 5 10 15 20 25 30 35 40 45
Torq
ue (N
m)
Doug
h tem
pera
ture (
°C)
Time (min)
Dough temperature (°C) HI 977PBW 373
Figure 1. Mixolab curves of extra strong (HI 977) and weak (PBW 373) bread making wheat varieties.
V. Dhaka and B.S. Khatkar
318 Quality Assurance and Safety of Crops & Foods 5 (4)
present study, it was observed that wheat varieties having subunits 2+12 at Glu-D1 had weaker doughs and lower SLV. However, some wheat varieties such as WH 283 and WH 147, although having subunits 2+12, produced strong doughs with good SLV (Table 1). Another noteworthy observation was that wheat varieties PBW 343 and PBW 373 (Glu-1 score 9) both have the same high molecular
weight glutenin subunits (HMWGS) composition 1, 7+9 and 5+10, but PBW 373 produced weaker dough (confirmed by Mixolab as well as gluten quality parameters) and poor SLV, which may be attributed to its low glutenin/gliadin ratio of 0.48 as compared to glutenin/gliadin ratio of 0.79 in case of variety PBW 343. It was a general observation that varieties with a higher Glu-1 score (Table 4) and having HMWGS
Table 3. Correlation coefficient among Mixolab parameters and other quality attributes.
DDT DSt C2 C3 C4 C5 PC SDS WG DG GI RE FN DS GLU/GLI
BF SLV
DDT 1DSt 0.933** 1C2 0.794** 0.869** 1C3 -0.073 -0.008 -0.052 1C4 -0.209 -0.107 -0.226 0.138 1C5 -0.021 0.142 0.094 0.593* 0.708** 1PC 0.610* 0.588* 0.493 -0.097 -0.091 0.172 1SDS 0.688** 0.758** 0.815** 0.181 -0.376 0.018 0.622* 1WG 0.105 0.047 0.048 -0.482 -0.276 -0.362 0.593* 0.256 1DG 0.206 0.126 0.141 -0.419 -0.251 -0.292 0.640* 0.341 0.948** 1GI 0.687** 0.758** 0.727** 0.282 -0.257 0.181 0.575* 0.885** -0.006 0.137 1RE 0.664** 0.746** 0.796** -0.092 -0.227 -0.018 0.426 0.752** -0.053 0.065 0.847** 1FN 0.550* 0.451 0.294 -0.382 -0.117 -0.237 0.347 0.154 0.459 0.507 0.102 0.153 1DS 0.212 0.193 0.150 -0.640* -0.362 -0.646** -0.122 -0.054 0.138 0.016 -0.203 0.136 0.322 1GLU/GLI 0.834** 0.832** 0.735** 0.125 -0.413 0.042 0.551* 0.708** 0.077 0.192 0.762** 0.684** 0.435 0.07 1BF -0.820** -0.864** -0.824** -0.111 0.229 -0.201 -0.654** -0.795** -0.153 -0.183 -0.753** -0.634* -0.268 0 -0.814** 1SLV 0.880** 0.942** 0.890** 0.135 -0.158 0.222 0.601* 0.829** -0.007 0.056 0.833** 0.751** 0.259 0.046 0.802** -0.952** 1
BF = bread firmness; C2 = protein weakening; C3 = starch gelatinisation; C4 = amylase activity; C5 = starch gelling; DDT = dough development time; DG = dry gluten; DS = damaged starch; DSt = dough stability; FN = falling number; GI = gluten index; Glu/Glia = glutenin/gliadin; PC = protein content; R/E = resistance/ extensibility; SDS = sodium dodecyl sedimentation volume; SLV = specific loaf volume; WG = wet gluten.* Correlation is significant at 0.05 level; ** Correlation is significant at 0.01 level.
205 kDA
97.4 kDA
66 kDA
43 kDA
29 kDA
M 1 2 3 5 6 7 8 9 1110 12 13 14 154
HMWgluteninsubunits
ω-gliadins
LMWgluteninsubunits
Figure 2. SDS-PAGE patterns of reduced gluten proteins from different wheat varieties. The varieties are in lanes 1 to 15: 1 = C 306; 2 = PBW 373; 3 = HI 977; 4 = DBW 16; 5 = WH 542; 6 = PBW 343; 7 = WH 1025; 8 = PBW 550; 9 = PBW 443; 10 = HW 2004; 11 = WH 283; 12 = WH 711; 13 = WH 147; 14 = HS 490; 15 = WH 1021; M = marker.
Mixolab thermomechanical characteristics of dough from Indian wheat varieties
Quality Assurance and Safety of Crops & Foods 5 (4) 319
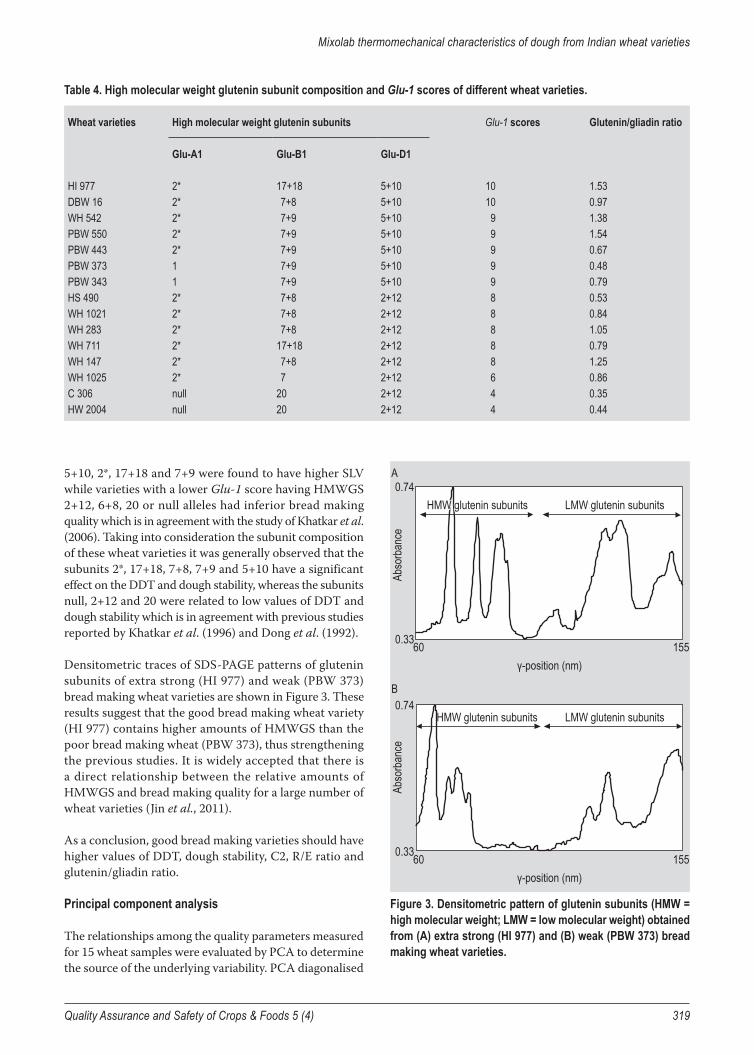
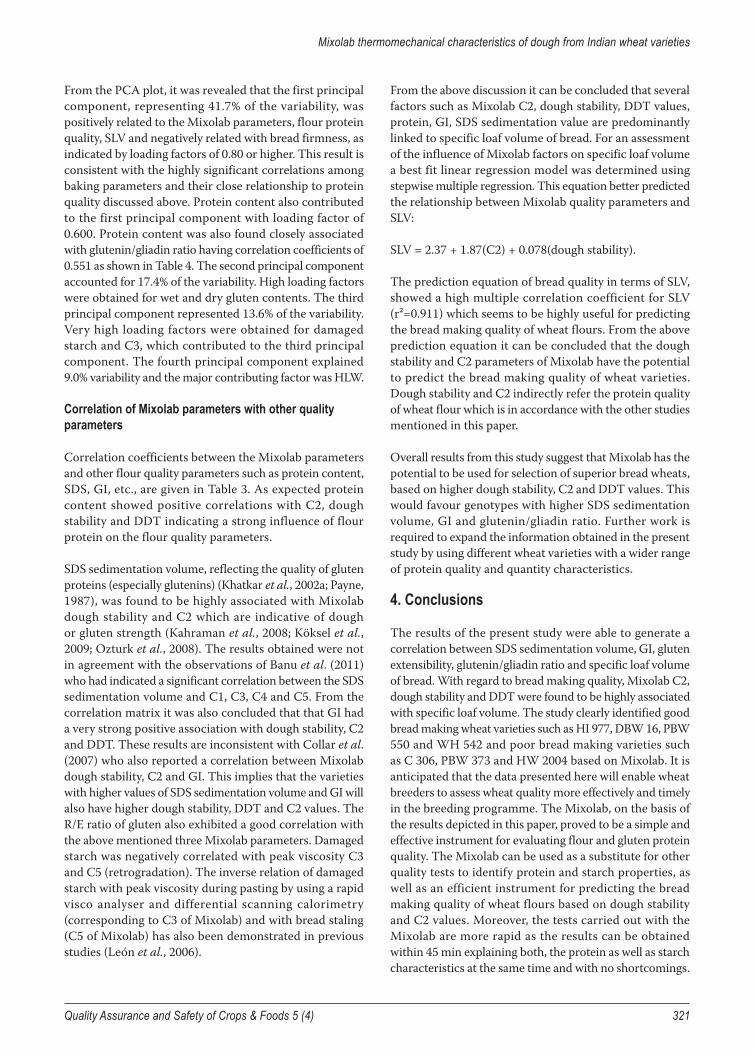
5+10, 2*, 17+18 and 7+9 were found to have higher SLV while varieties with a lower Glu-1 score having HMWGS 2+12, 6+8, 20 or null alleles had inferior bread making quality which is in agreement with the study of Khatkar et al. (2006). Taking into consideration the subunit composition of these wheat varieties it was generally observed that the subunits 2*, 17+18, 7+8, 7+9 and 5+10 have a significant effect on the DDT and dough stability, whereas the subunits null, 2+12 and 20 were related to low values of DDT and dough stability which is in agreement with previous studies reported by Khatkar et al. (1996) and Dong et al. (1992).
Densitometric traces of SDS-PAGE patterns of glutenin subunits of extra strong (HI 977) and weak (PBW 373) bread making wheat varieties are shown in Figure 3. These results suggest that the good bread making wheat variety (HI 977) contains higher amounts of HMWGS than the poor bread making wheat (PBW 373), thus strengthening the previous studies. It is widely accepted that there is a direct relationship between the relative amounts of HMWGS and bread making quality for a large number of wheat varieties (Jin et al., 2011).
As a conclusion, good bread making varieties should have higher values of DDT, dough stability, C2, R/E ratio and glutenin/gliadin ratio.
Principal component analysis
The relationships among the quality parameters measured for 15 wheat samples were evaluated by PCA to determine the source of the underlying variability. PCA diagonalised
Table 4. High molecular weight glutenin subunit composition and Glu-1 scores of different wheat varieties.
Wheat varieties High molecular weight glutenin subunits Glu-1 scores Glutenin/gliadin ratio
Glu-A1 Glu-B1 Glu-D1
HI 977 2* 17+18 5+10 10 1.53DBW 16 2* 7+8 5+10 10 0.97WH 542 2* 7+9 5+10 9 1.38PBW 550 2* 7+9 5+10 9 1.54PBW 443 2* 7+9 5+10 9 0.67PBW 373 1 7+9 5+10 9 0.48PBW 343 1 7+9 5+10 9 0.79HS 490 2* 7+8 2+12 8 0.53WH 1021 2* 7+8 2+12 8 0.84WH 283 2* 7+8 2+12 8 1.05WH 711 2* 17+18 2+12 8 0.79WH 147 2* 7+8 2+12 8 1.25WH 1025 2* 7 2+12 6 0.86C 306 null 20 2+12 4 0.35HW 2004 null 20 2+12 4 0.44
Abso
rban
ce
0.33
0.74
γ-position (nm) 60 155
HMW glutenin subunits LMW glutenin subunits
HMW glutenin subunits LMW glutenin subunitsHMW glutenin subunits LMW glutenin subunits
A
Abso
rban
ce
0.33
0.74
γ-position (nm) 60 155
B
Figure 3. Densitometric pattern of glutenin subunits (HMW = high molecular weight; LMW = low molecular weight) obtained from (A) extra strong (HI 977) and (B) weak (PBW 373) bread making wheat varieties.
V. Dhaka and B.S. Khatkar
320 Quality Assurance and Safety of Crops & Foods 5 (4)
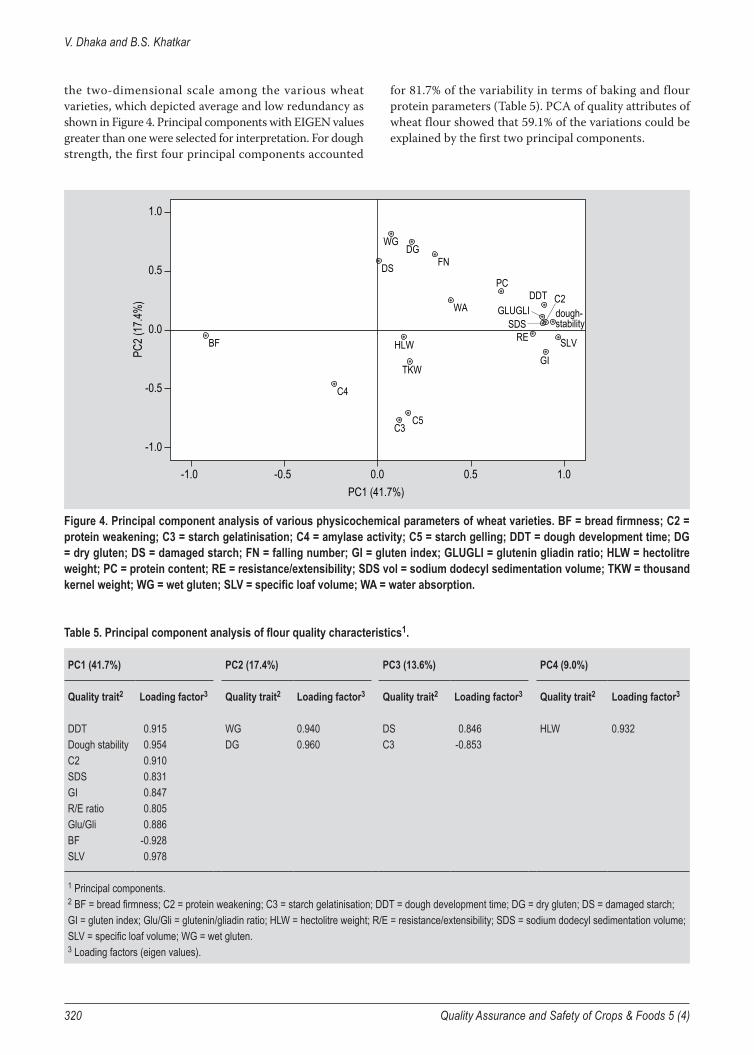
the two-dimensional scale among the various wheat varieties, which depicted average and low redundancy as shown in Figure 4. Principal components with EIGEN values greater than one were selected for interpretation. For dough strength, the first four principal components accounted
for 81.7% of the variability in terms of baking and flour protein parameters (Table 5). PCA of quality attributes of wheat flour showed that 59.1% of the variations could be explained by the first two principal components.
PC1 (41.7%)1.00.50.0-0.5-1.0
PC2 (
17.4%
)
1.0
0.5
0.0
-0.5
-1.0
WA
HLW
TKW
SLVBF
GLUGLI
DS FN
RE
GI
DGWG
SDS
PC
C5
C4
C3
C2dough-stability
DDT
Figure 4. Principal component analysis of various physicochemical parameters of wheat varieties. BF = bread firmness; C2 = protein weakening; C3 = starch gelatinisation; C4 = amylase activity; C5 = starch gelling; DDT = dough development time; DG = dry gluten; DS = damaged starch; FN = falling number; GI = gluten index; GLUGLI = glutenin gliadin ratio; HLW = hectolitre weight; PC = protein content; RE = resistance/extensibility; SDS vol = sodium dodecyl sedimentation volume; TKW = thousand kernel weight; WG = wet gluten; SLV = specific loaf volume; WA = water absorption.
Table 5. Principal component analysis of flour quality characteristics1.
PC1 (41.7%) PC2 (17.4%) PC3 (13.6%) PC4 (9.0%)
Quality trait2 Loading factor3 Quality trait2 Loading factor3 Quality trait2 Loading factor3 Quality trait2 Loading factor3
DDT 0.915 WG 0.940 DS 0.846 HLW 0.932Dough stability 0.954 DG 0.960 C3 -0.853C2 0.910SDS 0.831GI 0.847R/E ratio 0.805Glu/Gli 0.886BF -0.928SLV 0.978
1 Principal components.2 BF = bread firmness; C2 = protein weakening; C3 = starch gelatinisation; DDT = dough development time; DG = dry gluten; DS = damaged starch; GI = gluten index; Glu/Gli = glutenin/gliadin ratio; HLW = hectolitre weight; R/E = resistance/extensibility; SDS = sodium dodecyl sedimentation volume; SLV = specific loaf volume; WG = wet gluten.3 Loading factors (eigen values).
Mixolab thermomechanical characteristics of dough from Indian wheat varieties
Quality Assurance and Safety of Crops & Foods 5 (4) 321
From the PCA plot, it was revealed that the first principal component, representing 41.7% of the variability, was positively related to the Mixolab parameters, flour protein quality, SLV and negatively related with bread firmness, as indicated by loading factors of 0.80 or higher. This result is consistent with the highly significant correlations among baking parameters and their close relationship to protein quality discussed above. Protein content also contributed to the first principal component with loading factor of 0.600. Protein content was also found closely associated with glutenin/gliadin ratio having correlation coefficients of 0.551 as shown in Table 4. The second principal component accounted for 17.4% of the variability. High loading factors were obtained for wet and dry gluten contents. The third principal component represented 13.6% of the variability. Very high loading factors were obtained for damaged starch and C3, which contributed to the third principal component. The fourth principal component explained 9.0% variability and the major contributing factor was HLW.
Correlation of Mixolab parameters with other quality parameters
Correlation coefficients between the Mixolab parameters and other flour quality parameters such as protein content, SDS, GI, etc., are given in Table 3. As expected protein content showed positive correlations with C2, dough stability and DDT indicating a strong influence of flour protein on the flour quality parameters.
SDS sedimentation volume, reflecting the quality of gluten proteins (especially glutenins) (Khatkar et al., 2002a; Payne, 1987), was found to be highly associated with Mixolab dough stability and C2 which are indicative of dough or gluten strength (Kahraman et al., 2008; Köksel et al., 2009; Ozturk et al., 2008). The results obtained were not in agreement with the observations of Banu et al. (2011) who had indicated a significant correlation between the SDS sedimentation volume and C1, C3, C4 and C5. From the correlation matrix it was also concluded that that GI had a very strong positive association with dough stability, C2 and DDT. These results are inconsistent with Collar et al. (2007) who also reported a correlation between Mixolab dough stability, C2 and GI. This implies that the varieties with higher values of SDS sedimentation volume and GI will also have higher dough stability, DDT and C2 values. The R/E ratio of gluten also exhibited a good correlation with the above mentioned three Mixolab parameters. Damaged starch was negatively correlated with peak viscosity C3 and C5 (retrogradation). The inverse relation of damaged starch with peak viscosity during pasting by using a rapid visco analyser and differential scanning calorimetry (corresponding to C3 of Mixolab) and with bread staling (C5 of Mixolab) has also been demonstrated in previous studies (León et al., 2006).
From the above discussion it can be concluded that several factors such as Mixolab C2, dough stability, DDT values, protein, GI, SDS sedimentation value are predominantly linked to specific loaf volume of bread. For an assessment of the influence of Mixolab factors on specific loaf volume a best fit linear regression model was determined using stepwise multiple regression. This equation better predicted the relationship between Mixolab quality parameters and SLV:
SLV = 2.37 + 1.87(C2) + 0.078(dough stability).
The prediction equation of bread quality in terms of SLV, showed a high multiple correlation coefficient for SLV (r²=0.911) which seems to be highly useful for predicting the bread making quality of wheat flours. From the above prediction equation it can be concluded that the dough stability and C2 parameters of Mixolab have the potential to predict the bread making quality of wheat varieties. Dough stability and C2 indirectly refer the protein quality of wheat flour which is in accordance with the other studies mentioned in this paper.
Overall results from this study suggest that Mixolab has the potential to be used for selection of superior bread wheats, based on higher dough stability, C2 and DDT values. This would favour genotypes with higher SDS sedimentation volume, GI and glutenin/gliadin ratio. Further work is required to expand the information obtained in the present study by using different wheat varieties with a wider range of protein quality and quantity characteristics.
4. Conclusions
The results of the present study were able to generate a correlation between SDS sedimentation volume, GI, gluten extensibility, glutenin/gliadin ratio and specific loaf volume of bread. With regard to bread making quality, Mixolab C2, dough stability and DDT were found to be highly associated with specific loaf volume. The study clearly identified good bread making wheat varieties such as HI 977, DBW 16, PBW 550 and WH 542 and poor bread making varieties such as C 306, PBW 373 and HW 2004 based on Mixolab. It is anticipated that the data presented here will enable wheat breeders to assess wheat quality more effectively and timely in the breeding programme. The Mixolab, on the basis of the results depicted in this paper, proved to be a simple and effective instrument for evaluating flour and gluten protein quality. The Mixolab can be used as a substitute for other quality tests to identify protein and starch properties, as well as an efficient instrument for predicting the bread making quality of wheat flours based on dough stability and C2 values. Moreover, the tests carried out with the Mixolab are more rapid as the results can be obtained within 45 min explaining both, the protein as well as starch characteristics at the same time and with no shortcomings.
V. Dhaka and B.S. Khatkar
322 Quality Assurance and Safety of Crops & Foods 5 (4)
However, much more detailed work is required to expand the information obtained in the present study using a large number of wheat varieties grown in different locations as well as site to site variation within variety.
Acknowledgement
Author Vandana Dhaka is grateful for the Sir C.V Raman scholarship from the Department of Technical Education, Haryana, India.
References
Abdel-Samie, M.A., Wan, J.J., Huang, W.N., Chung, K.O. and Xu, B.C., 2010. Effects of cumin and ginger as antioxidants on dough mixing properties and cookie quality. Cereal Chemistry 87: 454-460.
Anderssen, R.S., Bekes, F., Gras, P.W., Nikolov, A. and Wood, J.T., 2004. Wheat-flour dough extensibility as a discriminator for wheat varieties. Journal of Cereal Science 39: 195-203.
Angioloni, A. and Collar, C., 2009. Significance of structuring/prebiotic blends on bread dough thermo-mechanical profile. European Food Research and Technology 229: 603-610.
Axford, D.W.E., McDermott, E.E. and Redman, D.G., 1978. Small scale tests of bread making quality. Milling Feed Fertilizer 66: 18-21.
Axford, D.W.E., McDermott, E.E. and Redman, D.G., 1979. Note on the sodium dodecyl sulphate test of bread making quality: comparison with Pelshenke and Zeleny tests. Cereal Chemistry 56: 582-584.
Banu, I., Stoenescu, G., Ionescu, V. and Aprodu, I., 2011. Estimation of the baking quality of the wheat flours based on rheological parameters of the mixolab curve. Czech Journal of Food Science 29: 35-44.
Bilgin, O. and Korkut, K.Z., 2005. Determination of some bread quality and grain yield characters in bread wheat (Triticum aestivum L.). International Journal of Agriculture and Biology 7: 125-128.
Blackman, J.A. and Gill, A.A., 1980. A comparison of some small-scale tests for breadmaking quality used in wheat breeding. Journal of Agricultural and Food Chemistry 95: 29-34.
Bonet, A., Blaszczak, W. and Roseli, C.M., 2006. Formation of homopolymers and heteropolymers between wheat flour and several protein sources by transglutaminase-catalyzed cross-linking. Cereal Chemistry 83: 655-662.
Carter, B.P., Morris, C.F. and Anderson, J.A., 1999. Optimizing the SDS sedimentation test for end-use quality selection in a soft white and club wheat-breeding program. Cereal Chemistry 76: 907-911.
Collar, C., Bollain, C. and Rosell, C.M., 2007. Rheological behaviour of formulated bread doughs during mixing and heating. Food Science and Technology International 13: 99-107.
De Villiers, O.T. and Laubscher, E.W., 1995. Use of the SDS test to predict the protein content and bread volume of wheat varieties. South African Journal of Plant and Soil 12: 140-142.
Dexter, J.E., Matsuo, R.R., Kosmolak, F.G., Leisle, D. and Marchylo, B.A., 1980. The suitability of the SDS-sedimentation test for assessing gluten strength in durum wheat. Canadian Journal of Plant Science 60: 25-29.
Dobraszczyk, B.J. and Salmanowicz, B.P., 2011. Comparison of predictions of baking volume using large deformation rheological properties. Journal of Cereal Science 47: 292-301.
Dong, H., Sears, R.G., Hoseney, R.C., Lookhart, G.I. and Shogren, M.D., 1992. Relationships between protein composition and mixograph and loaf characteristics in wheat. Cereal Chemistry 69: 132-136.
Faergestad, E.M., Molteberg, E.L. and Magnus, E.M., 2000. Interrelationships of protein composition, protein level, baking process and the characteristics of hearth bread and pan bread. Journal of Cereal Science 31: 309-320.
Finney, K.F., 1984. An optimized, straight dough, bread making method after 44 years. Cereal Chemistry 61: 20-27.
Greenaway, W.T., Hurst, N.S., Neustadt, M.H. and Zeleny, L., 1966. Micro sedimentation test for wheat. Cereal Science Today 11: 197-199.
Huang, W.N., Li, L.L., Wang, F., Wan, J.J., Tilley, M., Ren, C.Z. and Wu, S.Q., 2010. Effect of transglutaminase on rheological and mixolab thermomechanical characteristics of oat dough. Food Chemistry 121: 934-939.
Jia, C., Huang, W., Samie, M.A., Huang, G. and Huang, G., 2011. Dough rheological, Mixolab mixing, and nutritional characteristics of almond cookies with and without xylanase. Journal of Food Engineering 105: 227-232.
Jin, H., Yan, J., Peña, R.J., Xia, X.C., Morgounov, A., Han, L.M., Zhang, Y. and He, Z.H., 2011. Molecular detection of high- and low-molecular-weight glutenin subunit genes in common wheat cultivars from 20 countries using allele-specific markers. Crop and Pasture Science 62: 746-754.
Kahraman, K., Sakıyan, O., Ozturk, S., Köksel, H., Sumnu, G. and Dubat, A., 2008. Utilization of Mixolab to predict the suitability of flours in terms of cake quality. European Food Research and Technology 227: 565-570.
Kasarda, D.D., 1994. Glutenin structure in relation to wheat quality. In: Pomeranz, Y. (ed.) Wheat is unique. AACC, St. Paul, MN, USA, pp. 73-106.
Khatkar, B.S., 2006. Effects of high Mr glutenin subunits on dynamic rheological properties and bread making qualities of wheat gluten. Journal of Food Science and Technology 43: 382-387.
Khatkar, B.S., Bell, A.E. and Schofield, J.D., 1996. A comparative study of the inter- relationships between mixograph parameters and bread making qualities of wheat flours and glutens. Journal of the Science of Food and Agriculture 72: 71-85.
Khatkar, B.S., Fido, R.J., Tatham, A.S. and Schofield, J.D., 2002a. Functional properties of wheat gliadins. I. Effects on mixing characteristics and bread making quality. Journal of Cereal Science 35: 299-306.
Khatkar, B.S., Fido, R.J., Tatham, A.S. and Schofield, J.D., 2002b. Functional properties of wheat gliadins. II. Effects on dynamic rheological properties of wheat gluten. Journal of Cereal Science 35: 307-313.
Khatkar, B.S. and Schofield, J.D., 2002. Dynamic rheology of wheat flour dough. I. Non-linear viscoelastic behaviour. Journal of the Science of Food and Agriculture 82: 827-829.
Köksel, H., Kahraman, K., Sanal, T., Ozay, D.S. and Dubat, A., 2009. Potential utilization of mixolab for quality evaluation of bread wheat genotypes. Cereal Chemistry 86: 522-526.
Mixolab thermomechanical characteristics of dough from Indian wheat varieties
Quality Assurance and Safety of Crops & Foods 5 (4) 323
Krattiger, A.F. and Law, C.N., 1991. The effects of adding NaCl and 2-mercaptoethanol and of other modifications to the SDS-sedimentation test. In: Bushuk, W. and Tkachuk, R. (eds.) Gluten proteins. AACC, St. Paul, MN, USA, pp. 156-159.
Ktenioudaki, A., Butler, F. and Gallagher, E., 2010. Rheological properties and baking quality of wheat varieties from various geographical regions. Journal of Cereal Science 51: 402-408.
León, A., Barrera, G., Pérez, G., Ribotta, P. and Rosell, C., 2006. Effect of damaged starch levels on flour-thermal behaviour and bread staling. European Food Research and Technology 224: 187-192.
Lorenzo, A. and Kronstad, W.E., 1987. Reliability of two laboratory techniques to predict bread wheat protein quality in nontraditional growing areas. Crop Science 27: 247-252.
Lundh, G. and MacRitchie, F., 1989. Size exclusion HPLC characterisation of gluten protein fractions varying in bread making potential. Journal of Cereal Science 10: 247-253.
Manthey, F., Tulbek, M.C. and Sorenson, B., 2006. Evaluation of US durum wheat quality with mixolab. In: Proceedings of AACC International Annual Meeting, World grain summit: foods and beverages. AACC, St. Paul, MN, USA, p. 336. Available at: http://www.wgsummit.org/program/pdfs/ProgramBook.pdf.
Matuz, J., 1998. Inheritance of SDS sedimentation volume of flour in crosses of winter wheat (Triticum aestivum L.). Cereal Research Communications 26: 203-210.
McDermott, E.E. and Redman, D.G., 1977. Small-scale tests of bread making quality. Flour Milling and Baking Research Association 6: 200-213.
Moonen, J.H.E., Scheepstra, A. and Graveland, A., 1982. Use of the SDS-sedimentation tests and SDS-polyacrylamide gel electrophoresis for screening breeder’s samples of wheat for bread-making quality. Euphytica 31: 677-690.
Moreira, R., Chenlo, F. and Torres, M.D., 2011. Effect of sodium chloride, sucrose and chestnut starch on rheological properties of chestnut flour doughs. Food Hydrocolloids 25: 1041-1050.
Morris, C.F., Paszczynska, B., Bettge, A. and King, G.E., 2007. A critical examination of sodium dodecyl sulfate (SDS) sedimentation test for wheat meals. Journal of the Science of Food and Agriculture 87: 607-615.
Nash, D., Lanning, S.P., Fox, P., Martin, J.M., Blake, N.K., Souza, E., Graybosch, R.A., Giroux, M.L. and Talbert, L.E., 2006. Relationship of dough extensibility to dough strength in a spring wheat cross. Cereal Chemistry 8: 255-258.
O’Brien, L. and Ronalds, J.A., 1979. Heritabilities of small-scale and standard measures of wheat quality for early generation selection. Australian Journal of Agricultural Research 38: 801-808.
Osborne, T.B., 1907. The proteins of the wheat kernel. Carnegie Institution of Washington Publication 84: 1-119.
Ozturk, S., Kahraman, K., Tiftik, B. and Köksel, H., 2008. Predicting the cookie quality of flours by using Mixolab. European Food Research and Technology 227: 1549-1554.
Payne, P.I., 1987. Genetics of wheat storage proteins and the effect of allelic variation on bread-making quality. Annual Review of Plant Physiology 38: 141-153.
Pena, R.J., Cervantes-Espinoza, M.I., Ortiz-Monasterio, J.I. and Dubat, A., 2006. Gluten composition, gluten quality, and dough mixing properties (National-Mixograph; Chopin- Mixolab) of high yielding wheats derived from crosses between common (Triticum aestivum) and synthetic (T. dicoccon × Aegilops tauschii) wheats. In: Proceedings of the Eucarpia Cereal Section Cereal Science and Technology for Feeding Ten Billion People: genomics era and beyond, Lleida, Spain. Available at: http://om.ciheam.org/om/pdf/a81/00800878.pdf.
Pickney, A.J., Greenaway, W.T. and Zeleny, L., 1957. Further developments in the sedimentation test for wheat quality. Cereal Chemistry 34: 16-24.
Rosell, C.M., Collar, C. and Haros, M., 2007. Assessment of hydrocolloid effects on the thermo-mechanical properties of wheat using the mixolab. Food Hydrocolloids 21: 452-462.
Schofield, J.D., 1994. Wheat proteins: structure and functionality in milling and bread making. In: Bushuk, W. and Rasper, V. (eds.) Wheat: production, composition and utilisation. Blackie Academic and Professional, Glasgow, UK, pp. 73-106.
Suchy, J., Lukow, O.M. and Ingelin, M.E., 2000. Dough microextensibility method using a 2-g mixograph and a texture analyzer. Cereal Chemistry 77: 39-43.
Takata, K., Yamauchi, H., Nishio, Z. and Kuwabara, T., 2001. Prediction of bread-making quality by prolonged swelling SDS-sedimentation test. Breeding Science 49: 221-223.
Treml, M.C., Glover, K.D., Krishnan, P.G., Hareland, G.A., Bondalapati, K.D. and Stein, J., 2006. Effect of wheat genotype and environment on relationships between dough extensibility and breadmaking quality. Cereal Chemistry 88: 201-208.
Tulbek, M.C. and Hall, C., 2006. Mixolab as a tool to investigate the effects of milled flaxseed on the rheological properties of dough. In: Proceedings of AACC International Annual Meeting, World grain summit: foods and beverages. AACC, St. Paul, MN, USA, p. 140. Available at: http://www.wgsummit.org/program/pdfs/ProgramBook.pdf.


![Thermomechanical Analysis [TMA] [NETZSCH]](https://img.pdfslide.us/doc/110x75/55cf940b550346f57b9f3bd8/thermomechanical-analysis-tma-netzsch.jpg)