Embed Size (px)
Citation preview
Mixed Petroleum Hydrocarbons and Biomass Derived Compounds Used in the Thermal
Catalytic Steam Cracking (TCSC) Process for the Production of Light Olefins
HaiTao Yan
A Thesis
in
The Department
of
Chemistry and Biochemistry
Presented in Partial Fulfillment of the Requirements
for the Degree of Doctor of Philosophy (Chemistry) at
Concordia University
Montreal, Quebec, Canada
October 2012
HaiTao Yan, 2012
CONCORDIA UNIVERSITY SCHOOL OF GRADUATE STUDIES
This is to certify that the thesis prepared By: HaiTao Yan
Entitled: Mixed Petroleum Hydrocarbons and Biomass Derived Compounds Used in the Thermal Catalytic Steam Cracking (TCSC) Process for the Production of Light Olefins
and submitted in partial fulfillment of the requirements for the degree of
DOCTOR OF PHILOSOPHY (Chemistry) complies with the regulations of the University and meets the accepted standards with respect to originality and quality. Signed by the final examining committee:
Chair Dr. A. Chapman External Examiner Dr. D. Zargarian External to Program Dr. L. Kalman Examiner Dr. X. Ottenwaelder Examiner Dr. L. Cuccia Thesis Supervisor Dr. R. Le Van Mao Approved by
Dr. H. Muchall, Graduate Program Director
December 18, 2012
Dr. B. Lewis, Dean, Faculty of Arts and Science
iii
ABSTRACT
Mixed Petroleum Hydrocarbons and Biomass Derived Compounds Used in the Thermal
Catalytic Steam Cracking (TCSC) Process for the Production of Light Olefins
HaiTao Yan
Light olefins and diolefins such as ethylene, propylene, butenes and 1,3-butadiene
are considered as the backbone of the petrochemical industry as they are precursors of
numerous plastic materials, synthetic fibers, and rubbers. The most prevalent
technologies for producing these precursors are steam cracking and fluid catalytic
cracking using petroleum-based feedstock like light naphtha and gas oil. However,
petroleum based feeds have several problems in terms of limited reserves, environmental
pollution and economic and geopolitical problems. Therefore, it is imperative to find an
alternative source, which may be able to overcome the limitation of petroleum oil.
In the current work, hydrocarbons-alcohol mixed feeds have been used in the
Thermal-Catalytic/Steam-Cracking (TCSC) process for the production of propylene and
ethylene. Alcohols like methanol and ethanol can be obtained from biomass, a potential
sustainable and renewable source, through gasification and/or fermentation, and they can
also be produced from natural gas and coal which are longer lasting fossil fuels than
petroleum. The results from on-stream cracking of mixed feedstocks indicated difference
in behaviors of ethanol and methanol. While ethanol undergoes predominantly
dehydration into ethylene, methanol predominantly intervenes directly on reactions
involving hydrocarbons (reactants and their intermediates). Moreover, the addition of
iv
methanol to hydrocarbons feedstock significantly increased the product yield of C2-C4
olefins, particularly that of ethylene and propylene. However, there was a maximum limit
of efficiency for the methanol content in the mixed feed. Over 25wt% of methanol, the
beneficial effect was not as important as expected. In addition, the increasing presence of
methanol in the feed significantly accelerated the kinetics of the catalytic cracking. The
gradual and significant decrease of the apparent activation energy with increasing
methanol concentration in the mixed feed was attributed to the effect of intensive
interactions between the hydrocarbons and methanol. These results demonstrated the
possibility of partial replacement of petroleum based feedstocks by methanol for the
production of propylene and ethylene. In the last part of this work, co-processing biomass
derived glycerol with hydrocarbon feedstock over TCSC process was studied. It was
found that glycerol as an additive to hydrocarbon feed, can be beneficial till a content of
30 wt%. However, the main concern is the rapid catalyst decay caused by formation of
coke. Therefore, there is a need for a more advanced hybrid catalyst having higher
hydrogen spillover activity.
v
PROFESSIONAL ACKNOWLEDGMENTS
First and foremost, I would like to express my extreme gratitude to my supervisor
Prof. Raymond Le Van Mao for giving me the opportunity to work in his lab over the
past six years. I would like to thank you for introducing me to the world of catalysis,
petroleum chemistry and zeolites. I also want to thank you for your guidance,
encouragement, kindness, and patience during my time at Concordia University. Without
your valuable insight and input, as well as your extensive expertise, this work would not
have been possible or might not have ever come to fruition.
I cannot fail to mention my thesis committee members, Prof. Louis A. Cuccia and
Prof. Xavier Ottenwaelder. I would like to express my thanks and appreciation for their
endless helpful suggestions, encouragement and support throughout the course of this
degree.
I would like to sincerely thank the current and past Industrial Catalysis Group: Dr.
Dora Petraccone, and Dr. Nabil Al-Yassir. Thank you for your support, helpful advices.
I would like to express my sincere appreciation to the Science Technical Center:
Mr. Richard Allix, Mr. Aldo Dissegna, Mr. Gheorghe Dan Duru, Mr. Chris Kowalewski,
and Mr. Robert Pisarsky. I always had a tremendous respect for your endless support, and
my words cannot entirely express my sincere gratitude.

vi
PERSONAL ACKNOWLEDGMENTS
Needless to say, this entire Ph.D. dissertation would be at most a dream if there
were not my mother Hua Mei. I do not know how to start this, but I do know that no
matter how much I say, or how long it will take me to finish it, my words will not be
enough or definitely will run out before I adequately express my deep gratitude and
appreciation to my mother. You have supported me in many, many ways and this Ph.D. is
as much as yours as it is mine. Your countless emotional and moral support, endless love,
and unconditional sacrifice are the reasons why I make it to this point in my life. Your
encouragement meant the whole to me. You have waited so long for this moment to come
true; I am glad that your waiting has finally been rewarded.
vii
“No matter who wrote it, there’s nothing we can’t make intelligible.”
{Pinball, 1973/Murakami Haruki}
“The introduction to Bonus Light, that exegesis of pinball, has this to say:
There is precious little you can gain from a pinball machine. Only some lights that
convert to a score count. On the other hand, there is a great deal to lose. All the coppers
you’d ever need to erect statues of every president in history (provided, of course, you
thought well enough to erect a statue of Richard M. Nixon), not to mention a lot of
valuable and nonreturnable time.
While you’re playing yourself out in lonesome dissipation in front of a pinball
machine, someone else might be reading through Proust. Still another might be engaged
in heavy petting with a girlfriend at a drive-in theater showing of Paths of Courage. The
one could well become a writer, witness to the age; the others, a happily married couple.
Pinball machines, however, won’t lead you anywhere. Just the replay light.
Replay, replay, replay …. So persistently you’d swear a game of pinball aspired to
perpetuity.
We ourselves will never know much of perpetuity. But we can get a faint inkling
of what it’s like.
The object of pinball lies not in self-expression, but in self-revolt. Not in the
expansion of the ego, but in its compression. Not in extractive analysis, but in inclusive
subsumption.
So if it’s self-expression or ego expansion or analysis you’re after, you’ll only be
subjected to the merciless retaliation of the tilt lamps.
Have a good game.”
{Pinball, 1973/Murakami Haruki}

viii
Not for anyone, just for myself.
ix
TABLE OF CONTENTS
LIST OF FIGURES ........................................................................................................ xvii
LIST OF TABLES ............................................................................................................ xx
CONTRIBUTIONS OF AUTHORS .............................................................................. xxii
CHAPTER I ....................................................................................................................... 1
GENERAL INTRODUCTION ........................................................................................ 1
1.1. PREAMBLE ................................................................................................................ 2
1.2 Current Technologies for the Production of Light Olefins ........................................... 3
1.2.1 The Significance of Light Olefins in Petrochemical Industry ................................... 3
1.2.2 The Demand and Main Technologies for the Production of Ethylene and Propylene
............................................................................................................................................. 6
1.3 The Thermo-Catalytic/Steam-cracking (TCSC) Process and The Hybrid Catalysts .. 16
1.3.1 Overview of the TCSC Process ............................................................................... 16
1.3.2 Hybrid Catalysts: Concepts of Pore Continuum and Hydrogen Spillover .............. 16
1.3.2.1 Pore Continuum Effect ......................................................................................... 16
1.3.2.2 Hydrogen Spillover Effect .................................................................................... 16
1.4 Problems of the Current Light Olefins Industry and Solution .................................... 21
1.4.1 Problems of the Current Light Olefins Industry ...................................................... 21
1.4.2 Current Feedstocks Used by the Light Olefin Industry ........................................... 22
x
1.4.3 Biomass Derived Compounds as Feed Additives for the Production of Light Olefins
........................................................................................................................................... 23
1.5. OUTLINE .................................................................................................................. 26
Chapter II ...................................................................................................................... 31
Review: Design of TCSC Hybrid Catalysts and Phenomenon of Hydrogen Spillover .................................................................................................... 31
2.1 INTRODUCTION ...................................................................................................... 32
2.2 EXPERIMENTAL ...................................................................................................... 34
2.2.1 Catalyst Preparation ................................................................................................. 34
2.2.1.1 Main Catalyst Component (M-cat) ....................................................................... 34
2.2.1.2 Co-catalyst (Co-Cat) ............................................................................................. 34
2.2.1.3 Hybrid Catalyst (Z-HYB) and Reference Catalyst (Z-REF) ................................ 35
2.2.2 Catalyst Characterization ......................................................................................... 35
2.2.2.1 Chemical Composition.......................................................................................... 35
2.2.2.2 Physical Properties ................................................................................................ 35
2.2.2.3 Acid Sites Properties ............................................................................................. 36
2.2.2.4 Study of Coke Deposition ..................................................................................... 36
2.2.3 Experimental Setup and Testing Procedure ............................................................. 37
2.3 RESULTS AND DISCUSSION ................................................................................. 38
2.3.1 Main Physico-Chemical Properties of the Hybrid Catalyst Components ................ 38
xi
2.3.1.1 Determination of the Extent of the External Surface Area of the ZSM-5 Zeolite
Particles ............................................................................................................................. 38
2.3.1.2 Surface Acidity Characteristics ............................................................................. 40
2.3.2 Catalytic Performance of Various Hybrid Catalysts, Related to the Si/Al Atom
Ratio of Their Zeolite Components .................................................................................. 45
2.3.3 Multi-fact Experimental Evidence of the Beneficial Effect of the Co-catalyst ....... 48
2.3.4 Acceleration of the Coke Deposition by the “Contamination” Method .................. 49
2.4 CONCLUSION ........................................................................................................... 54
2.5 AUTHOR’S NOTES AND SIGNIFICANCE OF PAPER TO THESIS.................... 56
Chapter III .................................................................................................................... 57
“Petroleum Gas Oil – Ethanol” Blends Used as Feeds: Increased Production of Ethylene and Propylene over Catalytic Steam-Cracking (CSC) Hybrid Catalysts. Different Behaviour of Methanol in Blends with Petroleum Gas Oil ...................................................................................................... 57
3.1 INTRODUCTION ...................................................................................................... 58
3.2 EXPERIMENTAL ...................................................................................................... 60
3.2.1 Catalyst Preparation ................................................................................................. 60
3.2.1.1 Preparation of the Alumina Aerogel (Y-AS) Used as Support for the Co-catalysts
........................................................................................................................................... 60
3.2.1.2 Preparation of the Co-catalysts ............................................................................. 60
3.2.1.3 Preparation of the Main Catalyst Components ..................................................... 61
3.2.1.4 Preparation of the Final Hybrid Catalysts ............................................................. 61
xii
3.2.2 Catalyst Characterization ......................................................................................... 62
3.2.3 Experimental Setup and Testing Procedure ............................................................. 63
3.3 RESULTS AND DISCUSSION ................................................................................. 64
3.3.1 Comparison between (Ni-Ru) HYB1 and (Zn-Pd) HYB1 in terms of On-Stream
Stability ............................................................................................................................. 64
3.3.2 Effect of the Nature of the Alcohol Used in “Gas Oil-Alcohol” Feed .................... 67
3.3.3 Effect of Concentration of Ethanol or Methanol When Blended to Gas Oil ........... 67
3.3.3.1 “Gas Oil – Ethanol” Feed ..................................................................................... 67
3.3.3.2 “Gas Oil – Methanol” Feed ................................................................................... 69
3.3.4 Proposed Mechanism of Intervention of Ethanol (or Methanol) When Blended with
Gas Oil .............................................................................................................................. 70
3.3.5 Advantages of Feeding the CSC Process with “(Petroleum) Gas Oil/Ethnaol
(Bioethanol)” Blends ........................................................................................................ 74
3.4 CONCLUSION ........................................................................................................... 75
3.5 AUTHOR’S NOTES AND SIGNIFICANCE OF PAPER TO THESIS.................... 76
Chapter IV ..................................................................................................................... 78
Mixed Naphtha/Methanol Feed Used in the Thermal Catalytic/Steam Cracking (TCSC) Process for the Production of Propylene and Ethylene........................................................................................................................................... 78
4.1 INTRODUCTION ...................................................................................................... 79
4.2 EXPERIMENTAL ...................................................................................................... 81
xiii
4.2.1 Preparation of the Hybrid Catalyst .......................................................................... 81
4.2.1.1 Main Catalyst Component (M-Cat) ...................................................................... 81
4.2.1.2 Co-catalyst (Co-Cat) ............................................................................................. 82
4.2.1.3 Final Hybrid Catalyst ............................................................................................ 82
4.2.2 Catalyst Characteization .......................................................................................... 82
4.2.3 “Petroleum Light Naphtha – Methanol” Mixed Feeds ............................................ 83
4.2.4 Experimental Set-up and Testing Procedure ............................................................ 83
4.3 RESULTS AND DISCUSSION ................................................................................. 85
4.3.1 Data of Total Conversion as a Function of Contact Time and Recorded at Various
Temperatures Investigated ................................................................................................ 85
4.3.2 Data of Production Yields as Functions of Contact Time and Recorded at Various
Temperatures Investigated ................................................................................................ 88
4.3.3 Coke Deposition....................................................................................................... 94
4.4 CONCLUSION ........................................................................................................... 98
4.5 AUTHOR’S NOTES AND SIGNIFICANCE OF PAPER TO THESIS.................... 99
Chapter V .................................................................................................................... 101
Catalytic Compatibility of Methanol with Petroleum Naphtha in Mixed Feeds Used in the Thermal-Catalytic/Steam-Cracking (TCSC) Process for the Production of Propylene and Ethylene .............................................. 101
5.1 INTRODUCTION .................................................................................................... 102
5.2 EXPERIMENTAL .................................................................................................... 103
xiv
5.2.1 Preparation of the Hybrid Catalyst ........................................................................ 103
5.2.2 Catalyst Characterization ....................................................................................... 104
5.2.3 Experimental Set-Up and Testing Proedure .......................................................... 104
5.2.4 Determination of the Apparent Activation Energy ................................................ 106
5.3 RESULTS AND DISCUSSION ............................................................................... 110
5.3.1 Combined Effect of Steam and High Temperature on the Textural Properties of the
Zeolite Component .......................................................................................................... 110
5.3.2 Effect of Steam Dilution on the Reactivity of “Petroleum Naphtha-Methanol”
Mixtures .......................................................................................................................... 111
5.3.2.1 Steam Dilution Effect on the Overall Catalytic Cracking .................................. 111
5.3.2.2 Steam Dilution Effect on the Thermal Cracking ................................................ 116
5.3.2.3 Effect of the Steam Dilution on the Coke Deposition onto the Catalyst Surface 116
5.3.3 Kinetic Studies ..................................................................................................... 119
5.3.3.1 Initial Rates ....................................................................................................... 119
5.3.3.2 Determination of the Apparent Activation Energy, Ea ..................................... 120
5.3.3.2.1 Thermal (Steam) Cracking ............................................................................. 120
5.3.3.2.2 Overall Catalytic Cracking ............................................................................ 122
5.3.3.3 Interpretation of the Kinetic Results ................................................................. 123
5.3.3.3.1 Thermal Cracking and Overall Catalytic Cracking ....................................... 123
5.3.3.3.2 Back to the “Hydrocarbon Pool” Mechanism ................................................ 125
xv
5.4 CONCLUSION ......................................................................................................... 128
5.5 Ongoing and Future Research Work......................................................................... 129
5.6 AUTHOR’S NOTES AND SIGNIFICANCE OF PAPER TO THESIS.................. 130
Chapter VI ................................................................................................................... 132
Blending of Non-petroleum Compounds into the Hydrocarbon Feeds Used in the Thermal Catalytic/Steam Cracking (TCSC) Process for the Selective Production of Light Olefins: Is Glycerol a Good Candidate for Blending with Petroleum Hydrocarbon Feeds? ............................................. 132
6.1 INTRODUCTION .................................................................................................... 134
6.2 EXPERIMENTAL .................................................................................................... 134
6.2.1 Preparation of the Hybrid Catalysts ....................................................................... 134
6.2.1.1 Main catalyst component (MCC) ........................................................................ 134
6.2.1.2 Co-catalyst (Co-Cat) ........................................................................................... 134
6.2.1.3 Final Hybrid Catalyst .......................................................................................... 135
6.2.2 Experimental Set-up and Testing Procedure .......................................................... 135
6.3 RESULTS AND DISCUSSION ............................................................................... 136
6.3.1 Effect of Glycerol Content in the Feed .................................................................. 136
6.3.2 Understanding the Influence of the OH Groups of Glycerol ................................. 138
6.4 CONCLUSION ......................................................................................................... 143
6.5 AUTHOR’S NOTES AND SIGNIFICANCE OF PAPER TO THESIS.................. 144
Chapter VII ................................................................................................................. 145
xvi
GENERAL CONCLUSIONS AND FUTURE WORK ............................................ 145
7.1 GENERAL CONCLUSIONS ................................................................................... 146
7.2 FUTURE WORK ...................................................................................................... 148
Chapter VIII ............................................................................................................... 152
REFERENCES .............................................................................................................. 152
xvii
LIST OF FIGURES
Figure 1 Major chemicals derived from ethylene [3] ......................................................... 5
Figure 2 Major chemicals derived form propylene [3] ....................................................... 6
Figure 3 Expected world market demand of ethylene [6] ................................................... 7
Figure 4 Expected world market demand of propylene [6] ................................................ 7
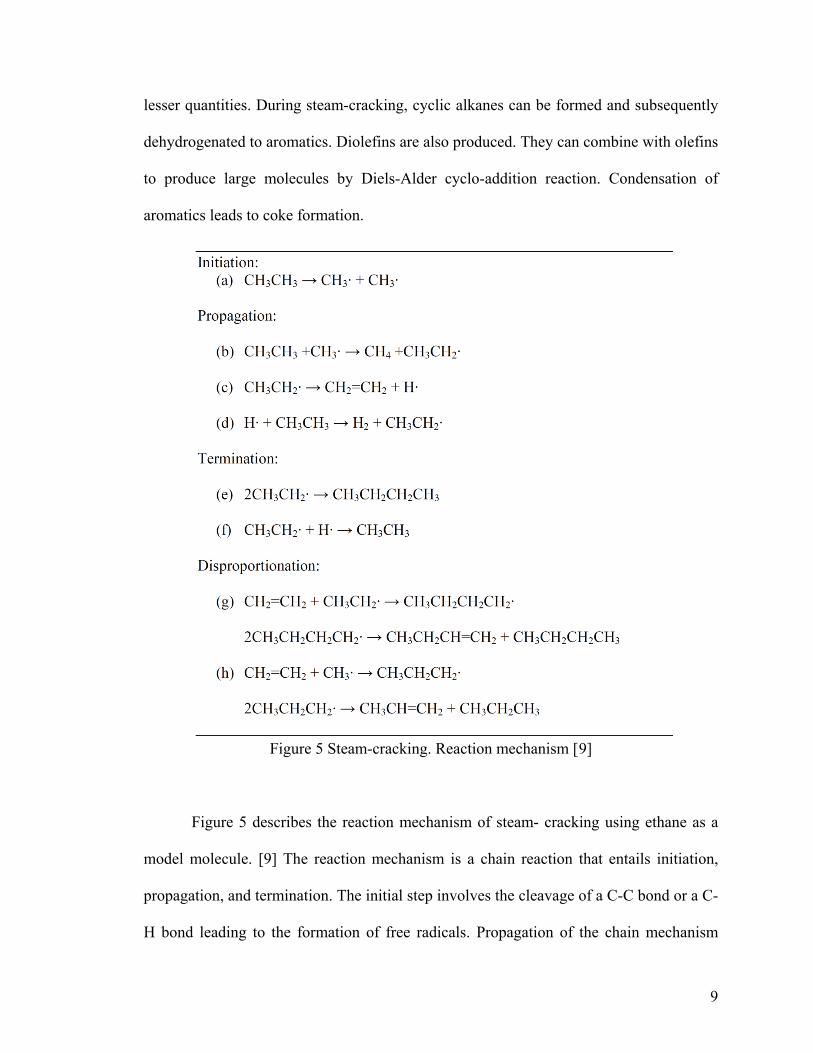
Figure 5 Steam-cracking. Reaction mechanism ................................................................. 9
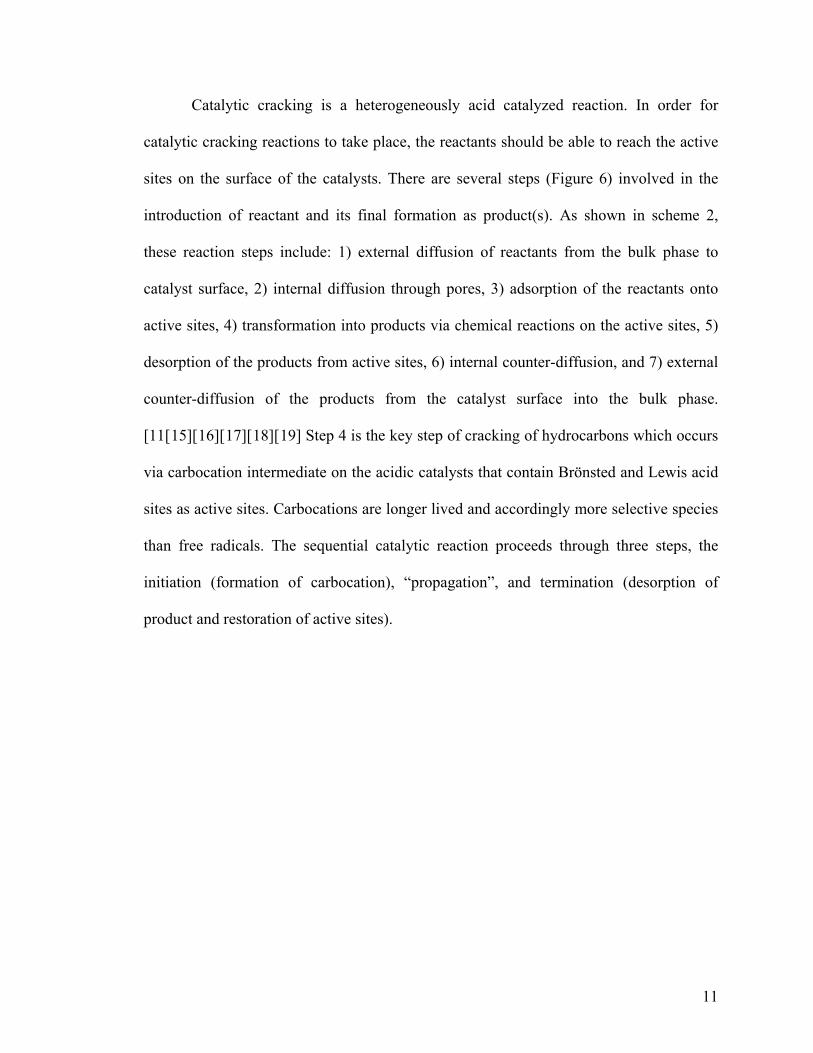
Figure 6 Individual steps of catalytic cracking reactions .................................................. 12
Figure 7 Preparation of multifunctional hybrid catalyst ................................................... 17
Figure 8 Concept of pore continuum effect ...................................................................... 18
Figure 9 Concept of hydrogen spillover effect ................................................................. 20
Figure 10 Strategies for production of fuels and chemicals from lignocellulosic biomass
........................................................................................................................................... 25
Figure 11 FT-IR spectra of pyridine adsorbed onto various hybrid catalysts (recorded at
100 ℃) .............................................................................................................................. 43
Figure 12 FT-IR spectra of pyridine adsorbed onto (25H HYB) hybrid catalyst (recorded
at various temperatures) .................................................................................................... 43
Figure 13 FT-IR spectra of pyridine adsorbed onto (100H HYB (up) and 1000H HYB
(bottom)) hybrid catalyst (recorded at various temperatures) ........................................... 44
Figure 14 Effect of 1,3,5-TMB “contamination” on the total conversion of the (25H)
hybrid and that of the (25H) reference catalysts .............................................................. 51
Figure 15 Effect of 1,3,5-TMB “contamination” on the selectivity in C2-C4 olefins of the
(25H) hybrid and that of the (25H) reference catalysts .................................................. 51
xviii
Figure 16 Coke deposition onto the (25H) hybrid and reference catalysts in the presence
of 1,3,5-TMB contaminant ............................................................................................... 52
Figure 17 Effect of the massive contamination by 1,2,4-TMB on the total conversion ... 53
Figure 18 Effect of the massive contamination by 1,2,4-TMB on the selectivity in C2-C4
olefins ................................................................................................................................ 53
Figure 19 Effect of the massive contamination by 1,2,4-TMB on the coke deposition ... 54
Figure 20 Effect of the massive contamination by 1,2,4-TMB on the nature of the coke
deposited ........................................................................................................................... 54
Figure 21 Yield in (C2= - C4
=) olefins versus time of stream (tos) .................................... 66
Figure 22 Yield in (C2= - C4
=) olefins ............................................................................... 70
Figure 23 Influence of the hydrocarbon feed and the ethanol alcohol blended to the gas
oil feed on the overall reaction mechanism. ..................................................................... 74
Figure 24 Total conversion (Ct) versus contact time (t) ................................................... 86
Figure 25 Total conversion (Ct) versus contact time (t) ................................................... 86
Figure 26 Total conversion (Ct) and yield in Propylene + Ethylene (YEt+Pr) vs. methanol
content in the feed (wt%) .................................................................................................. 88
Figure 27 Yield in C2-C4 olefins versus contact time t ..................................................... 89
Figure 28 Yield in C2-C4 olefins versus contact time t ..................................................... 90
Figure 29 Yield in “ethylene + propylene” versus contact time t ..................................... 90
Figure 30 Yield in BTX aromatics versus contact time t .................................................. 92
Figure 31 Yield in medium and heavy products versus contact time t ............................. 92
Figure 32 Product propylene/ethylene weight ratio versus contact time .......................... 93
Figure 33 DTA/TGA curves (air atmosphere) recorded at 670 ℃ ................................... 95
xix
Figure 34 DTA/TGA curves (air atmosphere) recorded at 670 ℃ ................................... 96
Figure 35 Methanol in its mixtures with petroleum naphtha: Effect of the steam dilution
(Rwf) on the total feed conversion (Ctt) in the overall catalytic cracking (OC) .............. 113
Figure 36 Methanol in its mixtures with petroleum naphtha: Effect of the steam dilution
(Rwf) on the product “ethylene + propylene” selectivity (SC2=+C3=) in the overall catalytic
cracking (OC) .................................................................................................................. 114
Figure 37 Methanol in its mixtures with petroleum naphtha: Effect of the steam dilution
(Rwf) on the total feed conversion (Ctc) in the thermal cracking(TC) ............................ 115
Figure 38 Methanol in its mixtures with petroleum naphtha: Effect of the steam dilution
(Rwf) on the product “ethylene + propylene” selectivity (SC2=+C3=) in the thermal
cracking (TC) .................................................................................................................. 115
Figure 39 Thermal cracking (TC): Variations of total conversion (Ctc) versus residence
time (rt) at 635 ℃ ............................................................................................................ 118
Figure 40 Overall catalytic cracking (OC): Variations of total conversion (Ctt) versus
contact time (ct) at 635 ℃ ............................................................................................... 119
Figure 41 Arrhenius plots of the thermal cracking (TC) ................................................ 120
Figure 42 Arrhenius plots of the overall catalytic cracking (OC) .................................. 122
Figure 43 Proposed mechanism for the overall reaction when mixed “light naphtha-
methanol” feeds are used ................................................................................................ 128
xx
LIST OF TABLES
Table 1 BET surface areas of various catalyst components or catalysts used in this work,
SAR = external/internal surface area ratio ........................................................................ 40
Table 2 Surface acidity properties of parent ZSM-5 zeolites and corresponding catalysts.
The density of acid sites was obtained by back-titration method and the distribution of
acid site strength (zeolites) was determinded by ISE method. ......................................... 42
Table 3 Catalytic performances of hybrid catalysts and their corresponding references . 47
Table 4 Propylene-to-ethylene ratio as a function of the Si/Al ratio of the zeolite
component ......................................................................................................................... 48
Table 5 Co-catalyst content versus the coke deposition ................................................... 49
Table 6 (Ni-Ru) HYB1 versus (Zn-Pd) HYB1 ................................................................. 65
Table 7 TGA-DTA Investigations on coked hybrid catalysts .......................................... 66
Table 8 Performance of (Zn-Pd) HYB 1 in the presence of gas oil blended with C1-C4
Alcohol (5 wt%) ................................................................................................................ 67
Table 9 (Zn-Pd) HYB 2 and (Zn-Pd) HYB 1 in the presence of gas oil feed blended with
ethanol in various concentrations ...................................................................................... 69
Table 10 Composition of the petroleum light naphtha (LN) used in this work ................ 83
Table 11 Yield (wt %) of the product BTX aromatics at 670 ℃ and contact time t = 0.67
h......................................................................................................................................... 89
Table 12 Summary of the effect of methanol (ME) addition to light naphtha (LN) feed on
the total conversion (Ct) .................................................................................................... 94
Table 13 Effect of high temperature and steam on the BET characteristics and catalytic
performance of the hybrid catalyst ................................................................................. 110
xxi
Table 14 Effect of the steam dilution on the coke deposition onto the catalyst surface and
the total conversion of the overall catalytic cracking ..................................................... 117
Table 15 Values found for Ea for thermal cracking (TC) .............................................. 121
Table 16 Values found for the kinetic parameters of the overall catalytic cracking (OC)
......................................................................................................................................... 123
Table 17 Influence of the glycerol content in the feed ................................................... 137
Table 18 Catalytic data obtained with different feed additives containing OH groups
versus that of pure n-hexane ........................................................................................... 139
xxii
CONTRIBUTIONS OF AUTHORS
The following summarizes the contributions of each the authors cited in this dissertation. All papers presented in chapters 1 – 6 were co-authored with Prof. Raymond Le Van Mao (Department of Chemistry and Biochemistry, Concordia University), who acted as research supervisor. CHAPTER I: General Introduction: Parts of this chapter have been reproduced from
“Blending of Non-petroleum Compounds with Current Hydrocarbon Feeds to Use in the Thermo-Catalytic/Steam-Cracking Process for the Selective Production of Light Olefins”
R. Le Van Mao: manuscript preparation H.T. Yan: manuscript preparation A.Muntasar: experimental work N. Al-Yassir: experimental work CHAPTER II: “Review: Design of TCSC Hybrid Catalysts and Phenomenon of
Hydrogen Spillover” H.T. Yan: experimental work and Manuscript preparation
R. Le Van Mao: project supervisor and manuscript preparation CHAPTER III: ““Petroleum Gas Oil-Ethanol” Blends Used as Feeds: Increased
Production of Ethylene and Propylene over Catalytic Steam-Cracking (CSC) Hybrid Catalysts. Different Behavior of Methanol in Blends with Petroleum Gas Oil”
A. Muntasar: experimental work
R. Le Van Mao: project supervisor and manuscript preparation H.T. Yan: experimental work and Manuscript preparation CHAPTER IV: “Mixed Naphtha/Methanol Feed Used in the Thermal Catalytic/Steam
Cracking (TCSC) Process for the Production of Propylene and Ethylene”
H.T. Yan: experimental work and manuscript preparation R. Le Van Mao: project supervisor and manuscript preparation
xxiii
CHAPTER V: “Catalytic Compatibility of Methanol with Petroleum Naphtha in Mixed
Feeds Used in the Thermal-Catalytic/Steam-Cracking (TCSC) Process for the Production of Propylene and Ethylene”
H.T. Yan: experimental work and manuscript preparation R. Le Van Mao: project supervisor and manuscript preparation CHAPTER VI: “Blending of Non-petroleum Compounds with Current Hydrocarbon
Feeds to Use in the Thermo-Catalytic/Steam-Cracking Process for the Selective Production of Light Olefins: Is Glycerol a Good Candidate for Blending with Petroleum Hydrocarbon Feeds?”
R. Le Van Mao: project supervisor and manuscript preparation H.T. Yan: experimental work and manuscript preparation A.Muntasar: experimental work N. Al-Yassir: experimental work

1
CHAPTER I
GENERAL INTRODUCTION
Parts of this chapter have been reproduced from: “Blending of Non-petroleum Compounds with Current Hydrocarbon Feeds to Use in the Thermo-Catalytic Steam-Cracking Process for the Selective Production of Light Olefins” in “New and Future Development in Catalysis, Hybrid Materials, Composites, and Organocatalysts” 1st Edition, S.L. Suib (Ed.), Elsevier, Amsterdam (2012) R. Le Van Mao, H.T. Yan, A. Muntasar and N.Al-Yassir
2
1.1 PREAMBLE
Light olefins such as ethylene and propylene are considered as the most important
building blocks of the petrochemical industry since all the major bulk chemicals are
subsequently derived from them. Currently, these light olefins are predominantly
produced from fossil feedstocks, mainly petroleum, by Steam Cracking and Fluid
Catalytic Cracking technologies. However, due to the fact that fossil fuels are finite
resources and they are experiencing a very high rate of increasing demand in the recent
years, fossil fuels may not be able to continue to be the principal sources for the
petrochemical industry in the future. Also, another problem related to using petroleum is
the emission of greenhouse gases (CO2 and CH4), which lead to the global warming, and
other harmful gases like SOx and NOx, which are the precursors of acid rain.
Furthermore, economic and geopolitical problems are usually attributed to the uneven
distribution of fossil oil and gas in the world.
In light of what was said above, it is imperative to find a feedstock which is fully
renewable and sustainable in order to replace fossil. In this respect, biomass has recently
been considered to become a major source for the production of energy and chemicals
since bio-based resources are renewable and CO2 neutral. Currently, several technologies
for the conversion of biomass into bio-chemicals and bio-fuels have been successfully
developed. For example, bio-ethanol is produced by fermentation of sugars or starch, bio-
diesel is recovered from oil based crops by transesterification, and biogas and bio-oil can
be produced from lignocelluloses by thermal chemical processes such as gasification and
fast pyrolysis, respectively. However, one of the actual challenges is to convert biomass
derived raw materials into light olefins which are the current chemical platforms in oil
3
refinery. This is mainly because the structure and properties of biomass derived raw
materials (oxygenates) are totally different from that on which the current oil refinery is
based (hydrocarbons).
As a converting route, we propose processing biomass derived feedstock in a
conventional petroleum refinery. Petroleum refineries are already built, and using these
existing infrastructures for bio-chemicals production needs lower capital cost investment.
This is the starting point of a progressive replacement of fossil oil based feedstock by
biomass derived one.
1.2 Current Technologies for the Production of Light Olefins
1.2.1 The Significance of Light Olefins in Petrochemical Industry
Light olefins such as ethylene and propylene are the most important intermediates
used in the production of numerous fundamental materials, such as plastics, synthetic
fibres, and synthetic rubbers. The current and main technology of production of these
light olefins is steam-cracking, using various hydrocarbon feedstocks (light paraffins,
naphthas or gas oils).
In organic chemistry, an olefin can be defined as an unsaturated chemical
compound containing at least one carbon–to-carbon double bond.[1] The simplest acyclic
alkenes, which have only one double bond and no other functional group, form a
homologous family of hydrocarbons with the general formula CnH2n.[2] When comparing
with paraffinic hydrocarbons, olefins have higher reactivity. They can easily react with
reagents such as water, oxygen, hydrochloric acid, and chlorine to form valuable
4
chemicals. In addition, polymers such as polyethylene and polypropylene can be
produced via polymerization.[3]
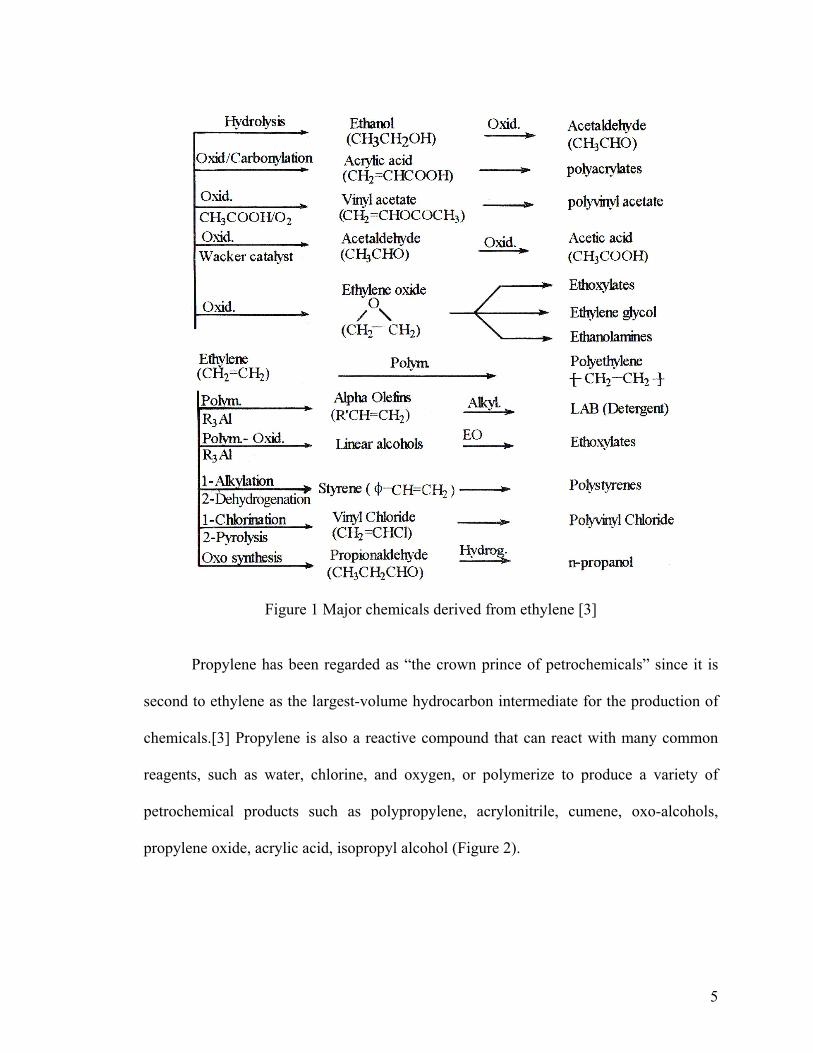
Ethylene is sometimes considered as the “king of petrochemicals”, because there
are more commercial chemicals produced from ethylene than from any other intermediate
due to ethylene’s several favourable properties as well as other technical and economic
factors [3]. Ethylene is a relatively inexpensive compound, which can be easily produced
from any hydrocarbon source through refinery processes like steam-cracking.
Furthermore, there are fewer by-products generated from ethylene reactions with other
compounds than from other olefins. Figure 1 shows valuable chemicals that can be
produced from ethylene by reaction with many inexpensive reagents like water, chlorine,
hydrogen chloride, and oxygen. Also, ethylene can be polymerized by free radicals or by
coordination catalysts into polyethylene, which is the largest-volume thermoplastic
polymer. In addition, the copolymerization of ethylene with other olefins can produce
copolymers with improved properties.[3]
5
Figure 1 Major chemicals derived from ethylene [3]
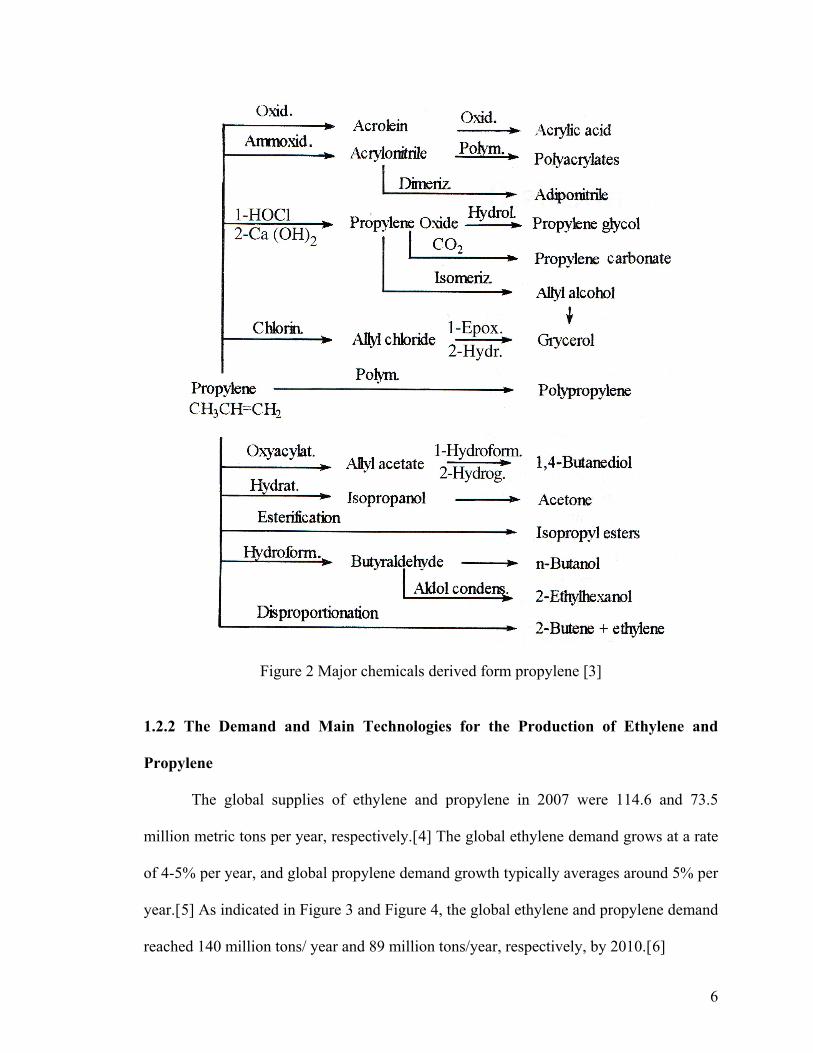
Propylene has been regarded as “the crown prince of petrochemicals” since it is
second to ethylene as the largest-volume hydrocarbon intermediate for the production of
chemicals.[3] Propylene is also a reactive compound that can react with many common
reagents, such as water, chlorine, and oxygen, or polymerize to produce a variety of
petrochemical products such as polypropylene, acrylonitrile, cumene, oxo-alcohols,
propylene oxide, acrylic acid, isopropyl alcohol (Figure 2).
6
Figure 2 Major chemicals derived form propylene [3]
1.2.2 The Demand and Main Technologies for the Production of Ethylene and
Propylene
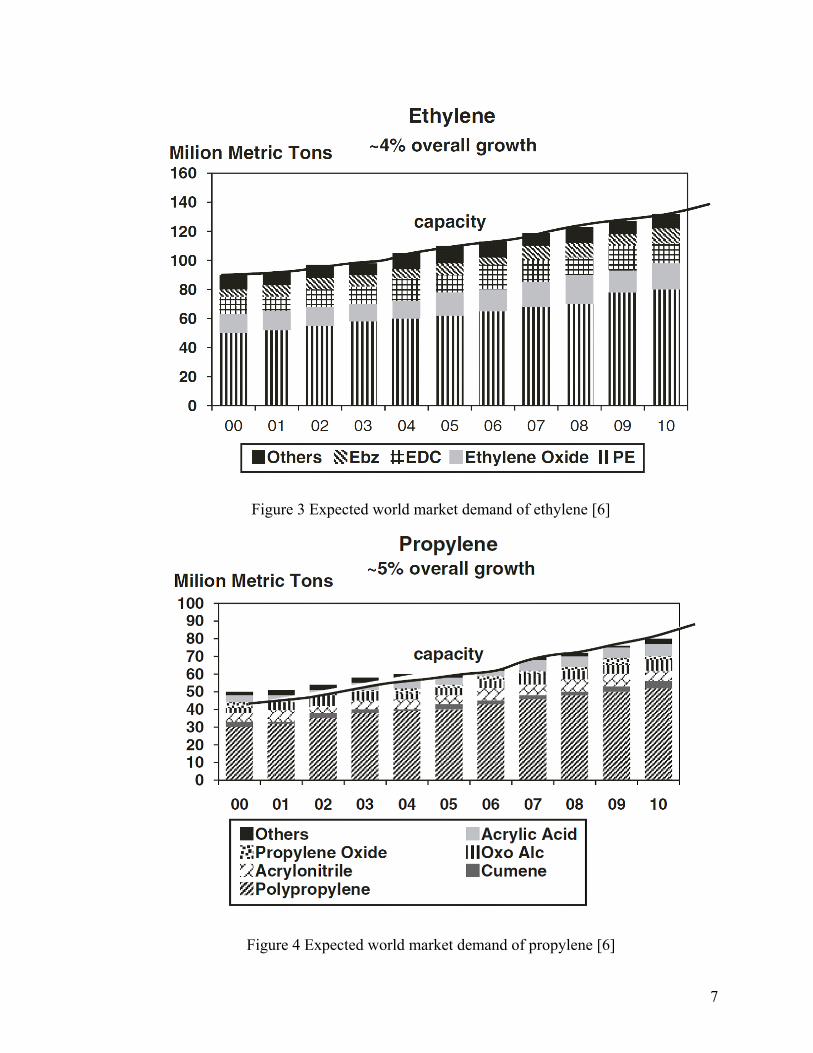
The global supplies of ethylene and propylene in 2007 were 114.6 and 73.5
million metric tons per year, respectively.[4] The global ethylene demand grows at a rate
of 4-5% per year, and global propylene demand growth typically averages around 5% per
year.[5] As indicated in Figure 3 and Figure 4, the global ethylene and propylene demand
reached 140 million tons/ year and 89 million tons/year, respectively, by 2010.[6]
7
Figure 3 Expected world market demand of ethylene [6]
Figure 4 Expected world market demand of propylene [6]
8
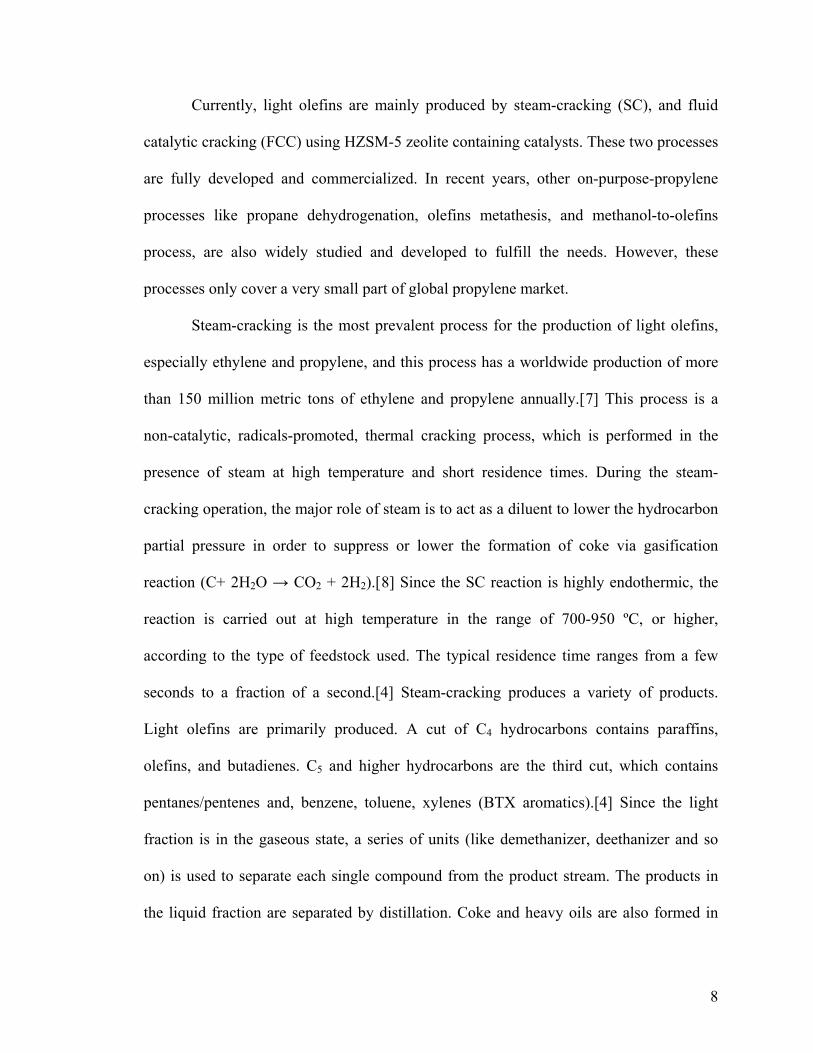
Currently, light olefins are mainly produced by steam-cracking (SC), and fluid
catalytic cracking (FCC) using HZSM-5 zeolite containing catalysts. These two processes
are fully developed and commercialized. In recent years, other on-purpose-propylene
processes like propane dehydrogenation, olefins metathesis, and methanol-to-olefins
process, are also widely studied and developed to fulfill the needs. However, these
processes only cover a very small part of global propylene market.
Steam-cracking is the most prevalent process for the production of light olefins,
especially ethylene and propylene, and this process has a worldwide production of more
than 150 million metric tons of ethylene and propylene annually.[7] This process is a
non-catalytic, radicals-promoted, thermal cracking process, which is performed in the
presence of steam at high temperature and short residence times. During the steam-
cracking operation, the major role of steam is to act as a diluent to lower the hydrocarbon
partial pressure in order to suppress or lower the formation of coke via gasification
reaction (C+ 2H2O → CO2 + 2H2).[8] Since the SC reaction is highly endothermic, the
reaction is carried out at high temperature in the range of 700-950 ºC, or higher,
according to the type of feedstock used. The typical residence time ranges from a few
seconds to a fraction of a second.[4] Steam-cracking produces a variety of products.
Light olefins are primarily produced. A cut of C4 hydrocarbons contains paraffins,
olefins, and butadienes. C5 and higher hydrocarbons are the third cut, which contains
pentanes/pentenes and, benzene, toluene, xylenes (BTX aromatics).[4] Since the light
fraction is in the gaseous state, a series of units (like demethanizer, deethanizer and so
on) is used to separate each single compound from the product stream. The products in
the liquid fraction are separated by distillation. Coke and heavy oils are also formed in
9
lesser quantities. During steam-cracking, cyclic alkanes can be formed and subsequently
dehydrogenated to aromatics. Diolefins are also produced. They can combine with olefins
to produce large molecules by Diels-Alder cyclo-addition reaction. Condensation of
aromatics leads to coke formation.
Figure 5 Steam-cracking. Reaction mechanism [9]
Figure 5 describes the reaction mechanism of steam- cracking using ethane as a
model molecule. [9] The reaction mechanism is a chain reaction that entails initiation,
propagation, and termination. The initial step involves the cleavage of a C-C bond or a C-
H bond leading to the formation of free radicals. Propagation of the chain mechanism
10
occurs by several different radical reactions which in turn produce radicals as products.
These radicals can, at any time, react with each other to produce a non-radical product.
These latter reactions, where radicals are consumed, are called termination steps because
the products have no further reactivity with respect to chain initiation.
Catalytic cracking can be defined as a cracking process that operates at moderate
temperature in the presence of a heterogeneous catalyst. It is a remarkably versatile and
flexible process with principal aim to crack lower-value feedstocks into higher-value
lighter liquids and distillates. Also, light hydrocarbon gases can be produced.[3]
Products of catalytic cracking are basically the same as those of steam-cracking except
the use of a catalyst to improve process efficiency.[10] Various different solid acidic
catalysts have been studied and tested for catalytic cracking, but zeolites are the most
performing ones. The Y zeolite is the main zeolitic component of the Fluid Catalytic
Cracking (FCC) process, which can be incorporated in industrial catalysts in various
forms: REHY (rare earth-exchanged HY), REY (rare earth-exchanged Y), HUSY (H
form of ultra-stable Y zeolite), and REHUSY (rare earth-exchanged H-form USY).[11]
The most common examples of catalytic cracking processes are Fluid Catalytic Cracking
(FCC), hydrocracking, and Deep Catalytic Cracking (DCC). FCC is the most widely used
process for the large-scale production of gasoline with high octane number.[12] Main
catalyst used in FCC process is Y zeolite. Recently, ZSM-5 zeolite is used as a co-
component to increase the yield of light olefins which are produced as secondary
products.[13][14] The typical reaction temperature for catalytic cracking ranges from 450
to 560 ºC.
11
Catalytic cracking is a heterogeneously acid catalyzed reaction. In order for
catalytic cracking reactions to take place, the reactants should be able to reach the active
sites on the surface of the catalysts. There are several steps (Figure 6) involved in the
introduction of reactant and its final formation as product(s). As shown in scheme 2,
these reaction steps include: 1) external diffusion of reactants from the bulk phase to
catalyst surface, 2) internal diffusion through pores, 3) adsorption of the reactants onto
active sites, 4) transformation into products via chemical reactions on the active sites, 5)
desorption of the products from active sites, 6) internal counter-diffusion, and 7) external
counter-diffusion of the products from the catalyst surface into the bulk phase.
[11[15][16][17][18][19] Step 4 is the key step of cracking of hydrocarbons which occurs
via carbocation intermediate on the acidic catalysts that contain Brönsted and Lewis acid
sites as active sites. Carbocations are longer lived and accordingly more selective species
than free radicals. The sequential catalytic reaction proceeds through three steps, the
initiation (formation of carbocation), “propagation”, and termination (desorption of
product and restoration of active sites).
12
Figure 6 Individual steps of catalytic cracking reactions
The initiation step involves the formation of carbocations through the interaction
of adsorbed hydrocarbons with the active sites. Suggested forms of carbocations include
carbenium and carbonium. Several reaction pathways have been proposed and are widely
accepted in the literature.
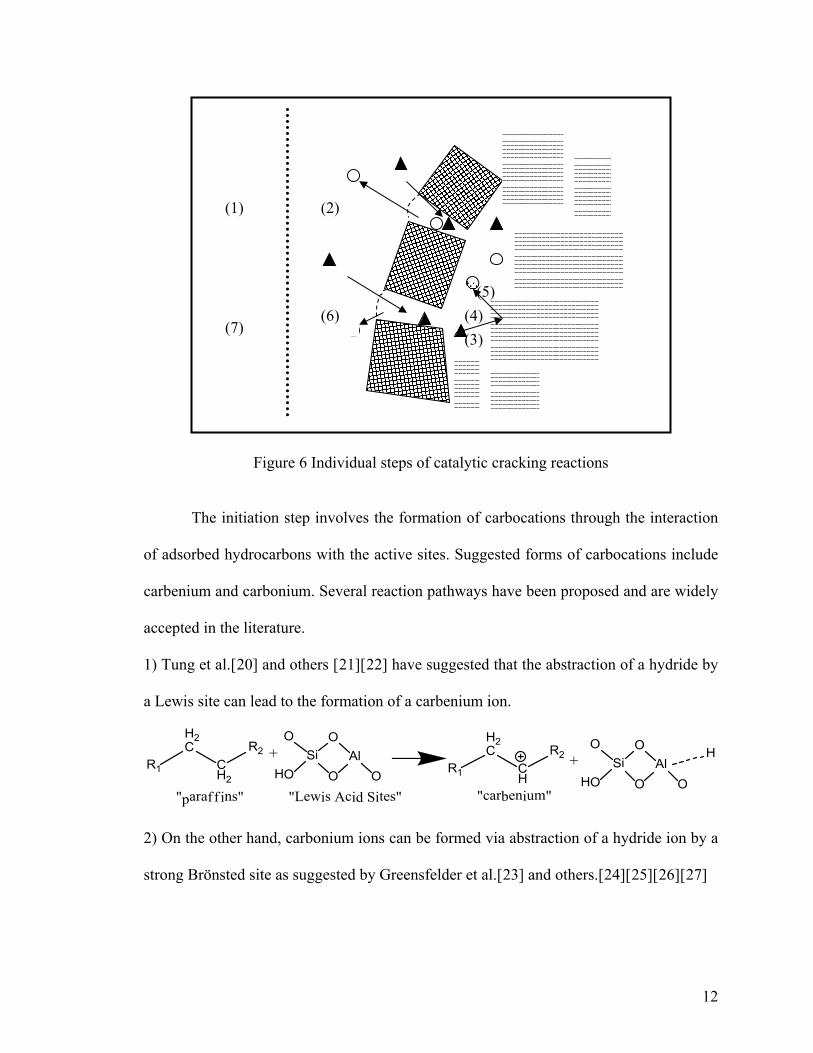
1) Tung et al.[20] and others [21][22] have suggested that the abstraction of a hydride by
a Lewis site can lead to the formation of a carbenium ion.
R1
H2C
CH2
R2
"paraff ins"
+HO
Si
O
O OAl
O R1
H2C
CH
R2
"carbenium""Lewis Acid Sites"HO
Si
O
O OAl
O
+ H
2) On the other hand, carbonium ions can be formed via abstraction of a hydride ion by a
strong Brönsted site as suggested by Greensfelder et al.[23] and others.[24][25][26][27]
(3) (7)
(1)
(4) (5)
(2)
(6)
13
R1
H2C
CH2
R2
"paraff ins"
+R1
H2C
CH3
R2
"carbonium""Bronsted Acid Sites"
+HO
Si
O
OHO
AlO
O
OSi
O
O OAl
O
O
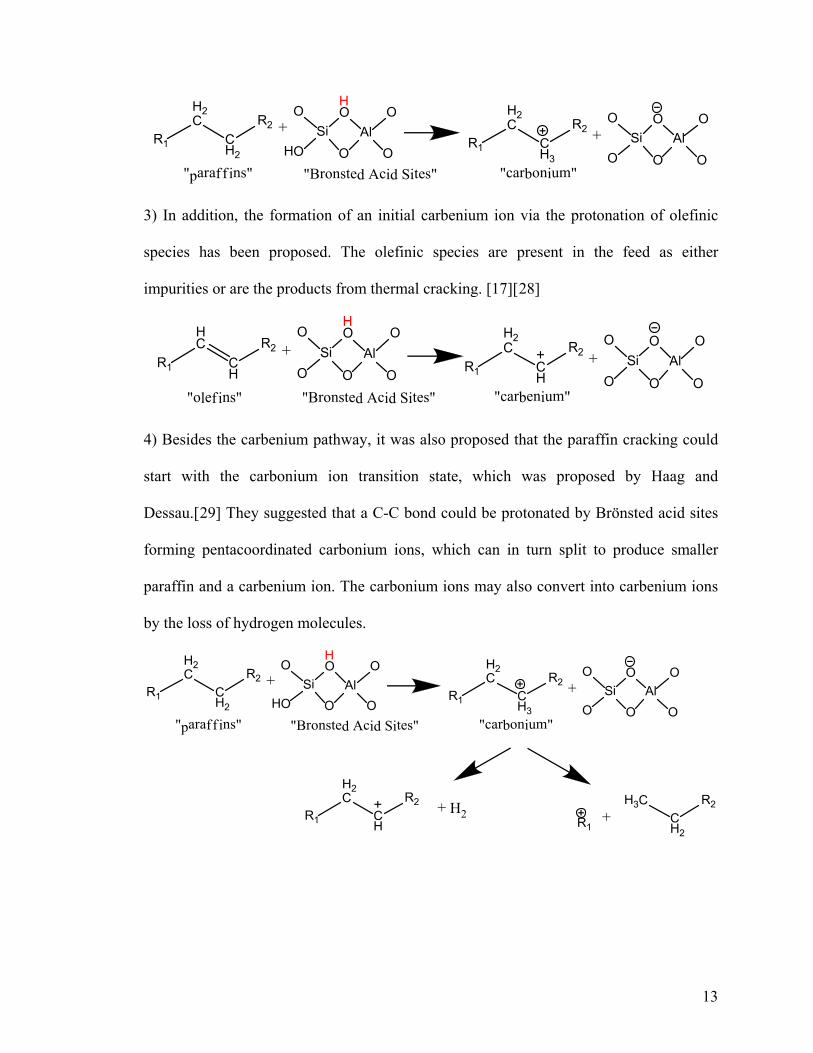
3) In addition, the formation of an initial carbenium ion via the protonation of olefinic
species has been proposed. The olefinic species are present in the feed as either
impurities or are the products from thermal cracking. [17][28]
R1
HC
CH
R2
"olef ins"
+O
Si
O
OHO
AlO R1
H2C
CH
R2
"carbenium""Bronsted Acid Sites"
+O
OSi
O
O OAl
O
O
4) Besides the carbenium pathway, it was also proposed that the paraffin cracking could
start with the carbonium ion transition state, which was proposed by Haag and
Dessau.[29] They suggested that a C-C bond could be protonated by Brönsted acid sites
forming pentacoordinated carbonium ions, which can in turn split to produce smaller
paraffin and a carbenium ion. The carbonium ions may also convert into carbenium ions
by the loss of hydrogen molecules.
R1
H2C
CH
R2
R1
H2C
CH2
R2
"paraff ins"
+R1
H2C
CH3
R2
"carbonium""Bronsted Acid Sites"
+HO
Si
O
OHO
AlO
O
OSi
O
O OAl
O
O
+ H2R1
H3CCH2
R2+
14
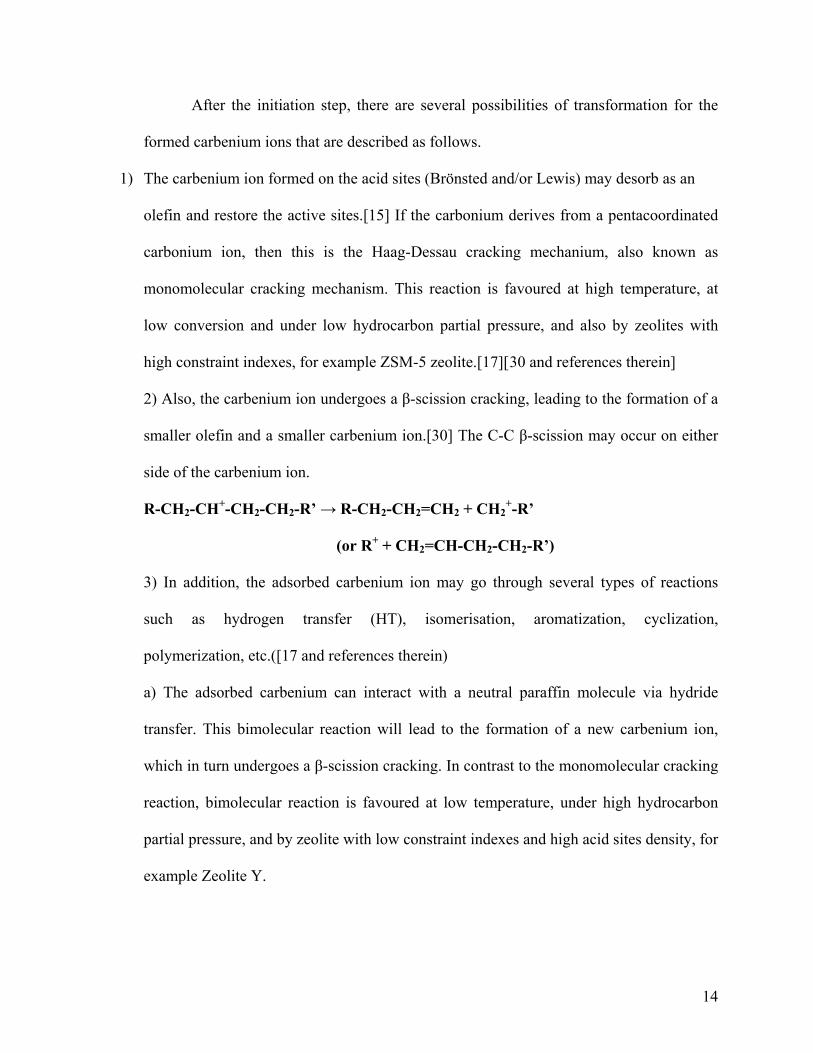
After the initiation step, there are several possibilities of transformation for the
formed carbenium ions that are described as follows.
1) The carbenium ion formed on the acid sites (Brönsted and/or Lewis) may desorb as an
olefin and restore the active sites.[15] If the carbonium derives from a pentacoordinated
carbonium ion, then this is the Haag-Dessau cracking mechanium, also known as
monomolecular cracking mechanism. This reaction is favoured at high temperature, at
low conversion and under low hydrocarbon partial pressure, and also by zeolites with
high constraint indexes, for example ZSM-5 zeolite.[17][30 and references therein]
2) Also, the carbenium ion undergoes a β-scission cracking, leading to the formation of a
smaller olefin and a smaller carbenium ion.[30] The C-C β-scission may occur on either
side of the carbenium ion.
R-CH2-CH+-CH2-CH2-R’ → R-CH2-CH2=CH2 + CH2+-R’
(or R+ + CH2=CH-CH2-CH2-R’)
3) In addition, the adsorbed carbenium ion may go through several types of reactions
such as hydrogen transfer (HT), isomerisation, aromatization, cyclization,
polymerization, etc.([17 and references therein)
a) The adsorbed carbenium can interact with a neutral paraffin molecule via hydride
transfer. This bimolecular reaction will lead to the formation of a new carbenium ion,
which in turn undergoes a β-scission cracking. In contrast to the monomolecular cracking
reaction, bimolecular reaction is favoured at low temperature, under high hydrocarbon
partial pressure, and by zeolite with low constraint indexes and high acid sites density, for
example Zeolite Y.
15
R1
H2C
CH
R2
"carbenium"
+ R3
H2C
CH2
R4
"paraff ins"
H-transferR1
H2C
CH2
R2
"paraff ins"
+ R3
H2C
CH
R4
R3
H2CCH
R4+
"carbenium"
"olef ins"
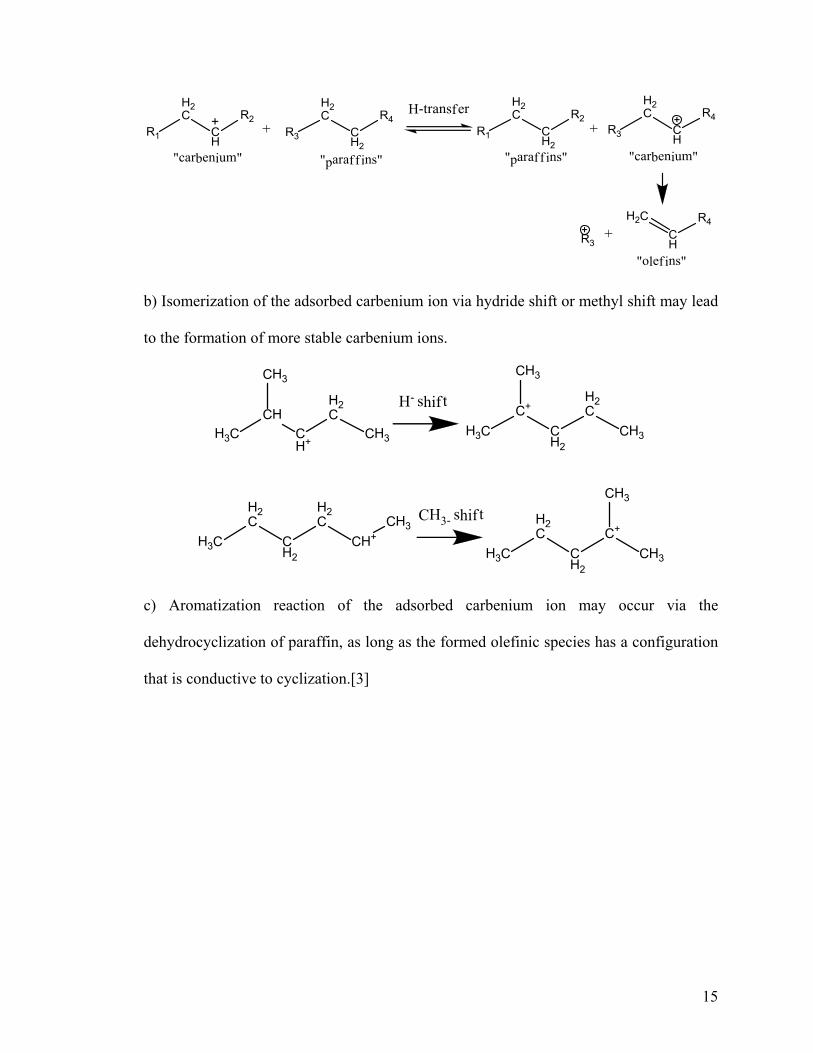
b) Isomerization of the adsorbed carbenium ion via hydride shift or methyl shift may lead
to the formation of more stable carbenium ions.
H3CCH
CH+
H2C
CH3
CH3 H3CC+
CH2
H2C
CH3
CH3
H- shif t
H3C
H2C
CH2
H2C
CH+CH3
H3C
H2C
CH2
C+
CH3
CH3
CH3- shif t
c) Aromatization reaction of the adsorbed carbenium ion may occur via the
dehydrocyclization of paraffin, as long as the formed olefinic species has a configuration
that is conductive to cyclization.[3]
16
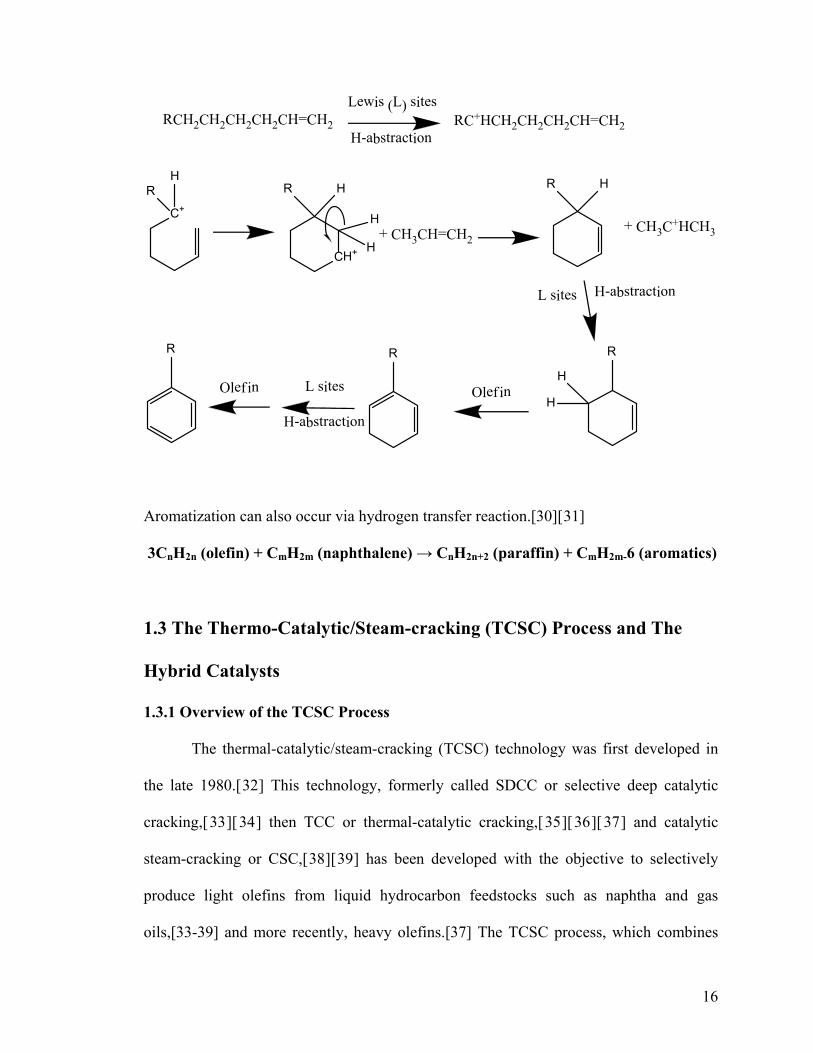
C+
HR
CH+
R H
H
H
R H
H
H
RRR
+ CH3CH=CH2+ CH3C+HCH3
Olefin L sites Olef in
H-abstractionL sites
H-abstraction
RCH2CH2CH2CH2CH=CH2 RC+HCH2CH2CH2CH=CH2
Lewis (L) sites
H-abstraction
Aromatization can also occur via hydrogen transfer reaction.[30][31]
3CnH2n (olefin) + CmH2m (naphthalene) → CnH2n+2 (paraffin) + CmH2m-6 (aromatics)
1.3 The Thermo-Catalytic/Steam-cracking (TCSC) Process and The
Hybrid Catalysts
1.3.1 Overview of the TCSC Process
The thermal-catalytic/steam-cracking (TCSC) technology was first developed in
the late 1980.[32] This technology, formerly called SDCC or selective deep catalytic
cracking,[33][34] then TCC or thermal-catalytic cracking,[35][36][37] and catalytic
steam-cracking or CSC,[38][39] has been developed with the objective to selectively
produce light olefins from liquid hydrocarbon feedstocks such as naphtha and gas
oils,[33-39] and more recently, heavy olefins.[37] The TCSC process, which combines
17
the (mild) thermal cracking with the acid-promoted cracking of a zeolite-based catalyst,
can provide very high yields of light olefins (with the possibility of varying the
propylene-to-ethylene ratio that is usually much higher than 1.0) while operating at
temperatures much lower than those used in the steam-cracking technology.
1.3.2 Hybrid Catalysts: Concept of Pore Continuum and Hydrogen Spillover
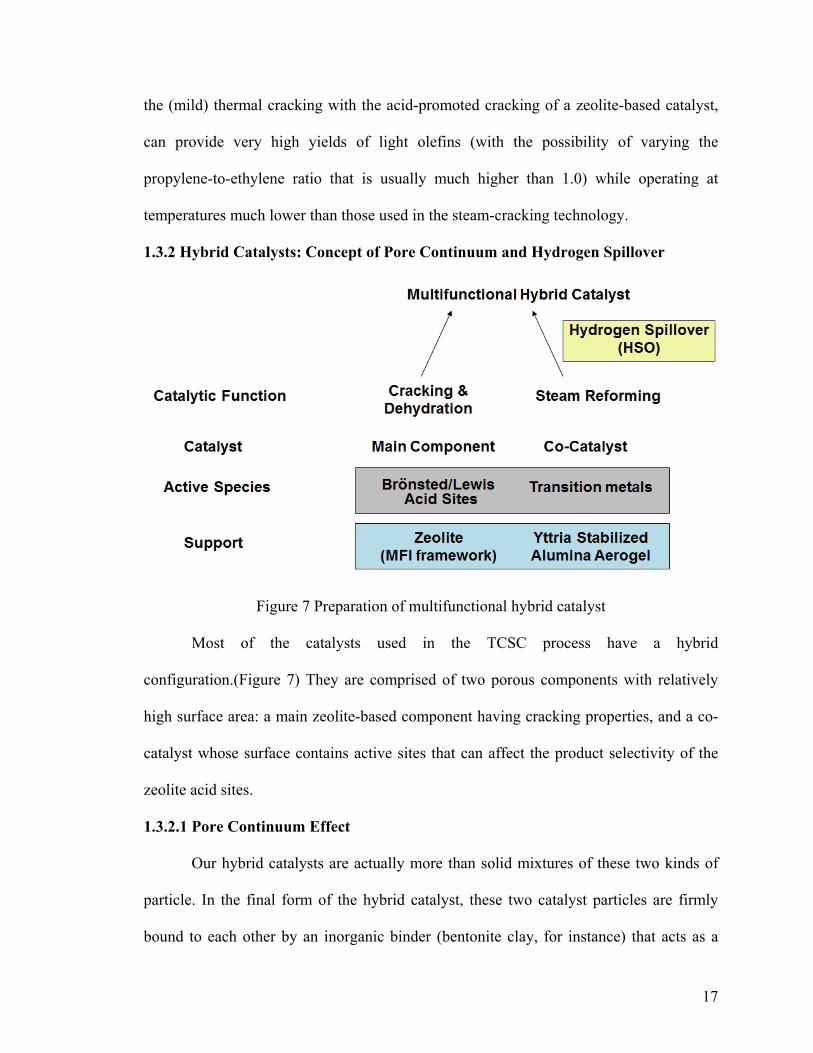
Figure 7 Preparation of multifunctional hybrid catalyst
Most of the catalysts used in the TCSC process have a hybrid
configuration.(Figure 7) They are comprised of two porous components with relatively
high surface area: a main zeolite-based component having cracking properties, and a co-
catalyst whose surface contains active sites that can affect the product selectivity of the
zeolite acid sites.
1.3.2.1 Pore Continuum Effect
Our hybrid catalysts are actually more than solid mixtures of these two kinds of
particle. In the final form of the hybrid catalyst, these two catalyst particles are firmly
bound to each other by an inorganic binder (bentonite clay, for instance) that acts as a
18
“pressuring” binder. In fact, this binder, when activated at high temperatures in the final
form of hybrid catalyst extrudates, holds these catalyst particles in an extremely “rigid
and pressurized” solid network. In addition, the zeolite-based particles should preferably
have the sub-micron size while the co-catalyst particles should be mesoporous, much
larger in size and also quite malleable in consistency (i.e. favourable for
extrusion).[32][ 40 ] The configuration of the catalyst extrudates resulting from the
combination of a submicrometer-sized zeolite particles and the much larger co-catalyst
ensures an easy two way diffusion of reaction intermediates within the catalyst network.
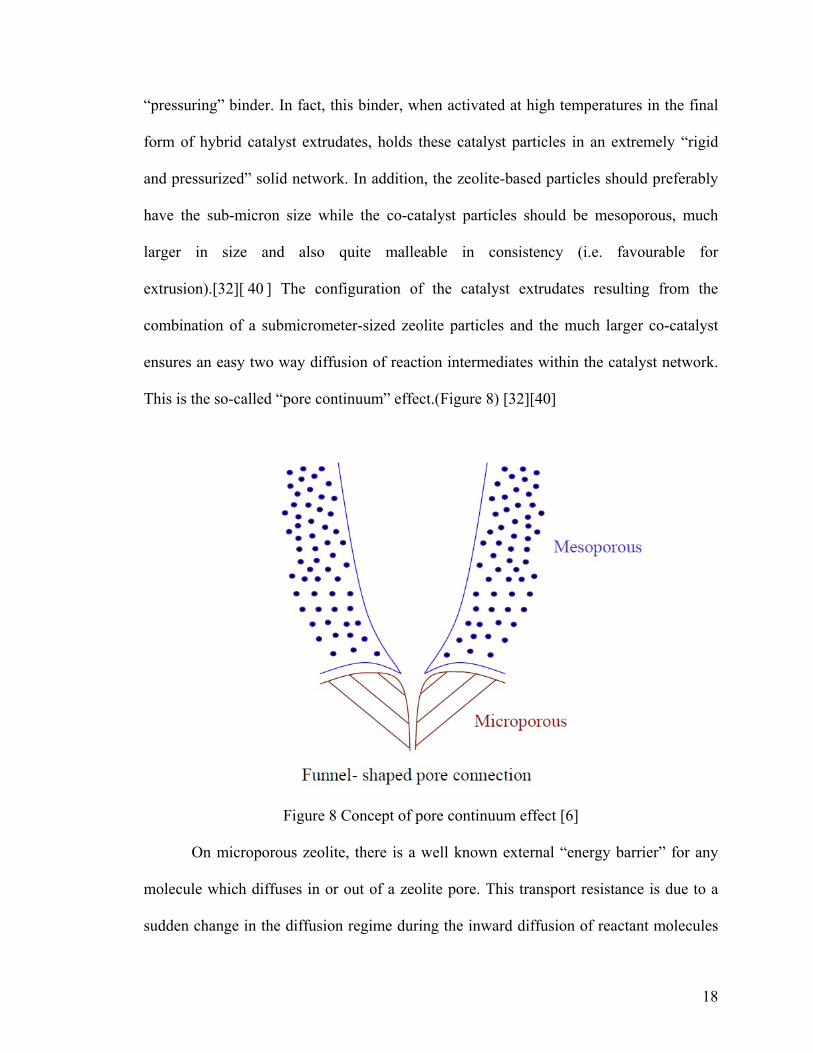
This is the so-called “pore continuum” effect.(Figure 8) [32][40]
Figure 8 Concept of pore continuum effect [6]
On microporous zeolite, there is a well known external “energy barrier” for any
molecule which diffuses in or out of a zeolite pore. This transport resistance is due to a
sudden change in the diffusion regime during the inward diffusion of reactant molecules
19
or a sudden change in the surface curvature during the outward diffusion of
products.[35][40][41] Pore continuum configuration is able to effectively decrease the
negative effect of the energy barrier and ease the inward or outward diffusion for
molecules. This is because that the formation of a “funnel-shaped” pore connection by
two porous materials with different pore size provides a gradual surface curvature change
instead of a sudden change. Once the pore connection does not show any discontinuity in
terms of the surface curvature, the energy barrier is eliminated. The existence of pore
continuum configuration is supported by several experimental evidences in terms of
diffusion and catalytic activity.[35][40][41]
1.3.2.2 Hydrogen Spillover Effect
The various co-catalysts used in our studies showed strong activities of
(hydrocarbon) steam-reforming (and water-gas shift). They mainly contained Pt,[35] Pd-
Sn,[35] Ni,[36] Ni-Re,[36] Ni-Ru,[36-39][42] Pd-Zn,[39] Ru and Ru/Pd-Zn, as well as
Mo-Ce [43] and Cr-Al,[33] on support. Some supported Mo-Ce mixed oxides were also
used as mono-component catalysts.[44] Our support of choice was Yttria-doped alumina
aerogel because such high-surface area material was found to be very hydrothermally
stable in the conditions of the TCSC operations, i.e. temperature ranging from 600oC to
750oC and presence of steam in substantial concentration.[45][46] The metal species on
the surface of the support have outstanding activities of hydrogen generation and
favorable Hydrogen Spill-over effect. Hydrogen has been produced from steam
reforming as part of the feedstock and water-gas shift reaction. They can spill over onto
the surface of the main acidic component from the metal sites on the co-catalyst. These
hydrogen spilt-over (HSO) species may interact with the intermediates from the cracking
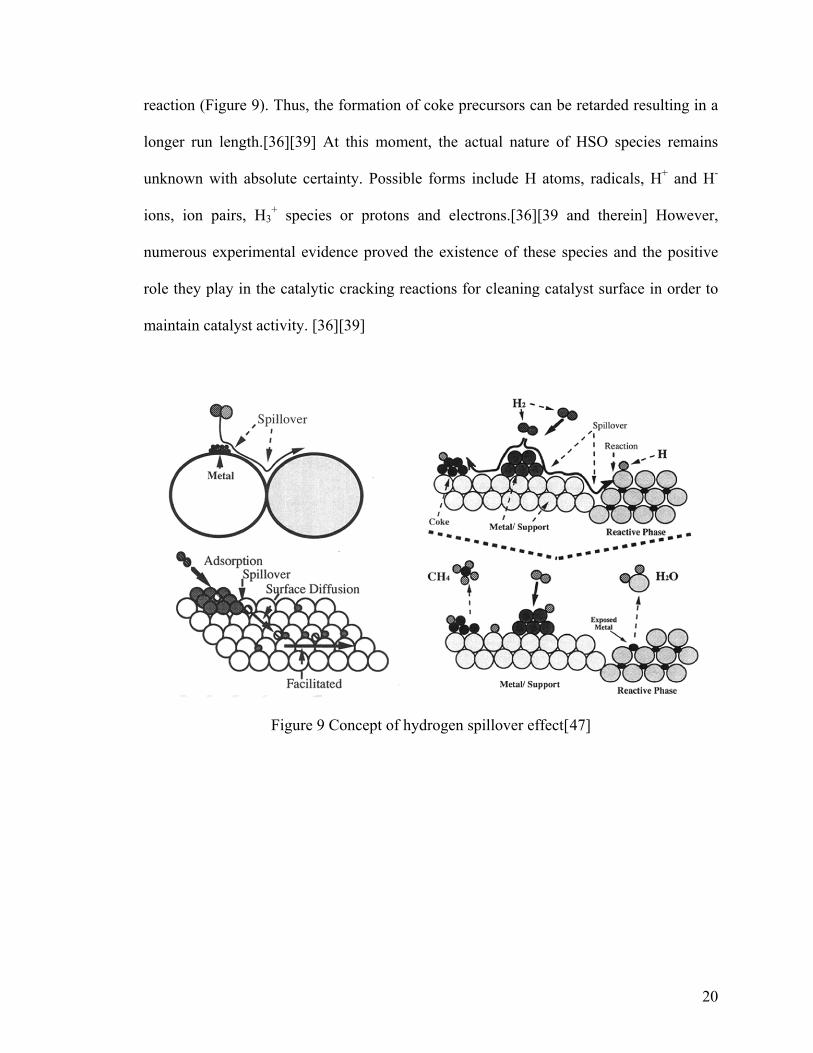
20
reaction (Figure 9). Thus, the formation of coke precursors can be retarded resulting in a
longer run length.[36][39] At this moment, the actual nature of HSO species remains
unknown with absolute certainty. Possible forms include H atoms, radicals, H+ and H-
ions, ion pairs, H3+ species or protons and electrons.[36][39 and therein] However,
numerous experimental evidence proved the existence of these species and the positive
role they play in the catalytic cracking reactions for cleaning catalyst surface in order to
maintain catalyst activity. [36][39]
Figure 9 Concept of hydrogen spillover effect[47]
21
1.4 Problems of the Current Light Olefins Industry and Solution
1.4.1 Problems of the Current Light Olefins Industry
There are three main problems that the current light olefin industry is facing:
rapid growth of demand, high consumption of energy, and more stringent environmental
regulations.
As stated above, the global market demand for ethylene and propylene grows at
an average rate around 5% per year.[5][6] However, with the current production
technologies, propylene is only produced as a by-product or a (minor) co-product. About
64% of worldwide propylene production comes from steam-cracking where propylene is
produced as a co-product to ethylene. 30% of worldwide propylene production comes
from fluid catalytic cracking where propylene is produced as a co-product to gasoline.
The remaining 6% is from other on-purpose-propylene processes like catalytic propane
dehydrogenation, metathesis and others, which are much less important.[48] Therefore,
the conventional olefin technologies will experience a great deal of pressure as a result of
continuous rapid growth in the demand for propylene.
In addition, the energy consumption is another significant obstacle in the light
olefins industry. For example, the current steam cracking process operates at 800-1000
ºC, consuming as much as 40% of the energy used by the entire petrochemical industry
and globally approximately 8% of the sector’s total primary energy use.[49][50] Specific
energy consumption is about 4500-5000 kcal/kg of ethylene for the most up-to-date
steam-crackers.[4] Overall, about 70% of production costs in typical ethane- or naphtha-
based olefin plants are due to energy costs.[50]
22
In addition, global environmental issues have stimulated the development of
technologies that minimise greenhouse gases (GHG) emissions.[49] Greenhouse gases
such as CH4 and CO2 are produced during the run-regeneration cycle. For instance,
approximately 180-220 million metric tons of worldwide CO2 emissions are from the
current steam-cracking process.[50] As a result, more strict environmental regulations
that require low greenhouse gases emission also put a strain on the conventional olefins
technologies.
1.4.2 Current Feedstocks Used by the Light Olefin Industry
The current dominant feedstocks for the light olefin industry are fossil fuels based
ones. They can be divided into two categories. The first category includes naphtha, gas
oils, propane, etc., which are derived from crude oil and the second one comprises
hydrocarbon feedstocks derived from natural gas, such as ethane, propane, etc.[50]
Fossil fuels are regarded as non-renewable sources of energy and chemicals. Energy
experts predict that recoverable reserves of different types of fossil fuels are about 30-60
years for petroleum, 60 years for natural gas, and 250 years for coal.[51][52] Depending
on the varying consumption rate, these fossil fuels might be exhausted even earlier.[52]
On the other hand, to produce 1 metric ton of ethylene, thermal cracking consumes 3 tons
of naphtha and 0.67 ton of fuel, providing 0.5 ton of propylene and 1.1 ton of carbon
dioxide as co-products. By using catalytic cracking technology, 2.9 tons of naphtha and
0.53 ton of fuel are needed for the production of 1 ton of ethylene (and 1 ton of propylene
and 0.9 ton of carbon dioxide as co-products).[52] As a conclusion, due to world
population growth and increasing demand of ethylene and propylene, fossil fuels based
23
feedstock eventually will not be able to satisfy global demand for light olefins and they
cannot continue to be the principal sources of feedstocks.
The second problem of using fossil fuels is global warming and other pollution
caused by the emission of harmful gases. 85.5 kg, 69.4 kg, and 52 kg of CO2 will be
produced by burning 1 GJ (energy equivalent) of coal, petroleum, and natural gas,
respectively. The emission of CO2 is expected to reach 8.2 to 10 gigatons around 2020.
As a result, an annual mean global temperature increase of almost 5 degrees would
approximately raise the level of seas and oceans more than one meter due to the ice
melting at the poles. This is sufficient to affect life around the world.[51] Besides
greenhouse gases, the emission of SOx and NOx also results from the use of fossil fuels.
And they are the main sources of acid rain.
Another problem of fossil fuels is their uneven distribution. For example, the
Middle East has about 63% of the global reserves.[51] There are always economic and
geopolitical concerns caused by this problematic situation.
1.4.3 Biomass Derived Compounds as Feed Additives for the Production of Light
Olefins
Currently, sustainable development is a topic that attracts attention in many
different areas of science and technology. To achieve sustainable development, one of the
factors is the requirement for a supply of energy resources that is fully sustainable.[51] In
this respect, it has recently been considered that biomass would become a major source
for the production of energy and chemicals in the near future. Biomass is a term for all
organic material produced by green plants converting sunlight into plant material through
photosynthesis. Biomass includes variety of materials such as forest residues, agriculture
24
crops and residues, perennial grasses, aquatic biomass, animal manure, and municipal
solid wastes. At regional, national and global levels there are several drivers for using
biomass as primary source of energy. First of all, converting biomass into biofuels or
biochemicals helps solve the problem of food surplus in Western Europe and in the
US.[53][54] Also, biomass is a more secure energy supply since it is available all over
the world.[51] One of the most important reasons for using biomass as a primary source
of energy is that biomass is fully renewable, sustainable, and environmentally friendly.
Within the life circle of biomass, carbon dioxide produced from using biomass derived
fuels or chemicals are absorbed by a cycle of new growth. Therefore, using biomass can
alleviate the global warming effect.[53][55][56][57] In addition, biomass contains only
trace amount of sulfur and nitrogen that results in a very low emission of SOx and NOx,
which are the precursors of acid rain. Besides previously mentioned drivers, researchers
also claimed that developing biomass energy will promote development in rural
area.[51][53][57][58] Conclusively, biomass derived feedstocks are a promising choice
for the light olefin industry in the near future.
25
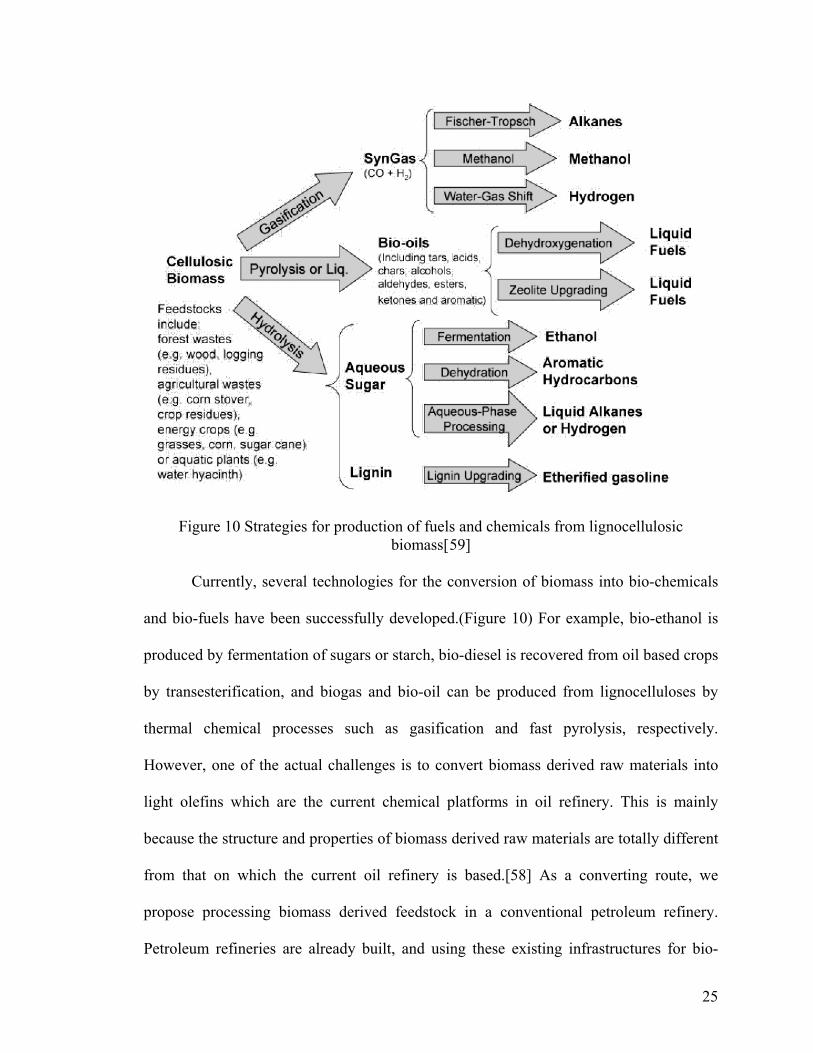
Figure 10 Strategies for production of fuels and chemicals from lignocellulosic biomass[59]
Currently, several technologies for the conversion of biomass into bio-chemicals
and bio-fuels have been successfully developed.(Figure 10) For example, bio-ethanol is
produced by fermentation of sugars or starch, bio-diesel is recovered from oil based crops
by transesterification, and biogas and bio-oil can be produced from lignocelluloses by
thermal chemical processes such as gasification and fast pyrolysis, respectively.
However, one of the actual challenges is to convert biomass derived raw materials into
light olefins which are the current chemical platforms in oil refinery. This is mainly
because the structure and properties of biomass derived raw materials are totally different
from that on which the current oil refinery is based.[58] As a converting route, we
propose processing biomass derived feedstock in a conventional petroleum refinery.
Petroleum refineries are already built, and using these existing infrastructures for bio-
26
chemicals production needs lower capital cost investment.[60] This is the starting point
of a progressive replacement of fossil oil based feedstock by biomass derived one.
1.5. Outline
This section outlines the format of this Manuscript-based thesis.
Chapter I
This chapter provides a general introduction to the situation of current light
olefins industry, the properties of light olefins and related reaction mechanisms in
petroleum conversion (both catalytic and non-catalytic), as well as any necessary
background information that are required to read this thesis. In particular, I will present
an overview of the industrial significance of light olefins and the current technologies for
their production. In addition, I will discuss about the roadblocks in the conventional light
olefins production, particularly the feedstocks used.
Chapter II
This chapter presents a general review of the design of hybrid catalysts used in the
Thermo-Catalytic/Steam-Cracking (TCSC) process and the phenomenon of hydrogen
spillover. It has been found that hydrogen spillover phenomenon shows significant
retarding effect of coke formation. This chapter presents the influence of the pore
characteristics and the acidity properties of the ZSM-5 zeolite-based component on the
oveall catalytic performance. Data of the present work shows that, in order to obtain
higher yields in light olefins, the ZSM-5 zeolite – the cracking component of the hybrid
catalyst – must have a relative low Si/Al ratio, so that its density of acid sites is high
(resulting in high total conversion) with a relatively mild acid strength (favouring a high
27
propylene/ethylene ratio). On the other hand, such milder acid sites also lead to a lower
amount of deposited coke, the latter exhibiting actually a lighter chemical nature. This
may ease the cleaning action of the hydrogen spilt-over species, resulting finally in a
greater on-stream stability of the hybrid catalyst. The present data, related to the intrinsic
properties of the zeolite component, are useful for the development of the hybrid catalysts
being used in the TCSC process where mixed feedstocks containing various biomass
derived compounds are used.
Chapter III
This chapter presents the starting point of our research on processing mixed
feedstocks containing biomass derived compounds and shows the beneficial effect of
bioethanol on the performance of the TCSC catalysts for the production of light olefins
from petroleum gas oil, suggesting that the integration of a small “biorefinery” to a
petrochemical production plant is now possible. This appears to be actually a good
approach for the partial replacement of petroleum feedstocks by biomass derived
chemicals. In fact, with the hybrid catalysts containing Zn-Pd based co-catalysts, which
show a high and positive sensitivity to ethanol, the use of “gas oil-ethanol” blends
significantly increases the product yields of light olefins. On the other hand, as a co-
reactant, methanol behaves very differently from ethanol over our hybrid catalysts. While
ethanol undergoes predominantly dehydration into ethylene, methanol predominantly
intervenes directly in the “hydrocarbon pool”, keeping the product propylene to ethylene
ratio almost constant and higher than 1.5.
Chapter IV
28
In our previous work (A. Muntasar, R. Le Van Mao, H.T. Yan, Ind. Eng. Chem.
Res. 49 (2010) 3611, (Chapter II)), we have found that a partial replacement of petroleum
feedstock with biomass derived compounds showed significantly increased product
yields of light olefins. In addition, methanol behaves very differently from ethanol when
it was used as a co-feedstock in the cracking of petroleum gas oil for the production of
light olefins. The “ethylene + propylene” products yields increased with increasing
methanol content in the mixed feedstock. Also, very importantly, the
“propylene/ethylene” product weight ratio remained almost constant with different levels
of blending. In the present work, the effect of methanol on a hydrocarbon feed was
investigated in more detail. The feedstock used was petroleum light naphtha whose
catalytic results were much easier to be interpreted than those of gas oil. The obtained
results showed that the addition of some methanol to petroleum light naphtha
significantly increased the product yield of C2-C4 olefins, particularly that of ethylene and
propylene. However, over 20-25 wt% of methanol content in the light naphtha feed, the
beneficial effect was attenuated.
Chapter V
It has been found that adding methanol to petroleum light naphtha resulted in a
significant increase in the product yield of light olefins and almost constant propylene to
ethylene ratio. In this chapter, we investigated the cracking behavior of the mixed “light
naphtha-methanol” feed in various operating conditions. Particularly the effects of the
steam dilution on the conversion, product selectivity and coke deposition would be
carefully observed under two specific situations: thermal cracking and overall catalytic
cracking (thermal + catalytic). Moreover, by measuring some kinetic parameters, we
29
answered the question raised in previous works (A. Muntasar, R. Le Van Mao, H.T. Yan,
Ind. Eng. Chem. Res. 49 (2010) 3611, (Chapter II) and H.T. Yan, R. Le Van Mao, catal.
Lett. 141 (2011) 691, (Chapter III)): when mixed with light naphtha hydrocarbons, does
methanol incorporate into the cracking “hydrocarbon pool” or merely react by itself?
Data of the present work shows that the increasing amount of methanol in the “light
naphtha-methanol” mixtures significantly modified the kinetics of the catalytic cracking.
The apparent activation energy decreased with an increasing methanol concentrations,
which can be attributed to the effect of intensive interactions between the hydrocarbon
and methanol molecules. This simplified kinetic study is useful for industrial catalysis
researchers to understand the phenomena of feed compatibility and to achieve a further
goal that is to gradually and partially replace petroleum feedstocks with long-lasting
fossil fuels sources (coal and natural gas) or biomass derived renewable sources.
Chapter VI
In the last three chapters, we thoroughly studied the effect of replacing petroleum
based feedstock with biomass or longer-lasting sources derived feedstock (particularly
ethanol and methanol) for the production of light olefins by performing several
mechanistic studies and simplified kinetic studies. In this chapter, we extended our
studies to other potential replacements of petroleum based feedstocks. These promising
replacements include biomass-derived glycerol, furfural, or bio-oil derived from
pyrolysis of cellulosic biomass. As a start point, we started our study with biomass-
derived glycerol from bio-diesel production, which is a low cost and quite abundant
feedstock having very limited applications. Our investigation showed that when glycerol
was added to n-hexane feed, its concentration should not exceed 30% in order to keep the
30
production yield of light olefins at an acceptable level. This is because glycerol easily
undergoes dimerization and cyclization reactions on the acidic sites over the surface of
zeolite. Consequently, these reactions lead to a formation of more aromatic molecules
and coke deposition. Therefore, more advanced hybrid nano-catalysts need to be
developed in order to successfully hydro-deoxygenate those oxygenate components of the
feed.
Chapter VII
This chapter gives brief conclusions of the work presented in this thesis as well as
some suggestions for future work.
31
Chapter II
Review: Design of TCSC Hybrid Catalysts and Phenomenon of Hydrogen Spillover
Published as:
H.T. Yan and R. Le Van Mao
Applied Catalysis A: General 375(1) (2010) 63-69
32
2.1. INTRODUCTION
Ethylene and propylene are the most important intermediates used in the
production of main plastics and synthetic fibres. [8] The current technology of production
of these olefins is steam-cracking, using various hydrocarbon feedstocks (light paraffins,
naphthas or gas oils). Setting aside this special period of economic recession, market
demands for ethylene and propylene have experienced significant and constant increases,
with a higher growth rate for propylene. [5][6] However, because the product selectivity
of the steam-cracking for propylene is quite low, the supply of this light olefin can be
compensated through the use of other production processes, such as propane
dehydrogenation, olefin metathesis, and, primarily, fluid catalytic cracking (FCC). The
latter technology, whose main objective is to produce gasoline, must incorporate some
ZSM-5 type zeolite as a catalyst additive so that the production of light olefins,
particularly propylene, can be increased significantly.
The thermo-catalytic cracking (TCC) process has been developed with the
objective to selectively produce light olefins from liquid hydrocarbon feedstocks such as
naphthas and gas oils [34-36], and more recently, heavy olefins. [37] The TCC process,
which combines the (mild) thermal cracking with the acid-promoted cracking of a
zeolite-based catalyst, can provide very high yields of light olefins (with the possibility of
varying the propylene-to-ethylene ratio) while operating at a temperature much lower
than those used in the steam-cracking process. Most of the catalysts used in the TCC
process are in the hybrid configuration, i.e., they are comprised of two porous
components with relatively high surface area: a main zeolite-based component, which has
cracking properties, and a co-catalyst, which has active sites that can affect the product
33
selectivity of the former (acidic) sites. These two catalyst particles are firmly bound to
each other by an inorganic binder that, in most cases, is bentonite clay. The “ideally
sparse particles configuration” in the hybrid catalyst [35] ensures an easy two-way
diffusion (of reaction intermediates) within the catalyst network; this is the so-called
“pore continuum” effect, which has been observed on many occasions, such as in
adsorption / desorption [41], and in different catalytic reactions such as aromatisation and
cracking. [6][32][40][43] Because the reaction temperature is relatively high (620-750
°C), the co-catalyst support must be very thermally and hydrothermally stable (such as
the amorphous alumina aerogel, being stabilized by yttria [45][46]). On the other hand,
the ZSM-5 zeolite is further stabilized by lanthanum. [36]
The role that the co-catalyst is expected to play, is to produce some hydrogen
species, in virtue of its steam-reforming activity, and to spill them over (its surface) to the
acidic sites of the main catalyst component. These hydrogen spilt-over (HSO) species can
exert some “cleaning action” on the coke precursors so that coking can be significantly
reduced and the run length (the period of time separating two catalyst decoking
operations - when the fixed-bed technology is used) can be improved. In our most recent
paper [42], it was shown that these HSO could easily reach the external surface of the
zeolite particle (surface area of the external part of the particle and the acid sites located
at the micropore mouths) but cannot go too deep inside the micropore network.
In previous works, the chemical/physical properties of the active surfaces (of
both zeolite and co-catalyst) have been thoroughly studied. [6][35][36][41][43-46] In the
present paper, we investigate in more detail the influence of the pore characteristics and
the acid properties of the ZSM-5 zeolite on the overall performance of the hybrid
34
catalyst. Some tests of surface contamination by 1,3,5-trimethylbenzene were also carried
out, just to exacerbate the fouling phenomena.
2.2. EXPERIMENTAL
2.2.1 Catalyst Preparation
Both hybrid and reference catalysts were prepared according the method
described in the previous papers. [35][36]
2.2.1.1 Main Catalyst Component (M-Cat)
50 g of HZSM-5 (powder, acid form, silicon/aluminum molar ratio = 25, 50, 100,
400, 1000, respectively, purchased from Zeochem, Switzerland) were added to a solution
that was prepared by dissolving 25.0 g of lanthanum nitrate hydrate (Strem Chemicals) in
500 mL of deionized water. The suspension, gently stirred, was heated to 80 C̊ for 2 h.
After filtration, the obtained solid was washed on the filter with 500 mL of water, then
dried at 120 ̊C overnight and finally activated at 500 ̊C for 3 h. This material was called
La-HZSM-5.
Then, a solution of 5.52 g of ammonium molybdate hexahydrate (Aldrich) in 89
mL of 3N H3PO4 was homogeneously impregnated onto 40.02g of La-HZSM-5. The
solid was dried at 120 C̊ overnight and finally activated at 500 ̊C for 3 h.
Its chemical composition was as follows: MoO3, 8.0 wt %; La2O3, 2.5 wt %;
phosphorous, 4.1 wt %; and zeolite, balance.
2.2.1.2 Co-catalyst (Co-Cat)
A mixture of 2.59 g of nickel nitrate hexahydrate (Strem) in 20 mL of deionized
water and 0.036g of ruthenium acetylacetonate (Strem) in 25 mL of methanol, was
homogeneously impregnated onto 20.0 g of yttria-stabilized alumina aerogel, Y-AA.
35
After drying at 120 ̊C overnight, the solid was activated at 500 ̊C for 3 h. Its chemical
composition was: nickel, 2.5 wt %; ruthenium, 0.05 wt %; and Y- AA, balance.
It is to note that, because TCC catalysts have to operate at relatively high
temperatures (620 C̊ – 750 ̊C), the co-catalyst and its support (Y-AA) should be
hydrothermally stable at those temperatures, as already mentioned. [45][46]
2.2.1.3 Hybrid Catalyst (Z-HYB) and Reference Catalyst (Z-REF)
The hybrid catalyst (Z-HYB) was obtained by extruding the main component (M-
Cat) with the co-catalyst (Co-Cat) in the following proportions: M-Cat, 65.6 wt %; Co-
Cat, 16.4 wt %; and binder, 18.0 wt %. Bentonite clay (Aldrich) was used as the
extruding and binding medium.
The reference catalyst (Z-REF) was obtained by extruding M-Cat with pure Y-
AA and bentonite in the same proportions as for HYB.
Z-HYB and Z-REF were dried at 120 ̊C overnight and finally activated at 750 C̊
for 3 h.
2.2.2 Catalyst Characterization
2.2.2.1 Chemical Composition
The chemical composition of various catalyst components were determined by
atomic absorption spectroscopy.
2.2.2.2 Physical Properties
The BET total surface area and pore size of these samples were determined by
nitrogen adsorption/desorption at 77K, using a Micromeretics ASAP 2000 apparatus.
Samples were out-gassed in vacuum for 4h at 220 ̊C before N2 physisorption. Specific
surface areas were calculated according to the Brunauer-Emmett-Teller (BET) method.
36
2.2.2.3 Acid Sites Properties
(a) Density of acid sites:
The NH3-TPD of various samples was recorded using a fixed-bed reactor
equipped with a programmable temperature controller. The total surface acidity was
measured by a back-titration method as described elsewhere. [6]
(b) Nature of acidic sites and strength profile:
Fourier transform infrared spectra of adsorbed pyridine were recorded in order to
evaluate the nature of acidic sites (i.e. Bronsted and Lewis sites). The transmission
spectra were recorded using a Nicolet FTIR spectrometer (Magna 500 model) in the
region of 1400-1800 cm-1, with resolution of 4 cm-1. The detailed measurements have
been previously described. [43][44]
The identification and the assignment of the bands formed upon pyridine
adsorption is well documented in the literature. [6 and references therein]
Particularly, the distribution of the acid sites of the zeolites in terms of strength
was previously studied by NH3-TPD method using a pH-meter equipped with an ion-
selective electrode. [6]
2.2.2.4 Study of Coke Deposition
Thermogravimetric analysis (TGA) and differential thermal analysis (DTA),
using a PL Thermal Sciences Model STA-1500 DTA/TGA apparatus, were used to
determine the amount of bound species and/or coke deposited onto the catalyst surface.
The flow rate of air was set at 30 mL/min. The rate of the temperature-programmed
heating (TPH) was set at 10 ̊C/min.
37
2.2.3 Experimental Set-up and Testing Procedure
Experiments were performed using a Lindberg one-zone tubular furnace. The
reactor vessel consisted of a quartz tube 50 cm long, 1.5 cm in outer diameter and 1.2 cm
in inner diameter. The temperatures were controlled and regulated by automatic devices
that were connected to chromel-alumel thermocouples (set in the catalyst bed and in the
pre-heating zone) and the heating furnace.
n-hexane (Aldrich) was used as a model for liquid hydrocarbon feed. In some
tests of surface contamination, 1,3,5-trimethylbenzene (135TMB, Aldrich) was added in
various concentrations. The feed and water were injected into a vaporizer using two
infusion pumps. In the vaporizer, nitrogen used as carrier gas, was mixed with the
vaporized feed/steam, and the gaseous stream was then sent into the tubular reactor. The
testing conditions used were as follows: temperature, 700 ̊C; total weight hourly space
velocity (WHSV, feed and steam), 1.52h-1; catalyst weight, 2.1g; steam/feed weight ratio,
0.5.
Liquid and gaseous products were collected separately, using a system of
condensers. The gas-phase components were analyzed using a Hewlett-Packard Model
5890 FID gas chromatograph that was equipped with a 30-m GS-alumina micro-packed
column (J & W Scientific), whereas the analysis of the liquid phase was performed using
a Hewlett-Packard gas chromatograph (Model 5890, with flame ionization detection
(FID)) that was equipped with a Heliflex AT-5 column (Alltech, 30m, nonpolar).
The total conversion (wt %) was expressed as the number of grams of all the
products collected at the reactor outlet, by 100g of feed, referring to n-hexane or
eventually to the mixture of n-hexane and 1,3,5-TMB, therein called FEED, as follows.
38
Conversion (wt %) = [(FEEDin – FEEDout)/FEEDin] 100 (wt %), with FEED in
and FEED out being the total weight of (n-hexane and eventually, 1,3.5-TMB) injected
into the reactor and the unconverted feed determined in the reactor out-stream,
respectively.
The selectivity of product i (Yi) was expressed as the number of grams of product
i recovered, by 100 g of total products collected (wt %). It is important to note that the
experimental error usually observed on total conversion and calculated product selectivity
was ± 0.2 wt %.
2.3 RESULTS AND DISCUSSION
2.3.1 Main Physico-chemical Properties of the Hybrid Catalyst Components
In our previous paper [8], the main chemical properties of the two components
of the hybrid catalyst, the acidic ZSM-5 zeolite and the Ni bearing support (Y-alumina
aerogel or Y-AA), were reported. In the present paper, the pore characteristics and the
surface acidity properties were carefully investigated because they were believed to have
a great influence on the overall catalytic performance.
2.3.1.1 Determination of the Extent of the External Surface Area of the ZSM-5 Zeolite Particles:
Table 1 reports the results of the BET analysis of the various hybrid catalysts and
their corresponding references. Herein, the BET surface area corresponding to the
micropores was assigned to the internal surface of the zeolite particle whereas that of
larger pores was attributed to its external surface. Thus, the external surface included the
surface area that was external to the zeolite particle, and the surface area corresponding to
that of the (large - sized) mouths of the micropores.
39
Except for the very SiO2 rich 1000H sample, all these other ZSM-5 samples or
corresponding catalysts showed an external surface area higher than 1/3 of the total
surface area (Table 1): on such “open” surface, the catalytic reaction was not submitted to
the same constraints (shape-selectivity) as on the micropores-related internal surface. It is
to note that the SAR values (external to internal surface area ratio) of the hybrid catalysts
and their corresponding references showed the same variation trend (with increasing
zeolite SiO2/Al2O3 ratio) as that of the parent zeolites, the co-catalyst or co-catalyst
support being incorporated in the same percentage.
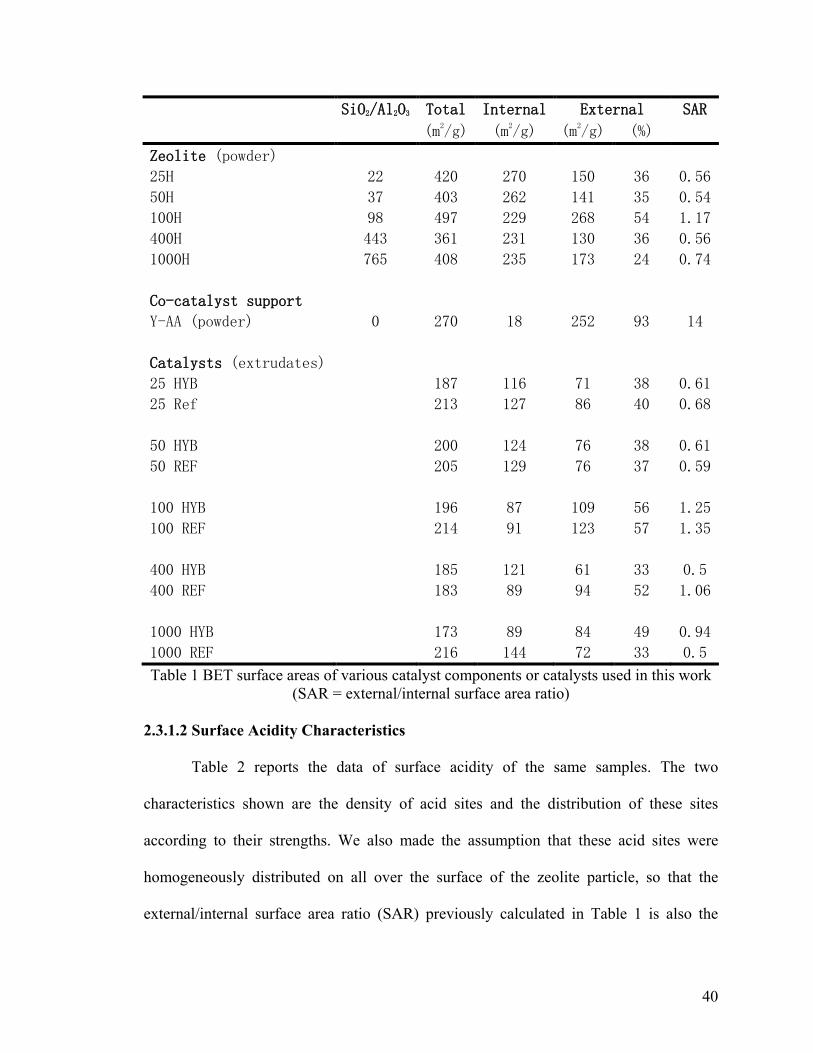
40
SiO2/Al2O3 Total Internal External SAR
(m2/g) (m2/g) (m2/g) (%)
Zeolite (powder)
25H 22 420 270 150 36 0.56
50H 37 403 262 141 35 0.54
100H 98 497 229 268 54 1.17
400H 443 361 231 130 36 0.56
1000H 765 408 235 173 24 0.74
Co-catalyst support
Y-AA (powder) 0 270 18 252 93 14
Catalysts (extrudates)
25 HYB 187 116 71 38 0.61
25 Ref 213 127 86 40 0.68
50 HYB 200 124 76 38 0.61
50 REF 205 129 76 37 0.59
100 HYB 196 87 109 56 1.25
100 REF 214 91 123 57 1.35
400 HYB 185 121 61 33 0.5
400 REF 183 89 94 52 1.06
1000 HYB 173 89 84 49 0.94
1000 REF 216 144 72 33 0.5
Table 1 BET surface areas of various catalyst components or catalysts used in this work (SAR = external/internal surface area ratio)
2.3.1.2 Surface Acidity Characteristics
Table 2 reports the data of surface acidity of the same samples. The two
characteristics shown are the density of acid sites and the distribution of these sites
according to their strengths. We also made the assumption that these acid sites were
homogeneously distributed on all over the surface of the zeolite particle, so that the
external/internal surface area ratio (SAR) previously calculated in Table 1 is also the
41
distribution ratio of the acid sites on the external surface to those of the internal surface of
the zeolite particle. In terms of acid strength, as expected, a zeolite material with higher
Si/Al atom ratio provides stronger acid sites, corresponding to higher desorption
temperatures for pre-adsorbed NH3. It is to note that the ISE method used for the
investigation on the distribution of the acid site strength was not sensitive enough to
detect the very low concentration of the desorbed NH3 (case of 1000H and related
materials). However, it is not illogical to say that, by considering the trend in the strength
distribution in Table 2, most of the acid sites of the 1000H zeolite were strong: this
statement was later confirmed by the qualitative investigation of the acid sites using the
FT-IR technique applied to pre-adsorbed pyridine (Figure 11 to Figure 13, in the
following section).
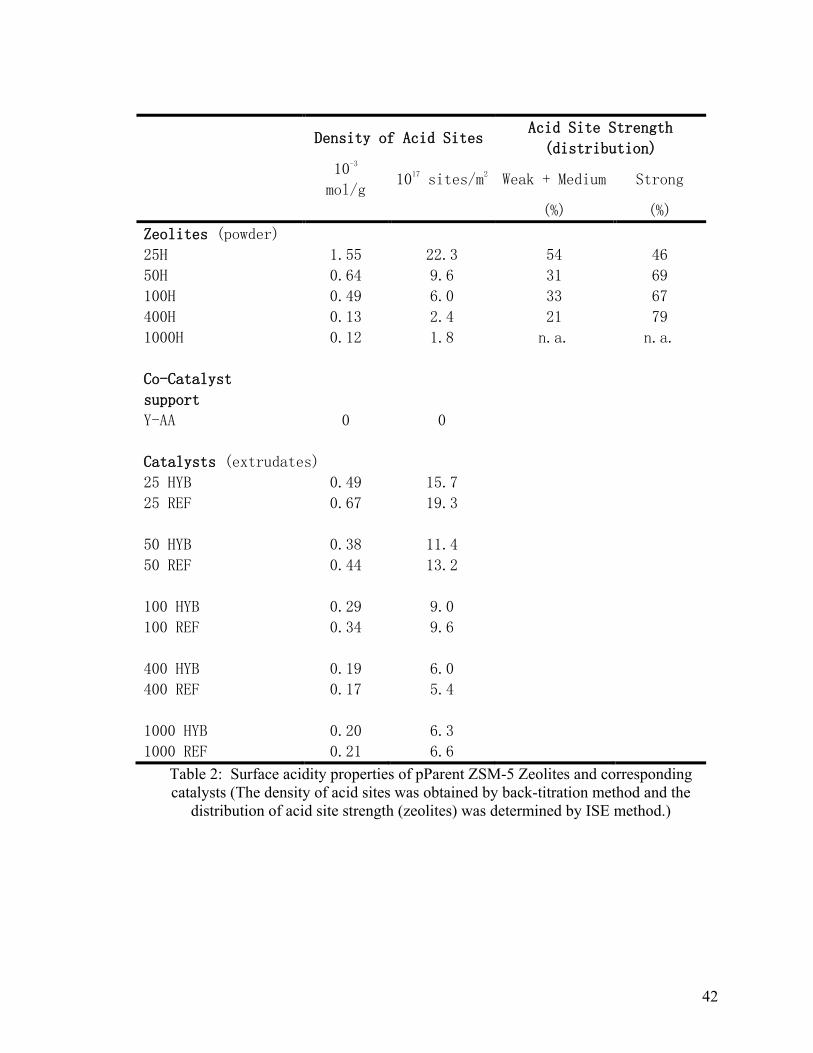
42
Density of Acid Sites Acid Site Strength
(distribution)
10-3
mol/g 1017 sites/m2 Weak + Medium Strong
(%) (%)
Zeolites (powder)
25H 1.55 22.3 54 46
50H 0.64 9.6 31 69
100H 0.49 6.0 33 67
400H 0.13 2.4 21 79
1000H 0.12 1.8 n.a. n.a.
Co-Catalyst
support
Y-AA 0 0
Catalysts (extrudates)
25 HYB 0.49 15.7
25 REF 0.67 19.3
50 HYB 0.38 11.4
50 REF 0.44 13.2
100 HYB 0.29 9.0
100 REF 0.34 9.6
400 HYB 0.19 6.0
400 REF 0.17 5.4
1000 HYB 0.20 6.3
1000 REF 0.21 6.6
Table 2: Surface acidity properties of pParent ZSM-5 Zeolites and corresponding catalysts (The density of acid sites was obtained by back-titration method and the
distribution of acid site strength (zeolites) was determined by ISE method.)
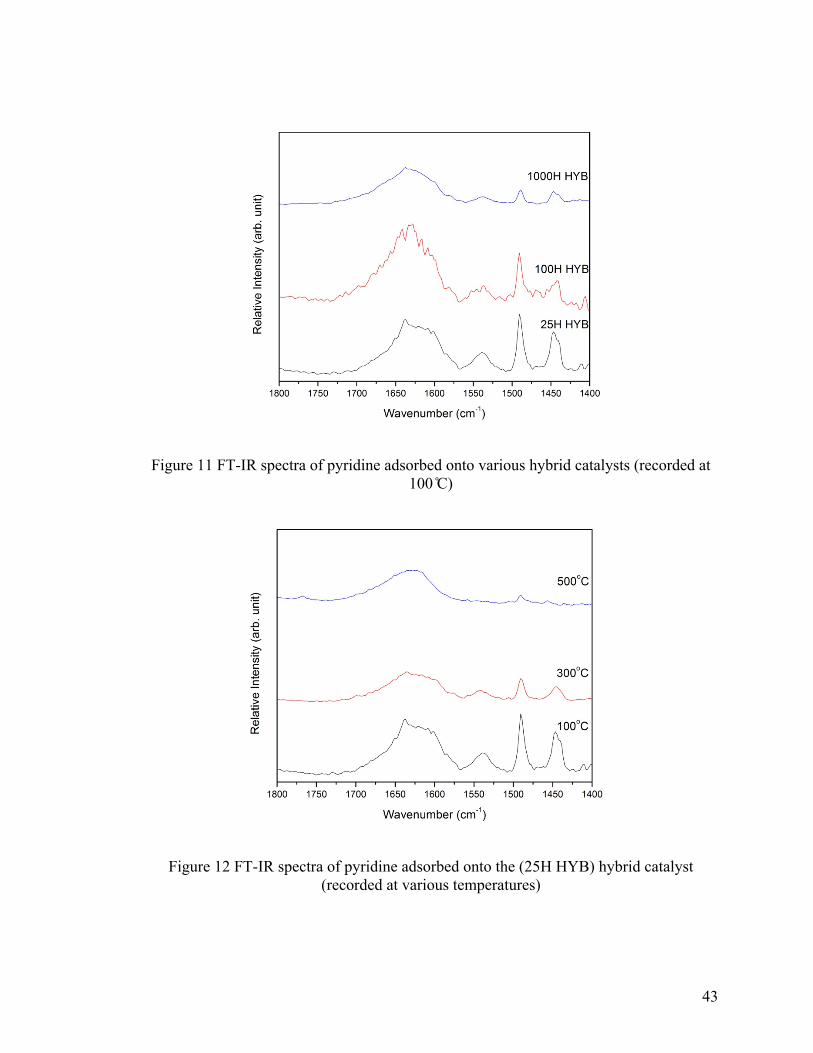
43
Figure 11 FT-IR spectra of pyridine adsorbed onto various hybrid catalysts (recorded at 100 ̊C)
Figure 12 FT-IR spectra of pyridine adsorbed onto the (25H HYB) hybrid catalyst (recorded at various temperatures)
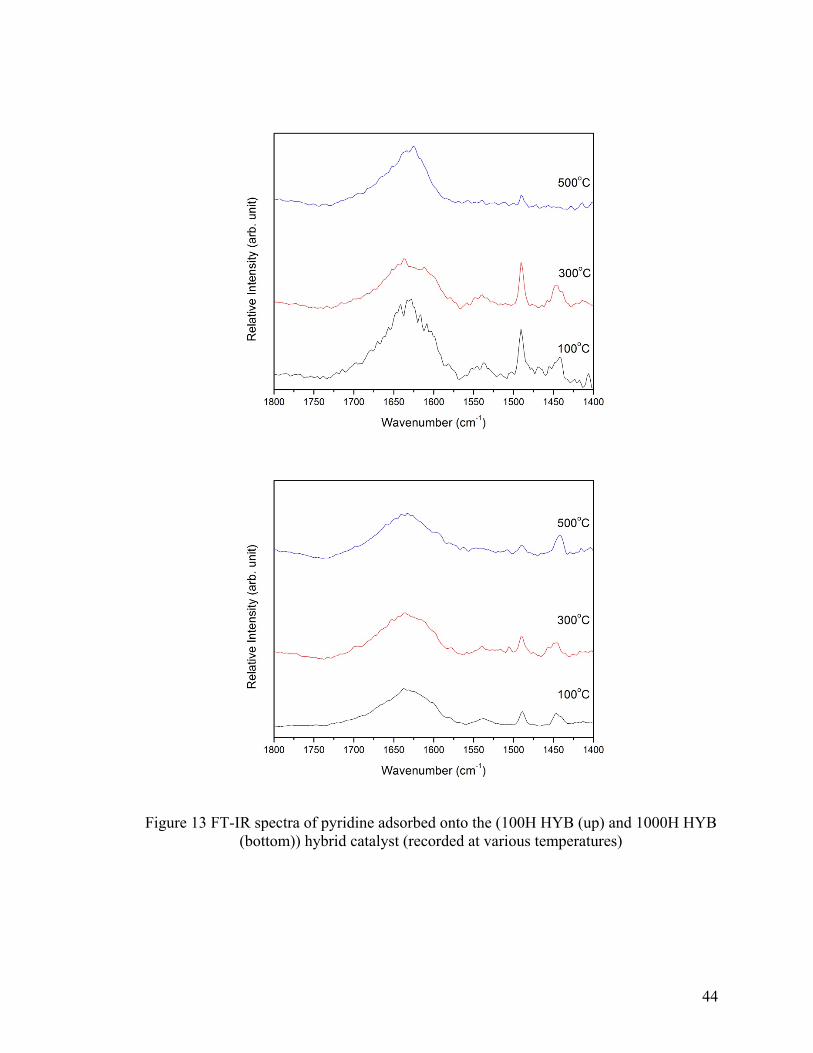
44
Figure 13 FT-IR spectra of pyridine adsorbed onto the (100H HYB (up) and 1000H HYB (bottom)) hybrid catalyst (recorded at various temperatures)
45
The acidity study using FT-IR technique applied to pyridine adsorption showed
that:
1) The FT-IR band at ca. 1540 cm-1 that is usually assigned to pyridine molecules
adsorbed on Brönsted acid sites, as well as the band at ca. 1485 cm-1 that is usually
assigned to pyridine molecules adsorbed on both Brönsted and Lewis acid sites,
decreased with higher zeolite SiO2/Al2O3 mol ratios (Figure 11). Such observation is
perfectly coincident with the results of Table 2 that showed the same trend for the total
density of acid sites.
2) The desorption of the pre-adsorbed pyridine by increasing the temperature of the FT-
IR cell, both FT-IR bands recorded on the 25 HYB catalyst prepared from the 25H ZSM-
5 zeolite, significantly decreased, suggesting that the acid sites of that catalyst were quite
weak, or at least not very strong (Figure 12).
3) The FT-IR band assigned to the Lewis acid sites (ca. 1450 cm-1) of the 1000 HYB
catalyst appeared to withstand much better high desorption temperatures (Figure 13): this
suggests that the 1000H zeolite possessed much stronger Lewis acid sites.
2.3.2 Catalytic Performance of Various Hybrid Catalysts, Related to the Si/Al Atom
Ratio of Their Zeolite Components
Table 3 reports the catalytic performance of the hybrid catalysts and their
references measured in the testing conditions as mentioned in the experimental section.
There are some (minor) differences between the hybrid catalysts and their
corresponding references in terms of catalytic behaviour (total conversion, product
selectivity into light olefins and other reaction products). However, the differences
became very significant when the coke deposition was considered (Table 3):
46
a) Total coke deposition (wt %) was much larger for the reference samples, indicating
the strong “cleaning” effect of the hydrogen spilt-over species produced by the co-
catalyst.
b) Coke deposition per mmol of acid sites (g/mmol, Table 3) became much larger for
the reference samples at higher Si/Al atom ratio, indicating that when the acid sites were
stronger (Table 2) the effect of the hydrogen spilt-over species was more significant.
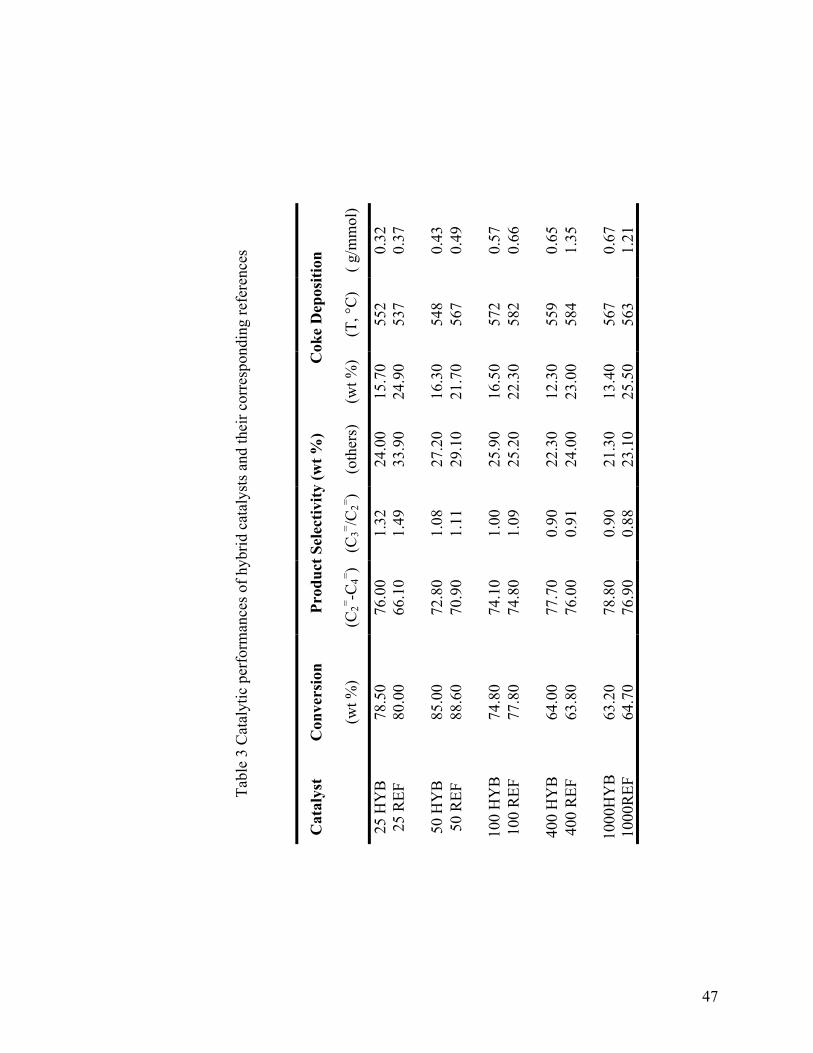
47
Tabl
e 3
Cat
alyt
ic p
erfo
rman
ces o
f hyb
rid c
atal
ysts
and
thei
r cor
resp
ondi
ng re
fere
nces
Cok
e D
epos
ition
( g/m
mol
)
0.32
0.
37
0.
43
0.49
0.
57
0.66
0.
65
1.35
0.
67
1.21
(T, °
C)
552
537
548
567
572
582
559
584
567
563
(wt %
)
15.7
0 24
.90
16.3
0 21
.70
16.5
0 22
.30
12.3
0 23
.00
13.4
0 25
.50
Prod
uct S
elec
tivity
(wt %
)
(oth
ers)
24.0
0 33
.90
27.2
0 29
.10
25.9
0 25
.20
22.3
0 24
.00
21.3
0 23
.10
(C3= /C
2= )
1.32
1.
49
1.
08
1.11
1.
00
1.09
0.
90
0.91
0.
90
0.88
(C2= -C
4= )
76.0
0 66
.10
72.8
0 70
.90
74.1
0 74
.80
77.7
0 76
.00
78.8
0 76
.90
Con
vers
ion
(wt %
)
78.5
0 80
.00
85.0
0 88
.60
74.8
0 77
.80
64.0
0 63
.80
63.2
0 64
.70
Cat
alys
t
25 H
YB
25
REF
50
HY
B
50 R
EF
10
0 H
YB
10
0 R
EF
40
0 H
YB
40
0 R
EF
10
00H
YB
10
00R
EF
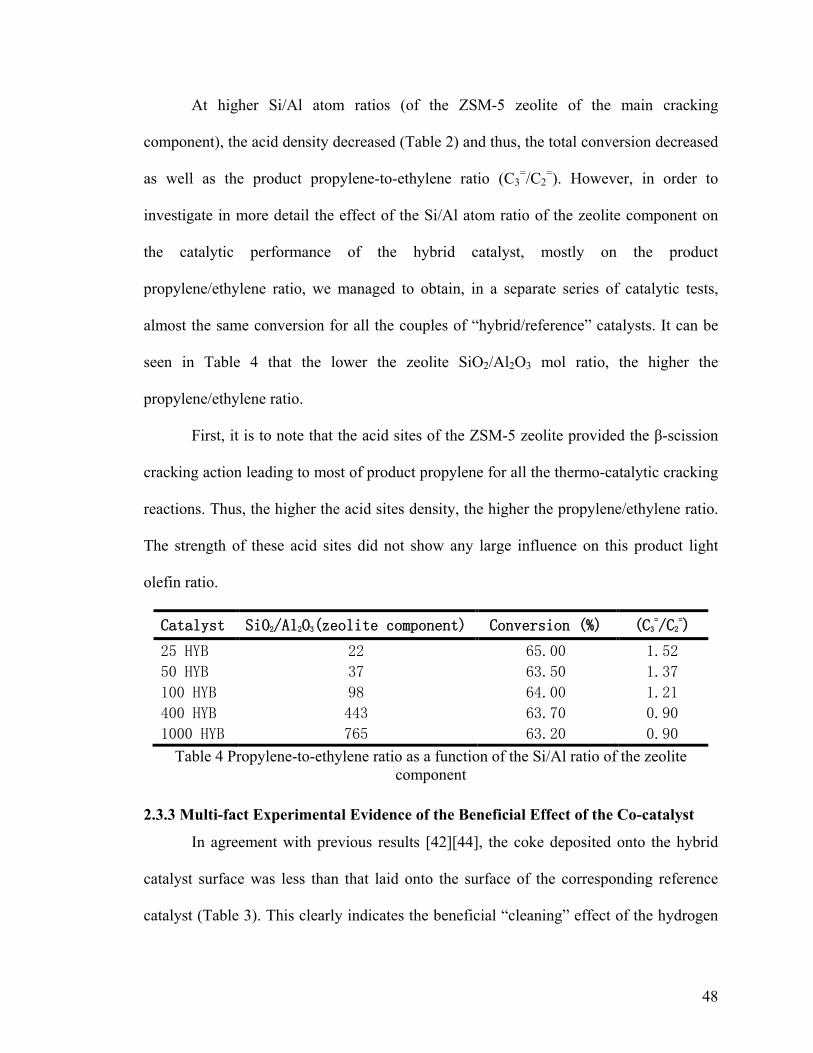
48
At higher Si/Al atom ratios (of the ZSM-5 zeolite of the main cracking
component), the acid density decreased (Table 2) and thus, the total conversion decreased
as well as the product propylene-to-ethylene ratio (C3=/C2
=). However, in order to
investigate in more detail the effect of the Si/Al atom ratio of the zeolite component on
the catalytic performance of the hybrid catalyst, mostly on the product
propylene/ethylene ratio, we managed to obtain, in a separate series of catalytic tests,
almost the same conversion for all the couples of “hybrid/reference” catalysts. It can be
seen in Table 4 that the lower the zeolite SiO2/Al2O3 mol ratio, the higher the
propylene/ethylene ratio.
First, it is to note that the acid sites of the ZSM-5 zeolite provided the β-scission
cracking action leading to most of product propylene for all the thermo-catalytic cracking
reactions. Thus, the higher the acid sites density, the higher the propylene/ethylene ratio.
The strength of these acid sites did not show any large influence on this product light
olefin ratio.
Catalyst SiO2/Al2O3(zeolite component) Conversion (%) (C3=/C2
=)
25 HYB 22 65.00 1.52
50 HYB 37 63.50 1.37
100 HYB 98 64.00 1.21
400 HYB 443 63.70 0.90
1000 HYB 765 63.20 0.90
Table 4 Propylene-to-ethylene ratio as a function of the Si/Al ratio of the zeolite component
2.3.3 Multi-fact Experimental Evidence of the Beneficial Effect of the Co-catalyst
In agreement with previous results [42][44], the coke deposited onto the hybrid
catalyst surface was less than that laid onto the surface of the corresponding reference
catalyst (Table 3). This clearly indicates the beneficial “cleaning” effect of the hydrogen
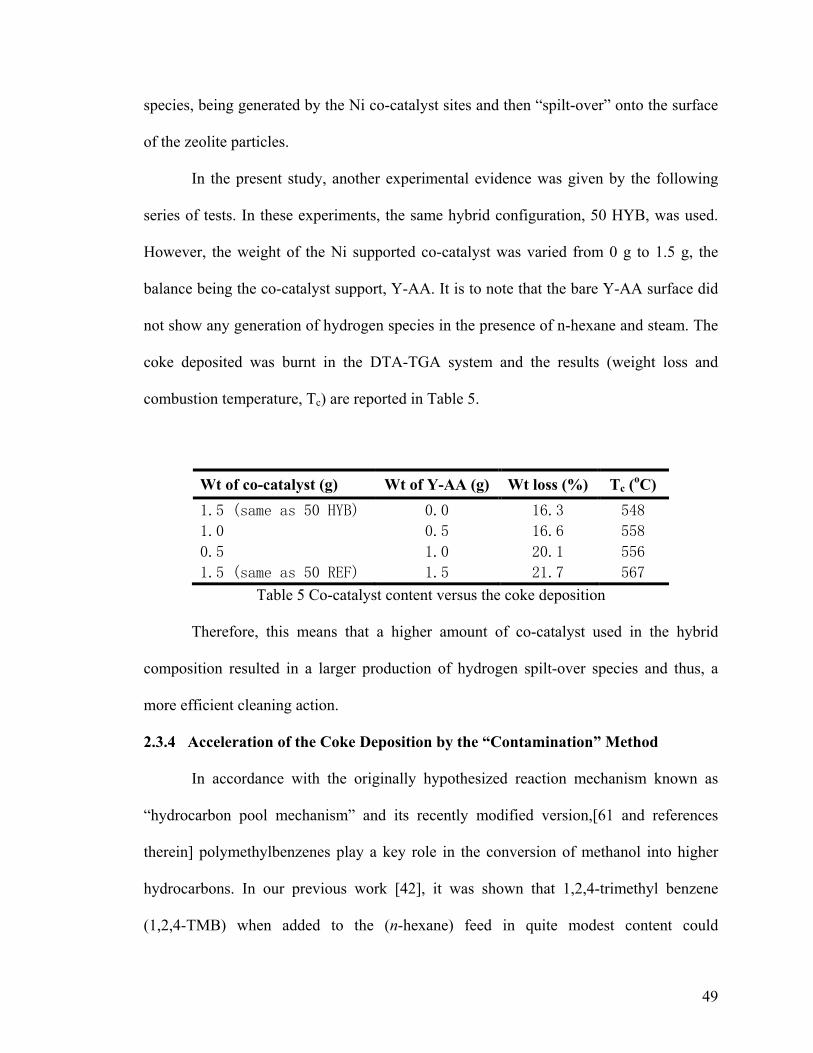
49
species, being generated by the Ni co-catalyst sites and then “spilt-over” onto the surface
of the zeolite particles.
In the present study, another experimental evidence was given by the following
series of tests. In these experiments, the same hybrid configuration, 50 HYB, was used.
However, the weight of the Ni supported co-catalyst was varied from 0 g to 1.5 g, the
balance being the co-catalyst support, Y-AA. It is to note that the bare Y-AA surface did
not show any generation of hydrogen species in the presence of n-hexane and steam. The
coke deposited was burnt in the DTA-TGA system and the results (weight loss and
combustion temperature, Tc) are reported in Table 5.
Wt of co-catalyst (g) Wt of Y-AA (g) Wt loss (%) Tc (oC) 1.5 (same as 50 HYB) 0.0 16.3 548
1.0 0.5 16.6 558
0.5 1.0 20.1 556
1.5 (same as 50 REF) 1.5 21.7 567
Table 5 Co-catalyst content versus the coke deposition
Therefore, this means that a higher amount of co-catalyst used in the hybrid
composition resulted in a larger production of hydrogen spilt-over species and thus, a
more efficient cleaning action.
2.3.4 Acceleration of the Coke Deposition by the “Contamination” Method
In accordance with the originally hypothesized reaction mechanism known as
“hydrocarbon pool mechanism” and its recently modified version,[61 and references
therein] polymethylbenzenes play a key role in the conversion of methanol into higher
hydrocarbons. In our previous work [42], it was shown that 1,2,4-trimethyl benzene
(1,2,4-TMB) when added to the (n-hexane) feed in quite modest content could
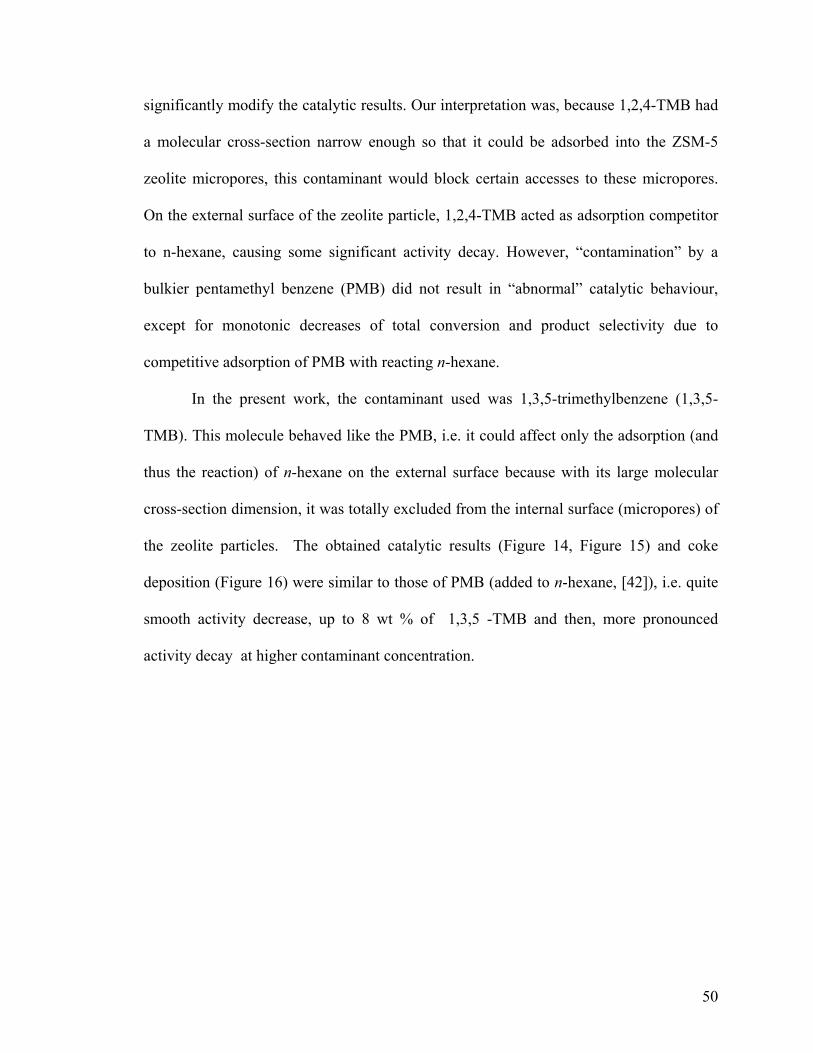
50
significantly modify the catalytic results. Our interpretation was, because 1,2,4-TMB had
a molecular cross-section narrow enough so that it could be adsorbed into the ZSM-5
zeolite micropores, this contaminant would block certain accesses to these micropores.
On the external surface of the zeolite particle, 1,2,4-TMB acted as adsorption competitor
to n-hexane, causing some significant activity decay. However, “contamination” by a
bulkier pentamethyl benzene (PMB) did not result in “abnormal” catalytic behaviour,
except for monotonic decreases of total conversion and product selectivity due to
competitive adsorption of PMB with reacting n-hexane.
In the present work, the contaminant used was 1,3,5-trimethylbenzene (1,3,5-
TMB). This molecule behaved like the PMB, i.e. it could affect only the adsorption (and
thus the reaction) of n-hexane on the external surface because with its large molecular
cross-section dimension, it was totally excluded from the internal surface (micropores) of
the zeolite particles. The obtained catalytic results (Figure 14, Figure 15) and coke
deposition (Figure 16) were similar to those of PMB (added to n-hexane, [42]), i.e. quite
smooth activity decrease, up to 8 wt % of 1,3,5 -TMB and then, more pronounced
activity decay at higher contaminant concentration.
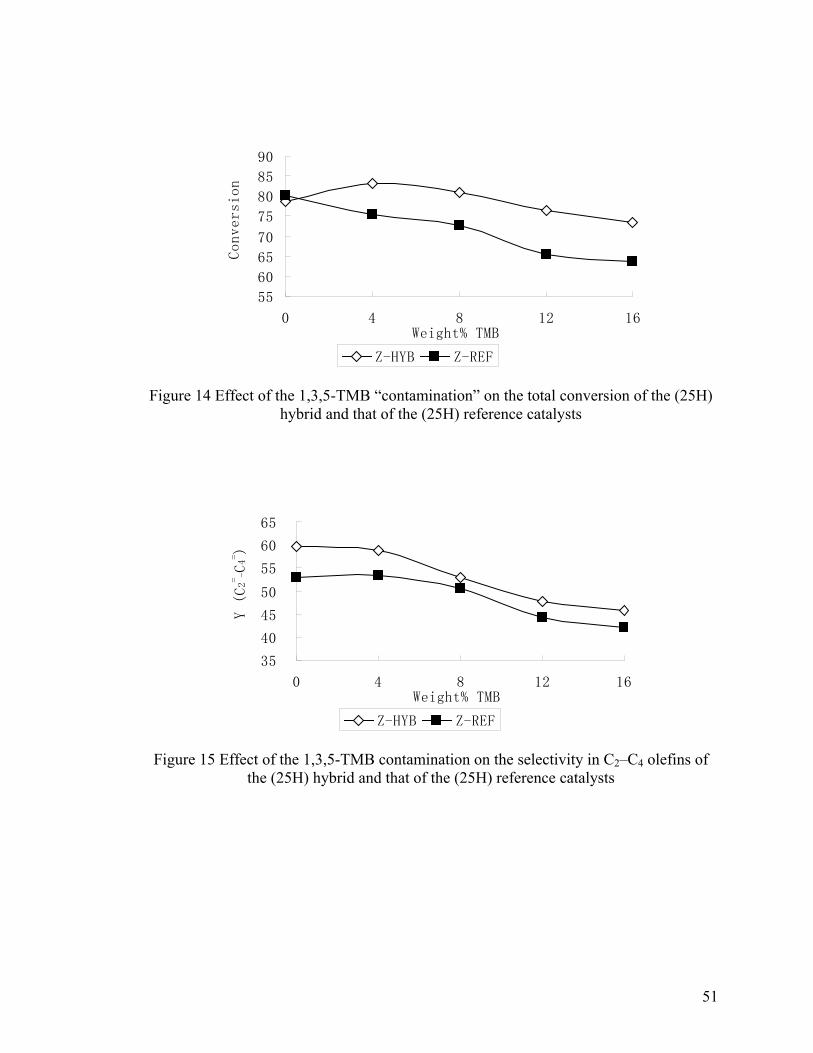
51
Figure 14 Effect of the 1,3,5-TMB “contamination” on the total conversion of the (25H)
hybrid and that of the (25H) reference catalysts
Figure 15 Effect of the 1,3,5-TMB contamination on the selectivity in C2–C4 olefins of
the (25H) hybrid and that of the (25H) reference catalysts
55
60
65
70
75
80
85
90
0 4 8 12 16Weight% TMB
Conversion
Z-HYB Z-REF
35
40
45
50
55
60
65
0 4 8 12 16Weight% TMB
Y (C2= -C
4= )
Z-HYB Z-REF
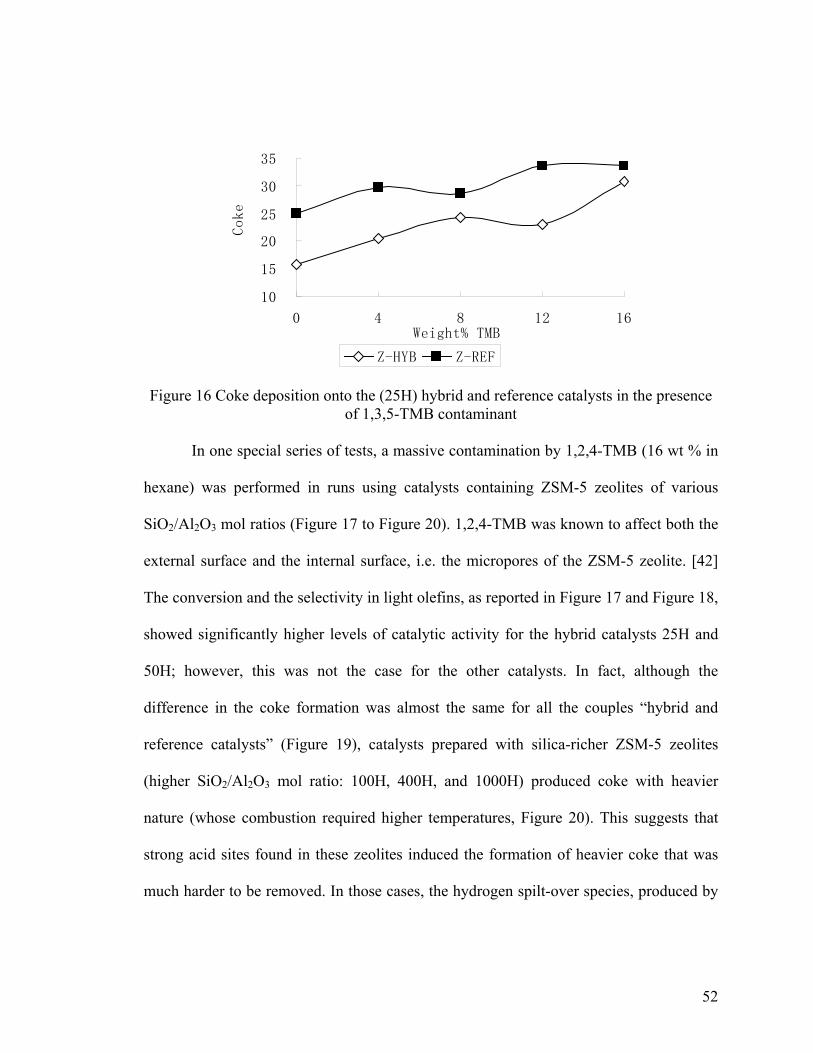
52
Figure 16 Coke deposition onto the (25H) hybrid and reference catalysts in the presence
of 1,3,5-TMB contaminant
In one special series of tests, a massive contamination by 1,2,4-TMB (16 wt % in
hexane) was performed in runs using catalysts containing ZSM-5 zeolites of various
SiO2/Al2O3 mol ratios (Figure 17 to Figure 20). 1,2,4-TMB was known to affect both the
external surface and the internal surface, i.e. the micropores of the ZSM-5 zeolite. [42]
The conversion and the selectivity in light olefins, as reported in Figure 17 and Figure 18,
showed significantly higher levels of catalytic activity for the hybrid catalysts 25H and
50H; however, this was not the case for the other catalysts. In fact, although the
difference in the coke formation was almost the same for all the couples “hybrid and
reference catalysts” (Figure 19), catalysts prepared with silica-richer ZSM-5 zeolites
(higher SiO2/Al2O3 mol ratio: 100H, 400H, and 1000H) produced coke with heavier
nature (whose combustion required higher temperatures, Figure 20). This suggests that
strong acid sites found in these zeolites induced the formation of heavier coke that was
much harder to be removed. In those cases, the hydrogen spilt-over species, produced by
10
15
20
25
30
35
0 4 8 12 16Weight% TMB
Coke
Z-HYB Z-REF
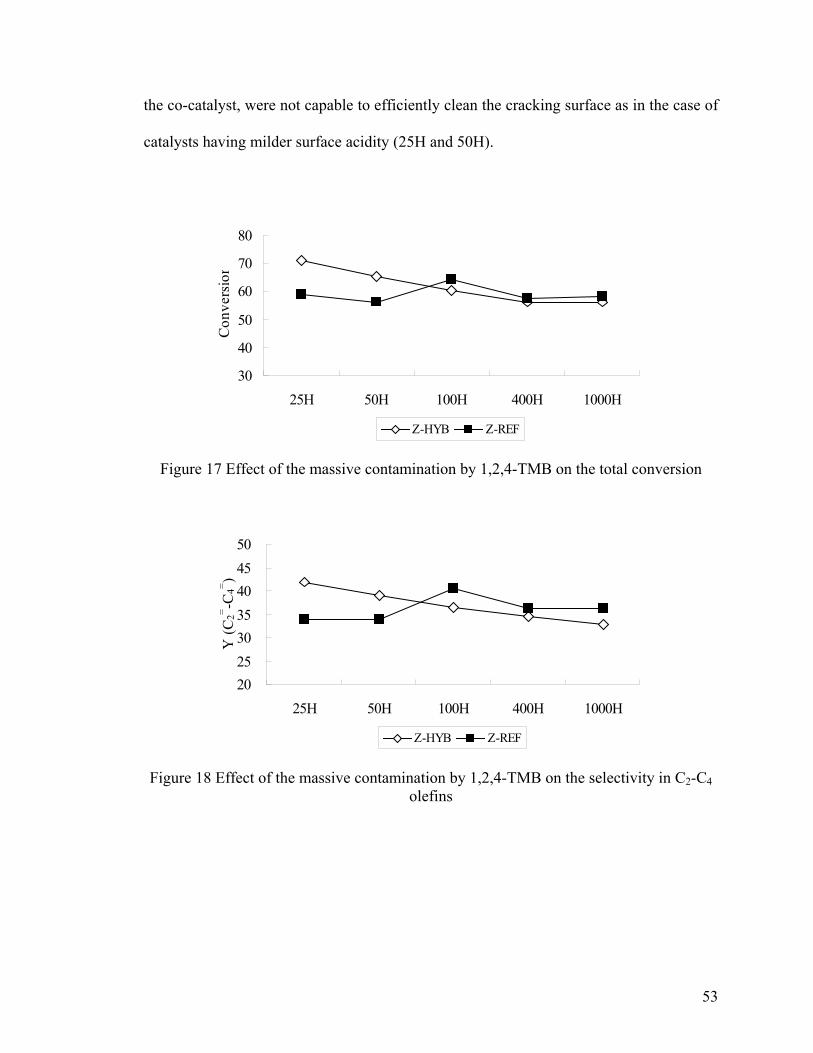
53
the co-catalyst, were not capable to efficiently clean the cracking surface as in the case of
catalysts having milder surface acidity (25H and 50H).
Figure 17 Effect of the massive contamination by 1,2,4-TMB on the total conversion
Figure 18 Effect of the massive contamination by 1,2,4-TMB on the selectivity in C2-C4
olefins
30
40
50
60
70
80
25H 50H 100H 400H 1000H
Con
vers
ion
Z-HYB Z-REF
20253035404550
25H 50H 100H 400H 1000H
Y (C
2= -C4= )
Z-HYB Z-REF
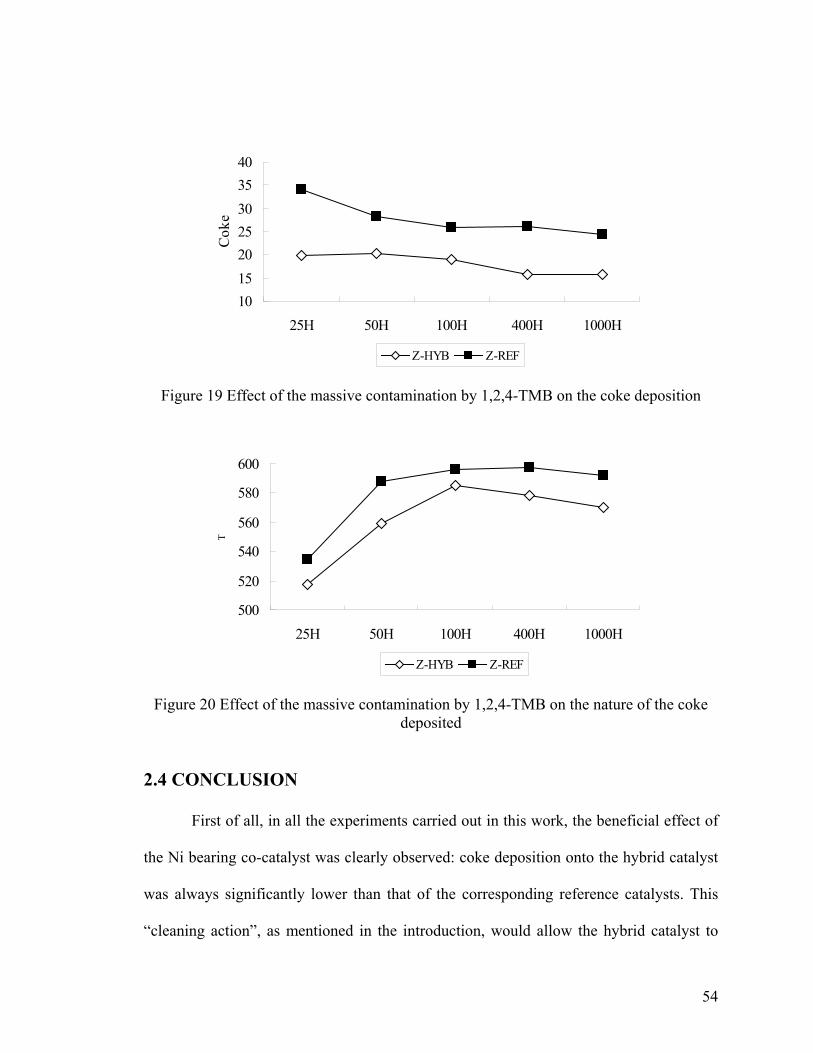
54
Figure 19 Effect of the massive contamination by 1,2,4-TMB on the coke deposition
Figure 20 Effect of the massive contamination by 1,2,4-TMB on the nature of the coke
deposited
2.4 CONCLUSION
First of all, in all the experiments carried out in this work, the beneficial effect of
the Ni bearing co-catalyst was clearly observed: coke deposition onto the hybrid catalyst
was always significantly lower than that of the corresponding reference catalysts. This
“cleaning action”, as mentioned in the introduction, would allow the hybrid catalyst to
10152025303540
25H 50H 100H 400H 1000H
Cok
e
Z-HYB Z-REF
500
520
540
560
580
600
25H 50H 100H 400H 1000H
T
Z-HYB Z-REF
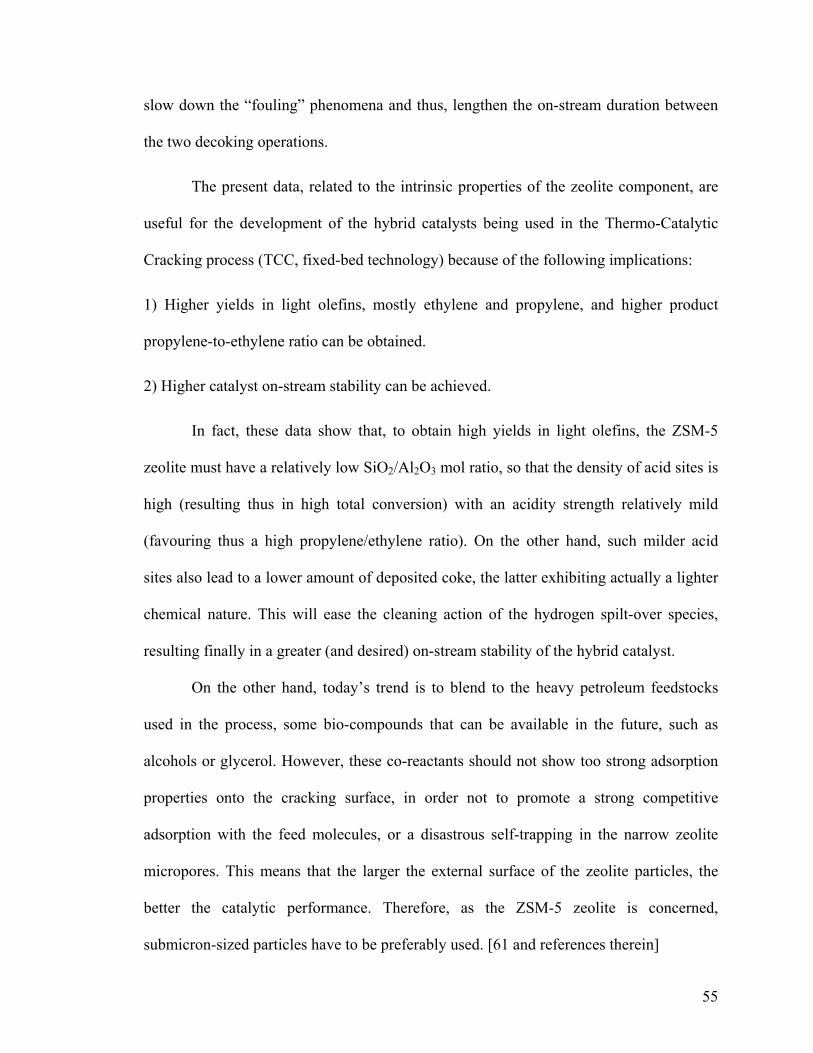
55
slow down the “fouling” phenomena and thus, lengthen the on-stream duration between
the two decoking operations.
The present data, related to the intrinsic properties of the zeolite component, are
useful for the development of the hybrid catalysts being used in the Thermo-Catalytic
Cracking process (TCC, fixed-bed technology) because of the following implications:
1) Higher yields in light olefins, mostly ethylene and propylene, and higher product
propylene-to-ethylene ratio can be obtained.
2) Higher catalyst on-stream stability can be achieved.
In fact, these data show that, to obtain high yields in light olefins, the ZSM-5
zeolite must have a relatively low SiO2/Al2O3 mol ratio, so that the density of acid sites is
high (resulting thus in high total conversion) with an acidity strength relatively mild
(favouring thus a high propylene/ethylene ratio). On the other hand, such milder acid
sites also lead to a lower amount of deposited coke, the latter exhibiting actually a lighter
chemical nature. This will ease the cleaning action of the hydrogen spilt-over species,
resulting finally in a greater (and desired) on-stream stability of the hybrid catalyst.
On the other hand, today’s trend is to blend to the heavy petroleum feedstocks
used in the process, some bio-compounds that can be available in the future, such as
alcohols or glycerol. However, these co-reactants should not show too strong adsorption
properties onto the cracking surface, in order not to promote a strong competitive
adsorption with the feed molecules, or a disastrous self-trapping in the narrow zeolite
micropores. This means that the larger the external surface of the zeolite particles, the
better the catalytic performance. Therefore, as the ZSM-5 zeolite is concerned,
submicron-sized particles have to be preferably used. [61 and references therein]
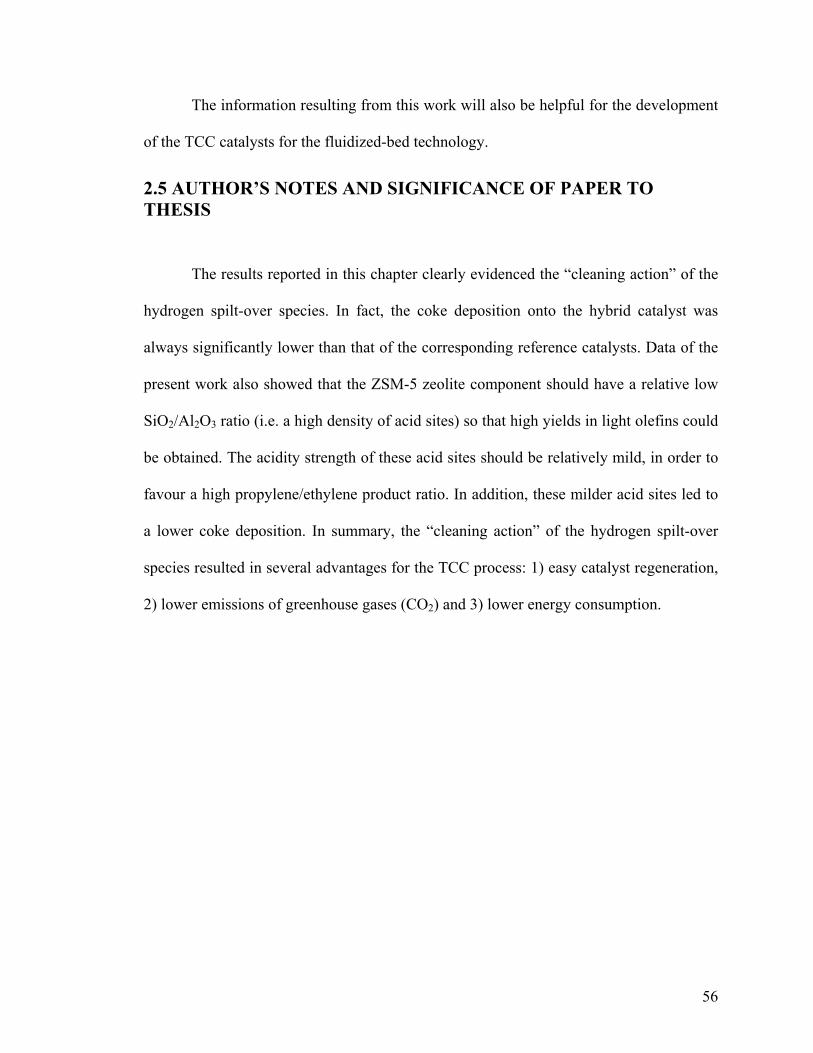
56
The information resulting from this work will also be helpful for the development
of the TCC catalysts for the fluidized-bed technology.
2.5 AUTHOR’S NOTES AND SIGNIFICANCE OF PAPER TO THESIS
The results reported in this chapter clearly evidenced the “cleaning action” of the
hydrogen spilt-over species. In fact, the coke deposition onto the hybrid catalyst was
always significantly lower than that of the corresponding reference catalysts. Data of the
present work also showed that the ZSM-5 zeolite component should have a relative low
SiO2/Al2O3 ratio (i.e. a high density of acid sites) so that high yields in light olefins could
be obtained. The acidity strength of these acid sites should be relatively mild, in order to
favour a high propylene/ethylene product ratio. In addition, these milder acid sites led to
a lower coke deposition. In summary, the “cleaning action” of the hydrogen spilt-over
species resulted in several advantages for the TCC process: 1) easy catalyst regeneration,
2) lower emissions of greenhouse gases (CO2) and 3) lower energy consumption.
57
Chapter III
“Petroleum Gas Oil - Ethanol” Blends Used as Feeds: Increased Production of Ethylene and Propylene over Catalytic Steam-Cracking (CSC) Hybrid Catalysts. Different Behaviour of Methanol in Blends with Petroleum Gas Oil
Published as:
A. Muntasar, R. Le Van Mao, and H.T. Yan
Ind. Eng. Chem. Res. 49 (2011) 3611-3616
58
3.1 INTRODUCTION
Recently developed hybrid catalysts used in the catalytic steam cracking (CSC,
formerly called selective deep catalytic cracking or SDCC[33][34] and also thermal
catalytic cracking or TCC[35][36]) of hydrocarbon heavy feedstocks (naphtha and gas
oil) are very efficient in the production of light olefins, particularly ethylene and
propylene with a product propylene-to-ethylene ratio close to 1.0.[35-37] Such hybrid
catalysts contain a main cracking component that is usually an acidic and a P-Mo-
modified ZSM-5 zeolite and a co-catalyst whose chemical composition includes
supported Ni and Ru. [35-37] [61] The submicrometer-sized zeolite particles and the
much larger co-catalyst ones are firmly bound to each other by extrusion (and then
activation at elevated temperatures) with a “pressure” inorganic binder that is bentonite
clay. The configuration of the resulting catalyst extrudates, which does not change during
the catalytic reaction and the catalyst decoking, shows high light olefins production and
on-stream stability. There has been experimental evidence of the beneficial effect of the
co-catalyst[32][35-38][40-42][61] whose surface is particularly active in the steam
reforming (of methane and other hydrocarbons). It is assumed that hydrogen species,
once formed on the co-catalyst surface, can be transferred (spilt over) onto the cracking
acid sites of the zeolite particles, thus preventing a rapid activity decay induced by the
coke build up.
The phenomena of hydrogen spillover (HSO) have been investigated for many
decades.[62][63][64][65] More specific investigations of the (nature of) deuterium spilt-
over species by Roland et al.[66][67][68] using various FT-IR techniques over Pt/NaY-
HNaY “hybrid” samples placed in a magnetic field B revealed that the diffusing spilt-
59
over particles were electrically charged. In another paper, this time focused on the
cracking of n-hexane over Pt/H-erionite, the same research group[69] showed that (a)
platinum-activated hydrogen could migrate over large distances and (b) hydrogen
dissociated into radicals on platinum and then spilled over onto the support surface where
a dynamic equilibrium was established between the hydrogen radicals and the protons.
However, in our case, the true nature of these species is still not known with sufficient
certainty. Nevertheless, the coke cleaning[63] is one of many useful effects of the HSO
species.[35-37]
In recent years, the predicted depletion of fossil oil resources encourages
researchers to look at processes that can incorporate, even very partially, bioderived
substances into the fossil oilderived feeds. Light alcohols such as methanol, ethanol, and
n-butanol are the coreactants of choice because they can be produced from renewable
biomass materials[70][71] or other less fast declining sources (natural gas, coal). It is
obvious that the supported Ni-Ru co-catalyst may be replaced by a more suitable co-
catalyst because of a higher steam-reforming activity with the investigated alcohol.
Therefore, this work was carried out with the double objective of, first, testing the
C1-C4 alcohols as “model” bioadditives to the petroleum gas oil and, second, testing new
hybrid catalysts whose cocatalyst has a chemical composition more favorable to the
steam reforming of the alcohols herein considered (to produce these HSO species) than
the supported Ni-Ru.
60
3.2 EXPERIMENTAL
3.2.1 Catalyst Preparation
3.2.1.1 Preparation of the Alumina Aerogel (Y-AS) Used as Support for the Co-
catalysts
The yttria-stabilized alumina aerogel was prepared using a sol-gel procedure that
was similar to those reported elsewhere.[35][72] After activation at 750 ℃ for 3 h, the
solid material (called herein Y-AS) showed the following (approximate) chemical
composition: 10 wt% Y2O3, with the balance being Al2O3. Its surface does not show any
acidity.[6]
3.2.1.2 Preparation of the Co-catalysts
(a) Ni-Ru Cocatalyst (Co-cat A). A mixture of 2.60 g of nickel hexahydrate
(Strem Chemical) in 25 mL of deionized water and 0.14 g of ruthenium acetyl acetonate
(Strem) in 25 mL of methanol was homogeneously impregnated onto 20.0 g of activated
Y-AS. After drying at 120 ℃ overnight, the solid was activated at 500 ℃ for 3 h. Its
chemical composition was as follows: nickel, 2.5 wt%; ruthenium, 0.2 wt%; Y-AS,
balance.
(b) Zn-Pd Cocatalyst (Co-cat B). Zn-Pd-loaded cocatalyst was prepared as
suggested by Dagle et al.[73] A 4.00 g amount of zinc chloride (Aldrich) and 0.40 g of
Pd(II) chloride (Aldrich) were dissolved in 30 mL of (warm) deionized water. This
solution was rapidly impregnated onto 18.2 g of Y-AS. After drying at 120 ℃ overnight,
the solid was activated at 500 ℃ for 3 h. Its chemical composition was as follows: Zn, 9.2
wt%; Pd, 1.1 wt%; Y-AS, balance.
61
3.2.1.3 Preparation of the Main Catalyst Components
(a) Preparation of the La HZSM-5 Zeolite. A 50 g amount of HZSM-5 (powder;
ZeoChem, Switzerland; SiO2/Al2O3, 37; total BET surface area, 403 m2/g) was added to
500 mL of an aqueous solution of La nitrate, 5 wt% (La nitrate hydrate; Strem), and
heated at 70-80 ℃, under mild stirring, for 2 h. This suspension was filtrated, and the
obtained solid was thoroughly washed with deionized water (in order to remove all
nitrate ions). After drying at 120 ℃overnight, the solid (named La-HZSM-5) was
activated at 500 ℃ for 3 h. Its La2O3 content was ca. 3.1 wt %.
(b) Preparation of the Main Catalyst Component MCC 1. A solution of 5.52 g of
ammonium molybdate hexahydrate (Aldrich) in 69 mL of aqueous 3 N H3PO4 and 20 mL
of deionized water was homogeneously impregnated onto 40.02 g of La-HZSM-5. The
solid (named MCC 1) was dried at 120 ℃ overnight and finally activated at 500 ℃ for 3
h. Its chemical composition was as follows: MoO3, 8.0 wt%; La2O3, 2.5 wt%;
phosphorus, 4.1 wt%; zeolite, balance.
(c) Preparation of the Main Catalyst Component MCC 2. A 69 mL amount of
aqueous 3 N H3PO4 and 20 mL of deionized water were homogeneously impregnated
onto 40.00 g of La-HZSM-5. The solid (named MCC 2) was dried 120 ℃ overnight and
finally activated at 500 ℃ for 3 h. Its chemical composition was as follows: La2O3, 2.6
wt%; phosphorus, 4.0 wt%; zeolite, balance.
3.2.1.4 Preparation of the Final Hybrid Catalysts
(a) Preparation of the (Ni-Ru)-Containing Hybrid Catalysts. These hybrid
catalysts were obtained by extruding the co-catalyst Co-cat A with either the main
component MCC 1 or MCC 2 in the following proportions: Co-cat A, 16.4 wt%; MCC 1
62
or MCC 2, 65.6 wt%; binder, 18.0 wt%. Bentonite clay (Aldrich) was used as the
extruding and binding medium. The resulting extrudates were dried at 120 ℃ overnight
and finally activated at 700 ℃ for 5 h. These catalysts were named (Ni-Ru) HYB 1 and
(Ni-Ru) HYB 2, respectively.
(b) Preparation of the (Zn-Pd)-Containing Hybrid Catalysts. These hybrid
catalysts were obtained by extruding the co-catalyst Co-cat B with either the main
component MCC 1 or MCC 2 in the following proportions: Co-cat B, 16.4 wt%; MCC 1
or MCC 2, 65.6 wt%; bentonite, 18.0 wt%. The resulting extrudates were dried at 120 ℃
overnight and finally activated at 700 ℃ for 5 h. These catalysts were named (Zn-Pd)
HYB 1 and (Zn-Pd) HYB 2, respectively.
3.2.2 Catalyst Characterization
Characterization of the various catalyst components and the resulting hybrid
catalysts includes several techniques as follows. (1) The various catalyst components and
catalysts were analyzed by atomic absorption spectroscopy for their chemical
compositions. (2) The BET total surface area and pore size (distribution) of these samples
were determined by nitrogen adsorption/desorption using a Micromeretics ASAP 2000
apparatus. (3) The surface acidity was studied by the technique of ammonia adsorption
and temperature- programmed desorption (TPD) using a system based on a pH meter
equipped with an ion-selective electrode (ISE).[6][74] (4) Thermogravimetric analysis
(TGA) and differential thermal analysis (DTA) were carried out in order to determine the
amount of bound species and/or coke deposited onto the catalyst surface. A PL Thermal
Science model STA-1500 DTA/TGA apparatus was used, the flow rates of argon (inert
gas) and air (oxidative gas) being set at 30 mL/min. The rate of the temperature-
63
programmed heating was set at 15 ℃/min from ambient temperature to 800 ℃.
3.2.3 Experimental Setup and Testing Procedure
The feed components, namely, the liquid hydrocarbon mixture (herein, the heavy
atmospheric gas oil or AGO-2) in one infusion pump and water (and eventually alcohol-
water mixture) in the other one, were injected into two vaporizers, respectively. These
vapors (hydrocarbons, steam, and vaporized alcohol) were then thoroughly mixed in a
homemade (heated) gas mixer. The resulting gaseous stream was finally sent into a
tubular reactor (a quartz tube with a length of 140 cm, outer diameter (o.d.) of 1.5 cm,
and inner diameter (i.d.) of 1.2 cm) that was heated by a Lindberg tubular furnace with
three heating zones. The first section of the reactor was used as a preheating chamber,
while its second part hosted the catalyst bed packed with catalyst extrudates.
Product liquid and gaseous fractions were collected separately using a system of
condensers. The gas-phase components were analyzed using a Hewlett-Packard model
5890 Series II FID gas chromatograph that was equipped with a 30 m GS-alumina
micropacked column (J W Scientific), whereas the liquid phase analysis was performed
using another Hewlett-Packard gas chromatograph equipped with an Agilent HP-5
column (Alltech; 30 m, nonpolar).
The testing conditions used were as follows: temperature, 635 ℃; total weight
hourly space velocity (WHSV) (in reference to feed and steam), 3.3 h-1; catalyst weight,
5.0 g; steam/feed ratio, 0.5; gas oil used (AGO-2), see physical characteristics and
chemical composition reported in ref. 36.
The yield of product i was expressed as the number of grams of product i
recovered by 100 g of feed injected (wt%).
64
In our activity reports (product yields), BTX aromatics mean benzene, toluene,
xylenes, and ethylbenzene while the heavy products include hydrocarbons having the
following boiling point ranges: 200-300 ℃, mainly (condensed) di-aroamatics; 300-400
℃, mainly (condensed) tri-aromatics; ≥400 ℃, mainly (condensed) polyaromatics.
It is important to note that the value of the “dispersion of results” (also known as
experimental error margin) usually observed on calculated product yield was ±0.3 wt %.
3.3 RESULTS AND DISCUSSION
3.3.1 Comparison between (Ni-Ru) HYB1 and (Zn-Pd) HYB1 in terms of On-
Stream Stability
In previous works,[35-37] the assumed role of the co-catalyst was to increase the
on-stream stability of the hybrid catalyst. In fact, it was hypothesized that the hydrogen
species being produced by steam reforming of methane and other hydrocarbons over the
(Ni-Ru) co-catalyst were spilt over onto the cracking surface of the ZSM-5 zeolite
component. As a result, the build up of coke at the level of the acid sites was less severe,
thus increasing the on-stream stability of the hybrid catalyst. Recently, the use of (Zn-Pd)
supported on the same yttria-modified alumina aerogel resulted in hybrid catalysts such
as the (Zn-Pd) HYB 1, which showed the same level of light olefins production (Table 6)
and the same on-stream stability as the (Ni-Ru) HYB 1.
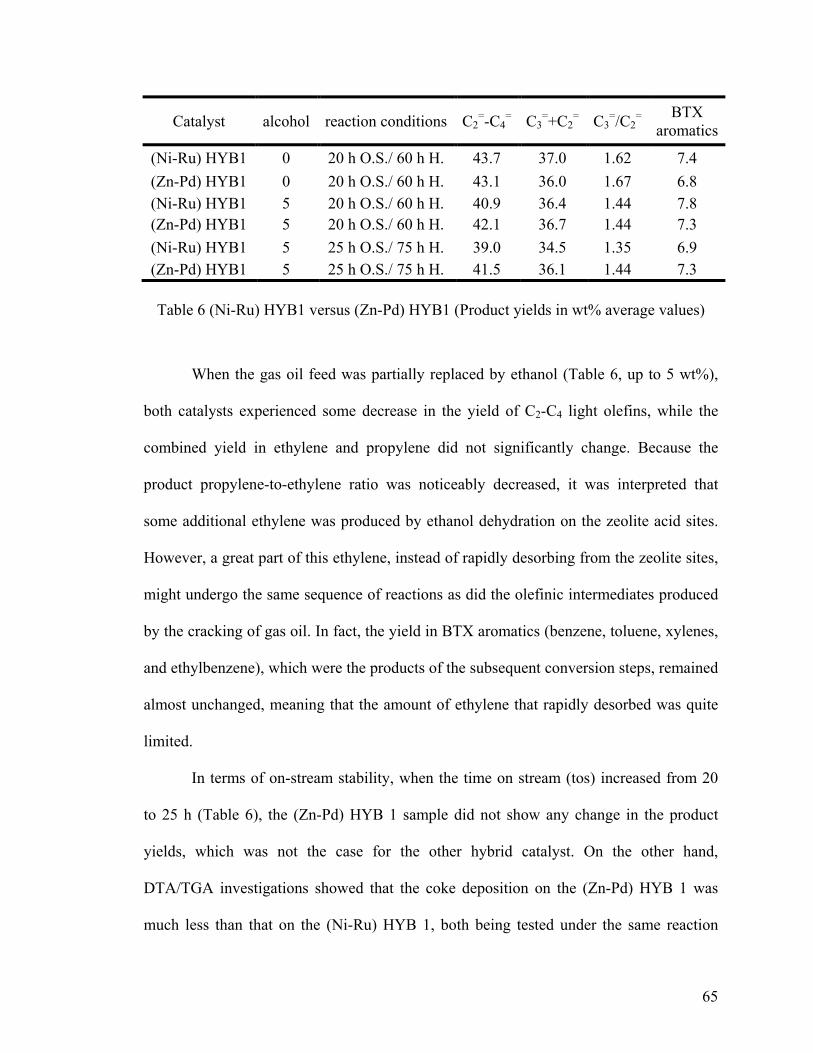
65
Catalyst alcohol reaction conditions C2=-C4
= C3=+C2
= C3=/C2
= BTX aromatics
(Ni-Ru) HYB1 0 20 h O.S./ 60 h H. 43.7 37.0 1.62 7.4 (Zn-Pd) HYB1 0 20 h O.S./ 60 h H. 43.1 36.0 1.67 6.8 (Ni-Ru) HYB1 5 20 h O.S./ 60 h H. 40.9 36.4 1.44 7.8 (Zn-Pd) HYB1 5 20 h O.S./ 60 h H. 42.1 36.7 1.44 7.3 (Ni-Ru) HYB1 5 25 h O.S./ 75 h H. 39.0 34.5 1.35 6.9 (Zn-Pd) HYB1 5 25 h O.S./ 75 h H. 41.5 36.1 1.44 7.3
Table 6 (Ni-Ru) HYB1 versus (Zn-Pd) HYB1 (Product yields in wt% average values)
When the gas oil feed was partially replaced by ethanol (Table 6, up to 5 wt%),
both catalysts experienced some decrease in the yield of C2-C4 light olefins, while the
combined yield in ethylene and propylene did not significantly change. Because the
product propylene-to-ethylene ratio was noticeably decreased, it was interpreted that
some additional ethylene was produced by ethanol dehydration on the zeolite acid sites.
However, a great part of this ethylene, instead of rapidly desorbing from the zeolite sites,
might undergo the same sequence of reactions as did the olefinic intermediates produced
by the cracking of gas oil. In fact, the yield in BTX aromatics (benzene, toluene, xylenes,
and ethylbenzene), which were the products of the subsequent conversion steps, remained
almost unchanged, meaning that the amount of ethylene that rapidly desorbed was quite
limited.
In terms of on-stream stability, when the time on stream (tos) increased from 20
to 25 h (Table 6), the (Zn-Pd) HYB 1 sample did not show any change in the product
yields, which was not the case for the other hybrid catalyst. On the other hand,
DTA/TGA investigations showed that the coke deposition on the (Zn-Pd) HYB 1 was
much less than that on the (Ni-Ru) HYB 1, both being tested under the same reaction
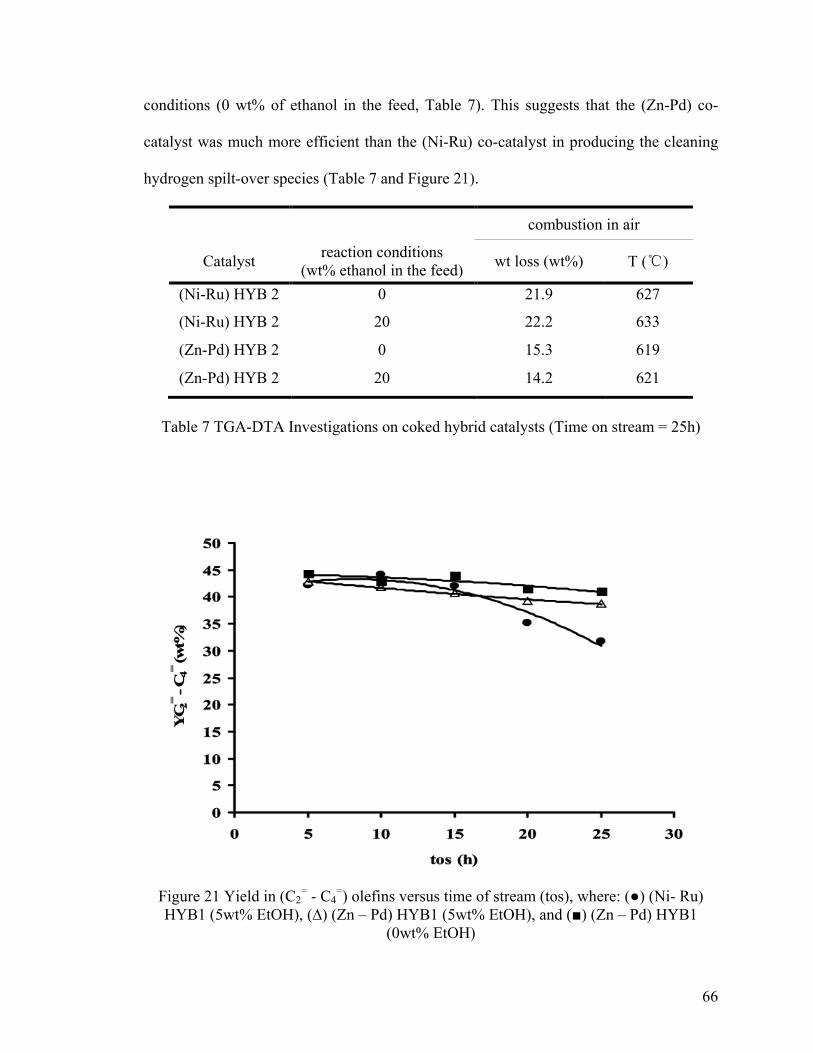
66
conditions (0 wt% of ethanol in the feed, Table 7). This suggests that the (Zn-Pd) co-
catalyst was much more efficient than the (Ni-Ru) co-catalyst in producing the cleaning
hydrogen spilt-over species (Table 7 and Figure 21).
combustion in air
Catalyst reaction conditions (wt% ethanol in the feed) wt loss (wt%) T (℃)
(Ni-Ru) HYB 2 0 21.9 627
(Ni-Ru) HYB 2 20 22.2 633
(Zn-Pd) HYB 2 0 15.3 619
(Zn-Pd) HYB 2 20 14.2 621
Table 7 TGA-DTA Investigations on coked hybrid catalysts (Time on stream = 25h)
Figure 21 Yield in (C2= - C4
=) olefins versus time of stream (tos), where: (●) (Ni- Ru) HYB1 (5wt% EtOH), (∆) (Zn – Pd) HYB1 (5wt% EtOH), and (■) (Zn – Pd) HYB1
(0wt% EtOH)
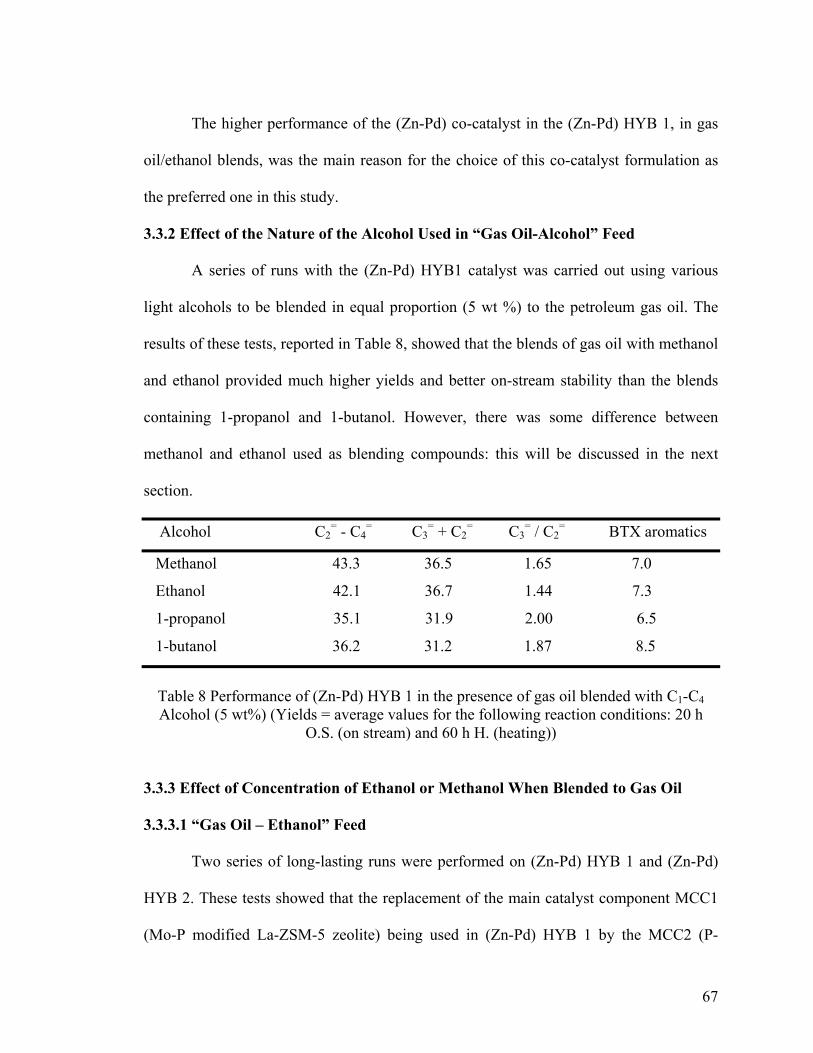
67
The higher performance of the (Zn-Pd) co-catalyst in the (Zn-Pd) HYB 1, in gas
oil/ethanol blends, was the main reason for the choice of this co-catalyst formulation as
the preferred one in this study.
3.3.2 Effect of the Nature of the Alcohol Used in “Gas Oil-Alcohol” Feed
A series of runs with the (Zn-Pd) HYB1 catalyst was carried out using various
light alcohols to be blended in equal proportion (5 wt %) to the petroleum gas oil. The
results of these tests, reported in Table 8, showed that the blends of gas oil with methanol
and ethanol provided much higher yields and better on-stream stability than the blends
containing 1-propanol and 1-butanol. However, there was some difference between
methanol and ethanol used as blending compounds: this will be discussed in the next
section.
Alcohol C2= - C4
= C3= + C2
= C3= / C2
= BTX aromatics
Methanol 43.3 36.5 1.65 7.0
Ethanol 42.1 36.7 1.44 7.3
1-propanol 35.1 31.9 2.00 6.5
1-butanol 36.2 31.2 1.87 8.5
Table 8 Performance of (Zn-Pd) HYB 1 in the presence of gas oil blended with C1-C4 Alcohol (5 wt%) (Yields = average values for the following reaction conditions: 20 h
O.S. (on stream) and 60 h H. (heating))
3.3.3 Effect of Concentration of Ethanol or Methanol When Blended to Gas Oil 3.3.3.1 “Gas Oil – Ethanol” Feed
Two series of long-lasting runs were performed on (Zn-Pd) HYB 1 and (Zn-Pd)
HYB 2. These tests showed that the replacement of the main catalyst component MCC1
(Mo-P modified La-ZSM-5 zeolite) being used in (Zn-Pd) HYB 1 by the MCC2 (P-
68
modified La-ZSM-5 zeolite) being used in (Zn-Pd) HYB 2 increased noticeably the
product yields (light olefins and propylene + ethylene) in the conversion of “pure” gas oil
(Table 9). In addition, the superior performance of the (Zn-Pd) HYB 2 was also observed
with increasing ethanol concentration in the feed (Table 9 and Figure 22). It is to note
that DTA and TGA investigations showed some slight gain in terms of carbon deposit
(lower carbon deposition) for the (Zn-Pd) HYB 2 catalyst at 20 wt % ethanol (Table 7).
It is to note that results reported in Figure 21, Table 6 and Table 9 show the
superiority of the (Zn-Pd) co-catalyst (Co-cat B) over the (Ni-Ru) co-catalyst (Co-cat A)
in terms of on-stream stability. This was fully supported by the data on the coke
deposition on these catalysts, clearly favorable to the (Zn-Pd) bearing catalyst (Table 7).
In addition, a recent study on the hydrocarbon steam reforming of the (Zn-Pd) co-catalyst
surface, when compared to that of the (Ni-Ru) surface, showed a superior activity in the
production of H2 (and carbon oxides).[75]
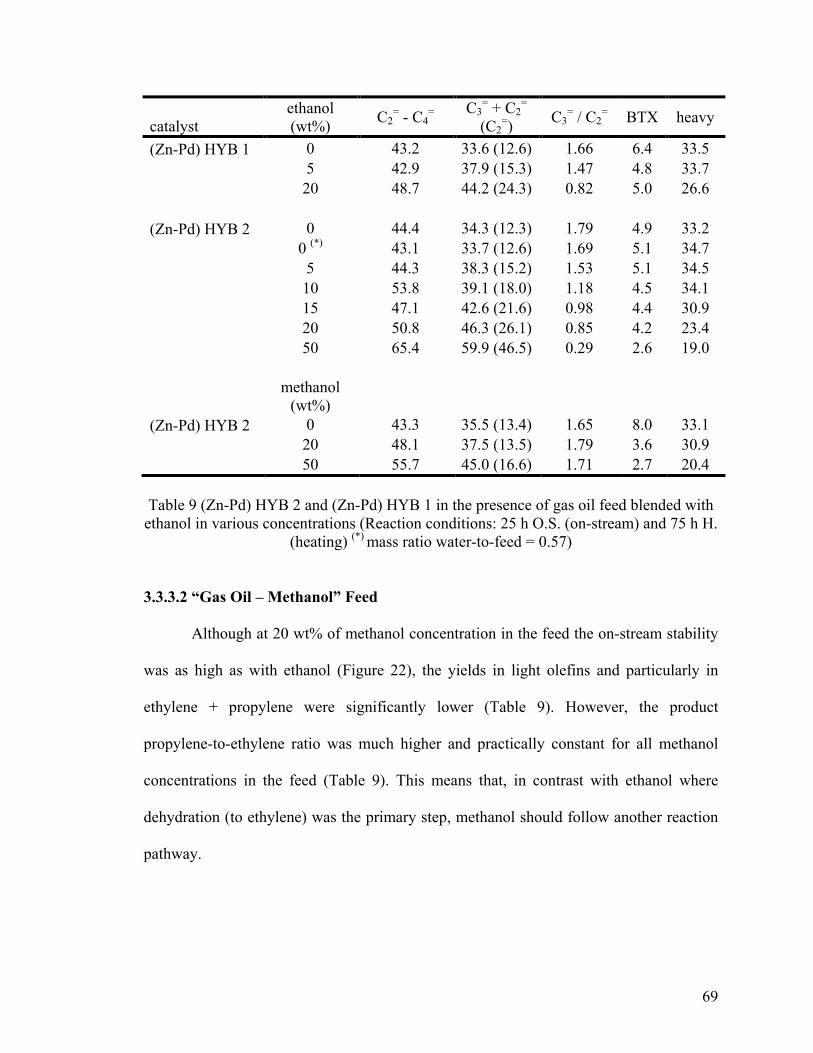
69
catalyst ethanol (wt%) C2
= - C4= C3
= + C2=
(C2=) C3
= / C2= BTX heavy
(Zn-Pd) HYB 1 0 43.2 33.6 (12.6) 1.66 6.4 33.5
5 42.9 37.9 (15.3) 1.47 4.8 33.7
20 48.7 44.2 (24.3) 0.82 5.0 26.6
(Zn-Pd) HYB 2 0 44.4 34.3 (12.3) 1.79 4.9 33.2
0 (*) 43.1 33.7 (12.6) 1.69 5.1 34.7
5 44.3 38.3 (15.2) 1.53 5.1 34.5
10 53.8 39.1 (18.0) 1.18 4.5 34.1
15 47.1 42.6 (21.6) 0.98 4.4 30.9
20 50.8 46.3 (26.1) 0.85 4.2 23.4
50 65.4 59.9 (46.5) 0.29 2.6 19.0
methanol (wt%)
(Zn-Pd) HYB 2 0 43.3 35.5 (13.4) 1.65 8.0 33.1
20 48.1 37.5 (13.5) 1.79 3.6 30.9
50 55.7 45.0 (16.6) 1.71 2.7 20.4
Table 9 (Zn-Pd) HYB 2 and (Zn-Pd) HYB 1 in the presence of gas oil feed blended with
ethanol in various concentrations (Reaction conditions: 25 h O.S. (on-stream) and 75 h H. (heating) (*) mass ratio water-to-feed = 0.57)
3.3.3.2 “Gas Oil – Methanol” Feed
Although at 20 wt% of methanol concentration in the feed the on-stream stability
was as high as with ethanol (Figure 22), the yields in light olefins and particularly in
ethylene + propylene were significantly lower (Table 9). However, the product
propylene-to-ethylene ratio was much higher and practically constant for all methanol
concentrations in the feed (Table 9). This means that, in contrast with ethanol where
dehydration (to ethylene) was the primary step, methanol should follow another reaction
pathway.
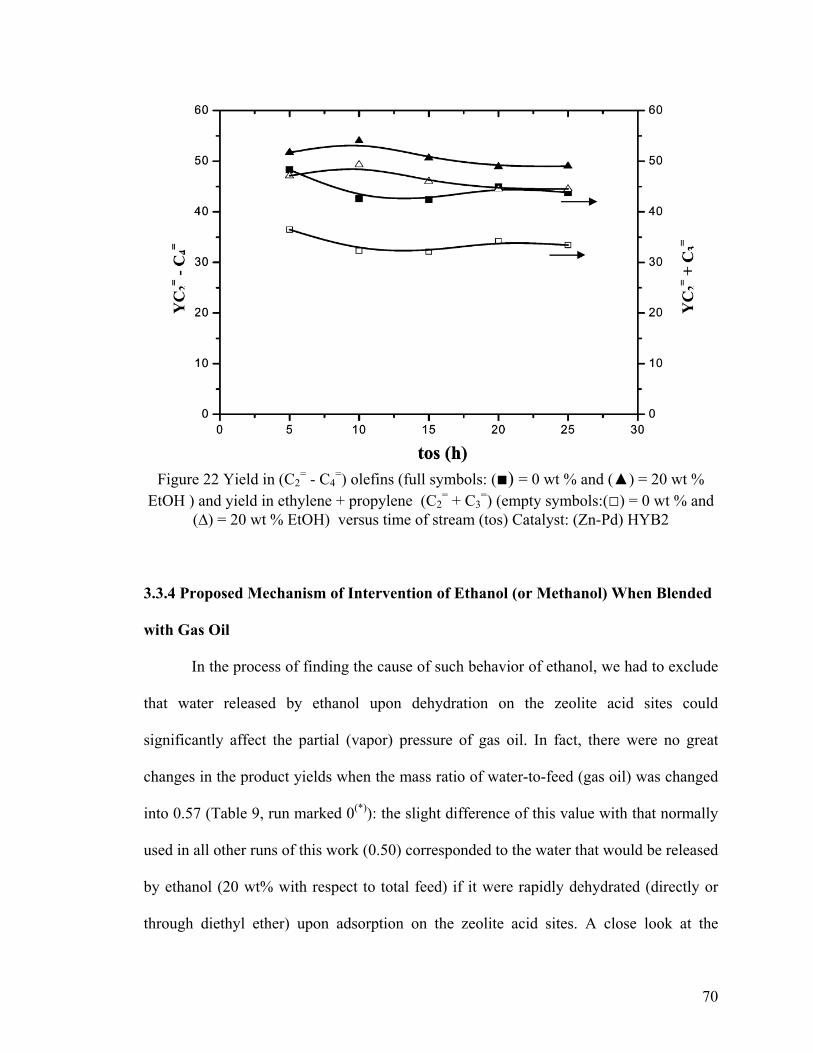
70
Figure 22 Yield in (C2= - C4
=) olefins (full symbols: (■) = 0 wt % and (▲) = 20 wt % EtOH ) and yield in ethylene + propylene (C2
= + C3=) (empty symbols:(□) = 0 wt % and
(∆) = 20 wt % EtOH) versus time of stream (tos) Catalyst: (Zn-Pd) HYB2
3.3.4 Proposed Mechanism of Intervention of Ethanol (or Methanol) When Blended
with Gas Oil
In the process of finding the cause of such behavior of ethanol, we had to exclude
that water released by ethanol upon dehydration on the zeolite acid sites could
significantly affect the partial (vapor) pressure of gas oil. In fact, there were no great
changes in the product yields when the mass ratio of water-to-feed (gas oil) was changed
into 0.57 (Table 9, run marked 0(*)): the slight difference of this value with that normally
used in all other runs of this work (0.50) corresponded to the water that would be released
by ethanol (20 wt% with respect to total feed) if it were rapidly dehydrated (directly or
through diethyl ether) upon adsorption on the zeolite acid sites. A close look at the
71
experimental data of Table 9 reveals that at 10 wt%, or more, of ethanol in the feed,
product ethylene experienced a steady increase, suggesting that at higher ethanol
concentration ethanol dehydration into ethylene became more and more important
because of its higher adsorptivity on the zeolite acid sites when compared to that of heavy
hydrocarbons on the same sites.
In earlier mechanistic studies of the methanol-to-gasoline reaction[76][77][78] it
was proposed that light olefins (particularly ethylene) were produced from dimethyl
ether. Heavier hydrocarbons were subsequently produced, leading to a variety of
hydrocarbons, following a consecutive-type reaction mechanism.[76][77] A more popular
mechanism, called “hydrocarbon pool mechanism”,[77][79][80] suggested that propylene
was directly formed, predominantly, from methanol and not from ethylene by addition of
methanol. In particular, in the MTH (methanol-to-hydrocarbons)/MTO (methanol-to-
olefins) conversion over the zeolite H-beta, data obtained by Bjorgen et al.[81] were in
good agreement with such reaction mechanism where rearrangement of the
heptamethylbenzenium cation, followed by dealkylation, was the major reaction route for
olefin formation. The paring reaction was a possible minor pathway.[82] However, over
a H-ZSM5 zeolite that had narrower pores than H-beta zeolite, polymethylbenzenes
lower than hexamethylbenzene were assumed to be reaction intermediates in a
hydrocarbon pool-type mechanism: recently, it was hypothesized that two mechanistic
cycles run simultaneously and were responsible for the formation of ethylene and
propylene, respectively.[ 83] More recently, Le Van Mao et al.[36] showed that the
composition of the hydrocarbon feed (particularly, the presence or absence of large
hydrocarbons/olefins and aromatics) might have some impact on either the adsorbed
72
hexamethylbenzene or (short) olefinic intermediates. Thus, it was suggested that there
were two different entries for various compounds of the feed: (a) light hydrocarbons,
being represented by naphtha, and (b) heavy aromatic compounds, being represented by
gas oil.[36]
Catalytic data of the (Zn-Pd) bearing hybrid catalysts when tested with gas oil
feed into which ethanol was blended in increasing concentration show three interesting
results (Figures 21 and 22 and Tables 6 and 9): increasing on-stream stability, increasing
yields in light olefins and, particularly, ethylene + propylene, and decreasing value of the
product propylene-to-ethylene ratio. However, the effect attributed to the added ethanol
on the mass of coke deposited on the catalyst surface was quite negligible (Table 7).
Moreover, only ethanol and methanol could show such catalytic performance
improvement (Tables 8 and 9).
All these facts suggest that ethanol molecules, at a certain concentration in the
feed, predominantly undergo, first, dehydration into ethylene over the zeolite acid sites
instead of reacting directly with the polymethylbenzene intermediates that are precursors
of coke as stated in the pool mechanism. Ethylene can either desorb (thus, increasing the
light olefin yield and at the same time, lowering the product propylene-to-ethylene ratio)
or react with other adsorbed species. Because the weight hourly space velocity was kept
constant for all the runs, the partial pressure of heavy compounds of the gas oil of the
feed was lower than in the case of 100% gas oil feed, the adsorption of these compounds
on the zeolite acid sites was much less, resulting in a slightly improved on-stream
stability.
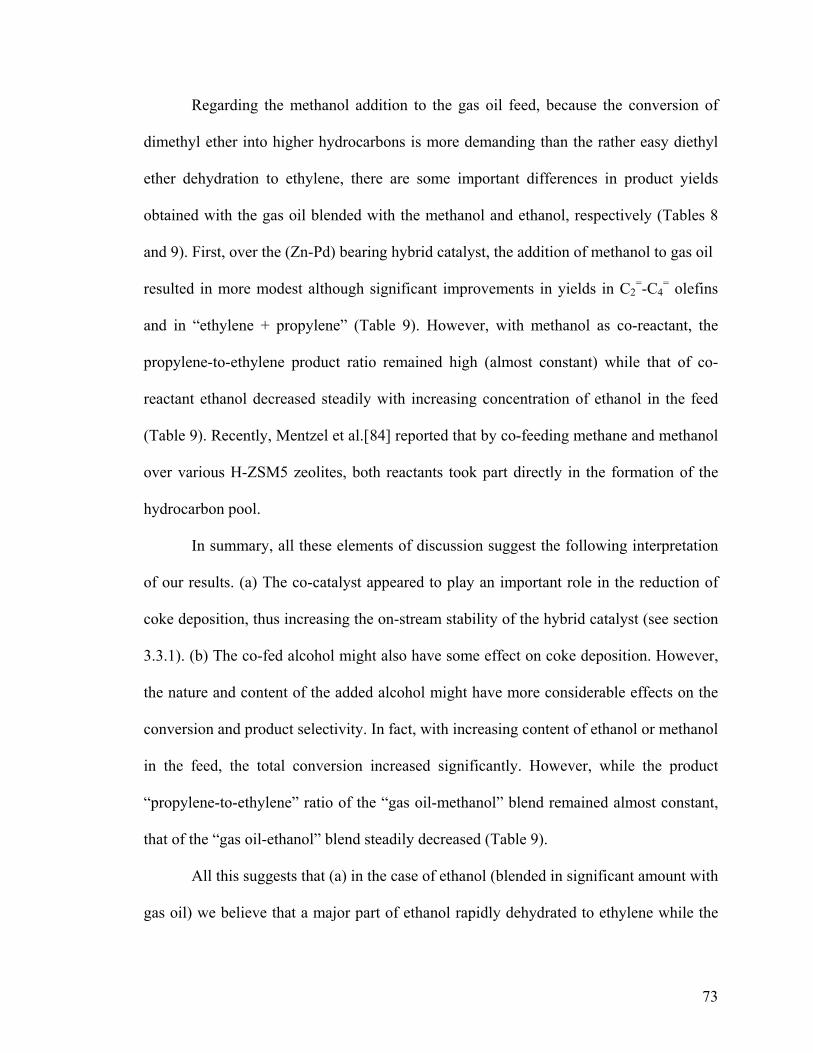
73
Regarding the methanol addition to the gas oil feed, because the conversion of
dimethyl ether into higher hydrocarbons is more demanding than the rather easy diethyl
ether dehydration to ethylene, there are some important differences in product yields
obtained with the gas oil blended with the methanol and ethanol, respectively (Tables 8
and 9). First, over the (Zn-Pd) bearing hybrid catalyst, the addition of methanol to gas oil
resulted in more modest although significant improvements in yields in C2=-C4
= olefins
and in “ethylene + propylene” (Table 9). However, with methanol as co-reactant, the
propylene-to-ethylene product ratio remained high (almost constant) while that of co-
reactant ethanol decreased steadily with increasing concentration of ethanol in the feed
(Table 9). Recently, Mentzel et al.[84] reported that by co-feeding methane and methanol
over various H-ZSM5 zeolites, both reactants took part directly in the formation of the
hydrocarbon pool.
In summary, all these elements of discussion suggest the following interpretation
of our results. (a) The co-catalyst appeared to play an important role in the reduction of
coke deposition, thus increasing the on-stream stability of the hybrid catalyst (see section
3.3.1). (b) The co-fed alcohol might also have some effect on coke deposition. However,
the nature and content of the added alcohol might have more considerable effects on the
conversion and product selectivity. In fact, with increasing content of ethanol or methanol
in the feed, the total conversion increased significantly. However, while the product
“propylene-to-ethylene” ratio of the “gas oil-methanol” blend remained almost constant,
that of the “gas oil-ethanol” blend steadily decreased (Table 9).
All this suggests that (a) in the case of ethanol (blended in significant amount with
gas oil) we believe that a major part of ethanol rapidly dehydrated to ethylene while the
74
other (minor) part contributed to the hydrocarbon pool and (b) in the case of methanol
(blended with gas oil) most of the added methanol took part directly in the formation of
the hydrocarbon pool. Figure 23 summarizes our interpretation of these data using a
general mechanistic scheme.
Figure 23 Influence of the hydrocarbon feed and the ethanol alcohol blended to the gas oil feed on the overall reaction mechanism. IL = intervention level of hydrogen spilt-over
species. (Reproduction and partially modification of Figure 2 of reference 36).
3.3.5 Advantages of Feeding the CSC Process with “(Petroleum) Gas Oil/Ethnaol
(Bioethanol)” Blends
Nowadays, most of the developed countries are interested in getting less
dependent on oil import. In the petrochemical industry that consumes up to 15% of
petroleum oil, it is imperative to be able to blend the normally used petroleum feedstocks
with ethanol or methanol that can be derived from renewable materials (biomass) or more
75
abundant sources (natural gas or even coal). The CSC process that uses steam as diluent
is the most adequate approach for achieving this goal.
This work has shown that ethanol is a good blending agent for gas oil. Because
bioethanol is usually obtained by enzymatic fermentation of glucose (or cellulose), its
concentration in the fermentation broth is 10 wt% or less.[85] To obtain 95 vol% ethanol,
the current technology is based on distillation. Absolute ethanol for use as fuel[85][86] is
obtained by further dehydration on 3A zeolite, for instance. All these concentrating
technologies are quite energy consuming. Therefore, by using simply ethanol at the exit
of the concentration distillation column (35-50 wt% of ethanol)[85] instead of water
(steam-to-feed ratio of 0.5-0.8, our CSC operating conditions), it would be possible to
incorporate 15 wt % of ethanol or more to the gas oil and thus to obtain up to 20 wt%
increase in the yield “ethylene + propylene”, respectively. Thus, a significant amount of
energy would be saved. These advantages would be even larger by integrating a small
“biorefinery” into a petrochemical plant using the CSC technology.
On the other hand, methanol can also be blended to the petroleum gas oil.
Preliminary tests show that the yield in light olefins is slightly lower than that obtained
with “gas oil-ethanol” blends (Table 9). However, the product propylene-to-ethylene ratio
is significantly higher. We believe that if we can produce a co-catalyst surface that is
more active in the steam reforming of methanol, the catalytic performance and on-stream
stability of the resulting hybrid catalyst when used on a “gas oil-methanol” blend would
be much more improved.
3.4 CONCLUSION
76
Hybrid catalysts that contain Zn-Pd-based cocatalyst show a higher and more
positive sensitivity to ethanol than catalysts that contain supported Ni-Ru co-catalyst. In
fact, with the former catalysts the use of “gas oil-ethanol” blends significantly increases
the product yields of light olefins and particularly of ethylene + propylene. This
constitutes actually a good approach for the partial replacement of petroleum feedstocks
by the bioderived ethanol. Another advantage of the CSC process is that it can make use
of simply “concentrated” ethanol as obtained by enzymatic conversion of cellulosic
biomass, thus saving some energy consumed for the entire process. Finally, methanol
used as co-reactant behaves very differently from ethanol. In fact, while ethanol
undergoes predominantly dehydration into ethylene, methanol predominantly intervenes
directly on reactions occurring in the “hydrocarbon pool”.
3.5 AUTHOR’S NOTES AND SIGNIFICANCE OF PAPER TO THESIS
This work on the different behavior of ethanol and methanol in blends with
petroleum gas oil in the catalytic cracking process was the first article published in the
literature on processing mixed feedstock containing traditional petroleum based
component (Gas Oil) and renewable biomass derived compound (bio-ethanol/methanol)
for the production of light olefins. Our results show that the use of “Gas Oil-alcohol”
blends significantly increases the product yields of light olefins with our specially
designed hybrid catalysts that contain Zn-Pd based co-catalyst. This appears to be a good
approach for the partial replacement of petroleum feedstocks by biomass derived
compounds. Our study also shows that the CSC process can make use of simply
concentrated ethanol in aqueous solution as obtained from enzymatic conversion of
77
biomass. This is maybe the first example of the beneficial effect of biomass derived
ethanol on the performance of the CSC catalysts, suggesting that the integration of a
small “biorefinery” process to a petrochemical conversion plant is now possible.
Furthermore, our work indicates that methanol, as a co-reactant, behaves very differently
from ethanol. While ethanol undergoes predominantly dehydration into ethylene,
methanol predominantly intervenes directly in the “hydrocarbon pool”, resulting in an
almost constant propylene-to-ethylene ratio that is usually higher than 1.5.
The following chapter shows the effect of methanol on a hydrocarbon feed in
more detail. This is because that blending methanol with petroleum based feedstock
results in higher product yields of light olefins and more importantly an almost constant
propylene-to-ethylene ratio. Also, methanol can be produced from not only renewable
biomass resources but also longer lasting fossil fuels like coal and natural gas which are
more promising for the near future. Several series of tests will be performed on methanol
added in various contents to petroleum light naphtha. This will allow us to investigate the
variations of the total conversion, the yields to different olefinic products (mostly
ethylene and propylene), as well as the propylene/ethylene ratio. This study also will
allow us to study the effect of the co-fed methanol onto the coke deposition and thus help
to determine the on-stream stability of the hybrid catalyst over such mixed feedstock.
78
Chapter IV
Mixed Naphtha/Methanol Feed Used in the Thermal Catalytic/Steam Cracking (TCSC) Process for the Production of Propylene and Ethylene
Published as:
H.T. Yan and R. Le Van Mao
Catal. Lett. 141 (2011) 691-698
79
4.1 INTRODUCTION
Ethylene and propylene are intermediates being used in the production of
important plastics and synthetic fibers.[8] These light olefins are currently and mainly
produced by steam cracking of various hydrocarbon feed-stocks (light paraffins, naphthas
or gas oils). In recent years, world market is experiencing growing demands for these
intermediates, mostly propylene.[ 87 ] Because the product selectivity of the steam
cracking technology for propylene is low, the supply of this light olefin can be
supplemented by other processes such as propane dehydrogenation, olefin metathesis and
primarily catalytic cracking (FCC). In the latter technology that normally aims at
producing gasoline, some ZSM-5 type zeolite is incorporated into the catalyst
formulation in order to enhance the production of light olefins, particularly propylene.
The Thermal Catalytic/Steam Cracking (TCSC) process,[38] formerly called
SDCC or selective deep catalytic cracking,[33][34] and then TCC or thermo-catalytic
cracking, [35-37] has been developed with the objective to selectively produce light
olefins from various liquid hydrocarbon feedstocks. The TCSC process, which combines
the (mild) thermal cracking with the acid cracking promoted by a zeolite-based catalyst,
can provide very high yields of light olefins while operating at temperatures much lower
than those used in the steam cracking technology. Most of the catalysts used in the TCSC
process are in the hybrid configuration, i.e., they are comprised of two porous
components with relatively high surface area: an acidic zeolite based component and a
co-catalyst having a specific physical–chemical effect on the overall catalytic reaction. In
this work, the (Zn–Pd) co-catalyst shows strong activities of (hydrocarbon) steam
reforming (and water–gas shift). The TCSC hybrid catalyst is not merely a solid mixture
80
of these two kinds of particle: in fact, its two different catalyst particles are firmly bound
to each other by an inorganic binder (bentonite clay). This material acts as a “pressure”
binder that, when activated at high temperatures in the form of final hybrid catalyst
extrudates, holds these catalyst particles in an extremely “rigid and pressurized” solid
network. In addition, the zeolite-based particles should be preferably microporous while
the co-catalyst particles should be mesoporous, much larger in size and also quite
malleable in consistency (very useful property for the production of the hybrid catalyst
extrudates[32][40]). Therefore, the rigid and “ideally sparse particles configuration” of
the hybrid catalyst ensures an easy two-way diffusion (of reaction intermediates) within
the catalyst network; this is the so-called “pore continuum” effect, which has been
observed on many occasions, such as in adsorption/desorption,[41] and in different
catalytic reactions such as aromatization and cracking.[32][40][43][88] It has been seen
that the co-catalyst can exert some “cleaning action” on the coke precursors so that
coking of the main catalyst surface can be significantly reduced.[35-38] This beneficial
effect has been attributed to the action of hydrogen spillover species [38 and references
therein, particularly [63].
Recently, it was reported that hybrid catalysts developed for the TCSC process
behaved very differently if a “gas oil-alcohol” mixed feed was used.[39] If the alcohol
was ethanol, there was a steady increase of the combined product yield “ethylene +
propylene”; however, at the same time, the propylene-to-ethylene weight ratio decreased
very rapidly, suggesting that ethanol underwent dehydration preferentially over the acid
sites of the zeolite component, instead of being integrated to the general and widely
accepted reaction mechanism, known as “hydrocarbon pool” mechanism.[83][89] On the
81
other hand, if methanol was used for the preparation of the mixed feeds, the “ethylene +
propylene” product yield increased with increasing methanol content, but gradually and
at a much lower pace.[39] Also, very importantly, the product weight ratio
“propylene/ethylene” remained almost constant at the value of the “non-blended” gas oil
feed (i.e. equal circa to 1.5). It is to note that the hybrid catalysts used comprised two
components: the main component that was an acidic ZSM-5 zeolite, and a co-catalyst that
contained Zn-Pd species supported on yttria stabilized alumina aerogel.
In the present work, the effect of methanol on a hydrocarbon feed is investigated
in more detail. The feed used is petroleum light naphtha whose catalytic results are much
easier to interpret than those of the gas oil as used in ref. [39]. Several series of tests are
performed on methanol added in various contents to light naphtha. This allows us to
investigate the variations of the total conversion, the yields to different olefinic products
(mostly ethylene and propylene), as well as the propylene/ethylene product ratio. We also
want to study the effect of the added methanol onto the coke deposition because this can
help determine the on-stream stability of the hybrid catalyst over a mixed “naphtha-
methanol” feed.
4.2 EXPERIMENTAL
4.2.1 Preparation of the Hybrid Catalyst
4.2.1.1 Main Catalyst Component (M-Cat)
The H-ZSM-5 zeolite (powder; Zeochem, Switzerland; Silica/alumina mol ratio =
37; total BET surface area = 403 m2/g) was dried at 120 ℃ overnight and then activated
in air at 500 ℃ for 5 h.
82
4.2.1.2 Co-Catalyst (Co-Cat)
The yttria-stabilized alumina aerogel used as support for the co-catalyst was
prepared using a sol–gel procedure that was similar to those reported elsewhere.[35][72]
After activation at 750 ℃ for 3 h, the solid material (herein called Y-AS) showed the
following (approximate) chemical composition: 10 wt% Y2O3, with the balance being
Al2O3.[39][46] Its surface did not show any acidity.[6]
The Zn–Pd loaded co-catalyst was prepared in accordance with the procedure
suggested by Dagle et al. [73] and used in the previous work.[39] 4.00 g of zinc chloride
(Aldrich) and 0.40 g of Pd (II) chloride (Aldrich) were dissolved in 30 mL of (warm)
deionized water. This solution was rapidly impregnated onto 18.2 g of Y-AS. After
drying at 120 ℃ overnight, the solid was activated at 500 ℃ for 3 h. Its chemical
composition was as follows: Zn = 9.2 wt%, Pd = 1.1 wt%, Y-AS = balance.
4.2.1.3 Final Hybrid Catalyst
The hybrid catalyst was obtained by extruding the zeolite component (MCC) with
the co-catalyst (Co-cat) in the following proportions: MCC = 65.6 wt%, Co-cat = 16.4
wt%, bentonite clay (Aldrich) = 18.0 wt%. Bentonite clay was used as the extruding and
solid binding agent. The resulting extrudates were dried at 120 ℃ overnight and finally
activated at 700 ℃ for 3 h.
4.2.2 Catalyst Characterization
Characterization of the hybrid catalyst and its components includes the following
techniques: (1) atomic absorption spectroscopy for chemical composition. (2) BET total
surface area and pore size distribution by using nitrogen adsorption/desorption
(apparatus: Micromeretics ASAP 2000). (3) Surface acidity by the technique of ammonia
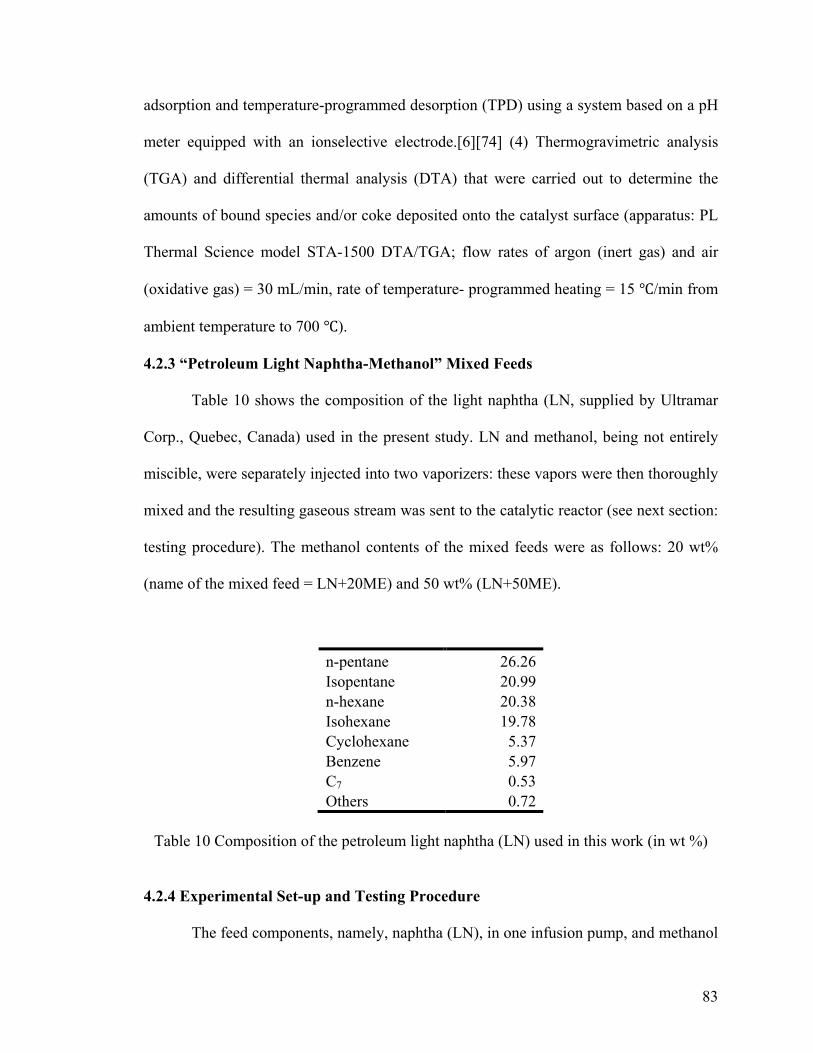
83
adsorption and temperature-programmed desorption (TPD) using a system based on a pH
meter equipped with an ionselective electrode.[6][74] (4) Thermogravimetric analysis
(TGA) and differential thermal analysis (DTA) that were carried out to determine the
amounts of bound species and/or coke deposited onto the catalyst surface (apparatus: PL
Thermal Science model STA-1500 DTA/TGA; flow rates of argon (inert gas) and air
(oxidative gas) = 30 mL/min, rate of temperature- programmed heating = 15 ℃/min from
ambient temperature to 700 ℃).
4.2.3 “Petroleum Light Naphtha-Methanol” Mixed Feeds
Table 10 shows the composition of the light naphtha (LN, supplied by Ultramar
Corp., Quebec, Canada) used in the present study. LN and methanol, being not entirely
miscible, were separately injected into two vaporizers: these vapors were then thoroughly
mixed and the resulting gaseous stream was sent to the catalytic reactor (see next section:
testing procedure). The methanol contents of the mixed feeds were as follows: 20 wt%
(name of the mixed feed = LN+20ME) and 50 wt% (LN+50ME).
n-pentane 26.26 Isopentane 20.99 n-hexane 20.38 Isohexane 19.78 Cyclohexane 5.37 Benzene 5.97 C7 0.53 Others 0.72
Table 10 Composition of the petroleum light naphtha (LN) used in this work (in wt %)
4.2.4 Experimental Set-up and Testing Procedure
The feed components, namely, naphtha (LN), in one infusion pump, and methanol
84
dissolved in water in the other one, were injected into two vaporizers, respectively. The
resulting vapors (hydrocarbons, steam and vaporized methanol) were then thoroughly
mixed in a homemade (heated) gas mixer. The resulting gaseous stream was finally sent
into a tubular reactor (quartz tube, 50 cm long, 1.5 cm in outer diameter and 1.2 cm in
inner diameter, length of the catalyst bed = 3 cm). The temperatures were controlled and
regulated by automatic devices that were connected to chromel–alumel thermocouples
(set in the catalytic bed and in the pre-heating zone) and the heating furnace.
The testing conditions were as follows: temperature (of the catalyst bed) = 600,
635, 650 or 670 ℃ ± 2 ℃; total weight hourly space velocity (WHSV, naphtha and
eventually methanol) = 4.5-0.75 h-1, corresponding to the following values of contact
time (t): 0.22–1.33 h; steam/feed weight ratio (feed: all C-containing reactants in the
feed) = 0.5, catalyst weight = 2 g, duration of a run = 4 h.
Liquid and gaseous products were collected separately, using a system of
condensers. The gas-phase components were analyzed using a Hewlett-Packard Model
5890 FID gas chromatograph that was equipped with a 30 m GS-capillary column
(Agilent J & W Scientific), while the analysis of the liquid phase was performed using a
Hewlett-Packard gas chromatograph (FID Model 5890) equipped with a HP-5 capillary
column (Agilent J & W Scientific, 30 m).
The total conversion, Ct, is defined as the percentage of the weight of (all the
components of) the organic feed (light naphtha and eventually methanol) converted into
final products (and coke) as follows:
Ct = 100% × (Wi –Wf)/Wi;
Wi and Wf being the weights of all organic components of the feed at the inlet and the
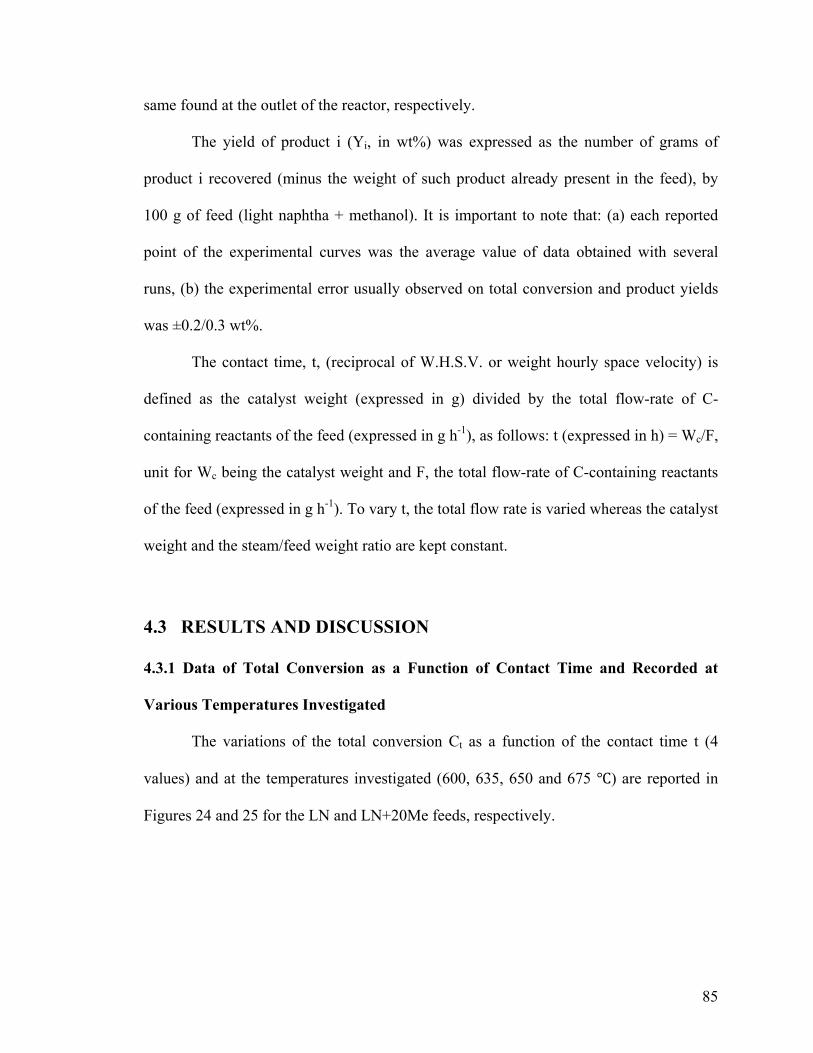
85
same found at the outlet of the reactor, respectively.
The yield of product i (Yi, in wt%) was expressed as the number of grams of
product i recovered (minus the weight of such product already present in the feed), by
100 g of feed (light naphtha + methanol). It is important to note that: (a) each reported
point of the experimental curves was the average value of data obtained with several
runs, (b) the experimental error usually observed on total conversion and product yields
was ±0.2/0.3 wt%.
The contact time, t, (reciprocal of W.H.S.V. or weight hourly space velocity) is
defined as the catalyst weight (expressed in g) divided by the total flow-rate of C-
containing reactants of the feed (expressed in g h-1), as follows: t (expressed in h) = Wc/F,
unit for Wc being the catalyst weight and F, the total flow-rate of C-containing reactants
of the feed (expressed in g h-1). To vary t, the total flow rate is varied whereas the catalyst
weight and the steam/feed weight ratio are kept constant.
4.3 RESULTS AND DISCUSSION
4.3.1 Data of Total Conversion as a Function of Contact Time and Recorded at
Various Temperatures Investigated
The variations of the total conversion Ct as a function of the contact time t (4
values) and at the temperatures investigated (600, 635, 650 and 675 ℃) are reported in
Figures 24 and 25 for the LN and LN+20Me feeds, respectively.
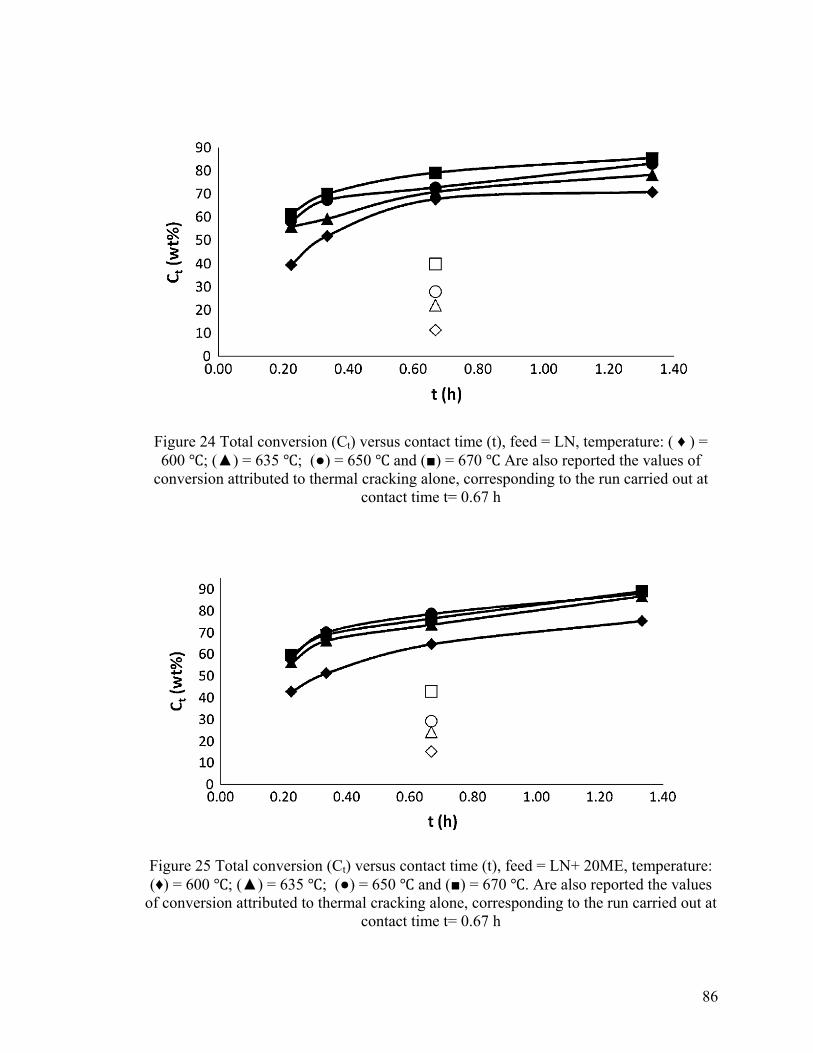
86
Figure 24 Total conversion (Ct) versus contact time (t), feed = LN, temperature: ( ♦ ) = 600 ℃; (▲) = 635 ℃; (●) = 650 ℃ and (■) = 670 ℃ Are also reported the values of
conversion attributed to thermal cracking alone, corresponding to the run carried out at contact time t= 0.67 h
Figure 25 Total conversion (Ct) versus contact time (t), feed = LN+ 20ME, temperature: (♦) = 600 ℃; (▲) = 635 ℃; (●) = 650 ℃ and (■) = 670 ℃. Are also reported the values
of conversion attributed to thermal cracking alone, corresponding to the run carried out at contact time t= 0.67 h
87
With all these feeds, the total conversion (Ct) increased, as expected, with
increasing contact time (t) and increasing reaction temperature (T). It is important to note
that the value of Ct was not nil when t = 0 (t = Wc/F, see experimental section) because t
= 0 if Wc = 0 (no catalyst); however, there was some conversion due to thermal cracking
(steam cracking). Thus, for each value of total conversion (catalytic plus thermal
cracking), it was possible to estimate the conversion due to thermal cracking by running
the reactor with the catalyst bed filled with quartz beads (2 mm diameter, assumed to be
catalytically inert), all other reaction parameters (temperature, reactant flowrates,
steam/reactants weight ratio) being kept the same, so that the residence time was the
same. Therefore, it was possible to estimate the conversion due to the catalyst itself.
From Figures 24 and 25, it can be seen that at increasing reaction temperature, the effect
of thermal cracking on the total conversion became slightly more important.
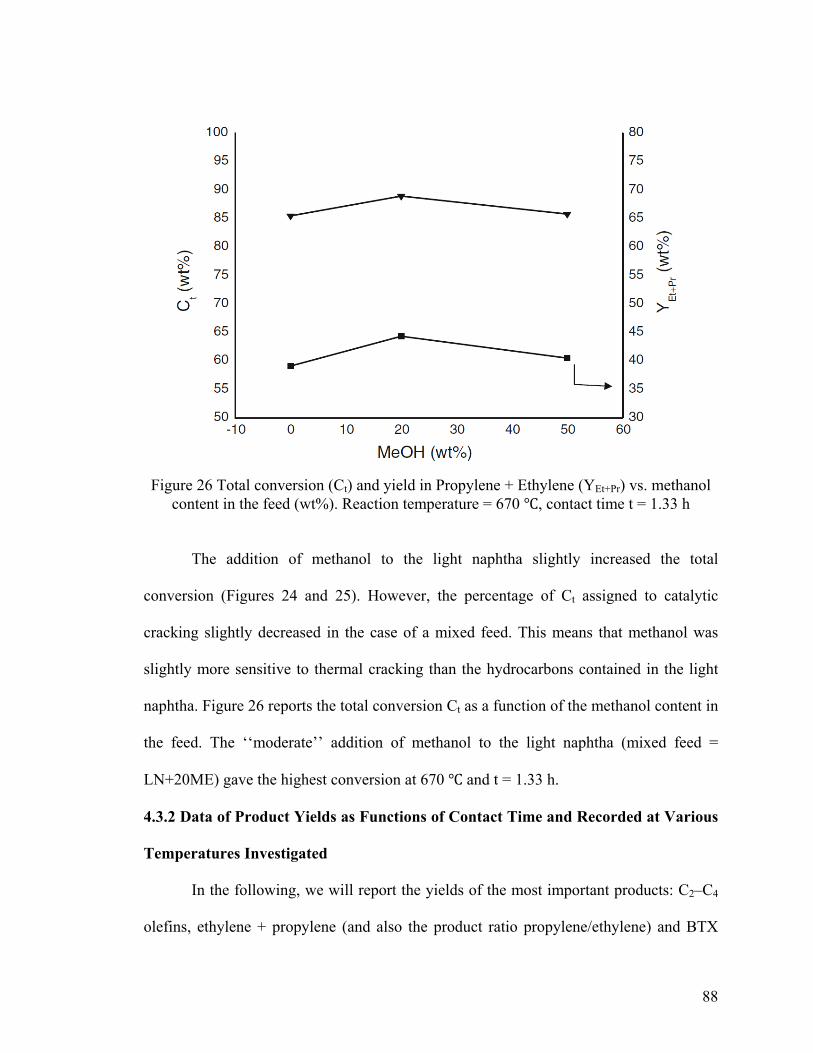
88
Figure 26 Total conversion (Ct) and yield in Propylene + Ethylene (YEt+Pr) vs. methanol
content in the feed (wt%). Reaction temperature = 670 ℃, contact time t = 1.33 h
The addition of methanol to the light naphtha slightly increased the total
conversion (Figures 24 and 25). However, the percentage of Ct assigned to catalytic
cracking slightly decreased in the case of a mixed feed. This means that methanol was
slightly more sensitive to thermal cracking than the hydrocarbons contained in the light
naphtha. Figure 26 reports the total conversion Ct as a function of the methanol content in
the feed. The ‘‘moderate’’ addition of methanol to the light naphtha (mixed feed =
LN+20ME) gave the highest conversion at 670 ℃ and t = 1.33 h.
4.3.2 Data of Product Yields as Functions of Contact Time and Recorded at Various
Temperatures Investigated
In the following, we will report the yields of the most important products: C2–C4
olefins, ethylene + propylene (and also the product ratio propylene/ethylene) and BTX
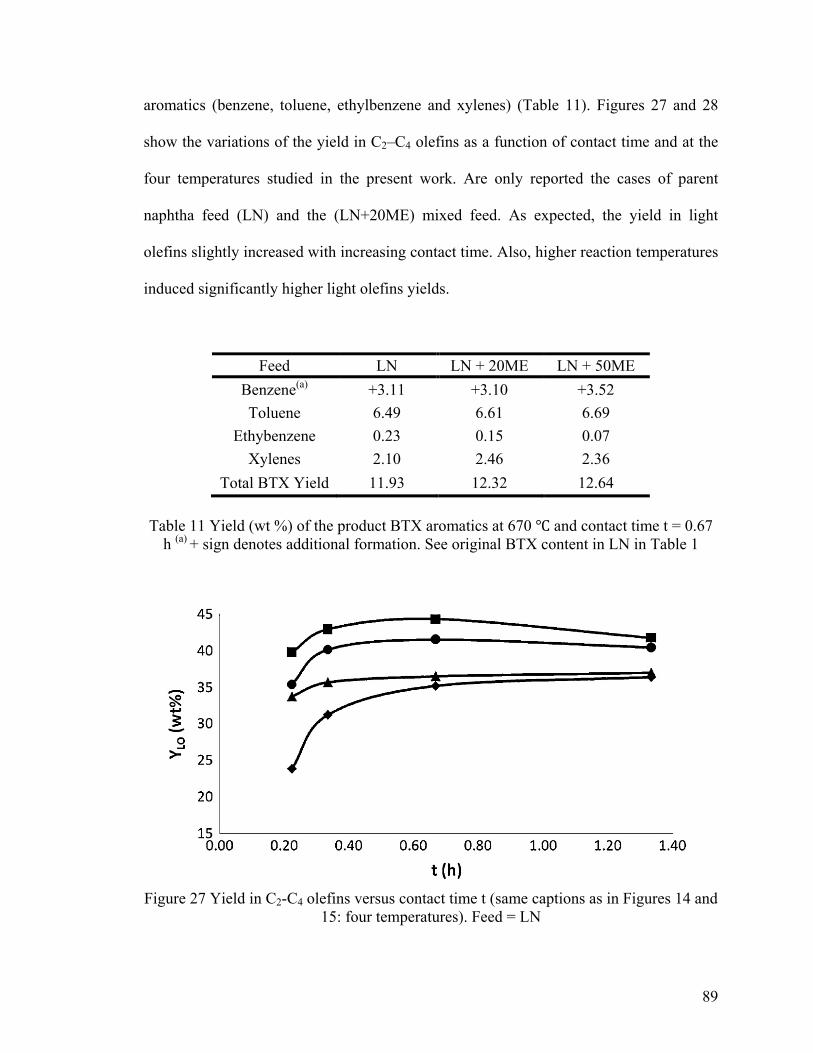
89
aromatics (benzene, toluene, ethylbenzene and xylenes) (Table 11). Figures 27 and 28
show the variations of the yield in C2–C4 olefins as a function of contact time and at the
four temperatures studied in the present work. Are only reported the cases of parent
naphtha feed (LN) and the (LN+20ME) mixed feed. As expected, the yield in light
olefins slightly increased with increasing contact time. Also, higher reaction temperatures
induced significantly higher light olefins yields.
Feed LN LN + 20ME LN + 50ME Benzene(a) +3.11 +3.10 +3.52 Toluene 6.49 6.61 6.69
Ethybenzene 0.23 0.15 0.07 Xylenes 2.10 2.46 2.36
Total BTX Yield 11.93 12.32 12.64
Table 11 Yield (wt %) of the product BTX aromatics at 670 ℃ and contact time t = 0.67 h (a) + sign denotes additional formation. See original BTX content in LN in Table 1
Figure 27 Yield in C2-C4 olefins versus contact time t (same captions as in Figures 14 and
15: four temperatures). Feed = LN
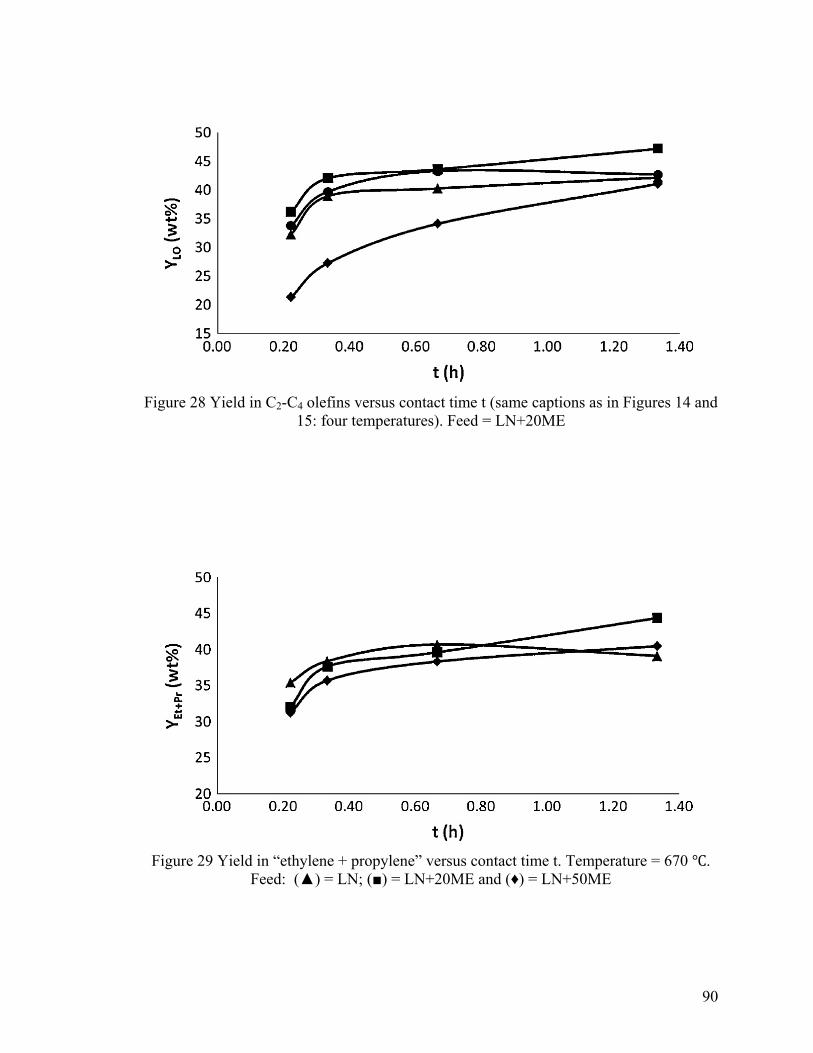
90
Figure 28 Yield in C2-C4 olefins versus contact time t (same captions as in Figures 14 and
15: four temperatures). Feed = LN+20ME
Figure 29 Yield in “ethylene + propylene” versus contact time t. Temperature = 670 ℃.
Feed: (▲) = LN; (■) = LN+20ME and (♦) = LN+50ME
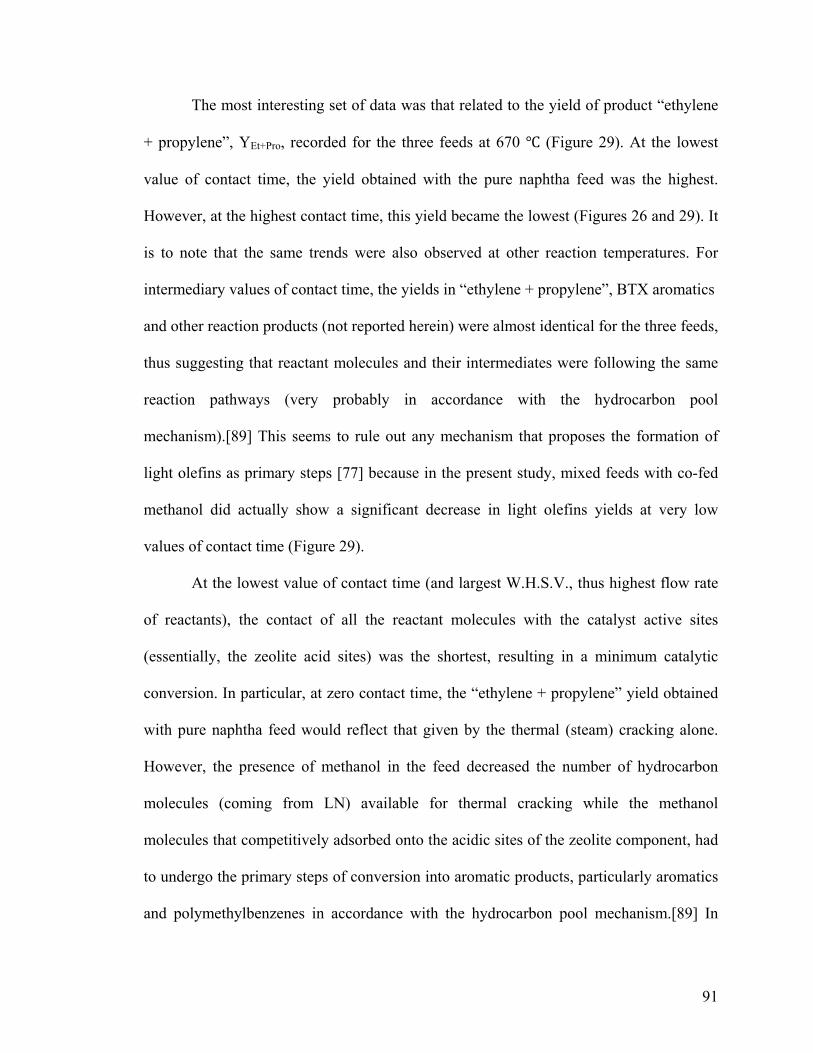
91
The most interesting set of data was that related to the yield of product “ethylene
+ propylene”, YEt+Pro, recorded for the three feeds at 670 ℃ (Figure 29). At the lowest
value of contact time, the yield obtained with the pure naphtha feed was the highest.
However, at the highest contact time, this yield became the lowest (Figures 26 and 29). It
is to note that the same trends were also observed at other reaction temperatures. For
intermediary values of contact time, the yields in “ethylene + propylene”, BTX aromatics
and other reaction products (not reported herein) were almost identical for the three feeds,
thus suggesting that reactant molecules and their intermediates were following the same
reaction pathways (very probably in accordance with the hydrocarbon pool
mechanism).[89] This seems to rule out any mechanism that proposes the formation of
light olefins as primary steps [77] because in the present study, mixed feeds with co-fed
methanol did actually show a significant decrease in light olefins yields at very low
values of contact time (Figure 29).
At the lowest value of contact time (and largest W.H.S.V., thus highest flow rate
of reactants), the contact of all the reactant molecules with the catalyst active sites
(essentially, the zeolite acid sites) was the shortest, resulting in a minimum catalytic
conversion. In particular, at zero contact time, the “ethylene + propylene” yield obtained
with pure naphtha feed would reflect that given by the thermal (steam) cracking alone.
However, the presence of methanol in the feed decreased the number of hydrocarbon
molecules (coming from LN) available for thermal cracking while the methanol
molecules that competitively adsorbed onto the acidic sites of the zeolite component, had
to undergo the primary steps of conversion into aromatic products, particularly aromatics
and polymethylbenzenes in accordance with the hydrocarbon pool mechanism.[89] In
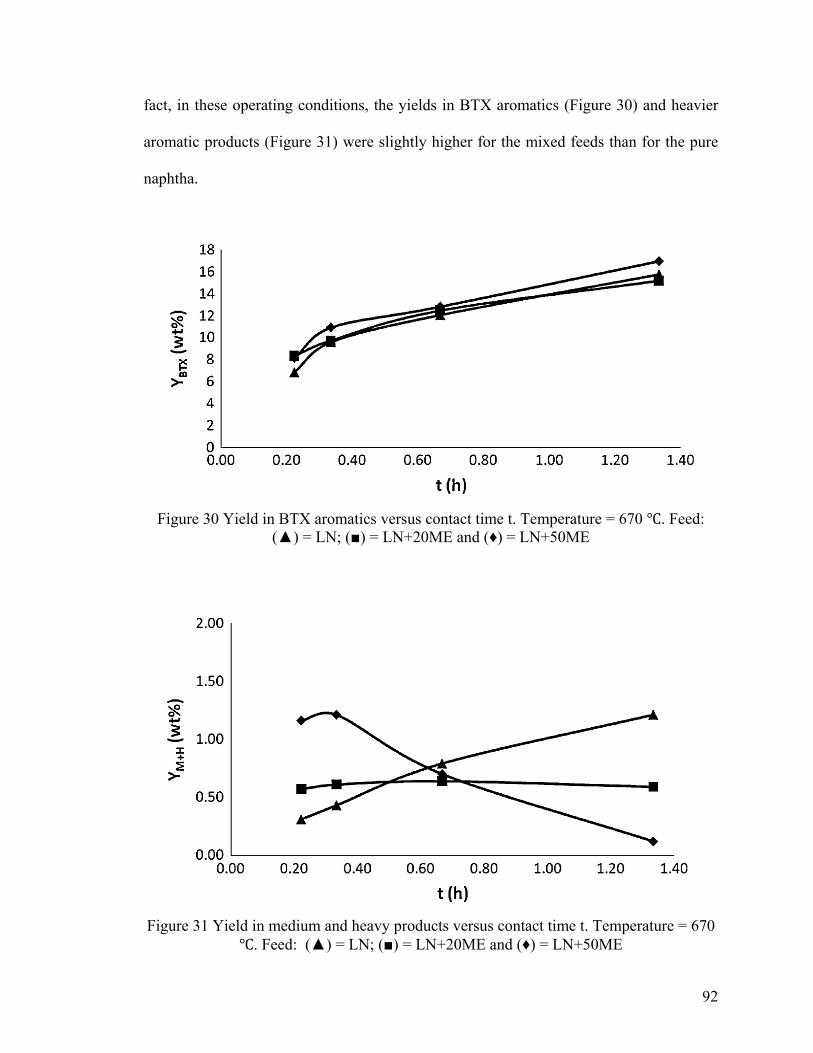
92
fact, in these operating conditions, the yields in BTX aromatics (Figure 30) and heavier
aromatic products (Figure 31) were slightly higher for the mixed feeds than for the pure
naphtha.
Figure 30 Yield in BTX aromatics versus contact time t. Temperature = 670 ℃. Feed:
(▲) = LN; (■) = LN+20ME and (♦) = LN+50ME
Figure 31 Yield in medium and heavy products versus contact time t. Temperature = 670
℃. Feed: (▲) = LN; (■) = LN+20ME and (♦) = LN+50ME
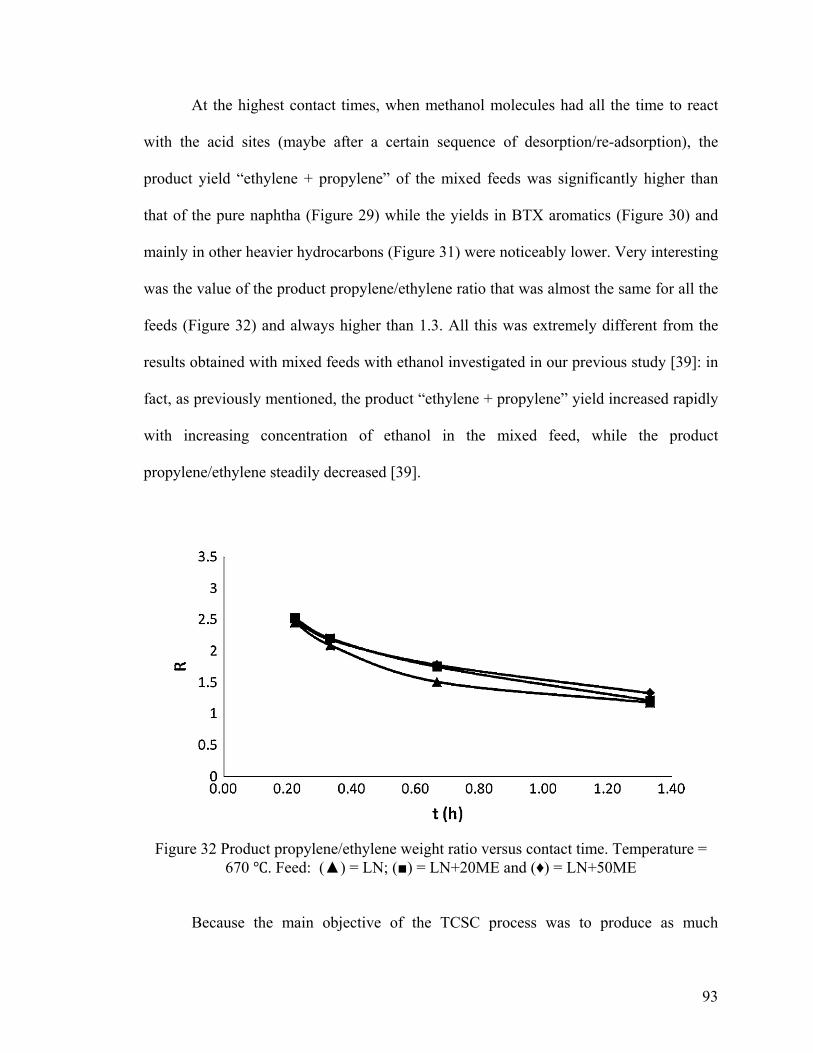
93
At the highest contact times, when methanol molecules had all the time to react
with the acid sites (maybe after a certain sequence of desorption/re-adsorption), the
product yield “ethylene + propylene” of the mixed feeds was significantly higher than
that of the pure naphtha (Figure 29) while the yields in BTX aromatics (Figure 30) and
mainly in other heavier hydrocarbons (Figure 31) were noticeably lower. Very interesting
was the value of the product propylene/ethylene ratio that was almost the same for all the
feeds (Figure 32) and always higher than 1.3. All this was extremely different from the
results obtained with mixed feeds with ethanol investigated in our previous study [39]: in
fact, as previously mentioned, the product “ethylene + propylene” yield increased rapidly
with increasing concentration of ethanol in the mixed feed, while the product
propylene/ethylene steadily decreased [39].
Figure 32 Product propylene/ethylene weight ratio versus contact time. Temperature =
670 ℃. Feed: (▲) = LN; (■) = LN+20ME and (♦) = LN+50ME
Because the main objective of the TCSC process was to produce as much
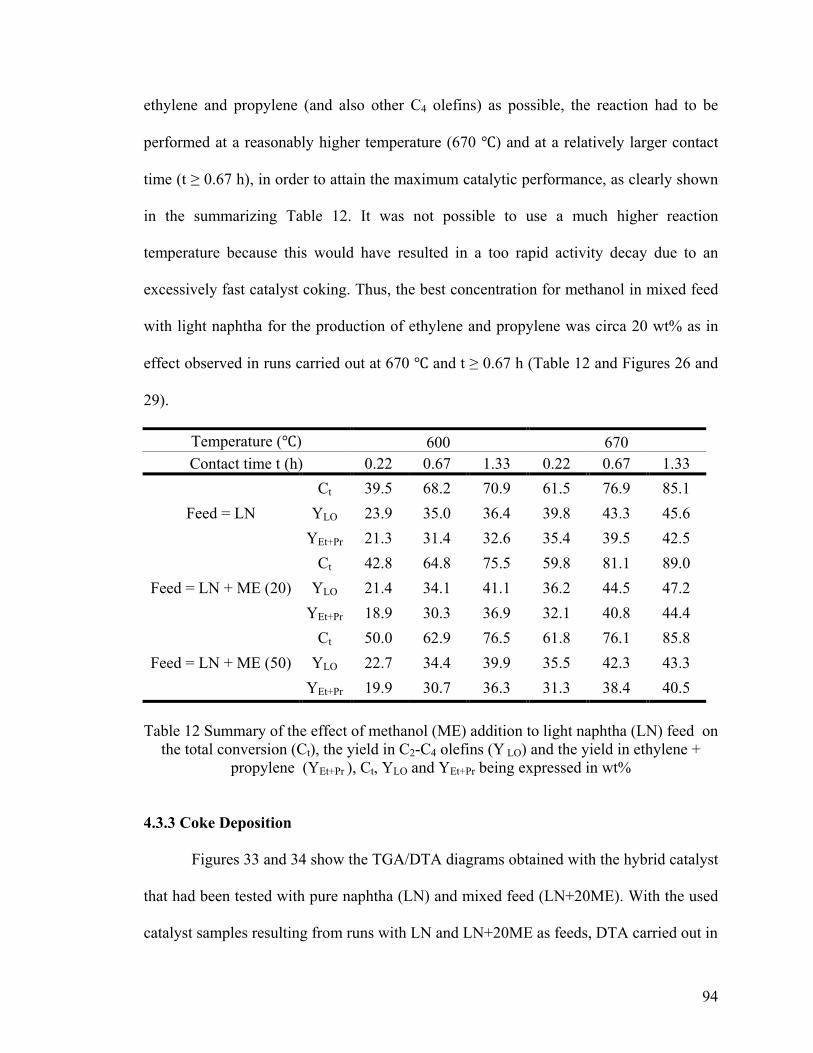
94
ethylene and propylene (and also other C4 olefins) as possible, the reaction had to be
performed at a reasonably higher temperature (670 ℃) and at a relatively larger contact
time (t ≥ 0.67 h), in order to attain the maximum catalytic performance, as clearly shown
in the summarizing Table 12. It was not possible to use a much higher reaction
temperature because this would have resulted in a too rapid activity decay due to an
excessively fast catalyst coking. Thus, the best concentration for methanol in mixed feed
with light naphtha for the production of ethylene and propylene was circa 20 wt% as in
effect observed in runs carried out at 670 ℃ and t ≥ 0.67 h (Table 12 and Figures 26 and
29).
Temperature (℃) 600 670 Contact time t (h) 0.22 0.67 1.33 0.22 0.67 1.33
Feed = LN Ct 39.5 68.2 70.9 61.5 76.9 85.1
YLO 23.9 35.0 36.4 39.8 43.3 45.6 YEt+Pr 21.3 31.4 32.6 35.4 39.5 42.5
Feed = LN + ME (20) Ct 42.8 64.8 75.5 59.8 81.1 89.0
YLO 21.4 34.1 41.1 36.2 44.5 47.2 YEt+Pr 18.9 30.3 36.9 32.1 40.8 44.4
Feed = LN + ME (50) Ct 50.0 62.9 76.5 61.8 76.1 85.8
YLO 22.7 34.4 39.9 35.5 42.3 43.3 YEt+Pr 19.9 30.7 36.3 31.3 38.4 40.5
Table 12 Summary of the effect of methanol (ME) addition to light naphtha (LN) feed on
the total conversion (Ct), the yield in C2-C4 olefins (Y LO) and the yield in ethylene + propylene (YEt+Pr ), Ct, YLO and YEt+Pr being expressed in wt%
4.3.3 Coke Deposition
Figures 33 and 34 show the TGA/DTA diagrams obtained with the hybrid catalyst
that had been tested with pure naphtha (LN) and mixed feed (LN+20ME). With the used
catalyst samples resulting from runs with LN and LN+20ME as feeds, DTA carried out in
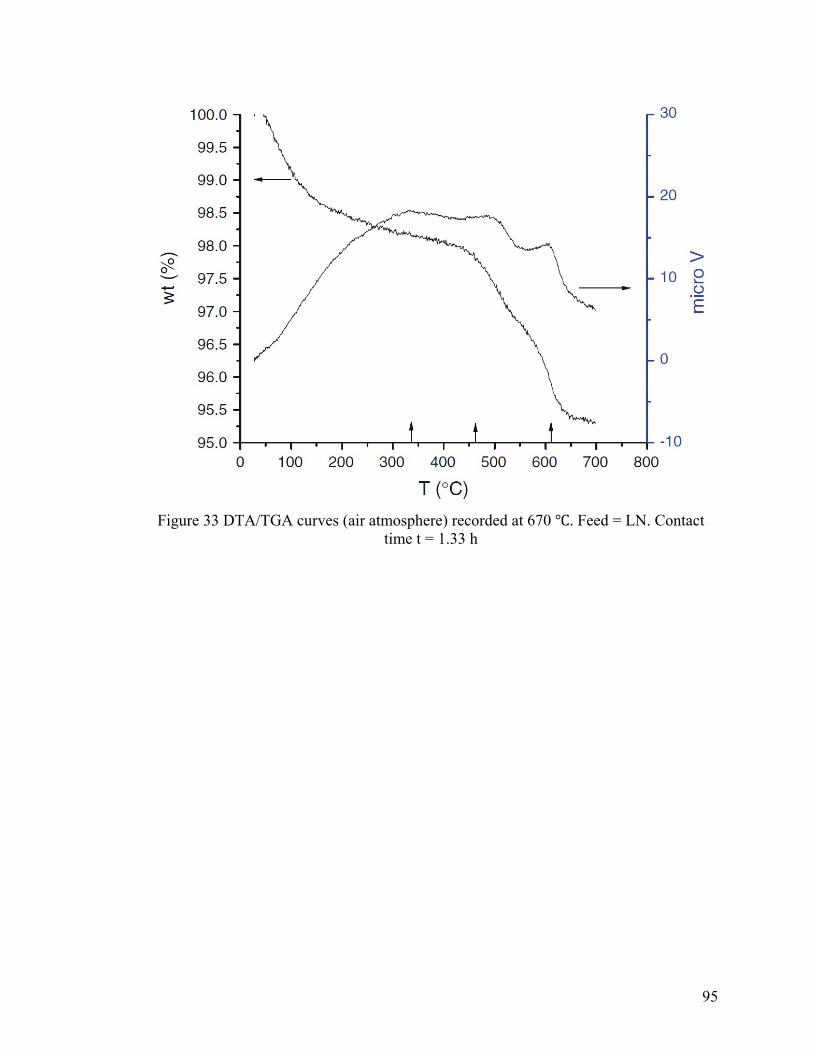
95
Figure 33 DTA/TGA curves (air atmosphere) recorded at 670 ℃. Feed = LN. Contact
time t = 1.33 h
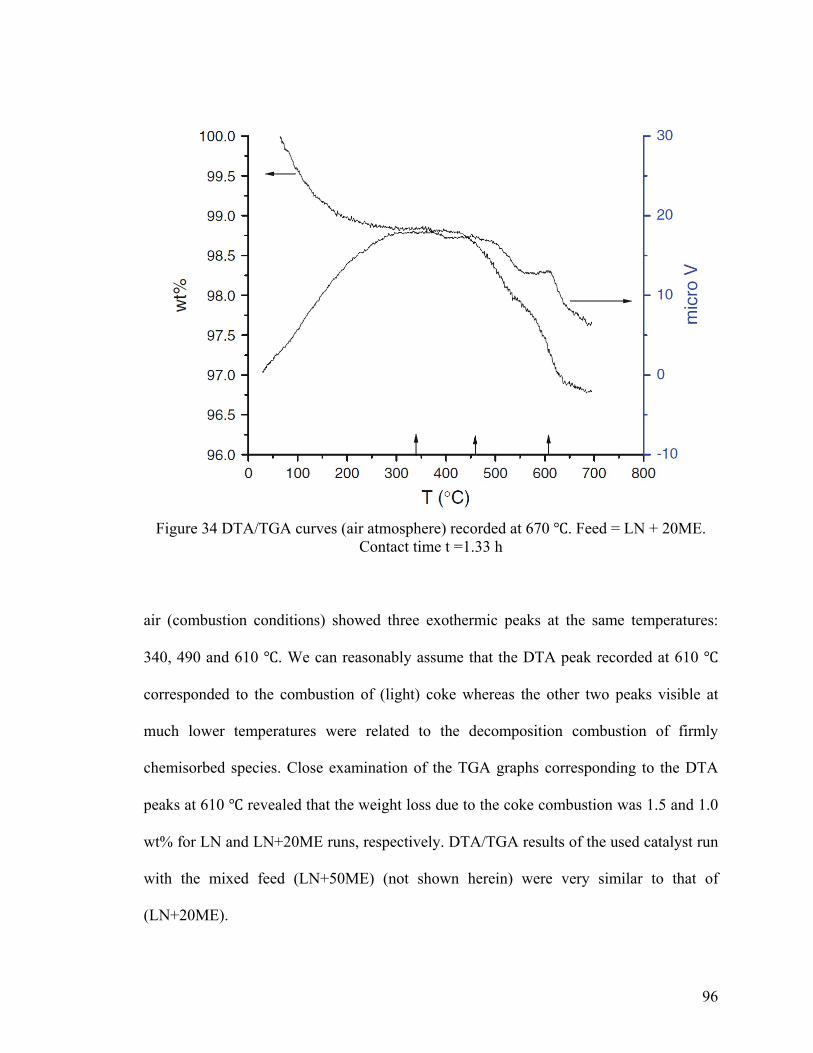
96
Figure 34 DTA/TGA curves (air atmosphere) recorded at 670 ℃. Feed = LN + 20ME.
Contact time t =1.33 h
air (combustion conditions) showed three exothermic peaks at the same temperatures:
340, 490 and 610 ℃. We can reasonably assume that the DTA peak recorded at 610 ℃
corresponded to the combustion of (light) coke whereas the other two peaks visible at
much lower temperatures were related to the decomposition combustion of firmly
chemisorbed species. Close examination of the TGA graphs corresponding to the DTA
peaks at 610 ℃ revealed that the weight loss due to the coke combustion was 1.5 and 1.0
wt% for LN and LN+20ME runs, respectively. DTA/TGA results of the used catalyst run
with the mixed feed (LN+50ME) (not shown herein) were very similar to that of
(LN+20ME).
97
Therefore, the presence of methanol in the feed resulted in:
(a) A noticeable decrease in the “coke” deposition; and
(b) Some kind of more efficient action of catalyst “surface cleaning” that could be
evidenced by a much less rapid darkening of the catalyst bed during the runs
when mixed feeds were used.
In our previous papers [35-39], the use of a co-catalyst having some hydrogen-
spillover capacity induced some coke cleaning effect on the zeolite acid surface, resulting
thus in a better catalyst on-stream stability.
In the present work, we could observe the same beneficial effect with the (Zn–Pd)
co-catalyst: the coke deposition was much less than with monocomponent ZSM-5 zeolite
catalyst (no co-catalyst). Figures 33 and 34 showed that in the present conditions of
TCSC testing, the amount of coke laid down was always lower than 1.5 wt%. Thus, the
cleaning effect of the hybrid catalyst was particularly more effective with mixed feeds
than with the “pure” light naphtha hydrocarbons.
For now, we cannot explain the previous phenomenon (more efficient hydrogen
spillover effect promoted by methanol or fierce competitive adsorption/desorption over
zeolite acid sites?). In fact, although we believe that methanol as co-feed is quite well
integrated into the reaction pathways of the hydrocarbons of LN feed, a massive presence
of methanol may result in higher turnover “reactant adsorption/product desorption” on
the zeolite acid sites, thus lowering the formation of coke precursors and finally
decreasing coke deposition rate.
98
4.4 CONCLUSION
Preliminary mechanistic investigations show that mixing some methanol with
petroleum light naphtha used as feed in the TCSC process significantly increased the
product yield of C2–C4 olefins, particularly that of ethylene and propylene, at relatively
large contact times. However, there was also a maximum limit for the methanol content
in the mixed feed: over 20 wt% of methanol, this beneficial effect was not as important as
expected. Also at relatively high values of contact times, the (Zn–Pd) co-catalyst of the
hybrid catalyst exerted visibly its coke cleaning effect, even and mostly in the presence of
methanol in the feed. The product weight ratio (propylene/ethylene) was not affected by a
“moderate” addition of methanol and remained always higher than 1.3.
Important facts that we have to elucidate in the near future through detailed
mechanistic and kinetic investigations are as follows:
(1) At moderate values of contact time, the feeds (pure light naphtha and its
various mixed feeds with methanol) show the same values of product yields and
coke deposition. Does this indicate that hydrocarbons of the light naphtha and
methanol undergo cracking following the same reaction pathways?
(2) However, at very large values of contact time, there are noticeable differences
in product yields and coke deposition depending on the type of feed used.
Diffusion and re-adsorption of various reaction intermediates may be the causes
of such differences when the zeolite pores are modified by a partial coking.
There are several prospects for future industrial development of the results of this
work, using the TCSC technology as a model. We are thinking of the FCC technology
that makes use of catalysts with ZSM-5 additives to produce higher light
99
olefins.[90][91][92] In fact, with the development of efficient feed injection systems
(multiple injectors), it would be relatively easy to inject methanol along with the usual
FCC hydrocarbon feed.[93] In addition, new techniques for FCC catalyst preparation
based on the spray-dry method [91] and/or in situ synthesis [94] will be developed in
order to bring the hybrid catalysts into the fluidized-bed technology field. Therefore,
significant increase of light olefins yield and much less catalyst coking are expected with
such technology developments.
Finally, it is to note that moderate addition of methanol to naphtha used as feed in
the TCSC process slightly increases both the total conversion and the yield in “propylene
+ ethylene” (Figure 26). Thus, this “methanol addition” strategy may be advantageous in
consideration of the today’s prices[ 95 ] (only for purpose of showing the order of
magnitude):
– Crude oil: USD 81.70/barrel or USD 1.95/gallon
– Petroleum naphtha: USD 0.5–1.5/gallon
– Methanol: USD 1.08/gallon
This strategy may be even more advantageous for companies or countries that
have large natural gas resources to be converted into methanol.
4.5 AUTHOR’S NOTES AND SIGNIFICANCE OF PAPER TO THESIS
This work on the preliminary mechanistic investigations of the conversion of
“methanol-light naphtha” blends was the first article in the literature showing the effect
of methanol on a hydrocarbon feed in TCSC process for light olefins production. The
100
results of this study indicated that a partial replacement of light naphtha with methanol
significantly increased the product yield of C2-C4 olefins, particularly that of ethylene and
propylene. Nevertheless, our studies found that there was also a maximum limit for the
methanol content in the mixed feed. Over 20 wt% of methanol, the beneficial effect of
methanol was not as important as expected.
The following chapter is a continuous effort toward the understanding of the
effect of methanol on the processing of “methanol-light naphtha” blends as feedstock.
The Cracking behavior the mixed feed will be investigated in various operation
conditions. The effects of the steam dilution on the conversion, product selectivity and
coke deposition would be carefully observed. Moreover, certain kinetic parameters will
be measured. By doing so, we will be try to answer the following question: if
hydrocarbons of the light naphtha and methanol undergo cracking following the same
reaction pathways?
101
Chapter V
Catalytic Compatibility of Methanol with Petroleum Naphtha in Mixed Feeds Used in the Thermal-Catalytic/Steam-Cracking (TCSC) Process for the Production of Propylene and Ethylene
Published as:
H.T. Yan and R. Le Van Mao
Catal. Lett. 142 (2012) 60-70
102
5.1 INTRODUCTION
Ethylene and propylene, two important petrochemical intermediates, are mainly
produced by steam cracking of various hydrocarbon feedstocks.[87] Because the yield of
propylene in steam cracking is usually low and the worldwide demand for this light olefin
is continuously increasing, the need of propylene can be covered by other processes such
as propane dehydrogenation, olefin metathesis and, primarily, catalytic cracking (FCC).
The thermal-catalytic/steam-cracking (TCSC), also formerly named (SDCC or
selective deep catalytic cracking, TCC or thermo-catalytic cracking),[33][35-38] has been
developed in our laboratory to selectively produce propylene and ethylene from the same
hydrocarbon feeds as in steam cracking. The TCSC process, which combines the (mild)
thermal cracking (TC) with the acid cracking promoted by a zeolite-based catalyst, can
provide very high yields of light olefins with a propylene-to-ethylene weight ratio much
higher than 1.0 while operating at temperatures much lower than those used in the steam
cracking technology. Most of the catalysts used in the TCSC process are in the hybrid
configuration, i.e., they are comprised of two porous components with relatively high
surface area: an acidic zeolite based component and a co-catalyst capable of exerting a
specific physical-chemical effect on the overall catalytic reaction. In this work, the (Zn-
Pd) co-catalyst shows strong activities of (hydrocarbon) steam reforming (and water-gas
shift). A “pressurizing” binder is used to firmly hold the two types of particles together
within the hybrid catalyst extrudates. Some hydrogen species, produced by the co-
catalyst surface, can be transferred to the zeolite surface using the experimentally proven
effect of “pore continuum” [40][41]: these “hydrogen spillover” species show some very
103
significant cleaning effect on the coke precursors formed and still adsorbed on the zeolite
acid sites [36-38].
In recent years, results of the cracking reaction over ZSM-5 type zeolite that was
carried out with “hydrocarbons-alcohol” mixed feeds were reported: methanol and
hydrocarbons,[96] methanol and n-hexane,[97 and references therein] methanol and n-
butane,[98] methanol and 1-butene,[99] ethanol and n-hexane.[100] Two papers on the
TCSC of mixtures of gas oil and a short chain alcohol (and particularly methanol),[39]
and of light naphtha and methanol,[101] were already published by our group.
In this work, we would like to investigate the cracking behavior of the mixed feed
“light naphtha–methanol” over the (Zn–Pd) hybrid catalyst in various operating
conditions. Particularly, the effects of the steam dilution on the conversion, product
selectivity and coke deposition would be carefully observed in two specific situations:
thermal cracking (TC) and overall catalytic (OC, thermal + catalytic) cracking. In
addition, by measuring some kinetic parameters such as the apparent activation energy,
we would like to answer the question that was raised in our previous works[39][101]:
when mixed with the light naphtha hydrocarbons, does methanol incorporate itself into
the cracking “hydrocarbon pool” or react merely by itself as in steam (thermal) cracking?
5.2 EXPERIMENTAL
5.2.1 Preparation of the Hybrid Catalyst
The preparation of the hybrid catalyst followed the same procedure as described
in our previous work.[101] Thus, the final hybrid catalyst resulted from the extrusion of
two porous components by using bentonite clay as “pressurizing” binder: the main
104
component was the H-ZSM-5 zeolite and the co-catalyst, an yttria-stabilized alumina
aerogel loaded with Zn–Pd.[101] Essentially, the hybrid catalyst was comprised of [101]:
(a) as main catalyst component (65.6 wt%), an acidic ZSM-5 zeolite, having the
following characteristics: Si/Al ratio = 50, total BET surface area = 403 m2/g;
(b) as co-catalyst (16.4 wt%), Zn–Pd loaded onto an yttria-stabilized alumina aerogel
(Y-AS), having the following weight composition: Zn = 9.2%, Pd = 1.1% and Y-
AS = balance;
(c) Bentonite clay (Aldrich, 18.0 wt%).
5.2.2 Catalyst Characterization
The hybrid catalyst and its components were characterized using the techniques as
described in Ref. [101].
5.2.3 Experimental Set-Up and Testing Proedure
Light naphtha (named LN, supplied by Ultramar Corp., Quebec, Canada) had the
following composition, in wt% [101]: n-alkanes (n-pentane, n-hexane and n-heptane) =
47.2, iso-alkanes (isopentane, isohexane) = 40.7, cyclohexane = 5.4, benzene = 6.0 and
heavier hydrocarbons (C8+) = 0.7.
The feed components, namely, naphtha LN, in one infusion pump, and methanol
(pure reagent, Aldrich) dissolved in water in another infusion pump, were injected into
two vaporizers, respectively. The resulting vapors (hydrocarbons on one side, steam and
vaporized methanol on the other side) were then thoroughly mixed in a (heated)
homemade gas mixer. The resulting gaseous stream was then sent into a tubular reactor
(quartz tube, 50 cm long, 1.5 cm in outer diameter and 1.2 cm in inner diameter). The
temperatures were controlled and regulated by automatic devices that were connected to
105
chromel–alumel thermocouples (set in the catalytic bed and in the preheating zone) and
the heating furnace.
In the following, LN, 20 MeOH, 50 MeOH and MeOH, denote feeds of light
naphtha, light naphtha mixed with 20 wt% of methanol, light naphtha mixed with 50 wt%
of methanol, and pure methanol, respectively. The testing conditions were as follows:
temperature (of the catalyst bed) = 600, 615, 635, 650 and 670 ± 2 ℃; total weight hourly
space velocity (WHSV, related to naphtha or methanol, or naphtha + methanol) = 10–60
h-1; steam/feed weight ratio (feed: all C-containing reactants in the feed) or Rwf = 0.5–2.0;
catalyst weight = 2 g (1 g for study of steam dilution); duration of a run = 4 h.
Liquid and gaseous products were collected separately, using a system of
condensers. The gas-phase components were analyzed using a Hewlett-Packard (HP)
Model 5890 FID gas chromatograph that was equipped with a 30 m GS capillary column
(Agilent J&W Scientific), while the analysis of the liquid phase was performed using
another HP gas chromatograph of same model but equipped with a HP-5 capillary
column (Agilent J&W Scientific, 30 m).
The total conversion Ct was defined as the percentage of the weight of (all the
components of) the organic feed (light naphtha and eventually methanol) converted into
final products (and coke) as follows: Ct = 100% × (Wi – Wf)/Wi
Wi and Wf being the weights of the all organic compounds of the feed (injected into the
reactor) and the same organic compounds collected at the outlet of the reactor,
respectively. Thus, the conversion is essentially referred to the consumption of reactants.
106
The product selectivity Si was defined as the percentage of the weight of product i
over the weight of all the reaction products collected.
In the following, Ctc and Ctt refer to the total conversion for TC and overall
catalytic cracking (OC), respectively (see Sect. 5.2.4).
Several runs, carried out in the same reaction conditions (reproducibility of the
testing method), showed that the data experimental error in this study was ±0.3%.
The WHSV was defined as the total flow-rate of C-containing reactants of the
feed (expressed in g h-1) divided by the catalyst weight (expressed in g), so that its unit
was h-1. Thus, the contact time ct (reciprocal of WHSV) was expressed in h.
The residence time rt, used in the study of the TC alone, was defined as the void
volume of the catalyst (expressed in cm3), divided by the total flow-rate of C-containing
gaseous reactants of the feed (expressed in cm3 s-1), so that its unit was second. It is to be
noted that the void volume of the catalyst was assumed to be similar to that left by a
packing of quartz beads with proper size. In such manner, the catalyst bed filled with
these quartz beads showed almost the same void volume as that containing the real
catalyst extrudates. The low surface area of these quartz beads (<0.2 m2/g) was assumed
not to be catalytically active. The value of the residence time rt used in this work ranged
from 0.68 to 5.42 s.
5.2.4 Determination of the Apparent Activation Energy
As reported in our previous paper [101], there are two effects in the TCSC
conversion: the TC (thermal cracking) and the OC. While the second effect includes that
of the TC and the conversion due to the catalyst, it is possible to assess the TC effect if
107
the reaction system is run without any catalyst [101]. Thus, the kinetics of TC was
studied by varying the residence time, the contact time being nil. However, it is
impossible to determine the effect of the sole catalytic cracking because in the reaction
medium, products from TC might be adsorbed on the catalyst surface and thus undergo
further conversion on these active sites. Therefore, kinetic data that bear the mention
“overall catalytic cracking”, refer to these two untied effects.
The following procedure was used to determine the apparent activation energy
(Arrhenius equation) for both OC and TC.[102]
Data of total conversion were plotted against corresponding values of contact time
ct and residence time rt, respectively. By using the method of regression analysis based
on a polynomial function for the best curve fitting, the following equations were found:
Thermal cracking: Ctc = a + b (rt) + c (rt)2 + d (rt)3 + …
Overall catalytic cracking: Ctt = e + f (ct) + g (ct)2 + h (ct)3 + …
• For TC, if the residence time rt = 0 (flow-rate of feed = 0), Ctc = a = 0.
• For OC, if the contact time ct = 0 (no catalyst), Ctt = e.
On the other hand, in order to give a full physical meaning to our data when using
a curve fitting with a polynomial function, the power coefficient of such function must be
as low as possible with the condition that the correlation factor is close to 1.00 (0.95). It
was observed that the polynomial functions for the plot Ctc versus rt and that of Ctt versus
ct could be written as follows:
Thermal cracking: Ctc = b (rt) + c (rt)2
(using power coefficient = 2). Thus:
108
Ctc’ (time derivative) = b + 2 c (rt) (equation 1)
Overall catalytic cracking: Ctt = e + f (ct) + g (ct)2
(using power coefficient = 2). Thus:
Ctc’ (time derivative) = f + 2 g (ct) (equation 2).
Ctc’ and Ctt
’ being the time derivative of the total conversion for TC and OC,
respectively. Thus, they are equal to the respective rates.
It is usually more convenient to determine the initial rate for each category of
reaction (rt and ct are both tending to zero), so that the coke deposited is almost nil and
the measured rate is totally related to the formation of reaction products. Such assumption
is fully supported by experimental data, as shown in the following example:
– Feed= light naphtha, reaction temperature = 635 ℃, Rwf = 2.0: conversion of
overall cracking (Ctt) = 5.73 wt%, that was equivalent to 2.86 g of reaction
products collected for a run of 240 min (4 h); amount of coke formed on the
hybrid catalyst (determined by TGA– DTA) in the same period of time (240 min)
= 0.0041 g. Thus, the weight ratio of products to coke was = 700. This means that,
in conditions used for this kinetic study (for having low conversions), the average
rate of formation of products on the fresh catalyst surface was almost 700 times
higher than that of coking. In other words, when the conversion was low (lower
than 25 wt%, preferably lower than 15 wt%), the rate of formation of coke could
be neglected in comparison with that of formation of products.
– In these conditions, the conversion based on the reaction products, experimentally
determined, was almost equal to that based on the consumption of the organic
compounds of the feed, as defined in Sect. 5.2.3.
109
Thus, the Eqs. 1 and 2 result simply in: Initial rate for thermal cracking: ro =
[Ctc’]o = b, and for overall catalytic cracking: ro = [Ctt’]o = f.
Because the determination of the initial rate for each category of cracking reaction
and for each temperature investigated in this study was carried out with the same
concentration of organic reactants in initial conditions (the catalyst weight or the void
volume, and the Rwf, being all held constant, only the flow-rate of organic reactants was
varied), we can write that:
ro = ko (concentration)
with ko being the (initial) rate constant and assuming a first-order reaction. Thus, ro = ko
(constant).
By simply using the Arrhenius equation [102][103]:
ko =A × exp(-Ea/RT)
where A is the pre-exponential factor, Ea the (apparent) activation energy, T the absolute
temperature of the reaction, and R is the ideal gas constant.
The apparent activation energy can be determined as follows:
ro = Ӓ × exp(-Ea /RT)
with Ӓ = A × (constant)
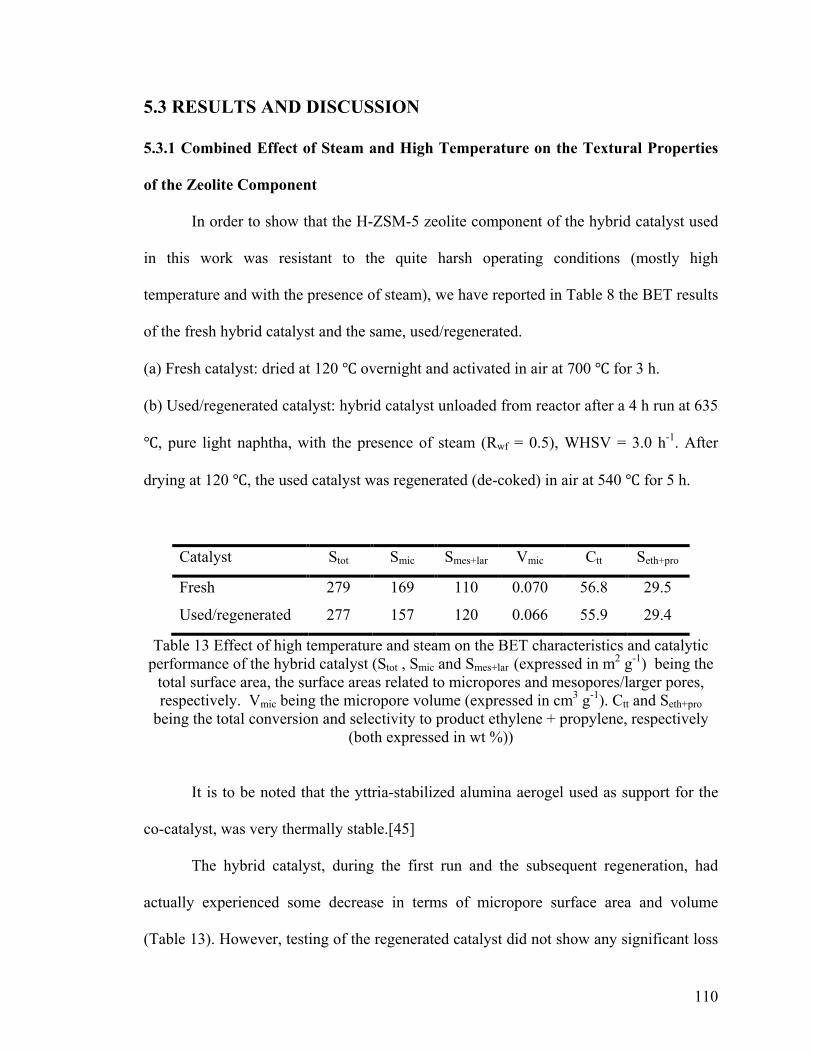
110
5.3 RESULTS AND DISCUSSION
5.3.1 Combined Effect of Steam and High Temperature on the Textural Properties
of the Zeolite Component
In order to show that the H-ZSM-5 zeolite component of the hybrid catalyst used
in this work was resistant to the quite harsh operating conditions (mostly high
temperature and with the presence of steam), we have reported in Table 8 the BET results
of the fresh hybrid catalyst and the same, used/regenerated.
(a) Fresh catalyst: dried at 120 ℃ overnight and activated in air at 700 ℃ for 3 h.
(b) Used/regenerated catalyst: hybrid catalyst unloaded from reactor after a 4 h run at 635
℃, pure light naphtha, with the presence of steam (Rwf = 0.5), WHSV = 3.0 h-1. After
drying at 120 ℃, the used catalyst was regenerated (de-coked) in air at 540 ℃ for 5 h.
Catalyst Stot Smic Smes+lar Vmic Ctt Seth+pro
Fresh 279 169 110 0.070 56.8 29.5
Used/regenerated 277 157 120 0.066 55.9 29.4
Table 13 Effect of high temperature and steam on the BET characteristics and catalytic performance of the hybrid catalyst (Stot , Smic and Smes+lar (expressed in m2 g-1) being the
total surface area, the surface areas related to micropores and mesopores/larger pores, respectively. Vmic being the micropore volume (expressed in cm3 g-1). Ctt and Seth+pro
being the total conversion and selectivity to product ethylene + propylene, respectively (both expressed in wt %))
It is to be noted that the yttria-stabilized alumina aerogel used as support for the
co-catalyst, was very thermally stable.[45]
The hybrid catalyst, during the first run and the subsequent regeneration, had
actually experienced some decrease in terms of micropore surface area and volume
(Table 13). However, testing of the regenerated catalyst did not show any significant loss
111
of the catalytic activity (less than 2%, Table 13). This evidenced that there was some
rearrangement of the internal surface of the zeolite component (as usually observed)
occurring during this first cycle of run-regeneration, however such change did not
significantly affect the overall catalytic performance of the hybrid catalyst in other
following tests. The quite high resistance of the H-ZSM-5 zeolite to steam and high
temperature used was also observed with gas oil feeds [36][39]: thus, there were no
serious phenomena of zeolite dealumination in the conditions used in this work.
5.3.2 Effect of Steam Dilution on the Reactivity of “Petroleum Naphtha-Methanol”
Mixtures
In the hydrocarbon steam-cracking and related processes, steam plays an
important role. It is a diluting agent for the vaporized feed and a retardant of coke
formation. In the TCSC process, steam dilutes the organic feed and may contribute to
some extent to the cleaning of the catalytic sites. In fact, with its strong affinity for the
zeolite acid sites where cracking occurs, it can displace out some coke precursors before
these latter species can undergo further conversion to coke. However, the “cleaning”
effect of steam was extremely weak when compared to that of the hydrogen spillover
species, the latter being purposely in situ produced: in fact, the weight of coke deposited
on the hybrid nano-catalyst was only 25–30 wt% of that found on the reference catalysts
(i.e. H-ZSM-5 based catalyst not having any co-catalyst with steam-reforming properties)
[36].
5.3.2.1 Steam Dilution Effect on the Overall Catalytic Cracking
In the TCSC process, the steam dilution, Rwf = 0.5 is normally used for light
naphtha and gas oil [35-39][101]. Much higher Rwf values were used in the present work
112
in order to assess the effect of a more important presence of steam in the feed. It was
expected that the competitive sorption of water molecules for the acid sites depended on
the affinity for protons of the reactant molecules. The effect of steam (as represented by
the “H2O/organic feed” ratio or steam dilution factor, R) on the activity (as represented
by the total conversion Ctt), shown in Figure 25, can be summarized as follows.
(a) With “pure” light naphtha as feed, the increased presence of steam was very
detrimental to the catalytic activity. In fact, the total conversion almost decreased
by half when Rwf increased from 0.5 to 2.0.
(b) With “pure” methanol as feed, no large variation of the total conversion was
observed.
(c) With “naphtha–methanol” mixtures, intermediary behaviors were observed.
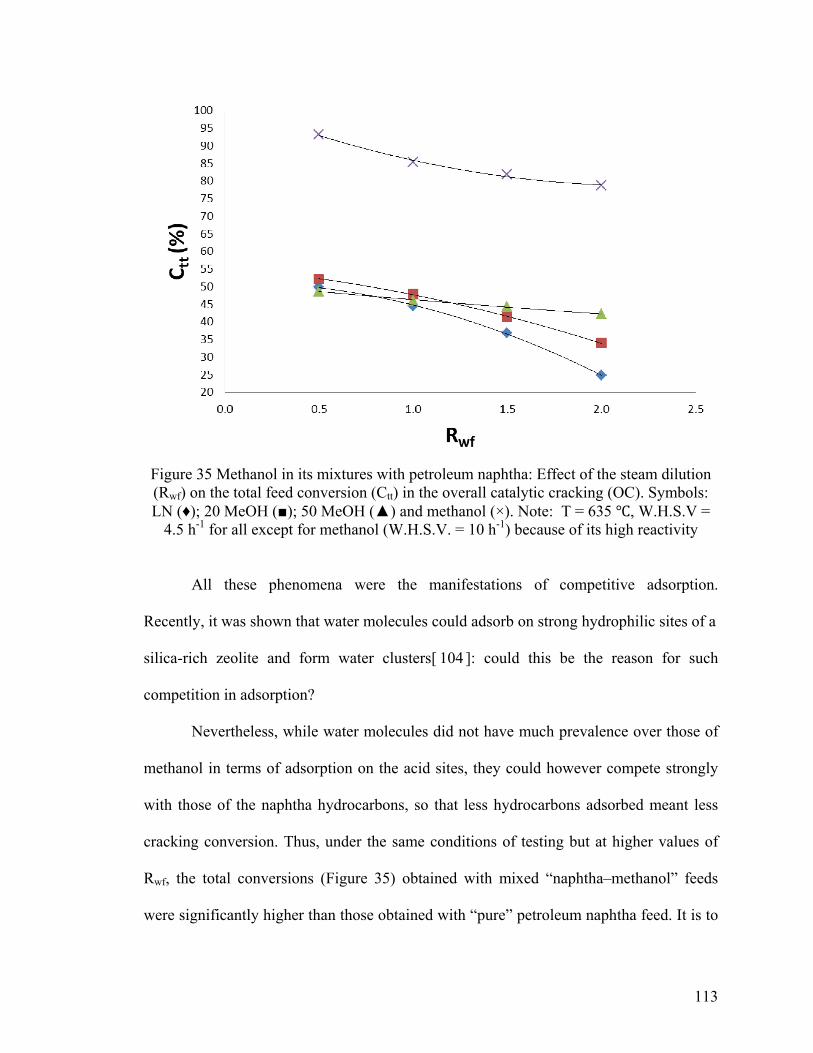
113
Figure 35 Methanol in its mixtures with petroleum naphtha: Effect of the steam dilution (Rwf) on the total feed conversion (Ctt) in the overall catalytic cracking (OC). Symbols: LN (♦); 20 MeOH (■); 50 MeOH (▲) and methanol (×). Note: T = 635 ℃, W.H.S.V =
4.5 h-1 for all except for methanol (W.H.S.V. = 10 h-1) because of its high reactivity
All these phenomena were the manifestations of competitive adsorption.
Recently, it was shown that water molecules could adsorb on strong hydrophilic sites of a
silica-rich zeolite and form water clusters[ 104 ]: could this be the reason for such
competition in adsorption?
Nevertheless, while water molecules did not have much prevalence over those of
methanol in terms of adsorption on the acid sites, they could however compete strongly
with those of the naphtha hydrocarbons, so that less hydrocarbons adsorbed meant less
cracking conversion. Thus, under the same conditions of testing but at higher values of
Rwf, the total conversions (Figure 35) obtained with mixed “naphtha–methanol” feeds
were significantly higher than those obtained with “pure” petroleum naphtha feed. It is to
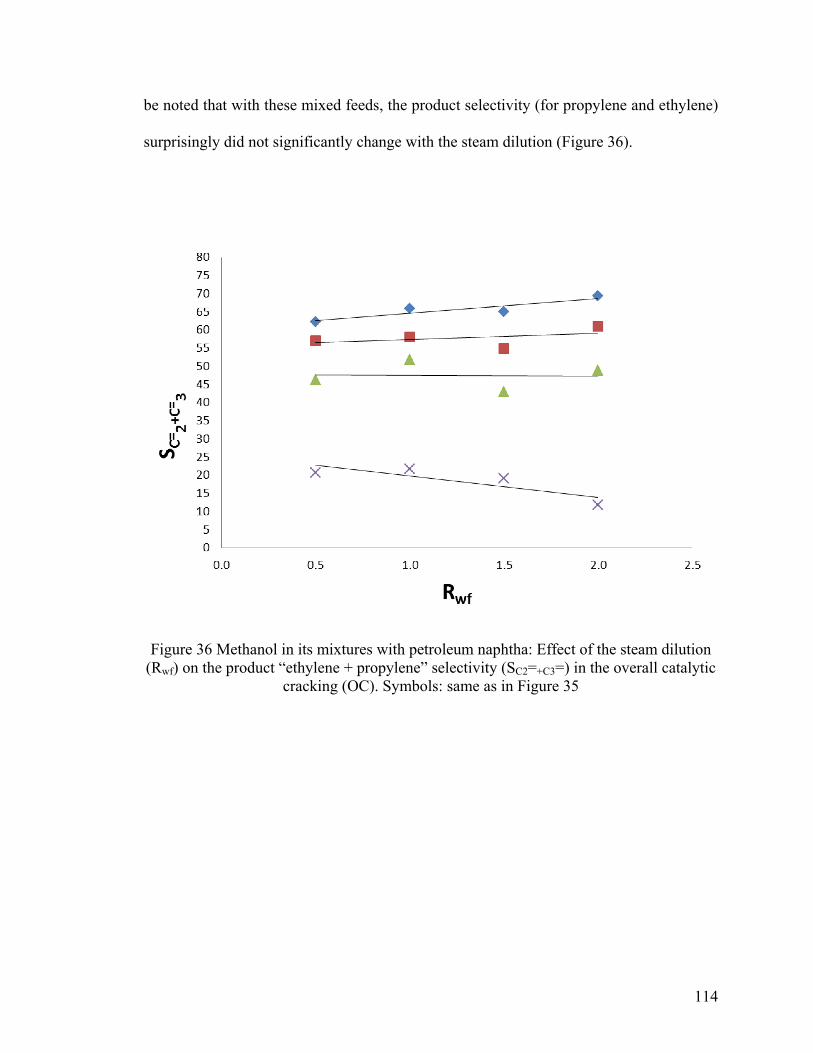
114
be noted that with these mixed feeds, the product selectivity (for propylene and ethylene)
surprisingly did not significantly change with the steam dilution (Figure 36).
Figure 36 Methanol in its mixtures with petroleum naphtha: Effect of the steam dilution (Rwf) on the product “ethylene + propylene” selectivity (SC2=+C3=) in the overall catalytic
cracking (OC). Symbols: same as in Figure 35
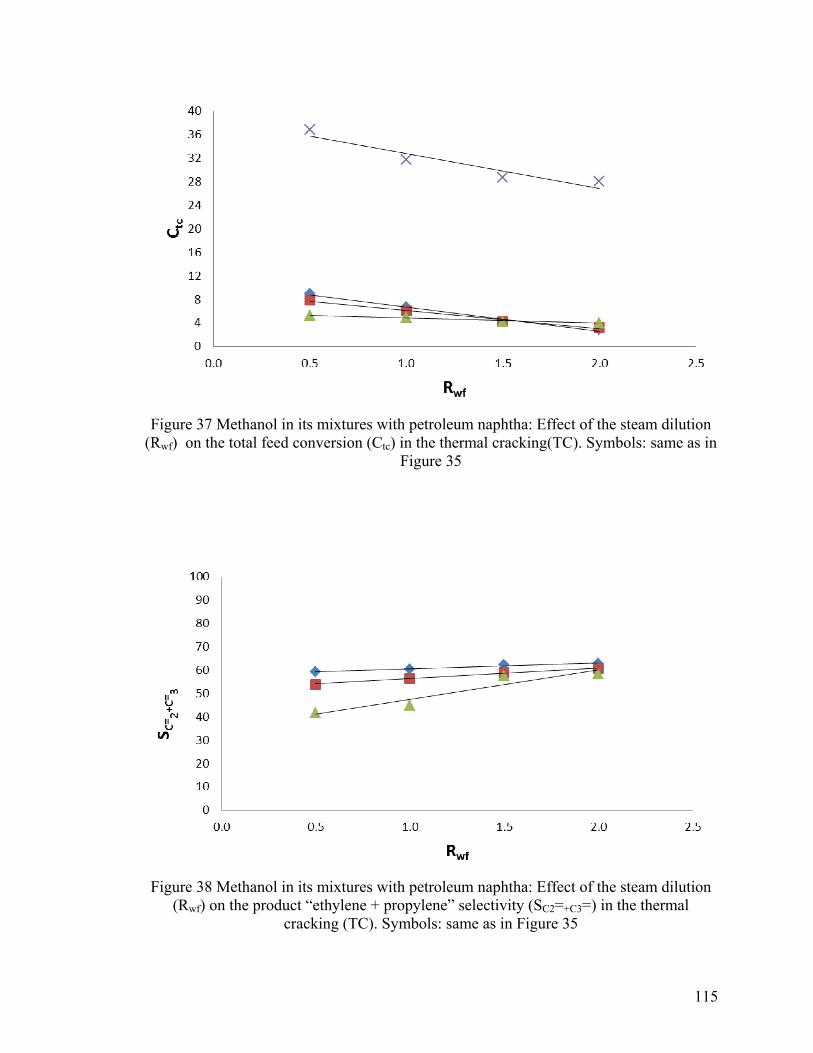
115
Figure 37 Methanol in its mixtures with petroleum naphtha: Effect of the steam dilution
(Rwf) on the total feed conversion (Ctc) in the thermal cracking(TC). Symbols: same as in Figure 35
Figure 38 Methanol in its mixtures with petroleum naphtha: Effect of the steam dilution
(Rwf) on the product “ethylene + propylene” selectivity (SC2=+C3=) in the thermal cracking (TC). Symbols: same as in Figure 35
116
5.3.2.2 Steam Dilution Effect on the Thermal Cracking
The same behaviors (for conversion and product selectivity) were found for TC
(Figures 37 and 38). It was obvious that the present conversion levels were much lower
than those recorded for the OC (Figure 35 vs. Figure 37). Interestingly, the conversion of
methanol in the TC reaction was more influenced by the steam dilution. In addition, the
product selectivity for (ethylene + propylene) when pure methanol was used as feed, was
almost nil (not reported in Figure 38), methane being the main product.
5.3.2.3 Effect of the Steam Dilution on the Coke Deposition onto the Catalyst
Surface
In our previous work [36], it was shown that the coke deposition onto the hybrid
catalyst was less than one-third of that deposited on the reference catalyst (only ZSM-5
component): it was suggested that hydrogen species produced by the co-catalyst surface
that were then transferred (spilt-over) onto the zeolite cracking sites, were effective to
reduce the amount of coke formed, with as a result, significantly enhanced conversion
and product selectivity.
In this work, the amount of coke laid down on the hybrid catalyst (wc) was
measured at various steam dilutions (0.5, and 2.0; Table 14). To assess the effect of
fouling on the catalyst activity, the Z factor, defined as the ratio of wc (g of coke per 100
g of catalyst) to the total conversion Ctt (g of reaction products per 100 g of feed), was
used herein.
It is well known that normally, the more important the presence of steam in the
feed, the lower the conversion: this was primarily due to the reactants dilution by steam.
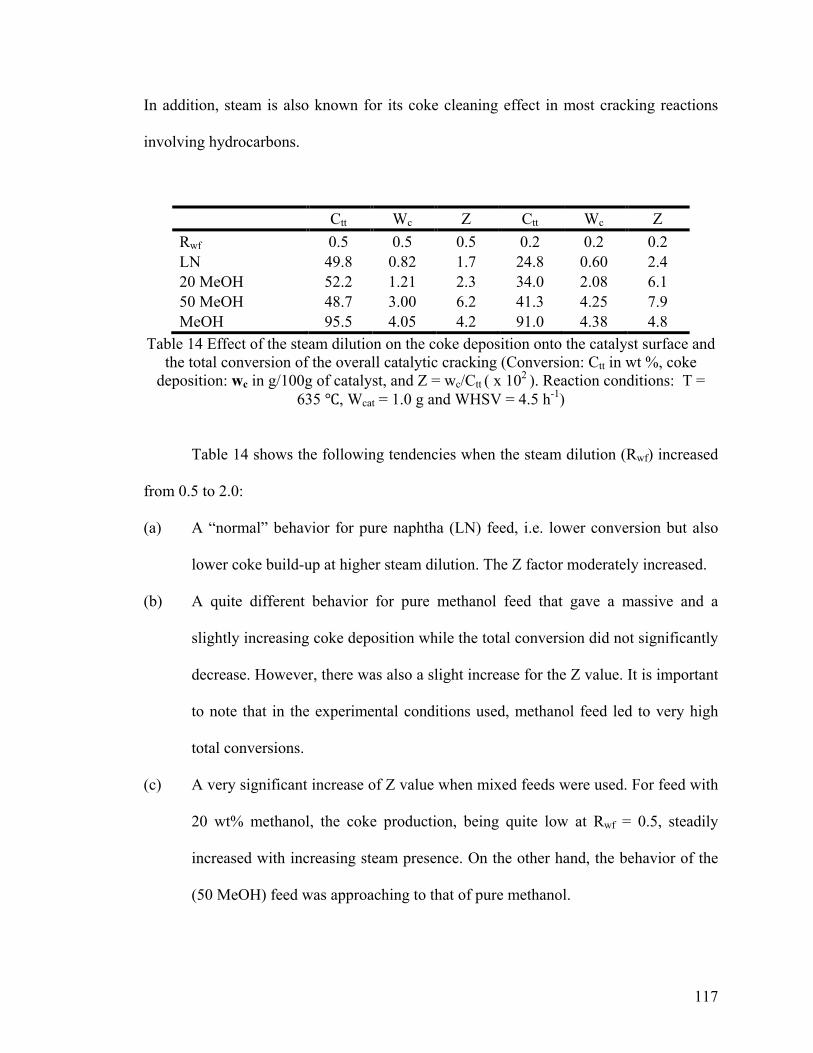
117
In addition, steam is also known for its coke cleaning effect in most cracking reactions
involving hydrocarbons.
Ctt Wc Z Ctt Wc Z Rwf 0.5 0.5 0.5 0.2 0.2 0.2 LN 49.8 0.82 1.7 24.8 0.60 2.4 20 MeOH 52.2 1.21 2.3 34.0 2.08 6.1 50 MeOH 48.7 3.00 6.2 41.3 4.25 7.9 MeOH 95.5 4.05 4.2 91.0 4.38 4.8
Table 14 Effect of the steam dilution on the coke deposition onto the catalyst surface and the total conversion of the overall catalytic cracking (Conversion: Ctt in wt %, coke
deposition: wc in g/100g of catalyst, and Z = wc/Ctt ( x 102 ). Reaction conditions: T = 635 ℃, Wcat = 1.0 g and WHSV = 4.5 h-1)
Table 14 shows the following tendencies when the steam dilution (Rwf) increased
from 0.5 to 2.0:
(a) A “normal” behavior for pure naphtha (LN) feed, i.e. lower conversion but also
lower coke build-up at higher steam dilution. The Z factor moderately increased.
(b) A quite different behavior for pure methanol feed that gave a massive and a
slightly increasing coke deposition while the total conversion did not significantly
decrease. However, there was also a slight increase for the Z value. It is important
to note that in the experimental conditions used, methanol feed led to very high
total conversions.
(c) A very significant increase of Z value when mixed feeds were used. For feed with
20 wt% methanol, the coke production, being quite low at Rwf = 0.5, steadily
increased with increasing steam presence. On the other hand, the behavior of the
(50 MeOH) feed was approaching to that of pure methanol.
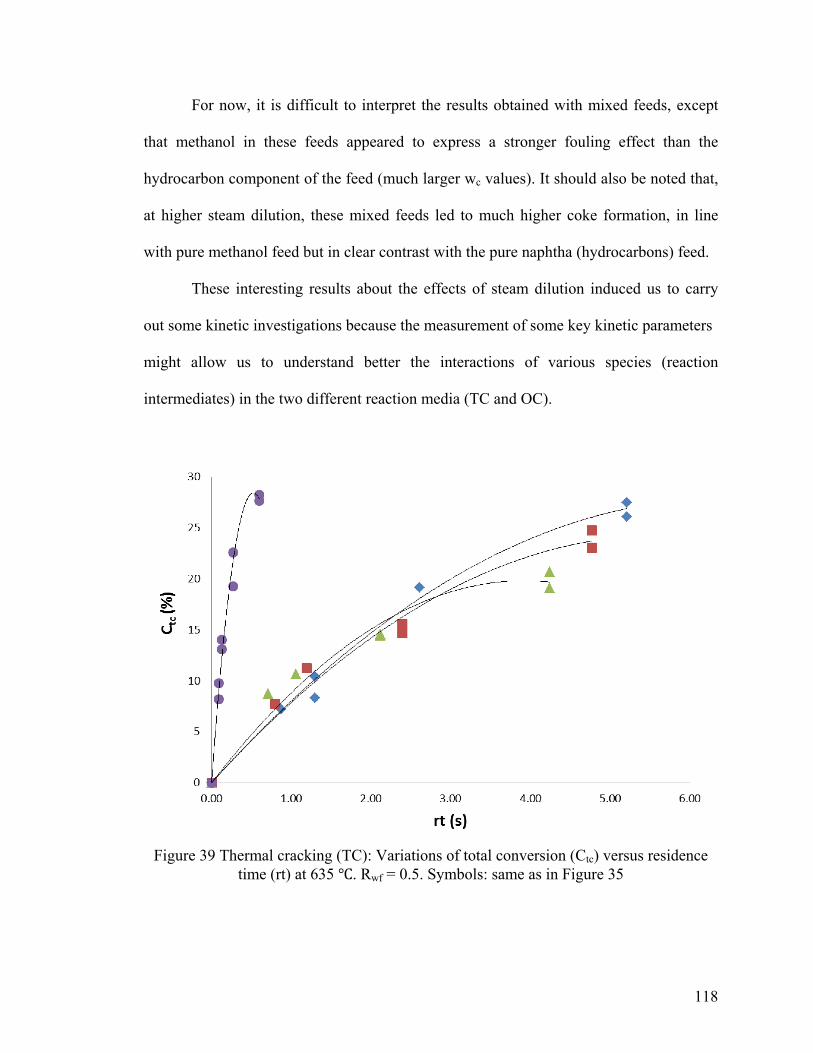
118
For now, it is difficult to interpret the results obtained with mixed feeds, except
that methanol in these feeds appeared to express a stronger fouling effect than the
hydrocarbon component of the feed (much larger wc values). It should also be noted that,
at higher steam dilution, these mixed feeds led to much higher coke formation, in line
with pure methanol feed but in clear contrast with the pure naphtha (hydrocarbons) feed.
These interesting results about the effects of steam dilution induced us to carry
out some kinetic investigations because the measurement of some key kinetic parameters
might allow us to understand better the interactions of various species (reaction
intermediates) in the two different reaction media (TC and OC).
Figure 39 Thermal cracking (TC): Variations of total conversion (Ctc) versus residence time (rt) at 635 ℃. Rwf = 0.5. Symbols: same as in Figure 35
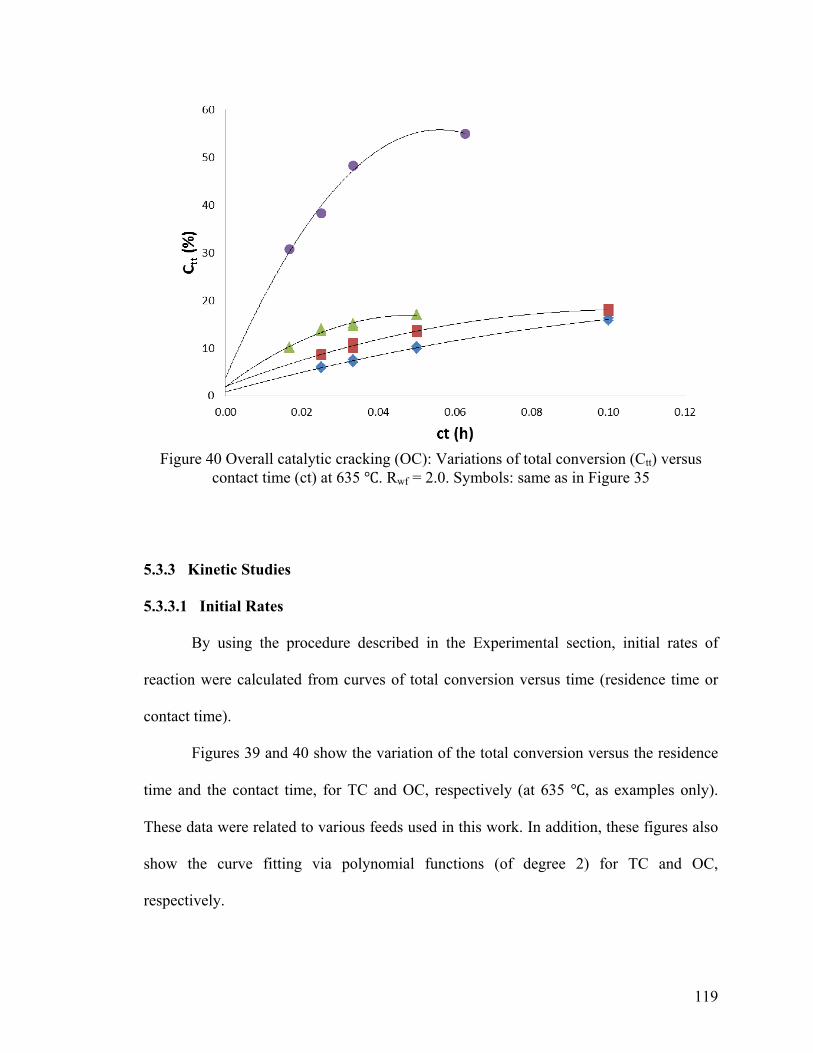
119
Figure 40 Overall catalytic cracking (OC): Variations of total conversion (Ctt) versus
contact time (ct) at 635 ℃. Rwf = 2.0. Symbols: same as in Figure 35
5.3.3 Kinetic Studies
5.3.3.1 Initial Rates
By using the procedure described in the Experimental section, initial rates of
reaction were calculated from curves of total conversion versus time (residence time or
contact time).
Figures 39 and 40 show the variation of the total conversion versus the residence
time and the contact time, for TC and OC, respectively (at 635 ℃, as examples only).
These data were related to various feeds used in this work. In addition, these figures also
show the curve fitting via polynomial functions (of degree 2) for TC and OC,
respectively.
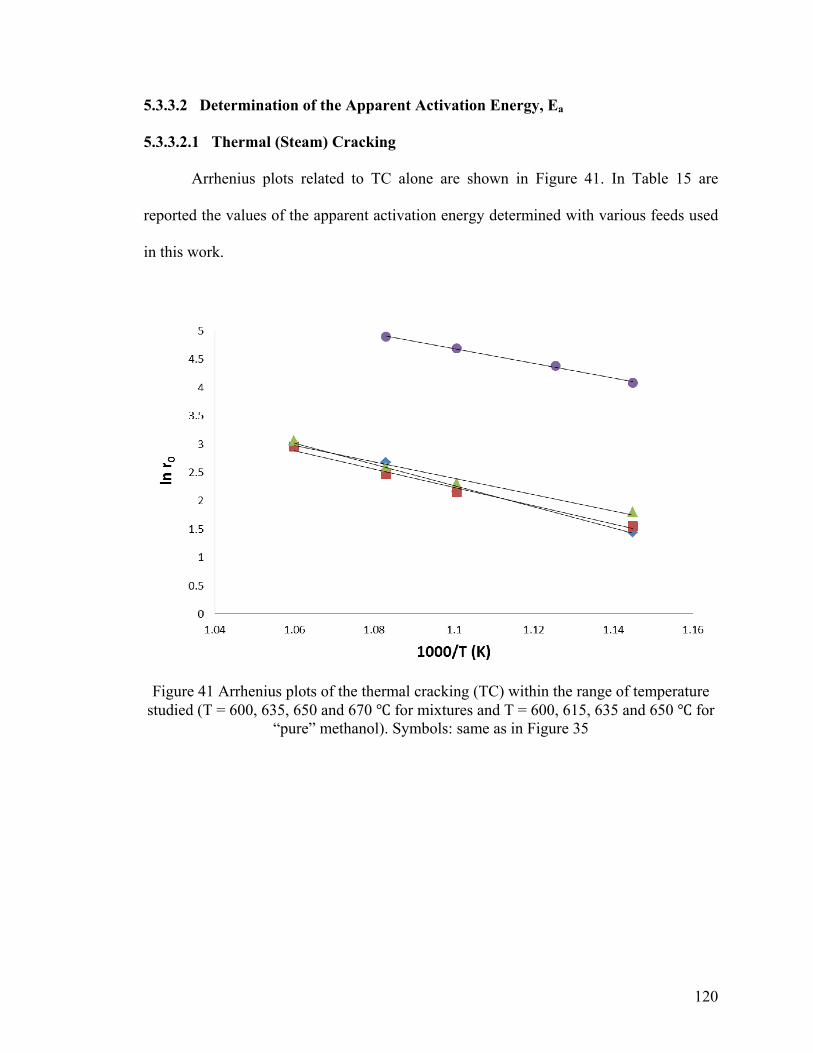
120
5.3.3.2 Determination of the Apparent Activation Energy, Ea
5.3.3.2.1 Thermal (Steam) Cracking
Arrhenius plots related to TC alone are shown in Figure 41. In Table 15 are
reported the values of the apparent activation energy determined with various feeds used
in this work.
Figure 41 Arrhenius plots of the thermal cracking (TC) within the range of temperature studied (T = 600, 635, 650 and 670 ℃ for mixtures and T = 600, 615, 635 and 650 ℃ for
“pure” methanol). Symbols: same as in Figure 35
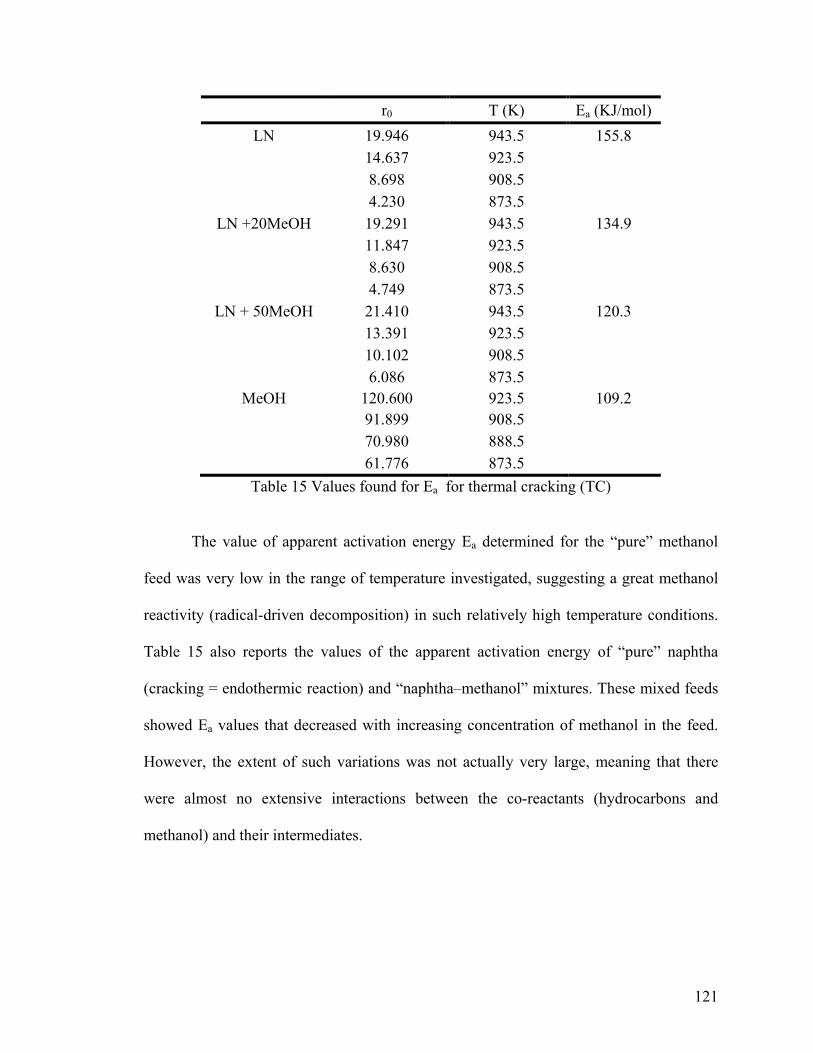
121
r0 T (K) Ea (KJ/mol) LN 19.946 943.5 155.8
14.637 923.5 8.698 908.5 4.230 873.5
LN +20MeOH 19.291 943.5 134.9 11.847 923.5 8.630 908.5 4.749 873.5
LN + 50MeOH 21.410 943.5 120.3 13.391 923.5 10.102 908.5 6.086 873.5
MeOH 120.600 923.5 109.2 91.899 908.5 70.980 888.5 61.776 873.5
Table 15 Values found for Ea for thermal cracking (TC)
The value of apparent activation energy Ea determined for the “pure” methanol
feed was very low in the range of temperature investigated, suggesting a great methanol
reactivity (radical-driven decomposition) in such relatively high temperature conditions.
Table 15 also reports the values of the apparent activation energy of “pure” naphtha
(cracking = endothermic reaction) and “naphtha–methanol” mixtures. These mixed feeds
showed Ea values that decreased with increasing concentration of methanol in the feed.
However, the extent of such variations was not actually very large, meaning that there
were almost no extensive interactions between the co-reactants (hydrocarbons and
methanol) and their intermediates.
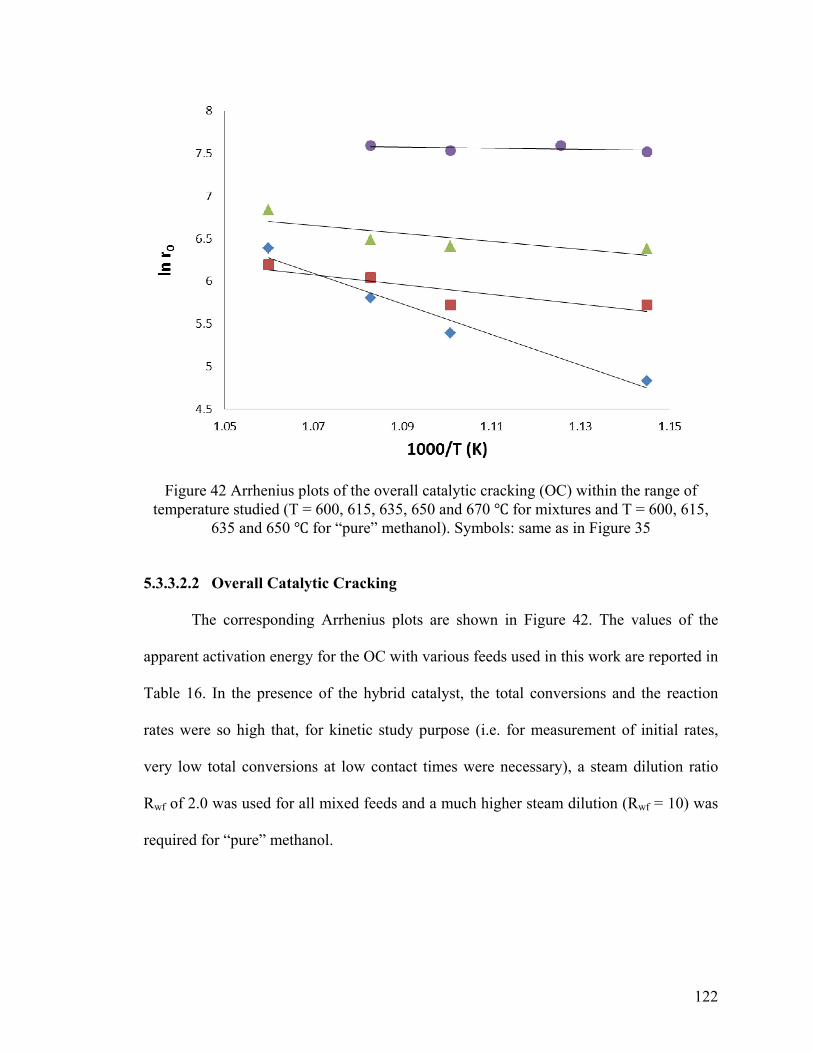
122
Figure 42 Arrhenius plots of the overall catalytic cracking (OC) within the range of temperature studied (T = 600, 615, 635, 650 and 670 ℃ for mixtures and T = 600, 615,
635 and 650 ℃ for “pure” methanol). Symbols: same as in Figure 35 5.3.3.2.2 Overall Catalytic Cracking
The corresponding Arrhenius plots are shown in Figure 42. The values of the
apparent activation energy for the OC with various feeds used in this work are reported in
Table 16. In the presence of the hybrid catalyst, the total conversions and the reaction
rates were so high that, for kinetic study purpose (i.e. for measurement of initial rates,
very low total conversions at low contact times were necessary), a steam dilution ratio
Rwf of 2.0 was used for all mixed feeds and a much higher steam dilution (Rwf = 10) was
required for “pure” methanol.
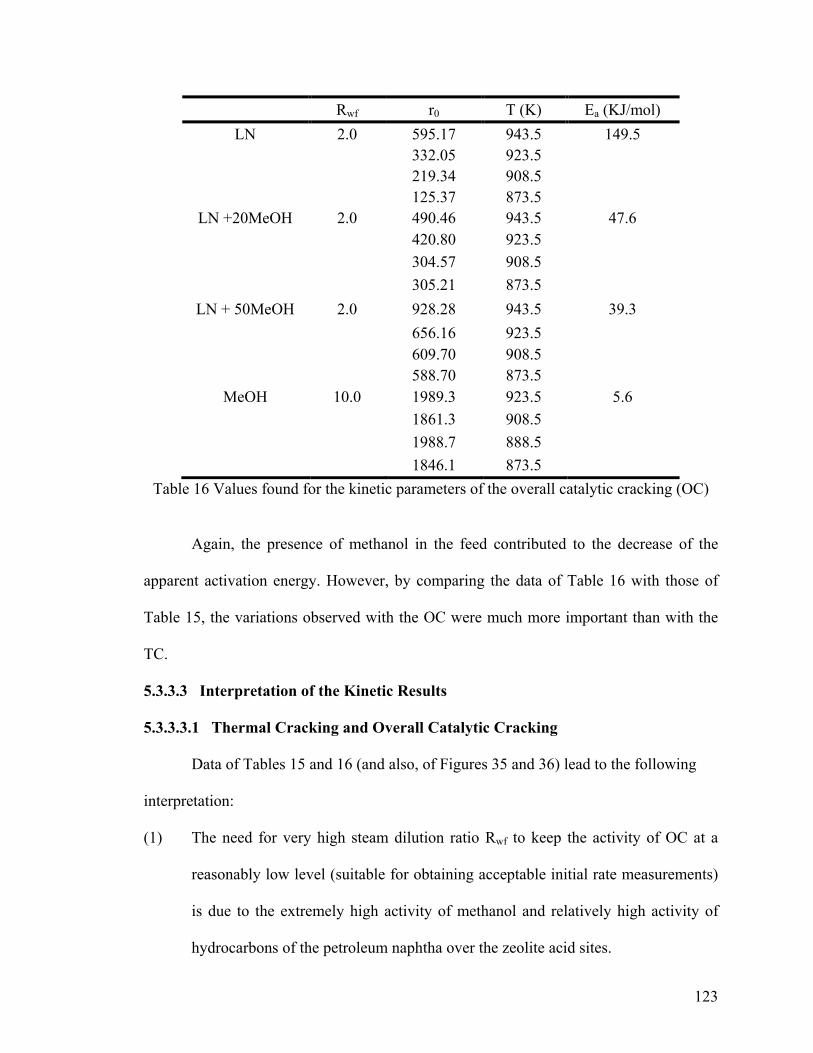
123
Rwf r0 T (K) Ea (KJ/mol) LN 2.0 595.17 943.5 149.5
332.05 923.5
219.34 908.5
125.37 873.5 LN +20MeOH 2.0 490.46 943.5 47.6
420.80 923.5
304.57 908.5
305.21 873.5 LN + 50MeOH 2.0 928.28 943.5 39.3
656.16 923.5
609.70 908.5
588.70 873.5 MeOH 10.0 1989.3 923.5 5.6
1861.3 908.5
1988.7 888.5
1846.1 873.5 Table 16 Values found for the kinetic parameters of the overall catalytic cracking (OC)
Again, the presence of methanol in the feed contributed to the decrease of the
apparent activation energy. However, by comparing the data of Table 16 with those of
Table 15, the variations observed with the OC were much more important than with the
TC.
5.3.3.3 Interpretation of the Kinetic Results
5.3.3.3.1 Thermal Cracking and Overall Catalytic Cracking
Data of Tables 15 and 16 (and also, of Figures 35 and 36) lead to the following
interpretation:
(1) The need for very high steam dilution ratio Rwf to keep the activity of OC at a
reasonably low level (suitable for obtaining acceptable initial rate measurements)
is due to the extremely high activity of methanol and relatively high activity of
hydrocarbons of the petroleum naphtha over the zeolite acid sites.
124
(2) When the concentration of methanol increased, there was a decrease of the
activation energy for both the TC and the OC.
(a) The value of apparent activation energy in the case of TC moderately
decreased with increasing methanol presence in the feed (Table 15): this
was indicative of a simple averaging of apparent activation energies
between the two components of the feed (i.e. hydrocarbons and methanol).
Without using sophisticated kinetic modeling methods for this reaction
with free-radical chain mechanism as in Reference [105], we can simply
state that there were practically no extensive interactions between these
two components (and their intermediates) during their passage through the
reaction zone.
(b) In the case of the OC (Table 16), the much more important decrease of the
value of the apparent activation energy suggested an actually fierce
competition for adsorption on the acid sites (located on the zeolite surface)
between the methanol molecules on one hand, and the hydrocarbon ones
on the other hand. Regarding the change in the apparent activation energy
of paraffins (main components of the light naphtha) upon addition of
methanol, we can recall the work of Kung and co-workers,[106] showing
that the differences in apparent activation energies could be entirely
attributed to differences in heats of (n-hexane) adsorption, such that the
intrinsic activation energies were identical. On the other hand, if the feed
is light naphtha, the catalytic cracking of these hydrocarbons over ZSM-5
zeolite follows a monomolecular mechanism because all our tests were
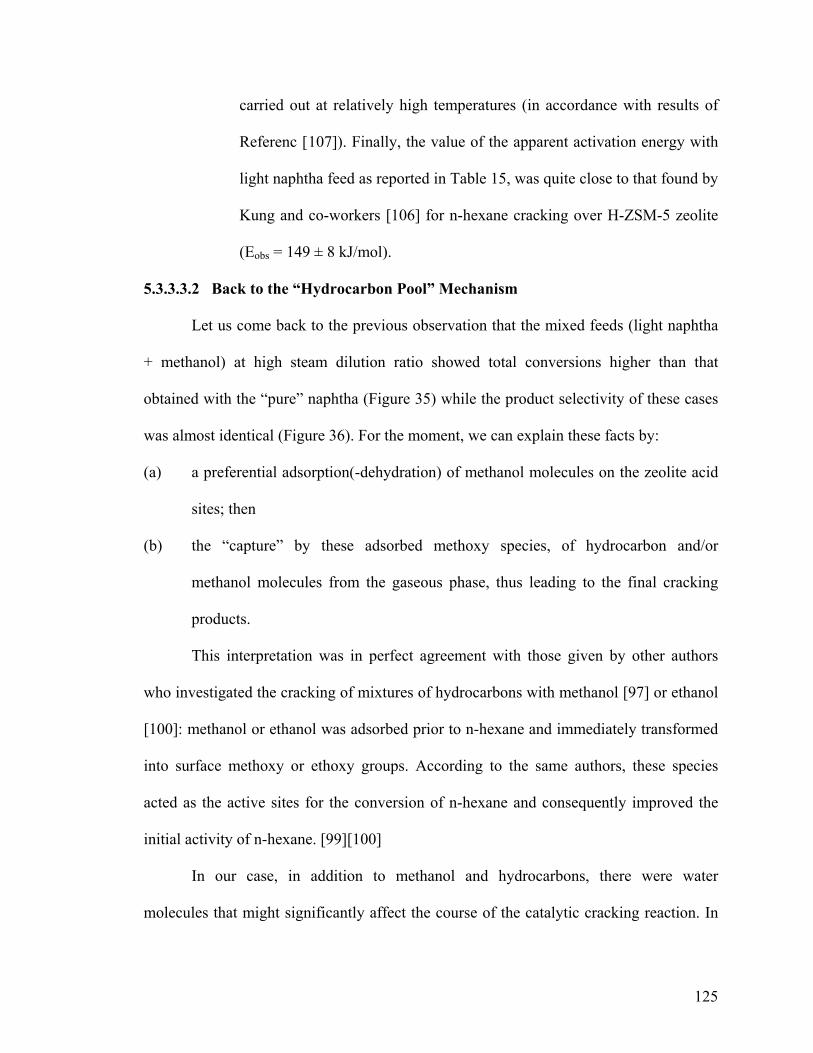
125
carried out at relatively high temperatures (in accordance with results of
Referenc [107]). Finally, the value of the apparent activation energy with
light naphtha feed as reported in Table 15, was quite close to that found by
Kung and co-workers [106] for n-hexane cracking over H-ZSM-5 zeolite
(Eobs = 149 ± 8 kJ/mol).
5.3.3.3.2 Back to the “Hydrocarbon Pool” Mechanism
Let us come back to the previous observation that the mixed feeds (light naphtha
+ methanol) at high steam dilution ratio showed total conversions higher than that
obtained with the “pure” naphtha (Figure 35) while the product selectivity of these cases
was almost identical (Figure 36). For the moment, we can explain these facts by:
(a) a preferential adsorption(-dehydration) of methanol molecules on the zeolite acid
sites; then
(b) the “capture” by these adsorbed methoxy species, of hydrocarbon and/or
methanol molecules from the gaseous phase, thus leading to the final cracking
products.
This interpretation was in perfect agreement with those given by other authors
who investigated the cracking of mixtures of hydrocarbons with methanol [97] or ethanol
[100]: methanol or ethanol was adsorbed prior to n-hexane and immediately transformed
into surface methoxy or ethoxy groups. According to the same authors, these species
acted as the active sites for the conversion of n-hexane and consequently improved the
initial activity of n-hexane. [99][100]
In our case, in addition to methanol and hydrocarbons, there were water
molecules that might significantly affect the course of the catalytic cracking reaction. In
126
order to facilitate the determination of the apparent activation energy of the OC (low total
conversion), we had to use a steam dilution of 2.0. Referring to Figure 35, at that value of
Rwf, steam decreased the total conversion of naphtha by half whereas that of the “pure”
methanol was not significantly affected. In an adsorption study by Baron and co-
workers[ 108] using chromatographic methods, it was shown that as polarity of the
adsorbent (ZSM-5 zeolite) decreased (increasing Si/Al ratio, i.e. increasing zeolite
hydrophobicity), the affinity for a polar molecules increased. Thus, the value of the
partition coefficient of n-hexane (measured at room temperature) moved from 2.20 to
13.8 whereas that of methanol went from 3.35 to 2.69 for two ZSM-5 zeolites having a
Si/Al ratio of 13 and 137, respectively. This means that water did not directly affect the
adsorption of n-hexane or methanol: however, it could affect significantly the zeolite sites
that were strongly hydrophilic by formation of water clusters [104], as in the case of the
ZSM-5 used in this work (Si/Al ratio = 50).
Regarding the meaning of the apparent activation energy Ea, Rozanska and Van
Santen [109] reported that in a monomolecular reaction, the apparent activation energy
could be simply expressed as:
Ea = Eact + (1 - Ɵ)Eads (equation 3)
where Eact is the intrinsic activation energy of the elementary reaction step, Ɵ the
coverage of the molecule on the catalytic site, and Eads the adsorption energy of the
molecule adsorbed to the active site. So, it would be possible to have the value of Eact
knowing those of h Ɵ and Eads. Several methods including the chromatographic ones [108]
and adsorption/temperature programmed surface reaction could be used.[110] However,
in practice, it is nearly impossible to do so because:
127
(a) It is very risky to extrapolate adsorption data from room temperature (or quite low
temperatures) used for the adsorption study to a temperature of 635–650 ℃
(normal operating temperature for the TCSC process). Moreover, zeolite particles
used in the industry are imperfect sub-micron sized crystallites, presenting large
pore mouths, having particle size smaller than that of the crystals currently
utilized in fundamental studies, and showing quite random distribution of the acid
sites (zoning effect in ZSM-5 zeolites = higher acid sites density in particle zones
close to the pore mouths and to the external surface), etc.
(b) Although in Eq. 3 the entropy aspect could be taken into consideration, at high
temperatures, the molecular diffusion regime through the zeolite micropores could
change because of important variation of the kinetic diameters. In addition, during
the long outward trip of the products, the latter could undergo further re-
adsorption and subsequent reaction. Another point is that light naphtha was
actually a mixture of several hydrocarbons with various molecular configurations.
Theoretical studies such as mentioned in Reference [111], would actually be very
difficult tasks in real conditions of industrial use.
(c) It should be noted that the zeolite component is only a part of the hybrid nano-
catalysts in which we have also the co-catalyst and some special binder. Thus, we
must do a real effort to think about all the phenomena that could occur within the
hybrid nano-catalyst: reactions occurring in the zeolite particles, those in the co-
catalyst particles, interactions between the catalyst surfaces, pore continuum
effect, etc. Researchers using in situ methods[112] would have quite hard time to
elucidate the mechanism of each reaction step in such complex reaction medium.
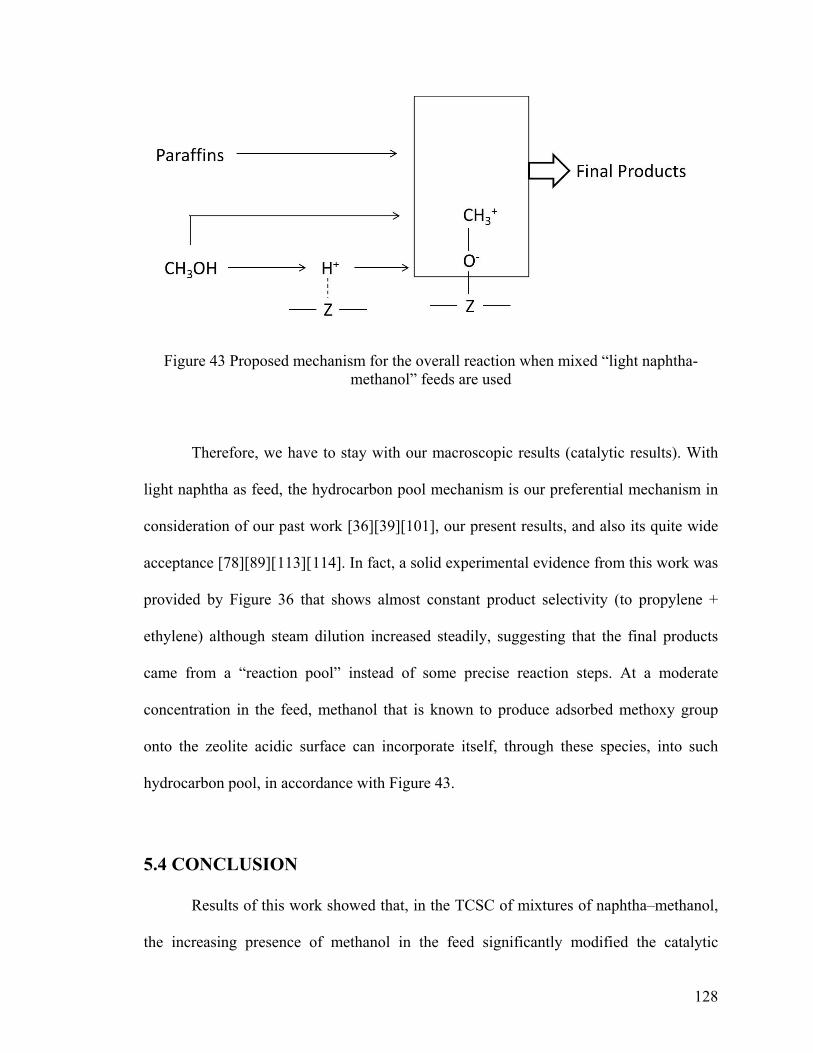
128
Figure 43 Proposed mechanism for the overall reaction when mixed “light naphtha-methanol” feeds are used
Therefore, we have to stay with our macroscopic results (catalytic results). With
light naphtha as feed, the hydrocarbon pool mechanism is our preferential mechanism in
consideration of our past work [36][39][101], our present results, and also its quite wide
acceptance [78][89][113][114]. In fact, a solid experimental evidence from this work was
provided by Figure 36 that shows almost constant product selectivity (to propylene +
ethylene) although steam dilution increased steadily, suggesting that the final products
came from a “reaction pool” instead of some precise reaction steps. At a moderate
concentration in the feed, methanol that is known to produce adsorbed methoxy group
onto the zeolite acidic surface can incorporate itself, through these species, into such
hydrocarbon pool, in accordance with Figure 43.
5.4 CONCLUSION
Results of this work showed that, in the TCSC of mixtures of naphtha–methanol,
the increasing presence of methanol in the feed significantly modified the catalytic
129
cracking kinetics. The gradual but significant decrease of the apparent activation energy
with increasing methanol concentration in the mixed feed was attributed to the effect of
intensive interactions between the two types of molecules: hydrocarbons and methanol.
The addition of methanol into petroleum naphtha feed, up to 25 wt%, did not
significantly change the catalytic performance of the TCSC hybrid nano-catalyst,
suggesting that this catalyst could create, at such relatively low methanol concentrations,
a certain compatibility between the feed components.
5.5 Ongoing and Future Research Work
Our future work will be focused on strengthening the in situ production of
hydrogen species by the co-catalyst component. These hydrogen species being extremely
active might contribute to decrease the consumption of (co-fed) molecular hydrogen in
reactions that require dual functions “hydrogenation-acid cracking”. Thus, hybrid
catalysts with their unique configuration might be useful in hydrocracking, catalytic
cracking or other similar reactions.
The concept of “pore continuum”, discovered more than a decade ago [40] and
that allows species produced on one catalytically active surface to migrate to another
catalytically active surface and subsequently react with other species being adsorbed
there, has recently found some similarity with that is called “tandem catalysis”.[115]
This apparently simplified kinetic study is however useful because it helps
industrial catalysis researchers understand the phenomena of feed compatibility and thus
achieve further an important goal: to partially replace petroleum feedstocks currently
used in the petrochemical industry, with long-lasting or renewable sources. The long-
130
lasting sources include methanol that can be derived from natural gas or coal. The
renewable sources include methanol, ethanol, butanol, furfural, levulinic acid, glycerol,
etc. These sources will be produced in large volumes owing to the booming bio-refining
industry. Our recent work [39][101] has shown that methanol can be advantageously
mixed with naphtha or gas oils up to 25 wt% in the TCSC process: in fact, with such
methanol concentration in the feed, the operating conditions are not significantly
modified while the catalyst performance remains, at least, the same. This feed
compatibility although resulting in limited percentage of non-petroleum compounds that
can be added, will have a considerable impact for all the industrial sector of fuels and
chemicals. We are confident that in the near future, one will succeed to develop hybrid
nano-catalysts that advantageously enable the (partial but significant) replacement of gas
oils used as feeds in the gasoline producing technology (fluid catalytic cracking or FCC).
Gas oil substitutes may be biomass-derived glycerol, furfural, or ultimately bio-oil that
can be derived (by pyrolysis) from biomass or C-containing organic wastes (general
formula: CHxOz, instead of CHy for hydrocarbons). Such catalysts are capable of carrying
out an “in situ” hydro-deoxygenation of the oxygenate component of the feed and
immediately insert the resulting intermediates into the main hydrocarbon conversion
stream.
5.6 AUTHOR’S NOTES AND SIGNIFICANCE OF PAPER TO THESIS
This work on the cracking behavior of the mixed “light naphtha-methanol” feed in
various operating conditions was the first article published in the literature on processing
mixed feedstock containing traditional petroleum based component (light naphtha) and
131
renewable biomass derived compound (methanol) for the production of light olefins. Our
results show the increasing presence of methanol in the blending feed significantly
modified the kinetics of the catalytic cracking. The gradual and significant decrease of
the apparent activation energy with increasing methanol concentration suggests intensive
interactions between hydrocarbon compounds and methanol molecules. This simplified
kinetic study is useful for industrial catalysis researchers. It can help to understand the
phenomena of feed compatibility and achieve a further goal: to partially replace
petroleum feedstocks with renewable biomass sources and/or long-lasting fossil fuels.
In the following chapter, we will extend our studies to other potential
replacements of petroleum based feedstocks. These promising replacements include
biomass-derived glycerol, furfural, or bio-oil derived from pyrolysis of cellulosic
biomass. As a start point, we will start our study with biomass-derived glycerol, which is
a low cost and quite abundant feedstock having very limited applications (side product of
bio-diesel production). Glycerol has three OH groups which may have different
reactivity. Therefore, the catalytic activity of our hybrid catalysts will be recorded for
various mixtures of n-hexane with oxygenate additives such as glycerol and other mono-
ols/dio-ols having the same carbon skeleton as glycerol.
132
Chapter VI
Blending of Non-petroleum Compounds into the Hydrocarbon Feeds Used in the Thermal Catalytic/Steam Cracking (TCSC) Process for the Selective Production of Light Olefins: Is Glycerol a Good Candidate for Blending with Petroleum Hydrocarbon Feeds?
This chapter has been reproduced from: “Blending of Non-petroleum Compounds with Current Hydrocarbon Feeds to Use in the Thermo-Catalytic Steam-Cracking Process for the Selective Production of Light Olefins” in “New and Future Development in Catalysis, Hybrid Materials, Composites, and Organocatalysts” 1st Edition, S.L. Suib (Ed.), Elsevier, Amsterdam (2012) R. Le Van Mao, H.T. Yan, A. Muntasar and N.Al-Yassir
133
6.1 INTRODUCTION
More than 1500 direct applications of glycerol are already known, especially in
cosmetics, pharmaceuticals and food industries.[ 116] Glycerol, one of the biomass-
derived oxygenated hydrocarbons, is currently formed as a by-product of the biodiesel
synthesis, by trans-esterification of vegetable oils (triglycerides) with methanol or
ethanol.[59] As pointed out in reference,[117] the size of the existing market of glycerol
is not sufficient to absorb the huge amount of this chemical currently produced, and the
gap between the absorption capacity of the market and the amount of glycerol produced
will increase in the near future if no new applications are found.
Crude glycerol, a low-cost and quite abundant feedstock containing ca. 80 wt %
of glycerol, can be converted into value-added products by various catalytic processes.
One of the most promising routes to glycerol valorisation lies in its catalytic dehydration
to acrolein, which is an important industrial intermediate for the chemical and the agro-
industries.[117][118] At smaller scales, there are selective reduction to yield propylene
glycol[119] and 1,3-propanediol,[59][120][121] which are valuable intermediates in the
polymer industry. Other applications of glycerol derive from its esterification and partial
oxidation to carboxylic acids, aldehydes or ketones,[122] and also its acid-catalyzed
conversion into value-added liquid chemicals.[123]
Glycerol possesses three OH groups whose reactivity is quite different from each
other. For our study, the catalytic activity of our hybrid catalysts was recorded for various
mixtures of n-hexane with oxygenate additives such as glycerol and other mono-ols/di-
ols having the same carbon skeleton as glycerol. The performance indicators for
identifying the effect of the feed composition/nature were as follows: total product yield,
134
yield in C2-C4 olefins (main objectives of the TCST process), yield in BTX aromatics and
eventually coke deposition during the 4-hour run. Therefore, the three hybrid catalysts
chosen had as cracking (acid) component the HZSM-5 zeolite (Si/Al atom ratio of ca. 50)
and as co-catalyst: Pd-Zn/Y-AA (CAT 1), Ru 0.5//Y-AA (CAT 2) or Ru0.5/Pd-Zn//Y-
AA (CAT 3). Ru was chosen because it has interesting hydrogenation/dehydrogenation
properties and, also, some interesting steam-reforming activity with respect to
glycerol.[124]
6.2 EXPERIMENTAL
6.2.1 Preparation of the Hybrid Catalysts
6.2.1.1 Main catalyst component (MCC)
H-ZSM5 zeolite (powder, Zeochem, Switzerland; Si/Al = 50; total BET surface
area = 403 m2/g) was dried at 120 ℃ overnight and then activated in air at 500 ℃ for 5h.
6.2.1.2 Co-catalyst (Co-Cat)
The yttria-stabilized alumina aerogel used as support for the co-catalyst was
prepared using a sol-gel procedure that was similar to those reported elsewhere.[35] After
activation at 750 ℃ for 3h, the solid material (called herein Y-AA) showed the following
(approximate) chemical composition: 10 wt% Y2O3, with the balance being Al2O3.
• Pd-Zn//Y-AA: a 4.00 g amount of zinc chloride (Aldrich) and 0.40 g of Pd (II)
chloride were dissolved in 30 mL of (warm) deionized water. This solution was
rapidly impregnated onto 18.2 g of Y-AA. After drying at 120 ℃ overnight, the
solid was activated in air at 500 ℃ for 3h. Its chemical composition was as
follows: Zn, 9.2 wt %; Pd, 1.1 wt %; Y-AA, balance.
135
• Ru 0.5//Y-AA: a solution of 0.2 g of Ru (III) acetylacetonate (Aldrich) in 15g of
2-propanol was dry-impregnated onto 10 g of Y-AA. After drying at 120 ℃
overnight, the solid was activated in air at 680 ℃ for 3 h.
• Ru 0.5/Pd-Zn//Y-AA: a solution of 0.2 g of Ru (III) acetylacetonate (Aldrich) in
15 g of 2-propanol was dry-impregnated onto 10 g of Pd-Zn/Y-AA. After drying
at 120 ℃ overnight, the solid was activated in air at 680 ℃ for 3 h.
6.2.1.3 Final Hybrid Catalyst
The hybrid catalyst was obtained by extruding the zeolite component (MCC) with
the co-catalyst (Cocat) in the following proportions: MCC= 65.6 wt %, Co-cat = 16.4
wt%, bentonite clay (Aldrich) = 18 wt%. Bentonite clay was used as the extruding and
solid binding agent. The resulting extrudates were dried at 120 ℃ overnight and finally
activated in air at 700 ℃ for 3 h.
6.2.2 Experimental Set-up and Testing Procedure
n-hexane in one infusion pump and glycerol, 1-propanol or other diol additive
dissolved in water, in the other one, were injected into two vaporizers, respectively. The
resulting vapors were then thoroughly mixed in a homemade (heated) gas mixer. The
resulting gaseous stream was finally sent into a tubular reactor (quartz tube, 50 cm long,
1.5 cm in outer diameter and 1.2 cm in inner diameter, length of the catalyst bed = 3 cm).
The temperatures were controlled and regulated by automatic devices that were
connected to chromel-alumel thermocouples (set in the catalytic bed and in the pre-
heating zone) and the heating furnace.
136
The testing conditions were as follows: temperature (of the catalyst bed) = 635
℃; weight hourly space velocity (WHSV= n-hexane and additive) = 1.5 h-1; steam/feed
weight ratio = 0.5, catalyst weight = 2 g; duration of a run = 4h.
Liquid and gaseous products were collected separately, using a system of
condensers. The gas-phase components were analyzed using a Hewlett-Packard FID gas
chromatograph that was equipped with a 30 m GS-capillary column (Agilent J&W
Scientific), while the analysis of the liquid phase was performed using another Hewlett-
Packard gas chromatograph equipped with a 30 m HP-5 capillary column.
The total product yield was the sum of all the yields of individual products i. The
yield of product i was expressed as the weight (in grams) of product i recovered (minus
the weight of such product already present in the feed) by 100 g of feed.
6.3 RESULTS AND DISCUSSION
6.3.1 Effect of Glycerol Content in the Feed
Hybrid catalyst CAT 1 was tested with three feeds: pure n-hexane, mixture [GLY
(30) = glycerol (30 wt%) + n-hexane(70 wt%)] and mixture [GLY (50) = glycerol (50
wt%) + n-hexane (50 wt%)], and the results are reported in Table 17.
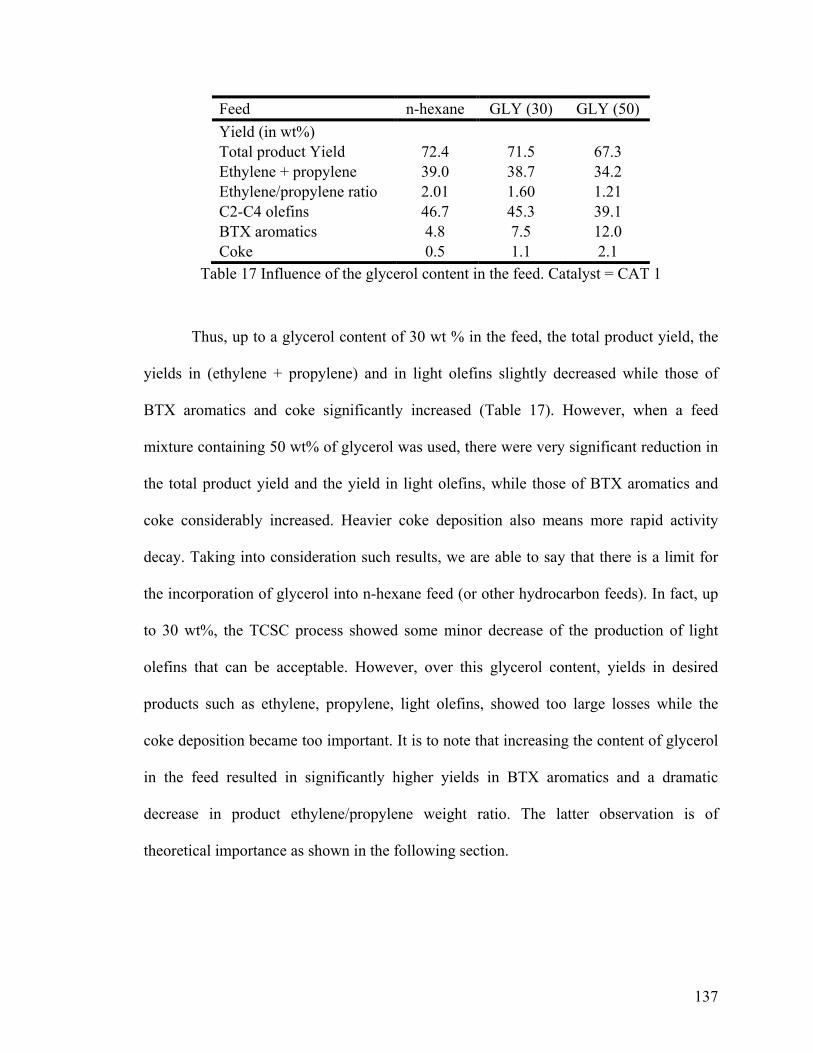
137
Feed n-hexane GLY (30) GLY (50) Yield (in wt%)
Total product Yield 72.4 71.5 67.3 Ethylene + propylene 39.0 38.7 34.2 Ethylene/propylene ratio 2.01 1.60 1.21 C2-C4 olefins 46.7 45.3 39.1 BTX aromatics 4.8 7.5 12.0 Coke 0.5 1.1 2.1
Table 17 Influence of the glycerol content in the feed. Catalyst = CAT 1
Thus, up to a glycerol content of 30 wt % in the feed, the total product yield, the
yields in (ethylene + propylene) and in light olefins slightly decreased while those of
BTX aromatics and coke significantly increased (Table 17). However, when a feed
mixture containing 50 wt% of glycerol was used, there were very significant reduction in
the total product yield and the yield in light olefins, while those of BTX aromatics and
coke considerably increased. Heavier coke deposition also means more rapid activity
decay. Taking into consideration such results, we are able to say that there is a limit for
the incorporation of glycerol into n-hexane feed (or other hydrocarbon feeds). In fact, up
to 30 wt%, the TCSC process showed some minor decrease of the production of light
olefins that can be acceptable. However, over this glycerol content, yields in desired
products such as ethylene, propylene, light olefins, showed too large losses while the
coke deposition became too important. It is to note that increasing the content of glycerol
in the feed resulted in significantly higher yields in BTX aromatics and a dramatic
decrease in product ethylene/propylene weight ratio. The latter observation is of
theoretical importance as shown in the following section.
138
6.3.2 Understanding the Influence of the OH Groups of Glycerol
To try to understand why glycerol once incorporated into the hydrocarbon feed
induced quite negative variations of the activity of the hybrid catalysts, i.e. higher yield in
BTX aromatics, lower yield in light olefins and higher coke formation (Table 18), four
series of runs were performed over the reference catalyst REF and the three hybrid
catalysts above-mentioned, i.e. CAT 1, CAT 2 and CAT 3. Let us consider the glycerol
molecule that contains – as mentioned earlier - three hydroxyl functions, two being
categorized as primary OH groups and one as a secondary OH group. The following
additives were added to n-hexane: 1-propanol, 1,2-propanediol, 1,3-propanediol. These
molecules have the same C-chain (propane) as glycerol, but different numbers of OH
groups, one primary OH, one primary and one secondary OH, and two primary OH
groups, respectively. Besides the “pure” n-hexane used as reference feed (feed # 1, Table
18), the other feeds were obtained by incorporating each of the four molecules into n-
hexane with the same 30 wt% content of oxygenate.
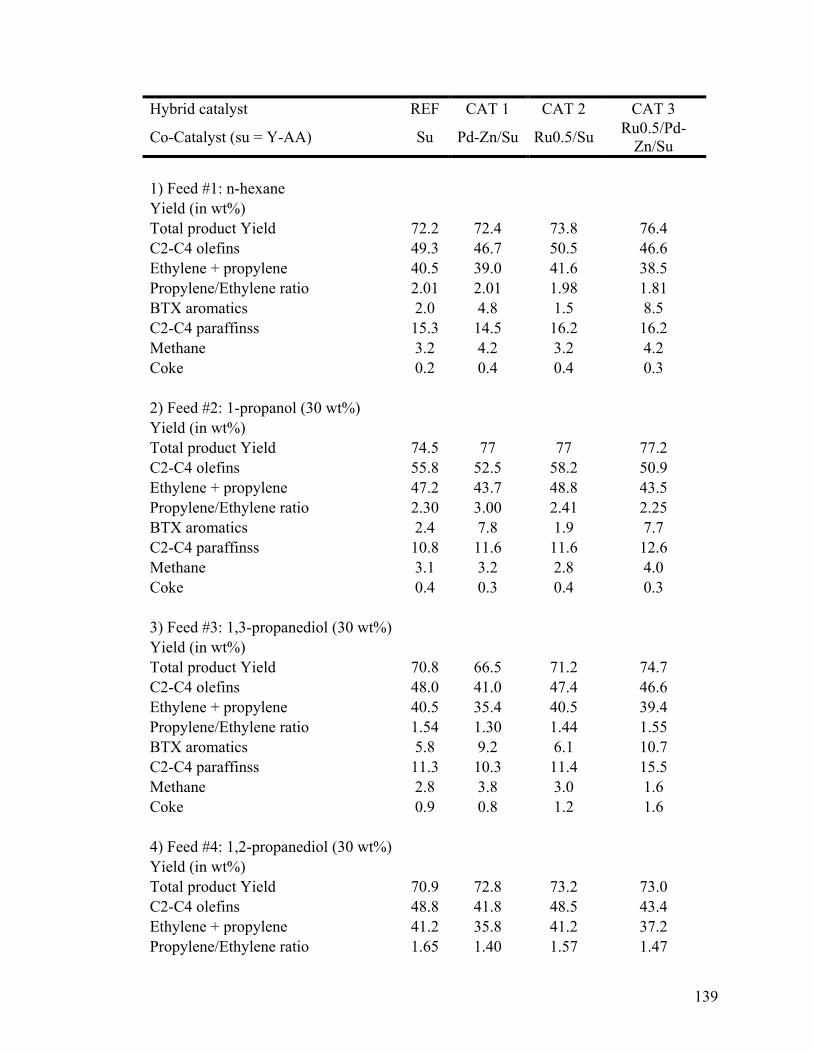
139
Hybrid catalyst REF CAT 1 CAT 2 CAT 3
Co-Catalyst (su = Y-AA) Su Pd-Zn/Su Ru0.5/Su Ru0.5/Pd-Zn/Su
1) Feed #1: n-hexane Yield (in wt%) Total product Yield 72.2 72.4 73.8 76.4 C2-C4 olefins 49.3 46.7 50.5 46.6 Ethylene + propylene 40.5 39.0 41.6 38.5 Propylene/Ethylene ratio 2.01 2.01 1.98 1.81 BTX aromatics 2.0 4.8 1.5 8.5 C2-C4 paraffinss 15.3 14.5 16.2 16.2 Methane 3.2 4.2 3.2 4.2 Coke 0.2 0.4 0.4 0.3
2) Feed #2: 1-propanol (30 wt%) Yield (in wt%) Total product Yield 74.5 77 77 77.2 C2-C4 olefins 55.8 52.5 58.2 50.9 Ethylene + propylene 47.2 43.7 48.8 43.5 Propylene/Ethylene ratio 2.30 3.00 2.41 2.25 BTX aromatics 2.4 7.8 1.9 7.7 C2-C4 paraffinss 10.8 11.6 11.6 12.6 Methane 3.1 3.2 2.8 4.0 Coke 0.4 0.3 0.4 0.3
3) Feed #3: 1,3-propanediol (30 wt%)
Yield (in wt%)
Total product Yield 70.8 66.5 71.2 74.7 C2-C4 olefins 48.0 41.0 47.4 46.6 Ethylene + propylene 40.5 35.4 40.5 39.4 Propylene/Ethylene ratio 1.54 1.30 1.44 1.55 BTX aromatics 5.8 9.2 6.1 10.7 C2-C4 paraffinss 11.3 10.3 11.4 15.5 Methane 2.8 3.8 3.0 1.6 Coke 0.9 0.8 1.2 1.6 4) Feed #4: 1,2-propanediol (30 wt%) Yield (in wt%) Total product Yield 70.9 72.8 73.2 73.0 C2-C4 olefins 48.8 41.8 48.5 43.4 Ethylene + propylene 41.2 35.8 41.2 37.2 Propylene/Ethylene ratio 1.65 1.40 1.57 1.47
140
BTX aromatics 5.1 12.0 6.4 10.9 C2-C4 paraffinss 10.6 10.8 11.4 11.3 Methane 3.6 4.3 3.6 4.5 Coke 0.7 1.3 1.1 1.3
5) Feed #5: glycerol (30 wt%) Yield (in wt%) Total product Yield 69.3 71.5 71.6 70.0 C2-C4 olefins 43.6 45.3 46.8 40.6 Ethylene + propylene 36.8 38.7 39.4 34.8 Propylene/Ethylene ratio 1.74 1.60 1.86 1.67 BTX aromatics 7.9 7.5 5.4 10.9 C2-C4 paraffinss 9.8 10.6 12.7 10.8 Methane 4.7 5.6 3.8 4.6 Coke 1.4 1.1 1.3 1.3
Table 18 Catalytic data obtained with different feed additives containing OH groups versus that of pure n-hexane
Table 18 reports the performances of the four catalysts studied:
a) With “pure” n-hexane feed (feed # 1, Table 18), all the hybrid catalysts gave a
total product yield that was comparable to or higher than that of the reference
catalyst (REF). In particular, CAT 1 that had been previously used in the TCSC
process because of its extraordinary on-stream stability at 635 ℃ or
above,[39][101] showed significantly higher BTX aromatic yield than that of REF.
On the other hand, CAT 3 whose co-catalyst also contained Ru in addition to Pd-
Zn, consequently exhibited higher aromatizing activity (Table 18). Our tentative
explanation of these results is based on the higher efficiency of the Pd-Zn species
in the dehydro-aromatization of cracking intermediates of n-hexane. It is to note
that as a rule, when the yield in product aromatics is higher, the yield in light
olefins is lower due to the H-transfer reaction that occurs during the process of
dehydro-aromatization. Because Pd-Zn species were located onto the co-catalyst
141
surface, such results (more aromatizing activity) evidenced the efficiency of the
concept of pore continuum that could ease the free circulation of species between
the acid sites of the zeolite and the modifying sites located on the co-catalyst
surface.
b) Data obtained with the mixed “n-hexane-glycerol” feed (feed # 5, Table 18)
indicated that the presence of the co-catalyst did not affect the total yield and even
resulted in higher yield of light olefins (CAT 1 and CAT 2). On the other hand, all
the catalysts including the REF gave a much higher yield in BTX aromatics than
that reported for n-hexane feed (feed # 1, Table 18): this was surely due to the
presence of glycerol in the feed. In fact, the glycerol molecules added to the n-
hexane feed, reacted with the protons of the zeolite acid sites following very
different conversion pathways: it is known that, over acid sites, glycerol
undergoes, at first, condensation to form linear or cyclic glycerol dimers or
oligomers, and then dehydration/cracking to form acrolein and other
compounds.[125][126] These reaction intermediates that are quite different from
those of acid-catalyzed cracking of n-hexane (olefinic species), finally produce
hydrocarbons that are predominantly aromatics in the present cases. Thus, the
production of BTX aromatics significantly increased when glycerol was added to
the n-hexane feed.
c) When the additive was 1-propanol (Feed # 2, Table 18), there was a general
increase in the total product yield and the yield in light olefins for all the four
catalysts tested. However, the differences in the catalytic performance between
these catalysts remained almost unchanged.
142
d) When feeds # 3 and 4 were used, the catalytic performances of all four catalysts
tested showed strong similarity with those obtained with feed # 5 (glycerol + n-
hexane), suggesting that the hypothesis of glycerol condensation via primary OH
groups (to form cyclic/dimer-type intermediates) in its first conversion
step,[126][ 127][ 128] regardless to the presence or absence of secondary OH
group in the molecular formula of the additive, was the most plausible.
e) With feeds # 1 (hexane) and # 2 (hexane + 1-propanol), the coke deposition was
quite small. This was not the case for feeds # 3,4,5 because their use resulted in
much heavier coke laydown, suggesting that the more abundant coke deposited
came from the feed additive (diols or glycerol) whose molecule possessed two
OH groups at least.
f) Let us consider the results obtained with the “pure” n-hexane feed (feed # 1,
Table 18) and the mixed “1-propanol + n-hexane” feed (feed # 2, Table 18). The
combined “propylene + ethylene” yield for the all the catalysts was significantly
higher with feed # 2 than with n-hexane feed. In addition, with feed # 2 that
contained 1-propanol, the propylene/ethylene weight ratio significantly increased.
All these facts suggested that over zeolite acidic sites, some propanol molecules
rapidly underwent dehydration (yielding propylene) instead of being incorporated
into the n-hexane conversion mainstream. These results were similar to those that
we have found for ethanol in various blends of “Petroleum Gas Oil - Ethanol”
[39]: in fact, over zeolite acidic sites, ethanol molecules can rapidly dehydrate
into ethylene, increasing thus the combined “propylene + ethylene” yield and at
the same time, significantly decreasing the product propylene/ethylene ratio.
143
However, when the feed additive was a propane-diol (feeds # 3 and 4, Table 18)
or glycerol (feed # 5, Table 18, also results of Table 17), the combined yield and
the propylene/ethylene ratio given by all the four catalysts were lower than those
obtained with n-hexane feed (feed # 1, Table 18) while the yield in BTX
aromatics significantly increased. All this suggested that, over the zeolite acidic
sites, adsorbed glycerol, 1,2-propanediol or 1,3-propanediol molecules underwent
primarily dimerization (then oligomerization)/cyclization reactions as
hypothesized by numerous researchers.[126-128] These reactions finally yielded
more aromatics and, unfortunately, more coke probably by degradation of higher
glycerol oligomers (Tables 17 and 18).
6.4 CONCLUSION
In summary, our study shows that when glycerol is added to n-hexane feed, its
concentration should not exceed 30 wt% in order to keep the total product yield and the
C2-C4 olefin yield at an acceptable level. However, the main concern is the more
abundant deposition of coke that requires a higher water/feed ratio since the hydrogen
spilt-over species are not sufficient to clean it up. On the other hand, with all the mixed
feeds investigated, the clear effect of the co-catalyst surface on the various reactions
catalyzed by the zeolite acidic sites, is the proof that the concept of pore continuum is
working fairly well.
144
6.5 AUTHOR’S NOTES AND SIGNIFICANCE OF PAPER TO
THESIS
In this chapter, we performed a preliminary mechanistic study on the catalystic
cracking of mixed “glycerol/n-hexane” feedstock for the production of light olefins. Our
investigation showed that if glycerol is to be added to n-hexane feed, its concentration
should not exceed 30% in order to keep the production yield of light olefins at an
acceptable level. This is because that glycerol easily undergoes dimerization and
cyclization reactions on the acidic sites over the surface of zeolite. Consequently, these
reactions lead to a formation of more aromatic molecules and coke deposition.
Therefore, a more advanced hybrid nano-catalyst needs to be developed in order to
successfully hydro-deoxygenate those oxygenate components of the feed. This piece of
work paved the road to the future study where other biomass derived oxygenates will be
used to partially replacing conventional petroleum based feedstocks.
145
Chapter VII
GENERAL CONCLUSIONS AND FUTURE WORK
146
7.1 GENERAL CONCLUSIONS
The results obtained in this thesis successfully demonstrated the potential
possibility of co-processing biomass derived compounds (bio-alcohols) with conventional
petroleum derived feedstocks for the production of light olefins. This is the starting point
of the partial replacement of petroleum based feeds by renewable biomass derived feeds
in petrochemical industry.
Nowadays, most of the developed countries are making efforts on being less
dependent on oil imports. Since petrochemical industry consumes up to 15% of
petroleum oil, it is imperative to be able to blend the normally used petroleum feedstocks
with ethanol and methanol that can be produced from renewable materials such as
biomass or other more abundant fossil fuels like natural gas or coal. In this respect, the
TCSC process which uses steam as co-fed diluent is the most adequate approach for
achieving this goal. The results obtained in our study show that ethanol is a good co-
processing feedstock for gas oil. Incorporating 15 wt% of ethanol or more to the gas oil
allowed us to increase the combined yield of ethylene and propylene up to 20 wt%. On
the other hand, methanol can also be co-processed with petroleum gas oil. Our
preliminary tests show that the increase in the product yields of light olefins is in a
slightly small extent than that in the case of ethanol when incorporating methanol to gas
oil. However, the product propylene-to-ethylene ratio is significantly high in the case of
methanol, and this ratio remains almost constant with an increasing content of methanol
in the mixed feedstock. These results suggest that methanol should undergo a different
reaction pathway than that of ethanol. While ethanol undergoes predominantly
dehydration into ethylene, methanol predominantly intervenes directly on reactions
147
occurring in the “hydrocarbon pool”. In addition, our especially designed hybrid catalysts
that contain Zn-Pd based co-catalyst have better performance than the old version
containing Ni-Ru based co-catalyst when “hydrocarbons-alcohols” mixed feedstocks
were used. Overall, the preliminary studies indicate that the partial replacement of
petroleum feedstocks by biomass derived chemicals is a promising approach to solve the
problems facing the petroleum resource such as continuous decline of reserves and
environmental concerns caused by emission.
Tests for mechanistic investigations were carried out by co-processing various
contents of methanol with petroleum light naphtha since the catalytic results obtained
from the later one are much easier to be interpreted than those of the gas oil. The results
show that there is a significant increased product yield of C2-C4 olefins, particularly that
of ethylene and propylene. However, there was also a maximum limit for the methanol
content in the mixed feed. The beneficial effect was not as important as expected when a
mixed feed contains over 20-25 wt% of methanol.
Furthermore, tests were carried out at different operating conditions to investigate
the cracking behavior of mixed “light naphtha-methanol” feed. Our simplified kinetic
study suggests that the increasing presence of methanol in the feed significantly modified
the catalytic cracking kinetics. The gradual and significant decrease of the apparent
activation energy with increasing methanol concentration in the feed was attributed to the
effect of intensive interaction between two molecules: hydrocarbons and methanol. In
addition, the addition of methanol into petroleum naphtha feed, up to 25 wt%, did not
significantly change the catalytic activity of our hybrid catalyst, suggesting that this
148
catalyst could create certain compatibility between hydrocarbons and methanol at relative
low methanol concentration.
In the last part of our work, glycerol, another promising replacement of petroleum
oil for the light olefins production, was co-fed with n-hexane (as a model molecule of
light naphtha) to study the catalytic behavior of mixed “hydrocarbon-glycerol” feed and
the different reactivity of glycerol’s three OH groups. Our study shows that when
glycerol is added to n-hexane feed, its concentration should not exceed 30 wt% in order
to keep the total product yield and the light olefins yield at an acceptable level. However,
an abundant deposition of coke was observed when glycerol was used as co-reactant,
suggesting that a higher water/feed ratio is required and an advanced hybrid catalyst need
to be developed.
7.2 FUTURE WORK
The results obtained in this thesis are very interesting from a fundamental and
applied viewpoint. Our future work will be focused on developing advanced hybrid
catalyst with strong “in-situ” hydrodeoxygenation activity in order to replace petroleum
based feedstocks by biomass derived oxygenates for the production of light olefins. As
stated above, currently, several technologies for the conversion of biomass into bio-
chemicals and bio-fuels have been successfully developed. One of the mature
technologies is the production of bio-oil from lignocelluloses by thermal chemical
processes such as fast pyrolysis. Bio-oil obtained from fast pyrolysis of biomass is
considered as a promising feedstock for the production of light olefins due to its low
149
cost.[129] Therefore, bio-oil can also be incorporated into hydrocarbon feeds in various
cracking processes.
However, using zeolite based catalysts for the conversion of bio-oil tends to form large
amounts of coke, which lowers the carbon efficiency and leads to a severe catalyst
deactivation.[130][131][132] This is because bio-oil is a mixture containing a large
variety of compounds that include acids, alcohols, aldehydes, esters, ketones, and
aromatic compounds.[59] As a result, incorporating bio-oil into a hydrocarbon feed and
integrating them into the “hydrocarbon pool” will be extremely difficult. In order to
achieve the goal, we need to develop high performance hybrid catalysts for the selective
cracking of mixed “hydrocarbons/oxygenate bio-compounds” feeds into ethylene and
propylene. These hybrid catalysts need to have high steam reforming (and water gas
shift) activity and hydrogen spill-over capability. For this purpose, several approaches
will be attemped. First of all, an active main metal species needs to be chosen. In this
study, we will start with Ni and Pd. Both two metals have to be studied extensively in the
previous studies to reduce the catalyst deactivation in catalytic cracking of hydrocarbons
or hydrocarbon/alcohols mixture.[36][39][101] Ni is a widely used metal for its high
reforming activities. It has been used in industry for the production of hydrogen from
steam reforming of hydrocarbons for several decades. It is a favored catalyst also due to
its low price. However, deactivation of Ni based catalyst is usually caused by carbon
deposition. Pd is a noble metal and has high reforming activities and hydrogen spill-over
capability. Although there is no record of its application in the commercial field, it
attracts more and more researchers’ attention in the laboratory level of studies. Also,
comparing to Ni, Pd has much higher activity per unit volume and higher resistance to the
150
deactivation caused by coking. In order to improve the activity and the stability of the
primary metal species, a secondary metal species can be added as dopant. The secondary
metal may increase the strength of the active sites or affect the dispersion of the primary
metal species. For example, Rh or Ru can be used for their high dry reforming
activity.[133][134] K can be used since it may promote steam gasification reaction (C +
H2O → CO + H2) which can remove coke deposits on the surface of the co-catalyst.[135]
Fe can also be used as a secondary dopant for its high water gas shift activity.[136][137]
In addition, Mg or V, which have high steam reforming activity of oxygenates, can be
tried as well.[138] In addition to the different combination of metal species, different
supports also need to be used to study the effect of supports on the activity of metal
dopant.[139] The potential supports include Al2O3 (acidic), SiO2 (neutral), Silica-alumina
(less acidic), and MgO (basic). We do expect that the development of a hybrid catalyst
with high steam reforming (and water gas shift) activity and hydrogen spill-over
capability will result in positive effect on the production of light olefins from
hydrocarbon/bio-oil mixed feedstock. This well designed hybrid catalyst will surely show
a better catalytic performance and increase light olefins yields at the expense of coke.
The amount of bio-oil that can be incorporated into petroleum feed depends on the
activity of the hybrid catalyst, especially its co-catalyst. The expected results obtained
from this work will allow a comprehensive understanding of the hybrid catalyst behavior;
hence, providing the requisite knowledge for processing petroleum feedstocks containing
biomass derived compounds to produce light olefins which are the current platform
chemicals. Also, in the petrochemical industry that consumes up to 15% of petroleum oil,
it is imperative to be able to blend the normally used petroleum feedstock with the one

151
can be derived from renewable sources (biomass). This can help most of the developed
countries become less dependent on oil import.

152
Chapter VIII
REFERENCES
153
[1] L.G. Wade, Organic Chemistry, 6th Edition Person Prentice Hall (2006) 279
[2] G.P. Moss, P.A.S. Smith, Pure and Applied Chemistry 67 (1995) 1307
[ 3 ] S. Matar, L.F. Hatch, Chemistry of Petrochemical Processes, 2nd Edition, Gulf
Professional Publishing (2001) 1
[4] J.H. Lee, S. Kang, Y. Kim, S. Park, Industrial & Engineering Chemistry Research, 50
(8) (2011) 4264
[5] C. Boyadjian, K. Seshan, L.Lefferts, A.G.J. van der Ham, H. van den berg, Industrial
& Engineering Chemistry Research, 50 (2011) 342
[6] N. Al-Yassir, Ph.D. Thesis (2007) Concordia University, Montreal, Canada
[7] D.A. Hunt, Handbook of Petroleum Refining Processes, 2nd Edition, McGraw Hill,
Boson (1997)
[8] A. Chauvel, G. Lefebvre, Petrochemical Process Vol.1, Technip, Paris (1989) 118
[9] http://www.chem.tamu.edu/class/majors/chem470/Steam_Cracking.html
[10] J.G. Speight, The chemistry and Technology of Petroleum, 4th Edition, CRC Press
(2006) 73
[11] P. Leprince, Conversion Processes, Technip, Paris (1998) 169
[12] D. Decroocq, Catalytic Cracking of Heavy Petroleum Reactions, Technip, Paris
(1984) 73
[13] A. Aitani, T. Yoshikawa, T. Ino, Catalysis Today, 60 (2000) 111
[14] J.S. Buchanan, Catalysis Today, 55 (2000) 207
[15] A. Corma, A. Martinez, zeolites for Cleaner Technologies Vol.3, Imperial College
Press, (2002) 29
154
[16] S. Raseev, Thermal and Catalytic processes in Petroleum refining, Marcel Dekker
Inc., New York (2003) 275
[17] S. Kotrel, H. Knozinger, B.C. Gates, Micropor. Mesopor. Mater. 35 (2000) 11
[18] J. Hagen, Industrial Catalysis A Practical Approach, 1st Edition, Wiley-VCH Verlag
Gmbh, Weinheim, Germany (1999) 83
[19] B.C. Gates, Catalytic Chemistry, John Wiley & Sons Inc., New York (1992) 268
[20] S.E. Tung, E. McIninch, J. Catal. 10 (1968) 166
[21] D.M. Nace, Ind. Eng. Chem. Prod. Res. Dev. 8 (1969) 31
[22] A. Borodzinski, A. corma, B.W. Wojciechowske, Canad. J. Chem. Eng. 58 (1980)
219
[23] B.S. Greensfelder, H.H. Voge, G.M. Good, Ind. Eng. Chem. $9 (1957) 742
[24] P.B. Janardhan, R.Rajeswari, Ind. Eng. Chem. Prod. Res. Dev. 16 (1977) 1
[25] J. Planelles, F. Sanchez-Martin, F. Tomas, A. Corma, J. Mol. Catal. 32 (1985) 365
[26] J. Abbot, I.D. Head, J. Catal. 125 (1990) 187
[27] M.L. Poustma, Zeolite Chemistry and Catalysis, ACS Monograph, Washington DC
(1976) 117
[28] B.S. Greensfelder, H.H. Voge, G.M. Good, Ind. Eng. Chem. 41 (1949) 2573
[29] W.O. Haag, R.M. Dessau, Proc. 8th Int. Congr. Catal. Vol 2, Berlin, (1984) 305
[30] J. Scherzer, Catal. Rev. Sci. Eng. 31 (1989) 215
[31] X. Zhao, R.H. Harding, Ind. Eng. Chem. Res. 38 (1999) 3854
[32] R. Le Van Mao, U.S. Patent 4,732,881, (1988)
[33] R. Le Van Mao, S. Melancon, C. Gauthier-Campbell, P. Kletniek, Catal. Lett. 73
(2001) 181
155
[34] S. Melancon, R. Le Van Mao, P. Kleniek, D. Ohayon, S. Interim, M.A. Saberi, D.
McCann, Catal. Lett. 80 (2002) 103
[35] R. Le Van Mao, N.T. Vu, N. Al-Yassir, N. Francois, J. Monnier, Top. Catal. 37
(2006) 107
[36] R. Le Van Mao, N.T. Vu, N. Al-Yassir, H.T. Yan, Ind. Eng. Chem. Res. 47 (2008)
2963
[37] R. Le Van Mao, A. Muntasar, H.T. Yan, Q. Zhao, Catal. Let. 130 (2009) 86
[38] H.T. Yan, R. Le Van Mao, Appl. Catal. A: General 375 (2010) 63
[39] A. Muntasar, R. Le Van Mao, H.T. Yan, Ind. Eng. Chem. Res. 49 (2010) 3611
[40] R. Le Van Mao, Micropor. Mesopor. Mater. (1999) 9
[41] R. Le Van Mao, N. Al-Yassir, D.T.T. Nguyen, Micropor. Mesopor. Mater. 85 (2005)
176
[42] H.T. Yan, R. Le Van Mao, Catal. Lett. 130 (2009) 558
[43] N. Al-Yassir, R. Le Van Mao, F. Heng, Catal. Lett. 100 (2005) 1
[44] N. Al-Yassir, R. Le Van Mao, Appl. Catal. A: General 305 (2006) 130
[45] N. Al-Yassir, R. Le Van Mao, Appl. Catal. A: General 317 (2007) 275
[46] N. Al-Yassir, R. Le Van Mao, Can. J. Chem. 86 (2008) 146
[47] W.C. Conner, J.L. Falconer, Chem. Rev. 95 (1995) 759
[48] M.A. Bari Siddiqui, A.M. aitani, M.R. Saeed, S. Al-Khattaf, Top. Catal. 53 (2010)
1387
[49] Y. Yoshimura, N. Kijima, T. Hayakawa, K. Murata, K. Suzuki, F. Mizukami, K.
Matano, T. Konichi, T. Oikawa, M. Saito, T. Shiojima, K. Shiozswa, K. Wakui, G.
Sawada, K. Sato, S. Matsuo, N. Yamaoka, Catalysis Surverys from Japan 2 (2000) 157
156
[50] R. Tao, M. Patel, K. Blok, Energy 31 (2006) 425
[51] A. Midilli, I. Dincer, M.A. Rosen, International Journal of Green Energy 4 (2007) 65
[52] Y.K. Park, C.W. Lee, N.Y. Kang, W.C. Choi, S. Choi, S.H. Oh, d.S. Park, Catal.
Surv. Asia 14 (2010) 75
[53] P. McKendry, Bioresource Technology 83 (2002) 37
[54] D.T. Boyles, J. Chem. Tech. Biotechnol. 36 (1986) 495
[55] R. Luque, L. Herrero-davila, J.M. Campelo, J.H. Clark, J.M. Hidalgo, D. Luna, J.M.
Marinas, A.A. Romero, Energy Environ. Sci., 1 (2008) 542
[56] D.M. Alonso, J.Q. bond, J.A. Dumesic, Green Chem. 12 (2010) 1493
[57] L. Zhang, C. Xu, P. Champagne, Energy Conversion and Management 51 (2010)
969
[58] F. Cherubini, Energy Conversion and Management 51 (2010) 1412
[59] G.W. Huber, S. Iborra, A. Corma, Chem. Rev. 106 (2006) 4044
[60] A. Corma, G.W. Huber, L. Sauvanaud, P. O’Connor, Journal of Catalysis, 247
(2007) 307
[61] H.T. Yan, M.Sc. Thesis (2009), Concordia University, Montreal, Canada
[62] C.G. Bond, In Studies in Surface Science and Catalysis; G.M. Pajond, S.J. Teichner,
J.E. Germain, Eds.; Elsevier, Amsterdam 17 (1983) 1
[63] J.M. Parera, E.M. Traffano, J.C. Musso, C.L. Pieck, In Studies in Surface Science
and Catalysis; G.M. Pajond, S.J. Teichner, J.E. Germain, Eds.; Elsevier, Amsterdam 17
(1983) 101
[64] C.W. Conner Jr., J.L. Falconner, Chem. Rev. 95 (1995) 759
157
[65] B. Delmon, In Proceedings of the 3rd International Conference on Spillover, T. Inui,
K. Fujimoto, T. Uchijima, M. Masai, Eds.; Elsevier, Amsterdam (1993) 1
[66] U. Roland, H. Winkler, K.H. Steinberg, In Proceedings of the 2nd International
Conference on Spillover, K.H. Steinberg, Ed.; Karl-Marx Universitat, Leipzig (1989) 63
[67] U. Roland, H. Winkler, H. Bauch, K.H. Steinberg, J. Chem. Soc. Faraday Trans. 87
(1991) 3921
[68] U. Roland, R. Salzer, S. Stolle, In Studies in Surface Science and Catalysis; J.
Weitkamp, H.G. Karge, H. Pfeifer, W. Holderich, Eds.; Elsevier, Amsterdam 84B (1994)
1231
[69] F. Roessner, U. Roland, T. Braunschweig, J. Chem. Soc. Faraday Trans. 91(1995)
1539
[70] M. Voith, Chem. Eng. News (2009) 20
[71] S. Morrissey, Chem. Eng. News (2009) 9
[72] E. Elaloui, R. Begag, B. Pommier, G.M. Pajonk, In Studies in Surface Science and
Catalysis; E. Gaigneaus, D.E. De Vos, P. Grange, P.A. Jacobs, J.A. Martens, P. Ruiz, G.
Poncelet, Eds.; Elsevier, Amsterdam 143 (2002) 331
[73] R.A. Dagle, Y.H. Chin, Y. Wang, Top. Catal. 46 (2997) 358
[74] R. Le Van Mao, N. Al-Yassir, L. Lu, N.T. Vu, A. Fortier, Catal. Lett. 112 (2006) 13
[75] H.T. Yan, R. Le Van Mao, Concordia University, Montreal, Canada (2009)
unpublished results
[76] C.D. Chang, Catal. Rev. Sci. Engng. 25 (1983) 1
[77] M. Stocker, Microporous Mesoporous Mater. 29 (1999) 3 and reference therein
[78] I.M. Dahl, S. Kolboe, J. Catal. 149 (1994) 458
158
[79] I.M. Dahl, S. Kolboe, J. Catal. 161 (1996) 304
[80] O. Mikkelsen, P.O. Ronning, S. Kolboe, Microporous Mesoporous Mater. 40 (2000)
95
[81] M. Bjorgen, U. Olsbye, D. Petersen, S. Kolboe, J. Catal. 221 (2004)1
[82] A. Sassi, A. Wildman, H.J. Ahn, P. Prasad, J.B. Nicolas, J.F. Haw, J. Phys. Chem. B
106 (2002) 2294
[83] M. Bjorgen, S. Svelle, F. Joensen, J. Nerlow, S. Kolboe, F. Bonino, L. Palaumbo, S.
Bordiga, U. Olsbye, J. Catal. 249 (2007) 195
[84] U.V. Mentzel, A.K. Rovik, C.H. Christensen, Cata. Lett. 127 (2009) 44
[85] C.A. Cardona, O.J. Sanchez, L.F. Gutierrez, In Process Synthesis for Fuel Ethnaol
Production, CRC Press, Boca Raton, Fl, USA (2010) 199
[86] N.N. Nichols, B.S. Dien, R.J. Bothast, M.A. Cotta, In Alcoholic Fuels, S.Minteer,
Ed.; Taylor & Francis (CRC), Boca Raton, FL, USA (2006) 59
[87] A. Corma, F.V. Melo, L. Sauvanat, F. Ortega, Catal. Today 107 (2005) 699
[88] R. Le Van Mao, L. Dufresne, J. Yao Appl. Catal. 65 (1990) 143
[89] B. Arstad, S. Kolboe J. Am. Chem. Soc. 123 (2001) 8137
[90] A. Corma, F.V. Melo, L. Sauvanaud, F.J. Ortega, Appl. Catal. A: General 265
(2004) 195
[91] J. Wan, Y. Wei, Z. Liu, B. Li, Y. Qi, M. Li, P. Xie, S. Meng, Y. He, F. Chang, Catal.
Lett. 124 (2008) 150
[92] B.Z. Solyar, E.Z. Aladysheva, M.V. Mnev, V.N. Popov, L.S. Glazov, E.A.
Klimseva, N.A. Filkova, Chem. Tech. Fuels Oils 46 (2010) 99
159
[93] R. Bonifay, C. Marcilly, In Conversion Processes, P. Leprince Ed.; Technip, Paris,
France (2010) 196
[94] H. Feng, C. Li, H. Shan, Appl. Clay. Sci. 42 (2009) 439
[95] Sources: Methanex and Oil-Price. Net (October 12, 2010)
[96] B. Lucke, A. Martin, H. Gunschel, S. Nowak, Microporous Mesoporous Mater. 29
(1999) 145
[97] F. Chang, Y. Wei, X. Liu, Y. Zhao, L. Xu, Y. Sun, D. Zhang, Y. He, Z. Liu, Appl.
Catal. A: General 328 (2007) 163
[98] D. Mier, A.T. Aguayo, A.G. Gayubo, M. Olazar, J. Bilbao, Appl. Catal. A: General
383 (2010) 202
[99] Z. Wang, G. Jiang, Z. Zhao, X. Feng, A. Duan, J. Liu, C. Xu, J. Gao, Energy &
Fuels 24 (2010) 758
[100] J. Wan, F. Chang, Y. Wei, Q. Xia, Z. Liu, Catal. Lett. 127 (2009) 348
[101] H.T. Yan, R. Le Van Mao, Catal. Lett. 141 (2011) 691
[102] M.A. Saberi, R. Le Van Mao, Appl. Catal. A: General 242 (2003) 139
[103] B.W. Wojciechowski, N.M. Rice, In Experimental Methods in Kinetic Studies,
Elsevier, Amsterdam (2003) 42
[104] M.G. Ahunbay, Langmuir 27 (2011) 4986
[105] P.A. Willems, G.F. Froment, Ind. Eng. Chem. Res. 27 (1988) 1966
[106] S.M. Babitz, B.A. Williams, J.T. Miller, R.Q. Snurr, W.O. Haag, H.H. Kung, Appl.
Catal. A: General 179 (1999) 71
[107] D.B. Lukyanov, V.I. Shtral, S.N. Khadzhiev, J. Catal. 146 (1994) 87
[108] J.F. Denayer, A. Bouyermaouen, G.V. Baron, Ind. Eng. Chem. Res. 37 (1998) 3691
160
[109] X. Rozanska, R.A. van Santen In Handbook of Zeolite Science and Technology,
S.M. Auerbach, K.A. Carrado, P.K. Dutta, Eds.; Marcel Dekker, New York, USA (2003)
785 and references therein
[110] M. Jayamurthy, S. Vasudevan, Catal. Lett. 36 (1996) 111
[111] S.R. Blaszkowski, R.A. van Santen, J. Am. Chem. Soc. 119 (1997) 5020
[112] J.F. Haw, In-situ Spectroscopic Methods in Catalysis, Wiley, New York, USA
(2002)
[113] M. Seiler, W. Wang, A. Buchholz, M. Hunger, Catal. Lett. 88 (2003) 187
[114] J.F. Haw, D.M. Marcus In Handbook of Zeolite Science and Technology, S.M.
Auerbach, K.A. Carrado, P.K. Dutta, Eds.; Marcel Dekker, New York, USA (2003) 833
and references therein
[115] Y. Yamada, C.K. Tsung, W. Huang, Z. Huo, S.E. Habas, T. Soejima, C.E. Aliaga,
G.A. Somorjai, P. Yang, Nature Chem. 3 (2011) 372
[116] C.S. Callam, S.J. Singer, T.L. Lowary, C.M. Hadad, J. Am. Chem. Soc. 123 (2001)
11743
[117] B. Katryniok, S. Paul V. Belliere-Baca, P. Rey, F. Dumeignil, Green Chem. 12
(2010) 2079 and references therein
[118] Y.T. Kim, K.D. Jung, E.D. Park, Microporous Mesoporous Mater. 131 (2010) 28
and references therein
[119] C.W. Chiu, M.A. Dasari, G.J. Suppes, W.R. Sutterlin, AICHE J. 52 (2006) 3543
[120] K. Wang, M.C. Hawley, S.J. DeAthos, Ind. Eng. Chem. Res. 42 (2003) 2913
[121] S. Zhu, Y. Zhu, S. Hao, L. Chen, B. Zhang, Y. Li, Appl. Cata. A: General 142
(2012) 267
161
[122] B. Katryniok, H. Kimura, E. Skrzynska, J.S. Girardon, P. Fongarland, M. Capron,
R. Ducoulombier, N. Mimura, S. Paul, F. Dumeignil, Green Chem. 13 (2011) 1960
[123] K. Pathak, K.M. Reddy, N.N. Bakhshi, A.K. Dalai, Appl. Cata. A: General 372
(2010) 224
[124] T. Hirai, N. Ikenaga, T. Miyake, T. Suzuki, Energy & Fuels 19 (2005) 1761
[125] E. Elaloui, R. Begag, B. Pommier, G.M. Pajonk, In Studies in Surface Science and
Catalysis, E. Gaigneaux, D.E. De Vos, P. Grange, P.A. Jacobs, J.A. Martens, P. Ruiz, G.
Poncelet, Eds.; Elsevier, Amsterdam 143 (2002) 331
[126] H. Atia, U. Armbruster, A. Martin, J. Catal. 258 (2008) 71
[127] K. Cottin, J. M. Clascens, Y. Pouilloux, J. Barrault, Ol. Corps Gras Lipides 5
(1998) 407
[128] M. Richter, Y.K. Krisnandi, R. Eckelt, A. Martin, Catal. Comm. 9 (2008) 2112
[129] T.P. Vispute, H. Zhang, A. Sanna, R. Xiao, G.W. Huber, Science 330 (2010) 1222
[130] E.Taarning, C.M. Osmundsen, X. Yang, B. Voss, S.I. Andersen, C.H. Christensen,
Energy & Environmental Science 4 (2011) 793
[131] B.Valle, A.G. Gayubo, A.T. Aguayo, M.O.J. Bilao, Energy & Fuels 24 (2010)
2060
[132] R.K. Sharma, N.N. Bakhshi, Energy & Fuels 7 (1993) 306
[133] S. Wang, G.Q. Lu, Energy & Fuels 10 (1996) 896
[134] M.C.J. Bradford, M.A. Vannice, Catalysis Review 41 (1999) 1
[135] S.P.S. Andrew, I& EC Product Research and Development 8 (1969) 321
[136] I. Wender, Fuel Processing Technology 48 (1996) 189
[137] M.E. Dry, Catalysis Today 71 (2002) 227

162
[138] A. Haryanto, S. Fernando, N. Murali, S. Adhikari, Energy & Fuels 19 (2005) 2098
[139] D.N. Bangala, N. Abatzoglou, E. Chornet, AIChE Journal 44 (1998) 927


![Roads to Olefins -Sinopec [兼容模式] - Platts · Technical Solutions Major Solutions to Olefin Production Steam Cracking Feedstock flexibility, product spectrum , downstream integration](https://img.pdfslide.us/doc/110x75/5b52f7107f8b9a35278df4dd/roads-to-olefins-sinopec-platts-technical-solutions-major.jpg)


![[Petroleum] - UOP Fluid Catalytic Cracking Unit](https://img.pdfslide.us/doc/110x75/55cf9b57550346d033a5ade2/petroleum-uop-fluid-catalytic-cracking-unit.jpg)