Embed Size (px)
Citation preview
1
Mitsubishi UFJ Financial Group Basel II DisclosureInterim Fiscal 2012
Basel II Data (MUFG, Consolidated)
Scope of Consolidation 2
Composition of Equity Capital 3
Capital Adequacy 4
Credit Risk 6
Credit Risk Mitigation 19
Derivative Transactions and Long Settlement Transactions 20
Securitization Exposures
(Subject to calculation of credit risk assets) 21
Securitization Exposures
(Subject to calculation of market risk equivalent amount) 29
Market Risk 30
Equity Exposures in Banking Book 33
Exposures Relating to Funds 34
Interest Rate Risk in the Banking Book (IRRBB) 35
2
Basel II Disclosure Interim Fiscal 2012
In accordance with the provisions of Article 52-25 of the Banking Law of Japan, Mitsubishi UFJ Financial Group (MUFG) adopts the
“First Standard” to calculate its capital adequacy ratio based on formulas contained in the standards for the consolidated capital
adequacy ratio of bank holding companies (Notification of the Financial Services Agency No. 20, 2006; referred to hereinafter as the
“FSA Consolidated Capital Adequacy Notification”) to assess capital adequacy in light of the assets we own on a consolidated basis.
With regard to the internal controls structure governing calculation of the consolidated capital adequacy ratio, MUFG received a
report from Deloitte Touche Tohmatsu LLC (DTT) which conducted certain procedures as an independent auditing firm. The proce-
dures that were agreed upon between MUFG and DTT were conducted in accordance with the Japanese Institute of Certified Public
Accountants (JICPA) Industry Audit Committee Practical Guideline No. 30. The procedures were not conducted based on “generally
accepted auditing principles,” and we did not receive any audit opinion with regard to our internal controls structure or the related
consolidated capital adequacy ratio.
Scope of Consolidation
Companies that are deficient in regulatory capital and total regulatory capital deficiencies
Names of any companies qualifying for
capital deductions under the provisions
of Paragraph 1.2 (a)–(c) of Article 8, or
Paragraph 1.2 (a)–(c) of Article 20, of the
FSA Consolidated Capital Adequacy
Notification that are deficient in
regulatory capital, and corresponding
total regulatory capital deficiencies
Not applicable as of end Sept. 2011 and 2012
3
Basel II Disclosure Interim Fiscal 2012
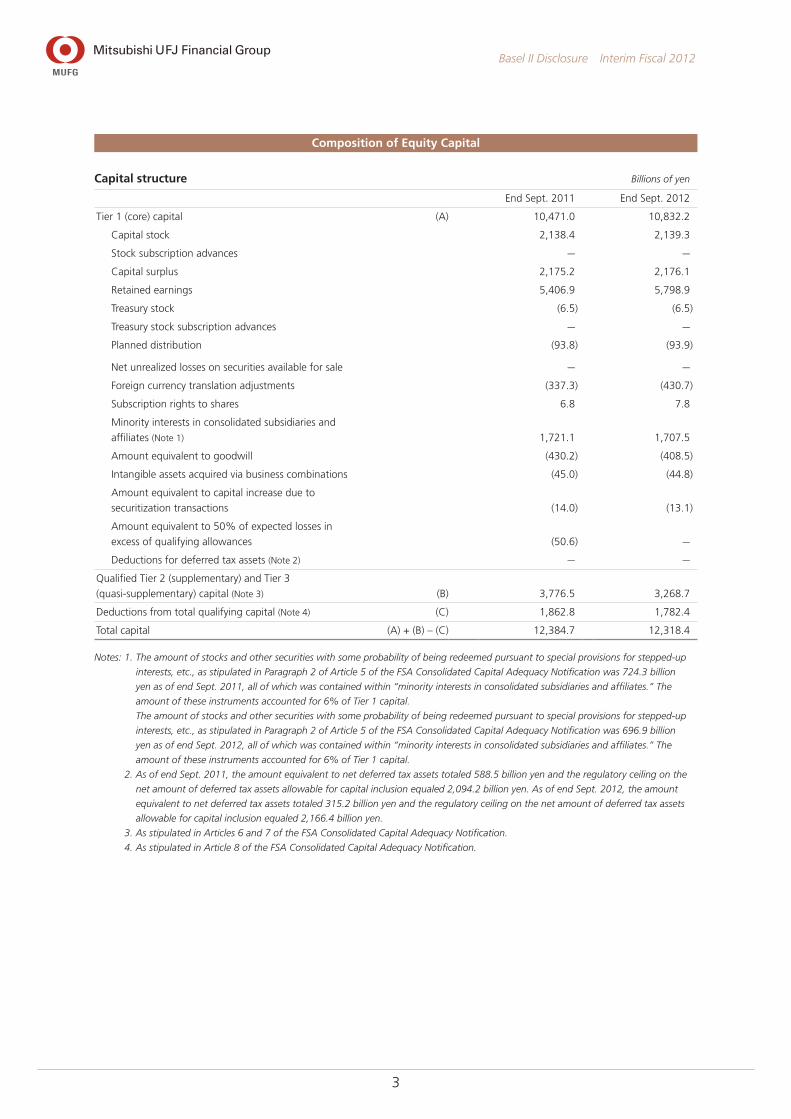
Composition of Equity Capital
Capital structure Billions of yen
End Sept. 2011 End Sept. 2012
Tier 1 (core) capital (A) 10,471.0 10,832.2
Capital stock 2,138.4 2,139.3
Stock subscription advances — —
Capital surplus 2,175.2 2,176.1
Retained earnings 5,406.9 5,798.9
Treasury stock (6.5) (6.5)
Treasury stock subscription advances — —
Planned distribution (93.8) (93.9)
Net unrealized losses on securities available for sale — —
Foreign currency translation adjustments (337.3) (430.7)
Subscription rights to shares 6.8 7.8
Minority interests in consolidated subsidiaries and
affiliates (Note 1) 1,721.1 1,707.5
Amount equivalent to goodwill (430.2) (408.5)
Intangible assets acquired via business combinations (45.0) (44.8)
Amount equivalent to capital increase due to
securitization transactions (14.0) (13.1)
Amount equivalent to 50% of expected losses in
excess of qualifying allowances (50.6) —
Deductions for deferred tax assets (Note 2) — —
Qualified Tier 2 (supplementary) and Tier 3
(quasi-supplementary) capital (Note 3) (B) 3,776.5 3,268.7
Deductions from total qualifying capital (Note 4) (C) 1,862.8 1,782.4
Total capital (A) + (B) – (C) 12,384.7 12,318.4
Notes: 1. The amount of stocks and other securities with some probability of being redeemed pursuant to special provisions for stepped-up
interests, etc., as stipulated in Paragraph 2 of Article 5 of the FSA Consolidated Capital Adequacy Notification was 724.3 billion
yen as of end Sept. 2011, all of which was contained within “minority interests in consolidated subsidiaries and affiliates.” The
amount of these instruments accounted for 6% of Tier 1 capital.
The amount of stocks and other securities with some probability of being redeemed pursuant to special provisions for stepped-up
interests, etc., as stipulated in Paragraph 2 of Article 5 of the FSA Consolidated Capital Adequacy Notification was 696.9 billion
yen as of end Sept. 2012, all of which was contained within “minority interests in consolidated subsidiaries and affiliates.” The
amount of these instruments accounted for 6% of Tier 1 capital.
2. As of end Sept. 2011, the amount equivalent to net deferred tax assets totaled 588.5 billion yen and the regulatory ceiling on the
net amount of deferred tax assets allowable for capital inclusion equaled 2,094.2 billion yen. As of end Sept. 2012, the amount
equivalent to net deferred tax assets totaled 315.2 billion yen and the regulatory ceiling on the net amount of deferred tax assets
allowable for capital inclusion equaled 2,166.4 billion yen.
3. As stipulated in Articles 6 and 7 of the FSA Consolidated Capital Adequacy Notification.
4. As stipulated in Article 8 of the FSA Consolidated Capital Adequacy Notification.
4
Basel II Disclosure Interim Fiscal 2012
Capital Adequacy
Capital requirements for credit risk Billions of yen
End Sept. 2011 End Sept. 2012
Capital requirements for credit risk (excluding equity exposures under the
IRB Approach, and exposures relating to funds (Note 3)) 6,883.5 6,158.3
IRB Approach (excluding securitization exposures) 5,756.1 4,996.0
Corporate exposures (excluding specialized lending exposures subject to
supervisory slotting criteria) 3,933.8 3,416.9
Corporate exposures (specialized lending exposures subject to
supervisory slotting criteria) 65.3 32.4
Sovereign exposures 87.5 57.1
Bank exposures 181.6 149.2
Residential mortgage exposures 622.9 589.0
Qualifying revolving retail exposures 233.0 209.0
Other retail exposures 345.6 281.3
Exposures related to unsettled transactions 0.1 0.1
Exposures for other assets 285.9 260.7
Standardized Approach (excluding securitization exposures) 878.5 956.2
Securitization exposures (Note 4) 248.8 206.0
Portfolios under the IRB Approach 207.4 179.4
Portfolios under the Standardized Approach 41.3 26.6
Capital requirements for credit risk of equity exposures under the IRB Approach 447.4 413.8
Exposures subject to transitional arrangements (grandfathering provisions) (Note 5) 268.9 249.7
Market-Based Approach (Simple Risk Weight Method) (Note 6) 81.8 64.2
Market-Based Approach (Internal Models Method) (Note 6) — —
PD/LGD Approach (Note 6) 96.7 99.8
Capital requirements for exposures relating to funds 232.2 154.6
Total 7,563.3 6,726.8
Notes: 1. Credit risk-weighted assets were calculated using the AIRB Approach. However, as an exemption to this approach, the
Standardized Approach is used for calculations with credit risk-weighted assets at some subsidiaries in cases where the figures for
such subsidiaries are expected to be minor compared with the total. In addition, the adoption of the IRB Approach is due to be
phased in from the end of March 2013 at UnionBanCal Corporation.
2. Capital requirement for portfolios under the IRB Approach is calculated as “credit risk-weighted asset amount x 8% + expected
losses.” In this calculation, the amount of capital requirement is including any exposures qualifying as capital deduction, and the
credit risk-weighted asset amount is multiplied by the scaling factor of 1.06. Capital requirements for portfolios under the
Standardized Approach are calculated as “credit risk-weighted asset amount x 8%.”
3. Exposures to calculate the amount of credit risk-weighted assets as stipulated in Article 145 of the FSA Consolidated Capital
Adequacy Notification.
4. Including amounts equivalent to increase in equity capital resulting from a securitization exposure, as a deduction from Tier 1
capital elements.
5. Exposures to calculate the amount of credit risk-weighted assets as stipulated in Article 13 of the Supplementary Provisions to the
FSA Consolidated Capital Adequacy Notification.
6. Exposures to calculate the amount of credit risk-weighted assets as stipulated in Article 144 of the FSA Consolidated Capital
Adequacy Notification.
5
Basel II Disclosure Interim Fiscal 2012
Capital requirements for market risk Billions of yen
End Sept. 2011 End Sept. 2012
Standardized Method 77.2 101.2
Interest rate risk 36.9 44.0
Equity position risk 35.3 50.1
Foreign exchange risk 2.7 3.1
Commodity risk 2.2 3.7
Options transactions — —
Internal Models Approach 70.9 74.0
Total 148.1 175.2
Notes: 1. As for market risk, the Internal Models Approach is mainly adopted to calculate general market risk and the Standardized Method
is adopted to calculate specific risk.
2. From end Mar. 2012, stressed value-at-risk (VaR) has been included in market risk calculated using the Internal Models Approach.
Capital requirements for operational risk Billions of yen
End Sept. 2011 End Sept. 2012
The Advanced Measurement Approach — 286.0
The Standardized Approach 516.7 —
The Basic Indicator Approach — 110.1
Total 516.7 396.2
Note: Operational risk was calculated using the Standardized Approach as of end Sept. 2011 and using the Advanced Measurement
Approach and the Basic Indicator Approach as of end Sept. 2012.
Consolidated total capital adequacy ratio, Tier 1 capital adequacy ratio and total capital requirement (consolidated basis) Billions of yen
End Sept. 2011 End Sept. 2012
Consolidated total capital adequacy ratio 15.42% 14.30%
Consolidated Tier 1 capital adequacy ratio 13.04% 12.57%
Consolidated total capital requirements 6,422.1 6,889.4
8% of credit risk-weighted assets 5,757.1 5,190.6
Capital requirements for market risk 148.1 175.2
Capital requirements for operational risk 516.7 396.2
8% of the amount by which the capital floor value, which is obtained
by multiplying the risk-weighted asset amount as calculated according to
the Former Notification (Note) by a predetermined adjustment factor,
exceeds the risk-weighted asset amount as calculated according to the
FSA Consolidated Capital Adequacy Notification — 1,127.2
Note: Hereafter, this refers to Ministry of Finance (MOF) Notification No. 62, 1998, which was based on the provisions of Article 52–25 of
the Banking Law of Japan.
6
Basel II Disclosure Interim Fiscal 2012
Credit Risk
Credit risk exposures and default exposures
(By approach) Billions of yen
End Sept. 2011
Credit risk exposures (Note 1)
Loans, etc. (Note 2) Debt securities OTC derivatives Total
The IRB approach 120,677.2 65,458.6 4,380.2 209,815.7
The Standardized approach 18,488.4 2,282.2 2,677.4 28,022.3
Total 139,165.6 67,740.9 7,057.6 237,838.1
Billions of yen
End Sept. 2012
Credit risk exposures (Note 1)
Loans, etc. (Note 2) Debt securities OTC derivatives Total
The IRB approach 120,288.8 66,548.2 3,891.9 209,340.8
The Standardized approach 17,193.8 2,370.7 2,507.8 26,746.6
Total 137,482.6 68,918.9 6,399.8 236,087.4
Notes: 1. Figures are without taking into account the effects of credit risk mitigation techniques. Furthermore, figures do not include any
securitization exposures or exposures relating to funds.
2. Loans, etc., include loans, commitments and other non-derivative off balance sheet exposures.
3. Regarding on balance sheet exposures to loans and debt securities, etc., and off balance sheet exposures to commitments, etc.,
no significant disparity was observed between the interim term-end position and the average risk positions during this period.
(By geographic area) Billions of yen
End Sept. 2011
Credit risk exposures (Note 1) Exposures more than three months
in arrears or in default (Note 3)Loans, etc. (Note 2) Debt securities OTC derivatives Total
Domestic 110,541.4 62,647.6 6,385.8 196,392.3 2,530.1
Foreign 28,624.1 5,093.2 671.7 41,445.8 162.3
Total 139,165.6 67,740.9 7,057.6 237,838.1 2,692.4
Billions of yen
End Sept. 2012
Credit risk exposures (Note 1) Exposures more than three months
in arrears or in default (Note 3)Loans, etc. (Note 2) Debt securities OTC derivatives Total
Domestic 105,077.0 62,367.1 5,679.6 190,937.8 2,515.6
Foreign 32,405.6 6,551.7 720.1 45,149.6 159.9
Total 137,482.6 68,918.9 6,399.8 236,087.4 2,675.5
Notes: 1. Figures are without taking into account the effects of credit risk mitigation techniques. Furthermore, figures do not include any
securitization exposures or exposures relating to funds.
2. Loans, etc., include loans, commitments and other non-derivative off balance sheet exposures.
3. Figures for exposures past due three months or more or default exposures correspond to exposures as of the period-end where
the amount of the credit risk-weighted asset is computed assuming default in cases subject to the IRB Approach, and exposures
where the amount of the credit risk-weighted asset is computed assuming past-due loan exposure in cases subject to the
Standardized Approach. Figures do not include any securitization exposures or exposures relating to funds.
4. Geographic area refers to the locations of MUFG or our subsidiaries or the head and branch offices of our subsidiaries.
7
Basel II Disclosure Interim Fiscal 2012
(By type of industry) Billions of yen
End Sept. 2011
Credit risk exposures (Note 1) Exposures more than three months
in arrears or in default (Note 3)Loans, etc. (Note 2) Debt securities OTC derivatives Total
Manufacturing 16,532.1 1,436.7 693.0 21,103.1 332.4
Wholesale and retail 9,810.2 667.8 755.6 12,198.0 410.7
Construction 1,529.3 152.0 24.0 1,807.3 101.2
Finance and insurance 26,700.9 1,657.9 4,145.8 36,542.8 37.0
Real estate 10,755.9 372.6 89.1 11,304.1 216.8
Services 6,201.0 390.4 253.3 6,926.9 237.0
Transport 4,199.7 245.1 303.8 5,060.3 63.1
Individuals 22,653.1 — 0.1 23,434.5 916.5
Governments and
local authorities 21,266.7 60,904.6 57.0 84,640.2 10.4
Others 19,516.2 1,913.4 735.4 34,820.4 366.9
Total 139,165.6 67,740.9 7,057.6 237,838.1 2,692.4
Billions of yen
End Sept. 2012
Credit risk exposures (Note 1) Exposures more than three months
in arrears or in default (Note 3)Loans, etc. (Note 2) Debt securities OTC derivatives Total
Manufacturing 17,090.4 1,331.7 608.5 21,343.9 433.9
Wholesale and retail 10,283.1 489.5 496.4 12,227.9 457.8
Construction 1,502.1 93.0 19.9 1,723.0 75.4
Finance and insurance 26,928.7 1,506.8 3,686.8 35,173.7 30.4
Real estate 10,553.5 275.1 100.0 11,024.7 222.5
Services 6,454.7 273.9 228.3 7,043.9 240.1
Transport 4,381.3 206.9 266.2 5,170.8 68.6
Individuals 21,697.6 — 0.1 22,511.7 832.8
Governments and
local authorities 20,790.3 62,644.4 61.9 87,973.9 0.0
Others 17,800.5 2,097.2 931.2 31,893.4 313.5
Total 137,482.6 68,918.9 6,399.8 236,087.4 2,675.5
Notes: 1. Figures are without taking into account the effects of credit risk mitigation techniques. Furthermore, figures do not include any
securitization exposures or exposures relating to funds.
2. Loans, etc., include loans, commitments and other non-derivative off balance sheet exposures.
3. Figures for exposures past due three months or more or default exposures correspond to exposures as of the period-end where
the amount of the credit risk-weighted asset is computed assuming default in cases subject to the IRB Approach, and exposures
where the amount of the credit risk-weighted asset is computed assuming past-due loan exposure in cases subject to the
Standardized Approach. Figures do not include any securitization exposures or exposures relating to funds.
4. Exposures held by certain subsidiaries whose credit risk weighted assets are considered minor relative to the overall total are
included in the “Others” category.
8
Basel II Disclosure Interim Fiscal 2012
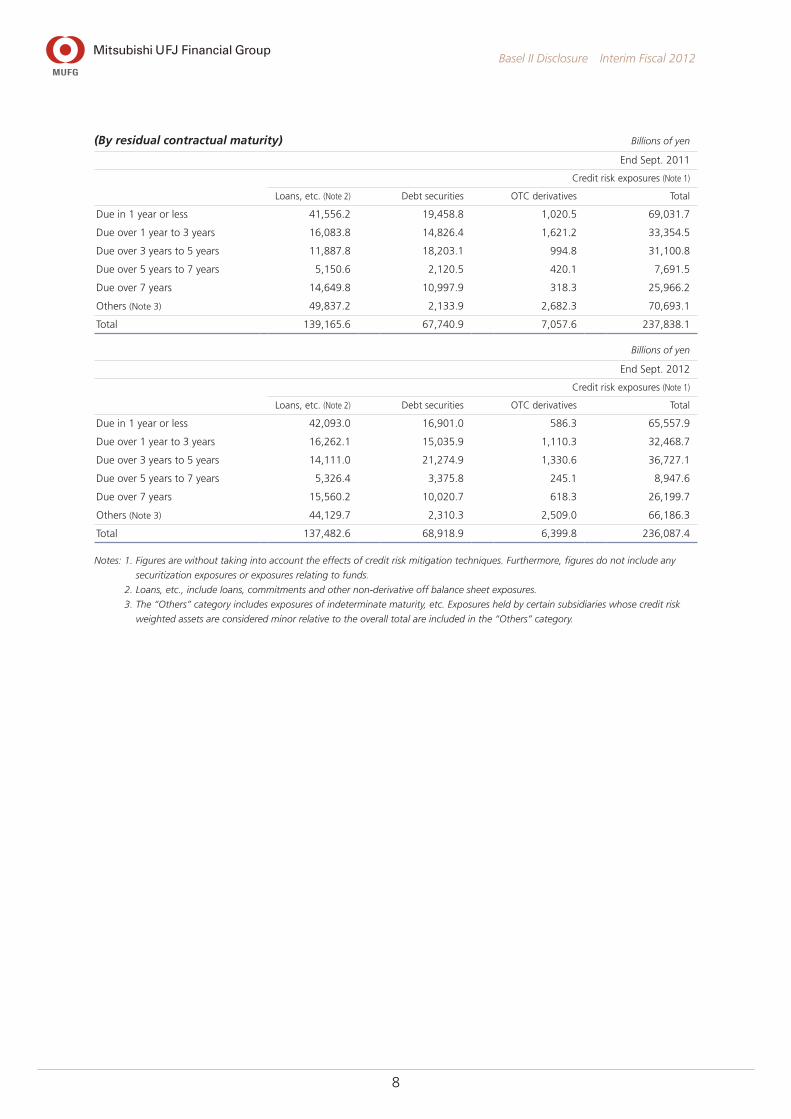
(By residual contractual maturity) Billions of yen
End Sept. 2011
Credit risk exposures (Note 1)
Loans, etc. (Note 2) Debt securities OTC derivatives Total
Due in 1 year or less 41,556.2 19,458.8 1,020.5 69,031.7
Due over 1 year to 3 years 16,083.8 14,826.4 1,621.2 33,354.5
Due over 3 years to 5 years 11,887.8 18,203.1 994.8 31,100.8
Due over 5 years to 7 years 5,150.6 2,120.5 420.1 7,691.5
Due over 7 years 14,649.8 10,997.9 318.3 25,966.2
Others (Note 3) 49,837.2 2,133.9 2,682.3 70,693.1
Total 139,165.6 67,740.9 7,057.6 237,838.1
Billions of yen
End Sept. 2012
Credit risk exposures (Note 1)
Loans, etc. (Note 2) Debt securities OTC derivatives Total
Due in 1 year or less 42,093.0 16,901.0 586.3 65,557.9
Due over 1 year to 3 years 16,262.1 15,035.9 1,110.3 32,468.7
Due over 3 years to 5 years 14,111.0 21,274.9 1,330.6 36,727.1
Due over 5 years to 7 years 5,326.4 3,375.8 245.1 8,947.6
Due over 7 years 15,560.2 10,020.7 618.3 26,199.7
Others (Note 3) 44,129.7 2,310.3 2,509.0 66,186.3
Total 137,482.6 68,918.9 6,399.8 236,087.4
Notes: 1. Figures are without taking into account the effects of credit risk mitigation techniques. Furthermore, figures do not include any
securitization exposures or exposures relating to funds.
2. Loans, etc., include loans, commitments and other non-derivative off balance sheet exposures.
3. The “Others” category includes exposures of indeterminate maturity, etc. Exposures held by certain subsidiaries whose credit risk
weighted assets are considered minor relative to the overall total are included in the “Others” category.
9
Basel II Disclosure Interim Fiscal 2012
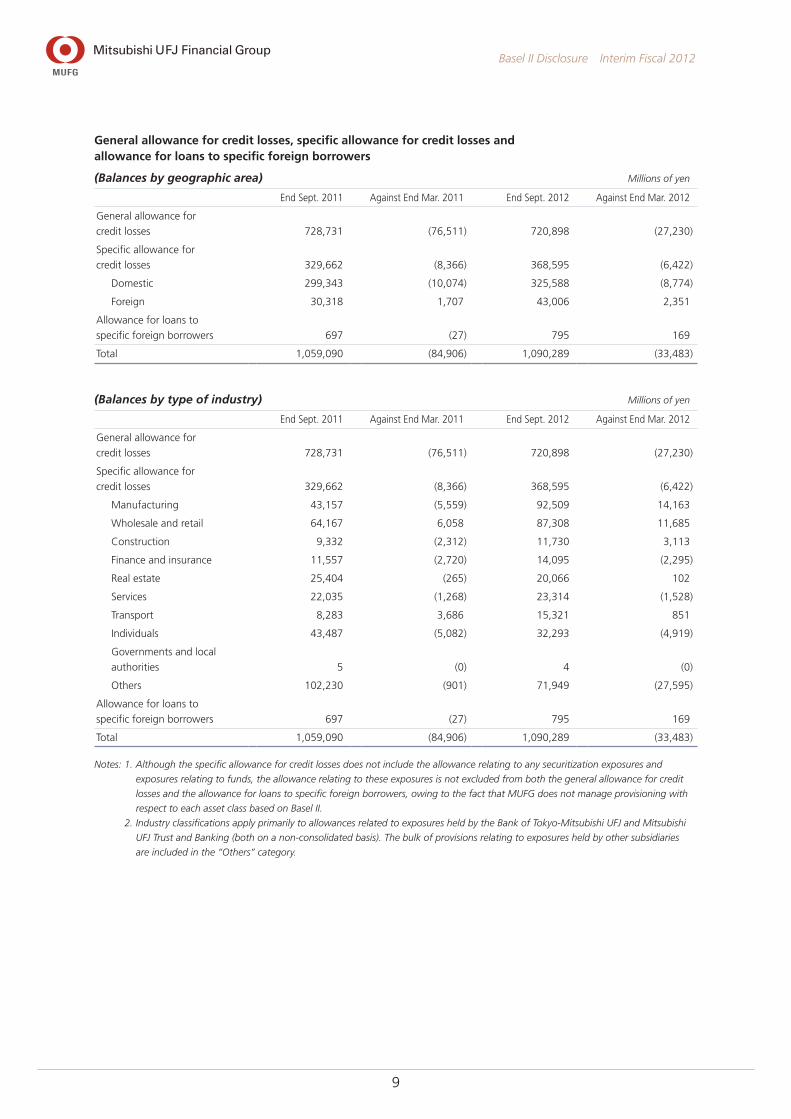
General allowance for credit losses, specific allowance for credit losses and allowance for loans to specific foreign borrowers
(Balances by geographic area) Millions of yen
End Sept. 2011 Against End Mar. 2011 End Sept. 2012 Against End Mar. 2012
General allowance for
credit losses 728,731 (76,511) 720,898 (27,230)
Specific allowance for
credit losses 329,662 (8,366) 368,595 (6,422)
Domestic 299,343 (10,074) 325,588 (8,774)
Foreign 30,318 1,707 43,006 2,351
Allowance for loans to
specific foreign borrowers 697 (27) 795 169
Total 1,059,090 (84,906) 1,090,289 (33,483)
(Balances by type of industry) Millions of yen
End Sept. 2011 Against End Mar. 2011 End Sept. 2012 Against End Mar. 2012
General allowance for
credit losses 728,731 (76,511) 720,898 (27,230)
Specific allowance for
credit losses 329,662 (8,366) 368,595 (6,422)
Manufacturing 43,157 (5,559) 92,509 14,163
Wholesale and retail 64,167 6,058 87,308 11,685
Construction 9,332 (2,312) 11,730 3,113
Finance and insurance 11,557 (2,720) 14,095 (2,295)
Real estate 25,404 (265) 20,066 102
Services 22,035 (1,268) 23,314 (1,528)
Transport 8,283 3,686 15,321 851
Individuals 43,487 (5,082) 32,293 (4,919)
Governments and local
authorities 5 (0) 4 (0)
Others 102,230 (901) 71,949 (27,595)
Allowance for loans to
specific foreign borrowers 697 (27) 795 169
Total 1,059,090 (84,906) 1,090,289 (33,483)
Notes: 1. Although the specific allowance for credit losses does not include the allowance relating to any securitization exposures and
exposures relating to funds, the allowance relating to these exposures is not excluded from both the general allowance for credit
losses and the allowance for loans to specific foreign borrowers, owing to the fact that MUFG does not manage provisioning with
respect to each asset class based on Basel II.
2. Industry classifications apply primarily to allowances related to exposures held by the Bank of Tokyo-Mitsubishi UFJ and Mitsubishi
UFJ Trust and Banking (both on a non-consolidated basis). The bulk of provisions relating to exposures held by other subsidiaries
are included in the “Others” category.
10
Basel II Disclosure Interim Fiscal 2012
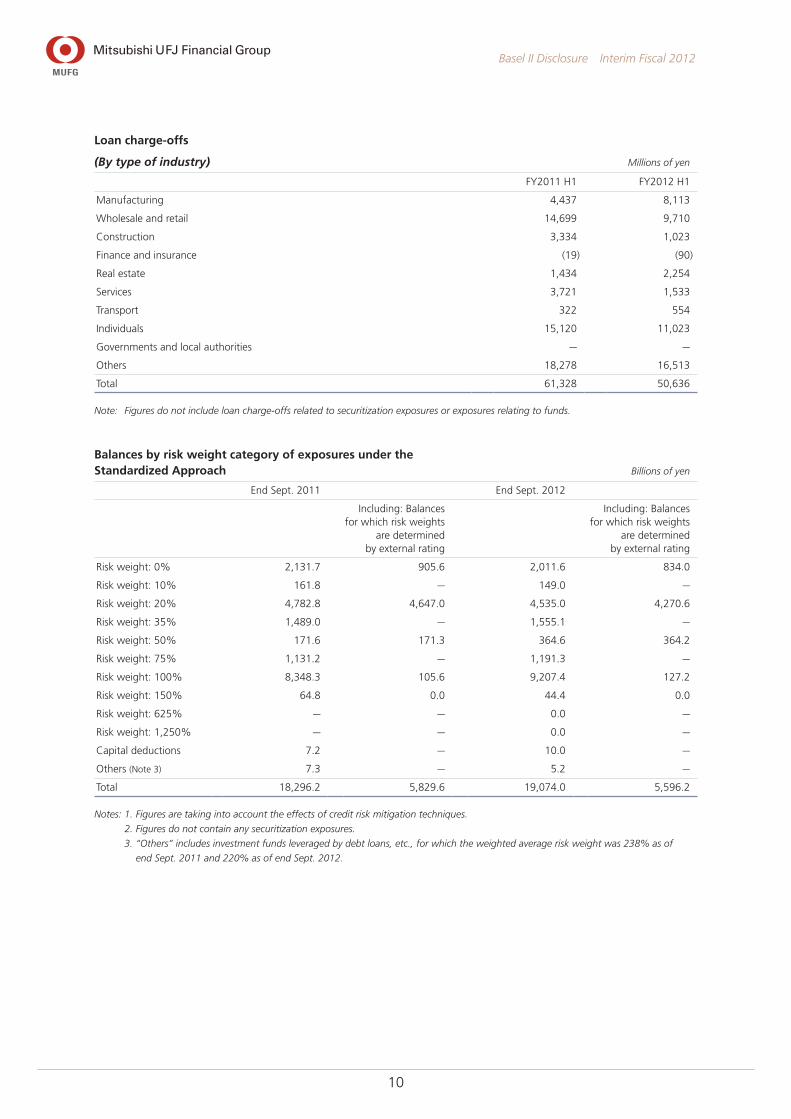
Loan charge-offs
(By type of industry) Millions of yen
FY2011 H1 FY2012 H1
Manufacturing 4,437 8,113
Wholesale and retail 14,699 9,710
Construction 3,334 1,023
Finance and insurance (19) (90)
Real estate 1,434 2,254
Services 3,721 1,533
Transport 322 554
Individuals 15,120 11,023
Governments and local authorities — —
Others 18,278 16,513
Total 61,328 50,636
Note: Figures do not include loan charge-offs related to securitization exposures or exposures relating to funds.
Balances by risk weight category of exposures under the Standardized Approach Billions of yen
End Sept. 2011 End Sept. 2012
Including: Balances for which risk weights
are determined by external rating
Including: Balances for which risk weights
are determined by external rating
Risk weight: 0% 2,131.7 905.6 2,011.6 834.0
Risk weight: 10% 161.8 — 149.0 —
Risk weight: 20% 4,782.8 4,647.0 4,535.0 4,270.6
Risk weight: 35% 1,489.0 — 1,555.1 —
Risk weight: 50% 171.6 171.3 364.6 364.2
Risk weight: 75% 1,131.2 — 1,191.3 —
Risk weight: 100% 8,348.3 105.6 9,207.4 127.2
Risk weight: 150% 64.8 0.0 44.4 0.0
Risk weight: 625% — — 0.0 —
Risk weight: 1,250% — — 0.0 —
Capital deductions 7.2 — 10.0 —
Others (Note 3) 7.3 — 5.2 —
Total 18,296.2 5,829.6 19,074.0 5,596.2
Notes: 1. Figures are taking into account the effects of credit risk mitigation techniques.
2. Figures do not contain any securitization exposures.
3. “Others” includes investment funds leveraged by debt loans, etc., for which the weighted average risk weight was 238% as of
end Sept. 2011 and 220% as of end Sept. 2012.
11
Basel II Disclosure Interim Fiscal 2012
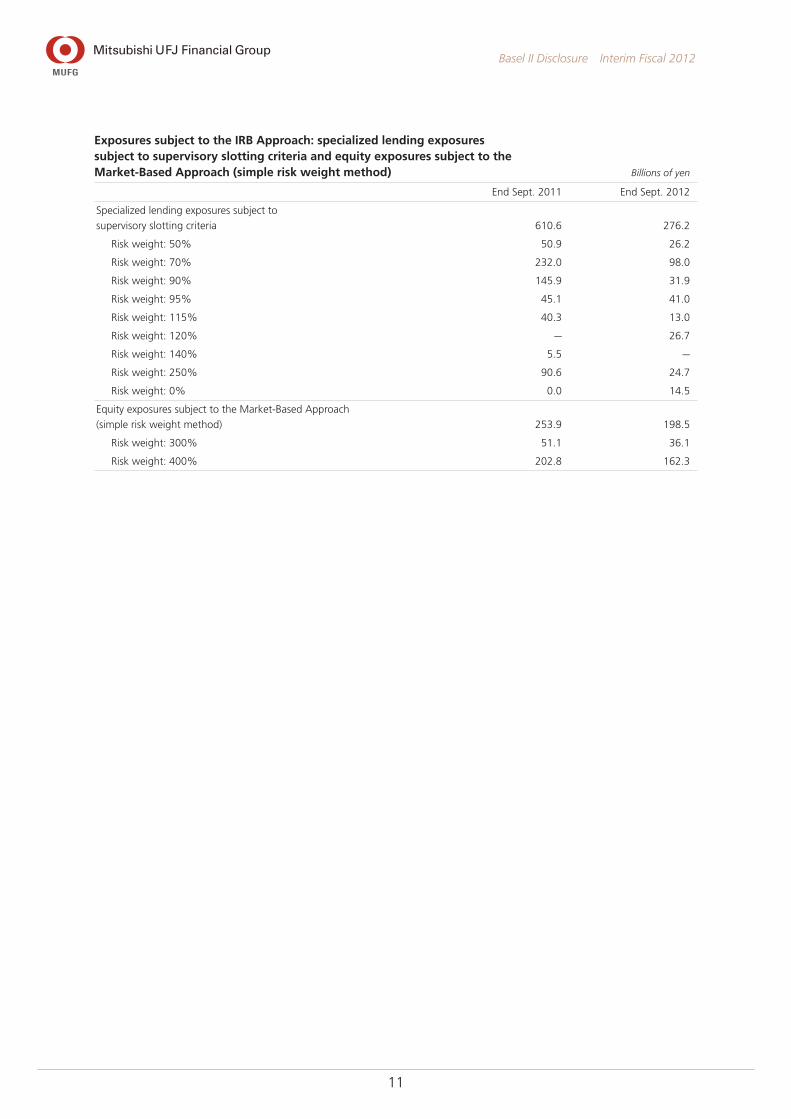
Exposures subject to the IRB Approach: specialized lending exposures subject to supervisory slotting criteria and equity exposures subject to the Market-Based Approach (simple risk weight method) Billions of yen
End Sept. 2011 End Sept. 2012
Specialized lending exposures subject to
supervisory slotting criteria 610.6 276.2
Risk weight: 50% 50.9 26.2
Risk weight: 70% 232.0 98.0
Risk weight: 90% 145.9 31.9
Risk weight: 95% 45.1 41.0
Risk weight: 115% 40.3 13.0
Risk weight: 120% — 26.7
Risk weight: 140% 5.5 —
Risk weight: 250% 90.6 24.7
Risk weight: 0% 0.0 14.5
Equity exposures subject to the Market-Based Approach
(simple risk weight method) 253.9 198.5
Risk weight: 300% 51.1 36.1
Risk weight: 400% 202.8 162.3

12
Basel II Disclosure Interim Fiscal 2012
Exposures subject to the IRB Approach: corporate exposures Billions of yen
End Sept. 2011
EAD
On balance sheet EAD
Off balance sheet EAD
Credit rating
Amount of undrawn
commitments
Weighted average factor
on undrawn commitments
Other off balance
sheet EAD
Borrower ratings 1~3 24,280.8 16,108.4 8,172.4 9,932.9 57.56% 2,455.1
Borrower ratings 4~9 37,258.8 31,974.7 5,284.1 4,937.2 57.73% 2,433.6
Borrower ratings 10~11 4,614.9 3,924.4 690.5 228.0 57.79% 558.7
Borrower ratings 12~15 1,780.6 1,692.6 88.0 10.1 57.32% 82.1
End Sept. 2011
Credit rating
Weighted average
PD
Weighted average
LGD
Weighted average
EL default
Weighted average
RW
Borrower ratings 1~3 0.13% 38.94% — 27.26%
Borrower ratings 4~9 0.86% 34.56% — 56.59%
Borrower ratings 10~11 13.35% 29.79% — 139.19%
Borrower ratings 12~15 100.00% 49.09% 46.01% 38.35%
Billions of yen
End Sept. 2012
EAD
On balance sheet EAD
Off balance sheet EAD
Credit rating
Amount of undrawn
commitments
Weighted average factor
on undrawn commitments
Other off balance
sheet EAD
Borrower ratings 1~3 24,947.9 16,704.8 8,243.1 10,533.6 56.14% 2,329.7
Borrower ratings 4~9 37,803.1 32,353.2 5,449.8 5,658.3 56.38% 2,259.6
Borrower ratings 10~11 4,970.0 4,376.6 593.4 267.3 57.16% 440.6
Borrower ratings 12~15 1,853.8 1,760.8 93.0 6.6 56.31% 89.2
End Sept. 2012
Credit rating
Weighted average
PD
Weighted average
LGD
Weighted average
EL default
Weighted average
RW
Borrower ratings 1~3 0.11% 34.88% — 23.01%
Borrower ratings 4~9 0.84% 29.86% — 47.42%
Borrower ratings 10~11 12.05% 26.32% — 118.96%
Borrower ratings 12~15 100.00% 42.14% 38.70% 46.92%
Notes: 1. Figures exclude specialized lending exposures subject to supervisory slotting criteria and any exposures relating to funds.
2. Weighted average PD and weighted average LGD represent weighted average figures based on EAD.
3. RW stands for risk weight. Risk weight is calculated by dividing the amount of credit risk-weighted assets by EAD, and does not
include any expected losses. Note that credit risk-weighted asset amounts are multiplied by 1.06.
13
Basel II Disclosure Interim Fiscal 2012
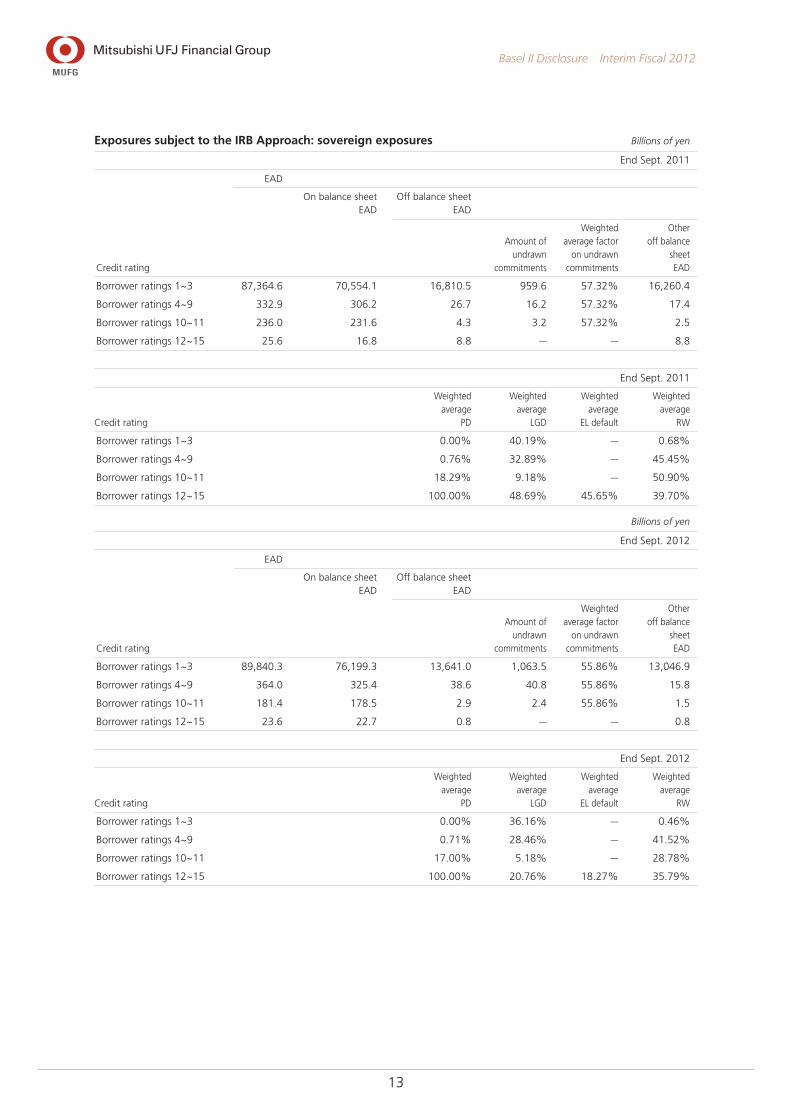
Exposures subject to the IRB Approach: sovereign exposures Billions of yen
End Sept. 2011
EAD
On balance sheet EAD
Off balance sheet EAD
Credit rating
Amount of undrawn
commitments
Weighted average factor
on undrawn commitments
Other off balance
sheet EAD
Borrower ratings 1~3 87,364.6 70,554.1 16,810.5 959.6 57.32% 16,260.4
Borrower ratings 4~9 332.9 306.2 26.7 16.2 57.32% 17.4
Borrower ratings 10~11 236.0 231.6 4.3 3.2 57.32% 2.5
Borrower ratings 12~15 25.6 16.8 8.8 — — 8.8
End Sept. 2011
Credit rating
Weighted average
PD
Weighted average
LGD
Weighted average
EL default
Weighted average
RW
Borrower ratings 1~3 0.00% 40.19% — 0.68%
Borrower ratings 4~9 0.76% 32.89% — 45.45%
Borrower ratings 10~11 18.29% 9.18% — 50.90%
Borrower ratings 12~15 100.00% 48.69% 45.65% 39.70%
Billions of yen
End Sept. 2012
EAD
On balance sheet EAD
Off balance sheet EAD
Credit rating
Amount of undrawn
commitments
Weighted average factor
on undrawn commitments
Other off balance
sheet EAD
Borrower ratings 1~3 89,840.3 76,199.3 13,641.0 1,063.5 55.86% 13,046.9
Borrower ratings 4~9 364.0 325.4 38.6 40.8 55.86% 15.8
Borrower ratings 10~11 181.4 178.5 2.9 2.4 55.86% 1.5
Borrower ratings 12~15 23.6 22.7 0.8 — — 0.8
End Sept. 2012
Credit rating
Weighted average
PD
Weighted average
LGD
Weighted average
EL default
Weighted average
RW
Borrower ratings 1~3 0.00% 36.16% — 0.46%
Borrower ratings 4~9 0.71% 28.46% — 41.52%
Borrower ratings 10~11 17.00% 5.18% — 28.78%
Borrower ratings 12~15 100.00% 20.76% 18.27% 35.79%

14
Basel II Disclosure Interim Fiscal 2012
Exposures subject to the IRB Approach: bank exposures Billions of yen
End Sept. 2011
EAD
On balance sheet EAD
Off balance sheet EAD
Credit rating
Amount of undrawn
commitments
Weighted average factor
on undrawn commitments
Other off balance
sheet EAD
Borrower ratings 1~3 6,072.7 3,599.2 2,473.5 174.2 57.32% 2,373.6
Borrower ratings 4~9 2,051.0 1,319.7 731.2 124.3 57.49% 659.7
Borrower ratings 10~11 127.4 22.1 105.3 1.2 58.78% 104.5
Borrower ratings 12~15 1.9 1.7 0.1 — — 0.1
End Sept. 2011
Credit rating
Weighted average
PD
Weighted average
LGD
Weighted average
EL default
Weighted average
RW
Borrower ratings 1~3 0.12% 34.45% — 19.91%
Borrower ratings 4~9 0.43% 35.98% — 36.66%
Borrower ratings 10~11 16.79% 24.96% — 122.95%
Borrower ratings 12~15 100.00% 80.11% 78.95% 15.35%
Billions of yen
End Sept. 2012
EAD
On balance sheet EAD
Off balance sheet EAD
Credit rating
Amount of undrawn
commitments
Weighted average factor
on undrawn commitments
Other off balance
sheet EAD
Borrower ratings 1~3 4,314.8 2,430.2 1,884.6 249.7 55.86% 1,745.1
Borrower ratings 4~9 2,698.6 1,434.4 1,264.2 102.4 55.20% 1,207.6
Borrower ratings 10~11 241.2 131.6 109.6 — — 109.6
Borrower ratings 12~15 1.5 1.5 — — — —
End Sept. 2012
Credit rating
Weighted average
PD
Weighted average
LGD
Weighted average
EL default
Weighted average
RW
Borrower ratings 1~3 0.10% 32.01% — 18.61%
Borrower ratings 4~9 0.46% 29.59% — 27.78%
Borrower ratings 10~11 11.36% 31.65% — 75.05%
Borrower ratings 12~15 100.00% 79.98% 77.98% 26.41%
15
Basel II Disclosure Interim Fiscal 2012
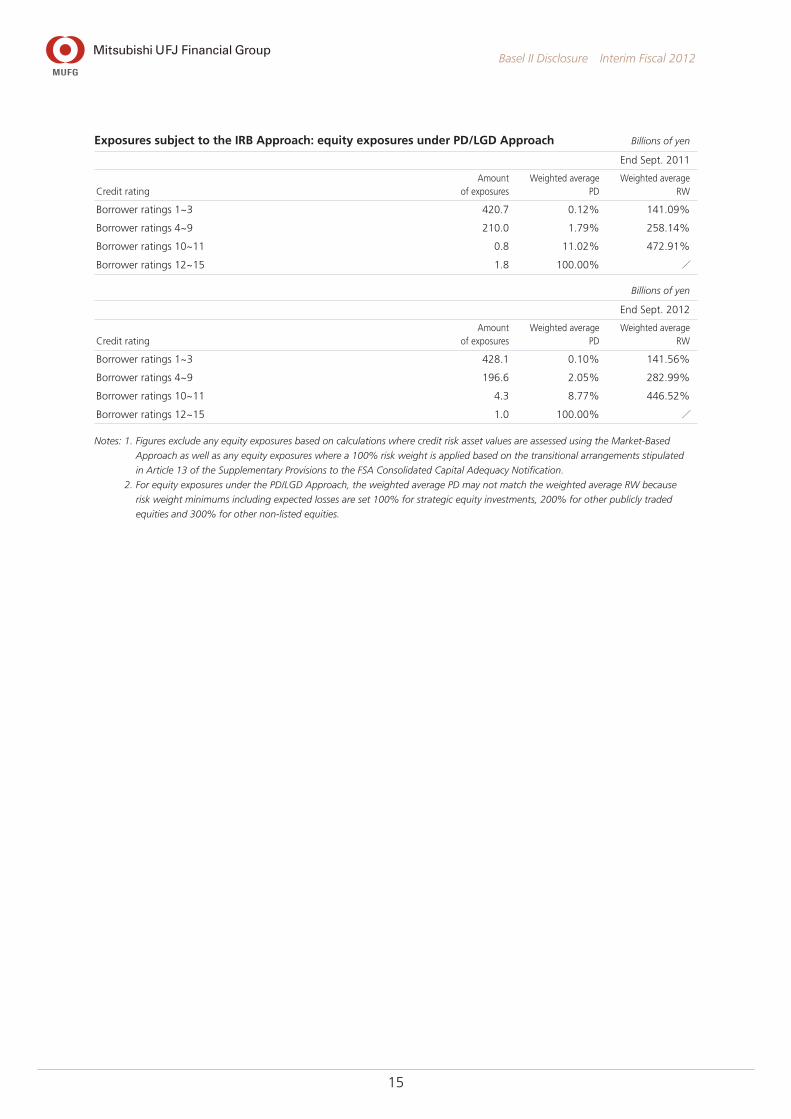
Exposures subject to the IRB Approach: equity exposures under PD/LGD Approach Billions of yen
End Sept. 2011
Credit ratingAmount
of exposuresWeighted average
PDWeighted average
RW
Borrower ratings 1~3 420.7 0.12% 141.09%
Borrower ratings 4~9 210.0 1.79% 258.14%
Borrower ratings 10~11 0.8 11.02% 472.91%
Borrower ratings 12~15 1.8 100.00% /
Billions of yen
End Sept. 2012
Credit ratingAmount
of exposuresWeighted average
PDWeighted average
RW
Borrower ratings 1~3 428.1 0.10% 141.56%
Borrower ratings 4~9 196.6 2.05% 282.99%
Borrower ratings 10~11 4.3 8.77% 446.52%
Borrower ratings 12~15 1.0 100.00% /
Notes: 1. Figures exclude any equity exposures based on calculations where credit risk asset values are assessed using the Market-Based
Approach as well as any equity exposures where a 100% risk weight is applied based on the transitional arrangements stipulated
in Article 13 of the Supplementary Provisions to the FSA Consolidated Capital Adequacy Notification.
2. For equity exposures under the PD/LGD Approach, the weighted average PD may not match the weighted average RW because
risk weight minimums including expected losses are set 100% for strategic equity investments, 200% for other publicly traded
equities and 300% for other non-listed equities.
16
Basel II Disclosure Interim Fiscal 2012
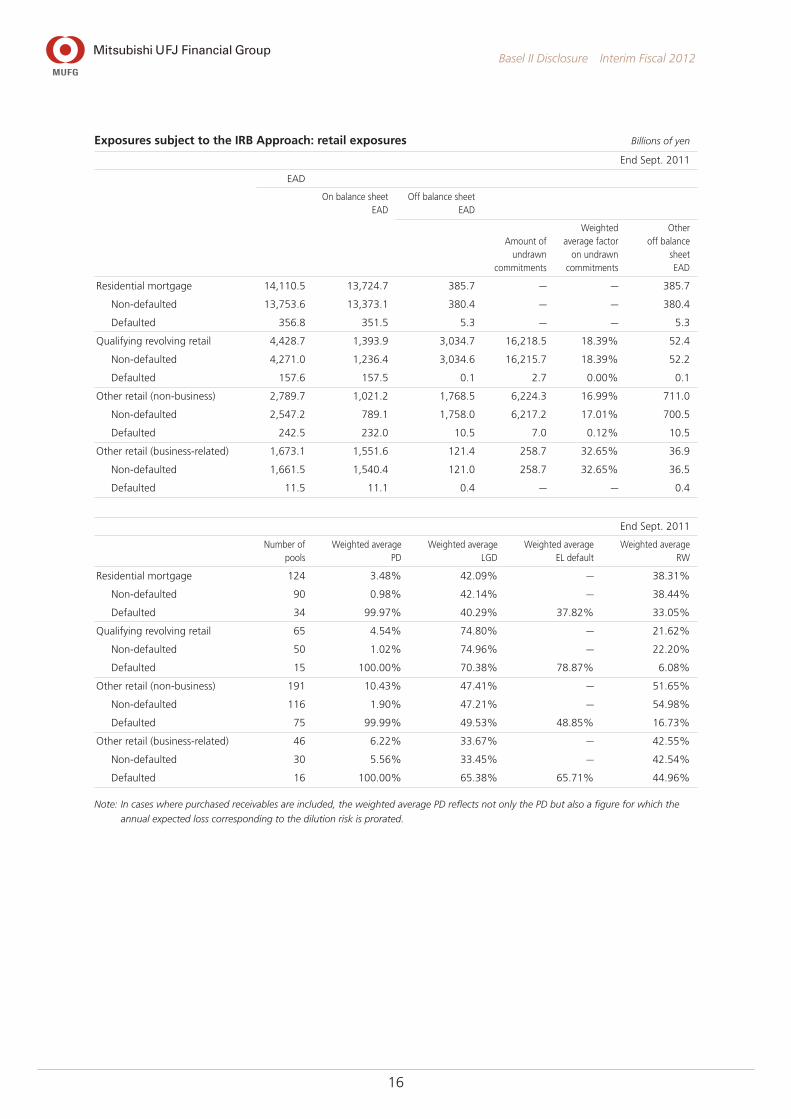
Exposures subject to the IRB Approach: retail exposures Billions of yen
End Sept. 2011
EAD
On balance sheet EAD
Off balance sheet EAD
Amount of undrawn
commitments
Weighted average factor
on undrawn commitments
Other off balance
sheet EAD
Residential mortgage 14,110.5 13,724.7 385.7 — — 385.7
Non-defaulted 13,753.6 13,373.1 380.4 — — 380.4
Defaulted 356.8 351.5 5.3 — — 5.3
Qualifying revolving retail 4,428.7 1,393.9 3,034.7 16,218.5 18.39% 52.4
Non-defaulted 4,271.0 1,236.4 3,034.6 16,215.7 18.39% 52.2
Defaulted 157.6 157.5 0.1 2.7 0.00% 0.1
Other retail (non-business) 2,789.7 1,021.2 1,768.5 6,224.3 16.99% 711.0
Non-defaulted 2,547.2 789.1 1,758.0 6,217.2 17.01% 700.5
Defaulted 242.5 232.0 10.5 7.0 0.12% 10.5
Other retail (business-related) 1,673.1 1,551.6 121.4 258.7 32.65% 36.9
Non-defaulted 1,661.5 1,540.4 121.0 258.7 32.65% 36.5
Defaulted 11.5 11.1 0.4 — — 0.4
End Sept. 2011
Number of pools
Weighted average PD
Weighted average LGD
Weighted average EL default
Weighted average RW
Residential mortgage 124 3.48% 42.09% — 38.31%
Non-defaulted 90 0.98% 42.14% — 38.44%
Defaulted 34 99.97% 40.29% 37.82% 33.05%
Qualifying revolving retail 65 4.54% 74.80% — 21.62%
Non-defaulted 50 1.02% 74.96% — 22.20%
Defaulted 15 100.00% 70.38% 78.87% 6.08%
Other retail (non-business) 191 10.43% 47.41% — 51.65%
Non-defaulted 116 1.90% 47.21% — 54.98%
Defaulted 75 99.99% 49.53% 48.85% 16.73%
Other retail (business-related) 46 6.22% 33.67% — 42.55%
Non-defaulted 30 5.56% 33.45% — 42.54%
Defaulted 16 100.00% 65.38% 65.71% 44.96%
Note: In cases where purchased receivables are included, the weighted average PD reflects not only the PD but also a figure for which the
annual expected loss corresponding to the dilution risk is prorated.
17
Basel II Disclosure Interim Fiscal 2012
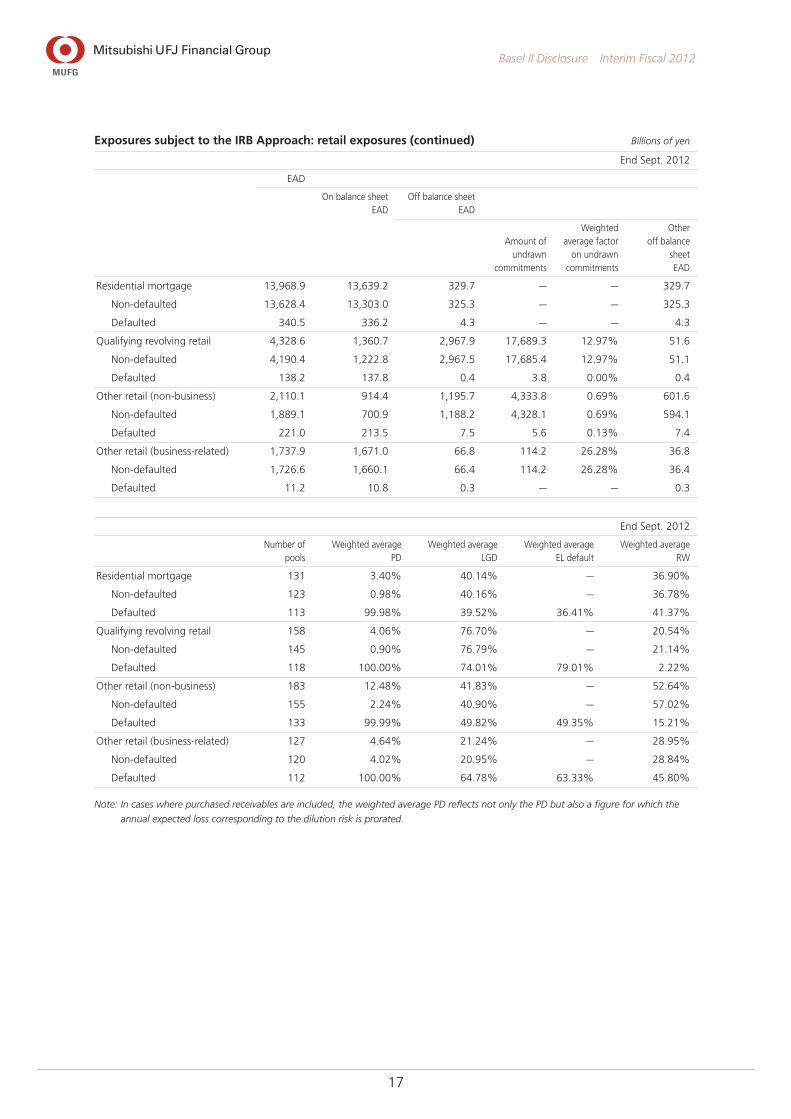
Exposures subject to the IRB Approach: retail exposures (continued) Billions of yen
End Sept. 2012
EAD
On balance sheet EAD
Off balance sheet EAD
Amount of undrawn
commitments
Weighted average factor
on undrawn commitments
Other off balance
sheet EAD
Residential mortgage 13,968.9 13,639.2 329.7 — — 329.7
Non-defaulted 13,628.4 13,303.0 325.3 — — 325.3
Defaulted 340.5 336.2 4.3 — — 4.3
Qualifying revolving retail 4,328.6 1,360.7 2,967.9 17,689.3 12.97% 51.6
Non-defaulted 4,190.4 1,222.8 2,967.5 17,685.4 12.97% 51.1
Defaulted 138.2 137.8 0.4 3.8 0.00% 0.4
Other retail (non-business) 2,110.1 914.4 1,195.7 4,333.8 0.69% 601.6
Non-defaulted 1,889.1 700.9 1,188.2 4,328.1 0.69% 594.1
Defaulted 221.0 213.5 7.5 5.6 0.13% 7.4
Other retail (business-related) 1,737.9 1,671.0 66.8 114.2 26.28% 36.8
Non-defaulted 1,726.6 1,660.1 66.4 114.2 26.28% 36.4
Defaulted 11.2 10.8 0.3 — — 0.3
End Sept. 2012
Number of pools
Weighted average PD
Weighted average LGD
Weighted average EL default
Weighted average RW
Residential mortgage 131 3.40% 40.14% — 36.90%
Non-defaulted 123 0.98% 40.16% — 36.78%
Defaulted 113 99.98% 39.52% 36.41% 41.37%
Qualifying revolving retail 158 4.06% 76.70% — 20.54%
Non-defaulted 145 0.90% 76.79% — 21.14%
Defaulted 118 100.00% 74.01% 79.01% 2.22%
Other retail (non-business) 183 12.48% 41.83% — 52.64%
Non-defaulted 155 2.24% 40.90% — 57.02%
Defaulted 133 99.99% 49.82% 49.35% 15.21%
Other retail (business-related) 127 4.64% 21.24% — 28.95%
Non-defaulted 120 4.02% 20.95% — 28.84%
Defaulted 112 100.00% 64.78% 63.33% 45.80%
Note: In cases where purchased receivables are included, the weighted average PD reflects not only the PD but also a figure for which the
annual expected loss corresponding to the dilution risk is prorated.
18
Basel II Disclosure Interim Fiscal 2012
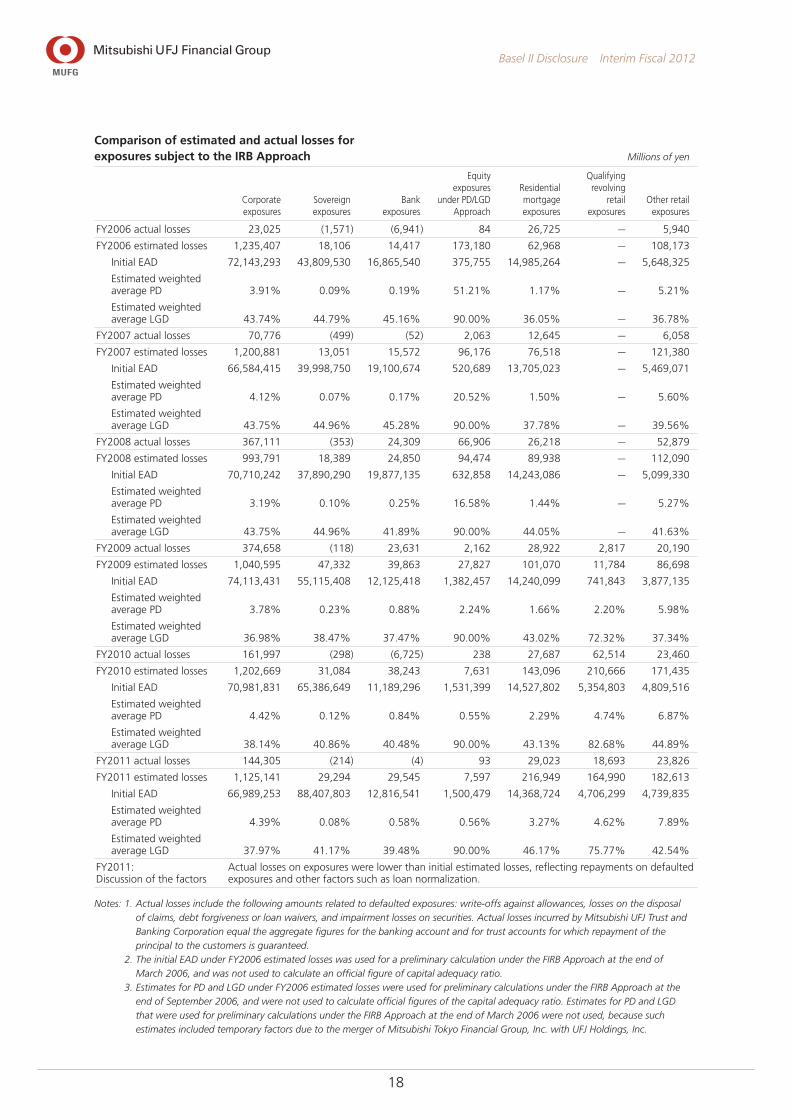
Comparison of estimated and actual losses for exposures subject to the IRB Approach Millions of yen
Corporate exposures
Sovereign exposures
Bank exposures
Equity exposures
under PD/LGD Approach
Residential mortgage exposures
Qualifying revolving
retail exposures
Other retail exposures
FY2006 actual losses 23,025 (1,571) (6,941) 84 26,725 — 5,940
FY2006 estimated losses 1,235,407 18,106 14,417 173,180 62,968 — 108,173
Initial EAD 72,143,293 43,809,530 16,865,540 375,755 14,985,264 — 5,648,325
Estimated weighted average PD 3.91% 0.09% 0.19% 51.21% 1.17% — 5.21%
Estimated weighted average LGD 43.74% 44.79% 45.16% 90.00% 36.05% — 36.78%
FY2007 actual losses 70,776 (499) (52) 2,063 12,645 — 6,058
FY2007 estimated losses 1,200,881 13,051 15,572 96,176 76,518 — 121,380
Initial EAD 66,584,415 39,998,750 19,100,674 520,689 13,705,023 — 5,469,071
Estimated weighted average PD 4.12% 0.07% 0.17% 20.52% 1.50% — 5.60%
Estimated weighted average LGD 43.75% 44.96% 45.28% 90.00% 37.78% — 39.56%
FY2008 actual losses 367,111 (353) 24,309 66,906 26,218 — 52,879
FY2008 estimated losses 993,791 18,389 24,850 94,474 89,938 — 112,090
Initial EAD 70,710,242 37,890,290 19,877,135 632,858 14,243,086 — 5,099,330
Estimated weighted average PD 3.19% 0.10% 0.25% 16.58% 1.44% — 5.27%
Estimated weighted average LGD 43.75% 44.96% 41.89% 90.00% 44.05% — 41.63%
FY2009 actual losses 374,658 (118) 23,631 2,162 28,922 2,817 20,190
FY2009 estimated losses 1,040,595 47,332 39,863 27,827 101,070 11,784 86,698
Initial EAD 74,113,431 55,115,408 12,125,418 1,382,457 14,240,099 741,843 3,877,135
Estimated weighted average PD 3.78% 0.23% 0.88% 2.24% 1.66% 2.20% 5.98%
Estimated weighted average LGD 36.98% 38.47% 37.47% 90.00% 43.02% 72.32% 37.34%
FY2010 actual losses 161,997 (298) (6,725) 238 27,687 62,514 23,460
FY2010 estimated losses 1,202,669 31,084 38,243 7,631 143,096 210,666 171,435
Initial EAD 70,981,831 65,386,649 11,189,296 1,531,399 14,527,802 5,354,803 4,809,516
Estimated weighted average PD 4.42% 0.12% 0.84% 0.55% 2.29% 4.74% 6.87%
Estimated weighted average LGD 38.14% 40.86% 40.48% 90.00% 43.13% 82.68% 44.89%
FY2011 actual losses 144,305 (214) (4) 93 29,023 18,693 23,826
FY2011 estimated losses 1,125,141 29,294 29,545 7,597 216,949 164,990 182,613
Initial EAD 66,989,253 88,407,803 12,816,541 1,500,479 14,368,724 4,706,299 4,739,835
Estimated weighted average PD 4.39% 0.08% 0.58% 0.56% 3.27% 4.62% 7.89%
Estimated weighted average LGD 37.97% 41.17% 39.48% 90.00% 46.17% 75.77% 42.54%
FY2011: Discussion of the factors
Actual losses on exposures were lower than initial estimated losses, reflecting repayments on defaulted exposures and other factors such as loan normalization.
Notes: 1. Actual losses include the following amounts related to defaulted exposures: write-offs against allowances, losses on the disposal of claims, debt forgiveness or loan waivers, and impairment losses on securities. Actual losses incurred by Mitsubishi UFJ Trust and Banking Corporation equal the aggregate figures for the banking account and for trust accounts for which repayment of the principal to the customers is guaranteed.
2. The initial EAD under FY2006 estimated losses was used for a preliminary calculation under the FIRB Approach at the end of March 2006, and was not used to calculate an official figure of capital adequacy ratio.
3. Estimates for PD and LGD under FY2006 estimated losses were used for preliminary calculations under the FIRB Approach at the end of September 2006, and were not used to calculate official figures of the capital adequacy ratio. Estimates for PD and LGD that were used for preliminary calculations under the FIRB Approach at the end of March 2006 were not used, because such estimates included temporary factors due to the merger of Mitsubishi Tokyo Financial Group, Inc. with UFJ Holdings, Inc.

19
Basel II Disclosure Interim Fiscal 2012
Credit Risk Mitigation
Exposures subject to application of credit risk mitigation techniques Billions of yen
End Sept. 2011
Eligible financial collateral Guarantees
Credit derivatives
Portfolios under the AIRB Approach / 5,138.0 312.7
Corporate exposures / 3,321.2 304.0
Sovereign exposures / 569.9 7.4
Bank exposures / 750.0 1.2
Residential mortgage exposures / — —
Qualifying revolving retail exposures / — —
Other retail exposures / 496.8 —
Portfolios under the Standardized Approach 9,135.0 361.6 —
Billions of yen
End Sept. 2012
Eligible financial collateral Guarantees
Credit derivatives
Portfolios under the AIRB Approach / 5,006.8 218.9
Corporate exposures / 3,306.3 214.5
Sovereign exposures / 489.6 1.2
Bank exposures / 698.8 3.0
Residential mortgage exposures / — —
Qualifying revolving retail exposures / — —
Other retail exposures / 512.0 —
Portfolios under the Standardized Approach 7,089.6 222.0 —
Note: Eligible financial collateral includes collateral for repo transactions but does not include deposits in our banks subject to on balance
sheet netting.
20
Basel II Disclosure Interim Fiscal 2012
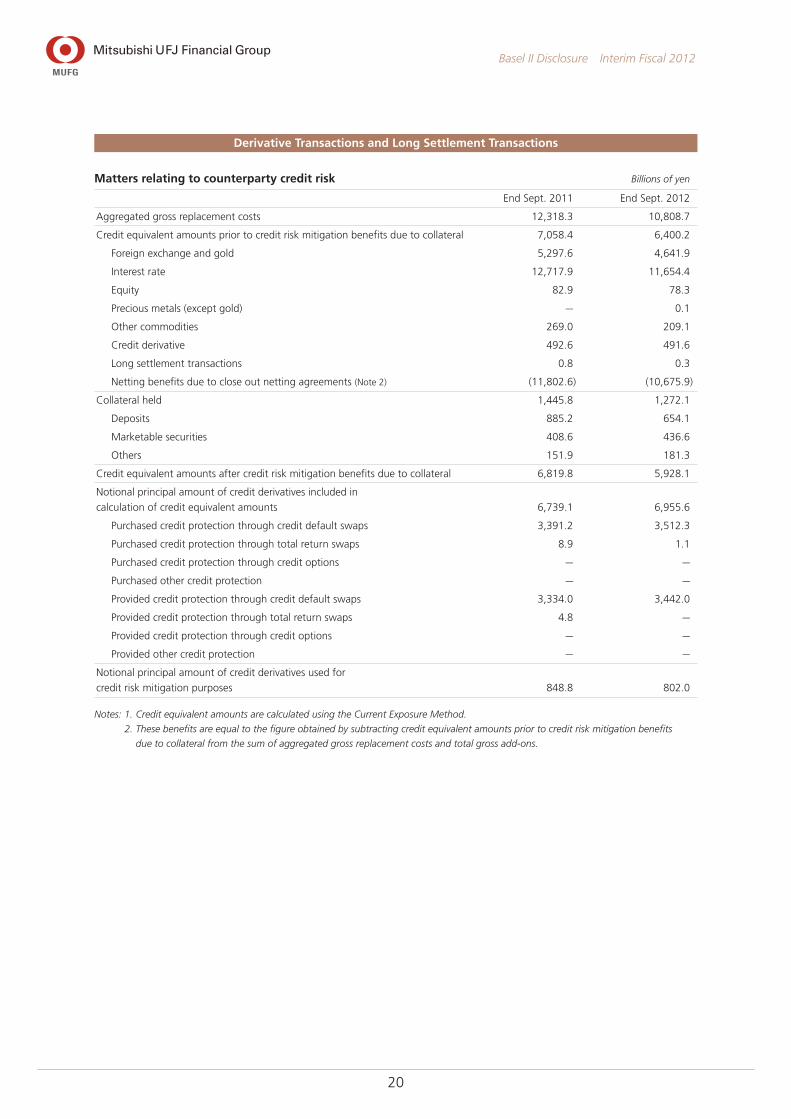
Derivative Transactions and Long Settlement Transactions
Matters relating to counterparty credit risk Billions of yen
End Sept. 2011 End Sept. 2012
Aggregated gross replacement costs 12,318.3 10,808.7
Credit equivalent amounts prior to credit risk mitigation benefits due to collateral 7,058.4 6,400.2
Foreign exchange and gold 5,297.6 4,641.9
Interest rate 12,717.9 11,654.4
Equity 82.9 78.3
Precious metals (except gold) — 0.1
Other commodities 269.0 209.1
Credit derivative 492.6 491.6
Long settlement transactions 0.8 0.3
Netting benefits due to close out netting agreements (Note 2) (11,802.6) (10,675.9)
Collateral held 1,445.8 1,272.1
Deposits 885.2 654.1
Marketable securities 408.6 436.6
Others 151.9 181.3
Credit equivalent amounts after credit risk mitigation benefits due to collateral 6,819.8 5,928.1
Notional principal amount of credit derivatives included in
calculation of credit equivalent amounts 6,739.1 6,955.6
Purchased credit protection through credit default swaps 3,391.2 3,512.3
Purchased credit protection through total return swaps 8.9 1.1
Purchased credit protection through credit options — —
Purchased other credit protection — —
Provided credit protection through credit default swaps 3,334.0 3,442.0
Provided credit protection through total return swaps 4.8 —
Provided credit protection through credit options — —
Provided other credit protection — —
Notional principal amount of credit derivatives used for
credit risk mitigation purposes 848.8 802.0
Notes: 1. Credit equivalent amounts are calculated using the Current Exposure Method.
2. These benefits are equal to the figure obtained by subtracting credit equivalent amounts prior to credit risk mitigation benefits
due to collateral from the sum of aggregated gross replacement costs and total gross add-ons.

21
Basel II Disclosure Interim Fiscal 2012
Securitization Exposures (Subject to calculation of credit risk assets)
Information on underlying assets Billions of yen
End Sept. 2011 FY2011 H1
Amount of underlying assets at period-end (Note 1)
Cumulative amount of underlying assets in default or contractually
past due 3 months or more
Underlying assets relating to
retained securitization
exposures
Underlying assets relating to
securitization transactions
during this period with no retained
securitization exposures (Note 2)
Underlying assets relating to
retained securitization
exposures
Underlying assets relating to
securitization transactions
during this period with no retained
securitization exposures (Note 3)
Losses on underlying assets
incurred during this period (Note 4)
Traditional securitizations
(asset transfer type) 2,029.6 — 10.8 — 3.7
Residential mortgage 1,852.6 — 9.3 — 3.5
Apartment loan 141.6 — 1.3 — 0.1
Credit card receivables — — — — —
Other assets 35.2 — 0.1 — —
Synthetic securitizations — — — — —
Residential mortgage — — — — —
Apartment loan — — — — —
Credit card receivables — — — — —
Other assets — — — — —
Sponsor of asset-backed
commercial paper (ABCP) program 18,718.7 — 342.8 383.8 375.6
Residential mortgage — — — — —
Apartment loan — — — — —
Credit card receivables 10,535.8 — 183.9 255.0 310.6
Account receivables 5,474.0 — 156.2 122.5 59.0
Leasing receivables 778.0 — 0.0 0.0 3.0
Other assets 1,930.8 — 2.6 6.1 2.9
Total as an originator 20,748.3 — 353.6 383.8 379.3
Notes: 1. The amount of underlying assets relating to the sponsor of ABCP programs includes underlying assets related to ABCP programs
sponsored by multiple financial institutions, including certain consolidated subsidiaries of MUFG.
2. The amount of underlying assets refers only to those cases in which the securitization exposures associated with a securitization
conducted during this period was wholly transferred to third parties.
3. Figures show cumulative totals for this period of underlying assets either in default or contractually past due 3 months or more
arising from securitization transactions in cases where the securitization exposures associated with a transaction conducted
during this period was wholly transferred to third parties, or where no exposure was retained at the end of this period from a
securitization conducted during this period due to related maturity.
4. Losses with traditional or synthetic securitizations are based on the projected accounting losses for holding the underlying assets
without conducting the relevant securitization. With the sponsor of ABCP programs, since it is extremely rare for such schemes to
result in losses on any retained securitization exposure, it is difficult to obtain generally relevant information relating to losses as
based on certain definitions. These figures therefore aggregate cases where actual economic losses have been recognized with
cases where the loss has been valued on the same basis as the underlying defaulted assets. Losses on underlying assets relating to
the sponsor of ABCP programs differ from losses incurred by MUFG.
22
Basel II Disclosure Interim Fiscal 2012
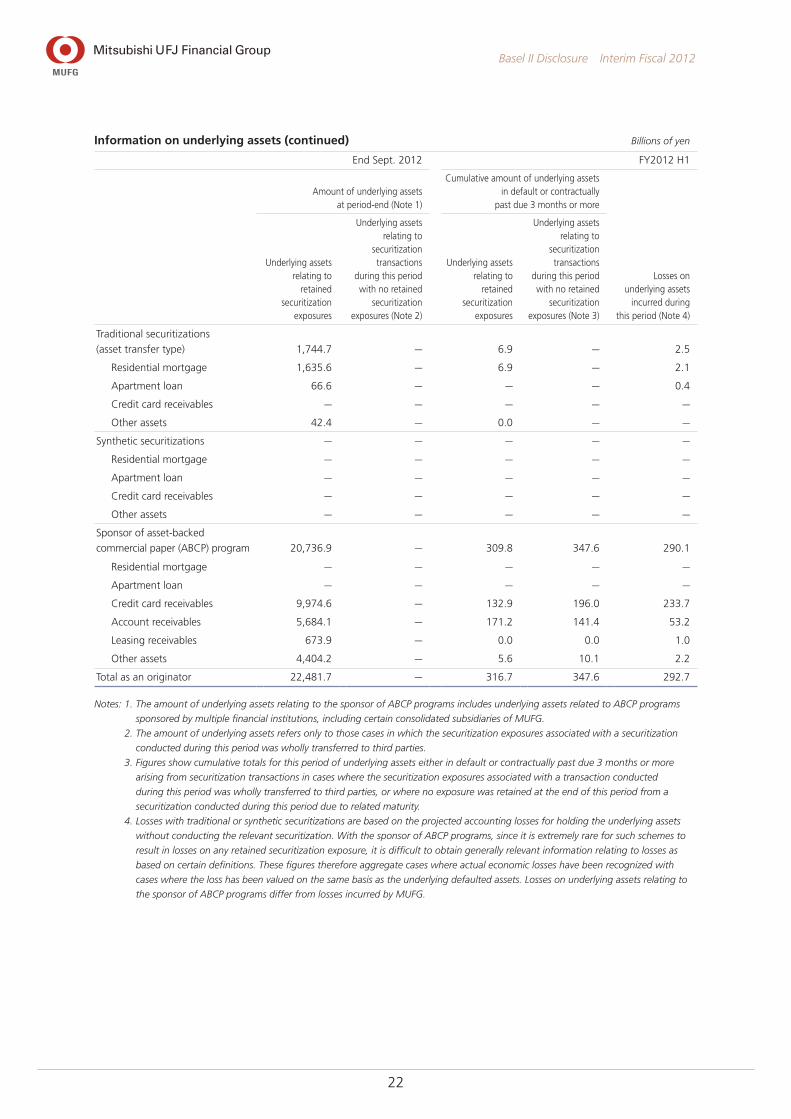
Information on underlying assets (continued) Billions of yen
End Sept. 2012 FY2012 H1
Amount of underlying assets at period-end (Note 1)
Cumulative amount of underlying assets in default or contractually
past due 3 months or more
Underlying assets relating to
retained securitization
exposures
Underlying assets relating to
securitization transactions
during this period with no retained
securitization exposures (Note 2)
Underlying assets relating to
retained securitization
exposures
Underlying assets relating to
securitization transactions
during this period with no retained
securitization exposures (Note 3)
Losses on underlying assets
incurred during this period (Note 4)
Traditional securitizations
(asset transfer type) 1,744.7 — 6.9 — 2.5
Residential mortgage 1,635.6 — 6.9 — 2.1
Apartment loan 66.6 — — — 0.4
Credit card receivables — — — — —
Other assets 42.4 — 0.0 — —
Synthetic securitizations — — — — —
Residential mortgage — — — — —
Apartment loan — — — — —
Credit card receivables — — — — —
Other assets — — — — —
Sponsor of asset-backed
commercial paper (ABCP) program 20,736.9 — 309.8 347.6 290.1
Residential mortgage — — — — —
Apartment loan — — — — —
Credit card receivables 9,974.6 — 132.9 196.0 233.7
Account receivables 5,684.1 — 171.2 141.4 53.2
Leasing receivables 673.9 — 0.0 0.0 1.0
Other assets 4,404.2 — 5.6 10.1 2.2
Total as an originator 22,481.7 — 316.7 347.6 292.7
Notes: 1. The amount of underlying assets relating to the sponsor of ABCP programs includes underlying assets related to ABCP programs
sponsored by multiple financial institutions, including certain consolidated subsidiaries of MUFG.
2. The amount of underlying assets refers only to those cases in which the securitization exposures associated with a securitization
conducted during this period was wholly transferred to third parties.
3. Figures show cumulative totals for this period of underlying assets either in default or contractually past due 3 months or more
arising from securitization transactions in cases where the securitization exposures associated with a transaction conducted
during this period was wholly transferred to third parties, or where no exposure was retained at the end of this period from a
securitization conducted during this period due to related maturity.
4. Losses with traditional or synthetic securitizations are based on the projected accounting losses for holding the underlying assets
without conducting the relevant securitization. With the sponsor of ABCP programs, since it is extremely rare for such schemes to
result in losses on any retained securitization exposure, it is difficult to obtain generally relevant information relating to losses as
based on certain definitions. These figures therefore aggregate cases where actual economic losses have been recognized with
cases where the loss has been valued on the same basis as the underlying defaulted assets. Losses on underlying assets relating to
the sponsor of ABCP programs differ from losses incurred by MUFG.

23
Basel II Disclosure Interim Fiscal 2012
Information on underlying assets (continued) Billions of yen
FY2011 H1 FY2012 H1
Cumulative amount of underlying assets
securitized during the period
Recognized gains or losses
in this period arising from securitization
transactions
Cumulative amount of underlying assets
securitized during the period
Recognized gains or losses
in this period arising from securitization
transactions
Traditional securitizations
(asset transfer type) — — — —
Residential mortgage — — — —
Apartment loan — — — —
Credit card receivables — — — —
Other assets — — — —
Synthetic securitizations — / — /
Residential mortgage — / — /
Apartment loan — / — /
Credit card receivables — / — /
Other assets — / — /
Sponsor of asset-backed
commercial paper (ABCP)
program 49,585.4 / 57,429.9 /
Residential mortgage — / — /
Apartment loan — / — /
Credit card receivables 12,857.3 / 14,336.5 /
Account receivables 36,086.9 / 41,770.3 /
Leasing receivables 123.0 / 351.5 /
Other assets 518.1 / 971.5 /
Total as an originator 49,585.4 — 57,429.9 —
(Amount of assets held for the purpose of securitization) Billions of yen
End Sept. 2012
Banking accountsSpecified trading
accounts Total
Residential mortgage 2.1 — 2.1
Apartment loan — — —
Credit card receivables — — —
Account receivables — — —
Leasing receivables — — —
Other assets — — —
Total 2.1 — 2.1
24
Basel II Disclosure Interim Fiscal 2012
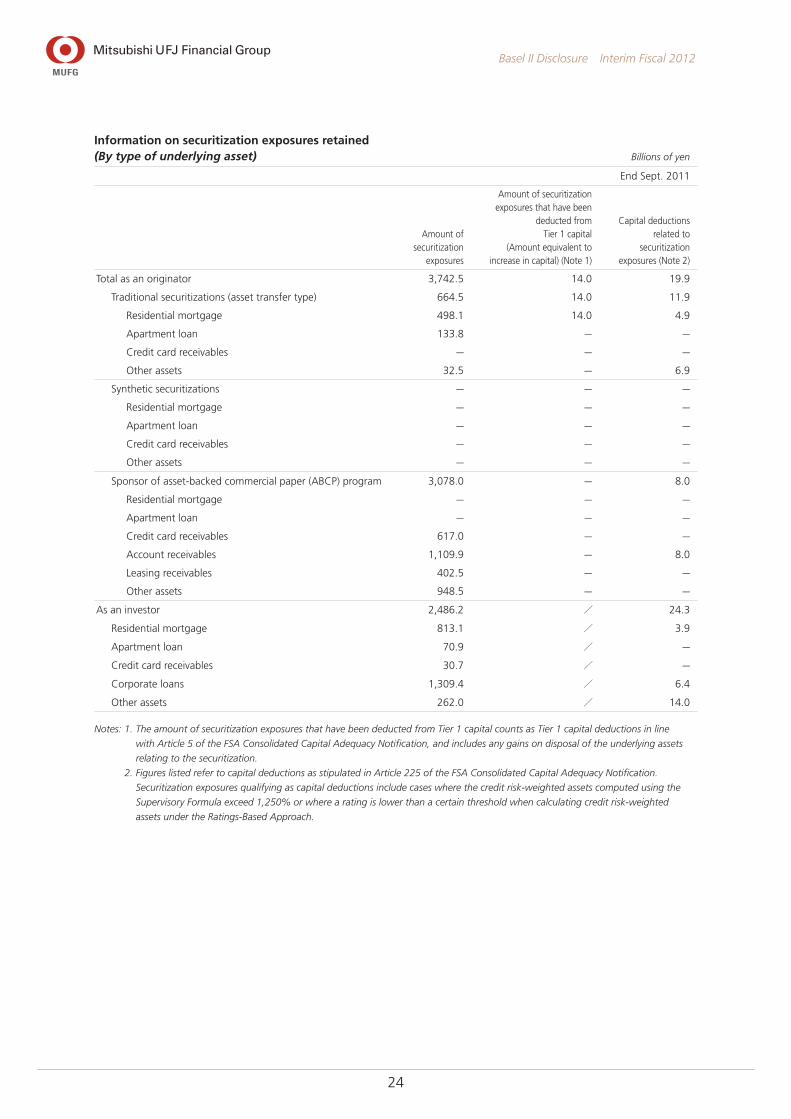
Information on securitization exposures retained (By type of underlying asset) Billions of yen
End Sept. 2011
Amount of securitization
exposures
Amount of securitization exposures that have been
deducted from Tier 1 capital
(Amount equivalent to increase in capital) (Note 1)
Capital deductions related to
securitization exposures (Note 2)
Total as an originator 3,742.5 14.0 19.9
Traditional securitizations (asset transfer type) 664.5 14.0 11.9
Residential mortgage 498.1 14.0 4.9
Apartment loan 133.8 — —
Credit card receivables — — —
Other assets 32.5 — 6.9
Synthetic securitizations — — —
Residential mortgage — — —
Apartment loan — — —
Credit card receivables — — —
Other assets — — —
Sponsor of asset-backed commercial paper (ABCP) program 3,078.0 — 8.0
Residential mortgage — — —
Apartment loan — — —
Credit card receivables 617.0 — —
Account receivables 1,109.9 — 8.0
Leasing receivables 402.5 — —
Other assets 948.5 — —
As an investor 2,486.2 / 24.3
Residential mortgage 813.1 / 3.9
Apartment loan 70.9 / —
Credit card receivables 30.7 / —
Corporate loans 1,309.4 / 6.4
Other assets 262.0 / 14.0
Notes: 1. The amount of securitization exposures that have been deducted from Tier 1 capital counts as Tier 1 capital deductions in line
with Article 5 of the FSA Consolidated Capital Adequacy Notification, and includes any gains on disposal of the underlying assets
relating to the securitization.
2. Figures listed refer to capital deductions as stipulated in Article 225 of the FSA Consolidated Capital Adequacy Notification.
Securitization exposures qualifying as capital deductions include cases where the credit risk-weighted assets computed using the
Supervisory Formula exceed 1,250% or where a rating is lower than a certain threshold when calculating credit risk-weighted
assets under the Ratings-Based Approach.
25
Basel II Disclosure Interim Fiscal 2012
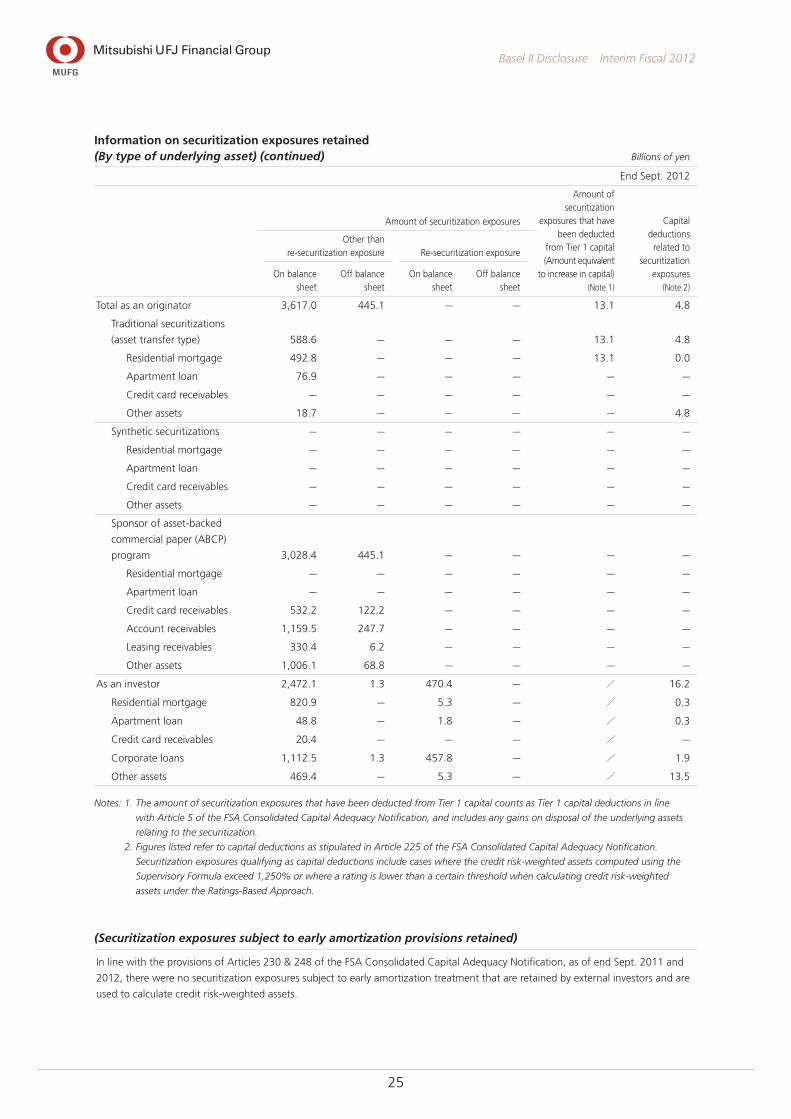
Information on securitization exposures retained (By type of underlying asset) (continued) Billions of yen
End Sept. 2012
Amount of securitization exposures
Amount of securitization
exposures that have been deducted
from Tier 1 capital (Amount equivalent
to increase in capital) (Note 1)
Capital deductions
related to securitization
exposures (Note 2)
Other than re-securitization exposure Re-securitization exposure
On balance sheet
Off balance sheet
On balance sheet
Off balance sheet
Total as an originator 3,617.0 445.1 — — 13.1 4.8
Traditional securitizations
(asset transfer type) 588.6 — — — 13.1 4.8
Residential mortgage 492.8 — — — 13.1 0.0
Apartment loan 76.9 — — — — —
Credit card receivables — — — — — —
Other assets 18.7 — — — — 4.8
Synthetic securitizations — — — — — —
Residential mortgage — — — — — —
Apartment loan — — — — — —
Credit card receivables — — — — — —
Other assets — — — — — —
Sponsor of asset-backed
commercial paper (ABCP)
program 3,028.4 445.1 — — — —
Residential mortgage — — — — — —
Apartment loan — — — — — —
Credit card receivables 532.2 122.2 — — — —
Account receivables 1,159.5 247.7 — — — —
Leasing receivables 330.4 6.2 — — — —
Other assets 1,006.1 68.8 — — — —
As an investor 2,472.1 1.3 470.4 — / 16.2
Residential mortgage 820.9 — 5.3 — / 0.3
Apartment loan 48.8 — 1.8 — / 0.3
Credit card receivables 20.4 — — — / —
Corporate loans 1,112.5 1.3 457.8 — / 1.9
Other assets 469.4 — 5.3 — / 13.5
Notes: 1. The amount of securitization exposures that have been deducted from Tier 1 capital counts as Tier 1 capital deductions in line
with Article 5 of the FSA Consolidated Capital Adequacy Notification, and includes any gains on disposal of the underlying assets
relating to the securitization.
2. Figures listed refer to capital deductions as stipulated in Article 225 of the FSA Consolidated Capital Adequacy Notification.
Securitization exposures qualifying as capital deductions include cases where the credit risk-weighted assets computed using the
Supervisory Formula exceed 1,250% or where a rating is lower than a certain threshold when calculating credit risk-weighted
assets under the Ratings-Based Approach.
(Securitization exposures subject to early amortization provisions retained)
In line with the provisions of Articles 230 & 248 of the FSA Consolidated Capital Adequacy Notification, as of end Sept. 2011 and
2012, there were no securitization exposures subject to early amortization treatment that are retained by external investors and are
used to calculate credit risk-weighted assets.
26
Basel II Disclosure Interim Fiscal 2012
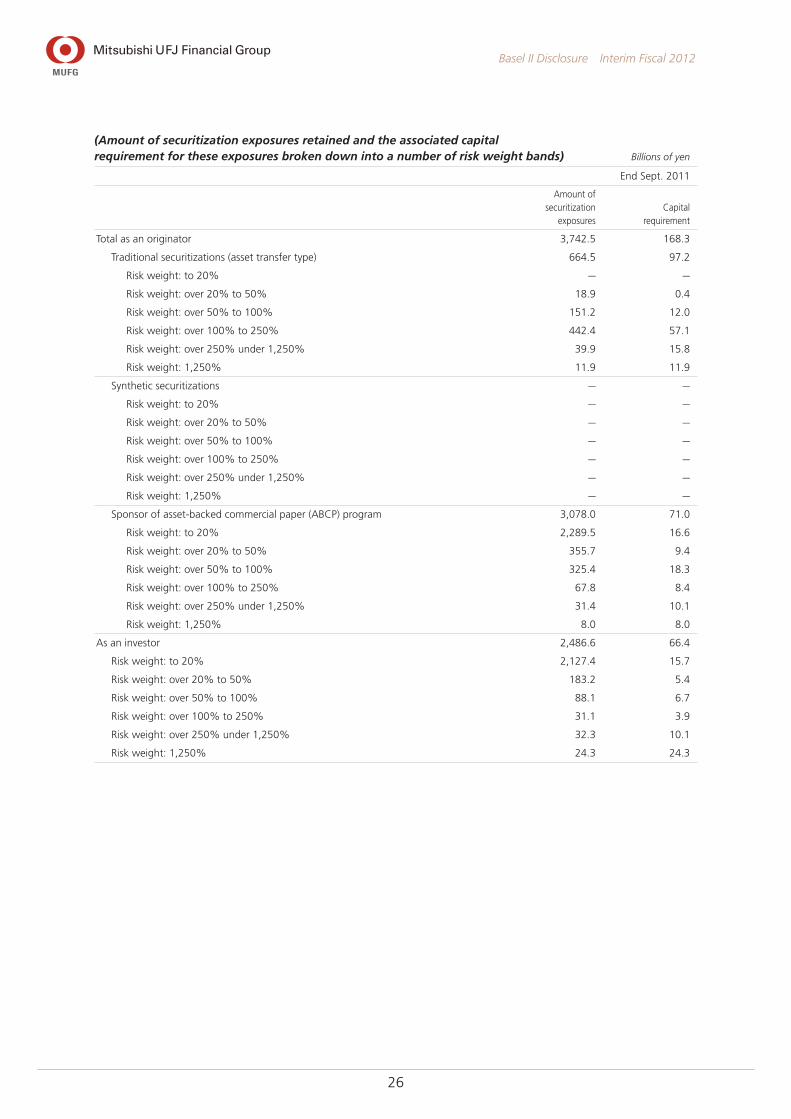
(Amount of securitization exposures retained and the associated capital requirement for these exposures broken down into a number of risk weight bands) Billions of yen
End Sept. 2011
Amount of securitization
exposuresCapital
requirement
Total as an originator 3,742.5 168.3
Traditional securitizations (asset transfer type) 664.5 97.2
Risk weight: to 20% — —
Risk weight: over 20% to 50% 18.9 0.4
Risk weight: over 50% to 100% 151.2 12.0
Risk weight: over 100% to 250% 442.4 57.1
Risk weight: over 250% under 1,250% 39.9 15.8
Risk weight: 1,250% 11.9 11.9
Synthetic securitizations — —
Risk weight: to 20% — —
Risk weight: over 20% to 50% — —
Risk weight: over 50% to 100% — —
Risk weight: over 100% to 250% — —
Risk weight: over 250% under 1,250% — —
Risk weight: 1,250% — —
Sponsor of asset-backed commercial paper (ABCP) program 3,078.0 71.0
Risk weight: to 20% 2,289.5 16.6
Risk weight: over 20% to 50% 355.7 9.4
Risk weight: over 50% to 100% 325.4 18.3
Risk weight: over 100% to 250% 67.8 8.4
Risk weight: over 250% under 1,250% 31.4 10.1
Risk weight: 1,250% 8.0 8.0
As an investor 2,486.6 66.4
Risk weight: to 20% 2,127.4 15.7
Risk weight: over 20% to 50% 183.2 5.4
Risk weight: over 50% to 100% 88.1 6.7
Risk weight: over 100% to 250% 31.1 3.9
Risk weight: over 250% under 1,250% 32.3 10.1
Risk weight: 1,250% 24.3 24.3
27
Basel II Disclosure Interim Fiscal 2012
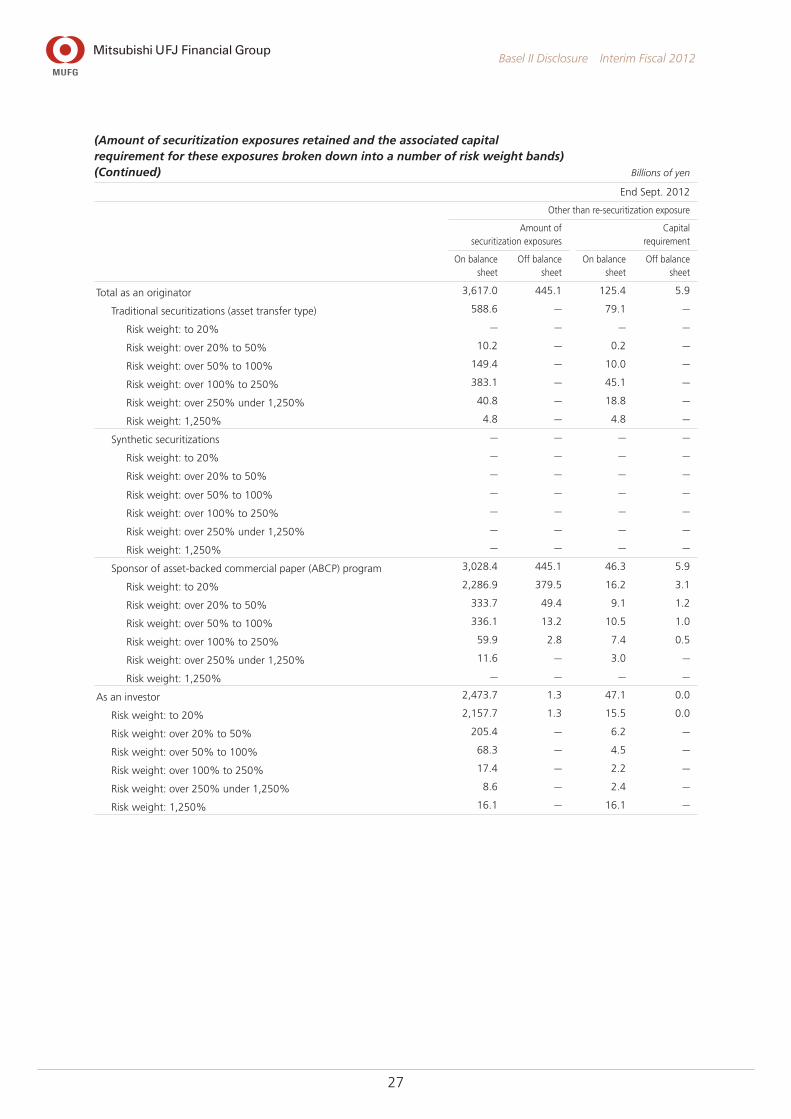
(Amount of securitization exposures retained and the associated capital requirement for these exposures broken down into a number of risk weight bands) (Continued) Billions of yen
End Sept. 2012
Other than re-securitization exposure
Amount of securitization exposures
Capital requirement
On balance sheet
Off balance sheet
On balance sheet
Off balance sheet
Total as an originator 3,617.0 445.1 125.4 5.9
Traditional securitizations (asset transfer type) 588.6 — 79.1 —
Risk weight: to 20% — — — —
Risk weight: over 20% to 50% 10.2 — 0.2 —
Risk weight: over 50% to 100% 149.4 — 10.0 —
Risk weight: over 100% to 250% 383.1 — 45.1 —
Risk weight: over 250% under 1,250% 40.8 — 18.8 —
Risk weight: 1,250% 4.8 — 4.8 —
Synthetic securitizations — — — —
Risk weight: to 20% — — — —
Risk weight: over 20% to 50% — — — —
Risk weight: over 50% to 100% — — — —
Risk weight: over 100% to 250% — — — —
Risk weight: over 250% under 1,250% — — — —
Risk weight: 1,250% — — — —
Sponsor of asset-backed commercial paper (ABCP) program 3,028.4 445.1 46.3 5.9
Risk weight: to 20% 2,286.9 379.5 16.2 3.1
Risk weight: over 20% to 50% 333.7 49.4 9.1 1.2
Risk weight: over 50% to 100% 336.1 13.2 10.5 1.0
Risk weight: over 100% to 250% 59.9 2.8 7.4 0.5
Risk weight: over 250% under 1,250% 11.6 — 3.0 —
Risk weight: 1,250% — — — —
As an investor 2,473.7 1.3 47.1 0.0
Risk weight: to 20% 2,157.7 1.3 15.5 0.0
Risk weight: over 20% to 50% 205.4 — 6.2 —
Risk weight: over 50% to 100% 68.3 — 4.5 —
Risk weight: over 100% to 250% 17.4 — 2.2 —
Risk weight: over 250% under 1,250% 8.6 — 2.4 —
Risk weight: 1,250% 16.1 — 16.1 —
28
Basel II Disclosure Interim Fiscal 2012
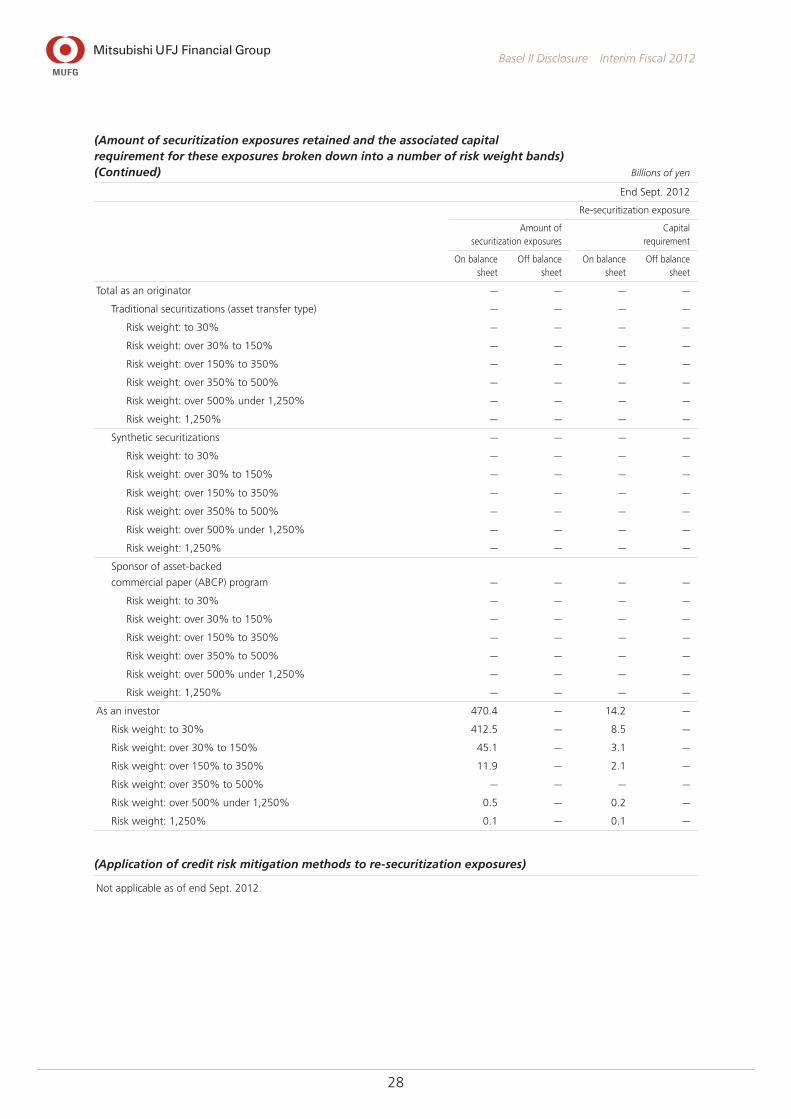
(Amount of securitization exposures retained and the associated capital requirement for these exposures broken down into a number of risk weight bands) (Continued) Billions of yen
End Sept. 2012
Re-securitization exposure
Amount of securitization exposures
Capital requirement
On balance sheet
Off balance sheet
On balance sheet
Off balance sheet
Total as an originator — — — —
Traditional securitizations (asset transfer type) — — — —
Risk weight: to 30% — — — —
Risk weight: over 30% to 150% — — — —
Risk weight: over 150% to 350% — — — —
Risk weight: over 350% to 500% — — — —
Risk weight: over 500% under 1,250% — — — —
Risk weight: 1,250% — — — —
Synthetic securitizations — — — —
Risk weight: to 30% — — — —
Risk weight: over 30% to 150% — — — —
Risk weight: over 150% to 350% — — — —
Risk weight: over 350% to 500% — — — —
Risk weight: over 500% under 1,250% — — — —
Risk weight: 1,250% — — — —
Sponsor of asset-backed
commercial paper (ABCP) program — — — —
Risk weight: to 30% — — — —
Risk weight: over 30% to 150% — — — —
Risk weight: over 150% to 350% — — — —
Risk weight: over 350% to 500% — — — —
Risk weight: over 500% under 1,250% — — — —
Risk weight: 1,250% — — — —
As an investor 470.4 — 14.2 —
Risk weight: to 30% 412.5 — 8.5 —
Risk weight: over 30% to 150% 45.1 — 3.1 —
Risk weight: over 150% to 350% 11.9 — 2.1 —
Risk weight: over 350% to 500% — — — —
Risk weight: over 500% under 1,250% 0.5 — 0.2 —
Risk weight: 1,250% 0.1 — 0.1 —
(Application of credit risk mitigation methods to re-securitization exposures)
Not applicable as of end Sept. 2012.
29
Basel II Disclosure Interim Fiscal 2012
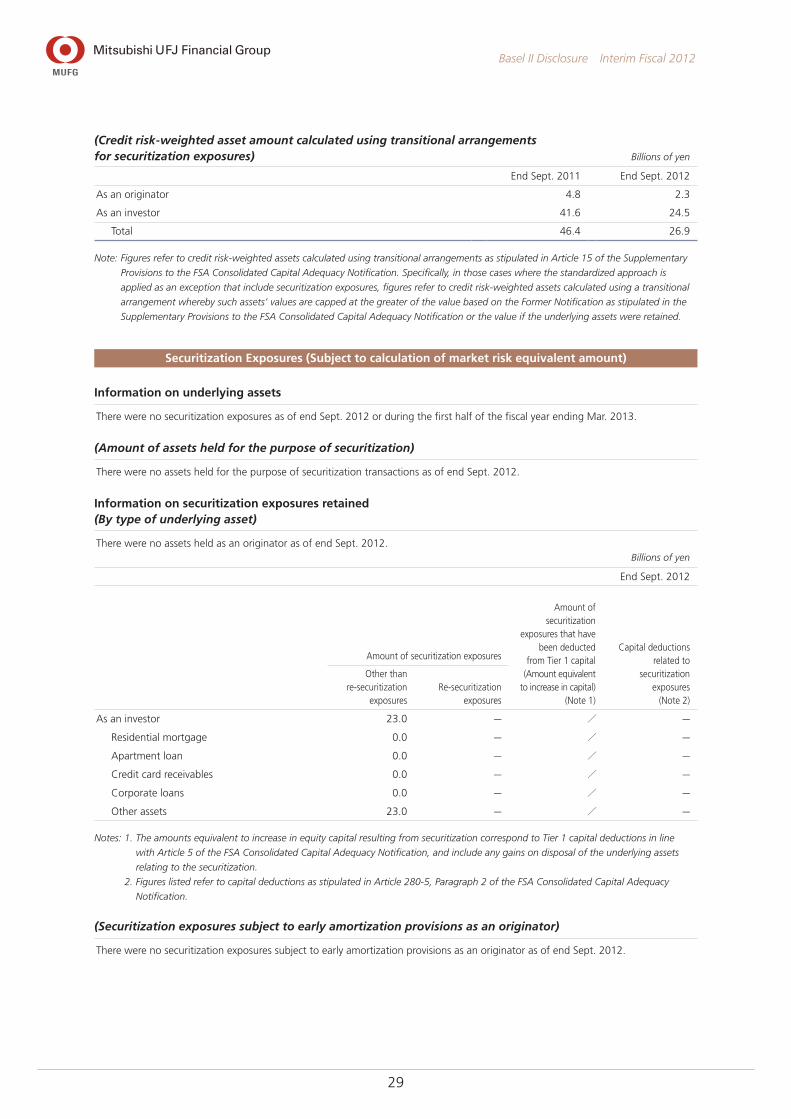
(Credit risk-weighted asset amount calculated using transitional arrangements for securitization exposures) Billions of yen
End Sept. 2011 End Sept. 2012
As an originator 4.8 2.3
As an investor 41.6 24.5
Total 46.4 26.9
Note: Figures refer to credit risk-weighted assets calculated using transitional arrangements as stipulated in Article 15 of the Supplementary
Provisions to the FSA Consolidated Capital Adequacy Notification. Specifically, in those cases where the standardized approach is
applied as an exception that include securitization exposures, figures refer to credit risk-weighted assets calculated using a transitional
arrangement whereby such assets’ values are capped at the greater of the value based on the Former Notification as stipulated in the
Supplementary Provisions to the FSA Consolidated Capital Adequacy Notification or the value if the underlying assets were retained.
Securitization Exposures (Subject to calculation of market risk equivalent amount)
Information on underlying assets
There were no securitization exposures as of end Sept. 2012 or during the first half of the fiscal year ending Mar. 2013.
(Amount of assets held for the purpose of securitization)
There were no assets held for the purpose of securitization transactions as of end Sept. 2012.
Information on securitization exposures retained (By type of underlying asset)
There were no assets held as an originator as of end Sept. 2012.Billions of yen
End Sept. 2012
Amount of securitization exposures
Amount of securitization
exposures that have been deducted
from Tier 1 capital (Amount equivalent
to increase in capital) (Note 1)
Capital deductions related to
securitization exposures
(Note 2)
Other than re-securitization
exposuresRe-securitization
exposures
As an investor 23.0 — / —
Residential mortgage 0.0 — / —
Apartment loan 0.0 — / —
Credit card receivables 0.0 — / —
Corporate loans 0.0 — / —
Other assets 23.0 — / —
Notes: 1. The amounts equivalent to increase in equity capital resulting from securitization correspond to Tier 1 capital deductions in line
with Article 5 of the FSA Consolidated Capital Adequacy Notification, and include any gains on disposal of the underlying assets
relating to the securitization.
2. Figures listed refer to capital deductions as stipulated in Article 280-5, Paragraph 2 of the FSA Consolidated Capital Adequacy
Notification.
(Securitization exposures subject to early amortization provisions as an originator)
There were no securitization exposures subject to early amortization provisions as an originator as of end Sept. 2012.
30
Basel II Disclosure Interim Fiscal 2012
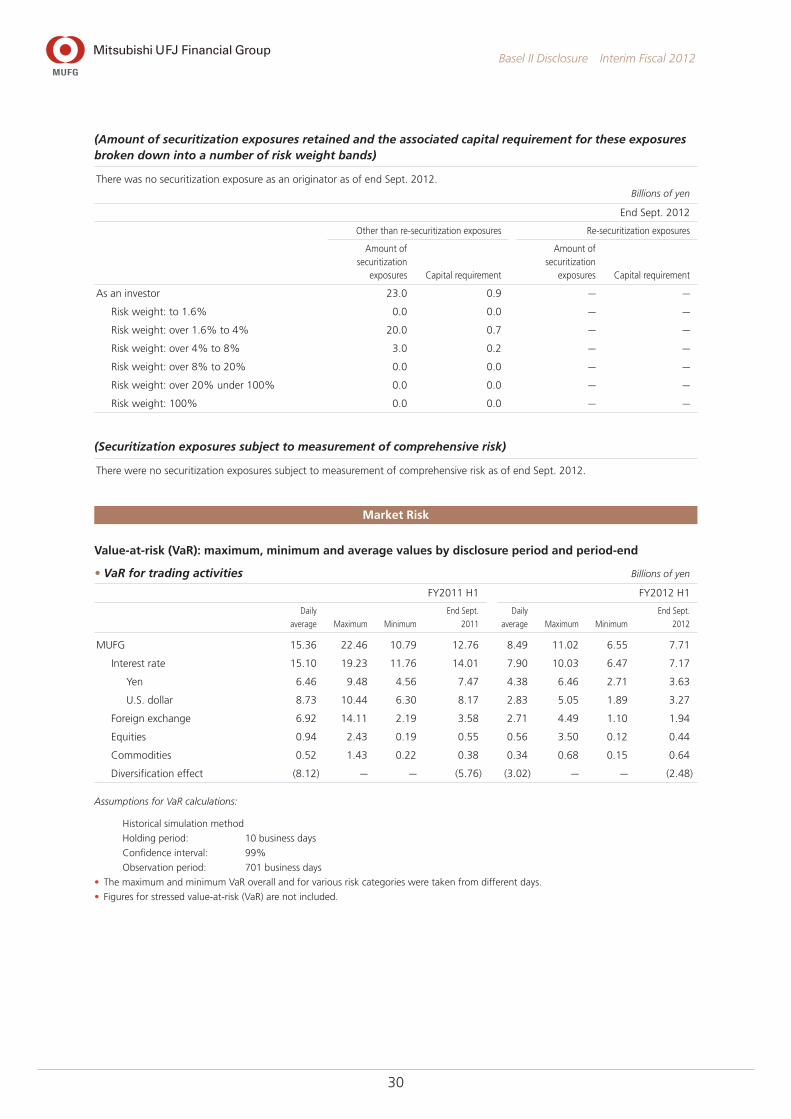
Market Risk
Value-at-risk (VaR): maximum, minimum and average values by disclosure period and period-end
• VaR for trading activities Billions of yen
FY2011 H1 FY2012 H1
Daily
average Maximum Minimum
End Sept.
2011
Daily
average Maximum Minimum
End Sept.
2012
MUFG 15.36 22.46 10.79 12.76 8.49 11.02 6.55 7.71
Interest rate 15.10 19.23 11.76 14.01 7.90 10.03 6.47 7.17
Yen 6.46 9.48 4.56 7.47 4.38 6.46 2.71 3.63
U.S. dollar 8.73 10.44 6.30 8.17 2.83 5.05 1.89 3.27
Foreign exchange 6.92 14.11 2.19 3.58 2.71 4.49 1.10 1.94
Equities 0.94 2.43 0.19 0.55 0.56 3.50 0.12 0.44
Commodities 0.52 1.43 0.22 0.38 0.34 0.68 0.15 0.64
Diversification effect (8.12) — — (5.76) (3.02) — — (2.48)
Assumptions for VaR calculations:
Historical simulation method
Holding period: 10 business days
Confidence interval: 99%
Observation period: 701 business days
• The maximum and minimum VaR overall and for various risk categories were taken from different days.
• Figures for stressed value-at-risk (VaR) are not included.
(Amount of securitization exposures retained and the associated capital requirement for these exposures broken down into a number of risk weight bands)
There was no securitization exposure as an originator as of end Sept. 2012.Billions of yen
End Sept. 2012
Other than re-securitization exposures Re-securitization exposures
Amount of securitization
exposures Capital requirement
Amount of securitization
exposures Capital requirement
As an investor 23.0 0.9 — —
Risk weight: to 1.6% 0.0 0.0 — —
Risk weight: over 1.6% to 4% 20.0 0.7 — —
Risk weight: over 4% to 8% 3.0 0.2 — —
Risk weight: over 8% to 20% 0.0 0.0 — —
Risk weight: over 20% under 100% 0.0 0.0 — —
Risk weight: 100% 0.0 0.0 — —
(Securitization exposures subject to measurement of comprehensive risk)
There were no securitization exposures subject to measurement of comprehensive risk as of end Sept. 2012.

31
Basel II Disclosure Interim Fiscal 2012
Stressed value-at-risk (VaR): maximum, minimum and average values by disclosure period and period-end
Billions of yen
FY2012 H1
Daily
average Maximum Minimum
End Sept.
2012
Stressed VaR 18.65 26.78 13.55 14.26
Assumptions for VaR calculations:
Historical simulation method
Holding period: 10 business days
Confidence interval: 99%
The amount of required capital related to additional risk and comprehensive risk as of the period-end, as well as the maximum, minimum and average values for the amount of required capital for additional risk and comprehensive risk during the disclosure period
Not applicable during the first half of the fiscal year ending Mar. 2013.

Oct. 2011 Sep. 2012
Daily profit/loss
VaR shown on a negative scale–12
–10
–6
–8
–2
–4
0
2
4
6
10
8
12
Oct. 2010 Sep. 2011
Daily profit/loss
VaR shown on a negative scale–12
–10
–6
–8
–2
–4
0
2
4
6
10
8
12
VaR0 10 126 842
–12
–10
–8
–6
–4
–2
0
2
4
6
8
10
12
Dai
ly p
rofit
/loss
Case of losses exceeding VaR: 1
VaR0 10 126 842
–12
–10
–8
–6
–4
–2
0
2
4
6
8
10
12
Dai
ly p
rofit
/loss
Case of losses exceeding VaR: 0
32
Basel II Disclosure Interim Fiscal 2012
Note: Actual trading losses never significantly exceeded
VaR throughout the period studied.
Note: Actual trading losses never exceeded VaR throughout
the period studied.
Results of market risk backtesting and explanations of any actual trading losses significantly in excess of VaR
Note: Actual trading losses never significantly exceeded
VaR throughout the period studied.
Note: Actual trading losses never exceeded VaR throughout
the period studied.
Market Risk Backtesting(Oct. 2011–Sept. 2012)
Market Risk Backtesting(Oct. 2010–Sept. 2011)
VaR and Daily Profit/Loss for Trading Activities(Oct. 2011–Sept. 2012)
VaR and Daily Profit/Loss for Trading Activities(Oct. 2010–Sept. 2011)
Billions of Yen
Billions of Yen
33
Basel II Disclosure Interim Fiscal 2012
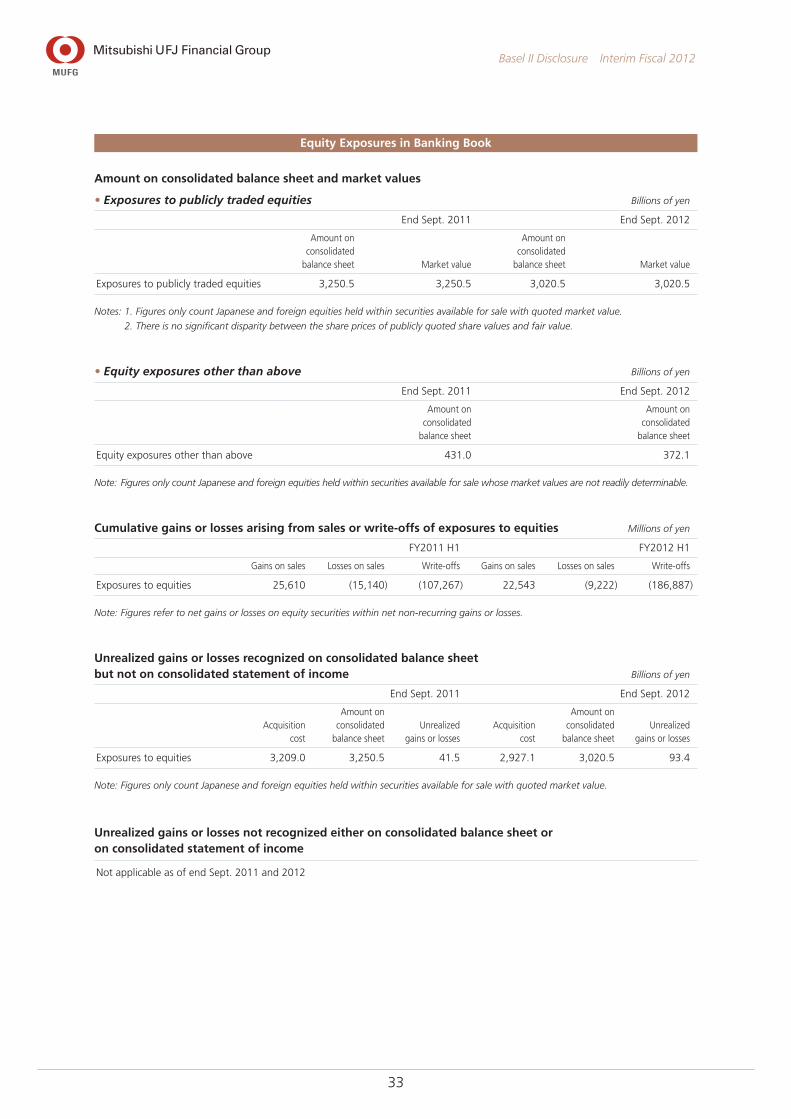
Equity Exposures in Banking Book
Amount on consolidated balance sheet and market values
• Exposures to publicly traded equities Billions of yen
End Sept. 2011 End Sept. 2012
Amount on consolidated
balance sheet Market value
Amount on consolidated
balance sheet Market value
Exposures to publicly traded equities 3,250.5 3,250.5 3,020.5 3,020.5
Notes: 1. Figures only count Japanese and foreign equities held within securities available for sale with quoted market value.
2. There is no significant disparity between the share prices of publicly quoted share values and fair value.
• Equity exposures other than above Billions of yen
End Sept. 2011 End Sept. 2012
Amount on consolidated
balance sheet
Amount on consolidated
balance sheet
Equity exposures other than above 431.0 372.1
Note: Figures only count Japanese and foreign equities held within securities available for sale whose market values are not readily determinable.
Cumulative gains or losses arising from sales or write-offs of exposures to equities Millions of yen
FY2011 H1 FY2012 H1
Gains on sales Losses on sales Write-offs Gains on sales Losses on sales Write-offs
Exposures to equities 25,610 (15,140) (107,267) 22,543 (9,222) (186,887)
Note: Figures refer to net gains or losses on equity securities within net non-recurring gains or losses.
Unrealized gains or losses recognized on consolidated balance sheet but not on consolidated statement of income Billions of yen
End Sept. 2011 End Sept. 2012
Acquisition cost
Amount on consolidated
balance sheetUnrealized
gains or lossesAcquisition
cost
Amount on consolidated
balance sheetUnrealized
gains or losses
Exposures to equities 3,209.0 3,250.5 41.5 2,927.1 3,020.5 93.4
Note: Figures only count Japanese and foreign equities held within securities available for sale with quoted market value.
Unrealized gains or losses not recognized either on consolidated balance sheet or on consolidated statement of income
Not applicable as of end Sept. 2011 and 2012
34
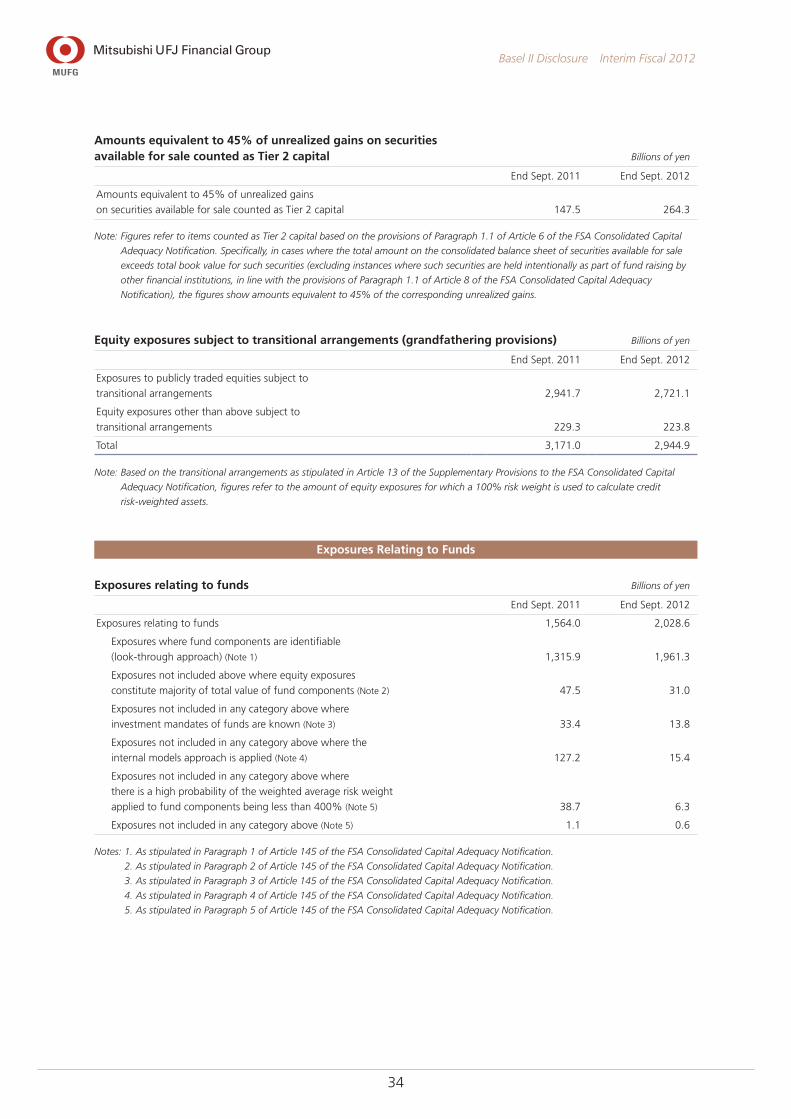
Basel II Disclosure Interim Fiscal 2012
Amounts equivalent to 45% of unrealized gains on securities available for sale counted as Tier 2 capital Billions of yen
End Sept. 2011 End Sept. 2012
Amounts equivalent to 45% of unrealized gains
on securities available for sale counted as Tier 2 capital 147.5 264.3
Note: Figures refer to items counted as Tier 2 capital based on the provisions of Paragraph 1.1 of Article 6 of the FSA Consolidated Capital
Adequacy Notification. Specifically, in cases where the total amount on the consolidated balance sheet of securities available for sale
exceeds total book value for such securities (excluding instances where such securities are held intentionally as part of fund raising by
other financial institutions, in line with the provisions of Paragraph 1.1 of Article 8 of the FSA Consolidated Capital Adequacy
Notification), the figures show amounts equivalent to 45% of the corresponding unrealized gains.
Equity exposures subject to transitional arrangements (grandfathering provisions) Billions of yen
End Sept. 2011 End Sept. 2012
Exposures to publicly traded equities subject to
transitional arrangements 2,941.7 2,721.1
Equity exposures other than above subject to
transitional arrangements 229.3 223.8
Total 3,171.0 2,944.9
Note: Based on the transitional arrangements as stipulated in Article 13 of the Supplementary Provisions to the FSA Consolidated Capital
Adequacy Notification, figures refer to the amount of equity exposures for which a 100% risk weight is used to calculate credit
risk-weighted assets.
Exposures Relating to Funds
Exposures relating to funds Billions of yen
End Sept. 2011 End Sept. 2012
Exposures relating to funds 1,564.0 2,028.6
Exposures where fund components are identifiable
(look-through approach) (Note 1) 1,315.9 1,961.3
Exposures not included above where equity exposures
constitute majority of total value of fund components (Note 2) 47.5 31.0
Exposures not included in any category above where
investment mandates of funds are known (Note 3) 33.4 13.8
Exposures not included in any category above where the
internal models approach is applied (Note 4) 127.2 15.4
Exposures not included in any category above where
there is a high probability of the weighted average risk weight
applied to fund components being less than 400% (Note 5) 38.7 6.3
Exposures not included in any category above (Note 5) 1.1 0.6
Notes: 1. As stipulated in Paragraph 1 of Article 145 of the FSA Consolidated Capital Adequacy Notification.
2. As stipulated in Paragraph 2 of Article 145 of the FSA Consolidated Capital Adequacy Notification.
3. As stipulated in Paragraph 3 of Article 145 of the FSA Consolidated Capital Adequacy Notification.
4. As stipulated in Paragraph 4 of Article 145 of the FSA Consolidated Capital Adequacy Notification.
5. As stipulated in Paragraph 5 of Article 145 of the FSA Consolidated Capital Adequacy Notification.

35
Basel II Disclosure Interim Fiscal 2012
Interest Rate Risk in the Banking Book (IRRBB)
Decline in economic values for applied interest rate shocks according to internal risk management
• VaR for non-trading activities Billions of yen
FY2011 H1 FY2012 H1
Daily
average Maximum Minimum
End Sept.
2011
Daily
average Maximum Minimum
End Sept.
2012
Interest rate 499.2 546.3 450.5 497.0 434.6 467.5 402.3 415.7
Yen 234.9 262.4 185.1 185.1 212.2 245.6 190.3 198.6
U.S. dollar 330.0 376.3 296.5 376.3 274.7 300.2 251.6 251.6
Euro 44.5 54.9 33.9 36.6 41.4 70.1 9.0 57.7
Equities 157.7 177.5 131.0 138.0 66.2 79.5 57.9 61.8
Overall 538.3 572.2 484.6 542.4 443.3 473.0 413.3 413.4
Assumptions for VaR calculations:
Historical simulation method
Holding period: 10 business days
Confidence interval: 99%
Observation period: 701 business days
• The maximum and minimum VaR overall and for various risk categories were taken from different days.
• The equity-related risk figures do not include market risk exposure from our strategic equity portfolio.
Outlier ratio
End Sept. 2011 End Sept. 2012
Outlier ratio 10.73% 9.73%
Assumptions for outlier ratio calculations:
Measurement method: Interest rate sensitivity method
Interest rate shock range: 1st and 99th percentile of observed interest changes using a one-year holding period
and five-year observation period