Embed Size (px)
Citation preview

Based on US GAAP(page)
Supplementary Information to the Consolidated Balance Sheets ****** 2
Supplementary Information to the Consolidated Statements of Income ****** 3
Supplementary Information to the Consolidated Statements of Cash Flows ****** 4
Operating Segment Information (Year ended March 2011) ****** 5-7
Performance at Consolidated Subsidiaries and Affiliates ****** 8-11
Balance of Risk Money Outstanding in 11 Main Countries ****** 12
Forecasts for Year Ending March 2012 by Operating Segment ****** 13
Number of Employees by Operating Segment and Region ****** 14
Forward-Looking StatementsThis release contains forward-looking statements about Mitsubishi Corporation’s future plans, strategies, beliefs and performance that arenot historical facts. Such statements are based on the company’s assumptions and beliefs in light of competitive, financial and economicdata currently available and are subject to a number of risks, uncertainties and assumptions that, without limitation, relate to worldeconomic conditions, exchange rates and commodity prices. Accordingly, Mitsubishi Corporation wishes to caution readers that actualresults may differ materially from those projected in this release and that Mitsubishi Corporation bears no responsibility for any negativeimpact caused by the use of this release.
Mitsubishi CorporationSupplementary Information to the Financial Results for the
Year Ended March 2011
1

Please refer to page 23 of the earnings release.
Supplementary Information to the Consolidated Balance Sheets (Billion yen)
〔Assets〕
Main items 2010/3 2011/3 Increase/decrease Main points of change
Current assets 5,491.4 5,993.4 502.0
Cash and cash equivalents 1,080.5 1,208.7 128.2 …
Trade accounts receivable 2,018.8 2,133.4 114.6 …
Inventories 848.4 970.7 122.3 …
Investments and non-current receivables 5,365.5 5,354.0 (11.5)
Investments in and advances to affiliatedcompanies 1,238.6 1,320.1 81.5 …
Other investments 1,631.4 1,522.2 (109.2) …
〔Liabilities〕
Main items 2010/3 2011/3 Increase/decrease Main points of change
Current liabilities 3,711.4 3,981.3 269.9
Short-term debt 555.0 656.9 101.9 …
Current maturities of long-term debt 408.3 468.7 60.4 …
Trade accounts payable 1,864.8 1,880.0 15.2 …
Long-term liabilities 3,876.8 3,765.2 (111.6)
Long-term debt 3,246.0 3,188.7 (57.3) …
〔Shareholders' Equity〕
Main items 2010/3 2011/3 Increase/decrease Main points of change
Total shareholders' equity 2,962.5 3,284.4 321.9
Retained earnings 2,749.3 3,135.2 385.9 …
Foreign currency translation adjustments (324.4) (396.0) (71.6) …
Major indices
2010/3 2011/3 Increase/decrease 2010/3 2011/3 Increase/
decrease
Current ratio 148.0% 150.5% 2.5% ROE (*2) 10.3% 14.8% 4.5%Total shareholders' equity ratio (*1) 27.3% 28.9% 1.6% ROA (*2) 2.7% 4.8% 2.1%Total assets (Billion yen) 10,856.9 11,347.4 490.5
Interest-bearing liabilities (*3)
2010/3 2011/3 Increase/decrease
Interest-bearing debt (Gross) 4,154.7 4,257.6 102.9Interest-bearing debt (Net) 2,968.2 2,947.3 (20.9)Total shareholders' equity (*1) 2,962.5 3,284.4 321.9
Interest-bearing debt to equity ratio (Gross) 1.4 1.3 △ 0.1Interest-bearing debt to equity ratio (Net) 1.0 0.9 △ 0.1
Increase resulted from securing liquidity on hand in preparedness for unexpected demand for fundsin the wake of the devastating natural disaster that struck Japan.
Increase due to increased sales in line with recovering steel product demand and higher crude oilprices.
Increase in line with recovering demand for steel products, automobiles, etc.
Increase in investments due to share transfer and subscription to a capital increase at a Chileaniron-ore business, etc.
Decrease due to reclassification of debt to current maturities of long-term debt.
Reflects net income (+463.2 billion yen) and decrease due to payment of dividends (-77.3 billionyen)
Due to decrease in net assets denominated in U.S. dollars reflecting the yen's appreciation, etc.
Decrease in line with sales of listed shares at the Parent, etc.
Increase due to increase in working capital and other demand for funds, etc.
Increase due to reclassification from long-term debt.
Increase reflects higher payables due to recovering demand for steel products and other items, aswell as higher crude oil prices.
(*1)…Total shareholders' equity shows the amount of total shareholders' equity attributable toMitsubishi Corporation, excluding noncontrolling interests.(*2)…ROE=Calculated with net income attributable to Mitsubishi Corporation as the numerator.ROA=Calculated with income before income taxes as the numerator.
〔US$〕 2010/3 ¥93.04 → 2011/3 ¥83.15 (10 yen appreciation)〔AUS$〕 2010/3 ¥85.28 → 2011/3 ¥86.08 (1 yen depreciation)〔Euro〕 2010/3 ¥124.92 → 2011/3 ¥117.57 (7 yen appreciation)
(*3)…Interest-bearing liabilities do not include the impact of adopting ASC Codification Topic815, "Derivatives and Hedging."
Short-term borrowingsCPCurrent maturities of long-term borrowings and bondsLong-term borrowingsBondsInterest-bearing debt (Gross) (*3)
2011/3
542.0114.9465.4
2,328.8806.5
4,257.6
2010/3
479.675.4
406.62,408.2
784.94,154.7
Increase/decrease
62.439.558.8
(79.4)21.6
102.9
2

Please refer to page 25 of the earnings release.
Supplementary Information for Consolidated Statements of Income
① Revenues (666.1 billion yen increase)Year Ended March
2010Year Ended March
2011Increase ordecrease
3,967.7 4,590.9 623.2
573.1 616.0 42.9
4,540.8 5,206.9 666.1
② Gross profit (133.3 billion yen increase) (Reference: Operating income (loss))
Year Ended March2010
Year Ended March2011
Increase ordecrease
Year Ended March2010
Year Ended March2011
Increase ordecrease
Industrial Finance, Logistics & Development 44.7 47.1 2.4 Industrial Finance, Logistics & Development 4.4 9.2 4.8Energy Business 39.8 43.8 4.0 Energy Business (1.4) 3.7 5.1Metals 231.8 326.3 94.5 Metals 103.4 185.0 81.6Machinery 155.1 182.0 26.9 Machinery 41.4 66.4 25.0Chemicals 77.8 84.2 6.4 Chemicals 23.2 29.2 6.0Living Essentials 457.1 456.8 (0.3) Living Essentials 62.4 69.4 7.0Food 391.6 386.9 (4.7) Food 58.9 57.2 (1.7)Textile, General Merchandise, etc. 65.5 69.9 4.4 Textile, General Merchandise, etc. 3.5 12.2 8.7Others 10.3 9.7 (0.6) Others (51.2) (46.8) 4.4Total 1,016.6 1,149.9 133.3 Total 182.2 316.1 133.9
③ SG&A expenses (Decreased 4.8 billion yen) (Breakdown of consolidated SG&A expenses)
Year Ended March2010
Year Ended March2011
Increase ordecrease Item Year Ended March
2010Year Ended March
2011Increase ordecrease
Parent company (213.5) (208.6) 4.9 (Personnel expenses)Overseas subsidiaries (38.8) (38.9) (0.1) Employee salaries and bonuses (303.6) (303.3) 0.3Subsidiaries and affiliates (577.2) (577.2) 0.0 Pension and retirement benefits (33.7) (28.6) 5.1Total (829.5) (824.7) 4.8 Fringe benefit costs (37.9) (38.3) (0.4)
Personnel expenses total (375.2) (370.2) 5.0(Other expenses)Rent (55.6) (52.0) 3.6
④ Provision for doubtful receivables (4.2 billion yen increase) Depreciation, equipment expenses (46.7) (47.0) (0.3)Increase due to small provisions. Travel, transportation, entertainment (36.9) (39.8) (2.9)
Administration (57.6) (58.0) (0.4)Others (257.5) (257.7) (0.2)
⑤ Net interest expense (5.9 billion yen decrease) Other expenses total (454.3) (454.5) (0.2)Decrease due to lower yen interest rates. Total (829.5) (824.7) 4.8
⑥ Dividend income (33.3 billion yen increase) (Reference: Net financial income)
Year Ended March2010
Year Ended March2011
Increase ordecrease
Year Ended March2010
Year Ended March2011
Increase ordecrease
Resource related 68.0 101.7 33.7 Interest income 37.7 33.1 (4.6)Production, sales and others 23.5 23.1 (0.4) Interest expense (50.3) (39.8) 10.5Total 91.5 124.8 33.3 Net interest expense (12.6) (6.7) 5.9
Dividends 91.5 124.8 33.3Net financial income 78.9 118.1 39.2
⑦ Gain on marketable securities and investments (net) (53.2 billion yen improvement)Write-down of marketable securities (available for sale) : -5.8(Year ended March 2010: -6.2 → Year ended March 2011: -12.0 )Impairment losses on non-performing assets : +55.0 (Year ended March 2010: -67.6 → Year ended March 2011: -12.6 )Other realized gains and unrealized gains on shares, etc. : +4.0 (Year ended March 2010: +74.0 → Year ended March 2011:+78.0 )
⑧ Gain (loss) on property and equipment-net (13.3 billion yen improvement)Gains on sale : +0.8 (Year ended March 2010: +7.6 → Year ended March 2011: +8.4 )Retirement and disposal losses : +1.4(Year ended March 2010: -5.1 → Year ended March 2011: -3.7 )Impairment losses : +11.1(Year ended March 2010: -18.3 → Year ended March 2011: -7.2 )
⑨ Other income-net (3.2 billion yen decrease)Deterioration in foreign exchange gains and losses, etc.
⑩ Corporate taxes (80.4 billion yen increase)Increase in taxes in line with increase in income before income taxes, etc.
⑪ Equity in earnings of affiliated companies-net (48.1 billion yen increase)Reflects higher earnings of overseas resource-related business investees, etc.
Revenues from trading, manufacturing andother activitiesTrading margins and commissions on tradingtransactionsTotal
3

Please refer to page 29 of the earnings release.
I. Cash Flows From Operating Activities
[Year ended March 2011 Result] Net cash provided by operating activities: 331.2 billion yen
[Comparison with year ended March 2010] Decreased 430.4 billion yen
(*) Breakdown of depreciation and amortization (Billion yen)Year ended March 2010 Year ended March 2011
Tangible fixed assets 119.6 123.2Intangible fixed assets 19.2 20.6Total 138.8 143.8
II. Cash Flows From Investing Activities
[Year ended March 2010 Result] Net cash used in investing activities: 262.6 billion yen
[Comparison with year ended March 2010] Increased 124.1 billion yen
III. Cash Flows From Financing Activities
[Year ended March 2011 Result] Net cash provided by financing activities: 76.7 billion yen
[Comparison with year ended March 2010] Change of 832.1 billion yen
(Note) Reconciliation With the Balance Sheet
Supplementary Information to the Consolidated Statements of Cash Flows
Movements in cash flows are generally consistent with changes on the balance sheet. However, due to new consolidations andexclusions as well as eliminating the effect of mark-to-market valuations and foreign exchange rate fluctuations, some cash flowmovements may be inconsistent with balance sheet changes.
Net cash provided by financing activities was 76.7 billion yen, despite the payment of dividends. Financingactivities provided net cash due to borrowing in line with increased working capital requirements and inpreparedness for an unexpected demand for funds following the major earthquake in Japan.
There was an 832.1 billion yen change from the previous year when cash was used for the repayment of debt inline with a decrease in working capital requirements.
Net cash provided by operating activities was 331.2 billion yen, despite an increase in working capitalrequirements. Operating activities provided net cash due to firm cash flows from operating transactions primarilyat resource-related subsidiaries and firm growth in dividend income mainly from resource-related businessinvestees.
Net cash provided by operating activities decreased 430.4 billion yen year on year, the result of an increase inworking capital requirements, although cash flows from operating transactions increased year on year.
Investing activities used net cash of 262.6 billion yen, despite proceeds from the sale of shares. Net cash wasused in investing activities mainly for subscribing to a capital increase at a Chilean iron ore business, and forcapital expenditures and the acquisition of working interests, primarily at overseas subsidiaries.
There was an increase of 124.1 billion yen in net cash used by investing activities. This was due to a decrease inproceeds from the sale of shares as well as capital expenditures and investments in affiliated companies in theyear under review.
4

Please refer to page 33 of the earnings release.
Operating Segment Information (Year Ended March 2011)
[Gross Profit]
(Billion yen)
Year ended Mar.2010
Year ended Mar.2011
Increase/decrease Main points of change
Industrial Finance, Logistics & Development 44.7 47.1 2.4 Reflects higher transaction volumes in distribution-related businesses, etc.
Energy Business 39.8 43.8 4.0 Increase due to higher earnings on transactions because of rising crude oil and other commodity prices and increased salesvolumes.
Metals 231.8 326.3 94.5Increase resulted primarily from higher sales prices at an Australian resource-related subsidiary (coking coal), highertransactions at a steel products-related subsidiary, and the absence of losses related to fuel derivative transactions for a JALsubsidiary recorded in the previous fiscal year.
Machinery 155.1 182.0 26.9 Increase due to higher sales in overseas automobile-related operations, particularly in Asia.
Chemicals 77.8 84.2 6.4 Higher earnings mainly reflect increased transactions at the Parent company, overseas regional subsidiaries and specialtypaper business-related subsidiaries.
Living Essentials 457.1 456.8 (0.3)Although earnings on transactions increased at general merchandise-related subsidiaries, the overall decrease reflects thedeconsolidation of and lower earnings on transactions at healthcare and marketing service-related subsidiaries, as well aslower earnings on transactions at food-related and feed-related subsidiaries.
Total 1,006.3 1,140.2 133.9
Adjustments and Eliminations 10.3 9.7 (0.6)
Consolidated 1,016.6 1,149.9 133.3
[Equity in earnings of affiliated companies](Billion yen)
Year ended Mar.2010
Year ended Mar.2011
Increase/decrease Main points of change
Industrial Finance, Logistics & Development 10.7 8.9 (1.8) Decrease reflects absence of fund investment-related earnings recorded in the previous fiscal year, although the segment sawgains on the sale of overseas real estate, and an improvement in earnings at lease-related businesses.
Energy Business 39.7 55.7 16.0 Increased equity-method earnings from overseas resource-related business investees due to higher oil prices.
Metals 6.2 36.3 30.1 Increased equity-method earnings from iron ore-related companies and copper-related companies.
Machinery 11.0 18.4 7.4 Reflects increase in equity in earnings at Asian automobile-related operations.
Chemicals 17.2 14.7 (2.5) Although transactions were strong at a petrochemical-related company, the overall decrease reflects the absence of gains onthe reversal of deferred tax liabilities recorded in the previous fiscal year.
Living Essentials 19.5 23.3 3.8 Increase in earnings due to higher equity in earnings of general merchandise- and food-related companies.
Total 104.3 157.3 53.0
Adjustments and Eliminations 9.1 4.2 (4.9)
Consolidated 113.4 161.5 48.1
Foreign exchange: Exchange rate for U.S. currency: Average for year ended March 2010: 92.89 yen → Average for year ended March 2011: 85.73 yen (7.16 yen (7.7%) appreciation)
Crude oil: Average for year ended March 2010: US$69.57/BBL → Average for year ended March 2011: US$84.2/BBL (US$14.63/BBL (21.03%) up)
5

Please refer to page 33 of the earnings release.
[Net income (loss)](Billion yen)
Year ended Mar.2010
Year ended Mar.2011
Increase/decrease Main points of change
Industrial Finance, Logistics & Development (7.6) 11.6 19.2Increase due to the absence of share write-downs (investment impairments) on Japan Airlines Corporation (JAL) and othershares recorded in the previous fiscal year, gains on the sale of overseas real estate, and an improvement in lease-relatedbusiness earnings.
Energy Business 71.9 94.0 22.1 Increase due to higher gross profit and equity in earnings because of rising crude oil and other commodity prices, and theabsence of losses related to fuel derivative transactions for a JAL subsidiary recorded in the previous fiscal year.
Metals 137.9 230.1 92.2 Increase resulted primarily from gains on a share transfer at a Chilean iron ore-related subsidiary and higher equity-methodearnings of related business investees, as well as higher sales prices at an Australian resource-related subsidiary (coking coal).
Machinery 18.1 61.4 43.3 Increase due to strong results at overseas automobile-related businesses, notably in Asia, as well as the absence of the write-down on Mitsubishi Motors Corporation preferred shares recorded in the previous fiscal year.
Chemicals 32.4 29.1 (3.3) Decrease reflects absence of gain on reversal of deferred tax liabilities of a petrochemical business-related company in theprevious fiscal year, offset in part by higher earnings due to strong transactions at a petrochemical business-related company.
Living Essentials 46.8 46.3 (0.5)Flat despite higher earnings on transactions and equity-method earnings at general merchandise-related businesses, as wellas an increase in equity-method earnings at food-related subsidiaries, because these were offset by tax expenses associatedwith adopting the consolidated tax filing system.
Total 299.5 472.5 173.0
Adjustments and Eliminations (24.7) (9.3) 15.4
Consolidated 274.8 463.2 188.4
6

Operating Segment Information (Year Ended March 2011)
Geographic Segment Information
Foreign exchange: Exchange rate for U.S. currency: Average for year ended March 2010: 92.89 yen → Average for year ended March 2011: 85.73 yen (7.16 yen (7.7%) appreciation)
Crude oil: Average for year ended March 2010: US$69.57/BBL → Average for year ended March 2011: US$84.2/BBL (US$14.63/BBL (21.03%) up)
【Operating Transactions】
(Billion yen)Year endedMar. 2010
Year endedMar. 2011
Increase/decrease Main points of change
Japan 14,132.8 15,667.2 1,534.4 Reflects higher crude oil prices at the Parent company, and higher transactions at steel products-related subsidiaries.
U.S.A. 752.1 886.3 134.2 Increase due to higher commodity prices at overseas regional subsidiaries, etc.
Thailand 492.8 634.6 141.8 Reflects higher sales at automobile-related operations, etc.
Others 1,725.1 2,045.3 320.2 Increase due to higher sales prices at a resource-related subsidiary (coking coal), etc.
Total 17,102.8 19,233.4 2,130.6
[Gross Profit]
(Billion yen)Year endedMar. 2010
Year endedMar. 2011
Increase/decrease Main points of change
Japan 710.3 735.1 24.8 Reflects higher transactions at steel products-related subsidiaries, etc.
Australia 125.3 175.8 50.5 Reflects higher sales prices at a resource-related subsidiary (coking coal), etc.
Thailand 39.2 53.3 14.1 Reflects higher sales at automobile-related operations, etc.
Others 141.8 185.7 43.9 Reflects absence of loss related to fuel derivative transactions for a JAL subsidiary recorded in theprevious fiscal year, etc.
Total 1,016.6 1,149.9 133.3
【Long-term Assets】
(Billion yen)Year endedMar. 2010
Year endedMar. 2011
Increase/decrease Main points of change
Japan 660.2 703.3 43.1 Increase due to acquisition of property and equipment for leasing operations, etc.
Australia 450.8 494.7 43.9 Increase due to acquisition of property and equipment at resource-related subsidiaries, etc.
U.S.A 118.7 80.4 -38.3 Decrease due to the conversion of a real estate-related subsidiary to an equity-method affiliate, etc.
Canada 60.2 75.5 15.3 Increase due to investment in shale gas development project, etc.
Others 300.0 312.5 12.5 Increase due to acquisition of resource-related subsidiaries, etc.
Total 1,589.9 1,666.4 76.5
7

Number of Consolidated Subsidiaries and Affiliates
(No. of companies)
Profit/Loss of Consolidated Subsidiaries and Affiliates (based on MC's equity earnings)
(Billion yen)
*The Parent has retrospectively adjusted the profit/loss information for the year ended March 2010, since an affiliate company had changed its fiscal year ending date.
35.9
128.8254.4 (57.1)
359.1265.9 215.2(9.5)
(50.7)87.8
466.0
31.9
35.5139.9143.9
108.031.5-0.4
23.4-1.5
197.3
51.961.4
337.2
-1-22
24.9
234 80 314350268 10
1
-3
321
Increase / decrease
Profit
-21 -14-37
Total
146
Year ended Mar. 2011
Affiliates 154 44 198
227
Total 242 79
Year ended Mar. 2010Profit Loss TotalProfit Loss Total
123 23
Total 190 37
124 42 166Affiliates 67 14 8167 15 82
191 57 248
OverseasSubsidiaries
Affiliates
DomesticSubsidiaries
155 49 204144 52 19687 30 11790 28 118
Domestic/Overseas TotalSubsidiaries 278 7294 362
137 562Total 432
30.0-1.731.721.9-2.824.78.1
157 43 200
1.17.0
Loss
425 116 548
Year ended Mar. 2011Year ended Mar. 2010TotalProfit Loss Total Profit Loss
DomesticSubsidiaries 74.8 (8.9)
Affiliates 42.1 (1.1)Total 116.9 (10.0)
65.949.9 (15.9) 34.041.043.6 (2.2) 41.4
106.993.5 (18.1) 75.4
OverseasSubsidiaries 287.8 (16.5)
Affiliates 100.1 (12.3)Total 387.9 (28.8)
271.3204.5 (41.2) 163.3
Domestic/Overseas TotalSubsidiaries 362.6 (25.4)
Affiliates 142.2Total 504.8 (38.8)
(13.4)93.3359.4 (68.8) 290.6105.0 (11.7)
145.437.2
108.2
Increase / decrease
Profit Loss Total
-20-1
-21
-19-1
175.4
8-17
-12-2
-20
2
-10
-1
122.038.783.3
11-38
8

* "Shareholding" represents the share of voting rights held.
(Billion yen)
3Q(accumulated)
4Q(accumulated)
3Q(accumulated)
4Q(accumulated)
3Q(accumulated)
4Q(accumulated)
Overseas Subsidiary K Mitsubishi Development Pty Ltd (Australia) Investment, production and sales of coal and other metals resources 100.00 81.8 112.8 119.1 135.8 37.3 23.0 -
Overseas Subsidiary K M.C. Inversiones Limitada (Chile) Investment company for iron ore mine in Chile 100.00 3.7 5.3 37.7 41.7 34.0 36.4 -
Overseas Affiliate K Iron Ore Company of Canada (Canada) Iron ore production and sales 26.18 2.5 4.6 13.4 18.8 10.9 14.2 -
Domestic Subsidiary K JECO Corporation Investment company for Minera Escondida Ltda. copper mines inChile 70.00 3.0 7.1 12.1 15.7 9.1 8.6 -
Overseas Subsidiary M Tri Petch Isuzu Sales Co., Ltd. (Thailand) Distribution of automobiles 88.73 4.2 6.7 10.0 14.3 5.8 7.6 -
Domestic Subsidiary K Metal One Corporation Steel products operations 60.00 3.2 5.4 8.1 11.2 4.9 5.8 -
Domestic Affiliate C SPDC Ltd. Investment and petroleum and petrochemicals-related businesses 30.39 14.7 16.3 7.1 9.9 -7.6 -6.4 -
Domestic Affiliate(listed) L LAWSON, INC. Franchise chain of LAWSON convenience stores 32.44 7.5 3.6 6.7 8.2 -0.8 4.6 -
Overseas Affiliate M P.T. Krama Yudha Tiga Berlian Motors (Indonesia) Distribution of automobiles 40.00 1.2 2.7 5.3 6.4 4.1 3.7 -
Domestic Subsidiary N Mitsubishi Shoji Sekiyu Co., Ltd. Marketing and sales of petroleum products 100.00 1.5 0.8 4.1 5.6 2.6 4.8 2.3
Overseas Subsidiary K MC Copper Holdings B.V. (The Netherlands) Investment company for Los Pelambres copper mine in Chile 100.00 0.3 2.8 3.1 5.6 2.8 2.8 -
Domestic Affiliate(listed) S Mitsubishi UFJ Lease & Finance Company Ltd. Leasing, installment sales, other financing 20.00 1.2 2.5 3.4 5.3 2.2 2.8 -
Overseas Subsidiary X Mitsubishi International Corporation Trading 100.00 6.0 7.3 4.2 4.9 -1.8 -2.4 4.0
Overseas Subsidiary M Isuzu Operations (Thailand) Co., Ltd. (Thailand) Distribution of automobiles 80.00 2.2 2.9 3.7 4.7 1.5 1.8 -
Overseas Subsidiary E Diamond Generating Asia, Limited (Hong Kong) Independent power producer 100.00 5.5 4.6 3.6 4.0 -1.9 -0.6 2.3
Overseas Affiliate L Princes Limited (U.K.) Manufacturing of food products and soft drinks 100.00 2.6 3.9 2.5 3.7 -0.1 -0.2 -
Domestic Subsidiary(listed) L RYOSHOKU LIMITED Wholesale of food products 51.17 1.1 4.1 2.7 3.6 1.6 -0.5 -
Overseas Affiliate M Isuzu Motors Co., (Thailand) Ltd. (Thailand) Manufacturing of automobiles 27.50 1.6 2.4 2.2 3.2 0.6 0.8 -
Overseas Subsidiary L Alpac Forest Products Inc. (Canada) Manufacturing and sales of wood pulp 70.00 (0.8) (0.4) 2.4 3.2 3.2 3.6 -
Overseas Affiliate K JECO 2 LTD. (U.K.) Investment company for Minera Escondida Ltda. copper mines inChile 50.00 - - 2.3 3.1 2.3 3.1 -
Overseas Subsidiary L Indiana Packers Corporation (U.S.A.) Processing and sales of pork 80.00 0.8 1.3 2.3 2.8 1.5 1.5 -
Overseas Subsidiary X Mitsubishi Corporation International (Europe) Plc. Trading 100.00 (0.5) 0.2 2.5 2.6 3.0 2.4 0.7
Overseas Subsidiary S Bow Bells House Investment L-1 (U.K.) Financial investment company 100.00 (0.1) (0.1) 2.5 2.5 2.6 2.6 0.0
Domestic Subsidiary C Kohjin Co., Ltd. Manufacturing of specialty papers, plastic films, biochemicals andfine chemicals 100.00 1.6 1.3 2.0 2.1 0.4 0.8 1.8
Overseas Subsidiary L AGREX Inc.(U.S.A.) Storage and marketing of grain 100.00 1.0 1.5 1.6 2.1 0.6 0.6 -
Domestic Subsidiary K Mitsubishi Corporation Unimetals Ltd. Metal trading company 100.00 (0.1) 0.2 2.1 2.0 2.2 1.8 -
Domestic Affiliate(listed) L Hokuetsu Kishu Paper, Co., Ltd. Manufacturing, processing, and sales of paper and pulp 24.72 0.2 0.8 1.4 1.9 1.2 1.1 -
Domestic Subsidiary S Mitsubishi Corporation LT, Inc. Warehousing and total logistics services 100.00 0.7 1.2 1.4 1.8 0.7 0.6 2.0
Overseas Subsidiary M Tri Petch Isuzu Leasing Co., Ltd. (Thailand) Plant engineering business 93.50 0.8 1.1 1.4 1.8 0.6 0.7 -
Overseas Subsidiary X Mitsubishi Corporation (Shanghai) Ltd. Trading 100.00 1.0 1.3 1.5 1.7 0.5 0.4 1.7
Domestic Subsidiary S MC Aviation Partners Inc. Aircraft leasing and management sevices 100.00 0.6 0.7 1.4 1.6 0.8 0.9 2.0
Domestic Subsidiary L Mitsubishi Shoji Packaging Corporation Sales and marketing of packaging materials, paper, paperboard andcorrugated containerboard, as well as export of paper and paperboard 92.15 0.5 1.4 0.7 1.6 0.2 0.2 -
Domestic Subsidiary L San-Esu Inc. Wholesale of confectionery 91.93 1.0 1.4 1.0 1.6 0.0 0.2 -
Domestic Affiliate N Astomos Energy Corporation Import, trading, domestic distribution and sales of LPG 49.00 1.3 2.4 1.7 1.5 0.4 -0.9 2.9
Domestic Subsidiary M MSK FARM MACHINERY CORPORATION Sales and service of agricultural machinery and facilities 100.00 0.4 0.6 0.3 1.5 -0.1 0.9 4.0
Domestic Subsidiary M Nikken Corporation Rental and sales of construction machinery and other equipment 96.83 (2.1) (1.6) 0.8 1.5 2.9 3.1 1.9
Domestic Subsidiary L Dai-Nippon Meiji Sugar Co., Ltd. Manufacturing and wholesale of sugar products 100.00 1.6 1.7 1.5 1.4 -0.1 -0.3 -
Overseas Subsidiary K Triland Metals Limited (U.K.) Commodity broker and market maker on the London Metal Exchange(LME) 100.00 1.3 1.9 1.0 1.3 -0.3 -0.6 -
Domestic Subsidiary C Mitsubishi Shoji Plastics Corp. Marketing of synthetic raw materials and plastics 100.00 1.1 1.3 1.1 1.3 0.0 0.0 1.5
Overseas Subsidiary N Diamond Gas Resources Pty., Ltd. (Australia) Sales agent of JALP crude oil and condensate 100.00 2.2 2.8 0.9 1.2 -1.3 -1.6 1.0
Overseas Subsidiary M MCE Bank GmbH (Germany) Automobile finance 100.00 1.1 1.0 0.8 1.2 -0.3 0.2 -
Domestic Subsidiary M Mitsubishi Corporation Power Systems, Inc. Supply, installation work, maintenance, inspection of powergenerating systems and related equipment, in-plant transportation 100.00 0.9 1.1 0.9 1.2 0.0 0.1 1.1
Overseas Affiliate C Metanol de Oriente, METOR, S.A. (Venezuela) Manufacturing and marketing of methanol 25.00 0.0 0.5 0.7 1.2 0.7 0.7 1.3
Domestic Subsidiary(listed) L Kentucky Fried Chicken Japan Ltd. Fast-food restaurant chain and home-delivery pizza stores 65.81 0.6 0.9 1.1 1.2 0.5 0.3 -
Domestic Subsidiary L MC Healthcare, Inc. Hospital management solutions through procurement of medicalsupplies and pharmaceuticals 80.00 - - 0.6 1.1 0.6 1.1 -
Overseas Subsidiary E Diamond Generating Corporation (U.S.A.) Independent power producer 100.00 1.6 1.9 0.7 1.1 -0.9 -0.8 1.7
Domestic Subsidiary M Mitsubishi Corporation Machinery, Inc. Export, import and domestic trading of machine parts 100.00 0.8 1.2 0.6 1.0 -0.2 -0.2 0.8
Domestic Subsidiary L Food Service Network Co., Ltd. Food wholesaling business for convenience stores 100.00 0.7 0.6 1.1 1.0 0.4 0.4 -
Overseas Affiliate N Energi Mega Pratama Inc. (Indonesia) Exploration, development, and production of oil and natural gas inIndonesia 25.00 (0.8) (1.5) (1.0) (1.2) -0.2 0.3 (1.0)
Domestic Subsidiary L Loyalty Marketing, Inc. Managing the operations of Multi-Partner Loyalty Program "Ponta" 90.00 (0.4) (0.8) (1.3) (1.6) -0.9 -0.8 -
Overseas Affiliate K Strand Minerals (Indonesia) Pte. Ltd. (Singapore) Investment company for nickel mine in Indonesia 33.40 (0.7) (1.0) (1.2) (1.7) -0.5 -0.7 -
Overseas Subsidiary N MCX Exploration (USA) Ltd. (U.S.A.) Exploration, development and production of oil and natural gas 100.00 (1.2) (1.9) 1.4 (2.7) 2.6 -0.8 (1.3)
Overseas Affiliate N ENCORE ENERGY PTE. LTD. (Singapore) Stockholding company for P.T.Medco Energi Internasional(Indonesia) 39.40 (0.3) (0.6) (0.3) (3.4) 0.0 -2.8 (0.1)
Domestic Subsidiary L Nosan Corporation Manufacturing and marketing of livestock feed 100.00 1.0 0.8 0.1 (3.4) -0.9 -4.2 -
* Equity in earnings of RYOSHOKU LIMITED has been retrospectively adjusted for the year ended March 2010, since the company had changed its fiscal yearending date.
Equity in earnings Increase or decreaseYear EndingMarch 2012
Outlook
Year Ended March2010
Year Ended March2011
Performance at Principal Subsidiaries and Affiliates
Domestic/Overseas
Subsidiary/Affiliate Group Company Name (Country) Main Business Shareholding
(%)
* Group: S (Industrial Finance, Logistics & Development ), N (Energy Business), K (Metals), M (Machinery), C (Chemicals), L (Living Essentials)E (Global Environment Business Development Group), X (Corporate Staff)
9

* "Shareholding" represents the share of voting rights held.
< Industrial Finance, Logistics & Development Group > (Billion yen)
3Q(accumulated)
4Q(accumulated)
3Q(accumulated)
4Q(accumulated)
3Q(accumulated)
4Q(accumulated)
Domestic Affiliate(listed) Mitsubishi UFJ Lease & Finance Company Ltd. Leasing, installment sales, other financing 20.00 1.2 2.5 3.4 5.3 2.2 2.8 -
Overseas Subsidiary Bow Bells House Investment L-1 (U.K.) Financial investment company 100.00 (0.1) (0.1) 2.5 2.5 2.6 2.6 0.0
Domestic Subsidiary Mitsubishi Corporation LT, Inc. Warehousing and total logistics services 100.00 0.7 1.2 1.4 1.8 0.7 0.6 2.0
Domestic Subsidiary MC Aviation Partners Inc. Aircraft leasing and management sevices 100.00 0.6 0.7 1.4 1.6 0.8 0.9 2.0
< Energy Business Group >
3Q(accumulated)
4Q(accumulated)
3Q(accumulated)
4Q(accumulated)
3Q(accumulated)
4Q(accumulated)
Domestic Subsidiary Mitsubishi Shoji Sekiyu Co., Ltd. Marketing and sales of petroleum products 100.00 1.5 0.8 4.1 5.6 2.6 4.8 2.3
Domestic Affiliate Astomos Energy Corporation Import, trading, domestic distribution and sales of LPG 49.00 1.3 2.4 1.7 1.5 0.4 -0.9 2.9
Overseas Subsidiary Diamond Gas Resources Pty. Ltd. (Australia) Sales agent of JALP crude oil and condensate 100.00 2.2 2.8 0.9 1.2 -1.3 -1.6 1.0
Overseas Affiliate Energi Mega Pratama Inc. (Indonesia) Exploration, development, and production of oil and natural gas inIndonesia 25.00 (0.8) (1.5) (1.0) (1.2) -0.2 0.3 (1.0)
Overseas Subsidiary MCX Exploration (USA) Ltd. (U.S.A.) Exploration, development and production of oil and natural gas 100.00 (1.2) (1.9) 1.4 (2.7) 2.6 -0.8 (1.3)
Overseas Affiliate ENCORE ENERGY PTE. LTD. (Singapore) Stockholding company for P.T.Medco Energi Internasional(Indonesia) 39.40 (0.3) (0.6) (0.3) (3.4) 0.0 -2.8 (0.1)
< Metals Group >
3Q(accumulated)
4Q(accumulated)
3Q(accumulated)
4Q(accumulated)
3Q(accumulated)
4Q(accumulated)
Overseas Subsidiary Mitsubishi Development Pty Ltd (Australia) Investment, production and sales of coal and other metals resources 100.00 81.8 112.8 119.1 135.8 37.3 23.0 -
Overseas Subsidiary M.C. Inversiones Limitada (Chile) Investment company for iron ore mine in Chile 100.00 3.7 5.3 37.7 41.7 34.0 36.4 -
Overseas Affiliate Iron Ore Company of Canada (Canada) Iron ore production and sales 26.18 2.5 4.6 13.4 18.8 10.9 14.2 -
Domestic Subsidiary JECO Corporation Investment company for Minera Escondida Ltda. copper mines inChile 70.00 3.0 7.1 12.1 15.7 9.1 8.6 -
Domestic Subsidiary Metal One Corporation Steel products operations 60.00 3.2 5.4 8.1 11.2 4.9 5.8 -
Overseas Subsidiary MC Copper Holdings B.V. (The Netherlands) Investment company for Los Pelambres copper mine in Chile 100.00 0.3 2.8 3.1 5.6 2.8 2.8 -
Overseas Affiliate JECO 2 LTD. (U.K.) Investment company for Minera Escondida Ltda. copper mines inChile 50.00 - - 2.3 3.1 2.3 3.1 -
Domestic Subsidiary Mitsubishi Corporation Unimetals Ltd. Metal trading company 100.00 (0.1) 0.2 2.1 2.0 2.2 1.8 -
Overseas Subsidiary Triland Metals Limited. (U.K.) Commodity broker and market maker on the London MetalExchange (LME) 100.00 1.3 1.9 1.0 1.3 -0.3 -0.6 -
Overseas Affiliate Strand Minerals (Indonesia) Pte. Ltd. (Singapore) Investment company for nickel mine in Indonesia 33.40 (0.7) (1.0) (1.2) (1.7) -0.5 -0.7 -
< Machinery Group >
3Q(accumulated)
4Q(accumulated)
3Q(accumulated)
4Q(accumulated)
3Q(accumulated)
4Q(accumulated)
Overseas Subsidiary Tri Petch Isuzu Sales Co., Ltd. (Thailand) Distribution of automobiles 88.73 4.2 6.7 10.0 14.3 5.8 7.6 -
Overseas Affiliate P.T. Krama Yudha Tiga Berlian Motors (Indonesia) Distribution of automobiles 40.00 1.2 2.7 5.3 6.4 4.1 3.7 -
Overseas Subsidiary Isuzu Operations (Thailand) Co., Ltd. (Thailand) Distribution of automobiles 80.00 2.2 2.9 3.7 4.7 1.5 1.8 -
Overseas Affiliate Isuzu Motors Co., (Thailand) Ltd. (Thailand) Manufacturing of automobiles 27.50 1.6 2.4 2.2 3.2 0.6 0.8 -
Overseas Subsidiary Tri Petch Isuzu Leasing Co., Ltd. (Thailand) Plant engineering business 93.50 0.8 1.1 1.4 1.8 0.6 0.7 -
Domestic Subsidiary MSK FARM MACHINERY CORPORATION Sales and service of agricultural machinery and facilities 100.00 0.4 0.6 0.3 1.5 -0.1 0.9 0.4
Domestic Subsidiary Nikken Corporation Rental and sales of construction machinery and other equipment 96.83 (2.1) (1.6) 0.8 1.5 2.9 3.1 1.9
Overseas Subsidiary MCE Bank GmbH (Germany) Automobile finance 100.00 1.1 1.0 0.8 1.2 -0.3 0.2 -
Domestic Subsidiary Mitsubishi Corporation Power Systems, Inc. Supply, installation work, maintenance, inspection of powergenerating systems and related equipment, in-plant transportation 100.00 0.9 1.1 0.9 1.2 0.0 0.1 1.1
Domestic Subsidiary Mitsubishi Corporation Machinery, Inc. Export, import and domestic trading of machine parts 100.00 0.8 1.2 0.6 1.0 -0.2 -0.2 0.8
< Chemicals Group >
3Q(accumulated)
4Q(accumulated)
3Q(accumulated)
4Q(accumulated)
3Q(accumulated)
4Q(accumulated)
Domestic Affiliate SPDC Ltd. Investment and petroleum and petrochemicals-related businesses 30.39 14.7 16.3 7.1 9.9 -7.6 -6.4 -
Domestic Subsidiary Kohjin Co., Ltd. Manufacturing of specialty papers, plastic films, biochemicals andfine chemicals 100.00 1.6 1.3 2.0 2.1 0.4 0.8 1.8
Domestic Subsidiary Mitsubishi Shoji Plastics Corp. Marketing of synthetic raw materials and plastics 100.00 1.1 1.3 1.1 1.3 0.0 0.0 1.5
Overseas Affiliate Metanol de Oriente, METOR, S.A. (Venezuela) Manufacturing and marketing of methanol 25.00 0.0 0.5 0.7 1.2 0.7 0.7 1.3
Year EndingMarch 2012
Outlook
Year Ended March2010
Year Ended March2011
Main Business Shareholding(%)
Equity in earnings Increase or decreaseDomestic/Overseas
Subsidiary/Affiliate Company Name (Country)
Year EndingMarch 2012
Outlook
Year Ended March2010
Year Ended March2011
Main Business Shareholding(%)
Equity in earnings Increase or decreaseDomestic/Overseas
Subsidiary/Affiliate Company Name (Country)
Year EndingMarch 2012
Outlook
Year Ended March2010
Year Ended March2011
Main Business Shareholding(%)
Equity in earnings Increase or decreaseDomestic/Overseas
Subsidiary/Affiliate Company Name (Country)
Shareholding(%)
Equity in earnings Increase or decreaseYear EndingMarch 2012
Outlook
Year Ended March2010
Year Ended March2011
Shareholding(%)
Equity in earnings Increase or decreaseYear EndingMarch 2012
Outlook
Year Ended March2010
Year Ended March2011
Domestic/Overseas
Subsidiary/Affiliate
Performance at Principal Subsidiaries and Affiliates (by Business Group)
Domestic/Overseas
Subsidiary/Affiliate Company Name (Country) Main Business
Company Name (Country) Main Business
10
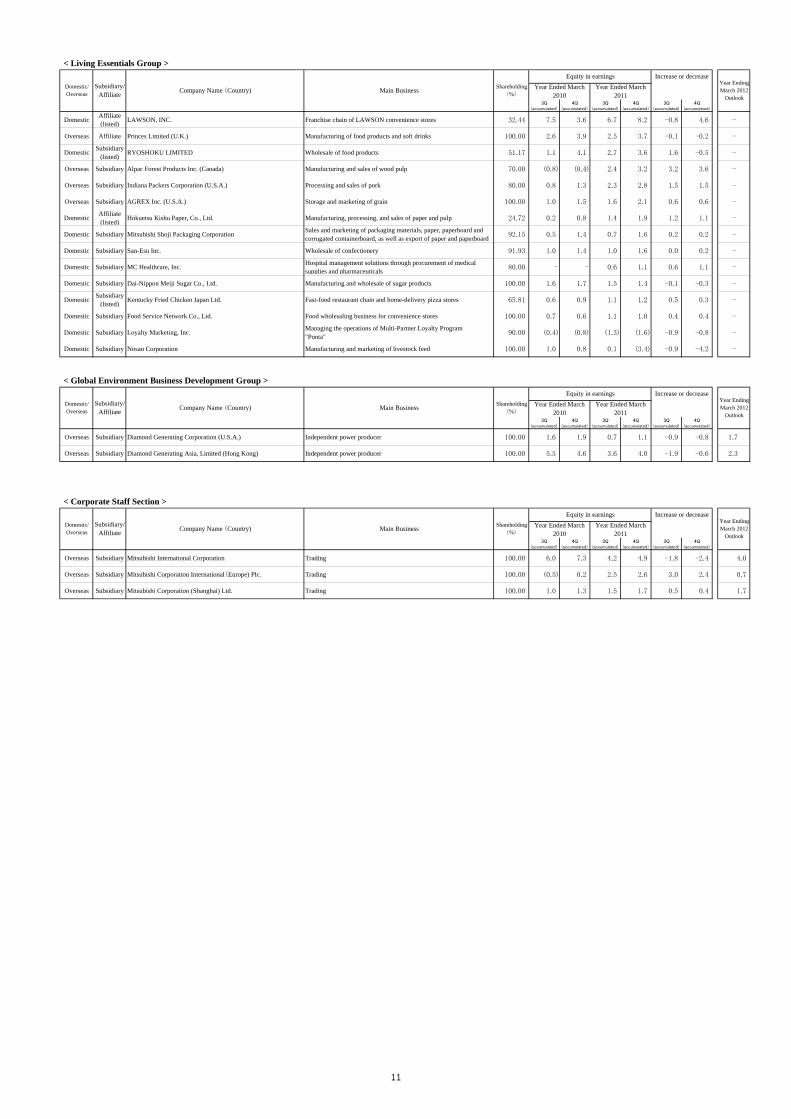
< Living Essentials Group >
3Q(accumulated)
4Q(accumulated)
3Q(accumulated)
4Q(accumulated)
3Q(accumulated)
4Q(accumulated)
Domestic Affiliate(listed) LAWSON, INC. Franchise chain of LAWSON convenience stores 32.44 7.5 3.6 6.7 8.2 -0.8 4.6 -
Overseas Affiliate Princes Limited (U.K.) Manufacturing of food products and soft drinks 100.00 2.6 3.9 2.5 3.7 -0.1 -0.2 -
Domestic Subsidiary(listed) RYOSHOKU LIMITED Wholesale of food products 51.17 1.1 4.1 2.7 3.6 1.6 -0.5 -
Overseas Subsidiary Alpac Forest Products Inc. (Canada) Manufacturing and sales of wood pulp 70.00 (0.8) (0.4) 2.4 3.2 3.2 3.6 -
Overseas Subsidiary Indiana Packers Corporation (U.S.A.) Processing and sales of pork 80.00 0.8 1.3 2.3 2.8 1.5 1.5 -
Overseas Subsidiary AGREX Inc. (U.S.A.) Storage and marketing of grain 100.00 1.0 1.5 1.6 2.1 0.6 0.6 -
Domestic Affiliate(listed) Hokuetsu Kishu Paper, Co., Ltd. Manufacturing, processing, and sales of paper and pulp 24.72 0.2 0.8 1.4 1.9 1.2 1.1 -
Domestic Subsidiary Mitsubishi Shoji Packaging Corporation Sales and marketing of packaging materials, paper, paperboard andcorrugated containerboard, as well as export of paper and paperboard 92.15 0.5 1.4 0.7 1.6 0.2 0.2 -
Domestic Subsidiary San-Esu Inc. Wholesale of confectionery 91.93 1.0 1.4 1.0 1.6 0.0 0.2 -
Domestic Subsidiary MC Healthcare, Inc. Hospital management solutions through procurement of medicalsupplies and pharmaceuticals 80.00 - - 0.6 1.1 0.6 1.1 -
Domestic Subsidiary Dai-Nippon Meiji Sugar Co., Ltd. Manufacturing and wholesale of sugar products 100.00 1.6 1.7 1.5 1.4 -0.1 -0.3 -
Domestic Subsidiary(listed) Kentucky Fried Chicken Japan Ltd. Fast-food restaurant chain and home-delivery pizza stores 65.81 0.6 0.9 1.1 1.2 0.5 0.3 -
Domestic Subsidiary Food Service Network Co., Ltd. Food wholesaling business for convenience stores 100.00 0.7 0.6 1.1 1.0 0.4 0.4 -
Domestic Subsidiary Loyalty Marketing, Inc. Managing the operations of Multi-Partner Loyalty Program"Ponta" 90.00 (0.4) (0.8) (1.3) (1.6) -0.9 -0.8 -
Domestic Subsidiary Nosan Corporation Manufacturing and marketing of livestock feed 100.00 1.0 0.8 0.1 (3.4) -0.9 -4.2 -
< Global Environment Business Development Group >
3Q(accumulated)
4Q(accumulated)
3Q(accumulated)
4Q(accumulated)
3Q(accumulated)
4Q(accumulated)
Overseas Subsidiary Diamond Generating Corporation (U.S.A.) Independent power producer 100.00 1.6 1.9 0.7 1.1 -0.9 -0.8 1.7
Overseas Subsidiary Diamond Generating Asia, Limited (Hong Kong) Independent power producer 100.00 5.5 4.6 3.6 4.0 -1.9 -0.6 2.3
< Corporate Staff Section >
3Q(accumulated)
4Q(accumulated)
3Q(accumulated)
4Q(accumulated)
3Q(accumulated)
4Q(accumulated)
Overseas Subsidiary Mitsubishi International Corporation Trading 100.00 6.0 7.3 4.2 4.9 -1.8 -2.4 4.0
Overseas Subsidiary Mitsubishi Corporation International(Europe) Plc. Trading 100.00 (0.5) 0.2 2.5 2.6 3.0 2.4 0.7
Overseas Subsidiary Mitsubishi Corporation (Shanghai) Ltd. Trading 100.00 1.0 1.3 1.5 1.7 0.5 0.4 1.7
Year EndingMarch 2012
Outlook
Year Ended March2010
Year Ended March2011
Main Business Shareholding(%)
Equity in earnings Increase or decreaseDomestic/Overseas
Subsidiary/Affiliate Company Name (Country)
Year EndingMarch 2012
Outlook
Year Ended March2010
Year Ended March2011
Main Business Shareholding(%)
Equity in earnings Increase or decreaseDomestic/Overseas
Subsidiary/Affiliate Company Name (Country)
Year EndingMarch 2012
Outlook
Year Ended March2010
Year Ended March2011
Main Business Shareholding(%)
Equity in earnings Increase or decreaseDomestic/Overseas
Subsidiary/Affiliate Company Name (Country)
11

Balance of Risk Money Outstanding in 11 Main Countries (As of March 31, 2011)
1. Change in Balance of Risk Money Outstanding (Investments, Loans and Guarantees: Consolidated Basis)
(Billion yen)2011/3/31 2010/9/30 Change 2011/3/31 2010/9/30 Change 2011/3/31 2010/9/30 Change 2011/3/31 2010/9/30 Change 2011/3/31 2010/9/30 Change 2011/3/31 2010/9/30 Change
India 8.4 7.5 0.9 0.5 0.0 0.4 1.6 0.9 0.6 10.4 8.5 1.9 - - 0.0 10.4 8.5 1.9
Indonesia 168.9 146.4 22.4 13.9 16.3 -2.4 145.0 98.5 46.6 327.8 261.2 66.6 30.0 15.4 14.7 297.8 245.8 52.0
Thailand 56.1 56.0 0.1 21.2 16.3 4.9 29.2 30.0 -0.8 106.5 102.2 4.3 - - 0.0 106.5 102.2 4.3
Korea 42.4 40.2 2.2 18.4 17.3 1.1 - - 0.0 60.7 57.5 3.3 - - 0.0 60.7 57.5 3.3
China 85.0 89.7 -4.7 9.6 - 9.6 22.9 19.1 3.8 117.4 108.8 8.6 1.3 1.3 0.0 116.1 107.5 8.6
Hong Kong 18.5 18.9 -0.3 - - 0.0 2.0 2.2 -0.2 20.5 21.1 -0.6 - - 0.0 20.5 21.1 -0.6
Philippines 51.7 55.3 -3.6 - - 0.0 0.7 0.7 0.0 52.4 56.0 -3.6 0.6 0.6 0.0 51.8 55.4 -3.6
7 countries total 431.0 413.9 17.0 63.5 49.9 13.6 201.4 151.5 50.0 695.9 615.3 80.6 32.0 17.3 14.7 663.9 598.0 65.9
Russia 125.6 132.1 -6.5 1.4 0.3 1.1 10.1 65.6 -55.5 137.0 197.9 -60.9 0.1 56.0 -56.0 136.9 141.9 -4.9
1 country total 125.6 132.1 -6.5 1.4 0.3 1.1 10.1 65.6 -55.5 137.0 197.9 -60.9 0.1 56.0 -56.0 136.9 141.9 -4.9
Mexico 8.3 8.9 -0.6 4.5 0.2 4.4 12.3 9.9 2.3 25.1 19.0 6.1 - - 0.0 25.1 19.0 6.1
Brazil 26.5 23.9 2.6 38.2 43.2 -4.9 14.3 7.3 7.0 79.0 74.4 4.6 - - 0.0 79.0 74.4 4.6
Chile 182.1 186.1 -4.0 - 2.2 -2.2 18.9 18.3 0.6 201.1 206.6 -5.6 0.1 0.9 -0.8 201.0 205.7 -4.7
3 countries total 216.9 218.9 -2.0 42.8 45.5 -2.8 45.5 35.6 9.9 305.2 300.0 5.2 0.1 0.9 -0.8 305.1 299.1 6.0
2. Change in Risk Money Outstanding (Trade Receivables, etc.: Non-consolidated Basis; Incl. Regional Subsidiaries)
(Billion yen)
India 45.7 39.5 6.2 10.9 11.9 -1.0 34.9 27.6 7.2
Indonesia 45.4 46.3 -0.9 26.5 29.7 -3.2 18.9 16.6 2.3
Thailand 22.6 18.5 4.1 7.4 7.8 -0.4 15.2 10.7 4.5
Korea 54.3 48.6 5.7 12.8 10.8 2.0 41.6 37.9 3.7
China 148.0 101.9 46.1 37.1 28.3 8.7 111.0 73.6 37.4
Hong Kong 31.7 27.8 3.8 9.5 10.5 -1.0 22.2 17.3 4.8
Philippines 2.7 2.7 0.0 0.5 0.5 -0.1 2.2 2.1 0.1
7 countries total 350.5 285.3 65.2 104.6 99.5 5.0 245.9 185.8 60.1
Russia 0.6 5.4 -4.8 0.4 0.3 0.1 0.2 5.1 -5.0
1 country total 0.6 5.4 -4.8 0.4 0.3 0.1 0.2 5.1 -5.0
Mexico 8.0 11.2 -3.2 2.1 5.2 -3.1 5.8 6.0 -0.2
Brazil 5.7 10.7 -5.0 3.0 5.2 -2.1 2.7 5.5 -2.9
Chile 6.5 7.4 -0.9 0.8 - 0.8 5.7 7.4 -1.7
3 countries total 20.2 29.3 -9.1 6.0 10.4 -4.4 14.2 18.9 -4.7
2010/9/30
Amounts Hedged Net Risk Money
Change
Investments Loans Guarantees Gross Risk MoneyTotal
Gross (Trade Receivables, etc.) Amounts Hedged Net Risk Money2011/3/31 2010/9/30 Change 2011/3/31 2010/9/30 Change 2011/3/31
12

Forecasts for Year Ending March 2012 by Operating Segment
[Gross Profit] (Billion yen)
Year endingMar. 2012Forecasts
Year endedMar. 2011
Results
Increase/decrease Main points of change
Industrial Finance, Logistics & Development 63.0 47.1 15.9 Projecting an increase in earnings on transactions in real estate-related and aircraft leasing-related businesses.
Energy Business 50.0 43.8 6.2 Projecting an increase in earnings on transactions due to rising oil prices.
Metals 404.0 326.3 77.7 Projecting an increase in earnings on transactions due to higher sales prices at anAustralian resource-related subsidiary (coking coal) and increased sales volumes.
Machinery 177.0 182.0 -5.0 Projecting a decrease due to lower earnings on transactions in overseas automobile-relatedbusinesses, etc.
Chemicals 83.0 84.2 -1.2 Projection reflects expected decline in earnings on transactions due to the sale of somebusinesses.
Living Essentials 482.0 456.8 25.2Projection reflects expected increase in earnings on transactions at food-related operatingsubsidiaries and business expansion at overseas food products-related operatingsubsidiaries.
Others 21.0 9.7 11.3
Total 1,280.0 1,149.9 130.1
[Net Income (Loss)] (Billion yen)
Year endingMar. 2012Forecasts
Year endedMar. 2011
Results
Increase/decrease Main points of change
Industrial Finance, Logistics & Development 13.0 11.6 1.4 Reflects projected increase in earnings at real estate-related, lease-related and distributionbusinesses.
Energy Business 90.0 94.0 -4.0Projection reflects absence of gains on share sales recorded in the year ended March 2011and higher exploration expenses, although gross profit and dividend income are expectedto increase on the back of rising oil prices.
Metals 230.0 230.1 -0.1The flat projection is premised on higher sales prices and volumes at an Australianresource-related subsidiary (coking coal), offset by the absence of a gain on a shareexchange at a Chilean iron ore related subsidiary recorded in the year ended March 2011.
Machinery 45.0 61.4 -16.4 Projecting a decrease due to lower equity in earnings of overseas automobile-relatedoperations, particularly in Asia.
Chemicals 28.0 29.1 -1.1 Projected decrease is premised on expected lower earnings on transactions atpetrochemical business-related companies, etc.
Living Essentials 55.0 46.3 8.7Projection reflects absence of tax expenses associated with adopting the consolidated taxfiling system in the year ended March 2011 and higher equity on earnings of food-relatedbusinesses.
Others (11.0) (9.3) -1.7
Total 450.0 463.2 -13.2
Basic Assumptions for ForecastsYear endingMar. 2012Forecasts
Year endedMar. 2011
Results
Increase/decrease
Foreign Exchange (YEN/USD) 80.0 85.7 -5.7Crude Oil Price (USD/BBL) 92.0 84.2 7.8Yen Interest (TIBOR) (%) 0.40% 0.36% 0.04%
13

Additional Information on the Parent CompanyNumber of Employees by Operating Segment and Region (Parent Company)
(Number of people)As of Mar. 31, 2010 As of Mar. 31, 2011 Increase/decrease
Japan 5,220 5,191 -29Outside of Japan 1,000 1,014 14
Total 6,220 6,205 -15*In Japan, employees on sick leave are included.
As of Mar. 31, 2010 As of Mar. 31, 2011 Increase/decrease
Industrial Finance, Logistics & Development 449 443 -6Energy Business 581 585 4Metals 669 680 11Machinery 1,029 976 -53Chemicals 671 664 -7Living essentials 1,151 1,140 -11Other 1,670 1,717 47Total 6,220 6,205 -15*Internal Audit Dept., Corporate Staff Section and Corporate Development Section are included in Other.
As of Mar. 31, 2010 As of Mar. 31, 2011 Increase/decrease
Japan 5,220 5,191 -29North America 186 182 -4Central America 18 17 -1South America 50 61 11Europe 187 191 4Africa 21 21 0Middle East 52 49 -3Asia 439 442 3Oceania 47 51 4Total 6,220 6,205 -15*In Japan, employees on sick leave are included.
14