Embed Size (px)
Citation preview

Estimating mitigation potential of agricultural projects: An application of the EX-Ante Carbon-balance Tool (EX-ACT) in Brazil
This study has been undertaken by a team of professionals from FAO and the Governments of the Santa Catarina and Rio de Janeiro States in Brazil: Giacomo Branca (FAO) and Katia Medeiros (FAO) coordinated the work, generated main results for the case studies using the Ex-Ante Carbon-balance Tool (EX-ACT) and prepared the report, with support from Aude Carro (FAO) who also conducted field work to collect relevant information for the EX-ACT application; Helga Hissa (EMBRAPA) and Marcelo Monteiro (EMATER-RIO) provided support, data collection and analysis for the realization of the case study on the Rio de Janeiro Sustainable Rural Development Project - The Rio Rural project; Mara Cristina Benez (EPAGRI), Elisângela Benedet da Silva (EPAGRI) and Vicente Sandrini Pereira (EPAGRI) provided support, data collection and analysis for the realization of the case study on the Santa Catarina Rural Competitiveness Project – The SC Rural project. The authors would like to thank: Cesar Falconi (FAO) for having granted support and overall supervision to the work; Martial Bernoux (IRD) for the guidance provided on the use of EX-ACT and the interpretation of the results; Leslie Lipper (FAO) for the helpful comments provided during the conduction of the study; Louis Bockel (FAO) as coordinator of the EX-ACT project; Alvaro Soler (World Bank Task Team Leader of the two projects used as case studies) and Ethel Sennhauser (Sector Manager Latin America and the Caribbean, World Bank) for having encouraged the choice of the projects as EX-ACT case studies and facilitated the conduction of the field work; the Governments of Santa Catarina and Rio de Janeiro States for their support to the field work; and Agnieszka Bakowska (FAO) for the assistance on the editorial and publishing process.
Estimating Mitigation Potential
of Agricultural Projects:
an Application of the
EX-Ante Carbon-balance Tool (EX-ACT)
in Brazil
Servicio de América Latina y el Caribe
División del Centro de Inversiones
Organización de la Naciones Unidas para la Agricultura y la Alimentación
Latin America, the Caribbean, East Asia and the Pacific Service Investment Centre Division Food and Agriculture Organization of the United Nations
ii
This study has been undertaken by a team of professionals from FAO and the Governments of the Santa Catarina and Rio de Janeiro States in Brazil: Giacomo Branca (FAO) and Katia Medeiros (FAO) coordinated the work, generated main results for the case studies using the Ex-Ante Carbon-balance Tool (EX-ACT) and prepared the report, with support from Aude Carro (FAO) who also conducted field work to collect relevant information for the EX-ACT application; Helga Hissa (EMBRAPA) and Marcelo Monteiro (EMATER-RIO) provided support, data collection and analysis for the realization of the case study on the Rio de Janeiro Sustainable Rural Development Project – The Rio Rural project; Mara Cristina Benez (EPAGRI), Elisângela Benedet da Silva (EPAGRI) and Vicente Sandrini Pereira (EPAGRI) provided support, data collection and analysis for the realization of the case study on the Santa Catarina Rural Competitiveness Project – The SC Rural project. The authors would like to thank: Cesar Falconi (FAO) for having granted support and overall supervision to the work; Martial Bernoux (IRD) for the guidance provided on the use of EX-ACT and the interpretation of the results; Leslie Lipper (FAO) for the helpful comments provided during the conduction of the study; Louis Bockel (FAO) as coordinator of the EX-ACT project; Alvaro Soler (World Bank Task Team Leader of the two projects used as case studies) and Ethel Sennhauser (Sector Manager Latin America and the Caribbean, World Bank) for having encouraged the choice of the projects as EX-ACT case studies and facilitated the conduction of the field work; the Governments of Santa Catarina and Rio de Janeiro States for their support to the field work; and Agnieszka Bakowska (FAO) for the assistance on the editorial and publishing process.
Internal TCI No: 10/002 FAO-BRA
The designations employed and the presentation of material in this information product do not imply the expression of any opinion whatsoever on the part of the Food and Agriculture Organization of the United Nations concerning the legal or development status of any country, territory, city or area or of its authorities, or concerning the delimitation of its frontiers or boundaries.
All rights reserved. Reproduction and dissemination of material in this information product for educational or other non-commercial purposes are authorized without any prior written permission from the copyright holders provided the source is fully acknowledged. Reproduction of material in this information product for resale or other commercial purposes is prohibited without written permission of the copyright holders. Applications for such permission should be addressed to: Director, Investment Centre, FAO, Viale delle Terme di Caracalla, 00153 Rome, Italy, or by e-mail to [email protected]
ESTIMATING MITIGATION POTENTIAL
OF AGRICULTURAL PROJECTS:
AN APPLICATION OF THE
EX‐ANTE CARBON‐BALANCE TOOL (EX‐ACT)
IN BRAZIL
Prepared by
Giacomo Branca Katia Medeiros
Working Paper LAC/03/10
April 2010
Latin America, the Caribbean, East Asia and the Pacific Service Investment Centre Division Food and Agriculture Organization of the United Nations

Estimating mitigation potential of agricultural projects: An application of the EX-Ante Carbon-balance Tool (EX-ACT) in Brazil
ESTIMATING MITIGATION POTENTIAL OF AGRICULTURAL PROJECTS:
AN APPLICATION OF THE
EX-ANTE CARBON-BALANCE TOOL (EX-ACT) IN BRAZIL
TABLE OF CONTENTS
TABLE OF CONTENTS .............................................................................................. iii LIST OF ABBREVIATIONS AND ACRONYMS..................................................... vi EXECUTIVE SUMMARY .......................................................................................... vii
1. INTRODUCTION .......................................................................................................... 1 1.1 Agricultural mitigation and rural development in Brazil: possible synergies ... 1 1.2 Objectives and structure of the document............................................................. 2
2. THE EX-ANTE CARBON-BALANCE TOOL (EX-ACT) ........................................ 4 2.1 General description of the tool ............................................................................... 4 2.2 Methodological aspects............................................................................................ 5 2.3 EX-ACT structure ................................................................................................... 6 2.4 Cost-benefit analysis and financing options for agriculture development and mitigation projects ................................................................................................... 8
3. THE CASE OF THE SANTA CATARINA RURAL COMPETITIVENESS PROJECT (SC RURAL) ....................................................................................................... 12
3.1 Background ............................................................................................................ 12 3.2 The SC Rural project profile ................................................................................ 13
3.2.1 Project objectives and financing .............................................................. 13 3.2.2 Project components ................................................................................... 14
3.3 Potential mitigation impact of project activities and land use implications..... 16 3.3.1 Structure of the analysis ........................................................................... 17 3.3.2 Basic assumptions of the analysis............................................................. 17 3.3.3 Expansion of training and extension services (pre-investment

Estimating mitigation potential of agricultural projects: An application of the EX-Ante Carbon-balance Tool (EX-ACT) in Brazil
iv
activities)..................................................................................................... 18 3.3.4 Diversification and enhancement of production systems ...................... 19 3.3.5 Support to the implementation of small-scale agro-industry and to the construction of sanitary installation ...................................... 27 3.3.6 Improved/legalized production systems .................................................. 28 3.3.7 Ecological corridors and land rehabilitation .......................................... 31
3.4 A summary of the project mitigation potential: C-balance and land use change............................................................................................................... 32 3.5 Sensitivity analysis ................................................................................................. 35
3.5.1 Main parameter sensitivity....................................................................... 35 3.5.2 Scenario sensitivity .................................................................................... 36
3.6 Economic analysis .................................................................................................. 38
4. THE CASE OF THE RIO DE JANEIRO SUSTAINABLE RURAL DEVELOPMENT (RIO RURAL) PROJECT .................................................................... 39
4.1 Background ............................................................................................................ 39 4.2 The Rio Rural project profile ............................................................................... 40
4.2.1 Project objectives and financing .............................................................. 40 4.2.2 Project components ................................................................................... 41
4.3 Potential mitigation impact of project activities ................................................. 42 4.3.1 Structure of the analysis ........................................................................... 42 4.3.2 Basic assumptions of the analysis............................................................. 45 4.3.3 Protection of springs and streams and support to the establishment of RLs.......................................................................................................... 46 4.3.4 Expansion of agro-forestry systems......................................................... 49 4.3.5 Improved annual crop management........................................................ 51 4.3.6 Improved grassland management............................................................ 54 4.3.7 Improved feeding practices of dairy cattle.............................................. 55 4.3.8 Support to small agro-industry ................................................................ 56 4.3.9 Use of lime to fight soil acidification and sustainable use of agro- chemicals .......................................................................................... 57 4.3.10 Technical assistance for project implementation ................................. 57
4.4 A summary of the project mitigation potential: C-balance and land use change............................................................................................................... 59 4.5 Sensitivity analysis ................................................................................................. 61
4.5.1 Main parameter sensitivity....................................................................... 61 4.5.2 Scenario sensitivity .................................................................................... 62
4.6 Economic analysis .................................................................................................. 63
5. COMPARATIVE ANALYSIS..................................................................................... 64 5.1 Synergies among the two projects ........................................................................ 64
5.1.1 Objectives ................................................................................................... 64 5.1.2 Ecoregions, land use and land use change .............................................. 64 5.1.3 Projects’ operational and technical strategy........................................... 65 5.1.4 Positive externalities and mitigation potential by project activity........ 66
5.2 Differences between the two projects................................................................... 66

Estimating mitigation potential of agricultural projects: An application of the EX-Ante Carbon-balance Tool (EX-ACT) in Brazil
v
5.2.1 Contribution of the projects to the state economy ................................. 66 5.2.2 Project area ................................................................................................ 67 5.2.3 Biodiversity conservation and management approaches....................... 67 5.2.4 Project mitigation potential...................................................................... 68
6. CONCLUSIONS ........................................................................................................... 69
7. REFERENCES.............................................................................................................. 72
ANNEXES Annex 1. Map of the State of Santa Catarina (Brazil) Annex 2. Map of the ecological corridors supported under the SC Rural project Annex 3. Map of the Rio Rural project area Annex 4. EX-ACT tables of the SC Rural project Annex 5. EX-ACT tables of the Rio Rural project

Estimating mitigation potential of agricultural projects: An application of the EX-Ante Carbon-balance Tool (EX-ACT) in Brazil
vi
LIST OF ABBREVIATIONS AND ACRONYMS
APP Areas of Permanent Preservation C Carbon CBA Cost Benefit Analysis CC Climate Change CDM Clean Development Mechanism CH4 Methane CO2 Carbon Dioxide CO2e Carbon Dioxide Equivalent EMBRAPA Agricultural Research Enterprise of Brazil EMATER State Rural Extension Agency (Rio de Janeiro) EPAGRI State Agricultural Research and Rural Extension Enterprise (Santa Catarina) ESA FAO’s Agricultural Development Economics Division EX-ACT EX-Ante Carbon-balance Tool FAO Food and Agriculture Organization of the United Nations FAPO Family Agriculture Producer Organization FATMA Santa Catarina State Environmental Foundation FDR State Rural Development Fund GHG Green House Gas GWP Global Warming Potential HAC High Activity Clay (soil type) HWP Harvested Wood Product INPE Brazil's National Institute for Space Research IPCC Intergovernmental Panel on Climate Change IRD Institut de Recherche pour le Développement, Montpellier, France IRDB International Bank for Reconstruction and Development LAC Low Activity Clay (soil type) LULUCF Land Use, Land Use Change and Forestry MRV Measuring, Reporting and Verification NO2 Nitrous Oxide ODA Official Development Assistance PRONAF Brazil’s Program to Assist Family Agriculture Rio Rural Rio de Janeiro Sustainable Rural Development project RL Legal Reserve SAR Santa Catarina State Secretariat of Agriculture and Rural Development PES Payments for Environmental Services SC Rural Santa Catarina Rural Competitiveness project SDS SEAPPA’s Super-Intendancy of Sustainable Development. SEAPPA Rio de Janeiro State Secretariat of Agriculture, Fisheries and Rural
Development SFFs Small family-farms SoRJ State of Rio de Janeiro SoSC State of Santa Catarina TCI FAO’s Investment Centre Division TCS FAO’s Policy and Programme Development Support Division UNFCCC United Nations Framework Convention on Climate Change VCS Voluntary Carbon Standard

Estimating mitigation potential of agricultural projects: An application of the EX-Ante Carbon-balance Tool (EX-ACT) in Brazil
vii
EXECUTIVE SUMMARY
Agriculture can play an important role in climate change mitigation while contributing to increased food security and reductions in rural poverty. The EX-Ante Carbon-balance Tool (EX-ACT) can estimate the mitigation potential of rural development projects generated from changes in farming systems and land use. The study presents and discusses the EX-ACT analysis performed on two World Bank-supported projects in Brazil (Santa Catarina Rural Competitiveness and Rio de Janeiro Sustainable Rural Development). The projected estimates of the impact of project activities on green house gas emissions and Carbon sequestration demonstrate the additional environmental benefits achieved through protecting forested areas (riparian zones, ecological corridors), enhancing production systems (promotion of improved cropland and grasslands management) and expanding agro-forestry and perennial systems. The study demonstrated possible synergies between mitigation and rural development goals while the EX-ACT sensitivity analysis has indicated that projected results will be intermediate between “pessimistic” and “optimistic” scenarios. Cost-benefit analysis showed that both projects would generate environmental benefits associated with climate change mitigation. However, the Santa Catarina Rural Competitiveness project demonstrated higher mitigation potential, a result primarily due to the size of the project area and the nature of the development activities, thus providing a better opportunity to be eventually considered for public co-financing for low-Carbon agriculture.

Estimating mitigation potential of agricultural projects: An application of the EX-Ante Carbon-balance Tool (EX-ACT) in Brazil
1
1. INTRODUCTION
1.1 Agricultural mitigation and rural development in Brazil: possible synergies
1.1 Agriculture is a major source of Green House Gas (GHG), contributing 14% of global emissions or about 6.8 Gt of CO2 equivalents per year (IPCC 2007). Climate change (CC) mitigation potential for the sector is high and many of the technical options are readily available and could be deployed immediately by:
reducing emissions of Carbon Dioxide (CO2) through reduction in the rate of deforestation and forest degradation, adoption of improved cropland management practices;
reducing emissions of Methane (CH4) and Nitrous Oxide (NO2) through improved animal production, improved management of livestock waste, more efficient management of irrigation water on rice paddies, improved nutrient management; and
sequestering Carbon (C) through conservation farming practices, improved forest management practices, afforestation and reforestation, agro-forestry, improved grasslands management, restoration of degraded land.
1.2 Considering that 74% of agriculture’s mitigation potential is estimated to be in developing countries (UNFCCC 2008), many agriculture (and forestry) development projects could play an important role in CC mitigation - either by reducing emissions or by sequestering C, at the same time that they contribute to increase food security and reduce rural poverty - 75% of the world’s poor live in rural areas in developing countries, and most depends on agriculture for their livelihoods (World Bank 2008).
1.3 Brazil stands out as a promising country which has developed a series of mitigation strategies for agriculture and livestock. The most relevant sectors in Brazil, both in terms of emissions as well as abatement opportunities, are those related to land use. Deforestation, especially in the Amazons, is Brazil’s largest source of GHG emissions (55% of the total). Agriculture, including livestock, accounts for 25% of emissions: half of such emissions come from cattle production (enteric fermentation and organic wastes) while the other half comes from agricultural practices as crop residues burning and excessive use of nitrogen fertilization (Mc Kinsey&Company 2009).
1.4 Cerri et al. (2009) highlighted that the modernization process of the Brazilian cattle production will result in productivity gains and consequently lower GHG emissions, from both enteric fermentation and higher pasture occupation. Moreover, Brazil has been endeavouring over four decades to improve agriculture through more productive and sustainable cropping systems (almost 20 million hectares are under no tillage systems) and, more recently, has committed to abolish the practice of burning off land prior to planting.

Estimating mitigation potential of agricultural projects: An application of the EX-Ante Carbon-balance Tool (EX-ACT) in Brazil
2
1.5 These and other sustainable practices can considerably increase crop productivity and food security, while contributing to mitigate climate change, both reducing emissions or enhancing Carbon sinks, besides recent decrease in deforestation rate. Because several mitigation strategies have already proven to be efficient, simple to be adopted and economically viable, it is now a top priority to Brazil to implement a national program to promote mitigation efforts concerning rural development and the agricultural (and forestry) sector.
1.6 The increased availability of information from spatially referenced databases will be particularly useful for identifying potential synergies between food security and agricultural mitigation. For example, overlaying the FAO “Carbon-gap” map – that allows for the identification of areas where increases in soil C storage are potentially greatest (FAO 2007) – with Hunger maps reveals that areas with large food insecure populations often have large Carbon-gaps (FAO 2009). Also, in Latin America and Caribbean Region, the Empresa Brasileira de Pesquisa Agropecuária (EMBRAPA) leads the generation of spatial soil C information for Brazil, Costa Rica and other countries in Latin America to develop digitalized soil database to support decision making on CC mitigation strategies in the agriculture, livestock and forestry sectors1.
1.7 However, the lack of methodologies to help project designers to identify and integrate more significant cost-efficient CC mitigation efforts in agriculture and forestry management is a major barrier to increase the adoption of CC approaches in development programs and, when applicable, to facilitate the access of agriculture and forestry sectors to C markets.
1.2 Objectives and structure of the document
1.8 In this context, models are being developed to estimate the mitigation potential from changes in agricultural production systems and to support project managers on CC mitigation decision making. EX-ACT (EX-Ante Carbon-balance Tool) is one of such models developed by FAO to provide an ex-ante evaluation of the impact of rural development projects on GHG emissions and C sequestration, thus estimating the potential contribution of agriculture (and forestry) sector to CC mitigation (see section 2).
1.9 During EX-ACT initial experimental phase, FAO approached a number of government institutions in Africa, Asia and South America, who were formulating new agricultural and rural development projects, to inquire about their interest in using their projects’ data to test EX-ACT. Projects used as case-studies for the testing process have been selected with the aim of representing a wide range of different ecosystems worldwide (e.g. tropical, temperate, semi-arid), agriculture activities (e.g. annual/perennial crops, forestry, livestock, grasslands) and geographic coverage. Results of the tests have been used by FAO to improve the methodology and to increase the consistency of EX-ACT results.
1.10 The objective of this report is to present the results of EX-ACT tests on two rural development projects located in South America. Two Brazilian state governments - Rio de Janeiro and Santa Catarina - volunteered to participate in the tool field testing process from September 2009 to February 2010 with the following projects: the Rio de Janeiro Sustainable Rural Development project (Rio Rural), currently under its start-up phase, and financed through a World
1 See http://www.cnps.embrapa.br/noticias/banco_noticias/20090218.html
Estimating mitigation potential of agricultural projects: An application of the EX-Ante Carbon-balance Tool (EX-ACT) in Brazil
3
Bank loan (50% of total cost) and State Government own resources (50%); and the proposed Santa Catarina Rural Competitiveness project, under final preparation stage, foreseen for funding through a World Bank loan (50% of total cost) and State Government own resources (50%).
1.11 These tests have been used to provide project designers with information about the potential mitigation impact of different and alternative project scenarios. EX-ACT has therefore been used as a guidance tool during the project design process, assisting project developers to refine project components so to increase, whenever possible, the environmental benefits of the project. The analysis provided also a basis to enter a C financing logic by highlighting the practices with the highest mitigation potential which could be extended either during the project implementation phase or in investment programs.
1.12 It is worth to notice that these projects represent the first cases of application of EX-ACT in the phases of appraisal and pre-start-up of relatively large projects, and that the results shown in what follows should be considered only as preliminary. They could therefore be subject to change as a result of possible adjustments in the methodology adopted in further development of the tool. It should also be noticed that the two project teams are planning to downscale the application of the tool to project’s lowest territorial level – the micro watershed level (about 930 watersheds in Santa Catarina and 270 in Rio de Janeiro project areas, with average micro watershed surface ranging from 1,000 to 3,000 ha). This downscaling is expected to allow the collection of more accurate data, hence consolidating and improving results of the application of EX-ACT analysis in these states.
1.13 This work has been carried out by FAO in partnership with the Santa Catarina State Secretariat of Agriculture and Rural Development (SAR) and the Rio de Janeiro State Secretariat of Agriculture, Fisheries and Rural Development (SEAPPA). The team responsible for the work in Santa Catarina is part of the SAR’s Rural Extension and Research Enterprise (EPAGRI). In Rio de Janeiro, the team is staffed under SEAPPA’s Super-Intendancy of Sustainable Development.
1.14 The report is organized as follows. Chapter 2 provides a description of EX-ACT and its methodology, followed by a short discussion on the potential use of EX-ACT results in cost-benefit analysis and financing options for agriculture development and mitigation projects. Chapters 3 and 4 present the case-studies of Santa Catarina Competitiveness and Rio de Janeiro Sustainable Rural Development projects, respectively, including: a brief description of each project followed by the actual EX-ACT application, an analysis of the potential mitigation impact of project activities and land use implications, the sensitivity and economic analyses. For the specific purpose of comparison between mitigation potential of the two projects, Chapter 5 provides a comparative analysis. Main conclusions are presented in Chapter 6. In the annexes the maps of project areas (annexes 1-3) and the complete tables of the EX-ACT analysis for both projects (annexes 4-5) are shown.

Estimating mitigation potential of agricultural projects: An application of the EX-Ante Carbon-balance Tool (EX-ACT) in Brazil
4
2. THE EX-ANTE CARBON-BALANCE TOOL (EX-ACT)
2.1 General description of the tool
2.1 EX-ACT (EX-Ante Carbon-balance Tool) is a tool developed by the Food and Agriculture Organization of the United Nations (FAO)2 and aimed at providing ex-ante measurements of the impact of agriculture (and forestry) development projects on GHG emissions and C sequestration, indicating its effects on the C-balance3, which is selected as an indicator of the mitigation potential of the project. The tool was built as a response to the increasing interest of agriculture and rural development project designers in quantifying the impact of project activities on biomass and soil C and in integrating significant mitigation effects in project components.
2.2 A big challenge in the area of CC mitigation is the management of terrestrial ecosystems to conserve existing C stocks and to remove C from the atmosphere by adding to stocks (Malhi et al. 1999). Land use change can modify land cover and cause an associated change in C stocks (Bolin and Sukumar 2000). The change from one ecosystem to another could occur naturally or be the result of human activity such as food production. Each ecosystem has an equilibrium C content depending on vegetation, soil and climatic conditions, inflows and outflows of the pool. The equilibrium between C inflows and outflows in soil is disturbed by land use change until a new equilibrium is eventually reached in the new ecosystem. During this process, soil and biomass may act either as a C source or as a C sink according to the ratio between inflows and outflows (Guo and Gifford 2002). Being a land-based accounting system, EX-ACT can take into consideration this process by measuring C stocks and stock changes per unit of land, as well as CH4 and N2O emissions expressed in t CO2e ha-1 and t CO2e yr-1.
2.3 EX-ACT can be used in the context of ex-ante project formulation and it is capable of covering the range of projects relevant for the land use, land use change and forestry (LULUCF) sector. It can compute the C-balance by comparing two scenarios: “without project” (i.e. the “Business As Usual” or “Baseline”) and “with project”. Main output of the tool consists of the C-balance resulting from the difference between these two alternative scenarios (figure 2.1).
2.4 The model takes into account both the implementation phase of the project (i.e. the active phase of the project commonly corresponding to the investment phase), and the so called “capitalization phase” (i.e. a period where project benefits are still occurring as a consequence of the activities performed during the implementation phase). Usually, the sum of the implementation and capitalization phases is set at 20 years. EX-ACT was designed to work at a project level but it can easily be up-scaled at program/sector or national level (Bernoux et al. 2010a; Cerri et al. 2010).
2 EX-ACT is the product of the joint work of three Divisions of FAO: Agricultural Development Economics
(ESA), Investment Centre (TCI), Policy and Programme Development Support (TCS). 3 C-balance = GHG emissions - C sequestered above and below ground.

Estimating mitigation potential of agricultural projects: An application of the EX-Ante Carbon-balance Tool (EX-ACT) in Brazil
5
Figure 2.1: Quantifying C-balance “with” and “without project” using EX-ACT
Time (years)
t0
Implementation phase
With project
Without project
Capitalization phase
t1 t2
x0
x1
x2
C balance (reduced GHG emissions and C sequestered)
Source: Bernoux et al. 2010b
2.2 Methodological aspects
2.5 EX-ACT has been developed using mostly the Guidelines for National Greenhouse Gas Inventories (IPCC 2006) complemented with other methodologies and review of default coefficients for mitigation option as a base. Default values for mitigation options in the agriculture sector are mostly from IPCC (2007). Other coefficients come from published reviews or international databases. For instance embodied GHG emissions for farm operations, transportation of inputs, and irrigation systems implementation are from Lal (2004) and electricity emission factors are based on data from the International Energy Agency (IEA).
2.6 Most calculations in EX-ACT use a Tier 1 approach4 as default values are proposed for each of the five pools defined by IPCC guidelines and UNFCCC: above-ground biomass, below-ground biomass, soil, deadwood and litter. It should be highlighted that EX-ACT also allows users to incorporate specific coefficients (e.g. from project area) in case they are available (Tier1/Tier2 approach).
2.7 Default values for above ground biomass correspond to estimates provided by IPCC (2006) and are expressed in ton of dry matter per ha (t dm/ha). The corresponding Carbon stock (in ton of C) is calculated using the specific C content indicated, e.g. 0.47 for above-ground forest
4 IPCC Guidelines provide three methodological tiers varying in complexity and uncertainty level: Tier1, simple
first order approach which uses data from global datasets, simplified assumptions, IPCC default parameters (large uncertainty); Tier 2, a more accurate approach, using more disaggregated activity data, country specific parameter values (smaller uncertainty); Tier 3, which makes reference to higher order methods, detailed modeling and/or inventory measurement systems driven by data at higher resolution and direct measurements (much lower uncertainty).

Estimating mitigation potential of agricultural projects: An application of the EX-Ante Carbon-balance Tool (EX-ACT) in Brazil
6
biomass. As concerns below-ground biomass, EX-ACT uses the default values for the ratio (R) between below-ground biomass and above-ground biomass provided by IPCC (2006) - e.g. R is 0.37 for all tropical rainforest and 0.27 for Tropical mountain systems. Litter and dead wood pools are zero in all non-forest categories (excluding tree crops and perennial systems) and for soil C estimates, default values are based on references for soil organic C stocks in mineral soils at a depth of 30 cm (Bernoux et al. 2010a).
2.8 As relates to N2O and CH4 emissions, the generic approach consists of multiplying an emission factor for a specific gas or source category with activity data related to the emission source (e.g. size of area or number of animals). These emissions are converted into CO2e emissions based on the global warming potential (GWP) coefficients5, either the official values under the Kyoto Protocol of the UNFCCC or the last update provided by IPCC (2007) (Bernoux et al. 2010a).
2.9 In terms of dynamics, land use changes associated with the establishment of project activities and the rate of adoption of land management options occur only in the implementation phase. Therefore, it is assumed that all project activities will be completed in the project timeframe and that no additional change in land use and management will take place in the capitalization phase. The EX-ACT default assumption for the land use and management change is a “linear” function over time, although the software allows for adopting a different dynamic of change, e.g. “immediate” or “exponential” (figure 2.2), depending on the characteristics of the specific project activity and on the information available on the adoption rate of the selected practice among project participants. This aspect is often considered in the sensitivity analysis where different rates of adoption are taken into account.
Figure 2.2: Schematic representation of the dynamics of change in the implementation phase
Ab
so
lute
Ch
an
ge
(x1-x
0)
t0 t1
“Immediate” “Linear” “Exponential”
t0 t1 t0 t1Time (years)
Source: Bernoux et al. 2010b
2.3 EX-ACT structure
2.10 EX-ACT consists of a set of Microsoft Excel sheets in which project designers insert information on dominant soil types and climatic conditions of project area together with basic data
5 The GWP is a measure of how much a given mass of greenhouse gas is estimated to contribute to global
warming. It is a relative scale which compares the gas in question to that of the same mass of carbon dioxide (whose GWP is by convention equal to 1).

Estimating mitigation potential of agricultural projects: An application of the EX-Ante Carbon-balance Tool (EX-ACT) in Brazil
7
on land use, land use change and land management practices foreseen under projects’ activities as compared to a business as usual scenario (Bernoux et al. 2010a).
2.11 EX-ACT adopts a modular approach – each “module” describing a specific land use – and following a three-step logical framework: general description of the project, identification of changes in land use and technologies foreseen by project activities, and computation of C-balance in the “with” and “without project” scenarios (figure 2.3).
Figure 2.3: General structure of EX-ACT
Components of the ProjectDeforestation Afforestation and ReforestationOther Land Use ChangeAgriculture
Annual CropsAgroforestry/Perennial Crops
Rice GrasslandOther GHG Emissions
LivestockInputs
Project Investment
Matrix (Synthesis of
LULUCF)
Description
Climate
Soil
Ecol-Zone
Sub-Modules
List
OtherCoeff.
IPCCdefaults
Variables andcoefficients
Modular approach
Related to land areas
Results (total, per ha, per ha and per year)
Source: Bernoux et al. 2010a
2.12 This three step logical approach should be adopted by the EX-ACT user which will: use the module called “description” to summarise relevant project characteristics (geographic area, climate and soil characteristics, project timeframe)6; use the relevant module(s) depending on project activities, choosing among the modules available (deforestation, afforestation/reforestation, land use change, annual and perennial crops, irrigated rice cropping, grasslands, livestock, inputs, energy and construction building); and estimate the project mitigation potential as a consequence of the land use and management change induced by project activities.
6 Three sub-modules on dominant soil type, climatic characteristics and soil ecological zone are also available,
providing the user with more detailed information.

Estimating mitigation potential of agricultural projects: An application of the EX-Ante Carbon-balance Tool (EX-ACT) in Brazil
8
2.13 The “deforestation” module can be used to either quantify emissions from deforestation, or for the case of avoided deforestation. This module – as well as the “afforestation/reforestation” one – takes into account the vegetation types consistent with climatic characteristics of project area.
2.14 For land use/management related modules, the user should describe the management options adopted under project activities. For example, the module “annual” (related to management of annual crops) takes into account practices such as nutrient management, tillage/residue management, water management and other techniques that increases yields and/or generates higher inputs of C residue leading to increased soil C storage; the “rice” module takes into consideration flooded rice fields, accounting for CH4 emissions produced from anaerobic decomposition of organic matter and non-CO2 GHG emissions (CH4 and N2O) from biomass burning; the module “perennials” deals with perennial or semi-perennial systems (e.g. agro-forestry) and the module “grasslands” deals with pasture degradation and rehabilitation.
2.15 A specific module takes into consideration the impact on the C-balance of land use change which is not accounted in other modules (e.g. from degraded land to annual cropland, or from grasslands to agro-forestry) while three modules are not specifically land-based and account for GHG emissions from livestock (and associated manure), inputs (agro-chemicals), energy use (electricity and fuel) and infrastructure building (e.g. irrigation systems, construction building).
2.4 Cost-benefit analysis and financing options for agriculture development and mitigation projects
2.16 Farmers can become important suppliers of climate change mitigation services – at different degrees of trade-off with agricultural production – by encouraging increased sequestration and long-term storage of C in plant biomass and soil organic matter (FAO 2007). This can be done by integrating conservation measures into their production process (e.g. reducing tillage or leaving more crop residues on fields, can enhance soil fertility, reduce the need for chemical inputs as well as increasing soil C sequestration potential), diverting land from crop and livestock production to other uses (e.g. set-aside, i.e. the practice of leaving a proportion of farm land uncultivated or put to non-agricultural use for a period of time) or avoiding a change in land use (e.g. not converting land from forest to agriculture).
2.17 In this frame, a tool to assess the potential magnitude of such benefits would be of great relevance for crediting GHG emissions reductions and providing a basis for receiving public or private financing from the C sector. Since the agricultural sectors of developing countries have undergone years of declining investment and neglect, a new injection of financing for the sector is required. Mitigation financing for agriculture is one potentially significant source which can play two important roles: providing increased investment flows to the agricultural sector of developing countries, and/or providing increased incomes to farmers in the form of C payments. Mitigation finance could be either public or market-based and integrated with existing official development assistance (ODA). Rural development projects involving the implementation of sustainable land management practices could therefore obtain funds from C finance related to mitigation benefits (Branca et al. 2010).

Estimating mitigation potential of agricultural projects: An application of the EX-Ante Carbon-balance Tool (EX-ACT) in Brazil
9
2.18 As already discussed above, EX-ACT can be used to assess the mitigation potential of agricultural projects corresponding to different land use patterns simulated in project scenarios. Based on this estimate, it is possible to classify projects which are of interest for agricultural development:
Type 0 – no mitigation potential;
Type 1 – low mitigation potential;
Type 2 – medium mitigation potential; and
Type 3 – high mitigation potential.
2.19 Type 0 projects have no mitigation potential (e.g. they are a net source of GHG emissions) and they have not been taken into consideration here as they cannot benefit from any additional financing from the C sector. On the contrary, type 1 to type 3 projects show a mitigation potential since the activities implemented are able to increase biomass above and below ground and/or soil organic C, albeit with a different intensity (figure 2.4).
2.20 Type 1 projects have a low mitigation potential so that the mitigation benefits are smaller than the costs for monitoring, reporting and verifying (MRV) C mitigation activities, so that there would be no space for additional project financing from C mitigation sources (ODA public funds remain the main financing source for this category of projects). Type 1 projects are therefore pure Agricultural development projects (e.g. agricultural projects aimed at increasing crop productivity and enhancing food security or rural development projects with the goal of increasing farmers’ competitiveness) and any positive impact on climate change mitigation as well on other environmental services7 could be considered as a positive externality8. However, these benefits could be valued using the C market price and eventually included in a Payments for Ecosystem Services (PES) scheme9.
2.21 For type 2 projects the benefits of pursuing low-C agricultural strategies may be greater than the costs associated with adoption of basic MRV for public implementation. In this case, public funding may be a possible financing source which could integrate ODA funds, as project offsets are considered as public goods10 and therefore purchased by a public institution.
7 Environmental services are defined as all benefits that humans receive from ecosystems. These benefits can be
direct (e.g. food production) or indirect, through the functioning of ecosystem processes that produce the direct services (e.g. climate regulation, water regulation and purification, pollination, cultural services). For example, a forest at the source of a river will provide more than fruits or timber. It will also play a role in water quality protection (filtering the water as it flows through roots and soil), flood control (reducing runoff and erosion), C storage and sequestration (in the form of additional biomass), biodiversity conservation (providing habitat for plants or animals living in the woods) and landscape aesthetics.
8 An externality is a cost or benefit resulting from an economic transaction that is borne or received by parties not directly involved in the transaction. An externality occurs when the consumption or production of a good impacts on people other than the producers or consumers that are participating in the market for that good. Externalities can be either negative (e.g. water pollution caused by industrial production) or positive (e.g. the role of agriculture in maintaining the countryside and rural communities).
9 PES are economic incentives which seek to internalize environmental costs or benefits into production and/or consumption decisions and induce more efficient use of natural resources.
10 Many environmental services have in fact the characteristic of "public goods" in that people usually cannot be excluded from benefiting from them, and the use of the service by one person does not diminish the

Estimating mitigation potential of agricultural projects: An application of the EX-Ante Carbon-balance Tool (EX-ACT) in Brazil
10
This is the case, for example, of a project aimed at implementing agricultural practices that improve agricultural productivity and resilience and thus contribute to food security in developing countries (e.g. zero tillage with incorporation of crop residues in the soil will increase soil C storage, while increasing crop yields through improved soil fertility and water holding capacity). In the future, with mitigation becoming part of public sector global development objectives, it is plausible that the importance of these agriculture multipurpose projects will increase.
2.22 For type 3 projects, mitigation benefits are greater than the costs of adopting and meeting C crediting MRV requirements (presumably higher than MRV for public sector options) so that C crediting mechanisms are a suitable source of financing for this category of projects. This is the case, for example, of projects aimed at producing C credits from agriculture in developed countries to be sold on the (voluntary or mandatory) C markets11.
Figure 2.4: Financing options for agriculture development and mitigation projects
Source: adapted from FAO 2009.
2.23 It is not easy to estimate the transaction costs related to the accounting of C activities at public or market level, given the lack of information and the fact that data available are not in standard format to allow accurate comparison. Therefore more research is needed on this topic. Nevertheless, for the purpose of this note, it is assumed that the transaction costs for public implementation are equal to 4 US$/t CO2e (per hectare and per year) which is an arbitrary but plausible value based on some literature available (Cacho et al.
availability of that service to other users. Consumption of "public goods" is non-rival (consumption of the good by one does not reduce the amount left for others) and non-excludable (individuals cannot be excluded from consuming the good). Many environmental services, ranging from flood control to climate stability, provide non-rival and non-excludable benefits.)
11 For example, the Chicago Climate Exchange (CCX) has developed simple, standardized rules for issuing contracts for C emission soil sequestration activities in the agricultural sector. Eligible agricultural soil C sequestration projects include continuous conservation tillage and grass planting. See the Continuous Conservation Tillage and Conversion to Grassland Soil Carbon Sequestration Offsets sold on CCX (http://www.chicagoclimatex.com).
Type 1 Type 2 Type 3

Estimating mitigation potential of agricultural projects: An application of the EX-Ante Carbon-balance Tool (EX-ACT) in Brazil
11
2005; Lipper at al. 2010; Mooney et al. 2004). The transaction costs for selling C credits on the market will be obviously higher, given the number and type of requirements, e.g. establish baseline and C flows of the project, design monitoring plan, establish permanent sampling plots, prepare project design document, design individual farm plans, monitor C stocks reported by farmers, verification and certification (Cacho and Lipper 2006).

Estimating mitigation potential of agricultural projects: An application of the EX-Ante Carbon-balance Tool (EX-ACT) in Brazil
12
3. THE CASE OF THE SANTA CATARINA RURAL COMPETITIVENESS PROJECT (SC RURAL)
3.1 Background12
3.1 The south Brazil State of Santa Catarina (SoSC) has an estimated land area of 95,346 km² and a population of some 6.1 million, 80% of which live in urban areas. The State’s economy is based primarily on the services sector (58.6% of the state’s GDP), followed by the industrial sector (34.5%), and agriculture (6.9%). Nationally, the SoSC accounted for 4% of GDP (about US$37 billion) in 2006 and, by 2008, it had expanded to 5.85% outpacing the national average of 5.1%.
3.2 SoSC is characterized by a rich natural resource base, including 42% of land covered with native forests and 9% by natural grasslands. The State’s water resources consist of two major river basins systems spanning 23 main watersheds. Livestock, agriculture and forestry represent 31%, 16% and 7% of the state’s total land use, respectively.
3.3 Agriculture plays an important role in SoSC political economy. Though accounting for only 7% of state GDP, when considered along with agro industry, the sector generates nearly 60% of SoSC exports and employs 40% of the labor force. Agricultural export growth is consistently above 15% annually. One-half of the state’s agricultural output is livestock-based, with another 41% accounted for by perennial crops and with forestry accounting for the remaining 9%. Agricultural exports consist mainly of meat (e.g. poultry and swine) and wood (e.g. furniture and cellulose).
3.4 Agriculture remains in fact vital to social well-being in the SoSC. About 20% of the SoSC’s population live in rural areas, of which some 90% are farmers. Of the State’s 187,000 holdings, 90% consist of small family-farms (SFFs) of 50 hectares or less (34% are 10 ha or less) which contribute 70% of the state’s Agricultural GDP. SoSC has the highest proportion of very small farms among the southern states of Brazil. The main contribution of SFFs to total agricultural production of the state includes the following products: maize (70%), beans (73%), rice (67%), swine and poultry (80%), milk (83%) and onion (91%).
3.5 In spite of its strong macroeconomic performance, economic opportunities in SoSC are not equally available to all. About 12% (or 700,000 people) of SoSC population live in poverty (poverty line of US$ 1.00/day per family), 20% of which being residents in rural areas, and consisting mainly of SFFs, rural workers and indigenous people. SFFs in SoSC lack competitiveness13 and face a number of pressing challenges, including: (i) absence of economies of scale given the nature of prevailing agro-industrialization processes that in some cases are inadequate for SFFs; (ii) lack of capital and expertise needed to facilitate the modernization of production; (iii) poor quality of products, low productivity and value added, and insufficient diversification of production systems that are more suitable to markets and to the local agro-
12 All data in this section is derived from the Santa Catarina State Government’s Secretariat of Agriculture and
Rural Development (SAR) and the World Bank Infoshop. 13 Competitiveness is defined here as the ability of a firm to offer products and services that meet the quality
standards of the market – whether local, regional, national or international – at prices that are competitive and provide adequate returns on the resources employed or consumed in producing them.
Estimating mitigation potential of agricultural projects: An application of the EX-Ante Carbon-balance Tool (EX-ACT) in Brazil
13
ecological conditions, leading to poor access to markets for a significant portion of SFFs; (iv) a fragile natural resource base and challenging requirements to comply with environmental legislation; (v) poor logistics systems and related infrastructure (roads) in many areas; and (vi) the limited scope of public policy in rural areas and a certain inability of public institutions to adapt to the evolving demands of the rural sector.
3.6 Also, mainly because of land titling irregularities, small producers face difficult to comply with environmental legislation which requires land regularization to demarcate and establish a “legal reserve” to either preserve 20% of their farmland or maintain 20% under biodiversity conservation-friendly production systems. This is key in SoSC where native forest lands are under pressure primarily as a result of past and on-going change in land use associated with conversion to agriculture, agro-forestry and livestock activities14. The loss of the original vegetation cover in fragile areas (such as riparian and steep zones) and past unplanned and unmanaged occupation of land have resulted in land degradation, making the soil susceptible to erosion which, in turn, carries organic matter and sediments into the state’s aquatic ecosystems. Erosion has led to silting of reservoirs, headwater areas and springs, and to less productive soils, which disproportionately affects low income farmers who are rarely able to afford the additional costs of fertilization and of making longer-term investments in improved soil management systems.
3.7 Growth in the agricultural sector has also contributed to an increase in water quantity and quality conflicts. Agriculture, along with domestic sewage, is the main source of water pollution in rural areas. Pressure is growing in SoSC to implement an integrated approach to water resources management (WRM), in particular strengthening capacity to implement key WRM instruments. In addition, the importance of appropriate land and water management is underscored by the impact of climate change associated to the increased frequency in natural disasters over the last decade, leading to high losses to the sector, and the need for improved resilience of ecosystems and production systems on such a changing environment.
3.2 The SC Rural project profile15
3.2.1 Project objectives and financing
3.8 The proposed Santa Catarina Rural Competitiveness project (SC Rural) has the objective of increasing the competitiveness of rural family agriculture producer organizations16. It
14 A recent study INPE/SOS Mata Atlantica states that, from 2005-2008, the SoSC had the second highest
deforestation rate of Atlantic Forest (after Minas Gerais) among ten Brazilian States evaluated (the biome covers 13 States). Existing data on native Atlantic Forest remnants vary from 23.39 to 37.7 % (methodological issues): according to KfW/FATMA’s land use map (2005), the forest remnants are 37.7% (it includes primary vegetation and forests under moderate and advanced stages of regeneration); according to the aforementioned INPE /SOS SOS Mata Atlantica study based on satellite images from 2005-2008, the forest remnants are 23.39% (includes only primary vegetation and forests under advanced stages of regeneration).
15 Unless otherwise stated, all data in this section is derived from the Santa Catarina State Government’s Secretariat of Agriculture and Rural Development (SAR) and the World Bank Infoshop.

Estimating mitigation potential of agricultural projects: An application of the EX-Ante Carbon-balance Tool (EX-ACT) in Brazil
14
will target Family Agricultural Producer Organizations (FAPOs)17, both those currently existing and others to be established during project execution. Approximately 3.6 million hectares (equivalent to 37% of the state area), where economic activity is lagging and the potential for improvement and the need for support are larger, will be covered by the project. It will primarily support rural agricultural and non-agricultural small-scale producers - including SFFs), rural workers and indigenous people families, organized in associations, cooperatives, formal (with legal status) and informal networks or alliances. The project will reach some 90,000 SFFs overall, 2,000 rural workers/laborers and 1,920 indigenous people families. Out of these beneficiaries, about 25,000 (considered priority beneficiaries) will receive direct financial project support through the State’s Rural Investment Fund (RIF), to support improved added-value arrangements as well as improved productive systems for rural competitiveness. A second important group of stakeholders will be the members of River Basin and Ecological Corridor’s Committees, consisting of various private and public institutions and sectors.
3.9 The proposed project will support rural competitiveness in Santa Catarina on two fronts: (i) finance capital and related technical assistance to FAPOs to encourage technological innovation and diversification, raise productivity, and broaden market access; and (ii) bolster provision of needed complementary public goods and services (e.g. infrastructure, certification, sanitary, legal and environmental regulatory compliance). In line with these two fronts, the project will support beneficiaries at two levels, respectively: (i) directly, for the implementation of collective and associated individual investments included in business plans in line with the PDO; and (ii) indirectly, through the improvement of the framework for the delivery of the above-mentioned complementary public services to shore-up the effectiveness and long-term sustainability of private investments.
3.10 The project is proposed for World Bank financing: its total cost is US$ 189.1 million, with US$ 90 million consisting of World Bank loan, using a Sector Wide Approach (SWAp)18 that includes Government expenditures and activities from the following sectors: Agriculture, Water Resources Management, Environment, Infrastructure (rural roads and communication) and Rural Tourism.
3.2.2 Project components
3.11 The project will be implemented over a period of six years and will have the following three components to achieve its objectives:
1) Family Agriculture Competitiveness and Increased Access to Markets;
2) Complementary Public Investments for Rural Competitiveness; and
16 Achievement of this objective will be reinforced by providing support for an improved framework of
structural competitiveness-inducing public-services activities as part of the State Multi-year Development Plan.
17 FAPOs are defined as producer organizations in which 90% of membership consists of family farmers as defined under Brazil’s Program to Assist Family Agriculture (PRONAF).
18 In this case, a SWAp is a loan operation that combines a traditional World Bank’ Specific Investment Lending and Government-funded Eligible Expenditure Programs.

Estimating mitigation potential of agricultural projects: An application of the EX-Ante Carbon-balance Tool (EX-ACT) in Brazil
15
3) Support to the Rural Competitiveness Program
3.12 Component 1 (Family Agriculture Competitiveness and Increased Access to Markets), with total expected expenditures amounting to US$ 95.1 million, will support family agriculture competitiveness by working with stakeholders across local, municipal and regional levels in order to increase organizational and participation skills for project implementation through capacity-building and planning activities, and through the partial financing of investments to FAPOs (beneficiaries) to operate market-focused changes with the aim of sustainably raising productivity and value added, increasing entrepreneurship and facilitating greater market access. It will finance technical assistance and training services, workshops and exchanges, expert services, studies and demonstration/adaptation activities, goods (production inputs; farming, storage and processing equipment; computers and other logistics and communications equipment) and small civil works as part of its main activities, which will include two sub-components:
a) pre-investment activities to (i) support technical, extension and training services to create and consolidate added-value arrangements among FAPOs and other commercial stakeholders; (ii) identify potential business opportunities on the part of these value-added arrangements (i.e. preparation of a business proposal or Perfil de Negócio); (iii) fully prepare the business opportunity into a Business Plan (Plano de Negócio); and (iv) build capacity among technical service providers to enhance the quality of their services provided in support of rural competitiveness. Expert services will also be financed under the component to facilitate the preparation of viable business profiles and business plans on behalf of the added-value arrangements. The main lines of activity covered by this subcomponent include: (i) Beneficiary Organization and Support to Local Productive Arrangements and Cooperation Networks; (ii) Training of beneficiaries, technical assistance providers and local authorities; and (iii) Investment Diagnostic and Planning, and Demonstration/Adaptation Activities.
b) Productive and Added Value Investments, namely capital grants under the SoSC Rural Investments Fund, to support implementation by FAPOs of viable Business Plans. To be eligible, a Business Plan must be financially feasible and entail a concrete value-added arrangement such as a productive alliance. Subprojects will be that portion of the productive alliance’s business plan that will: (i) be financed with proceeds from the proposed Loan; (ii) be implemented by FAPOs; (iii) be governed by subproject agreements signed between the FAPOs and the State’s Rural Extension Enterprise (EPAGRI); and (iv) include fixed capital (e.g., plant and equipment, minor infrastructure), working capital and technical assistance expenditures. FAPOs will be responsible for a minimum of 20% of subproject financing, through their own contributions (either in cash or in-kind). The main lines of activity include: (i) diversification and improvement of production (farming) systems; (ii) agro-processing; (iii) support to meet legal environmental and sanitary requirements for market access; (iv) marketing and logistics; and (v) off-farm (non-agricultural] investments.
3.13 Component 2 (Complementary Public Investments for Rural Competitiveness), with total expected expenditures amounting to US$81.4 million, will support the improvement of the structural rural competitiveness framework through the financing of public goods activities that are crucial for the sustained competitiveness of FAPOs endeavours. It will finance training, workshops and exchanges, expert services, studies, goods (equipment, satellite images, publications and materials), and civil works in support of the implementation of the following sectoral activities: (i) water resource management; (ii) ecosystems and corridor management; (iii)
Estimating mitigation potential of agricultural projects: An application of the EX-Ante Carbon-balance Tool (EX-ACT) in Brazil
16
environmental monitoring and education; (iv) rural infrastructure; (v) regulatory framework compliance; (vi) rural technical assistance, extension and sanitary and phyto-sanitary services; and (vii) rural tourism.
3.14 Through these activities, the project will: (i) expand the State’s efforts to strengthen the capacity for participatory, integrated, basin-scale WRM at the state (central) level and in 14 river basins (out of the state total 24 river basins), including formalization of non-agricultural and agricultural water rights, the latter incorporating specific support to SFFAs compliance with WRM legislation; (ii) implement two Ecological Corridors –Timbó and Chapecó– to support ecological corridor connectivity by supporting the creation of two areas of biodiversity conservation-friendly land use mosaics, and the development and implementation of two incentive mechanisms for payment of environmental services, environmental compliance and improved productive systems; (iii) strengthen capacity to assist small farmers and other rural entrepreneurs to comply with WRM and environmental legislation, and support implementation of the state and federal environmental education policies to promote awareness, appreciation, knowledge and stewardship of natural resources; (iv) support the State’s efforts to improve rural road rehabilitation and expand communication systems infrastructure essential for sustained rural competitiveness; (v) support SFFAs in ensuring the quality and safety required for their products to access formal final markets, and regularizing their land tenure to enable creditworthiness; (vi) support state’s efforts to re-structure its Agricultural Extension Services to provide quality and sufficient technical assistance and rural extension to promote sustained competitiveness of family-agriculture; and (vii) support state’s efforts to provide alternative non-agricultural sources of income in rural areas.
3.15 Component 3 (Support to the Rural Competitiveness Program), with total expected expenditures amounting to US$12.6 million, will promote enhanced public administration performance in support of rural competitiveness through the implementation of a results-based management approach for the main SoSC institutions involved with the rural sector. Through this component the project will finance expert services, training, workshops, studies and goods to support: (i) Central Administration Strengthening; (ii) Results-based Management at the Project, Rural and Environmental Sector Levels; and (iii) Program Coordination, Monitoring and Evaluation.
3.3 Potential mitigation impact of project activities and land use implications
3.16 This section describes the effects of selected project components on GHG emissions and C sequestration, indicating the overall impact on the C-balance which is an indication of the overall potential mitigation impact of the project and which has been estimated using EX-ACT. Project activities will be implemented in the whole SoSC and will target Producer Organizations active in about half (936) of the 1,683 micro watersheds into which the State is divided. The project represents therefore an interesting example of application of EX-ACT at watershed level.

Estimating mitigation potential of agricultural projects: An application of the EX-Ante Carbon-balance Tool (EX-ACT) in Brazil
17
3.3.1 Structure of the analysis
3.17 The analysis takes into account the activities to be undertaken under the Components 1 (Family Agriculture Competitiveness and Increased Access to Markets) and 2 (Complementary Public Investments for Rural Competitiveness) which may have a relevant impact on the C-balance of the project either directly, by determining a change in land use and management; or indirectly, by promoting actions which may have an impact on GHG emissions (input use, livestock production, energy consumption and building activities). Specifically, the analysis takes into consideration the following activities which fall below Component 1:
expansion of training and extension services (pre-investment activities);
diversification and enhancement of production systems (expansion of perennial crops, promotion of improved grassland and cropland management, and livestock production);
support to the implementation of small-scale agro-industry and to the construction of sanitary installations;
rehabilitation of the Areas of Permanent Preservation (APP - Áreas de Preservação Permanente) and Legal Reserve (RL - Reserva Legal) through the protection of existing forests and the implementation of environmentally-sound practices that facilitate forest regeneration or rehabilitation (e.g. fencing of riparian areas, agro-forestry, planting of native species in APPs and RLs for full protection).
3.18 Also, the analysis considers some activities which will be implemented under Component 2 (such as creation of ecological corridors, and rehabilitation of degraded land – analysed in section 3.3.7), and under Component3 (expert services, training and workshops – considered in section 3.3.3 together with similar activities foreseen under Component 1).
3.19 Next sections will describe the basic assumptions of the analysis and discuss the contribution of project components and activities to overall project C-balance.
3.3.2 Basic assumptions of the analysis
3.20 The project is happening in the State of Santa Catarina in Brazil, which is considered here as “developing” country in the South American Continent: this will affect some coefficients used in the analysis, such as dairy cattle emissions or enteric emission factors. Since the area interested by project activities is quite large, data used to describe climate patterns and soil characteristics cannot take into account the considerable variability of existing soil and climatic conditions and the results of the analysis should therefore be considered only as an average for the whole area.

Estimating mitigation potential of agricultural projects: An application of the EX-Ante Carbon-balance Tool (EX-ACT) in Brazil
18
3.21 Average climate is considered as warm temperate with a mean annual temperature equal to 18 degrees Celsius and a moisture regime classified as moist. These settings correspond to average temperature and rainfall for the State. Such information is essential as most coefficients used in the analysis can change drastically according to the climate. This is particularly true for the moisture regime, but also for the mean annual temperature which is affecting, for example, the level of CH4 emissions from manure management.
3.22 As for the soil characteristics – and with reference to the simplified IPCC classification where only six soil categories are listed (Sandy Soils, Spodic Soils, Volcanic Soils, Wetland Soils, High Activity Clay Soils and Low Activity Clay Soils) – the State is characterized by two major soil types: Low Activity Clay (LAC) and High Activity Clay (HAC) soils, the latter being mainly present in rice systems. Since rice producers are not targeted by the project, the analysis considers that the dominant soil type for the project area is LAC soils which are highly weathered soils, dominated by 1:1 clay minerals and amorphous iron and aluminium oxides. This category includes Acrisols, Lixisols, Nitisols, Ferralsols, Durisols in the FAO-World Reference Base classification; and Ultisols, Oxisols, acidic Alfisols in the USDA classification. HAC soils are taken into consideration when performing the sensitivity analysis (see section 3.5).
3.23 The project will be implemented over a timeframe of six years. The analysis will therefore consider an implementation phase of six years, followed by a capitalization phase of fourteen years, which will represent a period where the benefits of the investment are still occurring and may be attributed to the changes in land use and management induced by the adoption of the project (see section 2.1). In the analysis it is assumed that the implementation phase will happen according a linear dynamic of change (see figure 2.2), as no specific information is available about the adoption rate of the project activities among project participants. Changes in the adoption rates are simulated in the sensitivity analysis (see section 3.5). As concerns the Global Warming Potential (GWP) coefficients, the present analysis uses the same values as those adopted within the Clean Development Mechanism (CDM), i.e. 21 for CH4 and 310 for N2O.
3.3.3 Expansion of training and extension services (pre-investment activities)
3.24 This set of activities falls below project Components 1 and 3, and it is aimed at supporting technical, extension and training assistance and build capacity among technical service providers to enhance the quality of their support to rural competitiveness. The implementation of these activities is therefore expected to intensify and expand the work of the technicians (trainees and extension service staff) currently operating in the area. Its main environmental impact in terms of GHG emissions can be measured in terms of fuel consumption increase.
3.25 Overall, the project is expected to use up to 160 new cars, which would substantially increase the fuel consumption. It is assumed that each technician drives about 50 km every working day (261 days/year), with an average fuel consumption of 7 l/100km. Total increase of fuel consumption would therefore amount to 146.16 m3/year (= 3.5 l/day * 261

Estimating mitigation potential of agricultural projects: An application of the EX-Ante Carbon-balance Tool (EX-ACT) in Brazil
19
days/year). Current fuel consumption for extension and training activities already ongoing in the area amounts to 517 and 172.3 m3/year of gasoline and ethanol respectively. By using the same 3:1 ratio of the two fuel types, it is expected that fuel consumption “with project” will go up to 626.62 and 208.84 m3/year of gasoline and ethanol, respectively.
3.26 The increase in fuel consumption will increase the level of GHG emissions consequent to fuel burning: it is estimated that use of gasoline will emit 2.85 tCO2e/m3 (default value from IPCC) while ethanol will emit only 0.51 tCO2e/m3 (Dias de Oliveira 2005)19. Therefore, total GHG emissions from fuel consumption will increase linearly as a result of project activities as computed in the EX-ACT module called “investments” and shown in table 3.1.
Table 3.1: Released GHG associated with fuel consumption
Annual Fuel Consumption (m3/yr) Emission (t CO2eq)Type of Fuel Default value Specific Default Start
t CO2 /m3 Value Factor t0 End Rate End Rate Without WithGasoil/Diesel 2.63 YES 0 0 Linear 0 Linear 0 0Gasoline 2.85 YES 517 517 Linear 626.62 Linear 29483 34796Ethanol 0.5165 NO 172.3 172.3 Linear 208.84 Linear 1780 2101OPTION1 + OPTION2 Sub-Total Without 31262.7 Sub-Total With 36897.1 Difference 5634.4
Without Project With Project All Period
Source: our calculations using EX-ACT (2010)
3.27 It is worth to notice that this calculation does not take into account the emissions related to construction and transportation of the new cars. It is in fact assumed here that the process of production (and transportation) of new cars will take place independently of project activities. Also, for the sake of simplicity, the coefficient for ethanol use does not take into account the land-use change potentially induced by sugar-cane cropping for bio-ethanol production, although it is recognised that some studies carried out in the USA on corn bio-ethanol show that including land-use change in the calculation can significantly off-set the benefits from using bio-ethanol (Searchinger et al. 2008). For the same reasons, GHG emissions associated with fuel production and transportation are not considered here.
3.3.4 Diversification and enhancement of production systems
3.28 Under Component 1, the project will finance sub-projects (business plans) aimed at diversifying and improving farming systems. This will include:
a) expansion of perennial crops;
b) improved annual crop management through the adoption of improved agronomic practices, nutrient and tillage management, water management, manure application and residue management;
19 An alternative and slightly more optimistic value of 0.4265 tCO2e/m3 is in Macedo et al. (2008): it represents
an average of the values found for hydrous and anhydrous production of sugar-cane bio-ethanol in 2005-2006 in Brazil. Nevertheless, the adoption of this alternative coefficient will not change significantly the results.

Estimating mitigation potential of agricultural projects: An application of the EX-Ante Carbon-balance Tool (EX-ACT) in Brazil
20
c) improved grassland management; and
d) improved livestock production.
a) Expansion of perennial crops
3.29 The project promotes the expansion of perennial trees (banana, erva mate, orange, apple, palm tree, peach and grape) on degraded grasslands. Overall, it is foreseen that in the “with project” scenario, 1,434 ha of degraded pastures would be converted into fruit trees. This activity is taken into account in the EX-ACT modules called “other land use change” and “perennials”.
3.30 The change in land use from degraded grassland to perennials would determine a change in both biomass and soil C stock: with reference to the specific climate (warm temperate moist) and tree types, the land use change will cause an increase in biomass C stock from 1.0 to 2.1 tC/ha as a result of the land use change, corresponding to 4 tCO2e mitigated. The biomass will also increase as a consequence of the land management. This is accounted in the module “perennials”: above ground biomass growth is set using the IPCC default value of 2.1 tC/ha per year, so that total CO2e mitigated will amount to 127.05 tCO2e over 20 years. In fact, the module “other land use change” takes into account the calculations done by IPCC with reference to the changes in land use, while the module “perennials” considers the changes associated with the land management, helping to correct the nominal baseline according to the specific land management. Therefore, the results of the computations from the two modules should be considered as additive in this case.
3.31 The conversion from degraded land to perennials will also cause the increase in soil organic C stock from 20.8 to 63.0 tC/ha, corresponding to 7.7 tCO2e mitigated. Perennial systems can also store C in soil: default C storage amounts to 0.7 tCO2e/ha per year for warm moist regions.
3.32 Overall, this activity will determine a C sink of 393,687 tCO2e, of which 194,433 tCO2e as a consequence of land use change (5,784 from biomass C and 188,649 from soil organic C), and 199,254 tCO2e after 20 years (182,189 from biomass C and 17,065 from soil organic C) as a consequence of the management of the land after the change in its use. This will correspond to a mitigation capacity of 13.7 t CO2e/ha/year.
3.33 Also, the project will reverse the process of land degradation ongoing in some areas by preventing 210 ha of perennial crops (peach trees) from being abandoned and, in the end, degraded. This activity (taken into account in the EX-ACT modules named “other LUC” and “perennial”) will determine a change both in the biomass C stock (from 1 to 16.8 tC/ha) and in the soil organic C stock (from 21.7 to 63 tC/ha). The project will therefore avoid a GHG source of 41,673 tCO2e which will represent a C sink (in terms of “avoided C source”).
3.34 Overall, this set of activities will be able to mitigate a net balance of 435,360 tCO2e over 20 years, corresponding to a mitigation potential of 13 t CO2e/ha/year. A summary of the mitigation impact of this project activity is given in table 3.2.

Estimating mitigation potential of agricultural projects: An application of the EX-Ante Carbon-balance Tool (EX-ACT) in Brazil
21
Table 3.2: C-balance associated with expansion of perennial crops
As a consequence of land use change Vegetation Type Soil Change Fire Total Balance Difference
Without With Without With Without With Without WithtCO2 tCO2 tCO2 tCO2 tCO2 tCO2 tCO2 tCO2 tCO2
Conservation of 210 ha of perennial crops (peach trees) 12166 0 27008 0 0 0 39174 0 -39174
Conversion of 1,434 ha of degraded pastures to perennial crop 0 -5784 0 -188649 0 0 0 -194433 -194433
Biomass Change
As a consequence of the management of the land after the change in its use CO2 mitigated from Biomass CO2 mitigated from Soil CO2eq emitted from Burnin Difference
With Project Without With Without With Without With Without With
End Rate tCO2 tCO2 tCO2eq
0 Linear 0 0 0 0 0 0 0 0 00 Linear 0 0 0 0 0 0 0 0 0
1434 Linear 0 -182189,7 0 -17065 0 0 0 -199254 -199254
Total Balance
Source: our calculations using EX-ACT (2010)
b) Improved annual crop management
3.35 The project will have the effect to increase the adoption of sustainable land management (SLM) practices such as: improved agronomic practices (using improved crop varieties, extending crop rotations particularly with legumes crops); nutrient management (improving the efficiency of fertilizer applications); tillage management (switching from minimum tillage to no-tillage); water management (enhancing irrigation practices); manure application and residue management.
3.36 It is worth to notice that the project will not directly purchase agro-chemicals and that it will promote the adoption of sustainable agronomic practices in a holistic manner. Many of these improved practices may increase crop yields and thus generate higher residues with positive effects in terms of mitigation (because of increased C biomass and soil C stocks). Increasing available water in the root zone through water management can enhance biomass production, increase the amount of above-ground and root biomass returned to the soil, and improve soil organic C concentration. Some practices may also lead to reduction in N2O and C sources. For example, integrated nutrient management can reduce emissions on-site by reducing leaching and volatile losses, improving N use efficiency through precision farming and improved fertilizer application timing (FAO 2009).
3.37 Interested crops are: beans, millet, soybeans, tomatoes, onion, rice, potato, and cassava. It is assumed that most farmers are already adopting SLM practices (90% of cropland) and that the implementation of project activities will expand the area managed sustainably, so that in the “with project” scenario 100% of annual cropland will be managed using SLM practices. This is shown in table 3.3.

Estimating mitigation potential of agricultural projects: An application of the EX-Ante Carbon-balance Tool (EX-ACT) in Brazil
22
Table 3.3: Cropland area under SLM (ha)
Without project
With project
Beans 32,429 36,032 Millet 21,637 24,041 Soybeans 111,505 123,894 Tomatoes 24,944 27,715 Onion 5,856 6,507 Rice (rainfed) 46,280 51,422 Potato 2,624 2,915 Cassava 7,848 8,720 Total 253,121 281,246
Source: project data
3.38 The EX-ACT module “annual” computes the mitigation potential of this set of activities in terms of soil C change for a 20-years time horizon using only CO2 emissions factors for the relevant climate (warm moist) (table 3.4).
Table 3.4: Annual mitigation potential of selected SLM practices used in EX-ACT
Management Category Annual mitigation potential using only CO2 effect
(tCO2e/ha/year)
Improved agronomic practices 0.88 Nutrient management 0.55 Tillage/residue management 0.7 Water management 1.14 Manure application 2.79
Source: Bernoux et al. 2010b
3.39 Final emission factors reported by Smith et al. (2007) are higher because they also consider non-CO2 emissions (i.e. emissions from other GHG). For example, it is estimated that improved agronomic practices are able to store 0.98 tCO2e/ha/year instead of 0.88 as used in EX-ACT. Nevertheless, a conservative approach is used here: only the mitigation effect related to CO2 emissions are taken into account; also, EX-ACT assumes that when different land management practices are applied simultaneously on the same land, the final effect will be determined by the practice with the highest mitigation potential, i.e. the model will pick the highest coefficient instead of adding up the single coefficients corresponding to each practice (Bernoux et al. 2010b). This precautionary option will also prevent the model from overestimating the impact of SLM
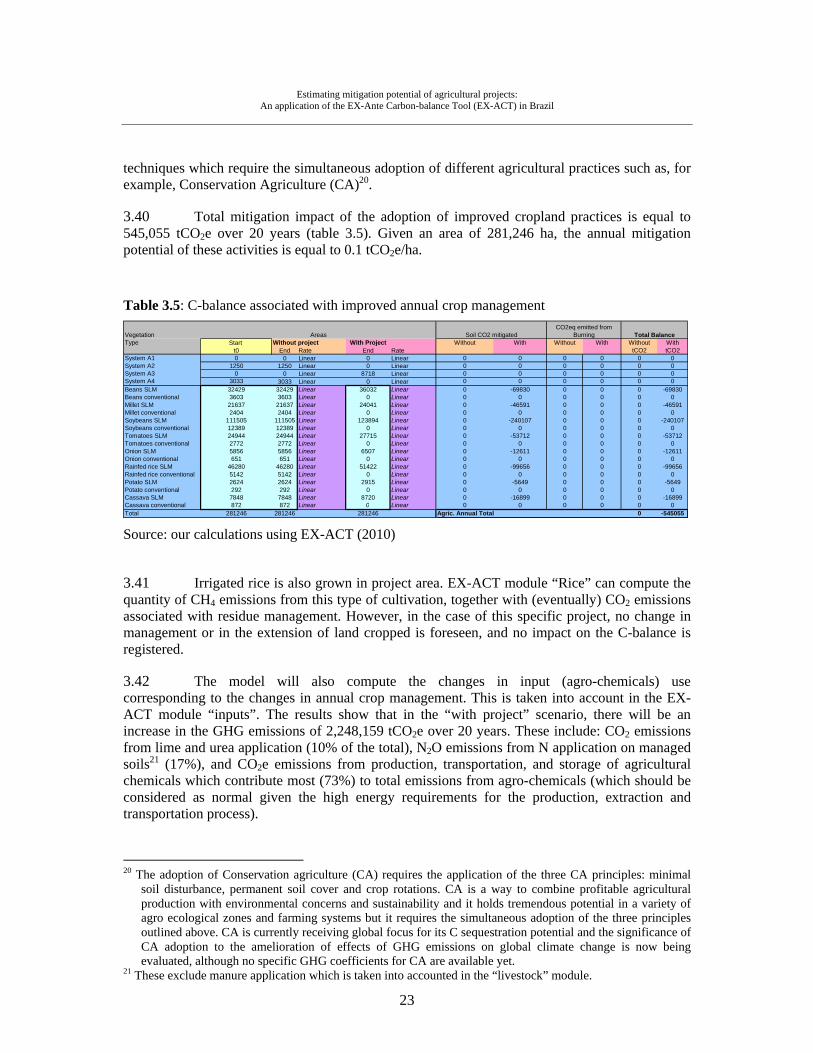
Estimating mitigation potential of agricultural projects: An application of the EX-Ante Carbon-balance Tool (EX-ACT) in Brazil
23
techniques which require the simultaneous adoption of different agricultural practices such as, for example, Conservation Agriculture (CA)20.
3.40 Total mitigation impact of the adoption of improved cropland practices is equal to 545,055 tCO2e over 20 years (table 3.5). Given an area of 281,246 ha, the annual mitigation potential of these activities is equal to 0.1 tCO2e/ha.
Table 3.5: C-balance associated with improved annual crop management
VegetationType Start Without project With Project Without With Without With Without With
t0 End Rate End Rate tCO2 tCO2System A1 0 0 Linear 0 Linear 0 0 0 0 0 0System A2 1250 1250 Linear 0 Linear 0 0 0 0 0 0System A3 0 0 Linear 8718 Linear 0 0 0 0 0 0System A4 3033 3033 Linear 0 Linear 0 0 0 0 0 0Beans SLM 32429 32429 Linear 36032 Linear 0 -69830 0 0 0 -69830Beans conventional 3603 3603 Linear 0 Linear 0 0 0 0 0 0Millet SLM 21637 21637 Linear 24041 Linear 0 -46591 0 0 0 -46591Millet conventional 2404 2404 Linear 0 Linear 0 0 0 0 0 0Soybeans SLM 111505 111505 Linear 123894 Linear 0 -240107 0 0 0 -240107Soybeans conventional 12389 12389 Linear 0 Linear 0 0 0 0 0 0Tomatoes SLM 24944 24944 Linear 27715 Linear 0 -53712 0 0 0 -53712Tomatoes conventional 2772 2772 Linear 0 Linear 0 0 0 0 0 0Onion SLM 5856 5856 Linear 6507 Linear 0 -12611 0 0 0 -12611Onion conventional 651 651 Linear 0 Linear 0 0 0 0 0 0Rainfed rice SLM 46280 46280 Linear 51422 Linear 0 -99656 0 0 0 -99656Rainfed rice conventional 5142 5142 Linear 0 Linear 0 0 0 0 0 0Potato SLM 2624 2624 Linear 2915 Linear 0 -5649 0 0 0 -5649Potato conventional 292 292 Linear 0 Linear 0 0 0 0 0 0Cassava SLM 7848 7848 Linear 8720 Linear 0 -16899 0 0 0 -16899Cassava conventional 872 872 Linear 0 Linear 0 0 0 0 0 0Total 281246 281246 281246 Agric. Annual Total 0 -545055
Total BalanceSoil CO2 mitigatedCO2eq emitted from
BurningAreas
Source: our calculations using EX-ACT (2010)
3.41 Irrigated rice is also grown in project area. EX-ACT module “Rice” can compute the quantity of CH4 emissions from this type of cultivation, together with (eventually) CO2 emissions associated with residue management. However, in the case of this specific project, no change in management or in the extension of land cropped is foreseen, and no impact on the C-balance is registered.
3.42 The model will also compute the changes in input (agro-chemicals) use corresponding to the changes in annual crop management. This is taken into account in the EX-ACT module “inputs”. The results show that in the “with project” scenario, there will be an increase in the GHG emissions of 2,248,159 tCO2e over 20 years. These include: CO2 emissions from lime and urea application (10% of the total), N2O emissions from N application on managed soils21 (17%), and CO2e emissions from production, transportation, and storage of agricultural chemicals which contribute most (73%) to total emissions from agro-chemicals (which should be considered as normal given the high energy requirements for the production, extraction and transportation process).
20 The adoption of Conservation agriculture (CA) requires the application of the three CA principles: minimal
soil disturbance, permanent soil cover and crop rotations. CA is a way to combine profitable agricultural production with environmental concerns and sustainability and it holds tremendous potential in a variety of agro ecological zones and farming systems but it requires the simultaneous adoption of the three principles outlined above. CA is currently receiving global focus for its C sequestration potential and the significance of CA adoption to the amelioration of effects of GHG emissions on global climate change is now being evaluated, although no specific GHG coefficients for CA are available yet.
21 These exclude manure application which is taken into accounted in the “livestock” module.

Estimating mitigation potential of agricultural projects: An application of the EX-Ante Carbon-balance Tool (EX-ACT) in Brazil
24
3.43 This is the effect of the increase in input use as a result of the increased cropland area (+ 8,718 ha) foreseen with project activities, although the implementation of SLM practices is expected to increase the efficiency of the input use and cause, on average, a reduction of the use of agro-chemicals on a per hectare base.
c) Improved grassland management
3.44 The project supports the development and adoption of improved grassland management practices such as pasture rotations and forage production as an alternative to grazing. Overall, area interested will be 138,152 ha (95,504 ha of natural grasslands + 42,648 ha of planted grasslands in good conditions).
3.45 The fourth IPCC assessment report indicates that improved grazing land management has the second highest technical potential for mitigating C emissions from agricultural management changes (IPCC 2007). Many of the changes needed to sequester C through improved grassland management are also associated with improved rangeland productivity and rural incomes (Lipper et al. 2010). In case of degraded grasslands, land rehabilitation might include a combination of cultivation abandonment, controlled grazing, erosion control, soil fertility improvement, plant introduction and seed dispersal, and reforestation, depending on the degree of severity of degradation (Woomer et al. 2004).
3.46 This is taken into account in the EX-ACT module called “grasslands”. It is considered that in the “with project” scenario, the management of the area under consideration will change from “non degraded” to “improved without inputs management” category, without any use of fire. This will imply an increase in C stock from 63 to 71.82 t C/ha. On the contrary, it is assumed that non change in management will occur in the “without project” scenario and that the land will remain “non degraded”22. Overall, the adoption of improved grassland management practices on the 138,152 ha will create a C sink of 3,797,660 tCO2e over 20 years. The module takes also into account the impact on the C-balance of the management of land converted to grasslands from other uses (as a result of other project activities), so that total mitigation potential of grasslands will climb to 3,845,599 tCO2e over 20 years (table 3.6).
Table 3.6: C-balance associated with improved grassland management Without project With Project Soil C variations (tCO2eq) Total CO2 eq from fire Total CO2eq Difference
End Rate End Rate Without With Without With Without With tCO2eqfrom Deforestation 1810 Linear 933 Linear 0 0 1451 0 1451 0 -1451converted to A/R 625 Linear 0 Linear 0 6136 589 0 589 6136 5547From OLUC 0 Linear 0 Linear 0 0 0 0 0 0 0Converted to OLUC 55178 Linear 0 Linear 0 0 52035 0 52035 0 -52035Natural grassland with prj 0 Linear 95504 Linear 0 -2625309 0 0 0 -2625309 -2625309
Natural grassland without prj 95504 Linear 0 Linear 0 0 0 0 0 0 0Planted grass good cond with prj 0 Linear 42648 Linear 0 -1172351 0 0 0 -1172351 -1172351Planted grass good cond without prj 42648 Linear 0 Linear 0 0 0 0 0 0 0Total 138152 138152
Grassland total 54075.0 -3791524.4 -3845599
Source: our calculations using EX-ACT (2010)
22 This is of course a very conservative hypothesis, as it is likely that in the “without project” scenario, grassland
will be degraded if not properly managed, thus becoming a source of GHG emissions.

Estimating mitigation potential of agricultural projects: An application of the EX-Ante Carbon-balance Tool (EX-ACT) in Brazil
25
d) Improved livestock production
3.47 The project will determine a change in livestock population as shown in table 3.7.
Table 3.7: Impact of project activities on livestock population (number of heads)
Startt0 End Rate End Rate
Dairy cattle 160523 128419 Linear 144471 LinearOther cattle 639776 640000 Linear 640000 LinearBuffalo 0 0 Linear 0 LinearSheep 25902 28490 Immediate 29787 ImmediateSwine (Market) 1570337 1570337 Linear 1570337 LinearSwine (Breeding) 0 0 Linear 0 LinearHorses 14724 14000 Linear 14000 LinearPoultry 56190050 76418468 Linear 76418468 LinearCamels 0 0 Linear 0 Linear
With ProjectWithout Project
Source: project data
3.48 EX-ACT can estimate CH4 emissions from enteric fermentation and manure management, as well as Nitrous Oxide (N2O) emissions from manure management. CH4 emissions from manure management are those produced during storage and treatment of manure as well as from manure deposited on pasture, while N2O emissions are produced, directly or indirectly, during storage and treatment of manure (solid and liquid).
3.49 Since EX-ACT adopts a Tier 1 approach, only animal population data are needed to estimate the relative emissions. Default values for CH4 emissions from enteric fermentation and manure management used in EX-ACT computations are shown in table 3.8 together with the N excretion rates adopted to compute N2O emissions from manure management. The mean annual temperature chosen at the beginning of the analysis is a critical parameter here as it affects both enteric fermentation and manure management and relative emissions.
Table 3.8: IPCC default values for methane emissions from enteric fermentation and manure management in S. America used in EX-ACT
CH4 from enteric
fermentation CH4 from manure
management N excretion rate
(Kg CH4/head/year)
(Kg CH4/head/year)
(Kg N/t animal mass/day)
Dairy cattle 63.00 1.00 0.48 Other cattle 56.00 1.00 0.36 Sheep 5.00 0.15 1.17 Swine (Market) 1.50 1.00 1.64 Horses 18.00 1.64 0.46 Poultry 0.00 0.02 0.82
Source: Bernoux et al. 2010b

Estimating mitigation potential of agricultural projects: An application of the EX-Ante Carbon-balance Tool (EX-ACT) in Brazil
26
3.50 The project is also implementing specific feeding practices for cattle and sheep, together with improved breeding management, which may contribute to reduce GHG emissions. Smith et al. (2007) showed that use of higher level of concentrates may increase CH4 emissions per animal, but also increase productivity (meat and milk), thus resulting in an overall reduction of CH4 emissions per unit of product (table 3.9).
Table 3.9: Reduction of CH4 emissions consequent to the adoption of additional technical practices in S. America used in EX-ACT
Feeding practices
Specific dietary agents
Management breeding
(% reduction CH4 emissions) Dairy cattle 6.0 3.0 2.0 Other cattle 3.0 2.0 3.0 Sheep 2.0 0.1 0.2
Source: Bernoux et al. 2010b
3.51 It is estimated that the project will have an additional technical mitigation potential consequent to the adoption of such practices as shown in table 3.10.
Table 3.10: Adoption of additional technical practices in livestock production in the "with" and "without project" scenarios
a) Feeding practices b) Management breeding
Without project
With project
Without project
With project
(% of population with
practices) (% of population with
practices) Dairy cattle 30 50 20 40 Other cattle 5 15 20 40 Sheep 5 15 20 40
Source: project data
3.52 The EX-ACT module called “livestock” computed all GHG emissions (CH4 from enteric fermentation and manure management, N2O from manure management) corresponding to livestock population in both “with” and “without project” scenarios, taking also into account the mitigation effect (GHG reduction) consequent to the implementation of improved feeding practices and management breeding. Overall, this set of project activities represents a net C source 288,993 tCO2e over 20 years) (table 3.11).

Estimating mitigation potential of agricultural projects: An application of the EX-Ante Carbon-balance Tool (EX-ACT) in Brazil
27
Table 3.11 Released GHG associated with livestock production Methane emissions from enteric fermentation
Total Emission (tCO2eq)IPCC Specific Default Start Start
Choose Livestocks: factor factor Factor t0 End Rate End Rate Without With Without WithDairy cattle 63 YES 160523 128419 Linear 144471 Linear 212372 169898 191135 3525388 3886413Other cattle 56 YES 639776 640000 Linear 640000 Linear 752377 752640 752640 15052010 15052010Buffalo 55 YES 0 0 Linear 0 Linear 0 0 0 0 0Sheep 5 YES 25902 28490 Immediate 29787 Immediate 2720 2991 3128 59829 62553Swine (Market) 1,5 YES 1570337 1570337 Linear 1570337 Linear 49466 49466 49466 989312 989312Swine (Breeding) 1,5 YES 0 0 Linear 0 Linear 0 0 0 0 0Horses 18 YES 14724 14000 Linear 14000 Linear 5566 5292 5292 106661 106661Poultry 0 YES 56190050 76418468 Linear 76418468 Linear 0 0 0 0 0
Methane emissions from manure managementTotal Emission (tCO2eq)
IPCC Specific Default Start StartLivestocks: factor factor Factor t0 End Rate End Rate Without With Without WithDairy cattle 1 YES 160523 128419 Linear 144471 Linear 3371 2697 3034 55959 61689Other cattle 1 YES 639776 640000 Linear 640000 Linear 13435 13440 13440 268786 268786Buffalo 1 YES 0 0 Linear 0 Linear 0 0 0 0 0Sheep 0,15 YES 25902 28490 Immediate 29787 Immediate 82 90 94 1795 1877Swine (Market) 1 YES 1570337 1570337 Linear 1570337 Linear 32977 32977 32977 659542 659542Swine (Breeding) 1 YES 0 0 Linear 0 Linear 0 0 0 0 0Horses 1,64 YES 14724 14000 Linear 14000 Linear 507 482 482 9718 9718Poultry 0,02 YES 56190050 76418468 Linear 76418468 Linear 23600 32096 32096 616427 616427
Nitrous Oxide emissions from manure managementTotal Emission (tCO2eq)
IPCC Specific Default Start StartLivestocks: factor factor Factor t0 End Rate End Rate Without With Without WithDairy cattle 0,01 YES 11249,5 8999,6 Linear 10124,5 Linear 54801 43841 49321 909698 1002858Other cattle 0,01 YES 25640,3 25649,3 Linear 25649,3 Linear 124905 124949 124949 2498842 2498842Buffalo 0,01 YES 0,0 0,0 Linear 0,0 Linear 0 0 0 0 0Sheep 0,01 YES 309,7 340,7 Immediate 356,2 Immediate 1509 1660 1735 33191 34702Swine (Market) 0,01 YES 26320,1 26320,1 Linear 26320,1 Linear 128217 128217 128217 2564330 2564330Swine (Breeding) 0,01 YES 0,0 0,0 Linear 0,0 Linear 0 0 0 0 0Horses 0,01 YES 588,4 559,4 Linear 559,4 Linear 2866 2725 2725 54929 54929Poultry 0,01 YES 16817,7 22872,0 Linear 22872,0 Linear 81926 111420 111420 2139911 2139911
Additional Technical Mitigation Percent of head with practices (0% =none;100%=all) Emission (t CO2eq) per year Total Emission (tCO2eq)
Start Without Project With Project Start End All PeriodLivestocks Dominant Practice* Factor t0 End Rate End Rate Without With Without WithDairy cattle Feeding practices 0,060 30% 30% Linear 50% Linear -3823 -3058 -5734 -63457 -108947
Specific Agents 0,030 0% 0% Linear 0% Linear 0 0 0 0 0Management-Breed 0,020 20% 20% Linear 40% Linear -849 -680 -1529 -14102 -28543No Option 0,000 50% 50% Linear 10% Linear 0 0 0 0 0
Other cattle Feeding practices 0,030 5% 5% Linear 15% Linear -1129 -1129 -3387 -22578 -60963Specific Agents 0,020 0% 0% Linear 0% Linear 0 0 0 0 0Management-Breed 0,030 20% 20% Linear 40% Linear -4514 -4516 -9032 -90312 -167081No Option 0,000 75% 75% Linear 45% Linear 0 0 0 0 0
Total Emission (tCO2eq) Without With DifferenceTotal "Livestocks" 29355793 29644786 288993
Emission (t CO2eq) per yearEnd
Head NumberAll Period
Annual amount of N manure* (t N per year) Emission (t CO2eq) per yearAll Period
Without Project With Project
Without Project With Project End
All PeriodEmission (t CO2eq) per year
EndHead Number
With ProjectWithout Project
Source: our calculations using EX-ACT (2010)
3.3.5 Support to the implementation of small-scale agro-industry and to the construction of sanitary installation
3.53 The project will promote value added investments which could help farmers on increasing their competitiveness. This would include mainly the support to the development of on-farm agro-processing activities and the construction of sanitary installations needed to meet the sanitary requirements for market access. It is important to specify that the present analysis is conducted at farm-gate level and not at value-chain level: therefore only on-farm activities will be taken into consideration here.
3.54 The development of agro-processing on-farm activities and the installation of sanitary equipments will have an environmental impact by increasing GHG emissions associated with electricity consumption and infrastructure building. It is in fact expected that over the whole project duration the total on-farm consumption of electricity will increase from 5,000 to 25,000 MWh; and total building area will be expanded from 18,700 to 80,000 square meters of industrial buildings (concrete) and from 3,300 to 15,000 square meters of garage construction (concrete).
3.55 The computation of GHG emissions associated with electricity consumption considers the annual consumption at the beginning of the project and at the end of the implementation phase. Default GHG emissions factors used in the model come from the

Estimating mitigation potential of agricultural projects: An application of the EX-Ante Carbon-balance Tool (EX-ACT) in Brazil
28
Electricity Information Database provided by the International Energy Agency (IEA) and reported by the US Department of Energy. They correspond to the average values for the 1999-2002 period and vary depending on the origin of the electricity consumed: the coefficient used for Brazil is 0.093 tCO2e/MWh. A default addition of 10% is also accounted for the losses occurring during electricity transportation.
3.56 GHG emissions associated with construction activities are computed using default values from the tool developed by the Agence de l'Environnement et de la Maîtrise de l'Energie (ADEME), i.e. 0.82 and 0.65 tCO2e/m2 of industrial building (concrete) and garage (concrete), respectively.
3.57 Results of the EX-ACT analysis show that overall this set of project activities will represent a source of GHG emissions of 60,290 tCO2e over 20 years, of which 2,042.5 from electricity consumption and 58,248 tCO2e from building construction (table 3.12).
Table 3.12: C-balance associated with electricity consumption and construction activities
Total Electricity Consumption (MWh) Origin of Electricity Associated tCO2eqWithout Project 5000 Brazil 2372,4With Project 25000 Brazil 11862,0 Type of construction surface (m2) Emission (t CO2eq)
Without With Without With0.0 0.00.0 0.0
18700 80000 15427.5 66000.03300 15000 2164.8 9840.0
0.0 0.0Garage (concrete)Offices (concrete)
Housing (concrete)Agricultural Buildings (metal)Industrial Buildings (concrete)
Source: our calculations using EX-ACT (2010)
3.3.6 Improved/legalized production systems
3.58 Under this set of activities, sub-project beneficiaries will be asked to fully protect existing forests and implement environmentally-sound practices that facilitate forest regeneration or rehabilitation, including:
a) fencing of riparian areas through forest regeneration and planting of native species in the Areas of Permanent Preservation (APPs) and Legal Reserves (RLs); and
b) expanding agro-forestry systems.
3.59 The project will also promote sustainable forest management in degraded RLs and APPs through the introduction of native species or a mixed system of native and exotic species of fruits, trees and ornamental plants. Nevertheless, the environmental impact on GHG emissions and C sequestration of this type of activities cannot be analysed using EX-ACT, therefore they are not considered here.

Estimating mitigation potential of agricultural projects: An application of the EX-Ante Carbon-balance Tool (EX-ACT) in Brazil
29
a) Fencing of riparian areas through forest regeneration and planting of native species in APPs and RLs
3.60 The project will promote the implementation of activities aimed at regenerating the forest cover in sensitive areas as established by the federal legislation. It is estimated that under project activities 625 ha of degraded land, 625 ha of grasslands and 1,250 ha of annual cropland will be covered by regenerated subtropical humid forest. This is considered in the EX-ACT module named “afforestation/reforestation” as shown in table 3.13.
3.61 It is assumed that the forest cover will be regenerated through naturally re-growing stands with reduced or minimum human intervention (extensively managed forest). Given the climatic conditions of project area, the vegetation type has been classified as natural (subtropical humid) forest. This affects the growth rate of trees and the process of biomass gains and losses: for less than 20 years old natural forests, it is estimated that above ground biomass is equal to 7 tons of dry matter per ha and per year (t dm/ha/year), and the below ground biomass is equal to 1.4 t dm/ha/year. Default value for litter (17.5 t C/ha) is based on the average between values for broadleaf deciduous and leaf deciduous forests, while soil C estimates are based on default references for soil organic C in mineral soils at a 30 cm depth (Bernoux et al. 2010b). There are no estimates available for dead wood C stocks; therefore the corresponding value is set equal to 0. The model takes also into account the loss in biomass C stock related to land conversion. In the specific case, it is estimated that the biomass C stock for annual is equal to 5 t C/ha, and for degraded land amounts to 1 t C/ha. In both cases, there will be no use of fire.
3.62 Overall, this set of activities is able to sequester 896,371 t CO2e, i.e. 17.9 t CO2e/ha/year (table 3.13).
Table 3.13: Fencing of riparian areas through forest regeneration and planting of native species in APPs and RLs
Biomass Loss Soil Fire Total BalanceStart Without Project With Project Without With Without With Without With Without With Without With
t0 End Rate End Rate tCO2 tCO2 tCO2 tCO2 tCO2 tCO2 tCO2 tCO2 tCO2 tCO20 0 Linear 625 Linear 0 -193912 0 2292 0 -82222 0 0 0 -2738420 0 Linear 1250 Linear 0 -387823 0 22917 0 -76086 0 0 0 -4409920 0 Linear 625 Linear 0 -193912 0 12375 0 0 0 0 0 -181537
Without With DifferenceDeforestation Total 0 -896371 -896371
Biomass GainAfforested or reforested Area (ha)
Source: our calculations using EX-ACT (2010)
b) Expanding agro–forestry systems
3.63 The project will encourage the expansion of agro-forestry systems, with a different level of cropping intensity and biological complexity depending on the ecological conditions of project area. The project will promote the integration between woody perennials with crops, shrubs, and/or animals on the same land management unit, with a consequent change in land use (table 3.14).

Estimating mitigation potential of agricultural projects: An application of the EX-Ante Carbon-balance Tool (EX-ACT) in Brazil
30
Table 3.14: Expansion of agro-forestry systems in project area
Previous land use Ha
Degraded land 533Degraded grassland 7,538Area under reforestation 8,718Annual cropland 3,033Natural grassland 37,042Non degraded planted grassland 18,136
Total 75,000
Source: project data
3.64 The expansion of agro-forestry activities will cause a change in both biomass and soil C stock and is taken into account in the EX-ACT modules “other land use change” and “perennials”. It should be specified that currently no default values for agro-forestry systems are available from IPCC. Therefore, the analysis has adopted default values for perennial crops, although in some cases a conservative approach is followed, by considering a smaller area in order not to overestimate the mitigation potential. The mitigation effect of the expansion of agro-forestry depends on the land quality of the area interested by expansion.
3.65 The expansion of agro-forestry activities on degraded land (533 + 7,538 ha) is assimilated to the expansion of perennial trees on degraded grasslands which has already been discussed in section 3.3.4. EX-ACT has estimated that this activity will determine a C sink of 2,215,795 tCO2e over 20 years, i.e. 13,7 tCO2e/ha per year.
3.66 Similarly, the expansion of agro-forestry on annual cropland (3,033 ha) will determine an increase in soil organic C (184,614 tCO2e) and an increase in biomass C (421,435 tCO2e) after a limited decrease on the first year as a result of the land use change (32,250 tCO2e). The net effect is a C sink of 573,798 tCO2e over 20 years, i.e. 9.4 tCO2e/ha per year.
3.67 On the contrary, it is assumed that the expansion of agro-forestry on area under reforestation (8,718 ha) will cause a reduction in the biomass C as a consequence of the decreased tree intensity and a reduction in soil organic C content as a consequence of the change in land use. The effect will be a net source of 1,011,594 tCO2e over 20 years, i.e. 2.1 tCO2e/ha per year.
3.68 Last, the expansion of agro-forestry systems on grassland (37,042 + 18,136 ha) will represent a source of GHG emissions (667,654 tCO2e) due to the loss in biomass C as a consequence of the change in land use, while it is assumed that there will be no change in soil organic C. Nonetheless, as a consequence of land management over the first year and in subsequent years, the system will accumulate biomass C so that the net effect will be a sink of 7.05 MtCO2e over 20 years, i.e. 6.4 tCO2e/ha per year.
3.69 Overall, this set of activities will create a net C sink of 8,829,363tCO2e over 20 years (table 3.15), corresponding to a net C sequestration capacity of 5.9 tCO2e/ha per year.

Estimating mitigation potential of agricultural projects: An application of the EX-Ante Carbon-balance Tool (EX-ACT) in Brazil
31
Table 3.15: C-balance associated with the expansion of agro forestry systems
Previous land use Ha
Degraded land (including degraded grasslands) -2,215,795
Area under reforestation 1,011,594Annual cropland -573,798
Grassland (natural and non degraded planted) -7,051,364
Total -8,829,363
Source: our calculations using EX-ACT (2010)
3.3.7 Ecological corridors and land rehabilitation
3.70 This set of activities, which falls under Component 2, will implement two ecological corridors by creating two areas of biodiversity conservation-friendly land use mosaics established on private lands, supporting ecological corridor connectivity in project watersheds; and will promote the rehabilitation, preservation or improvement of degraded land in order to obtain certification and/or to comply with environmental legislation23.
3.71 The implementation of these activities will be mainly based on the valorisation of environmental assets (preserved forests) through the commercialisation of “Conservation credits”. This is expected to determine a 50% reduction in the deforestation rate, with environmental benefits in terms of reduced emissions from deforestation. It is in fact estimated that the area deforested will decrease from 1,810 ha in the “without project” scenario, to only 933 ha as a result of project implementation.
3.72 In both “with” and “without project” scenarios it is assumed that no fire will be used to clear the forest, and that the area deforested will be used as natural pasture (grasslands). The level of Harvested Wood Product (HWP) would be equal to 100 t dm/ha. The amount of C exported is determined using the default C content of 0.47. It should be noted that the amount of C in HWP is not included in sources nor sinks in the final C-balance as some HWP will act as sinks (e.g. wood used in construction) and other as sources (e.g. wood used for charcoal production, if not used as fuel source): therefore the final figure will not change significantly24.
3.73 Given that the area deforested is covered by natural subtropical humid forest, it is estimated that the biomass loss caused by deforestation would be equal to 362 tCO2e/ha.
23 The federal legislation on APP and RL mandates that agricultural properties in Brazil maintain forest cover in
sensitive areas (riversides, high slopes) as well as in 20% of the property’s total area located in the biome Atlantic Forest, which is the case of State of Santa Catarina, originally fully covered by this biome’s vegetation. The project will promote the adoption of a system to promote the commercialization of “Conservation Credits” associated with the valorisation of environmental assets (preserved forests) mainly focused on farmers who are willing to “sell” their excess/extra forest (> 20% of farm land) as a “conservation credit” (hence, receiving a payment), instead of increasing their productive area. In fact, the legislation allows this “purchase” of credit – called servidão florestal – if the two farms are within the same river basin and the same biome, in this case Atlantic Forest.
24 It should also be added that this is a complicated issue object of the ongoing negotiation on deciding if including (or not) HWP estimates in national inventories (Bernoux et al. 2010b).

Estimating mitigation potential of agricultural projects: An application of the EX-Ante Carbon-balance Tool (EX-ACT) in Brazil
32
Therefore, total biomass loss would amount to 337,707 tCO2e with the project (933 ha deforested), as opposed to 655,145 tCO2e without the project (1,810 ha deforested). This is considered in the module “deforestation”. In the same module, EX-ACT is also taking into account the biomass of the vegetation cover following deforestation. Specifically, since grasslands biomass contains 6.3 t C, it is estimated that the system will “gain” 21,706 t CO2e in the “with project” scenario, and 42,110 t CO2e in the “without project” one.
3.74 As a result, total C-balance is equal to 613,036 tCO2e (“without project”) and 316,001 tCO2e (“with project”), therefore the impact of this set of project activities would represent a C sink of 297,034 tCO2e (table 3.16).
Table 3.16: C-balance associated with establishing ecological corridors and rehabilitating land Area deforested (ha) Biomass gain (1yr after) Total Balance Difference
Without With Without With Without With Without WithtCO2 tCO2 tCO2 tCO2 tCO2 tCO2 tCO2
1810 933 655145 337707 -42110 -21706 613036 316001 -297034
Biomass loss
Source: our calculations using EX-ACT (2010)
3.75 Also, the module “grasslands” takes into account the mitigation effect associated with the use of fire in grasslands management: since the project will reduce the land which will be deforested and transformed into grasslands, it will be able to mitigate 1,451 tCO2e over 20 years.
3.4 A summary of the project mitigation potential: C-balance and land use change
3.76 The overall C-balance of the project is computed as the difference between C sinks and sources over 20 years (6 years of implementation phase and 14 years of capitalization phase). The project is in fact able to sequester 14.9 MtCO2e while emitting “only” 2.7 MtCO2e so that the net effect of project activities is to create a sink of 12.2 MtCO2e (table 3.17). Since total project area amounts to 661 thousands ha, the average mitigation potential of the project is equal to 0.92 tCO2e/ha per year.
Table 3.17: C-balance of the SC Rural project
C-balance elements Mt EX-ACT modules Total GHG mitigated -14.9 Avoided deforestation, afforestation, cropland
management, agro-forestry, grasslands
Total GHG emitted 2.7 Other land use change, livestock, inputs, other investments
C-balance -12.2 Project is a C sink
Source: our calculations using EX-ACT (2010)

Estimating mitigation potential of agricultural projects: An application of the EX-Ante Carbon-balance Tool (EX-ACT) in Brazil
33
3.77 Table 3.18 and figure 3.1 show the mitigation potential of the project by category of land use change (corresponding to the EX-ACT modules).
Table 3.18: Mitigation potential of the SC Rural project, by EX-ACT module
EX-ACT modules Mt
% of total GHG mitigated
% of total GHG emitted
Deforestation -0,3 2,0 - Afforestation and Reforestation -0,9 6,0 - Annual crops -0,5 3,7 - Agroforestry/Perennial Crops -9,3 62,5 - Grassland -3,8 25,8 -
Total GHG mitigated -14,9 - -
Livestock 0,3 - 10,7 Inputs 2,2 - 83,3 Project Investment 0,1 - 2,4 Other Land Use Change 0,1 - 3,5
Total GHG emitted 2,7 - -
C-balance -12.2 - - Source: our calculations using EX-ACT (2010)
Figure 3.1: Mitigation potential of the SC Rural project, by EX-ACT module
-10
-8
-6
-4
-2
0
2
4
Defore
stat
ion
Affore
stat
ion a
nd R
efore
stat
ion
Other
Lan
d Use
Chan
ge
Annual
cro
ps
Agrofo
rest
ry a
nd P
erenn
ial C
rops
Grass
land
Lives
tock
Inpu
ts
Proje
ct In
vest
men
t
Land use categories
Mt
CO
2e
Source: our calculations using EX-ACT (2010)

Estimating mitigation potential of agricultural projects: An application of the EX-Ante Carbon-balance Tool (EX-ACT) in Brazil
34
3.78 Most mitigation potential of project activities is related to the expansion of agro-forestry and perennial crops (62.5%) and to grasslands (25.8%).
3.79 The relevant mitigation potential of the expansion of agro-forestry systems very much depends on the size of the area interested by the change as shown in the land use matrix developed for the two scenarios “without” and “with” projects (figure 3.2). The matrix shows clearly that the project is determining a significant increase of the area under perennial crops from 41,629 ha to 100,837 ha (+ 141%) essentially as a result of the expansion of agro-forestry systems.
3.80 On the contrary, the mitigation potential of grasslands is essentially related to the specific management practices implemented on the grasslands area (pasture rotations and forage production) more than on the size of the area which in fact decreases by 29% with respect to the initial status (before project begins). It is also interesting to notice that most of the grasslands is changing land destination towards improved use such as agro-forestry and forest land.
3.81 Last, an important contribution comes also from the rehabilitation of 10,130 ha of degraded land converted to perennial crops, agro-forestry and forest regeneration/plantation.
Figure 3.2: Land use matrix of the SC Rural project
Without Project Forest/ GrasslandPlantation Annual Perennial Rice Degraded Other Total Initial
INITIAL Forest/Plantation 76316 0 0 0 1810 0 0 78126Annual 0 285529 0 0 0 0 0 285529
Cropland Perennial 0 0 41629 0 0 210 0 41839Rice 0 0 0 51422 0 0 0 51422
Grassland 0 0 0 0 193955 0 0 193955Other Land Degraded 0 0 0 0 0 10130 0 10130
Other 0 0 0 0 0 0 0 0
Total Final 76316 285529 41629 51422 195765 10340 0 661001
With Project Forest/ GrasslandPlantation Annual Perennial Rice Degraded Other Total Initial
INITIAL Forest/Plantation 77193 0 0 0 933 0 0 78126Annual 1250 281246 3033 0 0 0 0 285529
Cropland Perennial 0 8718 33121 0 0 0 0 41839Rice 0 0 0 51422 0 0 0 51422
Grassland 625 0 55178 0 138152 0 0 193955Other Land Degraded 625 0 9505 0 0 0 0 10130
Other 0 0 0 0 0 0 0 0
Total Final 79693 289964 100837 51422 139085 0 0 661001
Cropland
Cropland
FINAL
Other Land
FINAL
Other Land
Source: our calculations using EX-ACT (2010)
3.82 By examining the mitigation potential by project activity (table 3.19), it is possible to note that among the activities which represent a net GHG source, cropland management contributes most with almost 83% of emissions – essentially as a result of the increased use of inputs – followed by livestock production. On the other side, consistently with the changes in land use discussed above, most mitigation potential comes from the expansion of agro forestry systems (61.7%) and from improved grassland management (26.9%).

Estimating mitigation potential of agricultural projects: An application of the EX-Ante Carbon-balance Tool (EX-ACT) in Brazil
35
Table 3.19: Mitigation potential of the SC Rural project, by project activity
Project activities Mt
% of total GHG
mitigated
% of total GHG
emitted
Expansion of training and extension services (pre-investment activities) 0.01 - 0.3 Improved annual crop management 1.7 - 82.8 Improved livestock production 0.3 - 14.0
Support to the implementation of small-scale agro-industry and to the construction of sanitary installation 0.1 - 2.9
Total GHG emitted 2.1 - 100.0
Improved grassland management -3.8 26.9 - Expansion of perennial crops -0.4 3.0 - Fencing of riparian areas -0.9 6.3 - Expanding agro-forestry systems -8.8 61.7 - Ecological corridors and land rehabilitation -0.3 2.1 -
Total GHG mitigated -14.3 100.0 -
Total C-balance -12.2 - - Source: our calculations using EX-ACT (2010)
3.5 Sensitivity analysis
3.5.1 Main parameter sensitivity
3.83 A parameter sensitivity analysis has been carried out in order to determine how EX-ACT is “sensitive” to changes in the value of the parameters. By showing how the model results respond to changes in the values of main parameters, sensitivity analysis is a useful tool in model building as well as in model evaluation. Therefore, the results of the sensitivity analysis will also represent a useful test for the tool itself.
3.84 Parameter sensitivity analysis helps building confidence in the model by studying the uncertainties that are often associated with parameters in models. Many parameters in C dynamics represent quantities that are very difficult, or even impossible to measure to a great deal of accuracy in the real world. This is particularly true for a Tier 1 approach as that one adopted in EX-ACT. This parameter sensitivity is performed here as a series of tests in which different parameter values cause a change in the dynamic behaviour of the C stocks, helping to understand dynamics of the agro ecosystems.
3.85 In the model, average climate is considered as warm temperate with a moisture regime classified as moist, which correspond to average temperature and rainfall for the State. Parameter sensitivity has been tested by introducing extreme values instead of average ones for the moisture regime (dry instead of moist). Also the soil characteristics have been changed considering High Activity Clay (HAC) soils – which are present in the project area – instead of

Estimating mitigation potential of agricultural projects: An application of the EX-Ante Carbon-balance Tool (EX-ACT) in Brazil
36
Low Activity Clay (LAC) soils. The results (table 3.20) show that a change in moisture regime will cause a decrease in the total mitigation potential of the project: this is reasonable as a drier climate is expected to lower the biomass growth, above and below ground. On the other hand, a change in soil characteristics (from LAC to HAC) will increase the sequestration potential, because of the higher C stocks and overall soil fertility. The change in the final balance consequent to the variation in moisture regime and soil parameters falls within ranges which may be considered reasonable for this case.
Table 3.20: Parameter sensitivity for the SC Rural project
Results
Final balance Change Climate
Moisture regime
Soil MtCO2e mitigated
%
Warm temperate Moist LAC 13.09 - Warm temperate Dry LAC 10.41 -15 Tropical Dry LAC 11.88 -3 Warm temperate Moist HAC 15.02 23 Tropical Moist HAC 14.00 15
Source: our calculations using EX-ACT (2010)
3.5.2 Scenario sensitivity
3.86 A second level of sensitivity analysis is carried out to deal with the uncertainty of the results which depends on the uncertainty of some data used to perform the analysis. Therefore, two different scenarios are built here, one more “pessimistic” and a second one more “optimistic” with respect to the main scenario outlined above. The results obtained will be compared with those already shown in section 3.4 and an intermediate scenario is built (“most likely” scenario).
3.87 The alternative scenarios have been built by changing the values of variables related to: the rate of adoption of the practices promoted by the project; change in land use and management; and, more in general, implementation of project activities.
3.88 The “pessimistic” scenario is built under the following assumptions, with respect to the main scenario: a 20% increase in fuel consumption (both diesel and gasoline) and a 30% increase of electricity consumption; a 30% decrease of the cropland area which will be managed with SLM practices; a 50% reduction of the grassland area interested by the introduction of improved grassland management options; reduction in the % of livestock population interested by additional technical practices (feeding and management-breeding ones). The results show that the mitigation potential of the SC project in the “pessimistic scenario” is equal to 10.0 MtCO2e, corresponding to a 17% reduction with respect to the main scenario.
3.89 The “optimistic” scenario is built by assuming that the adoption rate of the activities promoted by farmers will be faster than expected. In the main scenario it is prudentially assumed that the adoption dynamic will be linear, while here it is assumed as exponential (see figure 2.2)

Estimating mitigation potential of agricultural projects: An application of the EX-Ante Carbon-balance Tool (EX-ACT) in Brazil
37
for most project activities, i.e.: management of grasslands and annual crops, expansion of perennial crops, fencing of riparian areas, expansion of agro-forestry systems, creation of ecological corridors and land rehabilitation.
3.90 In this scenario it is also assumed that the impact on GHG emissions from production, transportation and storage of agricultural chemicals will be lower than in the main scenario. The default values used to estimate this impact are in fact extremely uncertain and correspond to world averages, considering that in most cases the production of agricultural inputs is realised outside the country of the project with high level of emissions due to transportation. This is certainly true for most developing countries. Nevertheless, in the case of Brazil, it is plausible to assume that project developers could organize the procurement of agro-chemicals on a national basis, avoiding purchasing inputs produced abroad. Therefore, in the “optimistic” scenario, a specific factor corresponding to the lower limit in the range provided by Lal (2004) is used instead of the EX-ACT default that corresponds to the central values of the same range, with a reduction of 61% in GHG emissions from production, transportation and storage of agricultural chemicals.
3.91 The results show that the mitigation potential of the SC project in the “optimistic scenario” is equal to 14.2 MtCO2e, corresponding to a 16% increase with respect to the main scenario.
3.92 It is therefore estimated that the SC Rural project will “most likely” be able to mitigate 12.1 MtCO2e, computed as the average of the “optimistic” and “pessimistic” scenarios (figure 3.3). It is interesting to note that this value is very close to what has been estimated in the main scenario (12.2 MtCO2e), showing the robustness of the analyses outlined above and of the EX-ACT results.
Figure 3.3: Scenario sensitivity analysis for the SC Rural project
14.2
12.1 12.210
0
2
4
6
8
10
12
14
16
Pessimistic Optimistic Most likely Main
Scenarios
Pro
ject
mit
igat
ion
pote
ntia
l
(MtC
O2e
)
Source: our calculations using EX-ACT (2010)

Estimating mitigation potential of agricultural projects: An application of the EX-Ante Carbon-balance Tool (EX-ACT) in Brazil
38
3.6 Economic analysis
3.93 The average mitigation potential of the project is equal to 0.92 tCO2e/ha per year. It could be valued using a price of 3 US$/tCO2e, which is the average C price for agricultural soil C at retail level on the voluntary C market in 2008 (Hamilton et al. 2009). Therefore, the value of the average mitigation potential of the project amounts to 2.76 US$/tCO2e (per hectare and per year). Since this value is below the level of transaction cost for public implementation (4 US$/tCO2e – see section 2.4), the project can be classified as type 1 (Agriculture Development) without any feasible option of being financed on the C sector (see figure 2.4).
3.94 However, it is interesting to note that a relatively limited change in project design could slightly increase the mitigation potential of the project and transform it in a type 2 one. For example, the mitigation potential of the project in the “optimistic scenario” outlined above is equal to 1.1 tCO2e/ha per year. Clearly, if the project is designed with explicit multiple objectives (e.g. the current goal of increasing the competitiveness of rural family agriculture producer organizations could be integrated by a specific mitigation objective) and with specific mitigation activities, it will be easily increase its mitigation potential.
3.95 If the corresponding mitigation potential value exceeds the level of transaction costs for public implementation, the project could then be potentially considered for public financing for low-Carbon agriculture. Being this the case, since yearly mitigation potential of the SC Rural project would be equal to 0.6 MtCO2e, mitigation benefits would be worth 1.8 million US$/year at the price of 3 US$/tCO2e. Given that total average project cost is 31.5 US$ million/year, public C finance would potentially cover about 6% of these costs.

Estimating mitigation potential of agricultural projects: An application of the EX-Ante Carbon-balance Tool (EX-ACT) in Brazil
39
4. THE CASE OF THE RIO DE JANEIRO SUSTAINABLE RURAL DEVELOPMENT (RIO RURAL) PROJECT
4.1 Background25
4.1 The SoRJ is one of Brazil’s 26 states and is located in the geopolitical region of the Southeast. With a total area of 43,864 square kilometres, it is divided into eight administrative regions: (i) North; (ii) Northwest; (iii) Serrana; (iv) South; (v) Coastal Floodplains; (vi) Metropolitan; (vii) Paraíba River Middle Valley; (viii) and Grande Bay Island. With a total of 92 municipalities, the SoRJ has approximately 15.4 million inhabitants (about 9% of the national population), of which 90% live in urban areas (IBGE 2007). The state economy is driven by the industrial and service sectors, which contribute to 51% and 42% of state GDP, respectively. Overall the SoRJ accounts for 15% of national GDP (US$139.0 billion in 2006).
4.2 The agricultural sector is important to the SoRJ economy and social well-being, although it contributes only to a small proportion of state GDP (0.5%). Nevertheless, outside of the metropolitan area of the city of Rio de Janeiro, agriculture’s contribution to GDP rises to nearly 5%, and when agro-industrial activities are included, agriculture represents over 25% of the state GDP. The importance of agriculture is further demonstrated in terms of rural employment - it accounts for over 40% and includes an estimated 157,492 individuals (IBGE 2006) - and land use (more than 60% of total state area is dedicated to agricultural activities). Three administrative regions, including the North, the North-West Fluminense and the Serrana region, are the agricultural powerhouse of the SoRJ. With 36 municipalities and over 10% of total state population, they are responsible for more than 60% of agricultural employment and produce 66% of agricultural goods in the state, namely: coffee (99% of the state total), sugarcane (97% of the state total), cereals (90% of the state total), vegetables (67% of the state total), milk (54% of the state total), and fruit (42% of the state total). These regions also have the state’s largest concentration of family farms. Small family farms represent some 80% of total land holdings, over half of which correspond to holdings of ten ha or less, and small-scale farming employs roughly twice the number of people per unit area than the larger holdings.
4.3 Despite its importance, the agricultural sector in the SoRJ faces a number of pressing challenges, the three major ones being: low productivity, poor linkages to the market and a weak natural resources base. Main causes for the low levels of productivity encountered in the agricultural sector, and especially sugarcane -the state’s most important production- coffee and cattle, include: the use of simple technology, sugarcane and coffee production dominated by “boom and bust” cycles26, weak farmer organization, and the widespread use of traditional, inefficient practices, especially by small farmers.
25 Unless otherwise stated, all data in this section derive from the Project Appraisal Document (World Bank
Infoshop) and Rio de Janeiro State Government’s Secretariat of Agriculture, Fisheries, and Rural Development (SEAPPA).
26The term “boom and bust” refers to a great build-up in the price of a particular commodity, followed by a downturn as the commodity price falls due to a change in economic circumstances or the collapse of unrealistic expectations.

Estimating mitigation potential of agricultural projects: An application of the EX-Ante Carbon-balance Tool (EX-ACT) in Brazil
40
4.4 Despite its proximity to a number of large markets, due to poor market linkages the majority of agricultural products in the SoRJ are locally consumed. Four key contributing constraints identified by the State Secretariat of Agriculture, Fisheries, and Rural Development (SEAPPA) are: (i) poor conditions of rural roads; (ii) limited market information inhibiting the ability of market forces to impact producer decisions; (iii) undeveloped value chains restricting product variety and price; and (iv) limited scope of public policy in rural areas.
4.5 Although home to an extremely diverse and unique mix of vegetation and forest types, including globally-important resources in the case of the Atlantic Forest (Mata Atlântica)27, such areas in the SoRJ continue to be under severe pressure primarily as a result of de-forestation (related to land conversion and charcoal production, among other things) and soil erosion (caused by, inter alia, deforestation, overgrazing, and poor agricultural practices).
4.6 Finally, poverty, especially in the North, North-West Fluminense and Serrana regions where over 60% of the state’s rural population lives in poverty and about one-third of those are in conditions of extreme poverty (Centre for Social Policy 2004)28, and the inability of public institutions to adapt to the evolving demands of the rural sector, attributed in particular to a lack of appropriate mechanisms to react to market forces with fixed norms and policies, and a weak local stakeholder representation in the institutional arrangements, represent other important challenges faced by the SoRJ rural sector.
4.7 The project is designed to address the aforementioned challenges by supporting interventions to improve small farmer productivity, enhance linkages with internal and national markets, strengthen the natural resources base, enhance the living conditions and incomes of small farming families, and improve the ability of public institutions to adapt to the evolving demands of the rural sector.
4.2 The Rio Rural project profile
4.2.1 Project objectives and financing
4.8 The Rio Rural project has the objective to increase the adoption of integrated and sustainable farming systems approaches29. Activities supported by the project will contribute to
27 The SoRJ has the highest percentage of the Atlantic Forest with respect to total area among all of Brazil’s
states. 28 This critical poverty assessment combines two elements in its definition of the poverty line: (i) less than half
of the minimum wage; and (ii) additional per capita income needed to ensure the minimum amount of calories as reflected by WHO requirements.
29 A farming systems approach is based on understanding the farm-household, the environment in which it operates, and the constraints it faces, together with identifying and testing potential solutions to those constraints. A farming system is defined as a population of individual farms systems that have broadly similar resource bases, enterprise patterns, household livelihoods, and constraints, and for which similar development strategies and interventions would be appropriate. Their analysis emphasizes horizontal and vertical integration, multiple sources of household livelihoods, and the role of the community, the environment and support services. The primary objective of this approach is to improve the well-being of individual farming families by increasing the overall productivity of the farming system in the context of both the individual and community goals, given the constraints imposed by the factors that determine the existing farming system.

Estimating mitigation potential of agricultural projects: An application of the EX-Ante Carbon-balance Tool (EX-ACT) in Brazil
41
the higher-order objective of increasing small-scale farming productivity and competitiveness in specific areas of the SoRJ.
4.9 The operational strategy is as follows. First, the project will establish an institutional framework in support of the FAO-developed approach of Participatory and Negotiated Territorial Development (PNTD) and promote community driven interventions to increase the organization and capacity of small farmers. Second, the project will support, based on the above, the transition to more productive, efficient, and sustainable production systems through financing different categories of investment proposals and promoting coordination with other agricultural-related programs. Lastly, the project will promote the replication of this methodology throughout the SoRJ by intervening in areas outside of the targeted priority regions with the aim of mainstreaming public policies in support of sustainable rural development.
4.10 The project will be implemented over a period of six years and will target approximately 37,000 small-farming families (some 150,000 people in total) in the SoRJ, which corresponds to roughly 30% of the total rural population in the state. The target population primarily resides in three main regions that include the North, the Northwest30 and Serrana administrative regions, representing a total area of about 23,000 square kilometres (53% of the total area of the state). Eighty-four percent of project funds (or US$66.1 million) will be directed to small farmers within the selected communities via participatory planning, capacity building, and investment activities.
4.11 The total cost of the project is US$79.0 million with a World Bank Loan of US$39.5 million. Counterpart financing from the SoRJ through SEAPPA totals US$21.4 million, in addition to US$18.1 million in private investments.
4.2.2 Project components
4.12 Project activities are structured in three components as follows: (i) Support to Small Farmer Production and Competitiveness (US$66.1 million); (ii) Institutional Frameworks (US$5.2 million); and (iii) Project Coordination and Information Management (US$7.6 million).
4.13 Most of the technical activities are gathered under Component 1 (Support to Small Farmer Production and Competitiveness), which aims to support changes in rural production processes within a framework of market-driven agricultural development focused on sustainable and increased productivity of small farmers, value added, and market linkages. To do so, activities under Component 1 will be carried out in two steps through two subcomponents: (1.1) Pre-Investment and (1.2) Investments.
30 The North and Northwestern administrative regions are also known as the “North and Northwestern
Fluminense” (NNWF). The NNWF is the target area of the Rio GEF project and its two administrative regions overlap with existing territories already established by the Ministry of Agrarian Development (MDA). Each MDA territory consists of a cluster of municipalities that share cultural and socioeconomic similarities. Given that territories are social constructions, the project is adopting a similar concept by defining the territory as a system of various levels (community/micro catchment, municipal, and regional) where different actors compete and eventually cooperate and negotiate.

Estimating mitigation potential of agricultural projects: An application of the EX-Ante Carbon-balance Tool (EX-ACT) in Brazil
42
Subcomponent 1.1 (Pre-investment) will strengthen organization, networking and capacity for agricultural productivity-focused and market-driven development across community, municipal, and regional levels, thus serving as the basic building block for investments supported under subcomponent 1.2. Specifically, this subcomponent will prepare beneficiaries and project staff for the implementation of the project’s technical strategy through training and planning activities. This subcomponent will finance training, workshops and exchanges, expert services (technical assistance for local and regional development), and goods (equipment and materials).
Subcomponent 1.2 (Investments) will implement demand-driven investments identified and developed under subcomponent 1.1. Through the use of grants, investments will be financed to directly support improvements in farming systems and production processes. In most cases, the project will finance a maximum of 80% of the estimated 24,400 investment proposals to be funded. Three types of subprojects will be eligible for support: (i) productive, which includes activities to increase sustainable productivity, promote value added, and develop value chains31; (ii) environmental conditioning of productive units, which includes complying with environmental laws and adopting environmentally-sound and agro-ecological practices; and (iii) rural roads-related logistical bottlenecks, which includes erosion control and rehabilitation of rural roads.
4.3 Potential mitigation impact of project activities
4.14 This section describes the effects of selected project components on GHG emissions and C sequestration, indicating the overall impact on the C-balance, analysed using EX-ACT. The computation of the C-balance is an indication of the overall potential mitigation impact of the selected project components which were considered as relevant in this type of environmental analysis.
4.3.1 Structure of the analysis
4.15 Amongst the activities supported under the above-mentioned sub-components, the following activities were identified as having a potential impact on the C-balance.
31 Based on a study carried out during preparation, the project will initially look at the whole product chain of six
pre-identified production chains – sugarcane, coffee, milk, fruits, vegetables and fish - (involving both market studies and adaptive research activities) as mentioned above, and the project will support the inclusion of small farmers within those chains to increase the efficiency and quality of production. Moreover, the financing of investment proposal under this category will serve as seed money for entrepreneurs to take risks at all stages of the value chain. As a result, in addition to the pre-identified value chains, a flexible design will allow for the financing of other entrepreneurial ideas that may arise during implementation (i.e., artisan products and tourism).

Estimating mitigation potential of agricultural projects: An application of the EX-Ante Carbon-balance Tool (EX-ACT) in Brazil
43
a) Protection of springs and streams
The project aims at involving farmers in water conservation by using economic incentives, encouraging them to conserve forested areas around springs and forested strips around streams in their exploitation. These areas are typically threatened by wood harvesting for energy supply, and by free grazing of cattle. Practically, this activity includes: (i) installation of fences to protect forest from cattle grazing and monetary incentives for farmers to cease exploiting these zones; and (ii) plantation of native forest on most degraded zones.
b) Support to the establishment of Legal Reserves
The project supports farm-level compliance with the current Brazilian Forest Code32, which requires to maintain under native forest all permanent preservation areas plus 20% of farm lands. When trying to match this requirement, farmers often face difficulties in particular to regulate this private reserve. The project intends to support the regularization of farmers by: (i) undertaking topographic survey, environmental licensing and notarization of ‘’in-process’’ Legal Reserve; (ii) providing incentives to farms that have not entered in the process and; (iii) the re-plantation of native vegetations on most degraded zones.
c) Expansion of agro-forestry
The project promotes the expansion of agro-forestry, and especially encourages its development in areas of permanent protection, such as those around springs and streams, or Legal Reserves (RLs), as allowed by the recently approved Brazilian legislation33.
d) Improved annual crop management
The project promotes the adoption of several agricultural practices which may have environmental co-benefits. These practices include: crop diversification; integrated pest management and biological control of pest and diseases; bio-fertilization and in particular the use of compost, organic fertilizer and green manure, soil analysis and rational use of fertilizers; zero and minimum tillage, planting contour, inter/relay cropping and mulching; irrigation management.
e) Improved grassland management
The project aims to restore degraded pastures by improving rotations and supporting the production of sugar-cane forage to feed cattle.
32 The Forest Code in Brazil, established in 1934, requires that 20% of properties must be conserved under forest
(80% in Legal Amazon, 50% for the savannah/cerrado zones on the Amazon fringes). 33 Instrução Normativa MMA, on 08/09/2009 and Decree 7029 on 10/12/2009.

Estimating mitigation potential of agricultural projects: An application of the EX-Ante Carbon-balance Tool (EX-ACT) in Brazil
44
f) Improved feeding practices of dairy cattle
The project supports the development of improved feeding practices for dairy cattle, which are already adopted for 12% of the 421,000 dairy cattle heads that counts Rio de Janeiro State.
g) Support to small agro-industry and construction of sanitary installations
The project supports the development of small agro-industry by funding the construction of the premises and the equipment, and aims to improve rural livelihood by financing the installation of sanitations.
h) Use of lime to fight soil acidification and sustainable use of agro-chemicals
The project supports the use of lime to combat soil acidification and, more generally, promotes a more sustainable use of agro-chemicals in cropland and grassland management.
4.16 In light of the above activities, two indirect impacts on the C-balance were also taken into account:
although project activities will emphasize sustainable agricultural practices, cropland and grasslands management is expected to increase the use of agro-chemicals, with an expected increase in GHG emissions (see section 4.3.9);
project implementation – but mainly activities under subcomponent 1.1 – is expected to intensify technical assistance of 400 project executers currently operating in the area, resulting in a substantial increase in the annual fuel consumption and, again, an expected increase in GHG emissions (see section 4.3.10).
4.17 Last, the following two activities were not taken into account in the analysis, although they may have an impact on the C-balance:
the establishment of fire-breaks to protect an area of 200 ha. The mitigation potential can be estimated taking into account the avoided deforestation consequent to the establishment of fire breaks, but no data on the occurrence of fire events in the state were available;
the construction and rehabilitation of roads on strategic sloppy zones, which may have a controversial effect on GHG emissions: it can increase emissions as a result of the construction work but it can also increase the amount of C

Estimating mitigation potential of agricultural projects: An application of the EX-Ante Carbon-balance Tool (EX-ACT) in Brazil
45
sequestration by re-vegetating areas adjacent to the roads and reducing soil erosion and thus potentially emissions from soil degradation (Lal 2005). Also, in the long run, roads in better conditions are expected to lower fuel consumption and related GHG emissions. The mitigation potential was not computed in the main scenario due to a lack of precise data, but it has been considered in the sensitivity analysis, albeit approximated.
4.3.2 Basic assumptions of the analysis
4.18 The project is being implemented in the State of Rio de Janeiro in Brazil, which is considered here as “developing” country in the South American Continent: this will affect some coefficients used in the analysis, such as dairy cattle emissions or enteric emission factors. Since the area interested by project activities is quite large, data used to describe climate patterns and soil characteristics cannot take into account the considerable variability of existing soil and climate conditions and the results of the analysis should therefore be considered only as representative for the whole area.
4.19 Average climate is considered as tropical with a mean annual temperature equal to 22 degrees Celsius and a moisture regime classified as moist. These settings correspond to average temperature and rainfall for the State. Such information is essential as most coefficients used in the analysis can change drastically according to the climate. This is particularly true for the moisture regime, but also for the mean annual temperature which is affecting, for example, the level of CH4 emissions from manure management.
4.20 As for the soil characteristics – and with reference to the simplified IPCC classification where only six soil categories are listed (Sandy Soils, Spodic Soils, Volcanic Soils, Wetland Soils, High Activity Clay Soils and Low Activity Clay Soils) – the analysis considers that the dominant soil type for the project area is LAC soils which are highly weathered soils, dominated by 1:1 clay minerals and amorphous iron and aluminium oxides (although it also includes HAC, Wetland and Sandy soils in a more detailed scale). LAC soils includes Acrisols, Lixisols, Nitisols, Ferralsols, Durisols in the FAO-World Reference Base classification; and Ultisols, Oxisols, acidic Alfisols in the USDA classification. HAC soils are taken into account in the sensitivity analysis (see section 4.5).
4.21 The project will be implemented over a timeframe of six years. The analysis will therefore consider an implementation phase of six years, followed by a capitalization phase of fourteen years, which will represent a period where the benefits of the investment are still occurring and may be attributed to the changes in land use and management induced by the adoption of the project. As it will be discussed further in the analysis, the implementation phase may happen according to three different dynamics of change: immediate, linear and exponential (see figure 3.1), depending on the characteristics of the specific project activity and on the information available on the adoption rate of the selected practice among project participants.
4.22 As concerns the Global Warming Potential (GWP) coefficients, the present analysis uses the same values as those adopted within the Clean Development Mechanism (CDM), i.e. 21 for CH4 and 310 for N2O.

Estimating mitigation potential of agricultural projects: An application of the EX-Ante Carbon-balance Tool (EX-ACT) in Brazil
46
4.23 A three–step methodological framework was used to account for each land-based project activity:
a) estimation of area interested by land use change and management;
b) characterization of the technologies/practices used in both “with” and “without project” scenarios with reference to the area concerned; and
c) estimation of the mitigation potential of the project activities using the relevant EX-ACT module.
4.24 Next sections show the implementation of this methodological approach in the case of project activities considered in the present analysis (as summarised in section 4.3.1).
4.3.3 Protection of springs and streams and support to the establishment of RLs
a) Protection of springs and streams
4.25 The project aims at involving farmers in water conservation by using economic incentives. It encourages them to conserve forested areas around springs and forested strips around streams in their exploitation. Practically, this activity involves 900 ha and includes installation of fences to protect land from cattle grazing and monetary incentives for farmers to cease exploiting these zones - both resulting in natural forest regeneration; and plantation of native forest on most degraded zones.
4.26 In the “with project” scenario, it is estimated that grassland area will gradually switch into native forest through a process of natural forest regeneration (this will involve 720 ha) and that no deforestation will take place (this will involve 180 ha). On the contrary, in the “without project” scenario it is assumed that: 80% of the area (720 ha) is likely to remain grasslands (degraded with fire use in the management of land); the remaining 20% of the area, already forested, is likely to suffer degradations from wood harvesting for energy supply. This is accounted for in the model by applying to these areas the current rate of deforestation for the state which is equal to 0.23% 34 (figure 4.1).
34 Although this assumption may be strong to represent the wood harvesting, it is acceptable considering the
extremely low deforestation rate in SoRJ.

Estimating mitigation potential of agricultural projects: An application of the EX-Ante Carbon-balance Tool (EX-ACT) in Brazil
47
Figure 4.1: “With” and “without project” scenarios for the protection of springs and streams
80% of Grassland
20% of Forest
Total area protected: 900 ha
Forest regeneration on 720 ha
Deforestation of 180ha*0.23%*6 =2.5 ha
=> Grassland
Without Project
With Project
Remains Grassland
Remains Forest
Source: project data 4.27 In addition, in the “with project” scenario, it is foreseen that 50 ha of degraded land will be interested by the plantation of native forest.
b) Support to the establishment of RLs
4.28 The project supports farm-level compliance with the current Brazilian Forest Code, which requires to maintain in Rio de Janeiro State 20% of the farm land surface under native forest. When trying to match this requirement, farmers often face difficulties in particular to notarize this private reserve.
4.29 The project intends to support the establishment of Legal Reserves by:
undertaking topographic survey, environmental licensing and notarization of 300 ha of “in-process” Legal Reserve;
providing incentives to conserve 100 additional ha for farms that are still not involved in the notarization process – resulting in forest regeneration; and
the re-plantation of native vegetations on the most degraded zones, which concerns an additional 60 ha.
4.30 Total area protected by project activities is therefore estimated at 460 ha. Of these, 60 hectares of degraded land will be interested by the re-plantation of native vegetations. It is assumed that most of the remaining 400 ha targeted by the project is under forest cover (80%) and the remaining (20%) is still predominantly under degraded grassland with use of fire in their management.
4.31 In the “without project” situation it is assumed that some deforestation activities will take place and that overall 4.4 ha of forest will be converted to grasslands. Also, degraded grassland is likely to remain as such in the “without project” case. On the contrary, in the “with project” scenario, no deforestation will occur, grassland area will gradually switch into native

Estimating mitigation potential of agricultural projects: An application of the EX-Ante Carbon-balance Tool (EX-ACT) in Brazil
48
forest through a process of forest regeneration and re-plantation of native vegetations over an area of 80 ha. This is shown in figure 4.2.
Figure 4.2: “With” and “without project” scenarios for the protection of legal reserve
80% of forest (320 ha)
20% of grassland
(80 ha)
Total area protected: 400 ha
Forest regeneration on 80 ha
Deforestation of 320ha*0.23%*6 = 4.4 ha
=> grassland
Without Project
With Project
Remains grassland
Source: project data
4.32 This set of project activities is taken into account in the following EX-ACT modules: “grassland”, “afforestation/reforestation”, and “deforestation” as explained in what follows.
4.33 Deforestation happening in the “without project” scenario is considered in the corresponding “deforestation” module. The forest was described as tropical rain forest: given that deforestation is clearly a source of GHG emissions, this represent a pessimistic setting considering that this type of forest is characterized by the highest values for above and below ground biomass. Considering local conditions and practices, it is assumed that the forest will not be burnt before conversion to grasslands. The module “deforestation” quantified in 4,302 tCO2e the mitigation impact of the avoided deforestation of 6.9 ha of tropical rain forest. The module “grassland” considered then the impact of the corresponding increase in grassland area. It is assumed that the grassland type after deforestation will most likely be non-degraded and would remain under this type with no fire use. This system evolution is considered as C neutral by the tool which explains the absence of additional effect on the C-balance for grasslands.
4.34 In the “afforestation/reforestation” module it is assumed that forest cover will be regenerated on 800 ha of degraded grassland through naturally re-growing stands with reduced or minimum human intervention (extensively managed forest). Given the climatic conditions of the project area, the vegetation type has been classified as natural (tropical rain) forest. This affects the growth rate of trees and the process of biomass gains and losses: for less than 20 years old natural forests, it is estimated that above ground biomass is equal to 11 tons of dry matter per ha and per year (t dm/ha/year), and the below ground biomass is equal to 4.07 t dm/ha/year. Default value for litter (3.65 t C/ha) is based on the average between values for broadleaf deciduous and leaf deciduous forests, while soil C estimates are based on default references for soil organic C in mineral soils at a 30 cm depth (Bernoux et al. 2010b). There are no estimates available for dead wood C stocks; therefore the corresponding value is set equal to 0 while default value for soil C is set equal to 47 t C/ha.
4.35 The same “afforestation/reforestation” module takes into account the activity of re-planting native vegetations on 110 ha of degraded grassland. It is again assumed that forest

Estimating mitigation potential of agricultural projects: An application of the EX-Ante Carbon-balance Tool (EX-ACT) in Brazil
49
regeneration and plantation of native forest will consist of tropical rain forest, which is perhaps an optimistic setting (here it is a C sink) considering that to this type of forest correspond the highest values for above and below ground biomass.
4.36 Both forest regeneration and re-planting are occurring on degraded grassland where fire use is a constant management option. The decrease in grassland is automatically accounted for in the module “grasslands”.
4.37 Overall, this set of activities is able to sequester 521,468 t CO2e, of which 4,302 as “avoided deforestation” and 517,166 as a result of forest regeneration and plantation of native forests (table 4.1).
Table 4.1: C-balance associated with the protection of springs and streams and the establishment of the legal reserve
a) Avoided deforestation GHG emissions
Area deforested (ha) Biomass gain (1yr after) Total Balance DifferenceStart Without Project With Project Without With Without With Without With Without With
t0 End Rate End Rate tCO2 tCO2 tCO2 tCO2 tCO2 tCO2 tCO22,5 0 Linear 2,5 Linear 3 0 1804 0 -69 0 1735 0 -17353,7 0 Linear 4,4 Linear 4 0 2670 0 -103 0 2568 0 -2568
4302 0 -4302
Forested Area (ha) Biomass loss
b) Forest regeneration and plantation of native forests GHG emissions
Biomass Loss Soil Fire Total Balance DifferenceStart Without Project With Project Without With Without With Without With Without With Without With
t0 End Rate End Rate tCO2 tCO2 tCO2 tCO2 tCO2 tCO2 tCO2 tCO2 tCO2 tCO2 tCO20 0 Linear 720 Linear 0 -327517 0 2803 0 -70664 0 163 0 -395214 -3952140 0 Linear 80 Linear 0 -36391 0 311 0 -7852 0 18 0 -43913 -439130 0 Linear 110 Linear 0 -67697 0 428 0 -10796 0 25 0 -78040 -78040
Deforestation Total 0 -517166 -517166
Biomass GainAfforested or reforested Area (ha)
Source: our calculations using EX-ACT (2010)
4.3.4 Expansion of agro-forestry systems
4.38 The project promotes the expansion of agro-forestry, and especially encourages its development in areas of permanent protection, such as those around springs and streams, or in Legal Reserves35.
4.39 Specifically, the project will promote the plantation of native forest on 1,100 ha of degraded grassland (table 4.2).The trees species planted are generally composed by two third of native species and one third of exotic commercial species. General more than 20 native species are planted among Angico sp., Inga spp., Cassia grandis, Cassia imperials, Ipê amarelo,Pau Ferro, Pau Brasil, Guapuruvu Quaresmeira, Jequitiba, Saboneteira, Nim, Pequiá, Pacová, associated to fruits (abacate, jambo, jaca, guava, caju, graviola, abiu, açaí, lemon, orange), vegetables (Manihot esculenta, inhame, cará) and wood species (Cedro australiano sp., Eucaliptus grandis sp.) so that the biomass is expected to be closest from a native forest type.
35 This activity is therefore very much linked with the previous one aimed at protecting springs and streams and
supporting the establishment of the Legal Reserves.

Estimating mitigation potential of agricultural projects: An application of the EX-Ante Carbon-balance Tool (EX-ACT) in Brazil
50
Table 4.2: Land use change related to the expansion of agro-forestry systems in the Rio Rural project (data in ha)
Project activity
Start Without project
With project
Technologies used
Agro-forestry systems
0 0 1,100 Plantation of native and exotic forestry species on degraded grassland
Total 0 0 1,100 Source: project data
4.40 This activity will determine a change in both biomass and soil C stock and is taken into account in the EX-ACT modules “other land use change” and “perennials”. As there are currently no default values for agro-forestry systems from IPCC, the analysis has adopted default values for perennial crops. The expansion of agro-forestry systems on degraded grassland (1,100 ha) would determine a change in both biomass and soil C stock, as explained next.
4.41 With reference to the specific climate (tropical moist) and tree types, it is expected that an increase in biomass C stock from 1.0 to 2.6 tC/ha will take place as a result of the land use change, corresponding to 6,453 tCO2e mitigated over 20 years. This is considered in the module “other land use change” which takes into account the calculations done by IPCC with reference to the changes in land use. The biomass will also increase as a consequence of the land management, as accounted for in the module “perennials” which helps to correct the nominal baseline according to the specific land management: above ground biomass growth is set using the IPCC default value of 2.1 tC/ha per year, corresponding to 139,755 tCO2e mitigated from biomass over 20 years (table 4.3). Therefore, total amount of CO2 mitigated from biomass, as a result of the expansion of agro-forestry systems is equal to: 6,453+139,755=146,208 tCO2e over 20 years. In fact, the results of the computations from the two modules should be considered as additive here.
4.42 The conversion from degraded land to perennials will also cause the increase in soil organic C stock, which for the climate and soil characteristics of project area is estimated to increase from 15.5 to 47.0 tC/ha, corresponding to 107,958 tCO2e mitigated. Perennial systems can also store C in soil: default C storage amounts to 0.7 tCO2e/ha per year for temperate moist regions, so that total mitigation potential is equal to 13,090 tCO2e. Similarly to mitigation from biomass, the results of the computations from the two modules should be considered as additive: total amount of CO2 mitigated from biomass, as a result of the expansion of agro-forestry systems is equal to: 107,958+13,090=121,048 tCO2e over 20 years (table 4.3).
Table 4.3: C-balance associated with the expansion of agro-forestry systems GHG emissions
Area concerned by LUC Soil Change Fire Total Balance DifferenceWithout Project With Project Without With Without With Without With Without With
Area Rate Area Rate tCO2 tCO2 tCO2 tCO2 tCO2 tCO2 tCO2 tCO2 tCO2Expansion of agro-forestry systems 0 Linear 1100 Linear 0 -6453 0 -107958 0 0 0 -114412 -114412
Other LUC total 0 -114412 -114412
Biomass Change
Mitigation potentialVegetation Type Areas CO2 mitigated from Biomass CO2 mitigated from Soil CO2eq emitted from Burnin Difference
Start Without project With Project Without With Without With Without With Without With
t0 End Rate End Rate tCO2 tCO2 tCO2eq
System P1 0 0 Linear 0 Linear 0 0 0 0 0 0 0 0 0System P2 0 0 Linear 0 Linear 0 0 0 0 0 0 0 0 0OLUC to Perennial 0 0 Linear 1100 Linear 0 -139755 0 -13090 0 0 0 -152845 -152845
Total Balance
Source: our calculations using EX-ACT (2010)

Estimating mitigation potential of agricultural projects: An application of the EX-Ante Carbon-balance Tool (EX-ACT) in Brazil
51
4.43 Total mitigation potential of the expansion of agro-forestry is computed by adding the mitigation potentials from biomass and soil C: overall, this activity will create a net C sink of 146,208+121,048=267,256 tCO2e over 20 years, i.e. 12.1 tCO2e/ha per year.
4.3.5 Improved annual crop management
4.44 The project promotes the adoption of several sustainable agricultural practices summarized in table 4.4. Many of these improved practices may increase yields and generate higher residues with positive effects in terms of mitigation (because of increased C biomass and soil C stocks). Increasing available water in the root zone through water management can enhance biomass production, increase the amount of above-ground and root biomass returned to the soil, and improve soil organic C concentration. Some practices may also lead to reduction in N2O and GHG emission sources. For example, integrated nutrient management can reduce on-site emissions by reducing leaching and volatile losses, improving N use efficiency through precision farming and improved fertilizer application timing (FAO 2009).
Table 4.4: Details of the sustainable agricultural practices promoted by project activities
Crop diversification Integrated Pest Management (IPM) Biological Control of pest and diseases
Improved agronomic practices
Transition toward agro-ecological systems Green manure
Organic fertilizer
Soil analysis and rational use of fertilizers
Bio-fertilization
Nutrient management
Composting
Minimum tillage
Inter/Relay Cropping
Contour/ Strip Contour Cropping Tillage / residues Management
Mulching
Water management Irrigation management Source: project data
4.45 Total cropland in the project area is 225,104 ha. The improved practices will involve 4,110 ha as reported in table 4.5.

Estimating mitigation potential of agricultural projects: An application of the EX-Ante Carbon-balance Tool (EX-ACT) in Brazil
52
Table 4.5: Land use change related to the promotion of sustainable agricultural practices promoted by the Rio Rural project (data in ha).
Description of farming systems
Start Without project
With project
Technologies used
Improved agronomic 1 0 0 300
Improved agronomic practices, tillage/residues management, nutrient management and manure application
Improved agronomic 2 0 0 240 Improved agronomic practices
Improved agronomic 3 0 0 305
Improved agronomic practices, tillage/residues management and manure application
Nutrient management 1 0 0 1,320
Nutrient management and manure application
Nutrient management 2 0 0 310 Nutrient management
Nutrient management 3 0 0 475 Nutrient management, tillage/residues management and manure application
Tillage/residue management
0 0 950
Tillage/residues management and manure application
Water management 0 0 210 Water management
Current system (not improved)
225,104 225,104 220,994
Manure application and residue/biomass burning
Total improved systems 0 0 4,110
Total 225,104 225,104 225,104 Source: project data
4.46 This activity is taken into account in the module named “annual” which computes the total mitigation potential of this set of activities in terms of soil C change for a 20-years time horizon using only CO2 emissions factors (see table 3.4). As already discussed in section 3.3.4, EX-ACT adopts a conservative approach by considering only the mitigation effect related to CO2 emissions and by considering that the mitigation effect of different agricultural practices applied on the same land is not additive (i.e. the model will pick only the practice with the highest coefficient instead of adding up the single coefficients corresponding to each practice).

Estimating mitigation potential of agricultural projects: An application of the EX-Ante Carbon-balance Tool (EX-ACT) in Brazil
53
4.47 Total mitigation impact of the adoption of improved cropland practices is equal to 18,334 tCO2e over 20 years (table 4.6). Given an area of 225,104 ha, the annual mitigation potential of these activities is equal to 0.08 tCO2e/ha.
Table 4.6: C-balance associated with improved annual crop management
Vegetation Areas DifferenceType Start Without With Without With Without With
t0 End Rate End Rate tCO2 tCO2 tCO2System A1 0 0 Linear 0 Linear 0 0 0 0 0 0 0System A2 0 0 Linear 0 Linear 0 0 0 0 0 0 0System A3 0 0 Linear 0 Linear 0 0 0 0 0 0 0System A4 0 0 Linear 0 Linear 0 0 0 0 0 0 0Current system 225104 225104 Linear 220994 Linear 0 194937 2823705 2779882 2823705 2974819 151115Improved agronomic 1 0 0 Linear 300 Linear 0 -14229 0 0 0 -14229 -14229Improved agronomic 2 0 0 Linear 240 Linear 0 -3590 0 0 0 -3590 -3590Improved agronomic 3 0 0 Linear 305 Linear 0 -14466 0 0 0 -14466 -14466Nutrient management 1 0 0 Linear 1320 Linear 0 -62608 0 0 0 -62608 -62608Nutrient management 2 0 0 Linear 310 Linear 0 -2899 0 0 0 -2899 -2899Nutrient management 3 0 0 Linear 475 Linear 0 -22529 0 0 0 -22529 -22529Tillage/residue management 0 0 Linear 950 Linear 0 -45059 0 0 0 -45059 -45059Water management 0 0 Linear 210 Linear 0 -4070 0 0 0 -4070 -4070Total Syst 1-10 225104 225104 225104
Agric. Annual Total 2823705 2805370 -18334
With ProjectWithout projectTotal BalanceSoil CO2 mitigated
CO2eq emitted from Burning
Source: our calculations using EX-ACT (2010)
4.48 The EX-ACT module “inputs” also computes the changes in input (agro-chemicals) use corresponding to the changes in annual crop management. Improved annual crop management is expected to increase input use (table 4.7). Except for vegetables cropping systems, project activities may intensify the use of lime and chemical fertilizers as well as the use of pesticides for annual crops such as corn and beans, or semi-perennial crops (sugarcane). In these cropping systems, current agricultural practices are conducted at a very low technological level and often on degraded soils, turning out invariably to very low productivity rates. In these cases, inputs are needed to restore soil fertility and amend soil constrains to ensure a good environment for plant growing and to raise crop productivity. For vegetables crops, on the contrary, the business as usual intense and irrational use of agro-chemicals tend to be reduced by the project by promoting a rational fertilization with less use of chemical fertilizers and pesticides.
Table 4.7: Use of agro-chemicals in cropland management
Consumption in m3/year Type of Input
Start Without project With project Limestone 73.6 126.6 146.4 Dolomite 110.3 84.4 97.6 Urea 45.4 50.9 72.6 Chemical N fertilizer 6.8 7.7 10.9 Phosphorus synthetic fertilizer
26.8 30.6 37.9
Potassium synthetic fertilizer
50.9 57.8 73.8
Source: project data

Estimating mitigation potential of agricultural projects: An application of the EX-Ante Carbon-balance Tool (EX-ACT) in Brazil
54
4.49 The results show that in the “with project” scenario, there will be an increase in the GHG emissions of 2,495 tCO2e over 20 years: CO2 emissions from lime and urea application (6% of the total), N2O emissions from N application on managed soils36 (28%), and CO2e emissions from production, transportation, and storage of agricultural chemicals (66%).
4.50 Overall, improved cropland management will create a net C sink of 18,334 – 2,495 = 15,839 tCO2e over 20 years.
4.3.6 Improved grassland management
4.51 The project will promote the restoration of moderately degraded grassland by improving pasture rotations (resulting in non degraded grassland) and supporting the production of sugar-cane forage (resulting in improved grassland with inputs improvement), as shown in table 4.8.
Table 4.8: Land use change related to the promotion of improved grassland management by the Rio Rural project (data in ha)
Initial state Start Without project
With project
Technology used Final state
Moderately degraded 0 85 290 Improved through
pasture rotation Non degraded
Moderately degraded 0 21 401 Improved through sugar cane forage
production
Improved with inputs improvement
Moderately degraded 691 585 0 System unchanged Moderately degraded
Total 691 691 691 Source: project data
4.52 Overall, this activity will involve 691 ha and is taken into account in the EX-ACT module named “grasslands”. It is considered that in the “with project” scenario, all 691 ha will be interested by the adoption of improved management practices, while this will happen only for 106 ha in the “without project” case. This is expected to create a mitigation potential: in fact, the change from moderately degraded to non degraded grassland (through the adoption of pasture rotation) implies a slight increase in C stock from 45.12 to 47 tC/ha; and the change from moderately degraded to improved with inputs improvement grassland (through the promotion of sugar cane production) implies a significant increase in C stock from 45.12 to 60.52 tC/ha. Therefore, this activity is expected to have an overall mitigation potential of 19,437 tCO2e over 20 years, i.e. 28,1 tCO2e/ha per year (table 4.9).
36 These exclude manure application which is taken into accounted in the “livestock” module.

Estimating mitigation potential of agricultural projects: An application of the EX-Ante Carbon-balance Tool (EX-ACT) in Brazil
55
Table 4.9: C-balance associated with improved grassland management Default Without project With Project Soil C variations (tCO2eq) Total CO2 eq from fire Total CO2eq Difference
End Rate End Rate Without With Without With Without With tCO2eqGrass-1 Pasture rotations 85 Linear 290 Linear 0 -1201 0 0 0 -1201 -1201Grass-2 Sugarcane forage 21 Linear 401 Linear 0 -18235 0 0 0 -18235 -18235Grass-3 Land equilibrium 585 Linear 0 Linear 0 0 0 0 0 0 0Total Syst 1-10 691 691
Grassland total 0,0 -19437 -19437
Source: our calculations using EX-ACT (2010)
4.3.7 Improved feeding practices of dairy cattle
4.53 The project supports the adoption of improved feeding practices for dairy cattle. This is already practiced over 12% of the 421,000 dairy cattle heads bred in Rio de Janeiro State, but the project will increase this percentage to 20%. It is assumed that a slight improvement from 12 to 13% will occur in the “without project” case too (table 4.10). It is also assumed that the herd size is steady in both “with” and “without project” scenarios.
Table 4.10: Rate of adoption of improved feeding practices (% of heads)
Start Without project
With project
Feeding practices 12 13 20 Source: project data
4.54 The module “livestock” takes into account the mitigation effect (GHG reduction) consequent to the implementation of improved feeding practices. Smith et al. (2007) showed in fact that use of higher level of concentrates may increase CH4 emissions per animal, but also increase productivity (meat and milk), thus resulting in an overall reduction of CH4 emissions per unit of product (see table 3.9). In the specific case of feeding practices, the default value of 6% reduction of CH4 emissions is adopted.
4.55 Overall, livestock production is responsible for emitting: 11,139,660 tCO2e over 20 years as CH4 emissions from enteric fermentation; 176,820 tCO2e over 20 years as CH4 emissions from manure management; and 2,874,501 tCO2e over 20 years as NO2 emissions from manure management. Since the project is not introducing any change in livestock population, the same level of emissions will occur in both “with” and “without project” scenarios, so the C-balance is equal to 0. Nevertheless, the project will have a mitigation effect determined by the adoption of the improved feeding practices as mentioned above, and quantified as 39,769 tCO2e over 20 years (table 4.11).

Estimating mitigation potential of agricultural projects: An application of the EX-Ante Carbon-balance Tool (EX-ACT) in Brazil
56
Table 4.11: C-balance associated with improved feeding practices of dairy cattle Methane emissions from enteric fermentation
Total Emission (tCO2eq)IPCC Specific Default Start Start Differencefactor factor Factor t0 End Rate End Rate Without With Without With
63 YES 421000 421000 Linear 421000 Linear 556983 556983 556983 11139660 11139660 0
Methane emissions from manure managementTotal Emission (tCO2eq)
IPCC Specific Default Start Start Differencefactor factor Factor t0 End Rate End Rate Without With Without With
1 YES 421000 421000 Linear 421000 Linear 8841 8841 8841 176820 176820 0
Nitrous Oxide emissions from manure managementTotal Emission (tCO2eq)
IPCC Specific Default Start Start Differencefactor factor Factor t0 End Rate End Rate Without With Without With0.01 YES 29503.7 29503.7 Linear 29503.7 Linear 143725 143725 143725 2874501 2874501 0.0
Additional Technical Mitigation
Percent of head with practices (0% =none;100%=all) Emission (t CO2eq) per year Total Emission (tCO2eq)Start Without Project With Project Start End All Period Difference
Dominant Practice* Factor t0 End Rate End Rate Without With Without WithFeeding practices 0.060 12.0% 13.0% Linear 20.0% Linear -4010 -4344 -6684 -85887 -125655 -39769Specific Agents 0.030 0% 0% Linear 0% Linear 0 0 0 0 0 0Management-Breed 0.020 0% 0% Linear 0% Linear 0 0 0 0 0 0No Option 0.000 88% 87% Linear 80% Linear 0 0 0 0 0 0
Total "Livestocks" 14105095 14065326 -39769
All PeriodEmission (t CO2eq) per year
EndHead Number
With ProjectWithout Project
All Period
Annual amount of N manure* (t N per year) Emission (t CO2eq) per yearAll Period
Without Project With Project
Without Project With Project End
Emission (t CO2eq) per yearEnd
Head Number
Source: our calculations using EX-ACT (2010)
4.3.8 Support to small agro-industry
4.56 The project supports the development of small agro-industry activities through funding the construction of the premises and the installation of equipment, which will also indirectly lead to increased electricity consumption (table 4.12).
Table 4.12: Construction and electricity consumption in support to agro-industry
Surface (m2) Type of construction
Without project With project Housing (concrete) 0 10,380 Agricultural Buildings (metal) 9,600 10,800 Industrial Buildings (concrete) 4,300 10,540
Electricity consumption (Mwh) Without project With project Electricity Consumption
1,030 1,300 Source: project data
4.57 The effect of this set of activities on GHG emissions is computed in the module “other investments” and shown in table 4.13. As already mentioned in section 3.3.5, default GHG emissions factors used in the model (0.093 tCO2e/MWh) come from the Electricity Information Database provided by the International Energy Agency (IEA) and reported by the US Department of Energy, while GHG emissions associated with construction activities are computed using default values from the tool developed by the Agence de l'Environnement et de la Maîtrise de l'Energie (ADEME), i.e. 0.436 tCO2e/m2 for housing (concrete), 0.22 tCO2e/m2 for agricultural buildings (metal), and 0.825 for industrial building (concrete).

Estimating mitigation potential of agricultural projects: An application of the EX-Ante Carbon-balance Tool (EX-ACT) in Brazil
57
4.58 Overall, this set of activities represents a source of GHG emissions which has been computed by adding the GHG associated with electricity consumption to the GHG associated with infrastructure building, i.e. 468.8 + 9,937.7 = 10,406.5 tCO2e.
Table 4.13: C-balance associated with support to small agro-industry Released GHG associated with Electricity ConsumptionAnnual Electricity Consumption (MWh/yr) Emission (t CO2eq)
Startt0 End Rate End Rate Without With
850 1030 Linear 1300 Linear 2049 2517
Sub-Total Without 2048,6 Sub-Total With 2517,4 Difference 468,8
Without Project With Project All Period
Released GHG associated with building of infrastructureType of construction surface (m2) Emission (t CO2eq)
Without With Without With
0 10380 0,0 4525,79600 10800 2112,0 2376,04300 10540 3547,5 8695,5
Subtotal 5659,5 15597,2 Difference 9937,7
Housing (concrete)Agricultural Buildings (metal)Industrial Buildings (concrete)
Source: our calculations using EX-ACT (2010)
4.3.9 Use of lime to fight soil acidification and sustainable use of agro-chemicals
4.59 The project supports the use of lime to combat soil acidification, common under these climatic conditions. This is taken into account in the module “inputs”, together with the change in the use of agro-chemicals as a result of the adoption of improved annual crop management which has been already discussed in section 4.3.5.
4.3.10 Technical assistance for project implementation
4.60 Project implementation is expected to intensify the work of the 400 technicians currently operating in the 59 municipalities and 270 micro watersheds/rural communities that will be targeted by the project.
4.61 Overall, project activities are expected to triple total fuel consumption, from 189m3 to 630m3, resulting in significantly increased GHG emissions. In order to cope with this expected source of emissions, the project is expected to increase the use of ethanol as fuel source, thus reducing oil consumption. The project will in fact promote the use of cars equipped with a new technology which allows using 100% ethanol as fuel. It is expected that 40% of the cars used during project activities will be run with 100% ethanol, with the remaining 60% still running with 20% ethanol. This will imply that on the first year of the project 83 cars equipped with the new technology will be purchased, since 10% of the current 330 cars are already equipped with the proper technology. Fuel consumption “with” and “without” project, computed by taking into account the increased use of ethanol, is shown in table 4.14.

Estimating mitigation potential of agricultural projects: An application of the EX-Ante Carbon-balance Tool (EX-ACT) in Brazil
58
Table 4.14: Fuel consumption related to technical assistance for project implementation
Consumption in m3/year Type of
fuel Start
Without project
With project
Gasoline 7.60 7.60 15.12 Ethanol 1.89 1.89 16.38
Source: project data
4.62 The increase in fuel consumption will increase the level of GHG emissions consequent to fuel burning (table 4.15). EX-ACT estimated that use of gasoline will emit 2.85 tCO2e/m3 (default value from IPCC) while ethanol will emit only 0.51 tCO2e/m3 (Dias de Oliveira 2005)37, therefore overall GHG emissions from fuel consumption will increase by 579 tCO2e.
Table 4.15: C-balance associated with technical assistance for project implementation Released GHG associated with Fuel consumption (agricultural or forestry machinery, generators…)
Annual Fuel Consumption (m3/yr) Emission (t CO2eq)Type of Fuel Default value Specific Default Start
t CO2 /m3 Value Factor t0 End Rate End Rate Without WithGasoil/Diesel 2,63 YES 0 0 Linear 0 Linear 0 0Gasoline 2,85 YES 7,56 7,56 Immediate 15,12 Immediate 431 862Ethanol 0,510 NO 1,89 1,89 Immediate 16,38 Immediate 19 167
Sub-Total Without 450,4 Sub-Total With 1029,3 Difference 578,9
Without Project With Project All Period
Source: our calculations using EX-ACT (2010)
4.63 This calculation does not take into account the emissions related to the construction and transportation of new cars as it is reasonably assumed that the cars will be produced even without this project. Also, the coefficient used for the 100% ethanol fuel represents the emission occurring during sugar cane cropping, harvest and ethanol production. Avoided emissions from biomass and electricity surplus, as well as from ethanol use were not taken into account here. The coefficient also does not account for the land-use changed potentially induced by sugar-cane cropping. If some studies carried out in the US on corn-based bio-ethanol show that including land-use change in the calculation can significantly off-set the benefits from using bio-ethanol (Searchinger et al. 2008), in Brazil this seems not being the case as sugar-cane production is concentrated in the Centre-South of the country and its impact on Amazonian deforestation is not so obvious.
37 An alternative and slightly more optimistic value of 0.4265 tCO2e/m3 is in Macedo et al. (2008): it represents
an average of the values found for hydrous and anhydrous production of sugar-cane bio-ethanol in 2005-2006 in Brazil. Nevertheless, the adoption of this alternative coefficient will not change significantly the results.

Estimating mitigation potential of agricultural projects: An application of the EX-Ante Carbon-balance Tool (EX-ACT) in Brazil
59
4.4 A summary of the project mitigation potential: C-balance and land use change
4.64 The overall C-balance of the project is computed as the difference between C sinks and sources over 20 years (6 years of implementation phase and 14 years of capitalization phase). The project is fact able to sequester 0.86 MtCO2e while emitting 0.01 MtCO2e so that the net effect of project activities is to create a sink of 0.85 MtCO2e (table 4.16). Since total project area amounts to 227,811 ha, the average mitigation potential of the project is equal to 0.2 tCO2e per ha per year.
Table 4.16: C-balance of the Rio Rural project
C-balance elements Mt EX-ACT modules
Total GHG mitigated -0.86 Avoided deforestation, afforestation, cropland management, agro-forestry, grasslands, livestock, other land use change
Total GHG emitted 0.01 Inputs, other investments C-balance -0.85 Project is a C sink
Source: our calculations using EX-ACT (2010)
4.65 Most mitigation potential is related to changes in the expansion of land under forest cover through forest regeneration and plantation of native forests (59.7%) and to the expansion of agro-forestry systems (17.6%) as shown in table 4.17 and figure 4.3.
Table 4.17: Mitigation impact of the Rio Rural project, by EX-ACT module
EX-ACT modules Mt % of total GHG
mitigated % of total GHG
emitted
Deforestation -0.004 0.5 - Afforestation and Reforestation -0.517 59.7 - Other Land Use Change -0.114 13.2 - Annual crops -0.018 2.1 - Agroforestry/Perennial Crops -0.153 17.6 - Grassland -0.019 2.2 - Livestock -0.040 4.6 -
Total GHG mitigated -0.866 100.0 -
Inputs 0.002 - 18.5 Project Investment 0.011 - 81.5
Total GHG emitted 0.013 - 100.0
C-balance -0.85 - - Source: our calculations using EX-ACT (2010)

Estimating mitigation potential of agricultural projects: An application of the EX-Ante Carbon-balance Tool (EX-ACT) in Brazil
60
Figure 4.3: Mitigation potential of the Rio Rural project, by EX-ACT module
-0.6
-0.5
-0.4
-0.3
-0.2
-0.1
0.0
0.1
Defore
stat
ion
Affore
statio
n and R
efore
statio
n
Other L
and U
se Chan
ge
Annual c
rops
Agrofo
rest
ry/P
erennial
Cro
ps
Grassl
and
Lives
tock
Input
s
Proje
ct In
vestm
ent
Land use categories
Mt
CO
2e
Source: our calculations using EX-ACT (2010)
4.66 This is essentially the effect of the activities aimed at enhancing the areas of permanent protection: establishment of the Legal Reserves, protection of springs and streams, expansion of agro-forestry systems especially in these areas – as shown in table 4.18 which takes into consideration the mitigation potential by project activity. This set of activities is also responsible for the most relevant change in land use promoted by the project: from grasslands to forest/plantation and, above all, from degraded land to forest/plantation and perennials (fig. 4.4).
Table 4.18: Mitigation potential of the Rio Rural project, by project activity
Project activities Mt % of total GHG
mitigated % of total
GHG emitted
Protection of springs and streams and support to the establishment of the Legal Reserves -0.52 60.6 - Expansion of agro-forestry systems -0.27 31.1 - Improved annual crop management -0.02 2.1 - Improved grassland management -0.02 2.3 - Improved feeding practices of dairy cattle -0.04 4.6 -
Total GHG mitigated -0.86 100.0 -
Support to small agro-industry 0.010 - 94.7 Technical assistance for project implementation 0.001 - 5.3
Total GHG emitted 0.011 - 100.0
Total C-balance -0.85 - - Source: our calculations using EX-ACT (2010)

Estimating mitigation potential of agricultural projects: An application of the EX-Ante Carbon-balance Tool (EX-ACT) in Brazil
61
Figure 4.4: Land use matrix of the Rio Rural project
Without Project Forest/ GrasslandPlantation Annual Perennial Rice Degraded Other Total Initial
INITIAL Forest/Plantation 0 0 0 0 6,2 0 0 6Annual 0 225104 0 0 0 0 0 225104
Cropland Perennial 0 0 0 0 0 0 0 0Rice 0 0 0 0 0 0 0 0
Grassland 0 0 0 0 691 0 0 691Other Land Degraded 0 0 0 0 0 2010 0 2010
Other 0 0 0 0 0 0 0 0
Total Final 0 225104 0 0 697 2010 0 227811
With Project Forest/ GrasslandPlantation Annual Perennial Rice Degraded Other Total Initial
INITIAL Forest/Plantation 6,2 0 0 0 0 0 0 6Annual 0 225104 0 0 0 0 0 225104
Cropland Perennial 0 0 0 0 0 0 0 0Rice 0 0 0 0 0 0 0 0
Grassland 0 0 0 0 691 0 0 691Other Land Degraded 910 0 1100 0 0 0 0 2010
Other 0 0 0 0 0 0 0 0
Total Final 916,2 225104 1100 0 691 0 0 227811
Cropland
Cropland
FINAL
Other Land
FINAL
Other Land
Source: our calculations using EX-ACT (2010)
4.5 Sensitivity analysis
4.5.1 Main parameter sensitivity
4.67 Similarly to what has been done for the SC Rural project (see section 3.5), a sensitivity analysis has been carried out in order to determine how EX-ACT is “sensitive” to changes in the value of the main parameters.
4.68 In the model, average climate is considered as tropical with a moisture regime classified as moist, which correspond to average temperature and rainfall for the State. Parameter sensitivity has been tested by introducing extreme values instead of average ones for the moisture regime (dry and wet instead of moist). Also the soil characteristics have been changed considering High Activity Clay (HAC) soils – which are present in the project area – instead of Low Activity Clay (LAC) soils. The results (table 4.19) show that a change in moisture regime from moist to dry will cause a decrease in the total mitigation potential of the project: this is reasonable as a drier climate is expected to lower the biomass growth, above and below ground. On the contrary, a change in moisture regime from moist to wet will increase total mitigation potential as a consequence of the accelerated biomass growth caused by increased water availability in the root zone. A change in soil characteristics (from LAC to HAC) will also increase the sequestration potential, because of the higher C stocks and overall soil fertility. The change in the final balance
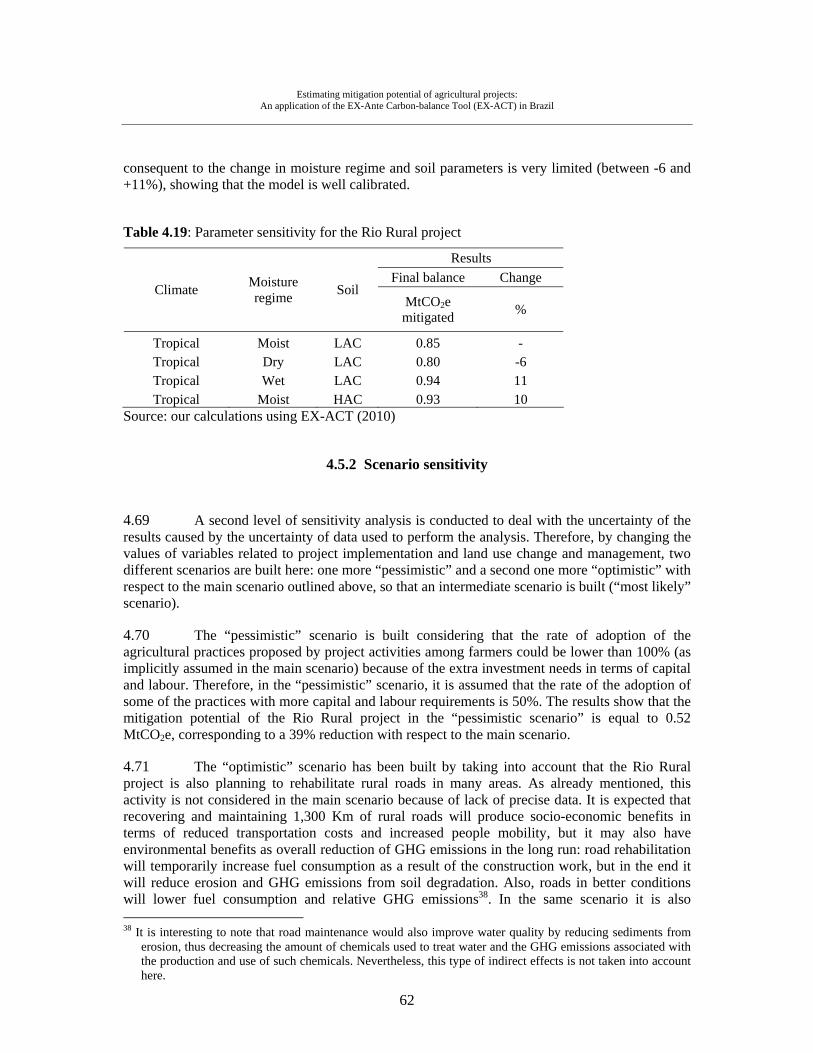
Estimating mitigation potential of agricultural projects: An application of the EX-Ante Carbon-balance Tool (EX-ACT) in Brazil
62
consequent to the change in moisture regime and soil parameters is very limited (between -6 and +11%), showing that the model is well calibrated.
Table 4.19: Parameter sensitivity for the Rio Rural project
Results
Final balance Change Climate
Moisture regime
Soil MtCO2e mitigated
%
Tropical Moist LAC 0.85 - Tropical Dry LAC 0.80 -6 Tropical Wet LAC 0.94 11 Tropical Moist HAC 0.93 10
Source: our calculations using EX-ACT (2010)
4.5.2 Scenario sensitivity
4.69 A second level of sensitivity analysis is conducted to deal with the uncertainty of the results caused by the uncertainty of data used to perform the analysis. Therefore, by changing the values of variables related to project implementation and land use change and management, two different scenarios are built here: one more “pessimistic” and a second one more “optimistic” with respect to the main scenario outlined above, so that an intermediate scenario is built (“most likely” scenario).
4.70 The “pessimistic” scenario is built considering that the rate of adoption of the agricultural practices proposed by project activities among farmers could be lower than 100% (as implicitly assumed in the main scenario) because of the extra investment needs in terms of capital and labour. Therefore, in the “pessimistic” scenario, it is assumed that the rate of the adoption of some of the practices with more capital and labour requirements is 50%. The results show that the mitigation potential of the Rio Rural project in the “pessimistic scenario” is equal to 0.52 MtCO2e, corresponding to a 39% reduction with respect to the main scenario.
4.71 The “optimistic” scenario has been built by taking into account that the Rio Rural project is also planning to rehabilitate rural roads in many areas. As already mentioned, this activity is not considered in the main scenario because of lack of precise data. It is expected that recovering and maintaining 1,300 Km of rural roads will produce socio-economic benefits in terms of reduced transportation costs and increased people mobility, but it may also have environmental benefits as overall reduction of GHG emissions in the long run: road rehabilitation will temporarily increase fuel consumption as a result of the construction work, but in the end it will reduce erosion and GHG emissions from soil degradation. Also, roads in better conditions will lower fuel consumption and relative GHG emissions38. In the same scenario it is also 38 It is interesting to note that road maintenance would also improve water quality by reducing sediments from
erosion, thus decreasing the amount of chemicals used to treat water and the GHG emissions associated with the production and use of such chemicals. Nevertheless, this type of indirect effects is not taken into account here.

Estimating mitigation potential of agricultural projects: An application of the EX-Ante Carbon-balance Tool (EX-ACT) in Brazil
63
assumed that the expansion of the improved feeding practices in livestock production will be higher than expected (50% of heads with practices instead of 20% as hypothesised in the main scenario), therefore the additional technical mitigation of this activity will be higher. The results show that the mitigation potential of the Rio Rural project in the “optimistic scenario” is equal to 1.02 MtCO2e, corresponding to a 20% increase with respect to the main scenario.
It is therefore estimated that the Rio Rural project will “most likely” be able to mitigate 0.77 MtCO2e, computed as the average of the “optimistic” and “pessimistic” scenarios (figure 4.5). It is interesting to note that this value is close to what has been estimated in the main scenario (0.85 MtCO2e), showing the robustness of the results outlined above.
Figure 4.5: Scenario sensitivity analysis for the Rio Rural project
1.02
0.770.85
0.52
0
0.2
0.4
0.6
0.8
1
1.2
Pessimistic Optimistic Most likely Main
Scenarios
Pro
jec
t m
itig
ati
on
po
ten
tia
l (M
tCO
2e)
Source: our calculations using EX-ACT (2010)
4.6 Economic analysis
4.72 The average mitigation potential of the project is equal to 0.19 tCO2e/ha per year. It could be valued using a price of 3 US$/tCO2e, which is the average C price for agricultural soil C at retail level on the voluntary C market in 2008 (Hamilton et al. 2009). Therefore, the value of the average mitigation potential of the project amounts to 0.57 US$/tCO2e (per hectare and per year). Since this value is well below the level of transaction cost for public implementation (4 US$/tCO2e – see section 2.4), the project can be classified as type 1 (Agriculture Development) without any feasible option of being financed on the C sector (see figure 2.4).
4.73 However, it should be highlighted that these environmental benefits could be eventually included into Payments for Ecosystem Services (PES) bundled schemes, together with watershed protection and biodiversity conservation benefits, for a public (or mixed public-private) financed initiative.

Estimating mitigation potential of agricultural projects: An application of the EX-Ante Carbon-balance Tool (EX-ACT) in Brazil
64
5. COMPARATIVE ANALYSIS
5.1 Synergies among the two projects
5.1.1 Objectives
5.2 Both project aim to increase small-scale farming productivity and rural competitiveness while adopting integrated and sustainable farming systems approaches while improving the management and conservation of natural resources.
5.1.2 Ecoregions, land use and land use change
5.3 The two project areas are located in same biome, the Atlantic Forest, which is considered one of the five biodiversity "hottest hotspots" among the world’s twenty-five top priority conservation areas, in view of its exceptional level of species endemism and degree of threat39 (Myers et al. 2000). The States of Santa Catarina (SoSC) and Rio de Janeiro (SoRJ) hold the highest percentages of Atlantic Forest with respect to total area among the seventeen Brazilian states located in this biome: 23% (or 2.2 million ha) of native Atlantic Forest remnants in the SoSC and 20% (or 0.86 million ha) in the SoRJ (INPE 2009). Hence, both states are characterized by a rich natural resource base. In the case of Santa Catarina, livestock, agriculture and forestry represent 31%, 16% and 7% of the state’s total land use, respectively. In the case of Rio de Janeiro, livestock, agriculture and forestry represent 56%, 15% and 29% of the of the total land use in the project area, respectively (CIDE 2010).
5.4 Past agricultural policies over the decades have led to the loss of the original vegetation cover in both states and unmanaged occupation of land has resulted in millions of hectares of impoverished soils.
5.5 The projects’ target areas produce the majority of the agricultural goods in the state and share a few agricultural outputs such as the sugar cane, cereals, vegetables and milk. These areas also have the state’s largest concentration of family farms whose main occupation and source of income is agriculture. The main agricultural outputs generated in the SoRJ’ project area include coffee, sugarcane, cereals (mainly maize), vegetables, milk and tropical fruits (orange, papaya, pineapple). In the case of Santa Catarina, they include: chicken, swine, cereals (mainly maize), soybeans, tobacco, wood from plantations (mainly for cellulose and furniture), beef, rice and tropical and sub-tropical fruits (apple, banana, peach, and orange).
5.6 The two projects envision agricultural intensification and increased yield productivity and reduction on pressure over the native Atlantic Forest. It is expected that this would give project beneficiaries (small farmers) a market advantage among national and international 39 The Atlantic Forest contains 20,000 plant species (of which 8,000 are endemic) and 1,351 vertebrate species:
of the original extent (1.3 million km2), covering (part or totally) seventeen Brazilian states, only around 8% remains nowadays.

Estimating mitigation potential of agricultural projects: An application of the EX-Ante Carbon-balance Tool (EX-ACT) in Brazil
65
purchases who are increasingly seeking to avoid products associated with tropical forest destruction.
5.1.3 Projects’ operational and technical strategy
5.7 Projects’ operational strategy and technical approaches to be adopted in priority areas/regions of the state are also similar:
both projects will promote interventions to increase the organization and capacity of small farmers in the areas of production technologies, marketing, organizational management and other areas critical to competitiveness. This would be supported through: i) training and assistance delivered by the state extension agency or by other qualified private service providers contracted by the project and/or by beneficiaries; and ii) strengthening the existing institutional and policy framework, in particular the state agencies’ capacity to advise small farmers and to support compliance with national legislation;
based on the above, the project will finance different categories of investment proposals (small business investments and rural infrastructure) and coordinate agricultural-related programs, the latter to increase the state’s efficiency in mainstreaming public policies in support of sustainable rural development;
lastly, the project will help start-up (in Santa Catarina) and extend (in Rio de Janeiro) the application of schemes for payments for environmental services to agricultural areas, thus providing a new source of income for small farmers who adopt agricultural, natural resources management and conservation practices that generate off-site environmental benefits (water quality, CC mitigation, biodiversity) while increasing their competitiveness.
5.8 In order to implement the above-mentioned strategy, the projects will adopt a technical planning approach to improve municipal and regional dialogue and management to unleash the agricultural production potential and competitiveness in priority areas/regions of the state while promoting sustainable practices and improving the socioeconomic conditions of family agriculture communities. This approach is based on comprehensive diagnostic and planning and negotiation exercises across different levels (i.e. local/micro catchments, municipal, and regional) with a wider scope beyond project activities.
5.9 Project activities to be directly supported by the project would stem from priorities established under this planning process and would focus on demand-driven investments to support:
small farmers’ business initiatives, submitted by producers’ organizations, aimed at increasing their competitiveness for products with demonstrated market viability. Eligible investment proposals will have to demonstrate market viability, and preference will be given to initiatives using improved land and water management techniques (restoring soil fertility, reducing soi and water pollution) while and focusing on wider aspects of environmental protection;
Estimating mitigation potential of agricultural projects: An application of the EX-Ante Carbon-balance Tool (EX-ACT) in Brazil
66
maintenance and rehabilitation of unpaved rural roads, under the responsibility of municipalities, and other rural investments identified in local and regional development plans when they complement investments undertaken by small farmers’ organizations (e.g. increase of supply of energy and water to enhance production systems or, in the case of Santa Catarina, establishing an enabling environment to promote rural tourism).
5.10 Because decentralization of planning and decision-making responsibilities is fundamental to the success of this approach, both projects will build on (and expand to the regional level) the strategy developed and implemented by two previous operations – a GEF/World Bank pilot project in Rio (under its fourth year of implementation) and a World Bank loan in Santa Catarina (implemented from 2002 to 2009), which were characterized by a participatory municipal and local/microcatchment-level planning model, promoting full involvement and empowerment of community-based and other local organizations while improving natural resources management. The two projects will also promote complementary strategies focused on increasing productivity, value added, and wider market access for small farmers, as well as on strengthening institutional capacity and networking to more effectively and efficiently respond to the arising, better articulated, and integrated demands at the local and regional levels.
5.1.4 Positive externalities and mitigation potential by project activity
5.11 Both projects are able to generate positive externalities as a result of the implementation of project activities: climate change mitigation, biodiversity conservation, watershed protection. Such environmental services could be conveniently valued and being considered in either public or private-funded PES initiatives. Also, in both projects, activities with highest mitigation potential are those aimed at: protecting water sources (protection of springs and streams, fencing of riparian areas); conserving forest resources and biodiversity (establishment of the Legal Reserves, creation of ecological corridors); improving grassland management; and expanding agro-forestry systems.
5.2 Differences between the two projects
5.2.1 Contribution of the projects to the state economy
5.12 Although the agricultural sector is important to the SoRJ economy, it contributes to a very small proportion of state GDP (0.5%). Outside of the metropolitan area of the city of Rio de Janeiro, agriculture’s contribution to GDP rises to nearly 5%, and when included with agro-industrial activities, agriculture represents over 25% of state GDP. The importance of agriculture is further demonstrated in terms of rural employment (it accounts for over 40% and includes an estimated 157,492 individuals) and land use (more than 60% of total state area is dedicated to agricultural activities). Santa Catarina’s agricultural sector (and the project area) plays a higher

Estimating mitigation potential of agricultural projects: An application of the EX-Ante Carbon-balance Tool (EX-ACT) in Brazil
67
role in the state’s political economy: it accounts for 7% of State GDP. Despite being a relatively small proportion (7%), when considered along with agro-industry, the sector generates nearly 60% of SoSC’s exports and employs 40% of the labour force. One-half of the state’s agricultural output is livestock-based, with another 41% accounted for by perennial crops, with forestry accounting for the remaining 9%. Agricultural exports consist mainly of meat (e.g. poultry and swine) and wood (e.g. furniture and cellulose).
5.2.2 Project area
Total landscape area covered by the SC Rural project has been estimated as 3.6 million hectares (productive and non-productive lands, equivalent to total area of about 930 micro-catchments). Productive landscape directly covered/targeted by the project is estimated as 200,000 ha. It is also estimated that the total land receiving support for improved agricultural systems and natural resources conservation and management amounts would total 661,000 hectares.
In Rio de Janeiro, a much smaller geographical area is covered by the Rio Rural project: the total landscape area has been estimated as 800,000 hectares (productive and non-productive lands, equivalent to total area of about 270 micro-catchments). An estimated 227,811 hectares of agricultural lands would receive support to implement improved production systems.
5.2.3 Biodiversity conservation and management approaches
5.13 Despite the fact that both projects will support similar on-the-ground investments to establish or improve biodiversity conservation-friendly land use mosaics on private lands – hence supporting corridor connectivity in project watersheds – the planning and policy approaches adopted by the two states are different, as shown in what follows:
The SC rural project proposes to formally implement two recently-created Ecological Corridors – Timbó and Chapecó Watersheds. This would involve two main lines of action:
(a) incentives (grants and technical assistance) obtained through the project Rural Investment Fund/Component 1, to promote corridor connectivity through the adoption of biodiversity conservation-friendly practices (rehabilitation of riparian zones, agro-forestry, organic farming); and
(b) establishment of two incentive mechanisms to promote PES, environmental compliance and improved productive systems:
a system to promote the commercialization of “Conservation Credits” associated with the valorisation of environmental assets (preserved forests), mainly focused on farmers who need to comply with the forest law which requires the preservation of 20% of their farmland area either on-farm or off-farm, by establishing a Legal Reserve;

Estimating mitigation potential of agricultural projects: An application of the EX-Ante Carbon-balance Tool (EX-ACT) in Brazil
68
an Integrated Agro-Ecological System (SIN - Sistema de Integração Ecológico-Econômica)” by strengthening existing and new local productive arrangements with a focus on their productive and marketing features as related to improved natural resources management. It will support activities in about eight existing value chains, including organic products, milk, meat, grains, agro-forestry, forestry, and rural tourism; the implementation of SINs will be done through technical assistance, capacity building, financial incentives (including - but not exclusively – above mentioned grants obtained through the project Rural Investment Fund/Component 1).
5.14 The Rio Rural project will expand some initial efforts (tested under a pilot GEF project) to implement corridor connectivity in project watersheds, and will not focus on specific large ecological corridors, except for some activities in the buffer zone of the large/interstate Serra do Mar Corridor. It includes incentives (grants and technical assistance) obtained through the project investment Component 1, to promote corridor connectivity through the adoption of biodiversity productive and non-productive conservation-friendly practices (rehabilitation of riparian zones, agro-forestry, organic farming). It will also promote the conservation and connection of forest remnants in the buffer zones of existing public protected areas, through provision of technical and financial assistance.
Under Component 2, project activities will improve medium to long-term policy and institutional frameworks supporting small farmers’ engagement in biodiversity conservation, water production and CC mitigation through the development of an Economic Sustainability System (ESS). The objectives of the ESS are to: promote awareness of (and access to) the existing supply of public and private financial support resources by small-farmers (i.e. resources from water charge, biodiversity conservation funds, C market); promote a better flow of this supply of financial resources in support of small-farmers activities; and facilitate the exchange of information between the parties involved to gradually induce a shift towards more receptive financial support arrangements for small-farming demands. By doing so, this subcomponent will promote sustained support to sustainable rural development activities beyond the life of the project.
5.2.4 Project mitigation potential
5.15 The two projects have a different mitigation potential. The SC Rural project has a large mitigation potential (12.2 Mt CO2e) if compared to the Rio Rural project one (0.85 Mt CO2e). This is of course the effect of the different project size (661,000 ha the SC Rural project, 227,811 ha the Rio Rural project), but also of the different unitary mitigation potential of the projects: 0.92 tCO2e/ha per year in the SC Rural project, higher than the corresponding value for the Rio Rural project (0.19 tCO2e/ha per year). This is in line with the type of intervention financed by the projects and the corresponding changes in land use: the Rio Rural concerns more about management of productive systems, while the SC Rural has a wider spectrum of actions with a relatively larger weight of activities aimed at conserving forests, rehabilitating degraded land and expanding agro-forestry systems.

Estimating mitigation potential of agricultural projects: An application of the EX-Ante Carbon-balance Tool (EX-ACT) in Brazil
69
6. CONCLUSIONS
6.1 Agriculture is an important source of GHG emissions representing 14% of the global total. Sustainable land management practices can considerably increase food security and reduce rural poverty, while contributing to mitigate climate change, both reducing GHG emissions or enhancing Carbon sinks. Mitigation potential is high and most of this potential can be realized in developing countries. In this frame, Brazil has developed a series of mitigation strategies for agriculture and livestock, and the most relevant sectors, both in terms of emissions as well as abatement opportunities, are those related to land use (forest conservation, improved cropland and grassland management, expansion of agro-forestry systems).
6.2 Models are being developed to estimate the mitigation relevance of changes in agricultural production systems: EX-ACT can provide an ex-ante evaluation of the impact of rural development projects on GHG emissions and C sequestration, thus estimating the mitigation potential of the project. The report has presented and discussed the results of EX-ACT tests on Santa Catarina Rural Competitiveness (SC Rural) and Rio de Janeiro Sustainable Rural Development (Rio Rural) projects in Brazil. These results are estimates at Tier 1 level of analysis and further work is needed to verify mitigation potential for financing.
6.3 EX-ACT estimated that the SC Rural project will be able to mitigate 12.2 MtCO2e through the implementation of the activities aimed at increasing the competitiveness of rural family agriculture producer organizations, i.e. expansion of training and extension services, diversification and enhancement of production systems, support to the implementation of small-scale agro-industry, land rehabilitation and forest conservation, creation of ecological corridors and expansion of agro-forestry systems.
6.4 Similarly, the Rio Rural project can mitigate 0.85 MtCO2e while increasing small-scale farming productivity and competitiveness essentially through the adoption of integrated and sustainable farming systems approaches (e.g. protection of springs and streams, support to the establishment of Legal Reserves, expansion of agro-forestry systems, improved annual crop and grassland management, improved cattle feeding practices, support to small agro-industry and sustainable use of agro-chemicals).
6.5 Both projects are therefore successful at implementing activities aimed at reducing rural poverty (and increase food security) while contributing to climate change mitigation, demonstrating the effectiveness of sustainable agriculture on producing environmental services (Carbon sequestration in this case). Both projects are classified as type 1 (Agriculture Development) projects given that they are characterised by a low mitigation potential with however, a positive externality of project activities.
6.6 Nevertheless, the Rio Rural project is characterised by an average mitigation potential of 0.19 tCO2e/ha per year while the SC Rural can mitigate 0.92 tCO2e/ha per year. This is in line with the type of intervention financed by the projects and the corresponding changes in land use: the Rio Rural is concerned more with management of productive

Estimating mitigation potential of agricultural projects: An application of the EX-Ante Carbon-balance Tool (EX-ACT) in Brazil
70
systems, while the SC Rural has a wider spectrum of actions with relatively more weight on activities aimed at conserving forests, rehabilitating degraded land and expanding agro-forestry systems. The design of the SC Rural project could therefore be slightly changed to increase the mitigation potential of the project and transform it into type 2 project which are more likely to be viable for public C financing.
6.7 EX-ACT could therefore be used also as a guidance tool during the project design process – assisting project developers to refine project components so to increase the environmental benefits of the project itself – and to provide a basis to enter a C financing logic by highlighting the most C intensive practices in the project which could be extended either during the project implementation phase or in future loans.
6.8 This process could be applied to the Rio Rural project in order to increase its overall mitigation potential. The results indicate that the potential mitigation benefits of the Rio Rural project may be viable for a public funded PES initiative, possibly together with other positive externalities of the project (e.g. biodiversity conservation, watershed protection). Nevertheless, the project could expand support to implement Legal Reserves and Areas of Permanent Preservation – which are in fact among the activities which contribute most to determine the mitigation potential of the SC Rural project. For historical reasons, most agricultural properties in the State of Rio de Janeiro, as in most regions across the country, are currently not complying with the legislation40 which requires maintaining forest cover in sensitive areas (riversides, high slopes) as well as in 20% of agricultural properties’ total area.
6.9 This extended support to forest conservation and land rehabilitation would be a combination of efforts from activities undertaken in both components 1 (technical assistance and financial incentives to farmers who do not comply with the legal requirements) and 2 (through a long-term financing mechanism for sustainable rural development activities). The project would help address this situation in a pragmatic manner, promoting a gradual process towards a higher level of compliance through the implementation of economically feasible measures:
(i) Component 1 (areas already considered in current EX-ACT analysis), by requiring sub-project beneficiaries to fully protect existing forests and implement environmentally-sound practices that facilitate forest regeneration in degraded areas (e.g. fencing of riparian areas) through financial incentives, environmental awareness-raising and the production of seeds of native tree species; and
(ii) Component 2 (areas not yet included in EX-ACT analysis), by supporting the creation of a long-term financing mechanism for sustainable rural development activities, including up scaling the establishment of Legal Reserves to a larger number of farmers. In fact, national legislation foresees that in less than two years all farmers should be complying with the legal requirements and many small farmers will be asked to enrol in the national program aimed specifically at assisting small farmers to comply with this legislation (Mais Ambiente - Decree 7029/09). The Rio Rural project would therefore help farmers to enrol in this national program through rural extension and new financing mechanism for sustainable rural development activities.
40 The already mentioned federal legislation on Areas de Preservação Permanente and Reserva Legal
(addendum 2166-67 to Federal Law 4771/65, CONAMA Resolution 369/06, Decree 6514/08 e and other related Normative Instructions issued in 2009).

Estimating mitigation potential of agricultural projects: An application of the EX-Ante Carbon-balance Tool (EX-ACT) in Brazil
71
6.11 Both projects could also benefit from using EX-ACT in the future by applying it at local/micro catchments level, where a more detailed data set will be likely available as a result of the comprehensive diagnostic and planning approach adopted. Also, since EX-ACT is a specific tool aimed at estimating the mitigation potential of project activities, it could be used together with other tools or methodologies adopted to assess environmental services linked to agricultural production and farming systems development.

Estimating mitigation potential of agricultural projects: An application of the EX-Ante Carbon-balance Tool (EX-ACT) in Brazil
72
7. REFERENCES
Agence de l'Environnement et de la Maîtrise de l'Energie (ADEME), Bilan Carbone, http://www2.ademe.fr/servlet/KBaseShow?sort=-1&cid=96&m=3&catid=15730
Bernoux M., Branca G., Carro A., Lipper L., Smith G., Bockel L., Ex-ante greenhouse gas balance of agriculture and forestry development programs, Scientia Agricola, Piracicaba Brazil, vol. 67, n.1, p.31-40, January/February, 2010a.
Bernoux M., Bockel L., Branca G., Ex-ante Carbon-balance Tool (EX-ACT) Technical Guidelines, Easypol, FAO, Rome: 2010b.
Bolin B., Sukumar R., Global perspective. In: Land use, land-use change and forestry (eds. Watson RT, Noble IR, Bolin B., Ravindranath NH, Verardo DJ, Dokken DJ), pp. 23-51, Cambridge University Press, Cambridge, UK, 2000.
Branca G., Lipper L., Bockel L., Potential use of the EX-Ante C-balance Tool (EX-ACT) in the economic and financial analysis of agriculture and mitigation projects. Working paper. FAO. Rome. 2010.
Cacho O.J., Marshall, G.R. and Milne, M. Transaction and abatement costs of carbon-sink projects in developing countries, Environment and Development Economics 10(5): 1-18. 2005.
Cacho O.J., Lipper L., Abatement and transaction costs of carbon-sink project involving smallholders. Working paper. FAO. Rome. 2006.
Centre for Social Policy, Rio de Janeiro End of Hunger Map, Getulio Vargas Foundation, 2004.
Cerri, C.C., Maia, S.M.F, Galdos, M.V., Cerri, C.E.P., Feigh, B.J. and Bernoux, M. Brazilian Greenhouse Gas Emissions: The importance of agriculture and livestock. Scientia Agricola. (Piracicaba, Brazil), v.66, n.6, p.831-843, November/December 2009
CIDE (Centro de Informações e Dados do Rio de Janeiro), www.cide.rj.gov.br, March 2010.
Dias de Oliveira M.E., Vaughan B.E., Rykiel Jr. E.J., Ethanol as Fuel: Energy, Carbon Dioxide Balances, and Ecological Footprint, BioScience, vol. 55 no. 7, July 2005.
EX-ACT, EX-Ante Carbon-balance Tool, version beta 1.1, FAO, Rome, 2010.
FAO, The State of Food and Agriculture. Paying Farmers for Environmental Services. Rome, 2007.
FAO, Food Security and Agricultural Mitigation in Developing Countries: Options for Capturing Synergies. Rome, November 2009.
FAO. Making the Step From Carbon to Cash – A Systematic Approach to Accessing Carbon Finance in the Forest Sector. Forest and Climate Change Working Paper no. x. [in press], 2010.
Guo L.B., Gifford R.M., Soil Carbon stock and land use change: a meta analysis, Global Change Biology, 8, 345-360, 2002.
Hamilton, K., Sjardin, M., Shapiro, A. and Marcello, T., Fortifying the Foundation: State and trends of the Voluntary market 2009. A Report by The Ecosystem Marketplace (Washington, DC, USA) and New Carbon Finance (New York), May 2009.
Estimating mitigation potential of agricultural projects: An application of the EX-Ante Carbon-balance Tool (EX-ACT) in Brazil
73
IBGE, Estimated Population Count 2007, Brazilian Institute of Geography and Statistics (IBGE), 2007.
IBGE, Agricultural Census 2006, Brazilian Institute of Geography and Statistics (IBGE), 2006.
INPE (Fundação SOS Mata Atlantica-Instituto Nacional de Pesquisas Espaciais), Atlas dos Remanecesntes Florestais da Mata Atlantica Período 2005-2008. Relatorio Parcial. 2009
IPCC, 2006 IPCC Guidelines for National Greenhouse Gas Inventories, H. Eggleston, Buendia L, Miwa K, Ngara T, Tanabe K, Editor. 2006, The National Greenhouse Gas Inventories Programme, Intergovernmental Panel on Climate Change.
IPCC, Agriculture, in Climate Change 2007: Mitigation. 2007, Contribution of Working Group III to the Fourth Assessment Report of the Intergovernmental Panel on Climate Change.
Lal R., Carbon emissions from farm operations. Environment International. 30: p. 981- 990. 2004.
Lal R., Soil erosion and carbon dynamics, Soil and Tillage Research, Volume 81, Issue 2, April 2005.
Lipper L., Dutilly-Diane C., McCarthy N., Supplying Carbon Sequestration From West African Rangelands: Opportunities and Barriers, Rangeland Ecology and Management 63(1) January 2010.
Macedo I., Seabra J., Silva J., Green house gases emissions in the production and use of ethanol from sugarcane in Brazil: The 2005/2006 averages and a prediction for 2020, Biomass and Bioenergy, Volume 32, Issue 7, Pages 582-595, July 2008.
Malhi, Y., Baldocchi DD., Jarvis PG, The Carbon balance of tropical, temperate and boreal forests. Plant, Cell and Environment, 22, 715-740, 1999.
Mc Kinsey&Company. Pathway to a low carbon economy for Brazil – Mc Kinsey&Company report, 2009.
Mooney S., Brown S., Shoch D., Measurement and monitoring costs: influence of parcel contiguity, carbon variability, project size and timing of measurement events. Report to The Nature Conservancy Conservation Partnership Agreement. Winrock international. January 2004.
Myers N., Mittermeier R.A., da Fonseca G., Kent J., Biodiversity hotspots for conservation priorities. Nature 403, 853-858, February 2000.
Searchinger T., Heimlich R., Houghton R.A., Dong F., Elobeid A., Fabiosa J., Tokgoz S., Hayes D., Yu T.H.,Use of U.S. Croplands for Biofuels Increases Greenhouse Gases Through Emissions from Land-Use Change, Science Express report, February 2008.
Smith, P.; Martino, D.; Cai, Z.; Gwary, D.; Janzen, H.H.; Kumar, P.; Mccarl, B.; Ogle, S.; O’mara, F.; Rice, C., Scholes, R.J.; Sirotenko, O. 2007. Agriculture. Chapter 8. In Climate Change 2007: Mitigation. Contribution of Working Group III to the Fourth Assessment Report of the Intergovernmental Panel on Climate Change, (B. Metz, O.R. Davidson, P.R. Bosch, R. Dave, .A. Meyer, Eds), Cambridge University Press, Cambridge, United Kingdom and New York, NY, USA.
UNFCCC. United Nations Framework Convention on Climate Change. Challenges and opportunities for mitigation in the agricultural sector. Technical paper FCCC/TP/2008/8 21 November 2008
VCS (Voluntary Carbon Standard). Guidance for AFOLU projects, VCS, Washington, DC Nov 2007.

Estimating mitigation potential of agricultural projects: An application of the EX-Ante Carbon-balance Tool (EX-ACT) in Brazil
74
Woomer P.L., Touré A., Sall M., Carbon stocks in Senegal’s Sahel transition zone. Journal of Arid Environment 59:499–510, 2004.
World Bank, The Rio de Janeiro Sustainable Rural Development Project, Project Appraisal Document, 2009.
World Bank. State of the carbon markets 2008. World Bank, Washington, DC, May 2008
World Bank. State of the carbon markets 2007. World Bank, Washington, DC, May 2007

Estimating mitigation potential of agricultural projects: An application of the EX-Ante Carbon-balance Tool (EX-ACT) in Brazil
75
ANNEXES
Annex 1 Map of the State of Santa Catarina (Brazil)
Source: World Bank/IRDB courtesy

Estimating mitigation potential of agricultural projects: An application of the EX-Ante Carbon-balance Tool (EX-ACT) in Brazil
76
Annex 2 Map of the ecological corridors supported under the SC Rural project
Source: World Bank/IRDB courtesy

Estimating mitigation potential of agricultural projects: An application of the EX-Ante Carbon-balance Tool (EX-ACT) in Brazil
77
Annex 3 Map of the Rio Rural project area
Source: World Bank, The Rio de Janeiro Sustainable Rural Development Project, Project Appraisal Document, 2009 (WB Infoshop)

Estimating mitigation potential of agricultural projects: An application of the EX-Ante Carbon-balance Tool (EX-ACT) in Brazil
78
Annex 4 EX-ACT tables of the SC Rural project
Ex-Ante Analysis of Deforestation
Type of Default forest/plantation proposed within the Combustion Dynamic Factorsspecified Climatic zone Litter Dead Wood Soil C % released CH4 N2O (linked with duration of the project)
Ecological Zone Go to Map tonnes dm t C tonnes dm t C t C tC tC of prefire dm g.kg DM burnt BiomassForest1 Subtropical humid forest 220 103,4 52,8 24,8 17,5 0 63 0,36 4,7 0,26 and FireForest2 Subtropical dry forest 210 98,7 58,8 27,6 17,5 0 63 0,36 4,7 0,26 Immediate 1Forest3 Subtropical steppe 80 37,6 25,6 12,0 17,5 0 63 0,74 4,7 0,26 Exponential 0,78Forest4 Subtropical mountains systems 145 68,15 39,2 18,4 17,5 0 63 0,36 4,7 0,26 Linear 0,5Plantation1 Subtropical humid forest 140 65,8 33,6 15,8 17,5 0 63 0,36 4,7 0,26Plantation2 Subtropical dry forest 60 28,2 16,8 7,9 17,5 0 63 0,36 4,7 0,26Plantation3 Subtropical steppe 30 14,1 9,6 4,5 17,5 0 63 0,74 4,7 0,26Plantation4 Subtropical mountains systems 90 42,3 24,3 11,4 17,5 0 63 0,36 4,7 0,26
If you have your own data fill the information -> Specific Vegetation 1 0 0 0 0 0 0 0 0,36 4,7 0,26Specific Vegetation 2 0 0 0 0 0 0 0 0,36 4,7 0,26Specific Vegetation 3 0 0 0 0 0 0 0 0,36 4,7 0,26Specific Vegetation 4 0 0 0 0 0 0 0 0,36 4,7 0,26
Conversion details (Harvest wood product exported before the conversion, use of fire, final use after conversion) Looses (positive value) and gain (negative value) per haVegetation Type Final Use after Biomass Biomass Soil CH4 N2O Total
Name tonne t C exported yes/no % released deforestation 1 yr after t C t CO2 ksoil Delta C tCO2/yr kg kg tCO2 eq
Defor.1 100 47 NO 0 6,3 98,7 362,0 1,00 0,0 0,0 0,0 0,0 0,0Defor.2 0 0 0 0,0 0,0 0,0 0,00 0,0 0,0 0,0 0,0 0,0Defor.3 0 0 0 0,0 0,0 0,0 0,00 0,0 0,0 0,0 0,0 0,0Defor.4 0 0 0 0,0 0,0 0,0 0,00 0,0 0,0 0,0 0,0 0,0Defor.5 0 0 0 0,0 0,0 0,0 0,00 0,0 0,0 0,0 0,0 0,0Defor.6 0 0 0 0,0 0,0 0,0 0,00 0,0 0,0 0,0 0,0 0,0Defor.7 Specific Vegetation 1 0 0 NO 0 0,0 0,00 0,0 0,00 0,0 0,0 0,0 0,0 0,0Defor.8 Specific Vegetation 2 0 0 NO 0 0,0 0,00 0,0 0,00 0,0 0,0 0,0 0,0 0,0Defor.9 Specific Vegetation 3 0 0 NO 0 0,0 0,00 0,0 0,00 0,0 0,0 0,0 0,0 0,0Defor.10 Specific Vegetation 4 0 0 NO 0 0,0 0,00 0,0 0,00 0,0 0,0 0,0 0,0 0,0
GHG emissionsVegetation Ty Area deforested (ha) Biomass gain (1yr after) Soil Fire Total Balance Difference
Start Without Project With Project Without With Without With Without With Without With Without With Without Witht0 End Rate End Rate tCO2 tCO2 tCO2 tCO2 tCO2 tCO2 tCO2 tCO2 tCO2 tCO2 tCO2
Defor.1 78126 76316 Linear 77193 Linear 1810 933 655145 337707 -42110 -21706 0 0 0 0 613036 316001 -297034Defor.2 0 0 Linear 0 Linear 0 0 0 0 0 0 0 0 0 0 0 0 0Defor.3 0 0 Linear 0 Linear 0 0 0 0 0 0 0 0 0 0 0 0 0Defor.4 0 0 Linear 0 Linear 0 0 0 0 0 0 0 0 0 0 0 0 0Defor.5 0 0 Linear 0 Linear 0 0 0 0 0 0 0 0 0 0 0 0 0Defor.6 0 0 Linear 0 Linear 0 0 0 0 0 0 0 0 0 0 0 0 0Defor.7 0 0 Linear 0 Linear 0 0 0 0 0 0 0 0 0 0 0 0 0Defor.8 0 0 Linear 0 Linear 0 0 0 0 0 0 0 0 0 0 0 0 0Defor.9 0 0 Linear 0 Linear 0 0 0 0 0 0 0 0 0 0 0 0 0Defor.10 0 0 Linear 0 Linear 0 0 0 0 0 0 0 0 0 0 0 0 0
Deforestation Total 613036 316001 -297034
Back to Description
Select Use after deforestationSelect Use after deforestation
Forested Area (ha)
Please specify the vegetation
Select Use after deforestationSelect Use after deforestation
Fire use
Suggested Default Values per hectare (/ha)Below-Ground Biomass
Natural Forest
Plantation
HWP before
Please specify the vegetation
Please specify the vegetation
Forest1Please specify the vegetationPlease specify the vegetation
Above-Ground Biomass
Biomass loss
Select Use after deforestationSelect Use after deforestationSelect Use after deforestation
Select Use after deforestation
GrasslandSelect Use after deforestation

Estimating mitigation potential of agricultural projects: An application of the EX-Ante Carbon-balance Tool (EX-ACT) in Brazil
79
Afforestation and Reforestation Back to DescriptionSuggested Default Values per hectare (/ha)
Type of Default forest/plantation proposed within the Up to 20 year-old After 20 year-old Dynamic Factorsspecified Climatic zone Above-Ground Biomass Growth Below-Ground Biomass grow Above-Ground Biomass GrowBelow-Ground Biomass grow Litter total Dead Wood Soil C (linked with duration of the project)
Ecological Zone Ecol_Zone tonnes dm t C tonnes dm t C tonnes dm t C tonnes dm t C t C tC tC Immediate 1Natural1 Subtropical humid forest 7,00 3,29 1,40 0,66 2,00 0,94 0,40 0,19 17,5 0 63 Exponential 0,78Natural2 Subtropical dry forest 4,00 1,88 2,24 1,05 1,00 0,47 0,56 0,26 17,5 0 63 Linear 0,5Natural3 Subtropical steppe 4,00 1,88 1,28 0,60 1,00 0,47 0,32 0,15 17,5 0 63Natural4 Subtropical mountains systems 3,40 1,60 0,92 0,43 0,90 0,42 0,24 0,11 17,5 0 63Plantation1 Subtropical humid forest 10,00 4,70 2,00 0,94 10,00 4,70 2,00 0,94 17,5 0 63Plantation2 Subtropical dry forest 8,00 3,76 4,48 2,11 8,00 3,76 4,48 2,11 17,5 0 63Plantation3 Subtropical steppe 5,00 2,35 1,60 0,75 5,00 2,35 1,60 0,75 17,5 0 63Plantation4 Subtropical mountains systems 5,00 2,35 1,35 0,63 5,00 2,35 1,35 0,63 17,5 0 63
If you have your own data fill the information Specific Vegetation 1 0,00 0,00 0,00 0,00 0,00 0,00 0,00 0 0 0 0See IPCC 2006 Tables 4.9 and 4.10 for other values Specific Vegetation 2 0,00 0,00 0,00 0,00 0,00 0,00 0,00 0,00 0 0 0
Specific Vegetation 3 0,00 0,00 0,00 0,00 0,00 0,00 0,00 0 0 0 0Specific Vegetation 4 0,00 0,00 0,00 0,00 0,00 0,00 0,00 0 0 0 0
Conversion details (Previous land use, use of fire before afforestation/reforestation,...) GHG emitted during Burning Biomass of forests/plantationVegetation Type Previous use before Burnt befor Default Specific Soil CH4 N2O Total Annual Biomass Growt Litter+dead
Name afforestation/reforestation conversion Biomass Biomass ksoil Delta C tCO2/yr kg kg tCO2 eq <=20yrs >20yr wood
A/R1 NO 1,0 0,33 42,2 7,7 4,60 0,42 0,2 3,9 1,1 17,5A/R2 NO 5,0 0,69 19,5 3,6 13,50 3,50 1,4 3,9 1,1 17,5A/R3 NO 5,4 1,00 0,0 0,0 24,84 2,27 1,2 3,9 1,1 17,5A/R4 NO 0,0 0,00 0,0 0,0 0,00 0,00 0,0 0,0 0,0 0,0A/R5 NO 0,0 0,00 0,0 0,0 0,00 0,00 0,0 0,0 0,0 0,0A/R6 NO 0,0 0,00 0,0 0,0 0,00 0,00 0,0 0,0 0,0 0,0A/R7 Specific Vegetation 1 NO 0,0 0,00 0,0 0,0 0,00 0,00 0,0 0,0 0,0 0A/R8 Specific Vegetation 2 NO 0,0 0,00 0,0 0,0 0,00 0,00 0,0 0,0 0,0 0A/R9 Specific Vegetation 3 NO 0,0 0,00 0,0 0,0 0,00 0,00 0,0 0,0 0,0 0A/R10 Specific Vegetation 4 NO 0,0 0,00 0,0 0,0 0,00 0,00 0,0 0,0 0,0 0
GHG emissionsVegetation Type Biomass Loss Soil Fire Total Balance Difference
Start Without Project With Project Without With Without With Without With Without With Without Witht0 End Rate End Rate tCO2 tCO2 tCO2 tCO2 tCO2 tCO2 tCO2 tCO2 tCO2 tCO2 tCO2
A/R1 0 0 Linear 625 Linear 0 -193912 0 2292 0 -82222 0 0 0 -273842 -273842A/R2 0 0 Linear 1250 Linear 0 -387823 0 22917 0 -76086 0 0 0 -440992 -440992A/R3 0 0 Linear 625 Linear 0 -193912 0 12375 0 0 0 0 0 -181537 -181537A/R4 0 0 Linear 0 Linear 0 0 0 0 0 0 0 0 0 0 0A/R5 0 0 Linear 0 Linear 0 0 0 0 0 0 0 0 0 0 0A/R6 0 0 Linear 0 Linear 0 0 0 0 0 0 0 0 0 0 0A/R7 0 0 Linear 0 Linear 0 0 0 0 0 0 0 0 0 0 0A/R8 0 0 Linear 0 Linear 0 0 0 0 0 0 0 0 0 0 0A/R9 0 0 Linear 0 Linear 0 0 0 0 0 0 0 0 0 0 0A/R10 0 0 Linear 0 Linear 0 0 0 0 0 0 0 0 0 0 0
Deforestation Total 0 -896371 -896371
Please specify the vegetationPlease specify the vegetation
Natural1Natural1Natural1Please specify the vegetation
Select previous useSelect previous useSelect previous useSelect previous use
Biomass GainAfforested or reforested Area (ha)
Natural ForestType
PlantationType
Degraded LandAnnual CropGrasslandSelect previous useSelect previous useSelect previous use

Estimating mitigation potential of agricultural projects: An application of the EX-Ante Carbon-balance Tool (EX-ACT) in Brazil
80
Ex-Ante Analysis of other LUC
Description of LUC Burnt before Default C Stocks (tC/ha) Delta (tCO2) Emitted during Burning Dynamic FactorsName Your Name Initial Land Use Final Land Use Alert conversion Biom. Ini. Biom. Fin. Soil Ini. Soil Fin. Biomass Soil /yr * CH4 (kg) N2O (kg) (linked with duration of the project)LUC-1 37042 ha from natural grasslands to ssp NO 5,4 2,1 63,0 63,0 -12,1 0,0 0,0 0,0 BiomassLUC-2 7538 ha from degraded grasslands to ssp NO 1,0 2,1 20,8 63,0 4,0 7,7 0,0 0,0 and FireLUC-3 18136 ha from grasslands to ssp NO 5,4 2,1 63,0 63,0 -12,1 0,0 0,0 0,0 Immediate 1
LUC-4533 ha from degraded land to saf agroforestry NO 1,0 2,1 20,8 63,0 4,0 7,7 0,0 0,0 Exponential 0,78
LUC-5 8,718 ha from reflorestamento to saf NO 16,8 5,0 63,0 43,5 -43,3 -3,6 0,0 0,0 Linear 0,5
LUC-6 3,033 ha from cultura annual to saf NO 5,0 2,1 43,5 63,0 -10,6 3,6 0,0 0,0
LUC-7Conservation of 210 ha of perennial crops (peach trees) NO 16,8 1,0 63,0 21,7 -57,9 -7,6 0,0 0,0 Default Soil Native (tC/ha) 63
LUC-8Conversion of 1,434 ha of degraded pastures to perennial crop NO 1,0 2,1 20,8 63,0 4,0 7,7 0,0 0,0
LUC-9 Fill initial LU NO 0,0 0,0 0,0 0,0 0,0 0,0 0,0 0,0LUC-10 Fill initial LU NO 0,0 0,0 0,0 0,0 0,0 0,0 0,0 0,0LUC-11 Fill initial LU NO 0,0 0,0 0,0 0,0 0,0 0,0 0,0 0,0LUC-12 Fill initial LU NO 0,0 0,0 0,0 0,0 0,0 0,0 0,0 0,0LUC-13 Fill initial LU NO 0,0 0,0 0,0 0,0 0,0 0,0 0,0 0,0LUC-14 Fill initial LU NO 0,0 0,0 0,0 0,0 0,0 0,0 0,0 0,0LUC-15 Fill initial LU NO 0,0 0,0 0,0 0,0 0,0 0,0 0,0 0,0LUC-16 Fill initial LU NO 0,0 0,0 0,0 0,0 0,0 0,0 0,0 0,0
*Soil effect limited to 20 years
GHG emissionsVegetation Type Area concerned by LUC Soil Change Fire Total Balance Difference
Without Project With Project Without With Without With Without With Without WithArea Rate Area Rate tCO2 tCO2 tCO2 tCO2 tCO2 tCO2 tCO2 tCO2 tCO2
LUC-1 37042 ha from natural grasslands to ssp 0 Linear 37042 Linear 0 448208 0 0 0 0 0 448208 448208LUC-2 7538 ha from degraded grasslands to ssp 0 Linear 7538 Linear 0 -30403 0 -991658 0 0 0 -1022061 -1022061LUC-3 18136 ha from grasslands to ssp 0 Linear 18136 Linear 0 219446 0 0 0 0 0 219446 219446LUC-4 533 ha from degraded land to saf agroforestry 0 Linear 533 Linear 0 -2150 0 -70119 0 0 0 -72268 -72268LUC-5 8,718 ha from reflorestamento to saf 0 Linear 8718 Linear 0 377199 0 530652 0 0 0 907850 907850LUC-6 3,033 ha from cultura annual to saf 0 Linear 3033 Linear 0 32251 0 -184614 0 0 0 -152363 -152363
LUC-7Conservation of 210 ha of perennial crops (peach trees) 210 Linear 0 Linear 12166 0 27008 0 0 0 39174 0 -39174
LUC-8Conversion of 1,434 ha of degraded pastures to perennial crop 0 Linear 1434 Linear 0 -5784 0 -188649 0 0 0 -194433 -194433
LUC-9 0 Linear 0 Linear 0 0 0 0 0 0 0 0 0LUC-10 0 Linear 0 Linear 0 0 0 0 0 0 0 0 0LUC-11 0 Linear 0 Linear 0 0 0 0 0 0 0 0 0LUC-12 0 Linear 0 Linear 0 0 0 0 0 0 0 0 0LUC-13 0 Linear 0 Linear 0 0 0 0 0 0 0 0 0LUC-14 0 Linear 0 Linear 0 0 0 0 0 0 0 0 0LUC-15 0 Linear 0 Linear 0 0 0 0 0 0 0 0 0LUC-16 0 Linear 0 Linear 0 0 0 0 0 0 0 0 0
Other LUC total 39174 134379 95205
Back to Description
Perennial/Tree CropPerennial/Tree CropPerennial/Tree Crop
Perennial/Tree Crop
Annual Crop
Perennial/Tree Crop
Degraded
Select Final Land UseSelect Final Land Use
Perennial/Tree CropSelect Final Land UseSelect Final Land UseSelect Final Land Use
Select Initial Land UseSelect Initial Land UseSelect Initial Land Use
Select Final Land Use
Select Initial Land UseSelect Initial Land UseSelect Initial Land UseSelect Initial Land Use
Select Final Land UseSelect Final Land Use
Grassland
Biomass Change
Degraded LandGrassland
Degraded Land
Perennial/Tree Crop (6-10 yrs)
Annual Crop
Perennial/Tree Crop (6-10 yrs)
Degraded LandSelect Initial Land Use

Estimating mitigation potential of agricultural projects: An application of the EX-Ante Carbon-balance Tool (EX-ACT) in Brazil
81
Ex-ante analysis of agricultural practices
User-defined practices Improved agro- Nutrient NoTillage/residues Water Manure Residue/Biomass Corresponding mean potential Used CH4 N2O CO2eqYour description Name Rate in tC/ha/yr -nomic practicesmanagement management managemen application Burning onnes dm/ha t CO2 /ha/yr Users kg kg t
Reserved system A1 from Deforestation NO ? ? ? ? ? NO 10 0 0 0 0 0 0,00 0 0 0 0,00Reserved system A2 Converted to A/R NO Conventional management No No No No No NO 10 0 0 0 0 0 0,00 0 0 0 0,00Reserved system A3 Annual From OLUC NO No No No No No NO 10 0 0 0 0 0 0,00 0 0 0 0,00Reserved system A4 Converted to OLUC NO No No No No No NO 10 0 0 0 0 0 0,00 0 0 0 0,00Annual System1 Beans SLM NO Yes Yes Yes Yes No NO 10 0,88 0,55 0,7 1,14 0 0,00 1,14 0 0 0,00Annual System2 Beans conventional NO No No No No No NO 10 0 0 0 0 0 0,00 0 0 0 0,00 Combustion Annual System3 Millet SLM NO Yes Yes Yes Yes No NO 10 0,88 0,55 0,7 1,14 0 0,00 1,14 0 0 0,00 % released CH4 N2OAnnual System4 Millet conventional NO No No No No No NO 10 0 0 0 0 0 0,00 0 0 0 0,00 of prefire dm kg GES / tonne dmAnnual System5 Soybeans SLM NO Yes Yes Yes Yes No NO 10 0,88 0,55 0,7 1,14 0 0,00 1,14 0 0 0,00 0,8 2,7 0,07Annual System6 Soybeans conventional NO No No No No No NO 10 0 0 0 0 0 0,00 0 0 0 0,00Annual System7 Tomatoes SLM NO Yes Yes No Yes No NO 10 0,88 0,55 0 1,14 0 0,00 1,14 0 0 0,00 Dynamic FactorsAnnual System8 Tomatoes conventional NO No No No No No NO 10 0 0 0 0 0 0,00 0 0 0 0,00 Immediate 1Annual System9 Onion SLM NO Yes Yes Yes Yes No NO 10 0,88 0,55 0,7 1,14 0 0,00 1,14 0 0 0,00 Exponential 0,78Annual System10 Onion conventional NO No No No No No NO 10 0 0 0 0 0 0,00 0 0 0 0,00 Linear 0,5Annual System11 Rainfed rice SLM NO Yes Yes Yes Yes No NO 10 0,88 0,55 0,7 1,14 0 0,00 1,14 0 0 0,00Annual System12 Rainfed rice conventional NO No No No No No NO 10 0 0 0 0 0 0,00 0 0 0 0,00Annual System13 Potato SLM NO Yes Yes Yes Yes No NO 10 0,88 0,55 0,7 1,14 0 0,00 1,14 0 0 0,00Annual System14 Potato conventional NO No No No No No NO 10 0 0 0 0 0 0,00 0 0 0 0,00Annual System15 Cassava SLM NO Yes Yes Yes Yes No NO 10 0,88 0,55 0,7 1,14 0 0,00 1,14 0 0 0,00Annual System16 Cassava conventional NO No No No No No NO 10 0 0 0 0 0 0,00 0 0 0 0,00
Positive value= gain for soil Description/example of the different options See FAOSTAT Soil mitigation effect limited to 20 yearsImproved agronomic practices: using improved varieties, extending crop rotation… Positive value= gain for soilNutrient management: precision farming, improve N use effciencyTillage / residues Management Adoption of reduced,minimum or zero tillage, with or without mulching, including Conservation AgricultureWater management: Effective irrigation measureManure application Manure or Biosolids application to the field as input
Mitigation potential
Vegetation DifferenceType Start Without project With Project Without With Without With Without With
t0 End Rate End Rate tCO2 tCO2 tCO2System A1 0 0 Linear 0 Linear 0 0 0 0 0 0 0System A2 1250 1250 Linear 0 Linear 0 0 0 0 0 0 0System A3 0 0 Linear 8718 Linear 0 0 0 0 0 0 0System A4 3033 3033 Linear 0 Linear 0 0 0 0 0 0 0Beans SLM 32429 32429 Linear 36032 Linear 0 -69830 0 0 0 -69830 -69830Beans conventional 3603 3603 Linear 0 Linear 0 0 0 0 0 0 0Millet SLM 21637 21637 Linear 24041 Linear 0 -46591 0 0 0 -46591 -46591Millet conventional 2404 2404 Linear 0 Linear 0 0 0 0 0 0 0Soybeans SLM 111505 111505 Linear 123894 Linear 0 -240107 0 0 0 -240107 -240107Soybeans conventional 12389 12389 Linear 0 Linear 0 0 0 0 0 0 0Tomatoes SLM 24944 24944 Linear 27715 Linear 0 -53712 0 0 0 -53712 -53712Tomatoes conventional 2772 2772 Linear 0 Linear 0 0 0 0 0 0 0Onion SLM 5856 5856 Linear 6507 Linear 0 -12611 0 0 0 -12611 -12611Onion conventional 651 651 Linear 0 Linear 0 0 0 0 0 0 0Rainfed rice SLM 46280 46280 Linear 51422 Linear 0 -99656 0 0 0 -99656 -99656Rainfed rice conventional 5142 5142 Linear 0 Linear 0 0 0 0 0 0 0Potato SLM 2624 2624 Linear 2915 Linear 0 -5649 0 0 0 -5649 -5649Potato conventional 292 292 Linear 0 Linear 0 0 0 0 0 0 0Cassava SLM 7848 7848 Linear 8720 Linear 0 -16899 0 0 0 -16899 -16899Cassava conventional 872 872 Linear 0 Linear 0 0 0 0 0 0 0Total 281246 281246 281246 Agric. Annual Total 0 -545055 -545055
Total Balance
Back to Description
Soil CO2 mitigatedCO2eq emitted from
BurningAreas

Estimating mitigation potential of agricultural projects: An application of the EX-Ante Carbon-balance Tool (EX-ACT) in Brazil
82
Agroforestry/Perennial/tree Crops
Residue/Biomass Aboveground Biomass Belowground Biomass Soil Effect User default available CH4 N2O CO2eq Combustion Dynamic FactorsYour description Burning tonnes dm/haGrowth rate Growth rate Default
Frequency Default Specific Default Specific t CO2/ha/yr tCO2/ha/yr kg kg t % released CH4 N2O Immediate 1Reserved system P1 From Deforestation NO 1 10 2,1 0 0,7 NO 0 0 0,00 of prefire dm kg GES / tonne dm Exponentia 0,78Reserved system P2 Converted to A/R NO 1 10 0 0 0,7 NO 0 0 0,00 0,8 2,3 0,21 Linear 0,5Reserved system P3 OLUC to Perennial NO 1 10 2,1 0 0,7 NO 0 0 0,00Reserved system P4 Perennial to OLUC NO 1 10 0 0 0,7 NO 0 0 0,00Perennial Syst 1 Banana NO 1 10 0 0 0,7 NO 0 0 0,00Perennial Syst 2 Erva Mate NO 1 10 0 0 0,7 NO 0 0 0,00Perennial Syst 3 Laranja NO 1 10 0 0 0,7 NO 0 0 0,00Perennial Syst 4 Maça NO 1 10 0 0 0,7 NO 0 0 0,00Perennial Syst 5 Palmito NO 1 10 0 0 0,7 NO 0 0 0,00Perennial Syst 6 Pêssego NO 1 10 0 0 0,7 NO 0 0 0,00Perennial Syst 7 Uva NO 1 10 0 0 0,7 NO 0 0 0,00
The default (tiers 1 assumption) is that if the system Positive value= gain for soilis in equilibrium therefore default growth rate is 0Only System P1 and P3 are considered by default not in equilibrium
Mitigation potentialVegetation Type Areas CO2 mitigated from Biomass CO2 mitigated from Soil CO2eq emitted from Burnin Difference
Start Without project With Project Without With Without With Without With Without With
t0 End Rate End Rate tCO2 tCO2 tCO2eq
System P1 0 0 Linear 0 Linear 0 0 0 0 0 0 0 0 0System P2 0 0 Linear 0 Linear 0 0 0 0 0 0 0 0 0System P3 0 0 Linear 67716 Linear 0 -8603317,8 0 -805820 0 0 0 -9409138 -9409138System P4 8718 8508 Linear 0 Linear 0 0 2499 103744 0 0 2499 103744 101245Perennial Syst 1 17628 17628 Linear 17628 Linear 0 0 0 0 0 0 0 0 0Perennial Syst 2 3886 3886 Linear 3886 Linear 0 0 0 0 0 0 0 0 0Perennial Syst 3 2476 2476 Linear 2476 Linear 0 0 0 0 0 0 0 0 0Perennial Syst 4 6436 6436 Linear 6436 Linear 0 0 0 0 0 0 0 0 0Perennial Syst 5 508 508 Linear 508 Linear 0 0 0 0 0 0 0 0 0Perennial Syst 6 602 602 Linear 602 Linear 0 0 0 0 0 0 0 0 0Perennial Syst 7 1585 1585 Linear 1585 Linear 0 0 0 0 0 0 0 0 0Total Syst 1-5 33121 33121 33121
Agric. Annual Total 2499 -9305394 -9307893
Total Balance
Back to Description

Estimating mitigation potential of agricultural projects: An application of the EX-Ante Carbon-balance Tool (EX-ACT) in Brazil
83
Grasslands
Description of Grassland type, their management and areas (ha) Avalaible options for Grassland Soil C (tC/ha)Name of the Systems Succession type Fire used to manage Delta C* Select state
Final (with or without project) Without project With project Cstart Cend tCO2eq/ha/yr Non degraded 63,0Default Your name Initial state State of the Grassland Fire* Frequency Fire Frequency t C/ha t C/ha Severely Degraded 44,1Reserved system G1 from Deforestation YES 5 NO 5 63,00 63,00 0,00 Moderately Degraded 59,9Reserved system G2 converted to A/R YES 5 NO 5 59,85 63,00 0,58 Improved without inputs management 71,8Reserved system G3 From OLUC YES 5 NO 5 63,00 71,82 1,62 Improved with inputs improvement 79,7Reserved system G4 Grassland to OLUC YES 5 NO 5 63,00 63,00 0,00
Grass-1Natural grasslands not improved NO 5 NO 5 63,00 63,00 0,00 Default Biom Combustion tCO2eq
Grass-2Natural grasslands improved NO 5 NO 5 63,00 71,82 1,62 Aboveground % released CH4 N2O for one
Grass-3Planted grassland not improved NO 5 NO 5 63,00 63,00 0,00 in t dm /ha of prefire dm kg GES / tonne dm combustion
Grass-4Planted grasslands improved NO 5 NO 5 63,00 71,82 1,62 2,7 0,77 2,3 0,21 0,236
Grass-5 NO 5 NO 5 0,00 0,00 0,00Grass-6 NO 5 NO 5 0,00 0,00 0,00 Dynamic FactorsGrass-7 NO 5 NO 5 0,00 0,00 0,00 Immediate 1Grass-8 NO 5 NO 5 0,00 0,00 0,00 Exponential 0,78Grass-9 NO 5 NO 5 0,00 0,00 0,00 Linear 0,5Grass-10 NO 5 NO 5 0,00 0,00 0,00
* is fire occuring?
Default Without project With Project Soil C variations (tCO2eq) Total CO2 eq from fire Total CO2eq Difference refers to initial state)End Rate End Rate Without With Without With Without With tCO2eq t0
System G1 from Deforestation 1810 Linear 933 Linear 0 0 1451 0 1451 0 -1451 0System G2 converted to A/R 625 Linear 0 Linear 0 6136 589 0 589 6136 5547 625System G3 From OLUC 0 Linear 0 Linear 0 0 0 0 0 0 0 0System G4 Grassland to OLUC 55178 Linear 0 Linear 0 0 52035 0 52035 0 -52035 55178
Grass-1Natural grasslands not improved 95504 Linear 0 Linear 0 0 0 0 0 0 0 95504
Grass-2Natural grasslands improved 0 Linear 95504 Linear 0 -2625309 0 0 0 -2625309 -2625309 0
Grass-3Planted grassland not improved 42648 Linear 0 Linear 0 0 0 0 0 0 0 42648
Grass-4Planted grasslands improved 0 Linear 42648 Linear 0 -1172351 0 0 0 -1172351 -1172351 0
Grass-5 0 Linear 0 Linear 0 0 0 0 0 0 0 0Grass-6 0 Linear 0 Linear 0 0 0 0 0 0 0 0Grass-7 0 Linear 0 Linear 0 0 0 0 0 0 0 0Grass-8 0 Linear 0 Linear 0 0 0 0 0 0 0 0Grass-9 0 Linear 0 Linear 0 0 0 0 0 0 0 0Grass-10 0 Linear 0 Linear 0 0 0 0 0 0 0 0Total Syst 1-10 138152 138152 138152
Grassland total 54075 -3791524 -3845599
Carbon Stock
Non degradedNon degraded
Back to Description
Non degraded
Improved without inputs managemenNon degraded
Improved without inputs managemen
Non degraded
Improved without inputs managemenSelect state
Select state
Select stateSelect stateSelect stateSelect state
Non degraded
Non degraded
Non degraded
Non degraded
Select stateSelect state
Non degraded
Non degradedModerately DegradedNon degraded
Select stateSelect stateSelect stateSelect state

Estimating mitigation potential of agricultural projects: An application of the EX-Ante Carbon-balance Tool (EX-ACT) in Brazil
84
Other GHG Emissions (not related to change in carbon pools)
Methane emissions from enteric fermentation Dynamic FactorsTotal Emission (tCO2eq) Immediate 1
IPCC Specific Default Start Start Difference Exponential 0,78Choose Livestocks: factor factor Factor t0 End Rate End Rate Without With Without With Linear 0,5Dairy cattle 63 YES 160523 128419 Linear 144471 Linear 212372 169898 191135 3525388 3886413 361026Other cattle 56 YES 639776 640000 Linear 640000 Linear 752377 752640 752640 15052010 15052010 0Buffalo 55 YES 0 0 Linear 0 Linear 0 0 0 0 0 0Sheep 5 YES 25902 28490 Immediate 29787 Immediate 2720 2991 3128 59829 62553 2724Swine (Market) 1,5 YES 1570337 1570337 Linear 1570337 Linear 49466 49466 49466 989312 989312 0Swine (Breeding) 1,5 YES 0 0 Linear 0 Linear 0 0 0 0 0 0Horses 18 YES 14724 14000 Linear 14000 Linear 5566 5292 5292 106661 106661 0Poultry 0 YES 56190050 76418468 Linear 76418468 Linear 0 0 0 0 0 0Camels 46 YES 0 0 Linear 0 Linear 0 0 0 0 0 0User Defined- Specified value ---------------> NO 0 0 Linear 0 Linear 0 0 0 0 0 0User Defined- Specified value ---------------> NO 0 0 Linear 0 Linear 0 0 0 0 0 0
Sub-Total L-1 1022500 980287 1001660 19733200 20096949 363749PLEASE SPECIFY INFORMATION BELOW IF AVAILABLECountry "Type" Def MAT MATMean Annual Temperature (MAT) in °C Possible 15 17,99
Methane emissions from manure managementTotal Emission (tCO2eq)
IPCC Specific Default Start Start DifferenceLivestocks: factor factor Factor t0 End Rate End Rate Without With Without WithDairy cattle 1 YES 160523 128419 Linear 144471 Linear 3371 2697 3034 55959 61689 5731Other cattle 1 YES 639776 640000 Linear 640000 Linear 13435 13440 13440 268786 268786 0Buffalo 1 YES 0 0 Linear 0 Linear 0 0 0 0 0 0Sheep 0,15 YES 25902 28490 Immediate 29787 Immediate 82 90 94 1795 1877 82Swine (Market) 1 YES 1570337 1570337 Linear 1570337 Linear 32977 32977 32977 659542 659542 0Swine (Breeding) 1 YES 0 0 Linear 0 Linear 0 0 0 0 0 0Horses 1,64 YES 14724 14000 Linear 14000 Linear 507 482 482 9718 9718 0Poultry 0,02 YES 56190050 76418468 Linear 76418468 Linear 23600 32096 32096 616427 616427 0Camels 1,92 YES 0 0 Linear 0 Linear 0 0 0 0 0 0User Defined- Specified value ---------------> NO 0 0 Linear 0 Linear 0 0 0 0 0 0User Defined- Specified value ---------------> NO 0 0 Linear 0 Linear 0 0 0 0 0 0
Sub-Total L-2 73972 81782 82123 1612226 1618038 5812
Nitrous Oxide emissions from manure managementTotal Emission (tCO2eq)
IPCC Specific Default Start Start DifferenceLivestocks: factor factor Factor t0 End Rate End Rate Without With Without WithDairy cattle 0,01 YES 11249,5 8999,6 Linear 10124,5 Linear 54801 43841 49321 909698 1002858 93159,8Other cattle 0,01 YES 25640,3 25649,3 Linear 25649,3 Linear 124905 124949 124949 2498842 2498842 0,0Buffalo 0,01 YES 0,0 0,0 Linear 0,0 Linear 0 0 0 0 0 0,0Sheep 0,01 YES 309,7 340,7 Immediate 356,2 Immediate 1509 1660 1735 33191 34702 1511,0Swine (Market) 0,01 YES 26320,1 26320,1 Linear 26320,1 Linear 128217 128217 128217 2564330 2564330 0,0Swine (Breeding) 0,01 YES 0,0 0,0 Linear 0,0 Linear 0 0 0 0 0 0,0Horses 0,01 YES 588,4 559,4 Linear 559,4 Linear 2866 2725 2725 54929 54929 0,0Poultry 0,01 YES 16817,7 22872,0 Linear 22872,0 Linear 81926 111420 111420 2139911 2139911 0,0Camels 0,01 YES 0,0 0,0 Linear 0,0 Linear 0 0 0 0 0 0,0User Defined- Specified value ---------------> NO Linear Linear 0 0 0 0 0 0,0User Defined- Specified value ---------------> NO Linear Linear 0 0 0 0 0 0,0see equation 10.30 Sub-Total L-3 394223,453 412810,4325 418365,97 8200900,0 8295570,7 94670,8
Additional Technical Mitigation (See IPCC TAR Vol 3 Chapter 8)
Percent of head with practices (0% =none;100%=all) Emission (t CO2eq) per year Total Emission (tCO2eq)Start Without Project With Project Start End All Period Difference
Livestocks Dominant Practice* Factor t0 End Rate End Rate Without With Without WithDairy cattle Feeding practices 0,060 30% 30% Linear 50% Linear -3823 -3058 -5734 -63457 -108947 -45490
Specific Agents 0,030 0% 0% Linear 0% Linear 0 0 0 0 0 0Management-Breed 0,020 20% 20% Linear 40% Linear -849 -680 -1529 -14102 -28543 -14441No Option 0,000 50% 50% Linear 10% Linear 0 0 0 0 0 0
Other cattle Feeding practices 0,030 5% 5% Linear 15% Linear -1129 -1129 -3387 -22578 -60963 -38385Specific Agents 0,020 0% 0% Linear 0% Linear 0 0 0 0 0 0Management-Breed 0,030 20% 20% Linear 40% Linear -4514 -4516 -9032 -90312 -167081 -76769No Option 0,000 75% 75% Linear 45% Linear 0 0 0 0 0 0
Buffalo Feeding practices 0,045 0% 0% Linear 0% Linear 0 0 0 0 0 0Specific Agents 0,007 0% 0% Linear 0% Linear 0 0 0 0 0 0Management-Breed 0,025 0% 0% Linear 0% Linear 0 0 0 0 0 0No Option 0,000 100% 100% Linear 100% Linear 0 0 0 0 0 0
Sheep Feeding practices 0,020 5% 5% Immediate 15% Immediate -3 -3 -9 -60 -188 -128Specific Agents 0,001 0% 0% Immediate 0% Immediate 0 0 0 0 0 0Management-Breed 0,002 20% 20% Immediate 40% Immediate -1 -1 -3 -24 -50 -26No Option 0,000 75% 75% Immediate 45% Immediate 0 0 0 0 0 0
Sub-Total L-4 -10319 -9387 -19694 -190532 -365772 -175239Feeding practices: e;g. more concentrates, adding certian oils or oilseeds to the diet, improving pasture quality,…Specific agents: specific agents and dietary additives to reduces CH4 emisisons (Ionophores, vaccines, bST…) Total "Livestocks" 29355793 29644786 288993Management-Breeding: Increasing productivity through breeding and better management practices, such as a reduction in the number of replacement heifers
Back to Description
Emission (t CO2eq) per yearEnd
Head Number
Developing17,99
All Period
Annual amount of N manure* (t N per year) Emission (t CO2eq) per yearAll Period
Without Project With Project
Without Project With Project End
All PeriodEmission (t CO2eq) per year
EndHead Number
With ProjectWithout Project

Estimating mitigation potential of agricultural projects: An application of the EX-Ante Carbon-balance Tool (EX-ACT) in Brazil
85
Other GHG Emissions (not related to change in carbon pools)
Carbon dioxide emissions from Lime application Dynamic FactorsTotal Emission (tCO2eq) Immediate 1
Type of lime IPCC Specific Default Start Start Difference Exponential 0,78factor factor Factor t0 End Rate End Rate Without With Without With Linear 0,5
Limestone 0,12 YES 0 0 Linear 0 Linear 0 0 0 0 0 0Dolomite 0,13 YES 2300560 2231543 Linear 2321265 Linear 299072,8 290100,59 301764,45 5828928 6027214 198286Not precised 0,125 YES 0 0 Linear 0 Linear 0 0 0 0 0 0
Sub-Total I-1 299072,8 290100,59 301764,45 5828928,4 6027214,1 198286
Carbon dioxide emissions from Urea applicationTotal Emission (tCO2eq)
IPCC Specific Default Start Start Differencefactor factor Factor t0 End Rate End Rate Without With Without With
Urea 0,2 YES 165014 160064 Linear 166499 Linear 33002,8 32012,8 33299,8 643226 665105 21879Sub-Total I-2 33002,8 32012,8 33299,8 643226 665105 21879
N2O emissions from N application on managed soils (except manure management see Livestock Module)Amount of N Applied (t per year) Total Emission (tCO2eq)
Type of input IPCC Specific Default Start Start Differencefactor factor Factor t0 End Rate 0 Rate Without With Without With
Urea 0,01 YES 77007 74697 Linear 77699,5 Linear 238720,3 231559,3 240868,6 4652668 4810926 158258N Fertiliser (other than Urea) 0,01 YES 107945 103737 Linear 107908 Linear 334629,5 321584,7 334514,8 6470828 6690640 219812N Fertiliser in non-upland Rice* 0,003 YES 0 0 Linear 0 Linear 0,0 0,0 0,0 0 0 0Sewage 0,01 YES 1000 970 Linear 1009 Linear 3100,0 3007,0 3127,9 60419 62474 2055Compost 0,01 YES 0 0 Linear 0 Linear 0,0 0,0 0,0 0 0 0*N fertilizer from upland rice should be included above (N fertilizer) Sub-Total I-3 576449,8 556151,0 578511,3 # 11183915 11564041 380125
CO2 equivalent emissions from production, transportation, storage and transfer of agricultural chemicalsAmount in tonnes of product (active ingrediente for Pesticides)
Type of input** Default Specific Default Start Start Differencefactor* factor Factor t0 End Rate End Rate Without With Without With
Urea 4,8 YES 77006,5333 74696,53333 Linear 77699,5333 Linear 367064,5 356053,5 370367,8 7154103 7397446 243343N Fertiliser (other than Urea) 4,8 YES 107945 103737 Linear 107908 Linear 514537,8 494479,7 514361,5 9949768 10287758 337990N Fertiliser in non-upland Rice* 4,8 YES 0 0 Linear 0 Linear 0,0 0,0 0,0 0 0 0Phosphorus synthetic fertilizer 0,7 YES 94236 91409 Linear 95084 Linear 69106,4 67033,3 69728,3 1346885 1392700 45815Potassium synthetic fertilizer 0,6 YES 85427 82864 Linear 86196 Linear 46984,9 45575,2 47407,8 915733 946887 31154Limestone (Lime) 0,6 YES 0 0 Linear 0 Linear 0,0 0,0 0,0 0 0 0Dolomite (Lime) 0,6 YES 2300560 2231543 Linear 2321265 Linear 1349661,9 1309171,9 1361808,8 26304908 27199735 894827Generic Lime 0,6 YES 0 0 Linear 0 Linear 0,0 0,0 0,0 0 0 0Herbicides (Pesticides) 23,1 YES 416,3 448,3 Linear 675,4 Linear 9616,5 10355,7 15601,7 204897 294079 89182Insecticides (Pesticides) 18,7 YES 339,2 336,5 Linear 344,5 Linear 6343,0 6292,6 6442,2 126002 128546 2543Fungicides (Pesticides) 14,3 YES 686,5 684,4 Linear 696,8 Linear 9817,0 9786,9 9964,2 195828 198843 3014* from Lal (2004) Table 5 - central value -tCO2/t product Sub-Total I-4 2373131,9 2298748,7 2395682,2 46198124 47845994 1647870** tonnes of N, P2O5, K2O and CaCO3
Total "Inputs" 63854194 66102354 2248159
Without Project With ProjectAmount of Lime in tonnes per year
Amount of Urea in tonnes per year Emission (t CO2eq) per yearWithout Project With Project End
Total Emission
Without Project With Project End
Back to Description
Without Project With Project End
Emission (t CO2eq) per year
Emission (t CO2eq) per yearEnd

Estimating mitigation potential of agricultural projects: An application of the EX-Ante Carbon-balance Tool (EX-ACT) in Brazil
86
Project Summary Area (Initial state in ha)Name SC Rural Forest/Plantation 78126
Annual 285529 Implementat 6Continent South America Cropland Perennial 41839 Capitalisatio 14
Rice 51422 Total 20Climate Warm Temperate Moist Grassland 193955
Other Land Degraded 10130Dominante Soil TLAC Soils Other 0 Total Area 661001
N2O CH4 Per phase of the projectBiomass Soil Implement. Capital. Total Implement. Capital.
-297034 this is a sink -297034 0 0 0 -297034 0 -14852 -49506 0-896371 this is a sink -738063 -158307 0 0 -259340 -637031 -44819 -43223 -4550295205 this is a source 1026601 -931396 0 0 862237 -767032 4760 143706 -54788
-545055 this is a sink 0 -545055 0 0 -42110 -502944 -27253 -7018 -35925-9307893 this is a sink -8603318 -704575 0 0 -1427870 -7880023 -465395 -237978 -562859
0 0 0 0 0 0 0 0 0 0-3845599 this is a sink 0 -3791524 -31043 -23032 -685136 -3160464 -192280 -114189 -225747
288993 this is a source 94671 194322 51513 237480 14450 8585 169632248159 this is a source 380125 --- 337089 1911071 112408 56181 136505
65925 this is a source --- --- 65185 739 3296 10864 53
Final Balance -12193670 It is a sink -6677856 -6130858 443753 171290 -1395467 -10798204 -609684 -232578 -771300
Result per ha -18,4 -10,1 -9,3 0,7 0,3 -2,1 -16,3 -0,92 -0,4 -1,2
Components of the Project
Other GHG EmissionsLivestock
Inputs
Deforestation Afforestation and ReforestationOther Land Use ChangeAgriculture
Project Investment
Annual CropsAgroforestry/Perennial Crops
Rice Grassland
65925
All GHG in tCO2eqBalance (Project - Baseline)
Duration of theProject (years)
Mean per year
CO2 (other)---
1868034
CO2
-10000000
-8000000
-6000000
-4000000
-2000000
0
2000000
4000000
Deforestation Afforestation andReforestation
Other Land UseChange
Annual Crops Agroforestry/PerennialCrops
Rice Grassland Livestock Inputs Project Investment

Estimating mitigation potential of agricultural projects: An application of the EX-Ante Carbon-balance Tool (EX-ACT) in Brazil
87
Annex 5 EX-ACT tables of the Rio Rural project
Ex-Ante Analysis of Deforestation
Type of Default forest/plantation proposed within the Combustion specified Climatic zone Soil C % released CH4 N2O
Ecological Zone Go to Map tonnes dm t C tonnes dm t C tC of prefire dm g.kg DM burntForest1 Tropical rain forest 300 141 111,0 52,2 47 0,32 6,8 0,2Forest2 Tropical moist deciduous forest 220 103,4 52,8 24,8 47 0,36 6,8 0,2Forest3 Tropical dry forest 210 98,7 58,8 27,6 47 0,36 6,8 0,2Forest4 Tropical shrubland 80 37,6 32,0 15,0 47 0,72 6,8 0,2Plantation1 Tropical rain forest 150 70,5 55,5 26,1 47 0,32 6,8 0,2Plantation2 Tropical moist deciduous forest 120 56,4 24,0 11,3 47 0,36 6,8 0,2Plantation3 Tropical dry forest 60 28,2 16,8 7,9 47 0,36 6,8 0,2Plantation4 Tropical shrubland 30 14,1 12,0 5,6 47 0,72 6,8 0,2
If you have your own data fill the information -> Specific Vegetation 1 0 0 0 0 0 0,32 6,8 0,2Specific Vegetation 2 0 0 0 0 0 0,32 6,8 0,2Specific Vegetation 3 0 0 0 0 0 0,32 6,8 0,2Specific Vegetation 4 0 0 0 0 0 0,32 6,8 0,2
Conversion details (Harvest wood product exported before the conversion, use of fire, final use after conversion) Looses (positive value) and gain (negative value) per haVegetation Type Final Use after Biomass Biomass N2O Total Dynamic Factors
Name tonne t C exported yes/no % released deforestation 1 yr after t C t CO2 kg tCO2 eq (linked with duration of the project)
Defor.1 0 0 NO 0 7,6 196,8 721,7 0,0 0,0 BiomassDefor.2 0 0 NO 0 7,6 196,8 721,7 0,0 0,0 and FireDefor.3 0 0 NO 0 0,0 0,0 0,0 0,0 0,0 Immediate 1Defor.4 0 0 NO 0 0,0 0,0 0,0 0,0 0,0 Exponential 0,78Defor.5 0 0 NO 0 0,0 0,0 0,0 0,0 0,0 Linear 0,5Defor.6 0 0 NO 0 0,0 0,0 0,0 0,0 0,0Defor.7 Specific Vegetation 1 0 0 NO 0 0,0 0,00 0,0 0,0 0,0Defor.8 Specific Vegetation 2 0 0 NO 0 0,0 0,00 0,0 0,0 0,0Defor.9 Specific Vegetation 3 0 0 NO 0 0,0 0,00 0,0 0,0 0,0Defor.10 Specific Vegetation 4 0 0 NO 0 0,0 0,00 0,0 0,0 0,0
GHG emissionsVegetation Ty Area deforested (ha) Biomass gain (1yr after) Total Balance Difference
Start Without Project With Project Without With Without With Without With Without Witht0 End Rate End Rate tCO2 tCO2 tCO2 tCO2 tCO2 tCO2 tCO2
Defor.1 2,5 0 Linear 2,5 Linear 3 0 1804 0 -69 0 1735 0 -1735Defor.2 3,7 0 Linear 4,4 Linear 4 0 2670 0 -103 0 2568 0 -2568
4302 0 -4302
Above-Ground Biomass
Biomass loss
Select Use after deforestationSelect Use after deforestationSelect Use after deforestation
Select Use after deforestation
GrasslandGrassland
Natural Forest
Plantation
HWP before
Please specify the vegetation
Please specify the vegetation
Forest1Forest1Please specify the vegetation
Back to Description
Select Use after deforestationSelect Use after deforestation
Forested Area (ha)
Please specify the vegetation
Select Use after deforestationSelect Use after deforestation
Fire use
Suggested Default Values per hectare (/ha)Below-Ground Biomass

Estimating mitigation potential of agricultural projects: An application of the EX-Ante Carbon-balance Tool (EX-ACT) in Brazil
88
Afforestation and Reforestation Back to DescriptionSuggested Default Values per hectare (/ha)
Type of Default forest/plantation proposed within the Up to 20 year-old After 20 year-old Dynamic Factorsspecified Climatic zone Above-Ground Biomass Growth Below-Ground Biomass grow Above-Ground Biomass GrowBelow-Ground Biomass grow Litter total Dead Wood Soil C (linked with duration of the project)
Ecological Zone Ecol_Zone tonnes dm t C tonnes dm t C tonnes dm t C tonnes dm t C t C tC tC Immediate 1Natural1 Tropical rain forest 11,00 5,17 4,07 1,91 3,10 1,46 1,15 0,54 3,65 0 47 Exponential 0,78Natural2 Tropical moist deciduous forest 7,00 3,29 1,40 0,66 2,00 0,94 0,40 0,19 3,65 0 47 Linear 0,5Natural3 Tropical dry forest 4,00 1,88 2,24 1,05 1,00 0,47 0,56 0,26 3,65 0 47Natural4 Tropical shrubland 4,00 1,88 1,60 0,75 1,00 0,47 0,40 0,19 3,65 0 47Plantation1 Tropical rain forest 15,00 7,05 5,55 2,61 15,00 7,05 5,55 2,61 3,65 0 47Plantation2 Tropical moist deciduous forest 10,00 4,70 2,00 0,94 10,00 4,70 2,00 0,94 3,65 0 47Plantation3 Tropical dry forest 8,00 3,76 4,48 2,11 8,00 3,76 4,48 2,11 3,65 0 47Plantation4 Tropical shrubland 5,00 2,35 2,00 0,94 5,00 2,35 2,00 0,94 3,65 0 47
If you have your own data fill the information Specific Vegetation 1 0,00 0,00 0,00 0,00 0,00 0,00 0,00 0 0 0 0See IPCC 2006 Tables 4.9 and 4.10 for other values Specific Vegetation 2 0,00 0,00 0,00 0,00 0,00 0,00 0,00 0,00 0 0 0
Specific Vegetation 3 0,00 0,00 0,00 0,00 0,00 0,00 0,00 0 0 0 0Specific Vegetation 4 0,00 0,00 0,00 0,00 0,00 0,00 0,00 0 0 0 0
Conversion details (Previous land use, use of fire before afforestation/reforestation,...) GHG emitted during Burning Biomass of forests/plantationVegetation Type Previous use before Burnt befor Default Specific Soil CH4 N2O Total Annual Biomass Growt Litter+dead
Name afforestation/reforestation conversion Biomass Biomass ksoil Delta C tCO2/yr kg kg tCO2 eq <=20yrs >20yr wood
A/R1 YES 1,0 0,33 31,5 5,8 4,60 0,42 0,2 7,1 2,0 3,7A/R2 YES 1,0 0,33 31,5 5,8 4,60 0,42 0,2 7,1 2,0 3,7A/R3 YES 1,0 0,33 31,5 5,8 4,60 0,42 0,2 9,7 9,7 3,7A/R4 NO 0,0 0,00 0,0 0,0 0,00 0,00 0,0 0,0 0,0 0,0A/R5 NO 0,0 0,00 0,0 0,0 0,00 0,00 0,0 0,0 0,0 0,0A/R6 NO 0,0 0,00 0,0 0,0 0,00 0,00 0,0 0,0 0,0 0,0A/R7 Specific Vegetation 1 NO 0,0 0,00 0,0 0,0 0,00 0,00 0,0 0,0 0,0 0A/R8 Specific Vegetation 2 NO 0,0 0,00 0,0 0,0 0,00 0,00 0,0 0,0 0,0 0A/R9 Specific Vegetation 3 NO 0,0 0,00 0,0 0,0 0,00 0,00 0,0 0,0 0,0 0A/R10 Specific Vegetation 4 NO 0,0 0,00 0,0 0,0 0,00 0,00 0,0 0,0 0,0 0
GHG emissionsVegetation Type Biomass Loss Soil Fire Total Balance Difference
Start Without Project With Project Without With Without With Without With Without With Without Witht0 End Rate End Rate tCO2 tCO2 tCO2 tCO2 tCO2 tCO2 tCO2 tCO2 tCO2 tCO2 tCO2
A/R1 0 0 Linear 720 Linear 0 -327517 0 2803 0 -70664 0 163 0 -395214 -395214A/R2 0 0 Linear 80 Linear 0 -36391 0 311 0 -7852 0 18 0 -43913 -43913A/R3 0 0 Linear 110 Linear 0 -67697 0 428 0 -10796 0 25 0 -78040 -78040
Deforestation Total 0 -517166 -517166
Biomass GainAfforested or reforested Area (ha)
Natural ForestType
PlantationType
Degraded LandDegraded LandDegraded LandSelect previous useSelect previous useSelect previous useSelect previous useSelect previous useSelect previous useSelect previous use
Please specify the vegetationPlease specify the vegetation
Natural1Natural1Plantation1Please specify the vegetation
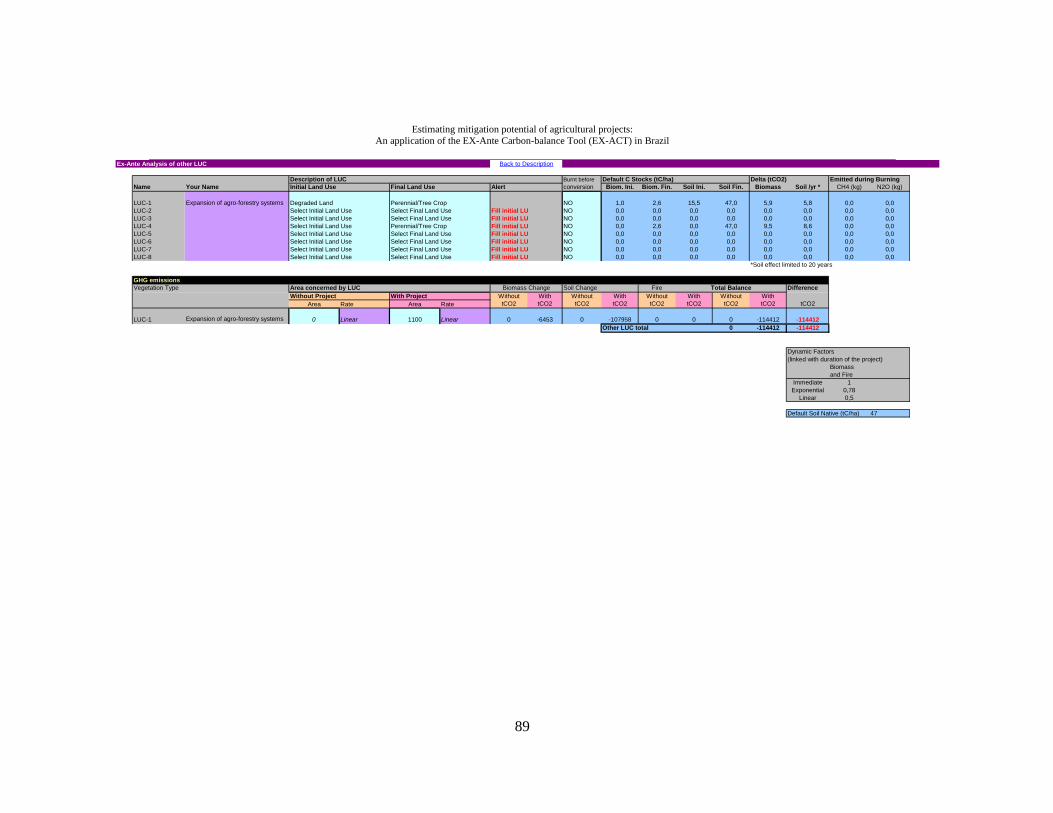
Estimating mitigation potential of agricultural projects: An application of the EX-Ante Carbon-balance Tool (EX-ACT) in Brazil
89
Ex-Ante Analysis of other LUC
Description of LUC Burnt before Default C Stocks (tC/ha) Delta (tCO2) Emitted during BurningName Your Name Initial Land Use Final Land Use Alert conversion Biom. Ini. Biom. Fin. Soil Ini. Soil Fin. Biomass Soil /yr * CH4 (kg) N2O (kg)
LUC-1 Expansion of agro-forestry systems NO 1,0 2,6 15,5 47,0 5,9 5,8 0,0 0,0LUC-2 Fill initial LU NO 0,0 0,0 0,0 0,0 0,0 0,0 0,0 0,0LUC-3 Fill initial LU NO 0,0 0,0 0,0 0,0 0,0 0,0 0,0 0,0LUC-4 Fill initial LU NO 0,0 2,6 0,0 47,0 9,5 8,6 0,0 0,0LUC-5 Fill initial LU NO 0,0 0,0 0,0 0,0 0,0 0,0 0,0 0,0LUC-6 Fill initial LU NO 0,0 0,0 0,0 0,0 0,0 0,0 0,0 0,0LUC-7 Fill initial LU NO 0,0 0,0 0,0 0,0 0,0 0,0 0,0 0,0LUC-8 Fill initial LU NO 0,0 0,0 0,0 0,0 0,0 0,0 0,0 0,0
*Soil effect limited to 20 years
GHG emissionsVegetation Type Area concerned by LUC Soil Change Fire Total Balance Difference
Without Project With Project Without With Without With Without With Without WithArea Rate Area Rate tCO2 tCO2 tCO2 tCO2 tCO2 tCO2 tCO2 tCO2 tCO2
LUC-1 Expansion of agro-forestry systems 0 Linear 1100 Linear 0 -6453 0 -107958 0 0 0 -114412 -114412Other LUC total 0 -114412 -114412
Dynamic Factors(linked with duration of the project)
Biomassand Fire
Immediate 1Exponential 0,78
Linear 0,5
Default Soil Native (tC/ha) 47
Degraded Land
Biomass Change
Select Initial Land UseSelect Initial Land UseSelect Initial Land UseSelect Initial Land UseSelect Initial Land UseSelect Initial Land UseSelect Initial Land Use Select Final Land Use
Perennial/Tree CropSelect Final Land UseSelect Final Land UseSelect Final Land Use
Back to Description
Perennial/Tree CropSelect Final Land UseSelect Final Land Use

Estimating mitigation potential of agricultural projects: An application of the EX-Ante Carbon-balance Tool (EX-ACT) in Brazil
90
Ex-ante analysis of some agricultural practices
User-defined practices Improved aNutrient NoTillage/r Water Manure Residue/Biomass Corresponding mean potential Used CH4 N2O CO2eqYour description Name ate in tC/ha/yr -nomic pramanagemmanagememanagemen applicationBurning tonnes dm/ha t CO2 /ha/yr Users kg kg t
Reserved system A1 from Deforestation NO ? ? ? ? ? NO 10 0 0 0 0 0 0,00 0 0 0 0,00Reserved system A2 Converted to A/R NO ? ? ? ? ? NO 10 0 0 0 0 0 0,00 0 0 0 0,00Reserved system A3 Annual From OLUC NO ? ? ? ? ? NO 10 0 0 0 0 0 0,00 0 0 0 0,00Reserved system A4 Converted to OLUC NO ? ? ? ? ? NO 10 0 0 0 0 0 0,00 0 0 0 0,00Annual System1 Current system NO No No No No Yes YES 10 0 0 0 0 2,79 0,00 2,79 21,6 0,56 0,63Annual System2 Improved agronomic 1 NO Yes Yes Yes No Yes NO 10 0,88 0,55 0,7 0 2,79 0,00 2,79 0 0 0,00Annual System3 Improved agronomic 2 NO Yes No No No No NO 10 0,88 0 0 0 0 0,00 0,88 0 0 0,00Annual System4 Improved agronomic 3 NO Yes No Yes No Yes NO 10 0,88 0 0,7 0 2,79 0,00 2,79 0 0 0,00Annual System5 Nutrient management 1 NO No Yes No No Yes NO 10 0 0,55 0 0 2,79 0,00 2,79 0 0 0,00Annual System6 Nutrient management 2 NO No Yes No No No NO 10 0 0,55 0 0 0 0,00 0,55 0 0 0,00Annual System7 Nutrient management 3 NO No Yes Yes No Yes NO 10 0 0,55 0,7 0 2,79 0,00 2,79 0 0 0,00Annual System8 Tillage/residue management NO No No Yes No Yes NO 10 0 0 0,7 0 2,79 0,00 2,79 0 0 0,00Annual System9 Water management NO No No No Yes No NO 10 0 0 0 1,14 0 0,00 1,14 0 0 0,00Annual System10 NO No No Yes Yes Yes NO 10 0 0 0,7 1,14 2,79 0,00 2,79 0 0 0,00
Positive value= gain for s Description/example of the different options See FAOSTAT Soil mitigation effect limited to 20 yearsImproved agronomicusing improved varieties, extending crop rotation… Positive value= gain for soilNutrient manageme precision farming, improve N use effciencyTillage / residues MaAdoption of reduced,minimum or zero tillage, with or without mulching, including Conservation AgricultureWater management Effective irrigation measureManure application Manure or Biosolids application to the field as input
Mitigation potential
Vegetation Areas Difference Combustion Type Start Without With Without With Without With % released CH4 N2O
t0 End Rate End Rate tCO2 tCO2 tCO2 of prefire dm kg GES / tonne dmSystem A1 0 0 Linear 0 Linear 0 0 0 0 0 0 0 0,8 2,7 0,07System A2 0 0 Linear 0 Linear 0 0 0 0 0 0 0System A3 0 0 Linear 0 Linear 0 0 0 0 0 0 0 Dynamic FactorsSystem A4 0 0 Linear 0 Linear 0 0 0 0 0 0 0 Immediate 1Current system 225104 225104 Linear 220994 Linear 0 194937 2823705 2779882 2823705 2974819 151115 Exponential 0,78Improved agronomic 1 0 0 Linear 300 Linear 0 -14229 0 0 0 -14229 -14229 Linear 0,5Improved agronomic 2 0 0 Linear 240 Linear 0 -3590 0 0 0 -3590 -3590Improved agronomic 3 0 0 Linear 305 Linear 0 -14466 0 0 0 -14466 -14466Nutrient management 1 0 0 Linear 1320 Linear 0 -62608 0 0 0 -62608 -62608Nutrient management 2 0 0 Linear 310 Linear 0 -2899 0 0 0 -2899 -2899Nutrient management 3 0 0 Linear 475 Linear 0 -22529 0 0 0 -22529 -22529Tillage/residue management 0 0 Linear 950 Linear 0 -45059 0 0 0 -45059 -45059Water management 0 0 Linear 210 Linear 0 -4070 0 0 0 -4070 -4070Total Syst 1-10 225104 225104 225104
Agric. Annual Total 2823705 2805370 -18334
With ProjectWithout projectTotal Balance
Back to Description
Soil CO2 mitigatedCO2eq emitted from
Burning

Estimating mitigation potential of agricultural projects: An application of the EX-Ante Carbon-balance Tool (EX-ACT) in Brazil
91
Agroforestry/Perennial/tree Crops
Residue/Biomass Aboveground Biomass Belowground Biomass Soil Effect User default available CH4 N2O CO2eqYour description Burning tonnes dm/haGrowth rate Growth rate Default
Frequency Default Specific Default Specific t CO2/ha/yr tCO2/ha/yr kg kg tReserved system P1 From Deforestation NO 1 10 2,1 0 0,7 NO 0 0 0,00Reserved system P2 Converted to A/R NO 1 10 0 0 0,7 NO 0 0 0,00Reserved system P3 OLUC to Perennial NO 1 10 2,1 0 0,7 NO 0 0 0,00Reserved system P4 Perennial to OLUC NO 1 10 0 0 0,7 NO 0 0 0,00Perennial Syst 1 NO 1 10 0 0 0,7 NO 0 0 0,00Perennial Syst 2 NO 1 10 0 0 0,7 NO 0 0 0,00Perennial Syst 3 NO 1 10 0 0 0,7 NO 0 0 0,00Perennial Syst 4 NO 1 10 0 0 0,7 NO 0 0 0,00Perennial Syst 5 NO 1 10 0 0 0,7 NO 0 0 0,00
The default (tiers 1 assumption) is that if the system Positive value= gain for soilis in equilibrium therefore default growth rate is 0Only System P1 and P3 are considered by default not in equilibrium
Mitigation potentialVegetation Type Areas CO2 mitigated from Biomass CO2 mitigated from Soil CO2eq emitted from Burnin Difference
Start Without project With Project Without With Without With Without With Without With
t0 End Rate End Rate tCO2 tCO2 tCO2eqSystem P1 0 0 Linear 0 Linear 0 0 0 0 0 0 0 0 0System P2 0 0 Linear 0 Linear 0 0 0 0 0 0 0 0 0System P3 0 0 Linear 1100 Linear 0 -139755 0 -13090 0 0 0 -152845 -152845System P4 0 0 Linear 0 Linear 0 0 0 0 0 0 0 0 0Perennial Syst 1 0 0 Linear 0 Linear 0 0 0 0 0 0 0 0 0Perennial Syst 2 0 0 Linear 0 Linear 0 0 0 0 0 0 0 0 0Perennial Syst 3 0 0 Linear 0 Linear 0 0 0 0 0 0 0 0 0Perennial Syst 4 0 0 Linear 0 Linear 0 0 0 0 0 0 0 0 0Perennial Syst 5 0 0 Linear 0 Linear 0 0 0 0 0 0 0 0 0Total Syst 1-5 0 0 0
Agric. Annual Total 0 -152845 -152845
Combustion Dynamic Factors
% released CH4 N2O Immediate 1of prefire dm kg GES / tonne dm Exponential 0,78
0,8 2,3 0,21 Linear 0,5
Total Balance
Back to Description

Estimating mitigation potential of agricultural projects: An application of the EX-Ante Carbon-balance Tool (EX-ACT) in Brazil
92
Grasslands
Description of Grassland type, their management and areas (ha) Avalaible options for Grassland Soil C (tC/ha)Name of the Systems Succession type Fire used to manage Delta C* Select state
Final (with or without project) Without project With project Cstart Cend tCO2eq/ha/yr Non degraded 47,0Default Your name Initial state State of the Grassland Fire* Frequency Fire Frequency t C/ha t C/ha Severely Degraded 32,9Reserved system G1 from Deforestation NO 5 NO 5 47,00 47,00 0,00 Moderately Degraded 45,1Reserved system G2 converted to A/R NO 5 NO 5 47,00 47,00 0,00 Improved without inputs management 54,5Reserved system G3 From OLUC NO 5 NO 5 47,00 47,00 0,00 Improved with inputs improvement 60,5Reserved system G4 Grassland to OLUC NO 5 NO 5 47,00 47,00 0,00Grass-1 Pasture rotations NO 5 NO 5 45,12 47,00 0,34 Default Biom Combustion tCO2eqGrass-2 Sugarcane forage NO 5 NO 5 45,12 60,52 2,82 Aboveground % released CH4 N2O for oneGrass-3 Land equilibrium NO 5 NO 5 45,12 45,12 0,00 in t dm /ha of prefire dm kg GES / tonne dm combustionGrass-4 NO 5 NO 5 0,00 0,00 0,00 6,2 0,77 2,3 0,21 0,541Grass-5 NO 5 NO 5 0,00 0,00 0,00Grass-6 NO 5 NO 5 0,00 0,00 0,00 Dynamic FactorsGrass-7 NO 5 NO 5 0,00 0,00 0,00 Immediate 1Grass-8 NO 5 NO 5 0,00 0,00 0,00 Exponential 0,78Grass-9 NO 5 NO 5 0,00 0,00 0,00 Linear 0,5Grass-10 NO 5 NO 5 0,00 0,00 0,00
* is fire occuring?
Default Without project With Project Soil C variations (tCO2eq) Total CO2 eq from fire Total CO2eq DifferenceEnd Rate End Rate Without With Without With Without With tCO2eq
System G1 from Deforestation 6,2 Linear 0 Linear 0 0 0 0 0 0 0System G2 converted to A/R 0 Linear 0 Linear 0 0 0 0 0 0 0System G3 From OLUC 0 Linear 0 Linear 0 0 0 0 0 0 0System G4 Grassland to OLUC 0 Linear 0 Linear 0 0 0 0 0 0 0Grass-1 Pasture rotations 85 Linear 290 Linear 0 -1201 0 0 0 -1201 -1201Grass-2 Sugarcane forage 21 Linear 401 Linear 0 -18235 0 0 0 -18235 -18235Grass-3 Land equilibrium 585 Linear 0 Linear 0 0 0 0 0 0 0Grass-4 0 Linear 0 Linear 0 0 0 0 0 0 0Grass-5 0 Linear 0 Linear 0 0 0 0 0 0 0Grass-6 0 Linear 0 Linear 0 0 0 0 0 0 0Grass-7 0 Linear 0 Linear 0 0 0 0 0 0 0Grass-8 0 Linear 0 Linear 0 0 0 0 0 0 0Grass-9 0 Linear 0 Linear 0 0 0 0 0 0 0Grass-10 0 Linear 0 Linear 0 0 0 0 0 0 0Total Syst 1-10 691 691
Grassland total 0,0 -19436,6 -19437
Select stateSelect state
Non degraded
Non degradedNon degradedNon degraded
Select stateSelect stateSelect stateSelect state
Moderately DegradedModerately DegradedModerately DegradedSelect state
Moderately DegradedSelect stateSelect state
Select state
Select stateSelect stateSelect stateSelect state
Non degraded
Non degradedNon degraded
Improved with inputs improvement
Carbon Stock
Non degradedNon degraded
Back to Description

Estimating mitigation potential of agricultural projects: An application of the EX-Ante Carbon-balance Tool (EX-ACT) in Brazil
93
Other GHG Emissions (not related to change in carbon pools)
Methane emissions from enteric fermentation Dynamic FactorsTotal Emission (tCO2eq) Immediate 1
IPCC Specific Default Start Start Difference Exponential 0,78Choose Livestocks: factor factor Factor t0 End Rate End Rate Without With Without With Linear 0,5Dairy cattle 63 YES 421000 421000 Linear 421000 Linear 556983 556983 556983 11139660 11139660 0Other cattle 56 YES 0 0 Linear 0 Linear 0 0 0 0 0 0Buffalo 55 YES 0 0 Linear 0 Linear 0 0 0 0 0 0Sheep 5 YES 0 0 Linear 0 Linear 0 0 0 0 0 0Swine (Market) 1,5 YES 0 0 Linear 0 Linear 0 0 0 0 0 0Swine (Breeding) 1,5 YES 0 0 Linear 0 Linear 0 0 0 0 0 0Goats 5 YES 0 0 Linear 0 Linear 0 0 0 0 0 0Camels 46 YES 0 0 Linear 0 Linear 0 0 0 0 0 0Camels 46 YES 0 0 Linear 0 Linear 0 0 0 0 0 0User Defined- Specified value ---------------> NO 0 0 Linear 0 Linear 0 0 0 0 0 0User Defined- Specified value ---------------> NO 0 0 Linear 0 Linear 0 0 0 0 0 0
Sub-Total L 556983 556983 556983 11139660 11139660 0PLEASE SPECIFY INFORMATION BELOW IF AVAILABLECountry "Type" Def MAT MATMean Annual Temperature (MAT) in °C Possible 25 22
Methane emissions from manure managementTotal Emission (tCO2eq)
IPCC Specific Default Start Start DifferenceLivestocks: factor factor Factor t0 End Rate End Rate Without With Without WithDairy cattle 1 YES 421000 421000 Linear 421000 Linear 8841 8841 8841 176820 176820 0Other cattle 1 YES 0 0 Linear 0 Linear 0 0 0 0 0 0Buffalo 1 YES 0 0 Linear 0 Linear 0 0 0 0 0 0Sheep 0,15 YES 0 0 Linear 0 Linear 0 0 0 0 0 0Swine (Market) 1 YES 0 0 Linear 0 Linear 0 0 0 0 0 0Swine (Breeding) 1 YES 0 0 Linear 0 Linear 0 0 0 0 0 0Goats 0,17 YES 0 0 Linear 0 Linear 0 0 0 0 0 0Camels 1,92 YES 0 0 Linear 0 Linear 0 0 0 0 0 0Camels 1,92 YES 0 0 Linear 0 Linear 0 0 0 0 0 0User Defined- Specified value ---------------> NO 0 0 Linear 0 Linear 0 0 0 0 0 0User Defined- Specified value ---------------> NO 0 0 Linear 0 Linear 0 0 0 0 0 0
Sub-Total L 8841 8841 8841 176820 176820 0
Nitrous Oxide emissions from manure managementTotal Emission (tCO2eq)
IPCC Specific Default Start Start DifferenceLivestocks: factor factor Factor t0 End Rate End Rate Without With Without WithDairy cattle 0,01 YES 29503,7 29503,7 Linear 29503,7 Linear 143725 143725 143725 2874501 2874501 0,0Other cattle 0,01 YES 0,0 0,0 Linear 0,0 Linear 0 0 0 0 0 0,0Buffalo 0,01 YES 0,0 0,0 Linear 0,0 Linear 0 0 0 0 0 0,0Sheep 0,01 YES 0,0 0,0 Linear 0,0 Linear 0 0 0 0 0 0,0Swine (Market) 0,01 YES 0,0 0,0 Linear 0,0 Linear 0 0 0 0 0 0,0Swine (Breeding) 0,01 YES 0,0 0,0 Linear 0,0 Linear 0 0 0 0 0 0,0Goats 0,01 YES 0,0 0,0 Linear 0,0 Linear 0 0 0 0 0 0,0Camels 0,01 YES 0,0 0,0 Linear 0,0 Linear 0 0 0 0 0 0,0Camels 0,01 YES 0,0 0,0 Linear 0,0 Linear 0 0 0 0 0 0,0User Defined- Specified value ---------------> NO Linear Linear 0 0 0 0 0 0,0User Defined- Specified value ---------------> NO Linear Linear 0 0 0 0 0 0,0see equation 10.30 Sub-Total L 143725,0697 143725,0697 143725,0697 2874501,4 2874501,4 0,0
Additional Technical Mitigation
Percent of head with practices (0% =none;100%=all) Emission (t CO2eq) per year Total Emission (tCO2eq)Start Without Project With Project Start End All Period Difference
Livestocks Dominant Practice* Factor t0 End Rate End Rate Without With Without WithDairy cattle Feeding practices 0,060 12,0% 13,0% Linear 20,0% Linear -4010 -4344 -6684 -85887 -125655 -39769
Specific Agents 0,030 0% 0% Linear 0% Linear 0 0 0 0 0 0Management-Breed 0,020 0% 0% Linear 0% Linear 0 0 0 0 0 0No Option 0,000 88% 87% Linear 80% Linear 0 0 0 0 0 0
Other cattle Feeding practices 0,030 0% 0% Linear 0% Linear 0 0 0 0 0 0Specific Agents 0,020 0% 0% Linear 0% Linear 0 0 0 0 0 0Management-Breed 0,030 0% 0% Linear 0% Linear 0 0 0 0 0 0No Option 0,000 100% 100% Linear 100% Linear 0 0 0 0 0 0
Buffalo Feeding practices 0,045 0% 0% Linear 0% Linear 0 0 0 0 0 0Specific Agents 0,007 0% 0% Linear 0% Linear 0 0 0 0 0 0Management-Breed 0,025 0% 0% Linear 0% Linear 0 0 0 0 0 0No Option 0,000 100% 100% Linear 100% Linear 0 0 0 0 0 0
Sheep Feeding practices 0,020 0% 0% Linear 0% Linear 0 0 0 0 0 0Specific Agents 0,001 0% 0% Linear 0% Linear 0 0 0 0 0 0Management-Breed 0,002 0% 0% Linear 0% Linear 0 0 0 0 0 0No Option 0,000 100% 100% Linear 100% Linear 0 0 0 0 0 0
Sub-Total L -4010 -4344 -6684 -85887 -125655 -39769
Total "Livestocks" 14105095 14065326 -39769
All PeriodEmission (t CO2eq) per year
EndHead Number
With ProjectWithout Project
All Period
Annual amount of N manure* (t N per year) Emission (t CO2eq) per yearAll Period
Without Project With Project
Without Project With Project End
Back to Description
Emission (t CO2eq) per yearEnd
Head Number
Developing22

Estimating mitigation potential of agricultural projects: An application of the EX-Ante Carbon-balance Tool (EX-ACT) in Brazil
94
Other GHG Emissions (not related to change in carbon pools)
Carbon dioxide emissions from Lime application Dynamic FactorsTotal Emission (tCO2eq) Immediate 1
Type of lime IPCC Specific Default Start Start Difference Exponential 0,78factor factor Factor t0 End Rate End Rate Without With Without With Linear 0,5
Limestone 0,12 YES 73,6 126,6 Linear 146,4 Linear 8,832 15,192 17,568 285 325 40Dolomite 0,13 YES 110,3 84,4 Linear 97,6 Linear 14,339 10,972 12,688 230 259 29Not precised 0,125 YES 0 0 Linear 0 Linear 0 0 0 0 0 0
Sub-Total I-1 23,171 26,164 30,256 514,3 583,9 70
Carbon dioxide emissions from Urea applicationTotal Emission (tCO2eq)
IPCC Specific Default Start Start Differencefactor factor Factor t0 End Rate End Rate Without With Without With
Urea 0,2 YES 45,4 50,9 Linear 72,6 Linear 9,08 10,18 14,52 200 274 74Sub-Total I-2 9,08 10,18 14,52 200,3 274,1 74
N2O emissions from N application on managed soils (except manure management see Livestock Module)Amount of N Applied (t per year) Total Emission (tCO2eq)
Type of input IPCC Specific Default Start Start Differencefactor factor Factor t0 End Rate 0 Rate Without With Without With
Urea 0,01 YES 21,2 23,8 Linear 33,9 Linear 65,7 73,6 105,0 1449 1983 534N Fertiliser (other than Urea) 0,01 YES 6,8 7,7 Linear 10,9 Linear 21,1 23,9 33,8 469 638 169N Fertiliser in non-upland Rice* 0,003 YES 0 0 Linear 0 Linear 0,0 0,0 0,0 0 0 0Sewage 0,01 YES 0 0 Linear 0 Linear 0,0 0,0 0,0 0 0 0Compost 0,01 YES 0 0 Linear 0 Linear 0,0 0,0 0,0 0 0 0*N fertilizer from upland rice should be included above (N fertilizer) Sub-Total I-3 86,8 97,5 138,8 # 1917,9 2620,2 702
CO2 equivalent emissions from production, transportation, storage and transfer of agricultural chemicalsAmount in tonnes of product (active ingrediente for Pesticides)
Type of input** Default Specific Default Start Start Differencefactor* factor Factor t0 End Rate End Rate Without With Without With
Urea 4,8 YES 21,2 23,8 Linear 33,9 Linear 101,0 113,2 161,5 2228 3048 821N Fertiliser (other than Urea) 4,8 YES 6,8 7,7 Linear 10,9 Linear 32,4 36,7 52,0 721 981 259N Fertiliser in non-upland Rice* 4,8 YES 0 0 Linear 0 Linear 0,0 0,0 0,0 0 0 0Phosphorus synthetic fertilizer 0,7 YES 26,8 30,6 Linear 37,9 Linear 19,7 22,4 27,8 440 531 91Potassium synthetic fertilizer 0,6 YES 50,9 57,8 Linear 73,8 Linear 28,0 31,8 40,6 624 774 150Limestone (Lime) 0,6 YES 73,6 126,6 Linear 146,4 Linear 43,2 74,3 85,9 1392 1590 197Dolomite (Lime) 0,6 YES 110,3 84,4 Linear 97,6 Linear 64,7 49,5 57,3 1036 1168 132Generic Lime 0,6 YES 0 0 Linear 0 Linear 0,0 0,0 0,0 0 0 0Herbicides (Pesticides) 23,1 YES 0 0 Linear 0 Linear 0,0 0,0 0,0 0 0 0Insecticides (Pesticides) 18,7 YES 0 0 Linear 0 Linear 0,0 0,0 0,0 0 0 0Fungicides (Pesticides) 14,3 YES 0 0 Linear 0 Linear 0,0 0,0 0,0 0 0 0* from Lal (2004) Table 5 - central value -tCO2/t product Sub-Total I-4 288,9 327,9 425,0 6441,9 8091,5 1650** tonnes of N, P2O5, K2O and CaCO3
Total "Inputs" 9074,3 11569,6 2495
Back to Description
Without Project With Project End
Emission (t CO2eq) per year
Emission (t CO2eq) per yearEnd
Total Emission
Without Project With Project End
Amount of Urea in tonnes per year Emission (t CO2eq) per yearWithout Project With Project End
Without Project With ProjectAmount of Lime in tonnes per year
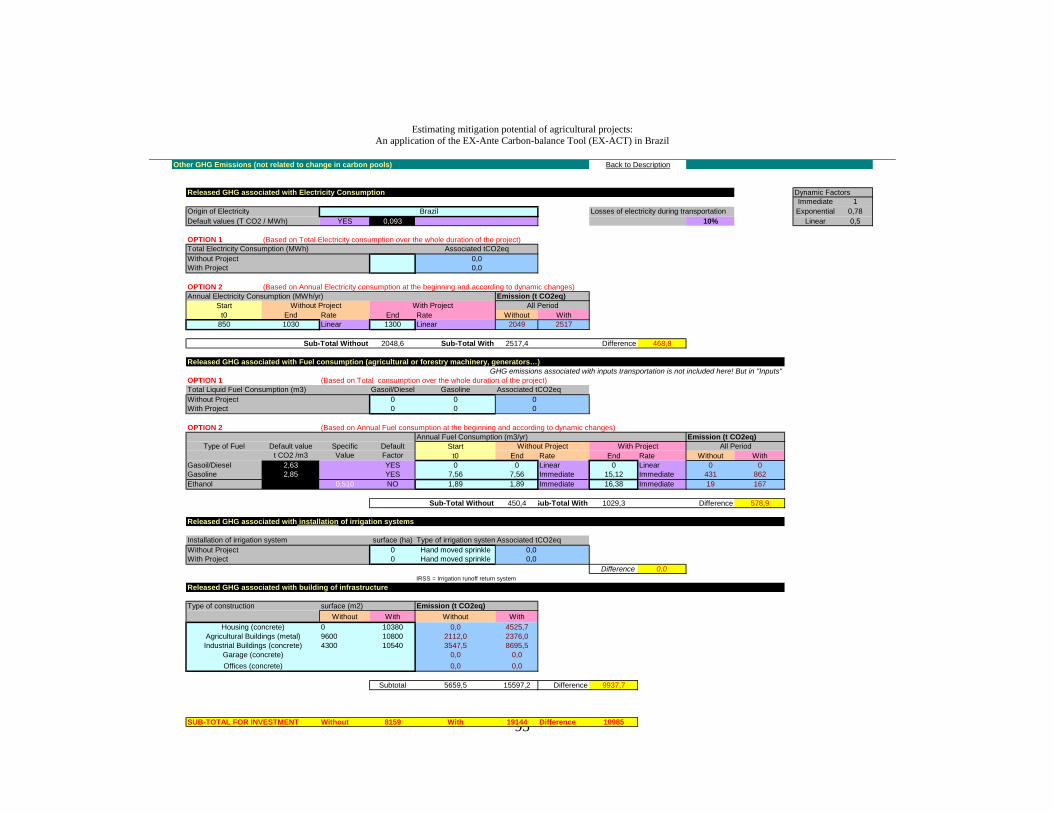
Estimating mitigation potential of agricultural projects: An application of the EX-Ante Carbon-balance Tool (EX-ACT) in Brazil
95
Other GHG Emissions (not related to change in carbon pools)
Released GHG associated with Electricity Consumption Dynamic FactorsImmediate 1
Origin of Electricity Losses of electricity during transportation Exponential 0,78Default values (T CO2 / MWh) YES 0,093 10% Linear 0,5
OPTION 1 (Based on Total Electricity consumption over the whole duration of the project)Total Electricity Consumption (MWh)Without ProjectWith Project
OPTION 2 (Based on Annual Electricity consumption at the beginning and according to dynamic changes)Annual Electricity Consumption (MWh/yr) Emission (t CO2eq)
Startt0 End Rate End Rate Without With
850 1030 Linear 1300 Linear 2049 2517
Sub-Total Without 2048,6 Sub-Total With 2517,4 Difference 468,8
Released GHG associated with Fuel consumption (agricultural or forestry machinery, generators…)GHG emissions associated with inputs transportation is not included here! But in "Inputs"
OPTION 1 (Based on Total consumption over the whole duration of the project)Total Liquid Fuel Consumption (m3) Gasoil/Diesel Gasoline Associated tCO2eqWithout Project 0 0 0With Project 0 0 0
OPTION 2 (Based on Annual Fuel consumption at the beginning and according to dynamic changes)Annual Fuel Consumption (m3/yr) Emission (t CO2eq)
Type of Fuel Default value Specific Default Startt CO2 /m3 Value Factor t0 End Rate End Rate Without With
Gasoil/Diesel 2,63 YES 0 0 Linear 0 Linear 0 0Gasoline 2,85 YES 7,56 7,56 Immediate 15,12 Immediate 431 862Ethanol 0,510 NO 1,89 1,89 Immediate 16,38 Immediate 19 167
Sub-Total Without 450,4 Sub-Total With 1029,3 Difference 578,9
Released GHG associated with installation of irrigation systems
Installation of irrigation system surface (ha) Type of irrigation systemAssociated tCO2eqWithout Project 0 Hand moved sprinkle 0,0With Project 0 Hand moved sprinkle 0,0
Difference 0,0IRSS = Irrigation runoff return system
Released GHG associated with building of infrastructure
Type of construction surface (m2) Emission (t CO2eq)
Without With Without With0 10380 0,0 4525,79600 10800 2112,0 2376,04300 10540 3547,5 8695,5
0,0 0,0
0,0 0,0
Subtotal 5659,5 15597,2 Difference 9937,7
SUB-TOTAL FOR INVESTMENT Without 8159 With 19144 Difference 10985
With Project
Without Project With Project All Period
All Period
Back to Description
Associated tCO2eq0,00,0
Brazil
Without Project
Garage (concrete)
Offices (concrete)
Housing (concrete)Agricultural Buildings (metal)Industrial Buildings (concrete)

Estimating mitigation potential of agricultural projects: An application of the EX-Ante Carbon-balance Tool (EX-ACT) in Brazil
96
Project Summary Area (Initial state in ha)Name Rio Rural Forest/Plantation 6,2
Annual 225104 Implementat 6Continent South America Cropland Perennial 0 Capitalisatio 14
Rice 0 Total 20Climate Tropical Moist Grassland 691
Other Land Degraded 2010Dominante Soil TLAC Soils Other 0 Total Area 227811,2
N2O CH4 Per phase of the projectBiomass Soil Implement. Capital. Total Implement. Capital.
-4302 this is a sink -4302 0 0 0 -4302 0 -215 -717 0-517166 this is a sink -428062 -89311 118 88 -98206 -418960 -25858 -16368 -29926-114412 this is a sink -6453 -107958 0 0 -25505 -88907 -5721 -4251 -6350
-18334 this is a sink 0 25488 -12129 -31693 -3235 -15099 -917 -539 -1078-152845 this is a sink -139755 -13090 0 0 -23485 -129360 -7642 -3914 -9240
0 0 0 0 0 0 0 0 0 0-19437 this is a sink 0 -19437 0 0 -3430 -16007 -972 -572 -1143
-39769 this is a sink 0 -39769 -7018 -32751 -1988 -1170 -23392495 this is a source 702 --- 395 2101 125 66 150
10985 this is a source --- --- 8159 19144 549 1360 1367
Final Balance -852784 It is a sink -565794 -204308 -11309 -71374 -156629 -679838 -42639 -26105 -48560
Result per ha -3,7 -2,5 -0,9 0,0 -0,3 -0,7 -3,0 -0,19 -0,1 -0,2
Components of the Project
Other GHG EmissionsLivestock
Inputs
Deforestation Afforestation and ReforestationOther Land Use ChangeAgriculture
Project Investment
Annual CropsAgroforestry/Perennial Crops
Rice Grassland
10985
All GHG in tCO2eqBalance (Project - Baseline)
Duration of theProject (years)
Mean per year
CO2 (other)---
1793
CO2
-600000
-500000
-400000
-300000
-200000
-100000
0
100000
Deforestation Afforestation andReforestation
Other Land UseChange
Annual CropsAgroforestry/PerennialCrops
Rice Grassland Livestock Inputs Project Investment

Estimating mitigation potential of agricultural projects: An application of the EX-Ante Carbon-balance Tool (EX-ACT) in Brazil
97
For further information, please contact:
Chief, Latin America, the Caribbean, East Asia and the Pacific Service
FAO Investment Centre Division tel +39 06 57053196 – fax +39 06 57054657
Or visit the Centre’s web site: www.fao.org/tc/tci/