Embed Size (px)
Citation preview
Michael J. Schwaebe PE, BBEC 760 753 7752 [email protected] 1
Mitigation of Dirty Electricity from Solar Inverters
Capacitive Parallel Filters Don’t Do the Job
SV roof mounted panels in Trabuco Canyon CA. Main array faces SSW and 3 other arrays WSW.
Abstract: This paper shows that solar inverters create dirty electricity and shows that Stetzer filters
do not mitigate this and can make matters worse. This is illustrated by oscilloscope measurements of
electrical system properties and ambient EMR from dirty electricity with the solar system running and
off along with different filter configurations. This paper also illustrates the effectiveness of the DNA
line filters in removing the dirty electricity caused by solar inverter operation.
Michael J. Schwaebe PE, BBEC 760 753 7752 [email protected] 2
Mitigation of Dirty Electricity from Solar Inverter with DNA Line Filter
Table of Contents Abstract:......................................................................................................................................................... 1
1.0 Introduction .............................................................................................................................................. 3
2.0 Electrical system modifications ................................................................................................................. 3
3.0 Measurements ......................................................................................................................................... 3
4.0 House Electrical System Observationsatta ............................................................................................... 4
4.1 Electric system “as found” conditions: ...................................................................................................... 4
4.2 DNA Line Filter Performance:................................................................................................................... 6
4.2.1 Waveforms ............................................................................................................................................ 6
4.2.2 Spectrums ............................................................................................................................................. 8
5.0 Electromagnetic radiation in a bedroom: .................................................................................................. 9
5.1 Oscilloscope EMR waveforms .................................................................................................................. 9
5.2 Oscilloscope EMR spectrums................................................................................................................. 11
5.3 Broadband EMR measurements ............................................................................................................ 13
6.0 Lessons Learned.................................................................................................................................... 14
7.0 Attachments: .......................................................................................................................................... 15
7.1 Instrument List ....................................................................................................................................... 16
7.2 Michael Schwaebe Short Bio ................................................................................................................. 18
Michael J. Schwaebe PE, BBEC 760 753 7752 [email protected] 3
1.0 Introduction
Alex works as a fireman for Los Angeles. He thought that getting a solar voltaic system for his home
was the right thing to do. After the system was installed and running, he would be off duty several
days in a row and find himself discomforted in his home and not knowing why. He did some detective
work and reasoned that the only new thing going on was the solar system. When he turned the solar
system off, he felt better. He did research on the Internet, talked to people and learned about dirty
electricity. He decided to try the Stetzer filters in his home. 21 Stetzer filters placed within the home
according to the Stetzer guidelines didn’t bring him comfort, even though the dirty electricity readings
were substantially lowered. He was advised by David Stetzer to place the filters as close to the
inverters as possible. So he had an electrician install receptacles at the inverters and he added
another 19 filters on power strips there. The level of dirty electricity as indicated on the Stetzer meter
decreased with all of the filters. However his comfort level was not improved.
This paper shows the dirty electricity conditions found with and without the Stetzer filters as voltage
and current in the wires and as magnetic and electric fields (electromagnetic radiation (EMR)) within
the home. The measurements show that parallel filters can make matters worse. Alex actually felt
better during a phase in the testing where the solar inverters were running and all filters were
removed. This paper also illustrates the effectiveness of the DNA line filters in removing the dirty
electricity caused by solar inverter operation.
2.0 Electrical system modifications
A receptacle box with dedicated circuits for each phase was installed adjacent to the power panel.
This change was made to facilitate measurements and the addition of parallel filters if needed.
There are two inverters in the solar system. The output of the inverters was routed to a new subpanel
next to the inverters in order to facilitate proper protection of the individual inverters along with a
common feed to each of the single phase DNA line filters.
DNA line filters were installed between the new subpanel and the solar disconnect switch located
near the power panel outside the garage. See figure 7 below.
3.0 Measurements
Electrical system properties including dirty electricity were measured using a laptop oscilloscope. The
oscilloscope was connected to the electrical system using an active differential probe for voltage, and
a clamp on amp meter for current.
The dirty electricity as ambient electromagnetic radiation (EMR) within the home was measured using
magnetic and electric field meters. The AC output of the meters (as B-field and E-field and frequency)
was utilized as input to the laptop oscilloscope. EMR was also recorded in a data logger and
broadband 2 KHz was manually logged.
Screen prints of the oscilloscope were saved in order to document the different conditions.
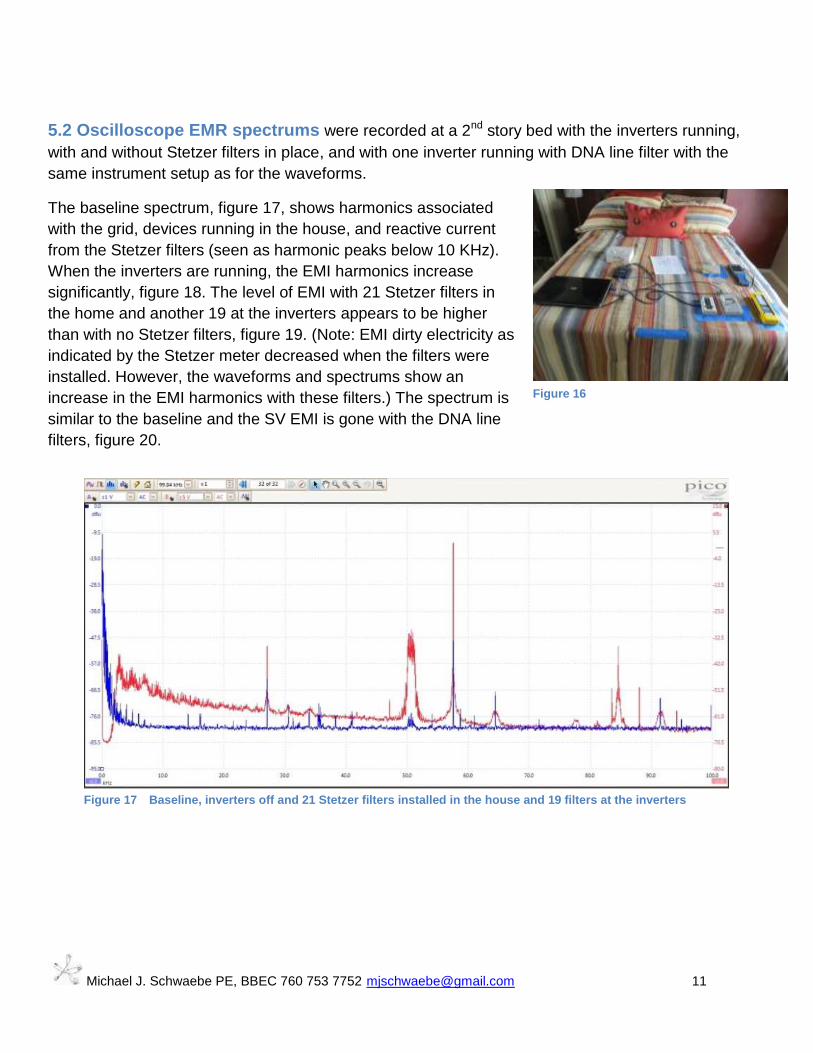
An instrument list is provided in attachment 1. Instrument set ups are shown in figures 1, 2, 8, 16 &
21.
Michael J. Schwaebe PE, BBEC 760 753 7752 [email protected] 4
4.0 House Electrical System Observations
4.1 Electric system “as found” conditions:
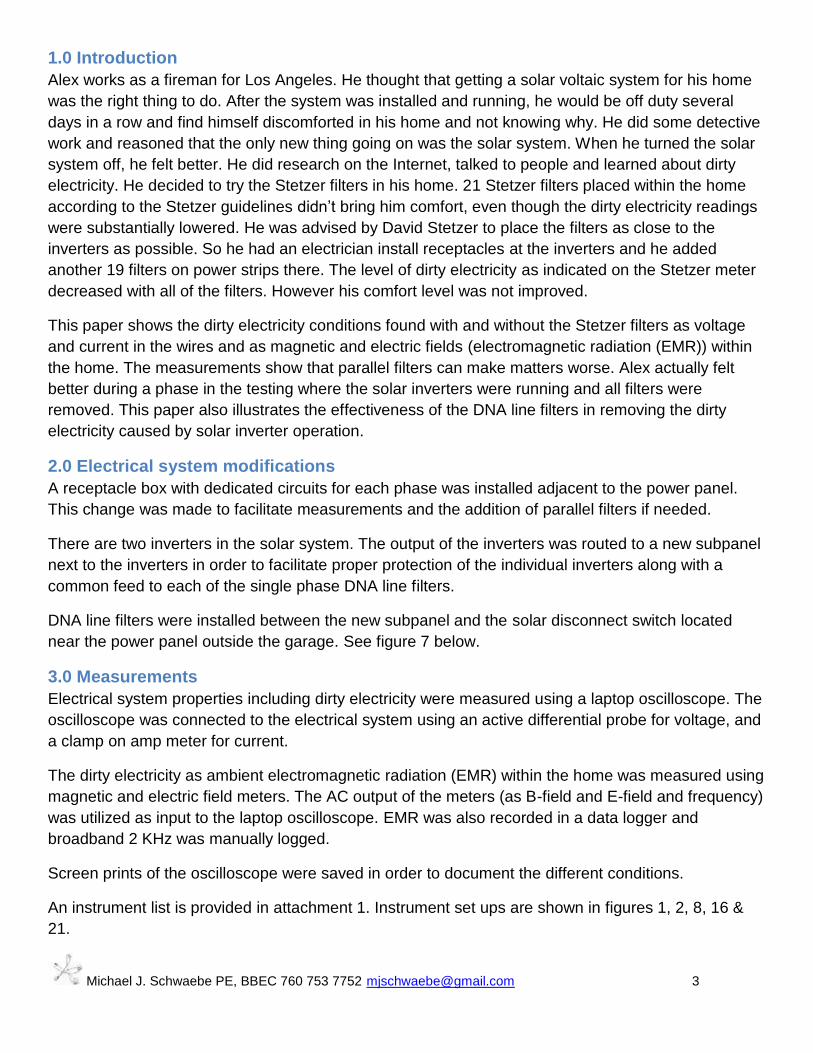
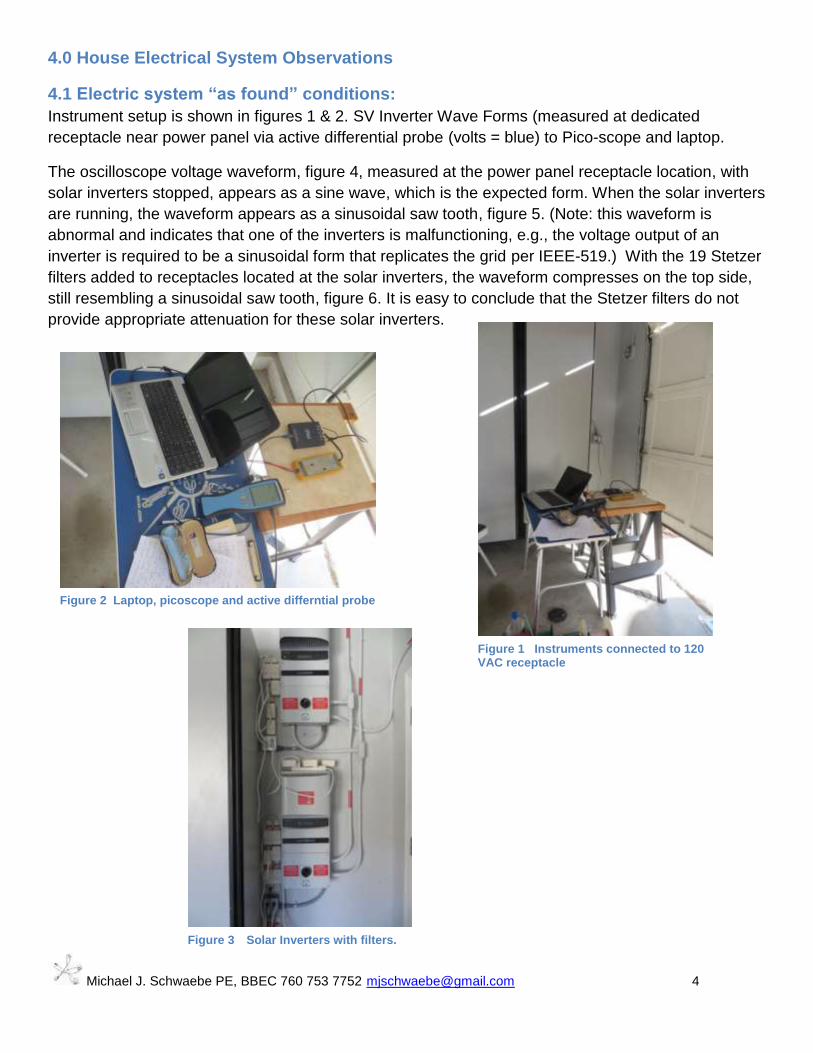
Instrument setup is shown in figures 1 & 2. SV Inverter Wave Forms (measured at dedicated
receptacle near power panel via active differential probe (volts = blue) to Pico-scope and laptop.
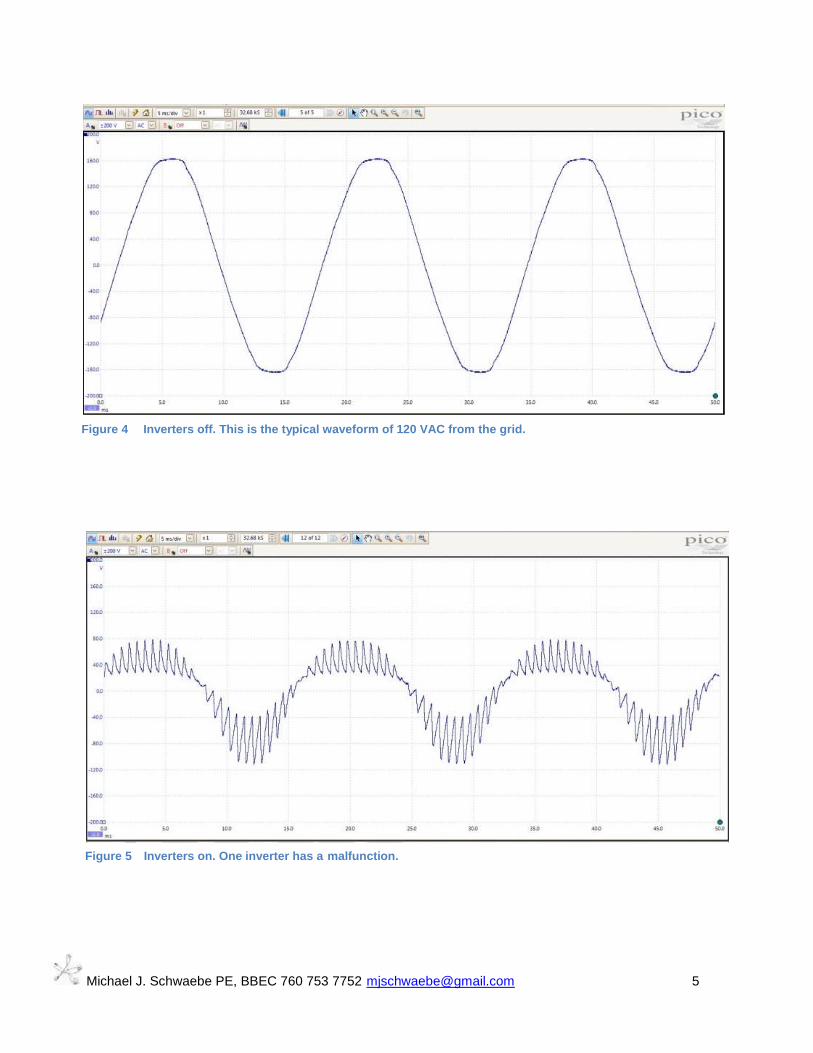
The oscilloscope voltage waveform, figure 4, measured at the power panel receptacle location, with
solar inverters stopped, appears as a sine wave, which is the expected form. When the solar inverters
are running, the waveform appears as a sinusoidal saw tooth, figure 5. (Note: this waveform is
abnormal and indicates that one of the inverters is malfunctioning, e.g., the voltage output of an
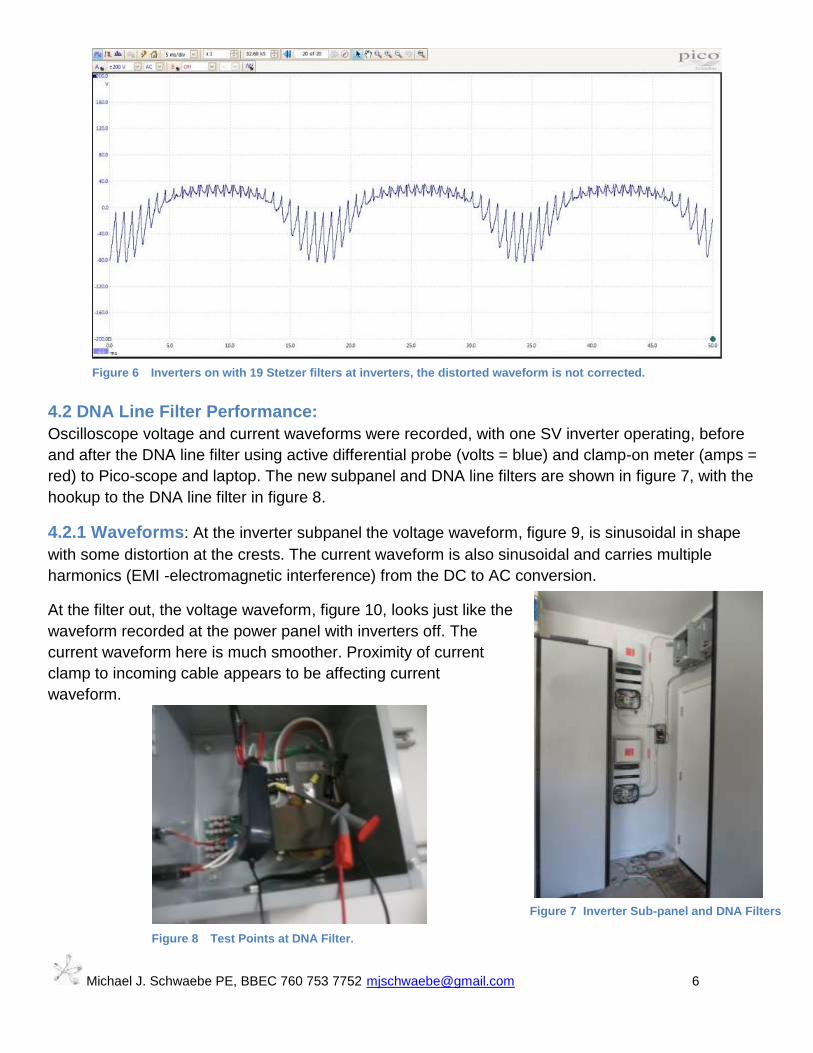
inverter is required to be a sinusoidal form that replicates the grid per IEEE-519.) With the 19 Stetzer
filters added to receptacles located at the solar inverters, the waveform compresses on the top side,
still resembling a sinusoidal saw tooth, figure 6. It is easy to conclude that the Stetzer filters do not
provide appropriate attenuation for these solar inverters.
Figure 1 Instruments connected to 120 VAC receptacle
Figure 2 Laptop, picoscope and active differntial probe
Figure 3 Solar Inverters with filters.
Michael J. Schwaebe PE, BBEC 760 753 7752 [email protected] 5
Figure 4 Inverters off. This is the typical waveform of 120 VAC from the grid.
Figure 5 Inverters on. One inverter has a malfunction.
Michael J. Schwaebe PE, BBEC 760 753 7752 [email protected] 6
4.2 DNA Line Filter Performance:
Oscilloscope voltage and current waveforms were recorded, with one SV inverter operating, before
and after the DNA line filter using active differential probe (volts = blue) and clamp-on meter (amps =
red) to Pico-scope and laptop. The new subpanel and DNA line filters are shown in figure 7, with the
hookup to the DNA line filter in figure 8.
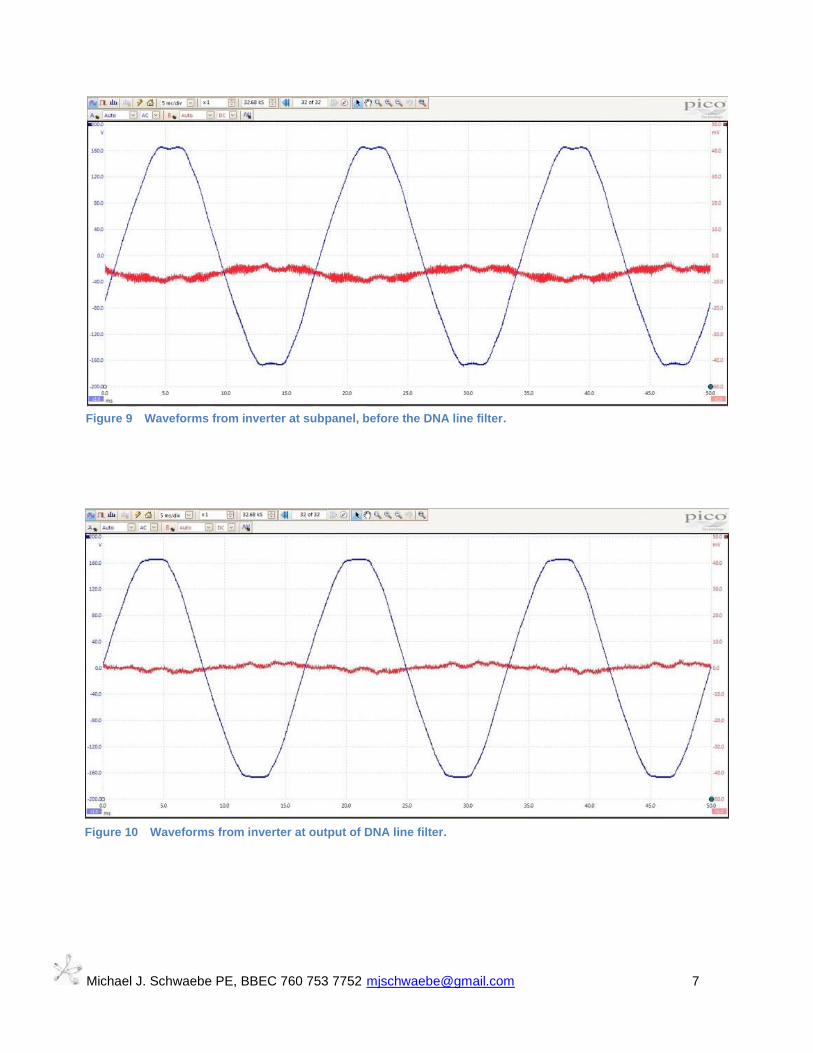
4.2.1 Waveforms: At the inverter subpanel the voltage waveform, figure 9, is sinusoidal in shape
with some distortion at the crests. The current waveform is also sinusoidal and carries multiple
harmonics (EMI -electromagnetic interference) from the DC to AC conversion.
At the filter out, the voltage waveform, figure 10, looks just like the
waveform recorded at the power panel with inverters off. The
current waveform here is much smoother. Proximity of current
clamp to incoming cable appears to be affecting current
waveform.
Figure 6 Inverters on with 19 Stetzer filters at inverters, the distorted waveform is not corrected.
Figure 7 Inverter Sub-panel and DNA Filters
Figure 8 Test Points at DNA Filter.
Michael J. Schwaebe PE, BBEC 760 753 7752 [email protected] 7
Figure 10 Waveforms from inverter at output of DNA line filter.
Figure 9 Waveforms from inverter at subpanel, before the DNA line filter.
Michael J. Schwaebe PE, BBEC 760 753 7752 [email protected] 8
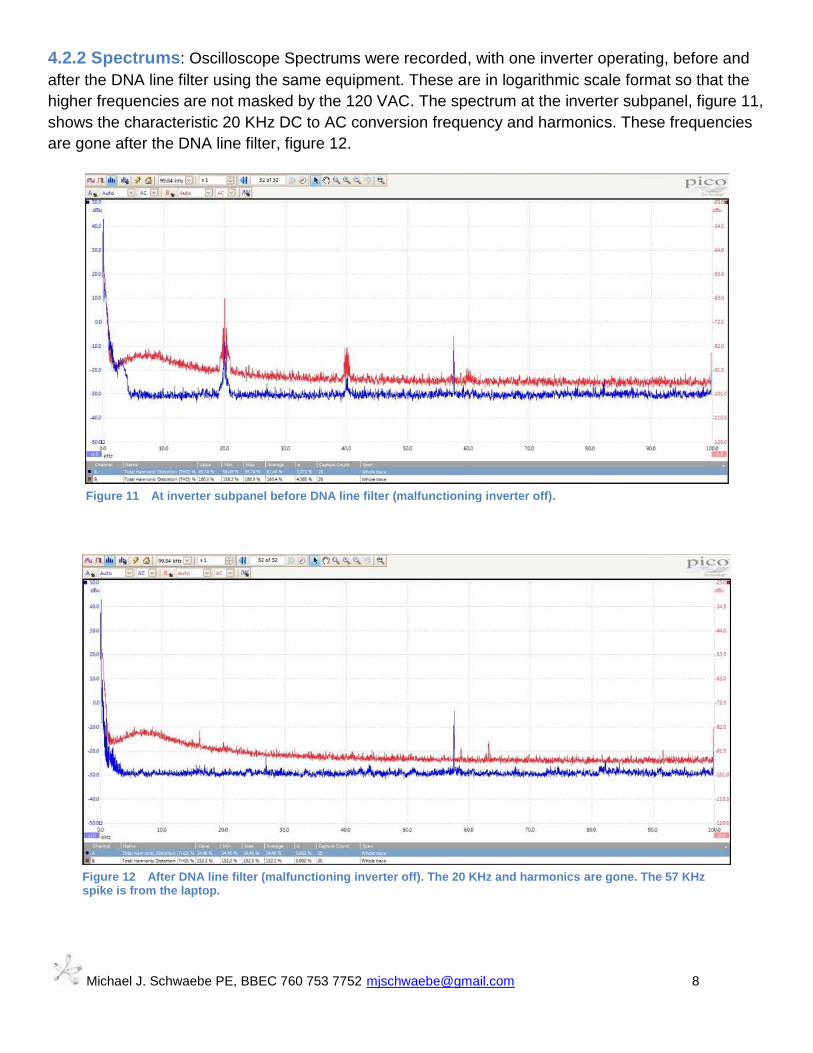
4.2.2 Spectrums: Oscilloscope Spectrums were recorded, with one inverter operating, before and
after the DNA line filter using the same equipment. These are in logarithmic scale format so that the
higher frequencies are not masked by the 120 VAC. The spectrum at the inverter subpanel, figure 11,
shows the characteristic 20 KHz DC to AC conversion frequency and harmonics. These frequencies
are gone after the DNA line filter, figure 12.
Figure 11 At inverter subpanel before DNA line filter (malfunctioning inverter off).
Figure 12 After DNA line filter (malfunctioning inverter off). The 20 KHz and harmonics are gone. The 57 KHz spike is from the laptop.
Michael J. Schwaebe PE, BBEC 760 753 7752 [email protected] 9
5.0 Electromagnetic radiation in a bedroom:
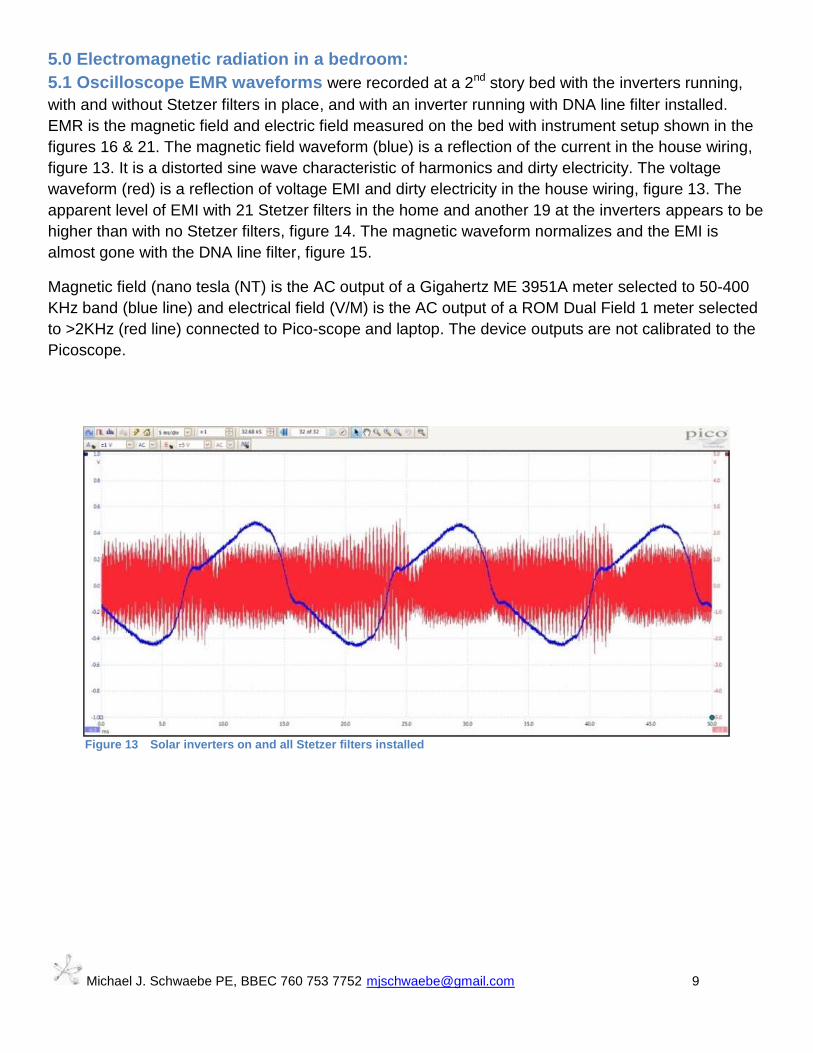
5.1 Oscilloscope EMR waveforms were recorded at a 2nd story bed with the inverters running,
with and without Stetzer filters in place, and with an inverter running with DNA line filter installed.
EMR is the magnetic field and electric field measured on the bed with instrument setup shown in the
figures 16 & 21. The magnetic field waveform (blue) is a reflection of the current in the house wiring,
figure 13. It is a distorted sine wave characteristic of harmonics and dirty electricity. The voltage
waveform (red) is a reflection of voltage EMI and dirty electricity in the house wiring, figure 13. The
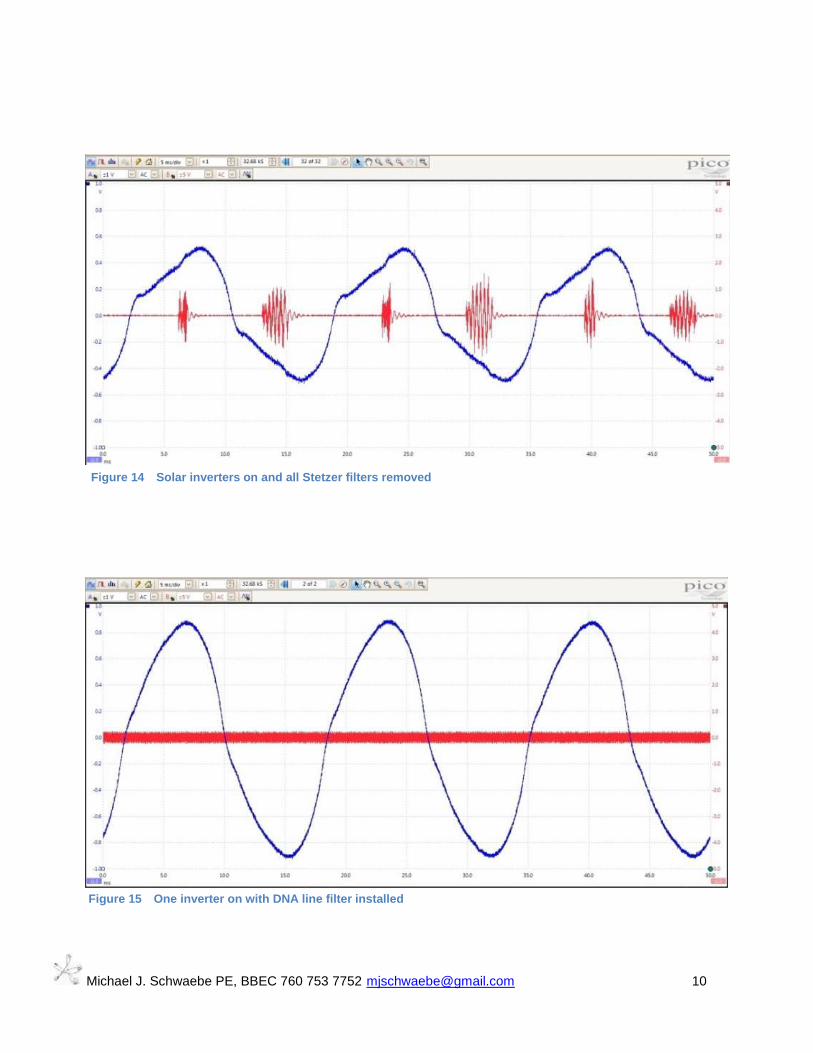
apparent level of EMI with 21 Stetzer filters in the home and another 19 at the inverters appears to be
higher than with no Stetzer filters, figure 14. The magnetic waveform normalizes and the EMI is
almost gone with the DNA line filter, figure 15.
Magnetic field (nano tesla (NT) is the AC output of a Gigahertz ME 3951A meter selected to 50-400
KHz band (blue line) and electrical field (V/M) is the AC output of a ROM Dual Field 1 meter selected
to >2KHz (red line) connected to Pico-scope and laptop. The device outputs are not calibrated to the
Picoscope.
Figure 13 Solar inverters on and all Stetzer filters installed
Michael J. Schwaebe PE, BBEC 760 753 7752 [email protected] 10
Figure 14 Solar inverters on and all Stetzer filters removed
Figure 15 One inverter on with DNA line filter installed
Michael J. Schwaebe PE, BBEC 760 753 7752 [email protected] 11
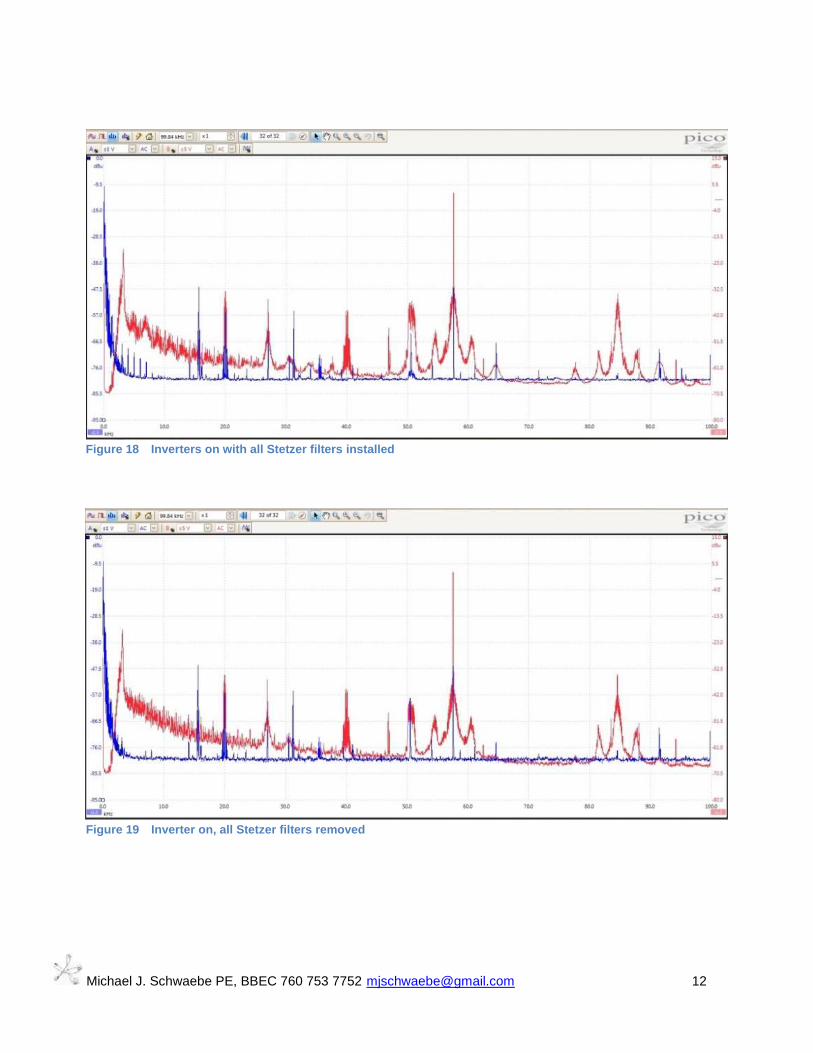
5.2 Oscilloscope EMR spectrums were recorded at a 2nd story bed with the inverters running,
with and without Stetzer filters in place, and with one inverter running with DNA line filter with the
same instrument setup as for the waveforms.
The baseline spectrum, figure 17, shows harmonics associated
with the grid, devices running in the house, and reactive current
from the Stetzer filters (seen as harmonic peaks below 10 KHz).
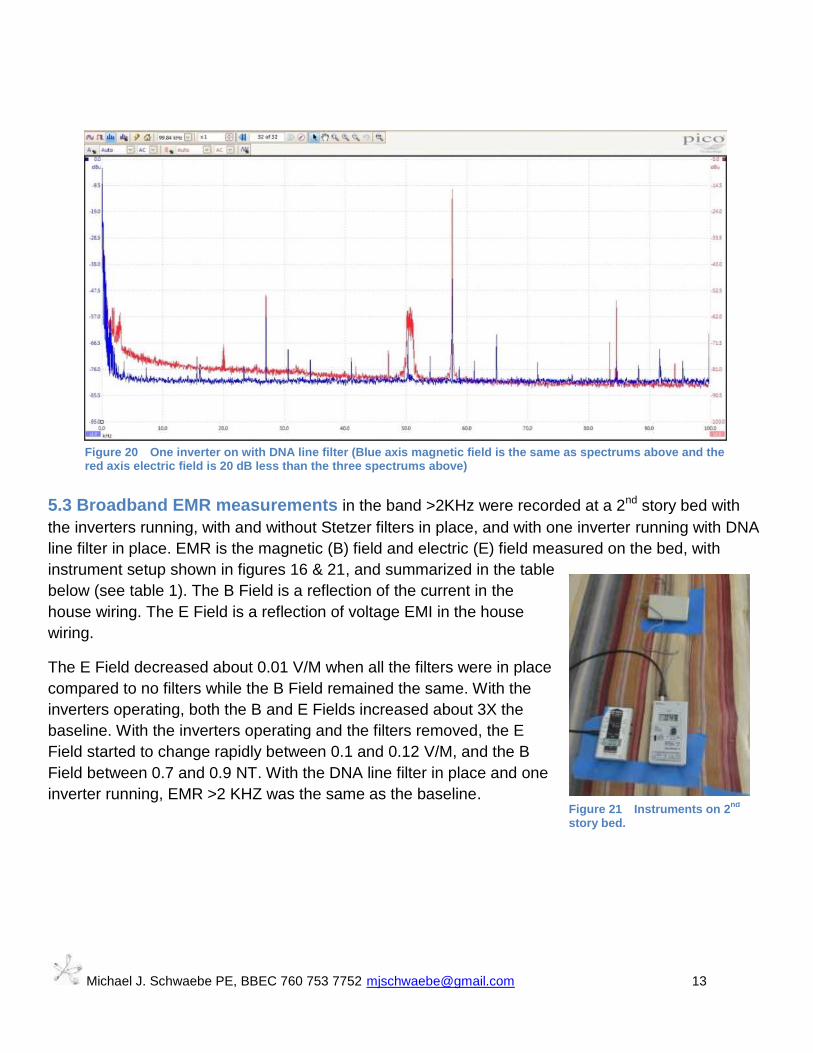
When the inverters are running, the EMI harmonics increase
significantly, figure 18. The level of EMI with 21 Stetzer filters in
the home and another 19 at the inverters appears to be higher
than with no Stetzer filters, figure 19. (Note: EMI dirty electricity as
indicated by the Stetzer meter decreased when the filters were
installed. However, the waveforms and spectrums show an
increase in the EMI harmonics with these filters.) The spectrum is
similar to the baseline and the SV EMI is gone with the DNA line
filters, figure 20.
Figure 17 Baseline, inverters off and 21 Stetzer filters installed in the house and 19 filters at the inverters
Figure 16
Michael J. Schwaebe PE, BBEC 760 753 7752 [email protected] 12
Figure 18 Inverters on with all Stetzer filters installed
Figure 19 Inverter on, all Stetzer filters removed
Michael J. Schwaebe PE, BBEC 760 753 7752 [email protected] 13
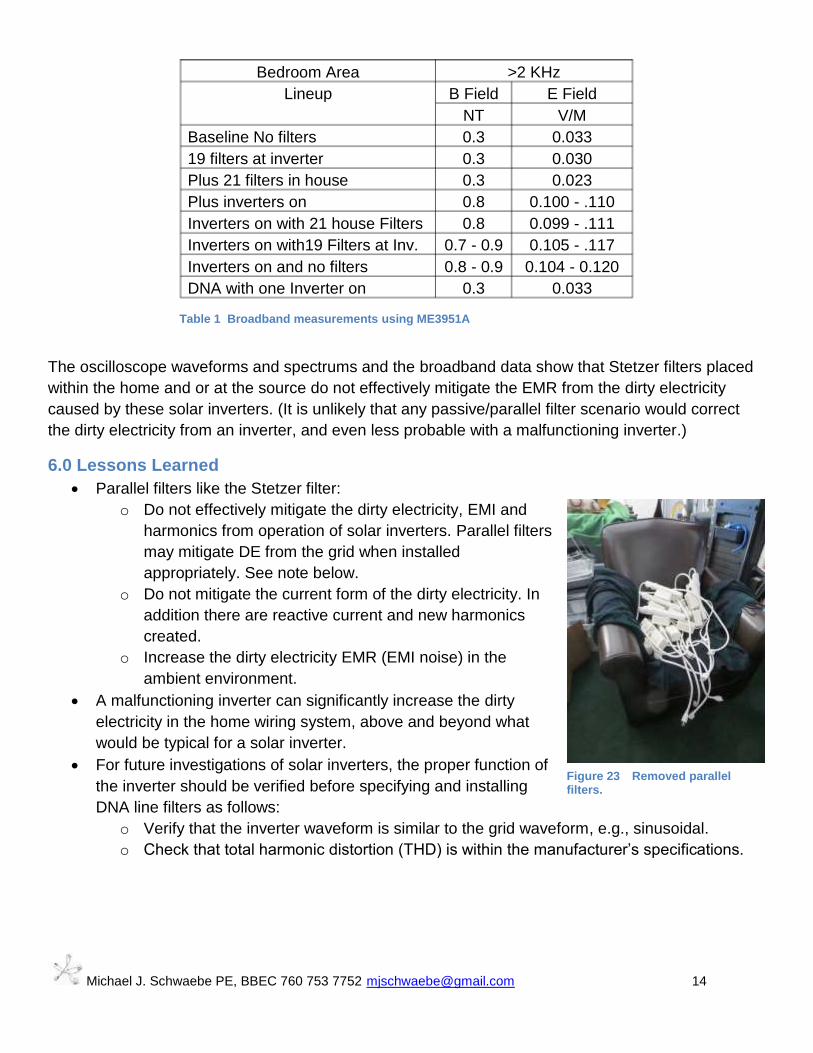
5.3 Broadband EMR measurements in the band >2KHz were recorded at a 2nd story bed with
the inverters running, with and without Stetzer filters in place, and with one inverter running with DNA
line filter in place. EMR is the magnetic (B) field and electric (E) field measured on the bed, with
instrument setup shown in figures 16 & 21, and summarized in the table
below (see table 1). The B Field is a reflection of the current in the
house wiring. The E Field is a reflection of voltage EMI in the house
wiring.
The E Field decreased about 0.01 V/M when all the filters were in place
compared to no filters while the B Field remained the same. With the
inverters operating, both the B and E Fields increased about 3X the
baseline. With the inverters operating and the filters removed, the E
Field started to change rapidly between 0.1 and 0.12 V/M, and the B
Field between 0.7 and 0.9 NT. With the DNA line filter in place and one
inverter running, EMR >2 KHZ was the same as the baseline.
Figure 20 One inverter on with DNA line filter (Blue axis magnetic field is the same as spectrums above and the red axis electric field is 20 dB less than the three spectrums above)
Figure 21 Instruments on 2nd
story bed.
Michael J. Schwaebe PE, BBEC 760 753 7752 [email protected] 14
The oscilloscope waveforms and spectrums and the broadband data show that Stetzer filters placed
within the home and or at the source do not effectively mitigate the EMR from the dirty electricity
caused by these solar inverters. (It is unlikely that any passive/parallel filter scenario would correct
the dirty electricity from an inverter, and even less probable with a malfunctioning inverter.)
6.0 Lessons Learned
Parallel filters like the Stetzer filter:
o Do not effectively mitigate the dirty electricity, EMI and
harmonics from operation of solar inverters. Parallel filters
may mitigate DE from the grid when installed
appropriately. See note below.
o Do not mitigate the current form of the dirty electricity. In
addition there are reactive current and new harmonics
created.
o Increase the dirty electricity EMR (EMI noise) in the
ambient environment.
A malfunctioning inverter can significantly increase the dirty
electricity in the home wiring system, above and beyond what
would be typical for a solar inverter.
For future investigations of solar inverters, the proper function of
the inverter should be verified before specifying and installing
DNA line filters as follows:
o Verify that the inverter waveform is similar to the grid waveform, e.g., sinusoidal.
o Check that total harmonic distortion (THD) is within the manufacturer’s specifications.
Figure 23 Removed parallel filters.
Bedroom Area >2 KHz
Lineup B Field E Field
NT V/M
Baseline No filters 0.3 0.033
19 filters at inverter 0.3 0.030
Plus 21 filters in house 0.3 0.023
Plus inverters on 0.8 0.100 - .110
Inverters on with 21 house Filters 0.8 0.099 - .111
Inverters on with19 Filters at Inv. 0.7 - 0.9 0.105 - .117
Inverters on and no filters 0.8 - 0.9 0.104 - 0.120
DNA with one Inverter on 0.3 0.033
Table 1 Broadband measurements using ME3951A
Michael J. Schwaebe PE, BBEC 760 753 7752 [email protected] 15
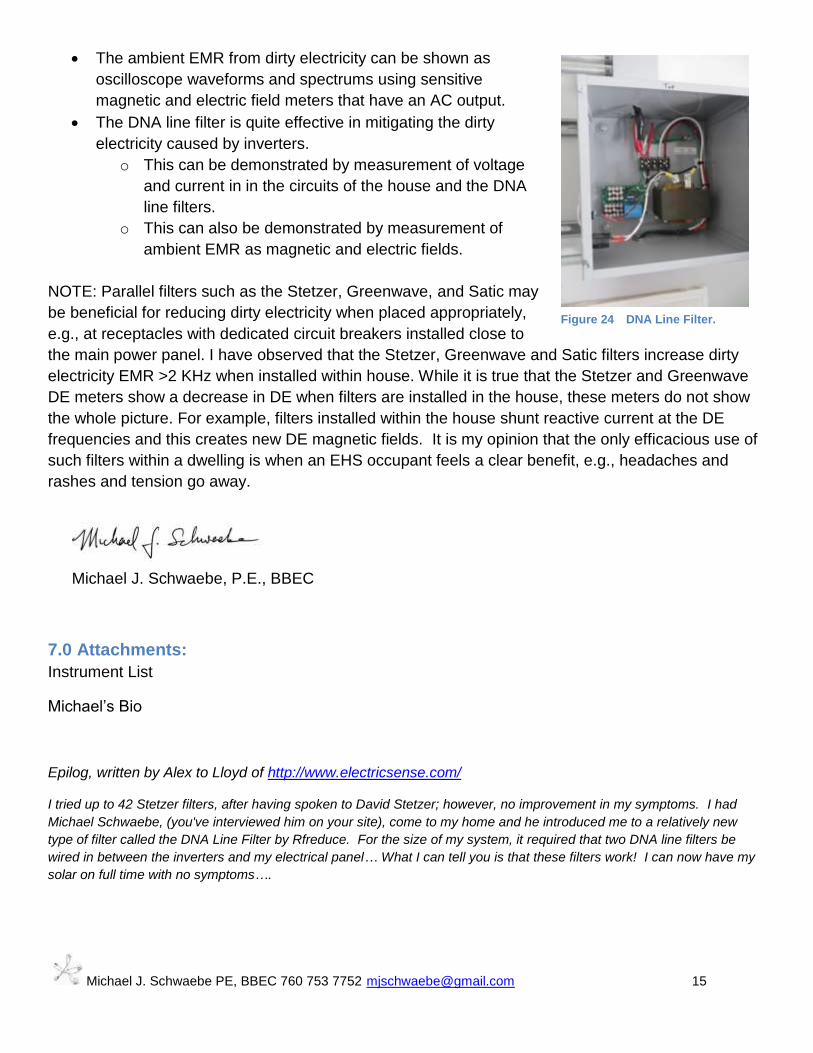
Figure 24 DNA Line Filter.
The ambient EMR from dirty electricity can be shown as
oscilloscope waveforms and spectrums using sensitive
magnetic and electric field meters that have an AC output.
The DNA line filter is quite effective in mitigating the dirty
electricity caused by inverters.
o This can be demonstrated by measurement of voltage
and current in in the circuits of the house and the DNA
line filters.
o This can also be demonstrated by measurement of
ambient EMR as magnetic and electric fields.
NOTE: Parallel filters such as the Stetzer, Greenwave, and Satic may
be beneficial for reducing dirty electricity when placed appropriately,
e.g., at receptacles with dedicated circuit breakers installed close to
the main power panel. I have observed that the Stetzer, Greenwave and Satic filters increase dirty
electricity EMR >2 KHz when installed within house. While it is true that the Stetzer and Greenwave
DE meters show a decrease in DE when filters are installed in the house, these meters do not show
the whole picture. For example, filters installed within the house shunt reactive current at the DE
frequencies and this creates new DE magnetic fields. It is my opinion that the only efficacious use of
such filters within a dwelling is when an EHS occupant feels a clear benefit, e.g., headaches and
rashes and tension go away.
Michael J. Schwaebe, P.E., BBEC
7.0 Attachments:
Instrument List
Michael’s Bio
Epilog, written by Alex to Lloyd of http://www.electricsense.com/
I tried up to 42 Stetzer filters, after having spoken to David Stetzer; however, no improvement in my symptoms. I had
Michael Schwaebe, (you've interviewed him on your site), come to my home and he introduced me to a relatively new
type of filter called the DNA Line Filter by Rfreduce. For the size of my system, it required that two DNA line filters be
wired in between the inverters and my electrical panel… What I can tell you is that these filters work! I can now have my
solar on full time with no symptoms….
Michael J. Schwaebe PE, BBEC 760 753 7752 [email protected] 16
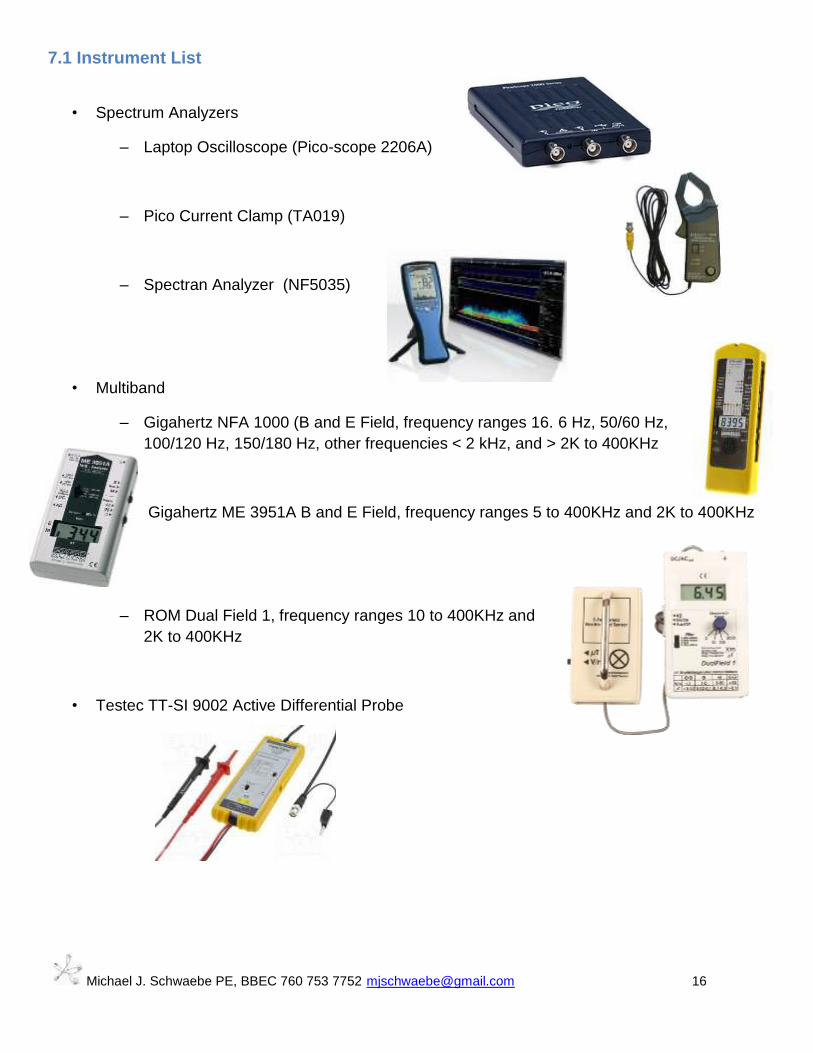
7.1 Instrument List
• Spectrum Analyzers
– Laptop Oscilloscope (Pico-scope 2206A)
– Pico Current Clamp (TA019)
– Spectran Analyzer (NF5035)
• Multiband
– Gigahertz NFA 1000 (B and E Field, frequency ranges 16. 6 Hz, 50/60 Hz,
100/120 Hz, 150/180 Hz, other frequencies < 2 kHz, and > 2K to 400KHz
– Gigahertz ME 3951A B and E Field, frequency ranges 5 to 400KHz and 2K to 400KHz
– ROM Dual Field 1, frequency ranges 10 to 400KHz and
2K to 400KHz
• Testec TT-SI 9002 Active Differential Probe
Michael J. Schwaebe PE, BBEC 760 753 7752 [email protected] 17
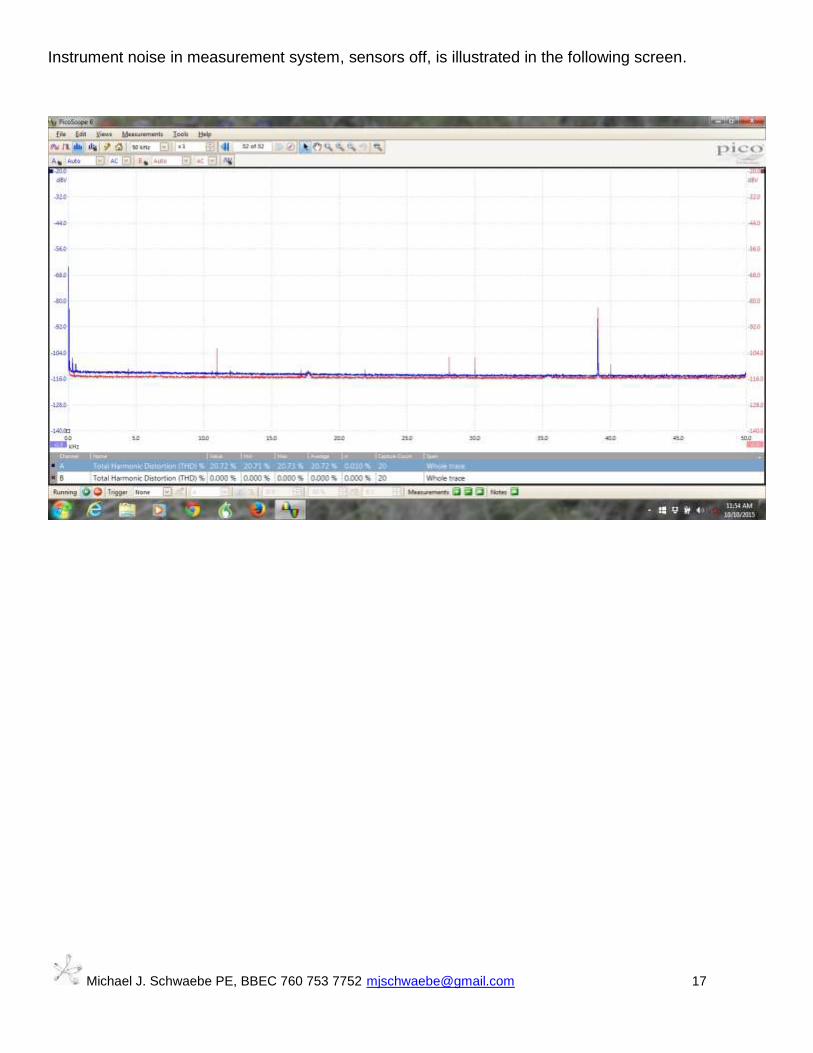
Instrument noise in measurement system, sensors off, is illustrated in the following screen.
Michael J. Schwaebe PE, BBEC 760 753 7752 [email protected] 18
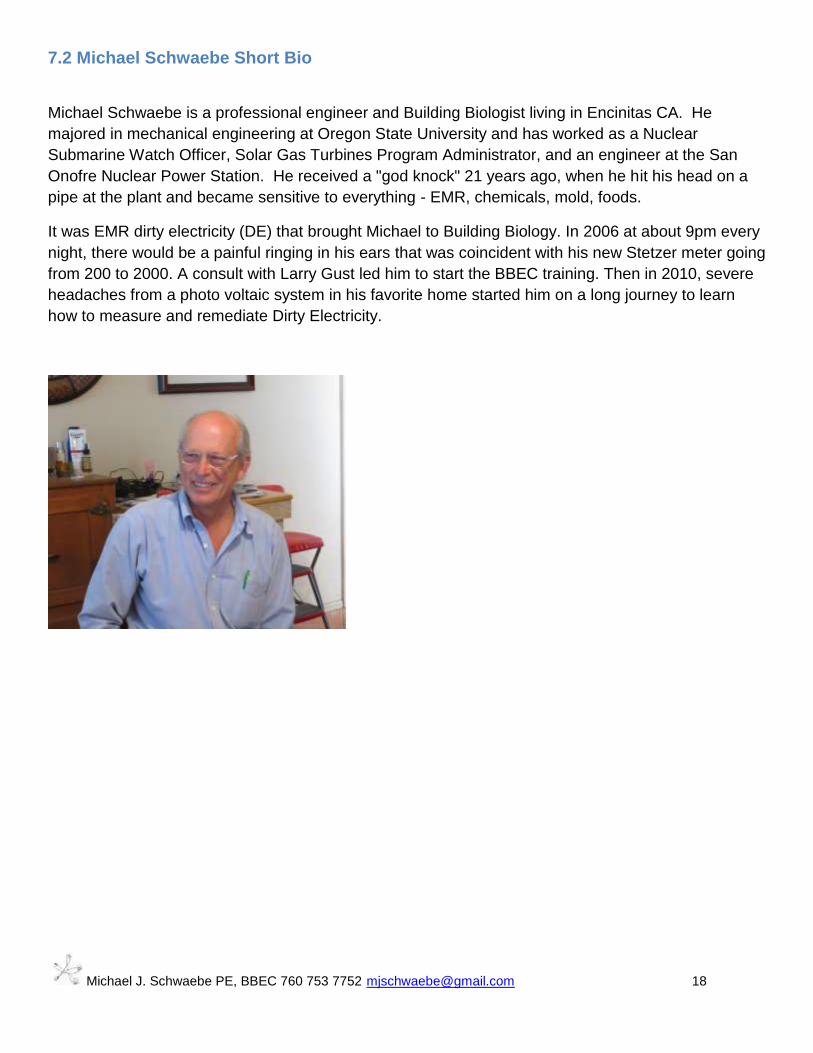
7.2 Michael Schwaebe Short Bio
Michael Schwaebe is a professional engineer and Building Biologist living in Encinitas CA. He
majored in mechanical engineering at Oregon State University and has worked as a Nuclear
Submarine Watch Officer, Solar Gas Turbines Program Administrator, and an engineer at the San
Onofre Nuclear Power Station. He received a "god knock" 21 years ago, when he hit his head on a
pipe at the plant and became sensitive to everything - EMR, chemicals, mold, foods.
It was EMR dirty electricity (DE) that brought Michael to Building Biology. In 2006 at about 9pm every
night, there would be a painful ringing in his ears that was coincident with his new Stetzer meter going
from 200 to 2000. A consult with Larry Gust led him to start the BBEC training. Then in 2010, severe
headaches from a photo voltaic system in his favorite home started him on a long journey to learn
how to measure and remediate Dirty Electricity.