Embed Size (px)
Citation preview
HAL Id: hal-01845004https://hal.inria.fr/hal-01845004v2
Submitted on 22 Aug 2018
HAL is a multi-disciplinary open accessarchive for the deposit and dissemination of sci-entific research documents, whether they are pub-lished or not. The documents may come fromteaching and research institutions in France orabroad, or from public or private research centers.
L’archive ouverte pluridisciplinaire HAL, estdestinée au dépôt et à la diffusion de documentsscientifiques de niveau recherche, publiés ou non,émanant des établissements d’enseignement et derecherche français ou étrangers, des laboratoirespublics ou privés.
Mitigating the Attraction Effect with VisualizationsEvanthia Dimara, Gilles Bailly, Anastasia Bezerianos, Steven Franconeri
To cite this version:Evanthia Dimara, Gilles Bailly, Anastasia Bezerianos, Steven Franconeri. Mitigating the Attrac-tion Effect with Visualizations. IEEE Transactions on Visualization and Computer Graphics, Insti-tute of Electrical and Electronics Engineers, 2019, TVCG 2019 (InfoVis 2018), 25 (1), pp.850 - 860.�10.1109/TVCG.2018.2865233�. �hal-01845004v2�
1077-2626 (c) 2018 IEEE. Personal use is permitted, but republication/redistribution requires IEEE permission. See http://www.ieee.org/publications_standards/publications/rights/index.html for more information.
This article has been accepted for publication in a future issue of this journal, but has not been fully edited. Content may change prior to final publication. Citation information: DOI 10.1109/TVCG.2018.2865233, IEEETransactions on Visualization and Computer Graphics
Mitigating the Attraction Effect with Visualizations
Evanthia Dimara, Gilles Bailly, Anastasia Bezerianos, and Steven Franconeri
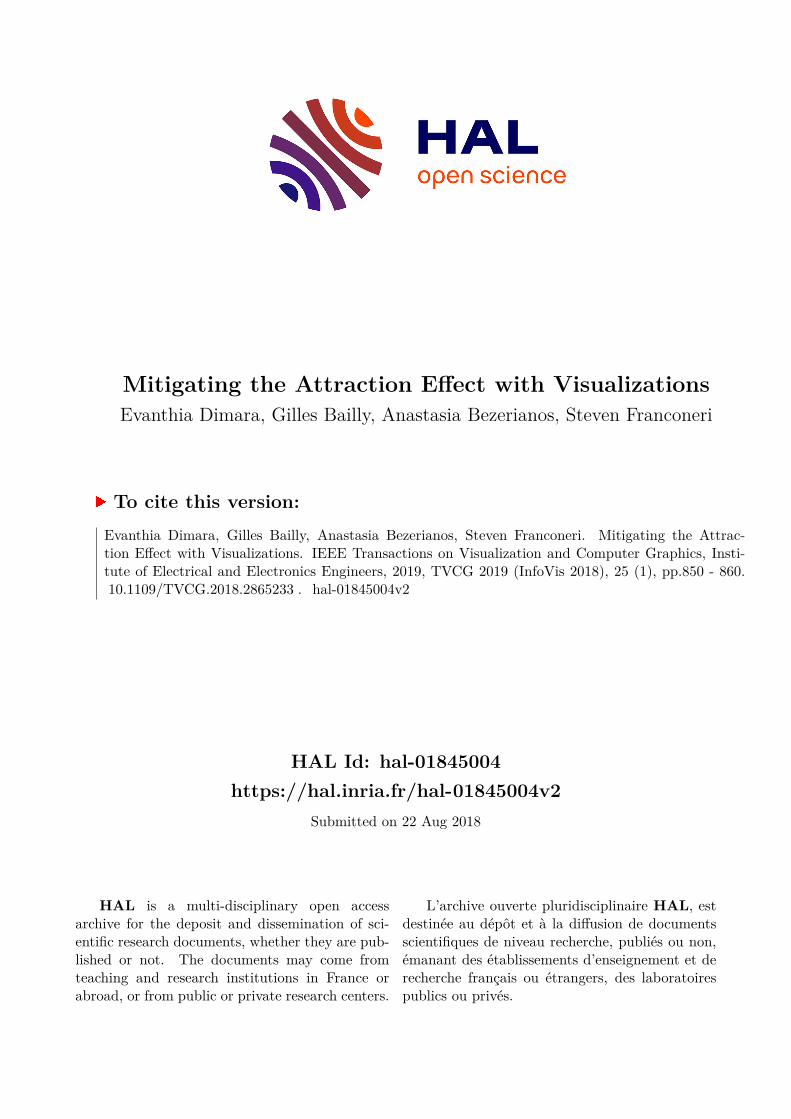
Abstract—Human decisions are prone to biases, and this is no less true for decisions made within data visualizations. Bias mitigationstrategies often focus on the person, by educating people about their biases, typically with little success. We focus instead on thesystem, presenting the first evidence that altering the design of an interactive visualization tool can mitigate a strong bias – the attractioneffect. Participants viewed 2D scatterplots where choices between superior alternatives were affected by the placement of othersuboptimal points. We found that highlighting the superior alternatives weakened the bias, but did not eliminate it. We then tested aninteractive approach where participants completely removed locally dominated points from the view, inspired by the elimination byaspects strategy in the decision-making literature. This approach strongly decreased the bias, leading to a counterintuitive suggestion:tools that allow removing inappropriately salient or distracting data from a view may help lead users to make more rational decisions.
Index Terms—Decision making, cognitive bias, bias alleviation, bias mitigation, debiasing, information visualization, attraction effect.
1 INTRODUCTION
We often misweigh information based on its salience, or how congruentit is with our fears or desires. People often misjudge probabilities, likethe odds of having breast cancer after a positive mammography [4].Or once we have formed a belief, we tend to overweigh informationthat confirms that belief [66]. These are cognitive biases. Accordingto Pohl’s definition [75], cognitive biases are phenomena that invol-untarily deviate from a normative model and the normal course ofinformation processing, in a predictable way (as opposed to judgementthat is unpredictably inaccurate, for example due to misunderstandinginformation). Cognitive biases differ from perceptual biases in thatthey exist even after veridically perceiving information. To measurea cognitive bias, researchers use synthetic tasks in constrained envi-ronments [24]. But biases also appear in critical real-world situationssuch as in the national security [77] or medical [61] domains, even forintelligent and open-minded decision makers [92] (though see [33] fora skeptical view of the ecological validity of many claimed biases).
Cognitive bias mitigation methods, known also as debiasing, focusprimarily on educating the decision maker, (e.g., through statisticstraining [30]). They have shown limited or only temporary success [75],and are ineffective [3, 27, 49, 79] even in critical domains such asmedicine [19, 34] or policy making [66]. A more rarely implementedapproach is to debias the environment instead of the decision maker [53].Previous studies that use this approach altered the design of textualinformation [40, 53], but did not consider the use of visualizations.
The visualization community has explored the idea that cognitivebiases may arise during visual analysis [24, 89, 98]. Dimara et al. [22]found that in scatterplots, decisions among optimal choices (points inthe 2D space of the scatterplot) were influenced by the presence ofsuboptimal choices, replicating the attraction effect. But when pastresearch has explored ways of mitigating such biases with visualiza-tions, results have remained inconclusive [24]. For example, Micallefet al. [59] explored whether Euler diagrams could improve probabilis-tic reasoning to mitigate the base rate fallacy [4], and Boy et al. [8]tested whether anthropomorphized icons would decrease an impulseto dehumanize statistical data about suffering populations [47]. Sur-
• Evanthia Dimara is with ISIR and INRIA. E-mail:[email protected].
• Gilles Bailly is with ISIR. E-mail: [email protected].• Anastasia Bezerianos Univ. Paris-Sud & CNRS (LRI), Inria, and Univ.
Paris-Saclay. E-mail: [email protected].• Steven Franconeri is with with Northwestern Univ. E-mail:
Manuscript received xx xxx. 201x; accepted xx xxx. 201x. Date of Publicationxx xxx. 201x; date of current version xx xxx. 201x. For information onobtaining reprints of this article, please send e-mail to: [email protected] Object Identifier: xx.xxxx/TVCG.201x.xxxxxxx
prisingly, neither study found evidence for the biases in the first place(such replication failures also occur in the primary literature [44]), and,consequently, if a visualization can alleviate it.
In this paper we take inspiration from the debiasing method ofaltering the environment of the decision maker [53] by using interactivevisualizations. We focus on mitigating the attraction effect bias whichhas been reliably detected in visualizations in past work [22]. Wereplicate the setup of that original study, across two studies, and contrastit to interactive displays that alter the decision making environment. Inthe first visual approach, we explore if highlighting optimal choicescould help decision makers focus on the important information whileignoring distracting choices. In the second interactive approach, weexplore a stronger manipulation where participants delete suboptimaldatapoints from the display, encouraging a decision strategy known as“elimination by aspects” [86].
2 BACKGROUND
We next review methods for debiasing decision makers, and connectthese debiasing approaches to visualization research.
2.1 Debias the judgeMost techniques that have been employed to mitigate cognitive biasesappear so far to be rather ineffective [3, 27, 49, 79]. Most of themfocus on how to improve decision making by improving a participant’seducation or by increasing their motivation.
2.1.1 Improve education“Training in rules” techniques examine the benefits of formal trainingin economics (e.g., normative theory) [54], social and natural sciences[56], and statistics (e.g., law of small numbers) often by combiningabstract rules for normative reasoning with concrete examples [13, 30].Unfortunately, these techniques require extensive training, and theimprovements that they bring tend to weaken over time [31].
Stronger forms of training can be effective. Computer games andsimulations [34] provide immediate feedback, structured learning envi-ronments, and tailored instructions based on performance [16,26,58,60].They have proven useful in reducing the fundamental attribution er-ror, bias blind spot, and confirmation bias [16, 60], after the sessionand even eight weeks later. Computer games appear more effectivethan videos probably because they provide personalized feedback andhands-on experience [60].
Other debiasing techniques teach thinking strategies. In “considerthe opposite” decision makers are asked to consider evidence for alter-natives in order to widen their sample of evidence, allowing to reducebiases such as overconfidence, hindsight or anchoring [3,64]. This tech-nique, though, can backfire since considering alternatives overwhelmscognitive capacity — when people were asked to list multiple ways inwhich past events could have turned out, the additional load actuallyamplifies some biases [79].
1077-2626 (c) 2018 IEEE. Personal use is permitted, but republication/redistribution requires IEEE permission. See http://www.ieee.org/publications_standards/publications/rights/index.html for more information.
This article has been accepted for publication in a future issue of this journal, but has not been fully edited. Content may change prior to final publication. Citation information: DOI 10.1109/TVCG.2018.2865233, IEEETransactions on Visualization and Computer Graphics
2.1.2 Increase motivationOther debiasing techniques attempt to increase the participant’s motiva-tion to solve a task, typically through reward incentives or accountabil-ity. Financial incentives can indeed improve performance for tasks thatrequire more effort [11]. For example, for decisions under uncertainty,one study showed that incentives did not affect mean performance, butthey did reduce variance in responses [11], suggesting a more carefuland consistent strategy.
However, these incentives typically fail to improve performancewhen the skills of the participant underlie the bias rather than their levelof effort. For example, Fischhoff et al. [28] showed that asking peopleto wager actual money based on their confidence levels did not manageto mitigate overconfidence. The automatic nature of most cognitivebiases may render people unresponsive to incentives, merely motivatingthem to perform their “suboptimal behavior with more enthusiasm” [3].
Making people accountable for their decisions can also motivatethem to put more effort. The assumption behind accountability is thatpeople expected to justify their responses to others would anticipatepossible flaws in their reasoning [9]. However, this technique requiresthe ability to recognize mistakes. Furthermore, accountability can itselfbias responses to be more favorable to the audience of interest [9].
2.2 Rely less on the judgeAnother way to reduce cognitive biases is to rely less on individualhuman judgment, relying instead on computational solutions or byaggregating multiple individual human judgments.
2.2.1 Add computation aidActuarial methods [21] — incorporating statistical models based on pastdata — can be effective. In some clinical judgments that systematicallysuffer from judgment inconsistencies [21], automated decision supportsystems (DSS) can run consistency checks (e.g., on attribute weightsor probabilities) [48]. They can also incorporate normative algorithmsinto the decision making process that would be difficult or impossiblefor human decision makers to compute [20].
However, automation can trigger new cognitive biases when expertsover-rely on recommendations from automated systems, even whenthere are clear indications of disconfirming evidence (e.g., pilots acceptsignificantly sub-optimal flight plans from autopilot systems) [20].
2.2.2 Encourage group decisionsOne solution to debias critical decisions is to rely on the “wisdom ofcrowds”, as has been implemented for cancer diagnosis, and financialforecast [65]. Each member of a group forms a judgment independently,and a final decision is computed from the aggregated judgments [42],making suboptimal individual strategies less influential [76, 83]. More-over, there is evidence that making financial choices within a socialnetwork can help older adults to overcome their biases in financial risktaking (e.g., to choose retirement savings plans) [96]. There are alsocases where deliberation and discussion can improve collective wisdomfor responses to general knowledge questions (e.g., what is the heightof the Eiffel Tower) [65].
In other cases of members forming judgments during a group discus-sion, individual biases can be amplified within the final decision [74],Group interactions often trigger other cognitive biases where individu-als shape judgments to be favorable to the group [10, 29], and groupdecisions are often biased towards conformity or polarization [62].
2.3 Debias the environment instead of the judgeA debiasing approach that has received less attention is to “debias theenvironment instead of the judge” [53]. Some of these techniques forcea slower, more analytical process. In the medical domain, for instance,checklists, deliberate practice, and immediate feedback are suggestedto help clinicians avoid diagnostic biases [34], though there is littleto no empirical data to demonstrate notable improvement in decisionmaking performance [19, 34].
Slowing people down is also possible by presenting information in adisfluent format, which can reduce confirmation bias [40]. For example,jurors gave fewer confirmatory verdicts when reading a summary of a
crime which required processing difficulty [40], though it is not clearthat this change led to an objectively better decision.
Another tactic is to force people to consider information in isola-tion from its context, versus in the comparison with other information.In one study where participants distinguished fictional diseases de-scribed in text format, one group of participants read about each diseaseseparately from each other, while another group saw simultaneouslyjuxtaposed information from both, which allowed them to highlight thedistinctive features of each other. The juxtaposed representation led tomore accurate judgments [53].
2.4 SummaryDecision making strategies have been divided into ’fast’ processes thatrely on automatic associations and tend to carry more biases, vs. ’slow’procedural processes that tend to be less biased [50]. Debiasing thejudge through education in ’slow’ processes can be difficult, as trainingoften does not stick, or transfer to new problems. Relying less on thejudge, through computational aids or group decisions, can lead to mixedsuccess. Increasing motivation and incentives can decrease variabilityin responses, but does not decrease biases. This may be because ifa judge only has access to ’fast’ processes in the first place, moremotivation may improve their attention and engagement, but cannotswitch them to a less biased process. Thus, we hope to find successwith the strategy of debiasing the environment, by altering the designof a visualization display to force the judge to take a slower and moredeliberate approach that is constrained by the task environment itself.
2.5 Connection to visualization researchThe visualization community has attempted to design and test visualdisplays that help viewers avoid misunderstandings and reasoning errorsin data displays. Some studies demonstrate that misleading designscan cause viewers to incorrectly perceive visualized data [71]. Otherstudies find that alternative visualization designs [2,36,68], or the use ofvisualizations instead of text [84] can improve probability estimations.Improving performance in these domains can be difficult [17], even foranimated displays [45]. Errors in applying probability or logic rules areoften associated with many documented cognitive biases.
Some studies focused explicitly on cognitive bias detection, demon-strating the existence of well known cognitive biases, such as anchoringeffects or shifts in decision criteria [14,87,97], the attraction effect [22],or overconfidence effects [2], but do not test designs for mitigatingthese biases. Some studies evaluated promising design interventions,but did not replicate the original biases [8, 59]. Others suggest solu-tions for mitigating cognitive biases by training the viewers to avoidthem. For example, we tend to see patterns in noise (e.g., the clusteringillusion [51]), a perceptual bias known as pareidolia or apophenia [88].Because this bias might occur in data visualizations as well, it couldbe useful to contrast datasets containing signal to other datasets con-structed from pure noise [93]. One might envision such training beingadded to visual analysis systems to mitigate cognitive biases. In sum-mary, previous work within InfoVis shows that cognitive biases affectvisualization systems, and while many studies attempt to reveal and im-prove some reasoning errors, cognitive bias alleviation is challenging.
To alleviate biases, visualization research might seek inspirationfrom attempts from other domains. The most effective techniques seemto be the educational interventions of Sect. 2.1, video-game trainingin particular [16]. However, their experimental design did not testmultidisciplinary contexts or long-term transfer of knowledge. It isunclear whether a data analyst who successfully solved a confirmationbias puzzle can improve her reasoning during actual visual analysis, astransfer of expertise across examples can be difficult [32]. Perhaps moreimportantly, extensive training is not always feasible for visualizationusers, though short-term prescriptions such as “consider the opposite”might inspire the development of visualization systems that encourageanalysts to generate alternative hypotheses.
The approach of relying less on the judge, where human judgmentis aided by computational methods or group decisions, also remainspromising. Similarly, visualization systems can incorporate compu-tation support or encourage collaboration among analysts to reduce
1077-2626 (c) 2018 IEEE. Personal use is permitted, but republication/redistribution requires IEEE permission. See http://www.ieee.org/publications_standards/publications/rights/index.html for more information.
This article has been accepted for publication in a future issue of this journal, but has not been fully edited. Content may change prior to final publication. Citation information: DOI 10.1109/TVCG.2018.2865233, IEEETransactions on Visualization and Computer Graphics
cognitive biases. For example, collaborative analysis platforms runningon shared displays (e.g., [46]) could promote collective wisdom, and ifwe enhance them with ways to monitor individual and group decisionsthey could potentially reduce biases present in collaboration.
Our experiments focus on the design-based debiasing approach oftransforming the environment of the decision maker. The studies ofSect. 2.3 provide evidence that restructuring the way information is pre-sented can mitigate some cognitive biases. Nevertheless, those studiesexamined only textual representation formats [40, 53], and, althoughvisualizations have been suggested as promising interventions for im-proving rational reasoning [98], we know of no empirical evidence thatvisualization systems can mitigate cognitive biases. The next sectionswill focus on an empirical investigation of how a visualization systemcould mitigate a known cognitive bias: the attraction effect.
3 THE ATTRACTION EFFECT
ATTRACTION EFFECT BOB ALICE EVE
EDUCATIONCRIME CONTROL
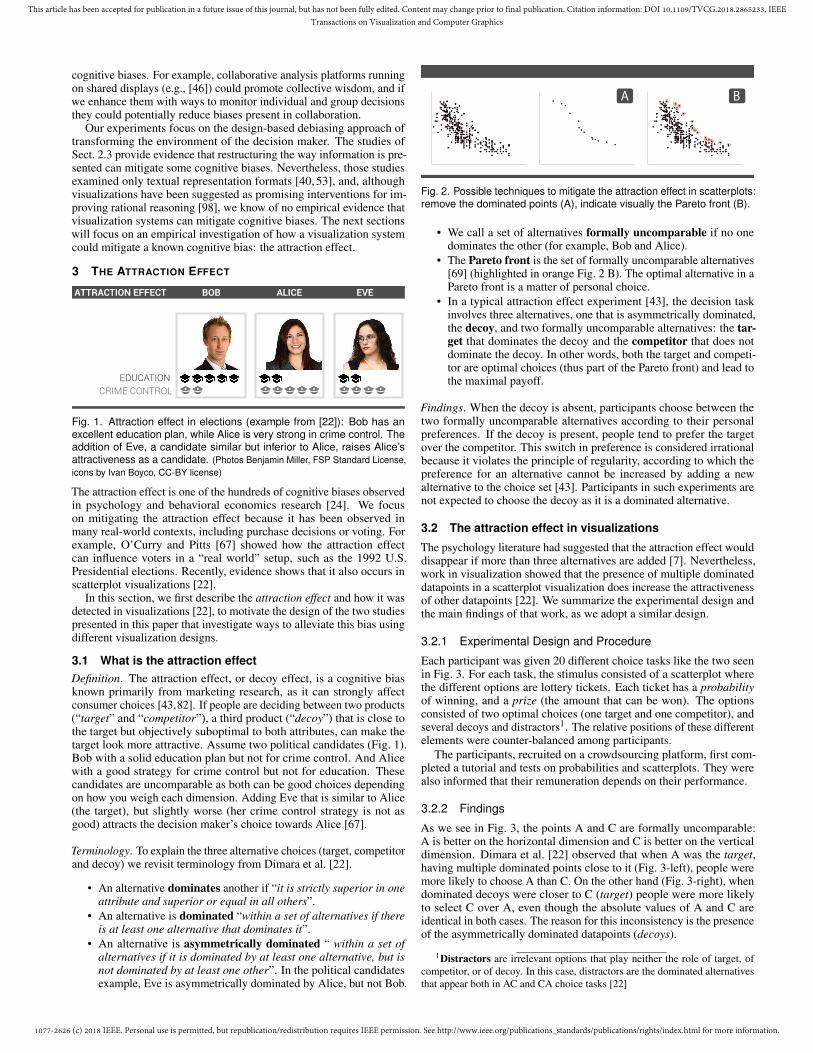
Fig. 1. Attraction effect in elections (example from [22]): Bob has anexcellent education plan, while Alice is very strong in crime control. Theaddition of Eve, a candidate similar but inferior to Alice, raises Alice’sattractiveness as a candidate. (Photos Benjamin Miller, FSP Standard License,icons by Ivan Boyco, CC-BY license)
The attraction effect is one of the hundreds of cognitive biases observedin psychology and behavioral economics research [24]. We focuson mitigating the attraction effect because it has been observed inmany real-world contexts, including purchase decisions or voting. Forexample, O’Curry and Pitts [67] showed how the attraction effectcan influence voters in a “real world” setup, such as the 1992 U.S.Presidential elections. Recently, evidence shows that it also occurs inscatterplot visualizations [22].
In this section, we first describe the attraction effect and how it wasdetected in visualizations [22], to motivate the design of the two studiespresented in this paper that investigate ways to alleviate this bias usingdifferent visualization designs.
3.1 What is the attraction effectDefinition. The attraction effect, or decoy effect, is a cognitive biasknown primarily from marketing research, as it can strongly affectconsumer choices [43,82]. If people are deciding between two products(“target” and “competitor”), a third product (“decoy”) that is close tothe target but objectively suboptimal to both attributes, can make thetarget look more attractive. Assume two political candidates (Fig. 1).Bob with a solid education plan but not for crime control. And Alicewith a good strategy for crime control but not for education. Thesecandidates are uncomparable as both can be good choices dependingon how you weigh each dimension. Adding Eve that is similar to Alice(the target), but slightly worse (her crime control strategy is not asgood) attracts the decision maker’s choice towards Alice [67].
Terminology. To explain the three alternative choices (target, competitorand decoy) we revisit terminology from Dimara et al. [22].
• An alternative dominates another if “it is strictly superior in oneattribute and superior or equal in all others”.
• An alternative is dominated “within a set of alternatives if thereis at least one alternative that dominates it”.
• An alternative is asymmetrically dominated “ within a set ofalternatives if it is dominated by at least one alternative, but isnot dominated by at least one other”. In the political candidatesexample, Eve is asymmetrically dominated by Alice, but not Bob.
AA B
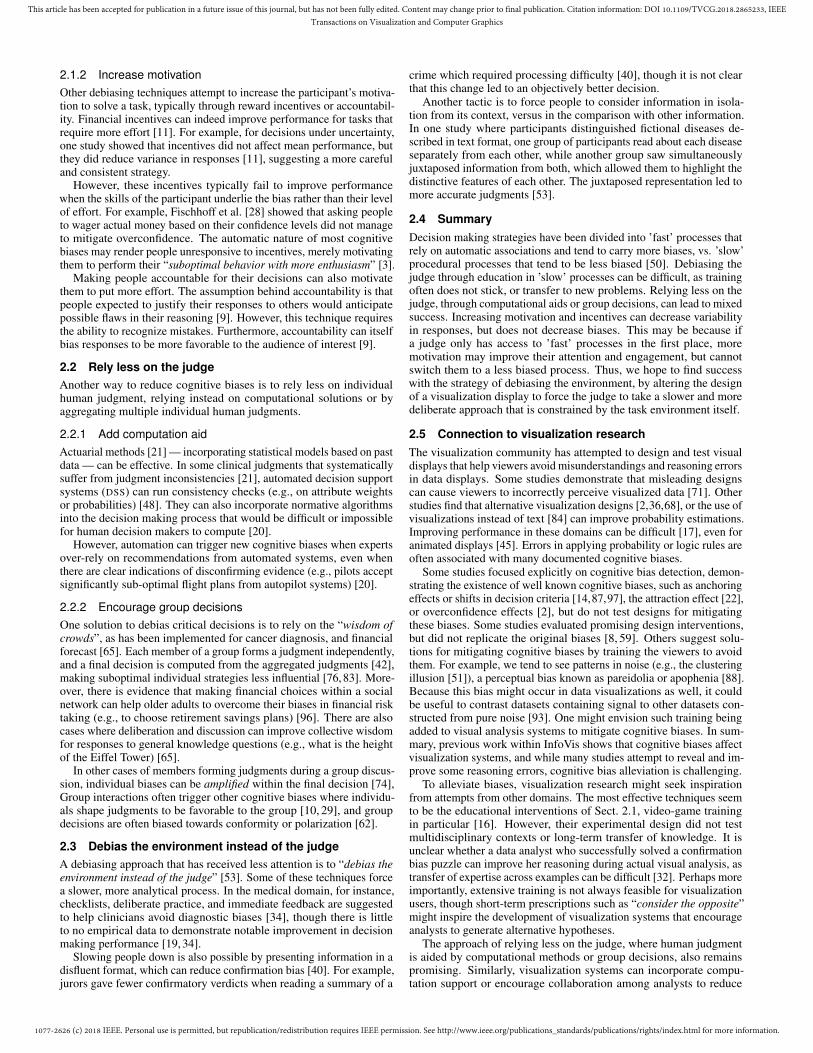
Fig. 2. Possible techniques to mitigate the attraction effect in scatterplots:remove the dominated points (A), indicate visually the Pareto front (B).
• We call a set of alternatives formally uncomparable if no onedominates the other (for example, Bob and Alice).
• The Pareto front is the set of formally uncomparable alternatives[69] (highlighted in orange Fig. 2 B). The optimal alternative in aPareto front is a matter of personal choice.
• In a typical attraction effect experiment [43], the decision taskinvolves three alternatives, one that is asymmetrically dominated,the decoy, and two formally uncomparable alternatives: the tar-get that dominates the decoy and the competitor that does notdominate the decoy. In other words, both the target and competi-tor are optimal choices (thus part of the Pareto front) and lead tothe maximal payoff.
Findings. When the decoy is absent, participants choose between thetwo formally uncomparable alternatives according to their personalpreferences. If the decoy is present, people tend to prefer the targetover the competitor. This switch in preference is considered irrationalbecause it violates the principle of regularity, according to which thepreference for an alternative cannot be increased by adding a newalternative to the choice set [43]. Participants in such experiments arenot expected to choose the decoy as it is a dominated alternative.
3.2 The attraction effect in visualizations
The psychology literature had suggested that the attraction effect woulddisappear if more than three alternatives are added [7]. Nevertheless,work in visualization showed that the presence of multiple dominateddatapoints in a scatterplot visualization does increase the attractivenessof other datapoints [22]. We summarize the experimental design andthe main findings of that work, as we adopt a similar design.
3.2.1 Experimental Design and Procedure
Each participant was given 20 different choice tasks like the two seenin Fig. 3. For each task, the stimulus consisted of a scatterplot wherethe different options are lottery tickets. Each ticket has a probabilityof winning, and a prize (the amount that can be won). The optionsconsisted of two optimal choices (one target and one competitor), andseveral decoys and distractors1. The relative positions of these differentelements were counter-balanced among participants.
The participants, recruited on a crowdsourcing platform, first com-pleted a tutorial and tests on probabilities and scatterplots. They werealso informed that their remuneration depends on their performance.
3.2.2 Findings
As we see in Fig. 3, the points A and C are formally uncomparable:A is better on the horizontal dimension and C is better on the verticaldimension. Dimara et al. [22] observed that when A was the target,having multiple dominated points close to it (Fig. 3-left), people weremore likely to choose A than C. On the other hand (Fig. 3-right), whendominated decoys were closer to C (target) people were more likelyto select C over A, even though the absolute values of A and C areidentical in both cases. The reason for this inconsistency is the presenceof the asymmetrically dominated datapoints (decoys).
1Distractors are irrelevant options that play neither the role of target, ofcompetitor, or of decoy. In this case, distractors are the dominated alternativesthat appear both in AC and CA choice tasks [22]
1077-2626 (c) 2018 IEEE. Personal use is permitted, but republication/redistribution requires IEEE permission. See http://www.ieee.org/publications_standards/publications/rights/index.html for more information.
This article has been accepted for publication in a future issue of this journal, but has not been fully edited. Content may change prior to final publication. Citation information: DOI 10.1109/TVCG.2018.2865233, IEEETransactions on Visualization and Computer Graphics
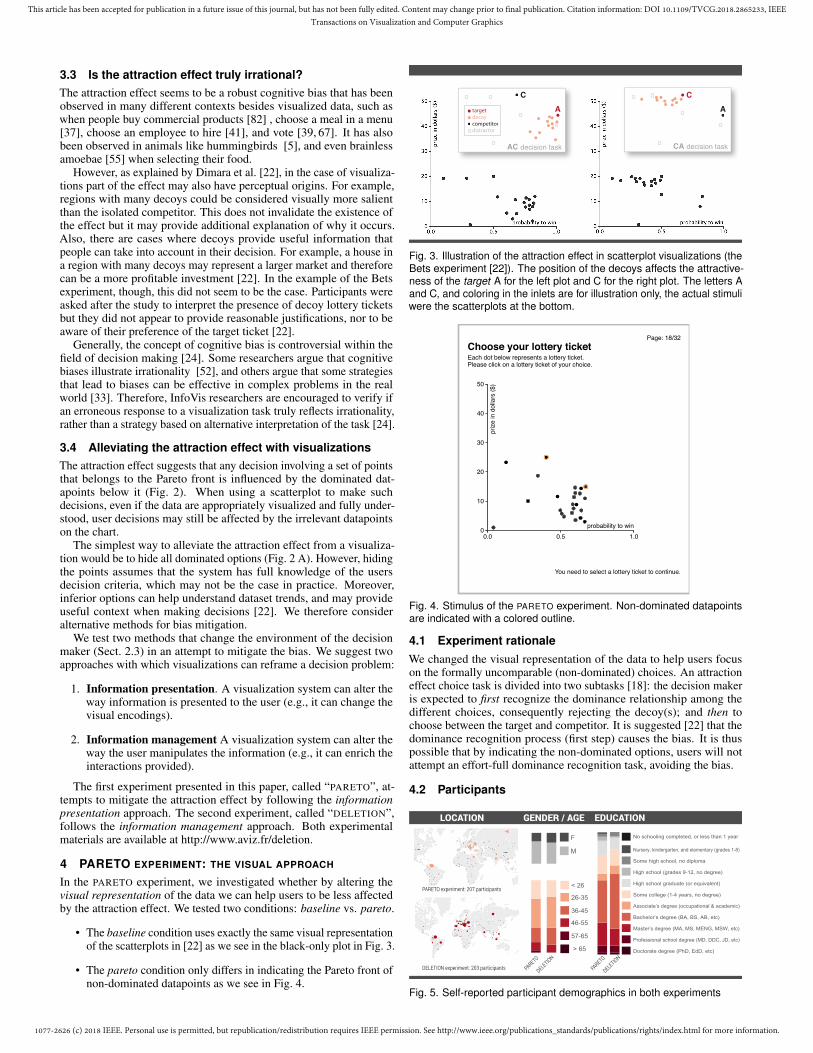
3.3 Is the attraction effect truly irrational?The attraction effect seems to be a robust cognitive bias that has beenobserved in many different contexts besides visualized data, such aswhen people buy commercial products [82] , choose a meal in a menu[37], choose an employee to hire [41], and vote [39, 67]. It has alsobeen observed in animals like hummingbirds [5], and even brainlessamoebae [55] when selecting their food.
However, as explained by Dimara et al. [22], in the case of visualiza-tions part of the effect may also have perceptual origins. For example,regions with many decoys could be considered visually more salientthan the isolated competitor. This does not invalidate the existence ofthe effect but it may provide additional explanation of why it occurs.Also, there are cases where decoys provide useful information thatpeople can take into account in their decision. For example, a house ina region with many decoys may represent a larger market and thereforecan be a more profitable investment [22]. In the example of the Betsexperiment, though, this did not seem to be the case. Participants wereasked after the study to interpret the presence of decoy lottery ticketsbut they did not appear to provide reasonable justifications, nor to beaware of their preference of the target ticket [22].
Generally, the concept of cognitive bias is controversial within thefield of decision making [24]. Some researchers argue that cognitivebiases illustrate irrationality [52], and others argue that some strategiesthat lead to biases can be effective in complex problems in the realworld [33]. Therefore, InfoVis researchers are encouraged to verify ifan erroneous response to a visualization task truly reflects irrationality,rather than a strategy based on alternative interpretation of the task [24].
3.4 Alleviating the attraction effect with visualizationsThe attraction effect suggests that any decision involving a set of pointsthat belongs to the Pareto front is influenced by the dominated dat-apoints below it (Fig. 2). When using a scatterplot to make suchdecisions, even if the data are appropriately visualized and fully under-stood, user decisions may still be affected by the irrelevant datapointson the chart.
The simplest way to alleviate the attraction effect from a visualiza-tion would be to hide all dominated options (Fig. 2 A). However, hidingthe points assumes that the system has full knowledge of the usersdecision criteria, which may not be the case in practice. Moreover,inferior options can help understand dataset trends, and may provideuseful context when making decisions [22]. We therefore consideralternative methods for bias mitigation.
We test two methods that change the environment of the decisionmaker (Sect. 2.3) in an attempt to mitigate the bias. We suggest twoapproaches with which visualizations can reframe a decision problem:
1. Information presentation. A visualization system can alter theway information is presented to the user (e.g., it can change thevisual encodings).
2. Information management A visualization system can alter theway the user manipulates the information (e.g., it can enrich theinteractions provided).
The first experiment presented in this paper, called “PARETO”, at-tempts to mitigate the attraction effect by following the informationpresentation approach. The second experiment, called “DELETION”,follows the information management approach. Both experimentalmaterials are available at http://www.aviz.fr/deletion.
4 PARETO EXPERIMENT: THE VISUAL APPROACH
In the PARETO experiment, we investigated whether by altering thevisual representation of the data we can help users to be less affectedby the attraction effect. We tested two conditions: baseline vs. pareto.
• The baseline condition uses exactly the same visual representationof the scatterplots in [22] as we see in the black-only plot in Fig. 3.
• The pareto condition only differs in indicating the Pareto front ofnon-dominated datapoints as we see in Fig. 4.
AC C
A
AC decision task CA decision task
decoy
distractorcompetitor
target
Fig. 3. Illustration of the attraction effect in scatterplot visualizations (theBets experiment [22]). The position of the decoys affects the attractive-ness of the target A for the left plot and C for the right plot. The letters Aand C, and coloring in the inlets are for illustration only, the actual stimuliwere the scatterplots at the bottom.
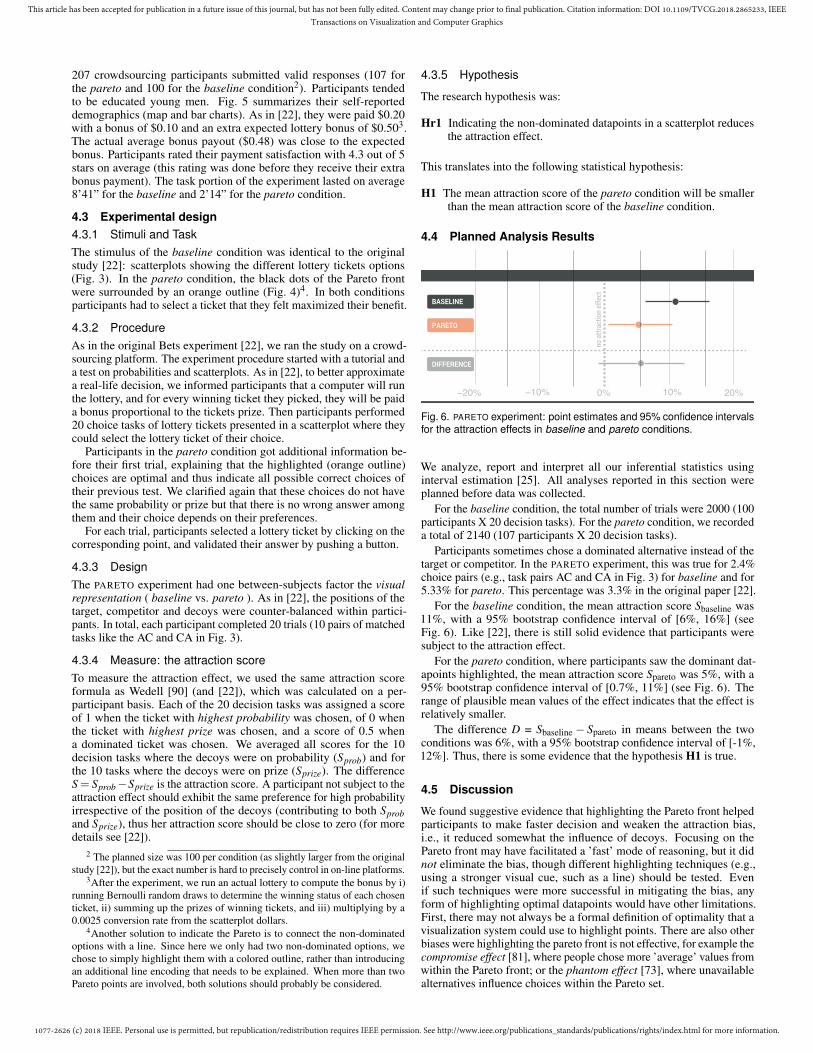
Choose your lottery ticketPage: 18/32
Each dot below represents a lottery ticket. Please click on a lottery ticket of your choice.
0.0 0.5 1.0probability to win
0
10
20
30
40
50
priz
e in
dol
lars
($)
You need to select a lottery ticket to continue.
Fig. 4. Stimulus of the PARETO experiment. Non-dominated datapointsare indicated with a colored outline.
4.1 Experiment rationaleWe changed the visual representation of the data to help users focuson the formally uncomparable (non-dominated) choices. An attractioneffect choice task is divided into two subtasks [18]: the decision makeris expected to first recognize the dominance relationship among thedifferent choices, consequently rejecting the decoy(s); and then tochoose between the target and competitor. It is suggested [22] that thedominance recognition process (first step) causes the bias. It is thuspossible that by indicating the non-dominated options, users will notattempt an effort-full dominance recognition task, avoiding the bias.
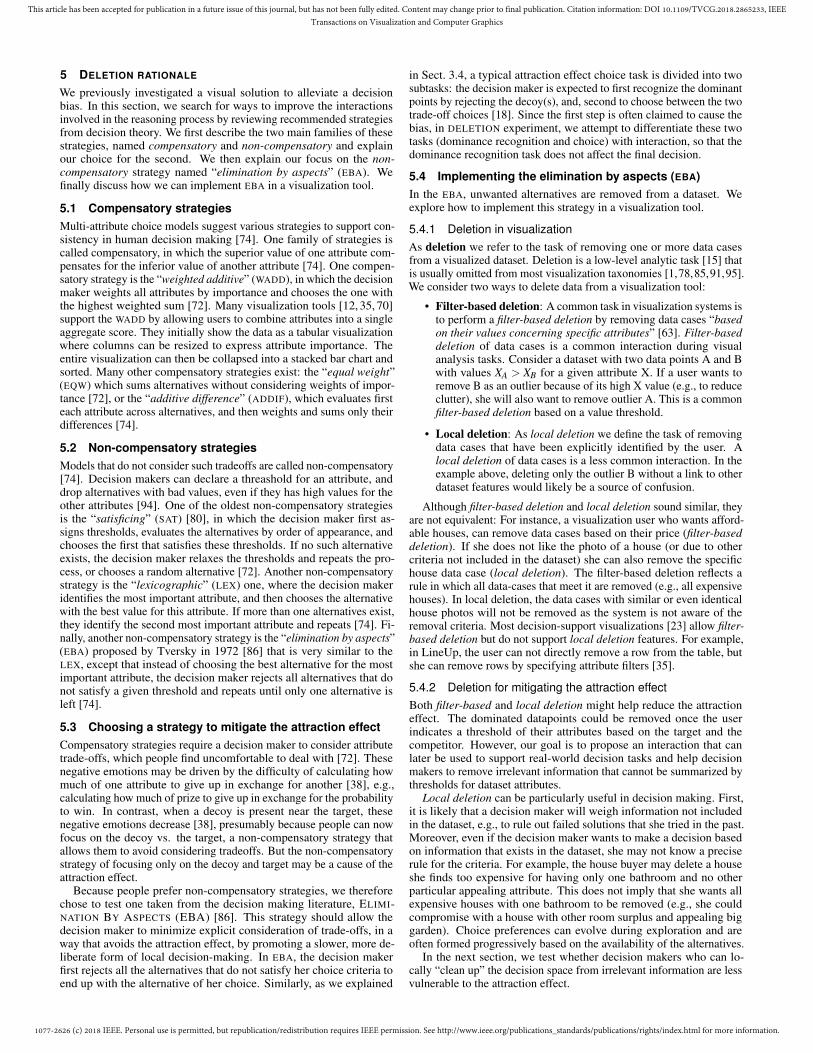
4.2 Participants
No schooling completed, or less than 1 yearF
> 65
M
< 26
26-35
36-45
46-55
57-65
DELETION
PARETO
DELETION
Nursery, kindergarten, and elementary (grades 1-8)
Some high school, no diploma
High school (grades 9-12, no degree)
High school graduate (or equivalent)
Some college (1-4 years, no degree)
Associate’s degree (occupational & academic)
Bachelor’s degree (BA, BS, AB, etc)
Master’s degree (MA, MS, MENG, MSW, etc)
Professional school degree (MD, DDC, JD, etc)
Doctorate degree (PhD, EdD, etc)
PARETO
LOCATION GENDER / AGE EDUCATION
PARETO experiment: 207 participants
DELETION experiment: 203 participants
Fig. 5. Self-reported participant demographics in both experiments
1077-2626 (c) 2018 IEEE. Personal use is permitted, but republication/redistribution requires IEEE permission. See http://www.ieee.org/publications_standards/publications/rights/index.html for more information.
This article has been accepted for publication in a future issue of this journal, but has not been fully edited. Content may change prior to final publication. Citation information: DOI 10.1109/TVCG.2018.2865233, IEEETransactions on Visualization and Computer Graphics
207 crowdsourcing participants submitted valid responses (107 forthe pareto and 100 for the baseline condition2). Participants tendedto be educated young men. Fig. 5 summarizes their self-reporteddemographics (map and bar charts). As in [22], they were paid $0.20with a bonus of $0.10 and an extra expected lottery bonus of $0.503.The actual average bonus payout ($0.48) was close to the expectedbonus. Participants rated their payment satisfaction with 4.3 out of 5stars on average (this rating was done before they receive their extrabonus payment). The task portion of the experiment lasted on average8’41” for the baseline and 2’14” for the pareto condition.
4.3 Experimental design4.3.1 Stimuli and TaskThe stimulus of the baseline condition was identical to the originalstudy [22]: scatterplots showing the different lottery tickets options(Fig. 3). In the pareto condition, the black dots of the Pareto frontwere surrounded by an orange outline (Fig. 4)4. In both conditionsparticipants had to select a ticket that they felt maximized their benefit.
4.3.2 ProcedureAs in the original Bets experiment [22], we ran the study on a crowd-sourcing platform. The experiment procedure started with a tutorial anda test on probabilities and scatterplots. As in [22], to better approximatea real-life decision, we informed participants that a computer will runthe lottery, and for every winning ticket they picked, they will be paida bonus proportional to the tickets prize. Then participants performed20 choice tasks of lottery tickets presented in a scatterplot where theycould select the lottery ticket of their choice.
Participants in the pareto condition got additional information be-fore their first trial, explaining that the highlighted (orange outline)choices are optimal and thus indicate all possible correct choices oftheir previous test. We clarified again that these choices do not havethe same probability or prize but that there is no wrong answer amongthem and their choice depends on their preferences.
For each trial, participants selected a lottery ticket by clicking on thecorresponding point, and validated their answer by pushing a button.
4.3.3 DesignThe PARETO experiment had one between-subjects factor the visualrepresentation ( baseline vs. pareto ). As in [22], the positions of thetarget, competitor and decoys were counter-balanced within partici-pants. In total, each participant completed 20 trials (10 pairs of matchedtasks like the AC and CA in Fig. 3).
4.3.4 Measure: the attraction scoreTo measure the attraction effect, we used the same attraction scoreformula as Wedell [90] (and [22]), which was calculated on a per-participant basis. Each of the 20 decision tasks was assigned a scoreof 1 when the ticket with highest probability was chosen, of 0 whenthe ticket with highest prize was chosen, and a score of 0.5 whena dominated ticket was chosen. We averaged all scores for the 10decision tasks where the decoys were on probability (Sprob) and forthe 10 tasks where the decoys were on prize (Sprize). The differenceS = Sprob−Sprize is the attraction score. A participant not subject to theattraction effect should exhibit the same preference for high probabilityirrespective of the position of the decoys (contributing to both Sproband Sprize), thus her attraction score should be close to zero (for moredetails see [22]).
2 The planned size was 100 per condition (as slightly larger from the originalstudy [22]), but the exact number is hard to precisely control in on-line platforms.
3After the experiment, we run an actual lottery to compute the bonus by i)running Bernoulli random draws to determine the winning status of each chosenticket, ii) summing up the prizes of winning tickets, and iii) multiplying by a0.0025 conversion rate from the scatterplot dollars.
4Another solution to indicate the Pareto is to connect the non-dominatedoptions with a line. Since here we only had two non-dominated options, wechose to simply highlight them with a colored outline, rather than introducingan additional line encoding that needs to be explained. When more than twoPareto points are involved, both solutions should probably be considered.
4.3.5 Hypothesis
The research hypothesis was:
Hr1 Indicating the non-dominated datapoints in a scatterplot reducesthe attraction effect.
This translates into the following statistical hypothesis:
H1 The mean attraction score of the pareto condition will be smallerthan the mean attraction score of the baseline condition.
4.4 Planned Analysis Results
−20% 0% 20%−10% 10%
no a
ttrac
tion
effe
ct
BASELINE
DIFFERENCE
PARETO
Fig. 6. PARETO experiment: point estimates and 95% confidence intervalsfor the attraction effects in baseline and pareto conditions.
We analyze, report and interpret all our inferential statistics usinginterval estimation [25]. All analyses reported in this section wereplanned before data was collected.
For the baseline condition, the total number of trials were 2000 (100participants X 20 decision tasks). For the pareto condition, we recordeda total of 2140 (107 participants X 20 decision tasks).
Participants sometimes chose a dominated alternative instead of thetarget or competitor. In the PARETO experiment, this was true for 2.4%choice pairs (e.g., task pairs AC and CA in Fig. 3) for baseline and for5.33% for pareto. This percentage was 3.3% in the original paper [22].
For the baseline condition, the mean attraction score Sbaseline was11%, with a 95% bootstrap confidence interval of [6%, 16%] (seeFig. 6). Like [22], there is still solid evidence that participants weresubject to the attraction effect.
For the pareto condition, where participants saw the dominant dat-apoints highlighted, the mean attraction score Spareto was 5%, with a95% bootstrap confidence interval of [0.7%, 11%] (see Fig. 6). Therange of plausible mean values of the effect indicates that the effect isrelatively smaller.
The difference D = Sbaseline − Spareto in means between the twoconditions was 6%, with a 95% bootstrap confidence interval of [-1%,12%]. Thus, there is some evidence that the hypothesis H1 is true.
4.5 Discussion
We found suggestive evidence that highlighting the Pareto front helpedparticipants to make faster decision and weaken the attraction bias,i.e., it reduced somewhat the influence of decoys. Focusing on thePareto front may have facilitated a ’fast’ mode of reasoning, but it didnot eliminate the bias, though different highlighting techniques (e.g.,using a stronger visual cue, such as a line) should be tested. Evenif such techniques were more successful in mitigating the bias, anyform of highlighting optimal datapoints would have other limitations.First, there may not always be a formal definition of optimality that avisualization system could use to highlight points. There are also otherbiases were highlighting the pareto front is not effective, for example thecompromise effect [81], where people chose more ’average’ values fromwithin the Pareto front; or the phantom effect [73], where unavailablealternatives influence choices within the Pareto set.
1077-2626 (c) 2018 IEEE. Personal use is permitted, but republication/redistribution requires IEEE permission. See http://www.ieee.org/publications_standards/publications/rights/index.html for more information.
This article has been accepted for publication in a future issue of this journal, but has not been fully edited. Content may change prior to final publication. Citation information: DOI 10.1109/TVCG.2018.2865233, IEEETransactions on Visualization and Computer Graphics
5 DELETION RATIONALE
We previously investigated a visual solution to alleviate a decisionbias. In this section, we search for ways to improve the interactionsinvolved in the reasoning process by reviewing recommended strategiesfrom decision theory. We first describe the two main families of thesestrategies, named compensatory and non-compensatory and explainour choice for the second. We then explain our focus on the non-compensatory strategy named “elimination by aspects” (EBA). Wefinally discuss how we can implement EBA in a visualization tool.
5.1 Compensatory strategiesMulti-attribute choice models suggest various strategies to support con-sistency in human decision making [74]. One family of strategies iscalled compensatory, in which the superior value of one attribute com-pensates for the inferior value of another attribute [74]. One compen-satory strategy is the “weighted additive” (WADD), in which the decisionmaker weights all attributes by importance and chooses the one withthe highest weighted sum [72]. Many visualization tools [12, 35, 70]support the WADD by allowing users to combine attributes into a singleaggregate score. They initially show the data as a tabular visualizationwhere columns can be resized to express attribute importance. Theentire visualization can then be collapsed into a stacked bar chart andsorted. Many other compensatory strategies exist: the “equal weight”(EQW) which sums alternatives without considering weights of impor-tance [72], or the “additive difference” (ADDIF), which evaluates firsteach attribute across alternatives, and then weights and sums only theirdifferences [74].
5.2 Non-compensatory strategiesModels that do not consider such tradeoffs are called non-compensatory[74]. Decision makers can declare a threashold for an attribute, anddrop alternatives with bad values, even if they has high values for theother attributes [94]. One of the oldest non-compensatory strategiesis the “satisficing” (SAT) [80], in which the decision maker first as-signs thresholds, evaluates the alternatives by order of appearance, andchooses the first that satisfies these thresholds. If no such alternativeexists, the decision maker relaxes the thresholds and repeats the pro-cess, or chooses a random alternative [72]. Another non-compensatorystrategy is the “lexicographic” (LEX) one, where the decision makeridentifies the most important attribute, and then chooses the alternativewith the best value for this attribute. If more than one alternatives exist,they identify the second most important attribute and repeats [74]. Fi-nally, another non-compensatory strategy is the “elimination by aspects”(EBA) proposed by Tversky in 1972 [86] that is very similar to theLEX, except that instead of choosing the best alternative for the mostimportant attribute, the decision maker rejects all alternatives that donot satisfy a given threshold and repeats until only one alternative isleft [74].
5.3 Choosing a strategy to mitigate the attraction effectCompensatory strategies require a decision maker to consider attributetrade-offs, which people find uncomfortable to deal with [72]. Thesenegative emotions may be driven by the difficulty of calculating howmuch of one attribute to give up in exchange for another [38], e.g.,calculating how much of prize to give up in exchange for the probabilityto win. In contrast, when a decoy is present near the target, thesenegative emotions decrease [38], presumably because people can nowfocus on the decoy vs. the target, a non-compensatory strategy thatallows them to avoid considering tradeoffs. But the non-compensatorystrategy of focusing only on the decoy and target may be a cause of theattraction effect.
Because people prefer non-compensatory strategies, we thereforechose to test one taken from the decision making literature, ELIMI-NATION BY ASPECTS (EBA) [86]. This strategy should allow thedecision maker to minimize explicit consideration of trade-offs, in away that avoids the attraction effect, by promoting a slower, more de-liberate form of local decision-making. In EBA, the decision makerfirst rejects all the alternatives that do not satisfy her choice criteria toend up with the alternative of her choice. Similarly, as we explained
in Sect. 3.4, a typical attraction effect choice task is divided into twosubtasks: the decision maker is expected to first recognize the dominantpoints by rejecting the decoy(s), and, second to choose between the twotrade-off choices [18]. Since the first step is often claimed to cause thebias, in DELETION experiment, we attempt to differentiate these twotasks (dominance recognition and choice) with interaction, so that thedominance recognition task does not affect the final decision.
5.4 Implementing the elimination by aspects (EBA)In the EBA, unwanted alternatives are removed from a dataset. Weexplore how to implement this strategy in a visualization tool.
5.4.1 Deletion in visualizationAs deletion we refer to the task of removing one or more data casesfrom a visualized dataset. Deletion is a low-level analytic task [15] thatis usually omitted from most visualization taxonomies [1,78,85,91,95].We consider two ways to delete data from a visualization tool:
• Filter-based deletion: A common task in visualization systems isto perform a filter-based deletion by removing data cases “basedon their values concerning specific attributes” [63]. Filter-baseddeletion of data cases is a common interaction during visualanalysis tasks. Consider a dataset with two data points A and Bwith values XA > XB for a given attribute X. If a user wants toremove B as an outlier because of its high X value (e.g., to reduceclutter), she will also want to remove outlier A. This is a commonfilter-based deletion based on a value threshold.
• Local deletion: As local deletion we define the task of removingdata cases that have been explicitly identified by the user. Alocal deletion of data cases is a less common interaction. In theexample above, deleting only the outlier B without a link to otherdataset features would likely be a source of confusion.
Although filter-based deletion and local deletion sound similar, theyare not equivalent: For instance, a visualization user who wants afford-able houses, can remove data cases based on their price (filter-baseddeletion). If she does not like the photo of a house (or due to othercriteria not included in the dataset) she can also remove the specifichouse data case (local deletion). The filter-based deletion reflects arule in which all data-cases that meet it are removed (e.g., all expensivehouses). In local deletion, the data cases with similar or even identicalhouse photos will not be removed as the system is not aware of theremoval criteria. Most decision-support visualizations [23] allow filter-based deletion but do not support local deletion features. For example,in LineUp, the user can not directly remove a row from the table, butshe can remove rows by specifying attribute filters [35].
5.4.2 Deletion for mitigating the attraction effectBoth filter-based and local deletion might help reduce the attractioneffect. The dominated datapoints could be removed once the userindicates a threshold of their attributes based on the target and thecompetitor. However, our goal is to propose an interaction that canlater be used to support real-world decision tasks and help decisionmakers to remove irrelevant information that cannot be summarized bythresholds for dataset attributes.
Local deletion can be particularly useful in decision making. First,it is likely that a decision maker will weigh information not includedin the dataset, e.g., to rule out failed solutions that she tried in the past.Moreover, even if the decision maker wants to make a decision basedon information that exists in the dataset, she may not know a preciserule for the criteria. For example, the house buyer may delete a houseshe finds too expensive for having only one bathroom and no otherparticular appealing attribute. This does not imply that she wants allexpensive houses with one bathroom to be removed (e.g., she couldcompromise with a house with other room surplus and appealing biggarden). Choice preferences can evolve during exploration and areoften formed progressively based on the availability of the alternatives.
In the next section, we test whether decision makers who can lo-cally “clean up” the decision space from irrelevant information are lessvulnerable to the attraction effect.
1077-2626 (c) 2018 IEEE. Personal use is permitted, but republication/redistribution requires IEEE permission. See http://www.ieee.org/publications_standards/publications/rights/index.html for more information.
This article has been accepted for publication in a future issue of this journal, but has not been fully edited. Content may change prior to final publication. Citation information: DOI 10.1109/TVCG.2018.2865233, IEEETransactions on Visualization and Computer Graphics
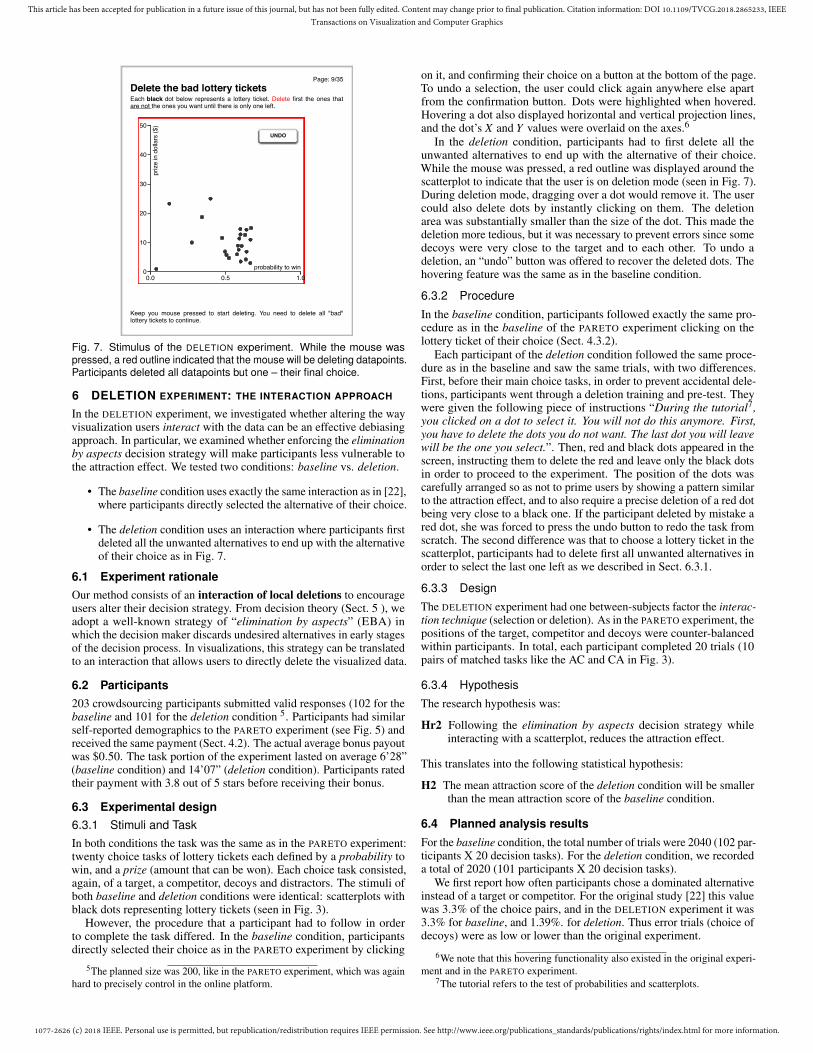
Delete the bad lottery ticketsPage: 9/35
Each black dot below represents a lottery ticket. Delete first the ones thatare not the ones you want until there is only one left.
0.0 0.5 1.0probability to win
0
10
20
30
40
50
priz
e in
dol
lars
($)
UNDOUNDO
Keep you mouse pressed to start deleting. You need to delete all "bad"lottery tickets to continue.
Fig. 7. Stimulus of the DELETION experiment. While the mouse waspressed, a red outline indicated that the mouse will be deleting datapoints.Participants deleted all datapoints but one – their final choice.
6 DELETION EXPERIMENT: THE INTERACTION APPROACH
In the DELETION experiment, we investigated whether altering the wayvisualization users interact with the data can be an effective debiasingapproach. In particular, we examined whether enforcing the eliminationby aspects decision strategy will make participants less vulnerable tothe attraction effect. We tested two conditions: baseline vs. deletion.
• The baseline condition uses exactly the same interaction as in [22],where participants directly selected the alternative of their choice.
• The deletion condition uses an interaction where participants firstdeleted all the unwanted alternatives to end up with the alternativeof their choice as in Fig. 7.
6.1 Experiment rationaleOur method consists of an interaction of local deletions to encourageusers alter their decision strategy. From decision theory (Sect. 5 ), weadopt a well-known strategy of “elimination by aspects” (EBA) inwhich the decision maker discards undesired alternatives in early stagesof the decision process. In visualizations, this strategy can be translatedto an interaction that allows users to directly delete the visualized data.
6.2 Participants203 crowdsourcing participants submitted valid responses (102 for thebaseline and 101 for the deletion condition 5. Participants had similarself-reported demographics to the PARETO experiment (see Fig. 5) andreceived the same payment (Sect. 4.2). The actual average bonus payoutwas $0.50. The task portion of the experiment lasted on average 6’28”(baseline condition) and 14’07” (deletion condition). Participants ratedtheir payment with 3.8 out of 5 stars before receiving their bonus.
6.3 Experimental design6.3.1 Stimuli and TaskIn both conditions the task was the same as in the PARETO experiment:twenty choice tasks of lottery tickets each defined by a probability towin, and a prize (amount that can be won). Each choice task consisted,again, of a target, a competitor, decoys and distractors. The stimuli ofboth baseline and deletion conditions were identical: scatterplots withblack dots representing lottery tickets (seen in Fig. 3).
However, the procedure that a participant had to follow in orderto complete the task differed. In the baseline condition, participantsdirectly selected their choice as in the PARETO experiment by clicking
5The planned size was 200, like in the PARETO experiment, which was againhard to precisely control in the online platform.
on it, and confirming their choice on a button at the bottom of the page.To undo a selection, the user could click again anywhere else apartfrom the confirmation button. Dots were highlighted when hovered.Hovering a dot also displayed horizontal and vertical projection lines,and the dot’s X and Y values were overlaid on the axes.6
In the deletion condition, participants had to first delete all theunwanted alternatives to end up with the alternative of their choice.While the mouse was pressed, a red outline was displayed around thescatterplot to indicate that the user is on deletion mode (seen in Fig. 7).During deletion mode, dragging over a dot would remove it. The usercould also delete dots by instantly clicking on them. The deletionarea was substantially smaller than the size of the dot. This made thedeletion more tedious, but it was necessary to prevent errors since somedecoys were very close to the target and to each other. To undo adeletion, an “undo” button was offered to recover the deleted dots. Thehovering feature was the same as in the baseline condition.
6.3.2 ProcedureIn the baseline condition, participants followed exactly the same pro-cedure as in the baseline of the PARETO experiment clicking on thelottery ticket of their choice (Sect. 4.3.2).
Each participant of the deletion condition followed the same proce-dure as in the baseline and saw the same trials, with two differences.First, before their main choice tasks, in order to prevent accidental dele-tions, participants went through a deletion training and pre-test. Theywere given the following piece of instructions “During the tutorial7,you clicked on a dot to select it. You will not do this anymore. First,you have to delete the dots you do not want. The last dot you will leavewill be the one you select.”. Then, red and black dots appeared in thescreen, instructing them to delete the red and leave only the black dotsin order to proceed to the experiment. The position of the dots wascarefully arranged so as not to prime users by showing a pattern similarto the attraction effect, and to also require a precise deletion of a red dotbeing very close to a black one. If the participant deleted by mistake ared dot, she was forced to press the undo button to redo the task fromscratch. The second difference was that to choose a lottery ticket in thescatterplot, participants had to delete first all unwanted alternatives inorder to select the last one left as we described in Sect. 6.3.1.
6.3.3 DesignThe DELETION experiment had one between-subjects factor the interac-tion technique (selection or deletion). As in the PARETO experiment, thepositions of the target, competitor and decoys were counter-balancedwithin participants. In total, each participant completed 20 trials (10pairs of matched tasks like the AC and CA in Fig. 3).
6.3.4 HypothesisThe research hypothesis was:
Hr2 Following the elimination by aspects decision strategy whileinteracting with a scatterplot, reduces the attraction effect.
This translates into the following statistical hypothesis:
H2 The mean attraction score of the deletion condition will be smallerthan the mean attraction score of the baseline condition.
6.4 Planned analysis resultsFor the baseline condition, the total number of trials were 2040 (102 par-ticipants X 20 decision tasks). For the deletion condition, we recordeda total of 2020 (101 participants X 20 decision tasks).
We first report how often participants chose a dominated alternativeinstead of a target or competitor. For the original study [22] this valuewas 3.3% of the choice pairs, and in the DELETION experiment it was3.3% for baseline, and 1.39%. for deletion. Thus error trials (choice ofdecoys) were as low or lower than the original experiment.
6We note that this hovering functionality also existed in the original experi-ment and in the PARETO experiment.
7The tutorial refers to the test of probabilities and scatterplots.
1077-2626 (c) 2018 IEEE. Personal use is permitted, but republication/redistribution requires IEEE permission. See http://www.ieee.org/publications_standards/publications/rights/index.html for more information.
This article has been accepted for publication in a future issue of this journal, but has not been fully edited. Content may change prior to final publication. Citation information: DOI 10.1109/TVCG.2018.2865233, IEEETransactions on Visualization and Computer Graphics
−20% 0% 20%
no a
ttrac
tion
effe
ct
BASELINE
DIFFERENCE
−10% 10%
DELETION
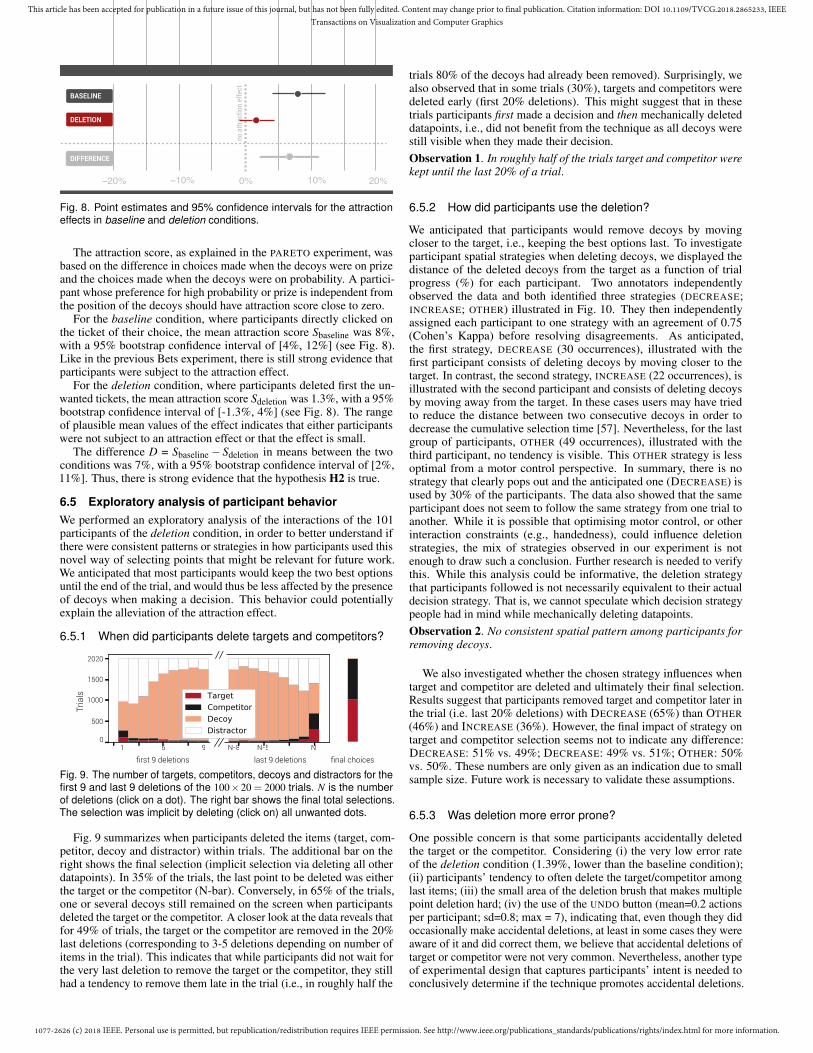
Fig. 8. Point estimates and 95% confidence intervals for the attractioneffects in baseline and deletion conditions.
The attraction score, as explained in the PARETO experiment, wasbased on the difference in choices made when the decoys were on prizeand the choices made when the decoys were on probability. A partici-pant whose preference for high probability or prize is independent fromthe position of the decoys should have attraction score close to zero.
For the baseline condition, where participants directly clicked onthe ticket of their choice, the mean attraction score Sbaseline was 8%,with a 95% bootstrap confidence interval of [4%, 12%] (see Fig. 8).Like in the previous Bets experiment, there is still strong evidence thatparticipants were subject to the attraction effect.
For the deletion condition, where participants deleted first the un-wanted tickets, the mean attraction score Sdeletion was 1.3%, with a 95%bootstrap confidence interval of [-1.3%, 4%] (see Fig. 8). The rangeof plausible mean values of the effect indicates that either participantswere not subject to an attraction effect or that the effect is small.
The difference D = Sbaseline − Sdeletion in means between the twoconditions was 7%, with a 95% bootstrap confidence interval of [2%,11%]. Thus, there is strong evidence that the hypothesis H2 is true.
6.5 Exploratory analysis of participant behaviorWe performed an exploratory analysis of the interactions of the 101participants of the deletion condition, in order to better understand ifthere were consistent patterns or strategies in how participants used thisnovel way of selecting points that might be relevant for future work.We anticipated that most participants would keep the two best optionsuntil the end of the trial, and would thus be less affected by the presenceof decoys when making a decision. This behavior could potentiallyexplain the alleviation of the attraction effect.
6.5.1 When did participants delete targets and competitors?
1
Tria
ls
5 9 N-8 N-5 N
first 9 deletions last 9 deletions
2020
1500
1000
500
0
final choices
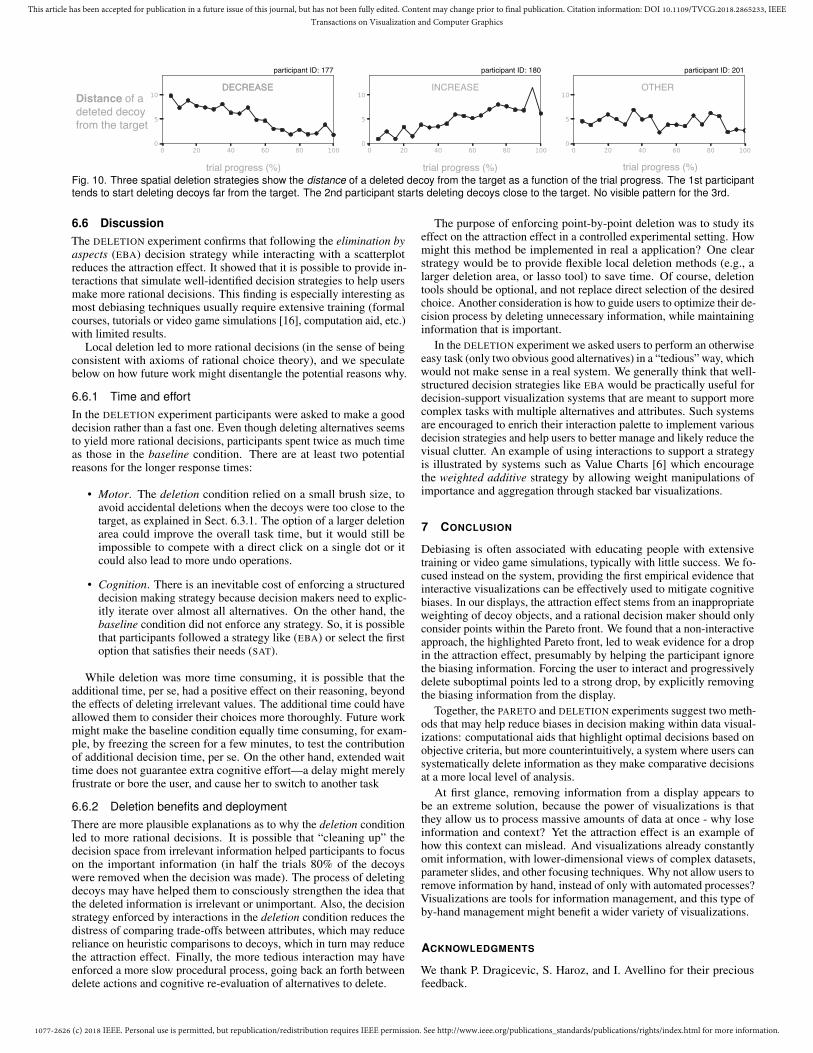
Fig. 9. The number of targets, competitors, decoys and distractors for thefirst 9 and last 9 deletions of the 100×20 = 2000 trials. N is the numberof deletions (click on a dot). The right bar shows the final total selections.The selection was implicit by deleting (click on) all unwanted dots.
Fig. 9 summarizes when participants deleted the items (target, com-petitor, decoy and distractor) within trials. The additional bar on theright shows the final selection (implicit selection via deleting all otherdatapoints). In 35% of the trials, the last point to be deleted was eitherthe target or the competitor (N-bar). Conversely, in 65% of the trials,one or several decoys still remained on the screen when participantsdeleted the target or the competitor. A closer look at the data reveals thatfor 49% of trials, the target or the competitor are removed in the 20%last deletions (corresponding to 3-5 deletions depending on number ofitems in the trial). This indicates that while participants did not wait forthe very last deletion to remove the target or the competitor, they stillhad a tendency to remove them late in the trial (i.e., in roughly half the
trials 80% of the decoys had already been removed). Surprisingly, wealso observed that in some trials (30%), targets and competitors weredeleted early (first 20% deletions). This might suggest that in thesetrials participants first made a decision and then mechanically deleteddatapoints, i.e., did not benefit from the technique as all decoys werestill visible when they made their decision.Observation 1. In roughly half of the trials target and competitor werekept until the last 20% of a trial.
6.5.2 How did participants use the deletion?
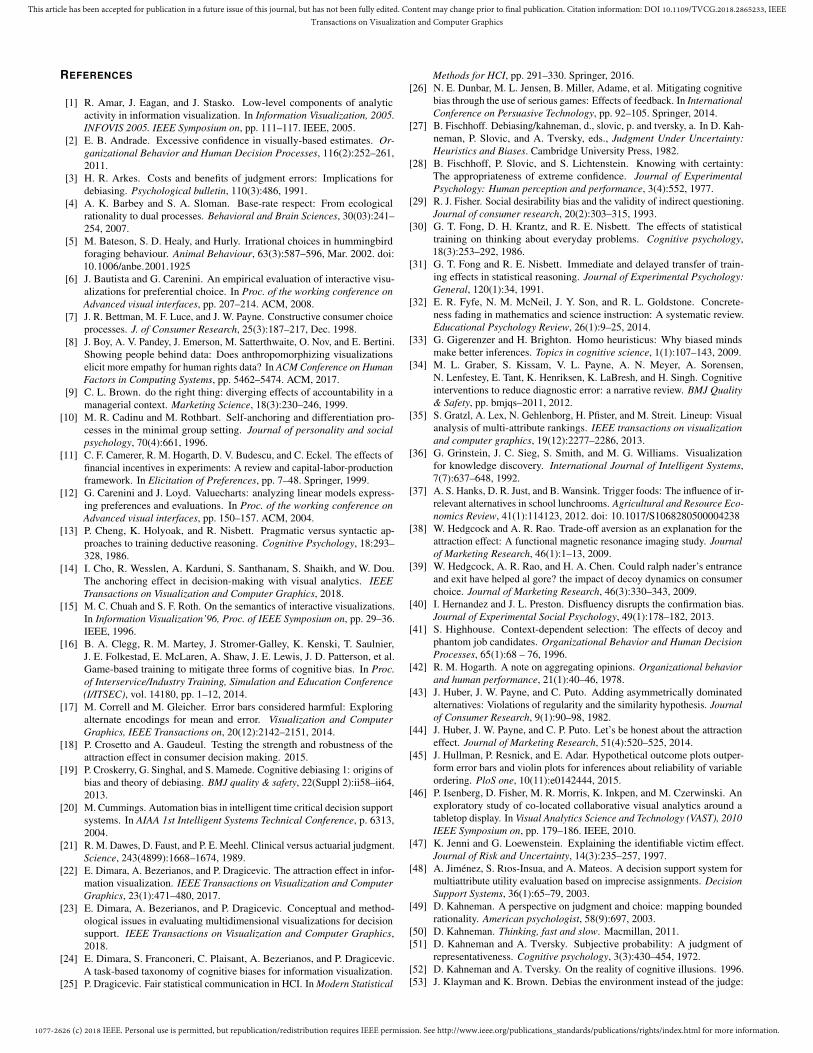
We anticipated that participants would remove decoys by movingcloser to the target, i.e., keeping the best options last. To investigateparticipant spatial strategies when deleting decoys, we displayed thedistance of the deleted decoys from the target as a function of trialprogress (%) for each participant. Two annotators independentlyobserved the data and both identified three strategies (DECREASE;INCREASE; OTHER) illustrated in Fig. 10. They then independentlyassigned each participant to one strategy with an agreement of 0.75(Cohen’s Kappa) before resolving disagreements. As anticipated,the first strategy, DECREASE (30 occurrences), illustrated with thefirst participant consists of deleting decoys by moving closer to thetarget. In contrast, the second strategy, INCREASE (22 occurrences), isillustrated with the second participant and consists of deleting decoysby moving away from the target. In these cases users may have triedto reduce the distance between two consecutive decoys in order todecrease the cumulative selection time [57]. Nevertheless, for the lastgroup of participants, OTHER (49 occurrences), illustrated with thethird participant, no tendency is visible. This OTHER strategy is lessoptimal from a motor control perspective. In summary, there is nostrategy that clearly pops out and the anticipated one (DECREASE) isused by 30% of the participants. The data also showed that the sameparticipant does not seem to follow the same strategy from one trial toanother. While it is possible that optimising motor control, or otherinteraction constraints (e.g., handedness), could influence deletionstrategies, the mix of strategies observed in our experiment is notenough to draw such a conclusion. Further research is needed to verifythis. While this analysis could be informative, the deletion strategythat participants followed is not necessarily equivalent to their actualdecision strategy. That is, we cannot speculate which decision strategypeople had in mind while mechanically deleting datapoints.Observation 2. No consistent spatial pattern among participants forremoving decoys.
We also investigated whether the chosen strategy influences whentarget and competitor are deleted and ultimately their final selection.Results suggest that participants removed target and competitor later inthe trial (i.e. last 20% deletions) with DECREASE (65%) than OTHER(46%) and INCREASE (36%). However, the final impact of strategy ontarget and competitor selection seems not to indicate any difference:DECREASE: 51% vs. 49%; DECREASE: 49% vs. 51%; OTHER: 50%vs. 50%. These numbers are only given as an indication due to smallsample size. Future work is necessary to validate these assumptions.
6.5.3 Was deletion more error prone?
One possible concern is that some participants accidentally deletedthe target or the competitor. Considering (i) the very low error rateof the deletion condition (1.39%, lower than the baseline condition);(ii) participants’ tendency to often delete the target/competitor amonglast items; (iii) the small area of the deletion brush that makes multiplepoint deletion hard; (iv) the use of the UNDO button (mean=0.2 actionsper participant; sd=0.8; max = 7), indicating that, even though they didoccasionally make accidental deletions, at least in some cases they wereaware of it and did correct them, we believe that accidental deletions oftarget or competitor were not very common. Nevertheless, another typeof experimental design that captures participants’ intent is needed toconclusively determine if the technique promotes accidental deletions.
1077-2626 (c) 2018 IEEE. Personal use is permitted, but republication/redistribution requires IEEE permission. See http://www.ieee.org/publications_standards/publications/rights/index.html for more information.
This article has been accepted for publication in a future issue of this journal, but has not been fully edited. Content may change prior to final publication. Citation information: DOI 10.1109/TVCG.2018.2865233, IEEETransactions on Visualization and Computer Graphics
DECREASE INCREASE OTHERDECREASEDistance of adeteted decoyfrom the target
trial progress (%) trial progress (%) trial progress (%)
participant ID: 177 participant ID: 180 participant ID: 201
Fig. 10. Three spatial deletion strategies show the distance of a deleted decoy from the target as a function of the trial progress. The 1st participanttends to start deleting decoys far from the target. The 2nd participant starts deleting decoys close to the target. No visible pattern for the 3rd.
6.6 DiscussionThe DELETION experiment confirms that following the elimination byaspects (EBA) decision strategy while interacting with a scatterplotreduces the attraction effect. It showed that it is possible to provide in-teractions that simulate well-identified decision strategies to help usersmake more rational decisions. This finding is especially interesting asmost debiasing techniques usually require extensive training (formalcourses, tutorials or video game simulations [16], computation aid, etc.)with limited results.
Local deletion led to more rational decisions (in the sense of beingconsistent with axioms of rational choice theory), and we speculatebelow on how future work might disentangle the potential reasons why.
6.6.1 Time and effortIn the DELETION experiment participants were asked to make a gooddecision rather than a fast one. Even though deleting alternatives seemsto yield more rational decisions, participants spent twice as much timeas those in the baseline condition. There are at least two potentialreasons for the longer response times:
• Motor. The deletion condition relied on a small brush size, toavoid accidental deletions when the decoys were too close to thetarget, as explained in Sect. 6.3.1. The option of a larger deletionarea could improve the overall task time, but it would still beimpossible to compete with a direct click on a single dot or itcould also lead to more undo operations.
• Cognition. There is an inevitable cost of enforcing a structureddecision making strategy because decision makers need to explic-itly iterate over almost all alternatives. On the other hand, thebaseline condition did not enforce any strategy. So, it is possiblethat participants followed a strategy like (EBA) or select the firstoption that satisfies their needs (SAT).
While deletion was more time consuming, it is possible that theadditional time, per se, had a positive effect on their reasoning, beyondthe effects of deleting irrelevant values. The additional time could haveallowed them to consider their choices more thoroughly. Future workmight make the baseline condition equally time consuming, for exam-ple, by freezing the screen for a few minutes, to test the contributionof additional decision time, per se. On the other hand, extended waittime does not guarantee extra cognitive effort—a delay might merelyfrustrate or bore the user, and cause her to switch to another task
6.6.2 Deletion benefits and deploymentThere are more plausible explanations as to why the deletion conditionled to more rational decisions. It is possible that “cleaning up” thedecision space from irrelevant information helped participants to focuson the important information (in half the trials 80% of the decoyswere removed when the decision was made). The process of deletingdecoys may have helped them to consciously strengthen the idea thatthe deleted information is irrelevant or unimportant. Also, the decisionstrategy enforced by interactions in the deletion condition reduces thedistress of comparing trade-offs between attributes, which may reducereliance on heuristic comparisons to decoys, which in turn may reducethe attraction effect. Finally, the more tedious interaction may haveenforced a more slow procedural process, going back an forth betweendelete actions and cognitive re-evaluation of alternatives to delete.
The purpose of enforcing point-by-point deletion was to study itseffect on the attraction effect in a controlled experimental setting. Howmight this method be implemented in real a application? One clearstrategy would be to provide flexible local deletion methods (e.g., alarger deletion area, or lasso tool) to save time. Of course, deletiontools should be optional, and not replace direct selection of the desiredchoice. Another consideration is how to guide users to optimize their de-cision process by deleting unnecessary information, while maintaininginformation that is important.
In the DELETION experiment we asked users to perform an otherwiseeasy task (only two obvious good alternatives) in a “tedious” way, whichwould not make sense in a real system. We generally think that well-structured decision strategies like EBA would be practically useful fordecision-support visualization systems that are meant to support morecomplex tasks with multiple alternatives and attributes. Such systemsare encouraged to enrich their interaction palette to implement variousdecision strategies and help users to better manage and likely reduce thevisual clutter. An example of using interactions to support a strategyis illustrated by systems such as Value Charts [6] which encouragethe weighted additive strategy by allowing weight manipulations ofimportance and aggregation through stacked bar visualizations.
7 CONCLUSION
Debiasing is often associated with educating people with extensivetraining or video game simulations, typically with little success. We fo-cused instead on the system, providing the first empirical evidence thatinteractive visualizations can be effectively used to mitigate cognitivebiases. In our displays, the attraction effect stems from an inappropriateweighting of decoy objects, and a rational decision maker should onlyconsider points within the Pareto front. We found that a non-interactiveapproach, the highlighted Pareto front, led to weak evidence for a dropin the attraction effect, presumably by helping the participant ignorethe biasing information. Forcing the user to interact and progressivelydelete suboptimal points led to a strong drop, by explicitly removingthe biasing information from the display.
Together, the PARETO and DELETION experiments suggest two meth-ods that may help reduce biases in decision making within data visual-izations: computational aids that highlight optimal decisions based onobjective criteria, but more counterintuitively, a system where users cansystematically delete information as they make comparative decisionsat a more local level of analysis.
At first glance, removing information from a display appears tobe an extreme solution, because the power of visualizations is thatthey allow us to process massive amounts of data at once - why loseinformation and context? Yet the attraction effect is an example ofhow this context can mislead. And visualizations already constantlyomit information, with lower-dimensional views of complex datasets,parameter slides, and other focusing techniques. Why not allow users toremove information by hand, instead of only with automated processes?Visualizations are tools for information management, and this type ofby-hand management might benefit a wider variety of visualizations.
ACKNOWLEDGMENTS
We thank P. Dragicevic, S. Haroz, and I. Avellino for their preciousfeedback.
1077-2626 (c) 2018 IEEE. Personal use is permitted, but republication/redistribution requires IEEE permission. See http://www.ieee.org/publications_standards/publications/rights/index.html for more information.
This article has been accepted for publication in a future issue of this journal, but has not been fully edited. Content may change prior to final publication. Citation information: DOI 10.1109/TVCG.2018.2865233, IEEETransactions on Visualization and Computer Graphics
REFERENCES
[1] R. Amar, J. Eagan, and J. Stasko. Low-level components of analyticactivity in information visualization. In Information Visualization, 2005.INFOVIS 2005. IEEE Symposium on, pp. 111–117. IEEE, 2005.
[2] E. B. Andrade. Excessive confidence in visually-based estimates. Or-ganizational Behavior and Human Decision Processes, 116(2):252–261,2011.
[3] H. R. Arkes. Costs and benefits of judgment errors: Implications fordebiasing. Psychological bulletin, 110(3):486, 1991.
[4] A. K. Barbey and S. A. Sloman. Base-rate respect: From ecologicalrationality to dual processes. Behavioral and Brain Sciences, 30(03):241–254, 2007.
[5] M. Bateson, S. D. Healy, and Hurly. Irrational choices in hummingbirdforaging behaviour. Animal Behaviour, 63(3):587–596, Mar. 2002. doi:10.1006/anbe.2001.1925
[6] J. Bautista and G. Carenini. An empirical evaluation of interactive visu-alizations for preferential choice. In Proc. of the working conference onAdvanced visual interfaces, pp. 207–214. ACM, 2008.
[7] J. R. Bettman, M. F. Luce, and J. W. Payne. Constructive consumer choiceprocesses. J. of Consumer Research, 25(3):187–217, Dec. 1998.
[8] J. Boy, A. V. Pandey, J. Emerson, M. Satterthwaite, O. Nov, and E. Bertini.Showing people behind data: Does anthropomorphizing visualizationselicit more empathy for human rights data? In ACM Conference on HumanFactors in Computing Systems, pp. 5462–5474. ACM, 2017.
[9] C. L. Brown. do the right thing: diverging effects of accountability in amanagerial context. Marketing Science, 18(3):230–246, 1999.
[10] M. R. Cadinu and M. Rothbart. Self-anchoring and differentiation pro-cesses in the minimal group setting. Journal of personality and socialpsychology, 70(4):661, 1996.
[11] C. F. Camerer, R. M. Hogarth, D. V. Budescu, and C. Eckel. The effects offinancial incentives in experiments: A review and capital-labor-productionframework. In Elicitation of Preferences, pp. 7–48. Springer, 1999.
[12] G. Carenini and J. Loyd. Valuecharts: analyzing linear models express-ing preferences and evaluations. In Proc. of the working conference onAdvanced visual interfaces, pp. 150–157. ACM, 2004.
[13] P. Cheng, K. Holyoak, and R. Nisbett. Pragmatic versus syntactic ap-proaches to training deductive reasoning. Cognitive Psychology, 18:293–328, 1986.
[14] I. Cho, R. Wesslen, A. Karduni, S. Santhanam, S. Shaikh, and W. Dou.The anchoring effect in decision-making with visual analytics. IEEETransactions on Visualization and Computer Graphics, 2018.
[15] M. C. Chuah and S. F. Roth. On the semantics of interactive visualizations.In Information Visualization’96, Proc. of IEEE Symposium on, pp. 29–36.IEEE, 1996.
[16] B. A. Clegg, R. M. Martey, J. Stromer-Galley, K. Kenski, T. Saulnier,J. E. Folkestad, E. McLaren, A. Shaw, J. E. Lewis, J. D. Patterson, et al.Game-based training to mitigate three forms of cognitive bias. In Proc.of Interservice/Industry Training, Simulation and Education Conference(I/ITSEC), vol. 14180, pp. 1–12, 2014.
[17] M. Correll and M. Gleicher. Error bars considered harmful: Exploringalternate encodings for mean and error. Visualization and ComputerGraphics, IEEE Transactions on, 20(12):2142–2151, 2014.
[18] P. Crosetto and A. Gaudeul. Testing the strength and robustness of theattraction effect in consumer decision making. 2015.
[19] P. Croskerry, G. Singhal, and S. Mamede. Cognitive debiasing 1: origins ofbias and theory of debiasing. BMJ quality & safety, 22(Suppl 2):ii58–ii64,2013.
[20] M. Cummings. Automation bias in intelligent time critical decision supportsystems. In AIAA 1st Intelligent Systems Technical Conference, p. 6313,2004.
[21] R. M. Dawes, D. Faust, and P. E. Meehl. Clinical versus actuarial judgment.Science, 243(4899):1668–1674, 1989.
[22] E. Dimara, A. Bezerianos, and P. Dragicevic. The attraction effect in infor-mation visualization. IEEE Transactions on Visualization and ComputerGraphics, 23(1):471–480, 2017.
[23] E. Dimara, A. Bezerianos, and P. Dragicevic. Conceptual and method-ological issues in evaluating multidimensional visualizations for decisionsupport. IEEE Transactions on Visualization and Computer Graphics,2018.
[24] E. Dimara, S. Franconeri, C. Plaisant, A. Bezerianos, and P. Dragicevic.A task-based taxonomy of cognitive biases for information visualization.
[25] P. Dragicevic. Fair statistical communication in HCI. In Modern Statistical
Methods for HCI, pp. 291–330. Springer, 2016.[26] N. E. Dunbar, M. L. Jensen, B. Miller, Adame, et al. Mitigating cognitive
bias through the use of serious games: Effects of feedback. In InternationalConference on Persuasive Technology, pp. 92–105. Springer, 2014.
[27] B. Fischhoff. Debiasing/kahneman, d., slovic, p. and tversky, a. In D. Kah-neman, P. Slovic, and A. Tversky, eds., Judgment Under Uncertainty:Heuristics and Biases. Cambridge University Press, 1982.
[28] B. Fischhoff, P. Slovic, and S. Lichtenstein. Knowing with certainty:The appropriateness of extreme confidence. Journal of ExperimentalPsychology: Human perception and performance, 3(4):552, 1977.
[29] R. J. Fisher. Social desirability bias and the validity of indirect questioning.Journal of consumer research, 20(2):303–315, 1993.
[30] G. T. Fong, D. H. Krantz, and R. E. Nisbett. The effects of statisticaltraining on thinking about everyday problems. Cognitive psychology,18(3):253–292, 1986.
[31] G. T. Fong and R. E. Nisbett. Immediate and delayed transfer of train-ing effects in statistical reasoning. Journal of Experimental Psychology:General, 120(1):34, 1991.
[32] E. R. Fyfe, N. M. McNeil, J. Y. Son, and R. L. Goldstone. Concrete-ness fading in mathematics and science instruction: A systematic review.Educational Psychology Review, 26(1):9–25, 2014.
[33] G. Gigerenzer and H. Brighton. Homo heuristicus: Why biased mindsmake better inferences. Topics in cognitive science, 1(1):107–143, 2009.
[34] M. L. Graber, S. Kissam, V. L. Payne, A. N. Meyer, A. Sorensen,N. Lenfestey, E. Tant, K. Henriksen, K. LaBresh, and H. Singh. Cognitiveinterventions to reduce diagnostic error: a narrative review. BMJ Quality& Safety, pp. bmjqs–2011, 2012.
[35] S. Gratzl, A. Lex, N. Gehlenborg, H. Pfister, and M. Streit. Lineup: Visualanalysis of multi-attribute rankings. IEEE transactions on visualizationand computer graphics, 19(12):2277–2286, 2013.
[36] G. Grinstein, J. C. Sieg, S. Smith, and M. G. Williams. Visualizationfor knowledge discovery. International Journal of Intelligent Systems,7(7):637–648, 1992.
[37] A. S. Hanks, D. R. Just, and B. Wansink. Trigger foods: The influence of ir-relevant alternatives in school lunchrooms. Agricultural and Resource Eco-nomics Review, 41(1):114123, 2012. doi: 10.1017/S1068280500004238
[38] W. Hedgcock and A. R. Rao. Trade-off aversion as an explanation for theattraction effect: A functional magnetic resonance imaging study. Journalof Marketing Research, 46(1):1–13, 2009.
[39] W. Hedgcock, A. R. Rao, and H. A. Chen. Could ralph nader’s entranceand exit have helped al gore? the impact of decoy dynamics on consumerchoice. Journal of Marketing Research, 46(3):330–343, 2009.
[40] I. Hernandez and J. L. Preston. Disfluency disrupts the confirmation bias.Journal of Experimental Social Psychology, 49(1):178–182, 2013.
[41] S. Highhouse. Context-dependent selection: The effects of decoy andphantom job candidates. Organizational Behavior and Human DecisionProcesses, 65(1):68 – 76, 1996.
[42] R. M. Hogarth. A note on aggregating opinions. Organizational behaviorand human performance, 21(1):40–46, 1978.
[43] J. Huber, J. W. Payne, and C. Puto. Adding asymmetrically dominatedalternatives: Violations of regularity and the similarity hypothesis. Journalof Consumer Research, 9(1):90–98, 1982.
[44] J. Huber, J. W. Payne, and C. P. Puto. Let’s be honest about the attractioneffect. Journal of Marketing Research, 51(4):520–525, 2014.
[45] J. Hullman, P. Resnick, and E. Adar. Hypothetical outcome plots outper-form error bars and violin plots for inferences about reliability of variableordering. PloS one, 10(11):e0142444, 2015.
[46] P. Isenberg, D. Fisher, M. R. Morris, K. Inkpen, and M. Czerwinski. Anexploratory study of co-located collaborative visual analytics around atabletop display. In Visual Analytics Science and Technology (VAST), 2010IEEE Symposium on, pp. 179–186. IEEE, 2010.
[47] K. Jenni and G. Loewenstein. Explaining the identifiable victim effect.Journal of Risk and Uncertainty, 14(3):235–257, 1997.
[48] A. Jimenez, S. Rıos-Insua, and A. Mateos. A decision support system formultiattribute utility evaluation based on imprecise assignments. DecisionSupport Systems, 36(1):65–79, 2003.
[49] D. Kahneman. A perspective on judgment and choice: mapping boundedrationality. American psychologist, 58(9):697, 2003.
[50] D. Kahneman. Thinking, fast and slow. Macmillan, 2011.[51] D. Kahneman and A. Tversky. Subjective probability: A judgment of
representativeness. Cognitive psychology, 3(3):430–454, 1972.[52] D. Kahneman and A. Tversky. On the reality of cognitive illusions. 1996.[53] J. Klayman and K. Brown. Debias the environment instead of the judge:
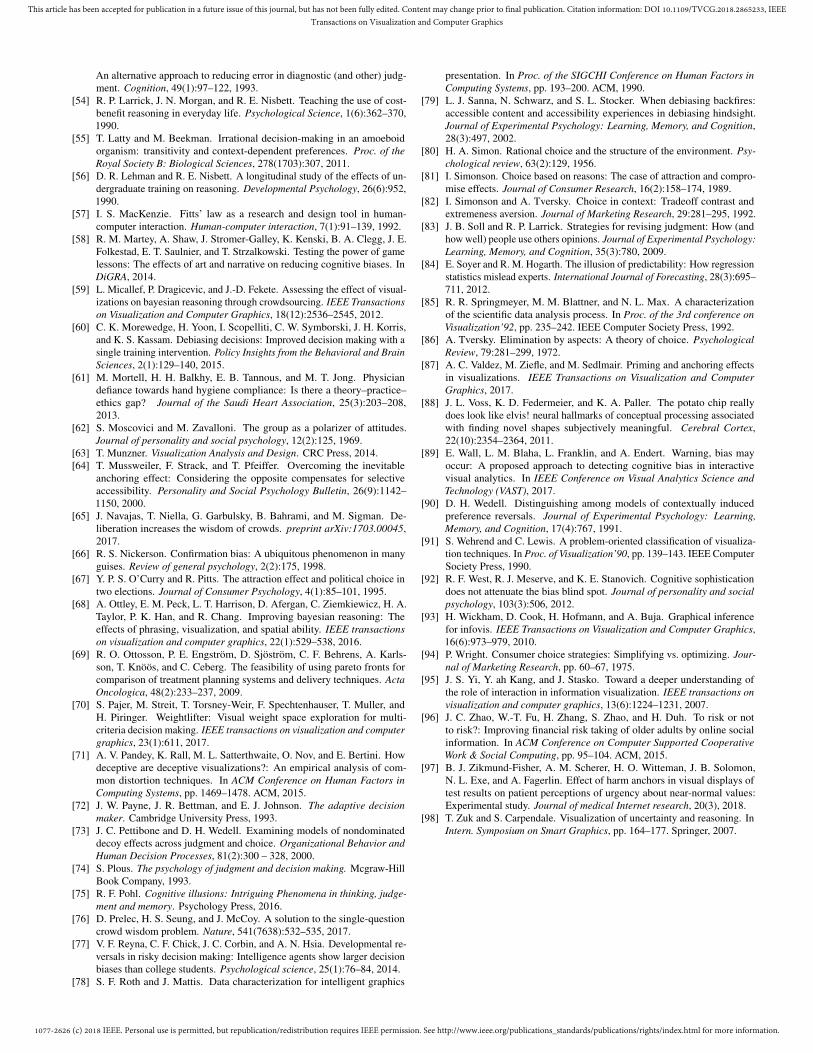
1077-2626 (c) 2018 IEEE. Personal use is permitted, but republication/redistribution requires IEEE permission. See http://www.ieee.org/publications_standards/publications/rights/index.html for more information.
This article has been accepted for publication in a future issue of this journal, but has not been fully edited. Content may change prior to final publication. Citation information: DOI 10.1109/TVCG.2018.2865233, IEEETransactions on Visualization and Computer Graphics
An alternative approach to reducing error in diagnostic (and other) judg-ment. Cognition, 49(1):97–122, 1993.
[54] R. P. Larrick, J. N. Morgan, and R. E. Nisbett. Teaching the use of cost-benefit reasoning in everyday life. Psychological Science, 1(6):362–370,1990.
[55] T. Latty and M. Beekman. Irrational decision-making in an amoeboidorganism: transitivity and context-dependent preferences. Proc. of theRoyal Society B: Biological Sciences, 278(1703):307, 2011.
[56] D. R. Lehman and R. E. Nisbett. A longitudinal study of the effects of un-dergraduate training on reasoning. Developmental Psychology, 26(6):952,1990.
[57] I. S. MacKenzie. Fitts’ law as a research and design tool in human-computer interaction. Human-computer interaction, 7(1):91–139, 1992.
[58] R. M. Martey, A. Shaw, J. Stromer-Galley, K. Kenski, B. A. Clegg, J. E.Folkestad, E. T. Saulnier, and T. Strzalkowski. Testing the power of gamelessons: The effects of art and narrative on reducing cognitive biases. InDiGRA, 2014.
[59] L. Micallef, P. Dragicevic, and J.-D. Fekete. Assessing the effect of visual-izations on bayesian reasoning through crowdsourcing. IEEE Transactionson Visualization and Computer Graphics, 18(12):2536–2545, 2012.
[60] C. K. Morewedge, H. Yoon, I. Scopelliti, C. W. Symborski, J. H. Korris,and K. S. Kassam. Debiasing decisions: Improved decision making with asingle training intervention. Policy Insights from the Behavioral and BrainSciences, 2(1):129–140, 2015.
[61] M. Mortell, H. H. Balkhy, E. B. Tannous, and M. T. Jong. Physiciandefiance towards hand hygiene compliance: Is there a theory–practice–ethics gap? Journal of the Saudi Heart Association, 25(3):203–208,2013.
[62] S. Moscovici and M. Zavalloni. The group as a polarizer of attitudes.Journal of personality and social psychology, 12(2):125, 1969.
[63] T. Munzner. Visualization Analysis and Design. CRC Press, 2014.[64] T. Mussweiler, F. Strack, and T. Pfeiffer. Overcoming the inevitable
anchoring effect: Considering the opposite compensates for selectiveaccessibility. Personality and Social Psychology Bulletin, 26(9):1142–1150, 2000.
[65] J. Navajas, T. Niella, G. Garbulsky, B. Bahrami, and M. Sigman. De-liberation increases the wisdom of crowds. preprint arXiv:1703.00045,2017.
[66] R. S. Nickerson. Confirmation bias: A ubiquitous phenomenon in manyguises. Review of general psychology, 2(2):175, 1998.
[67] Y. P. S. O’Curry and R. Pitts. The attraction effect and political choice intwo elections. Journal of Consumer Psychology, 4(1):85–101, 1995.
[68] A. Ottley, E. M. Peck, L. T. Harrison, D. Afergan, C. Ziemkiewicz, H. A.Taylor, P. K. Han, and R. Chang. Improving bayesian reasoning: Theeffects of phrasing, visualization, and spatial ability. IEEE transactionson visualization and computer graphics, 22(1):529–538, 2016.
[69] R. O. Ottosson, P. E. Engstrom, D. Sjostrom, C. F. Behrens, A. Karls-son, T. Knoos, and C. Ceberg. The feasibility of using pareto fronts forcomparison of treatment planning systems and delivery techniques. ActaOncologica, 48(2):233–237, 2009.
[70] S. Pajer, M. Streit, T. Torsney-Weir, F. Spechtenhauser, T. Muller, andH. Piringer. Weightlifter: Visual weight space exploration for multi-criteria decision making. IEEE transactions on visualization and computergraphics, 23(1):611, 2017.
[71] A. V. Pandey, K. Rall, M. L. Satterthwaite, O. Nov, and E. Bertini. Howdeceptive are deceptive visualizations?: An empirical analysis of com-mon distortion techniques. In ACM Conference on Human Factors inComputing Systems, pp. 1469–1478. ACM, 2015.
[72] J. W. Payne, J. R. Bettman, and E. J. Johnson. The adaptive decisionmaker. Cambridge University Press, 1993.
[73] J. C. Pettibone and D. H. Wedell. Examining models of nondominateddecoy effects across judgment and choice. Organizational Behavior andHuman Decision Processes, 81(2):300 – 328, 2000.
[74] S. Plous. The psychology of judgment and decision making. Mcgraw-HillBook Company, 1993.
[75] R. F. Pohl. Cognitive illusions: Intriguing Phenomena in thinking, judge-ment and memory. Psychology Press, 2016.
[76] D. Prelec, H. S. Seung, and J. McCoy. A solution to the single-questioncrowd wisdom problem. Nature, 541(7638):532–535, 2017.
[77] V. F. Reyna, C. F. Chick, J. C. Corbin, and A. N. Hsia. Developmental re-versals in risky decision making: Intelligence agents show larger decisionbiases than college students. Psychological science, 25(1):76–84, 2014.
[78] S. F. Roth and J. Mattis. Data characterization for intelligent graphics
presentation. In Proc. of the SIGCHI Conference on Human Factors inComputing Systems, pp. 193–200. ACM, 1990.
[79] L. J. Sanna, N. Schwarz, and S. L. Stocker. When debiasing backfires:accessible content and accessibility experiences in debiasing hindsight.Journal of Experimental Psychology: Learning, Memory, and Cognition,28(3):497, 2002.
[80] H. A. Simon. Rational choice and the structure of the environment. Psy-chological review, 63(2):129, 1956.
[81] I. Simonson. Choice based on reasons: The case of attraction and compro-mise effects. Journal of Consumer Research, 16(2):158–174, 1989.
[82] I. Simonson and A. Tversky. Choice in context: Tradeoff contrast andextremeness aversion. Journal of Marketing Research, 29:281–295, 1992.
[83] J. B. Soll and R. P. Larrick. Strategies for revising judgment: How (andhow well) people use others opinions. Journal of Experimental Psychology:Learning, Memory, and Cognition, 35(3):780, 2009.
[84] E. Soyer and R. M. Hogarth. The illusion of predictability: How regressionstatistics mislead experts. International Journal of Forecasting, 28(3):695–711, 2012.
[85] R. R. Springmeyer, M. M. Blattner, and N. L. Max. A characterizationof the scientific data analysis process. In Proc. of the 3rd conference onVisualization’92, pp. 235–242. IEEE Computer Society Press, 1992.
[86] A. Tversky. Elimination by aspects: A theory of choice. PsychologicalReview, 79:281–299, 1972.
[87] A. C. Valdez, M. Ziefle, and M. Sedlmair. Priming and anchoring effectsin visualizations. IEEE Transactions on Visualization and ComputerGraphics, 2017.
[88] J. L. Voss, K. D. Federmeier, and K. A. Paller. The potato chip reallydoes look like elvis! neural hallmarks of conceptual processing associatedwith finding novel shapes subjectively meaningful. Cerebral Cortex,22(10):2354–2364, 2011.
[89] E. Wall, L. M. Blaha, L. Franklin, and A. Endert. Warning, bias mayoccur: A proposed approach to detecting cognitive bias in interactivevisual analytics. In IEEE Conference on Visual Analytics Science andTechnology (VAST), 2017.
[90] D. H. Wedell. Distinguishing among models of contextually inducedpreference reversals. Journal of Experimental Psychology: Learning,Memory, and Cognition, 17(4):767, 1991.
[91] S. Wehrend and C. Lewis. A problem-oriented classification of visualiza-tion techniques. In Proc. of Visualization’90, pp. 139–143. IEEE ComputerSociety Press, 1990.
[92] R. F. West, R. J. Meserve, and K. E. Stanovich. Cognitive sophisticationdoes not attenuate the bias blind spot. Journal of personality and socialpsychology, 103(3):506, 2012.
[93] H. Wickham, D. Cook, H. Hofmann, and A. Buja. Graphical inferencefor infovis. IEEE Transactions on Visualization and Computer Graphics,16(6):973–979, 2010.
[94] P. Wright. Consumer choice strategies: Simplifying vs. optimizing. Jour-nal of Marketing Research, pp. 60–67, 1975.
[95] J. S. Yi, Y. ah Kang, and J. Stasko. Toward a deeper understanding ofthe role of interaction in information visualization. IEEE transactions onvisualization and computer graphics, 13(6):1224–1231, 2007.
[96] J. C. Zhao, W.-T. Fu, H. Zhang, S. Zhao, and H. Duh. To risk or notto risk?: Improving financial risk taking of older adults by online socialinformation. In ACM Conference on Computer Supported CooperativeWork & Social Computing, pp. 95–104. ACM, 2015.
[97] B. J. Zikmund-Fisher, A. M. Scherer, H. O. Witteman, J. B. Solomon,N. L. Exe, and A. Fagerlin. Effect of harm anchors in visual displays oftest results on patient perceptions of urgency about near-normal values:Experimental study. Journal of medical Internet research, 20(3), 2018.
[98] T. Zuk and S. Carpendale. Visualization of uncertainty and reasoning. InIntern. Symposium on Smart Graphics, pp. 164–177. Springer, 2007.