Embed Size (px)
Citation preview
1
American -Ukrainian Workshop on “Innovative Combustion and Aerothermal Technologies in Energy and Power System” May 20-25, 2001, Kiev, Ukraine
MIST/STEAM COOLING FOR ADVANCED TURBINE SYSTEMS
Ting Wang
Energy Conversion and Conservation Center
University of New Orleans New Orleans, LA 70148-2220, USA
1-504-280-7183, 1-504-280-5539 (fax) [email protected]
ABSTRACT
Closed-loop steam cooling has been adopted by two major gas turbine manufacturers for their heavy-frame Advanced Turbine System (ATS) engines. The major advantage of closed-loop steam cooling is that it can eliminate the need for film cooling. Without conventional film cooling, internal cooling of the turbine airfoils requires significant enhancement. To help significantly increase the cooling enhancement, the concept of employing closed-loop mist/steam cooling has been explored by conducting experiments on four test conditions: a horizontal tube, a 180o curved tube, impingement jets on a flat surface, and impingement jets on a curved surface.
The mist/steam mixture was obtained by blending fine water droplets (3~15 µm in diameter) with the saturated steam at 1.2 bars. A phase Doppler particle analyzer (PDPA) system was employed to obtain information of mist transportation and droplet dynamics of the water droplets including size distribution, velocity distribution, and turbulence.
Generally, the heat transfer performance of steam can be significantly improved by adding mist of an average diameter of 5~7 µm into the main flow. An average enhancement of 100% with the highest local heat transfer enhancements of 200% ~ 500% are achieved with 2 ~ 5% mist. This paper reviews some of these results.
NOMENCLATURE
b = Jet width (7.5mm) D = deposition rate Dch = channel diameter d = droplet diameter d10 = droplet arithmetic mean diameter d20 = droplet surface mean diameter d30 = droplet volume mean diameter E = entrainment rate
h0 = heat transfer coefficient for single-phase flow hmist = heat transfer coefficient for mist/steam flow hlg = latent heat of the liquid H = heating factor, H = q” / (Re mr) k = thermal conductivity mr = droplet mass flow ratio Nu = Nusselt number, Nu = hDch/k Pr = Prandtl number, ν /α q” = heat flux Re = Ud/ν, Reynolds number Tsat = saturation temperature of steam Tw = wall temperature U = mean flow velocity
y = perpendicular distance from test wall surface ν = kinematic viscosity ρ = density µ = dynamic viscosity Subscripts 0 = stagnation point j = jet gas or vapor phase l = liquid phase sat = saturation w = wall
INTRODUCTION
Two major gas turbine manufacturers have adopted closed-loop steam cooling for their heavy-frame Advanced Turbine System (ATS) engines. The major advantage of closed-loop steam cooling is that it can eliminate the need for film cooling. As the turbine inlet temperature is raised to 1400°C (~2600°F), excessive film cooling is the major obstacle to a further increase in gas turbine thermal efficiency (Bannister, et al, 1994) because as the cooling air is injected from the airfoil into the main hot gas flow, it interferes with the main flow field and subsequently causes aerodynamic and thermal losses. Meanwhile, less air is available for combustion and therefore the work output will be
2
reduced. Furthermore, excessive film cooling will force the combustion temperature to be raised to achieve the desired turbine inlet temperature. This further compounds the issue of reducing NOx and controlling emissions.
As a result, using the closed-loop steam cooling scheme allows a higher thermal efficiency than using air film cooling (Farmer and Fulton, 1995). However, there are still many technical challenges to overcome. One of the most challenging problems is that a very large amount of steam will be needed (Mukherjee, 1984; Wenglarz, et al, 1994). The reason is that to eliminate film cooling, the coolant side heat transfer coefficient must be greatly increased to about 8,000-10,000 W/m2K. To reach this, a very high steam Reynolds number and thus a very high steam flow rate must be maintained. Drawing this large amount of steam from the bottom steam cycle would decrease the thermal efficiency of the bottom steam turbines since the normal steam expansion process would be interrupted. Furthermore, high steam flow rate will significantly increase the pressure losses.
In this study, the concept of closed-loop steam/mist cooling is proposed to alleviate some of the above mentioned problems. The concept of using mist/steam cooling is based on its following features: (a) latent heat of evaporation, (b) increased specific heat, (c) steeper temperature gradient near the wall, (d) lower bulk temperature, (e) increased flow mixing induced by steam-particle interactions and particle dynamics, and (f) additional momentum and mass transfer induced by evaporation of liquid droplets on/near the wall. As a result, for mist/steam cooling, the steam mass flow rate can be greatly reduced to reach the same heat transfer performance as the single steam flow.
Although there are numerous investigations on the 1-component, 2-phase water/steam flow such as the post-dry out dispersed flow heat transfer or the 2-component, 2-phase mist/air flow, no experimental studies (except those published by the author's group) can be found in the open literature of internal mist/steam flow where the mist is generated by atomizing water and then injected into the steam under controlled conditions. Previous studies in these two related areas, namely, the post-dry out dispersed flow and the 2-component 2-phase mist/air internal flow, have provided guidance to the current study. Both have a dispersed liquid phase flowing within a gas phase, as in the case of the mist/steam flow. The main difference between the post-dry out dispersed flow and the present mist/steam flow is the different inlet conditions. The droplet size and distribution as well as the liquid mass fraction at the Critical Heat Flux (CHF) point for post-dry out flow depend on the flow conditions prior to the CHF point and are usually difficult to control. The inlet conditions for the mist/steam internal flow are controlled mainly by the atomizing system; the droplet size and distribution as well as the liquid mass fraction and liquid temperature are systematically controlled. The droplets in the post-dry out flow are usually generated from the breakup and entrainment of liquid layers and the droplet sizes are quite large. The
radial temperature profile is more developed in the post-dry out flow than in the current flow in which the mist/steam mixture is introduced homogeneously into a highly heated test section.
The difference between mist/air flow and mist/steam flow is that they are thermodynamically different. Mist/air is a 2-component 2-phase flow where the evaporation process of the water droplets is controlled by the partial pressure of the water vapor in the air, not by the total pressure of the mixture. Mist/steam is a 1-component 2-phase flow in which the evaporation process of the water droplets is controlled by the steam pressure. Generally, under the same pressure and the same temperature, the droplets within mist/air flow are more likely to evaporate than those within mist/steam flow. For example, for mist/steam flow under saturated pressure and temperature, no evaporation would occur. However, for mist/air flow under the same pressure and temperature, if the air is dry, the water droplets would be in a superheated state and evaporate immediately because the partial pressure of the vapor is lower than the saturated pressure.
EXPERIMENTAL PROGRAM
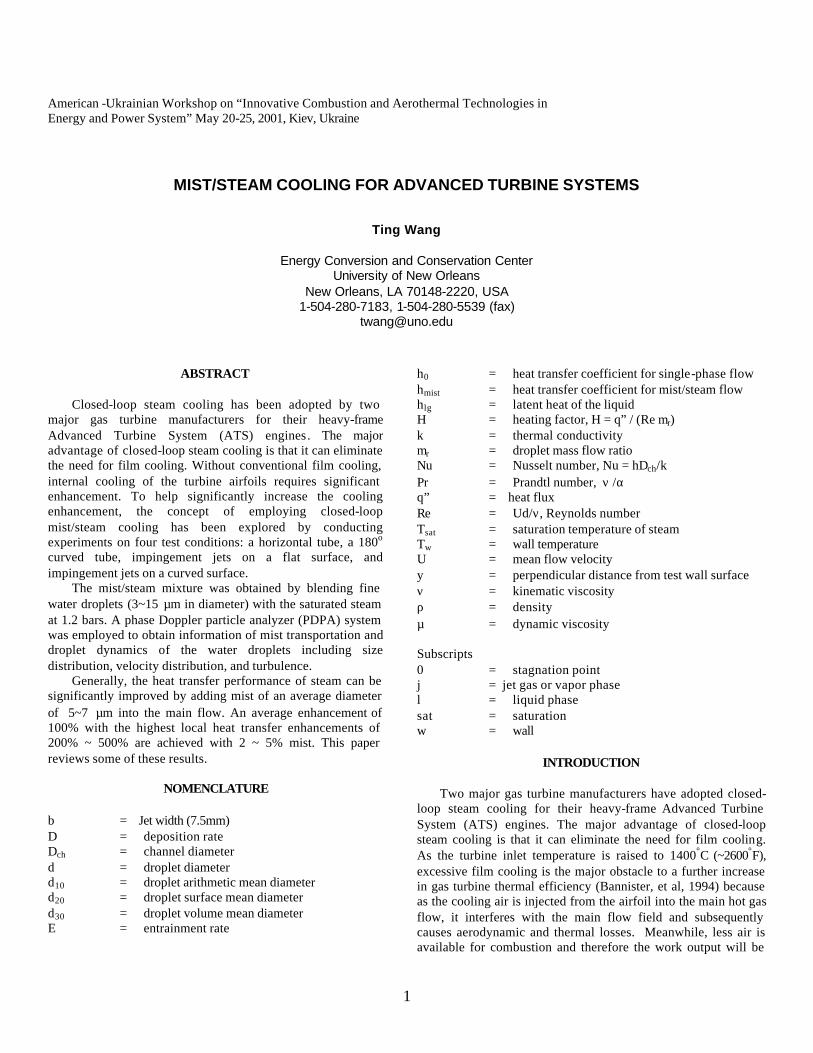
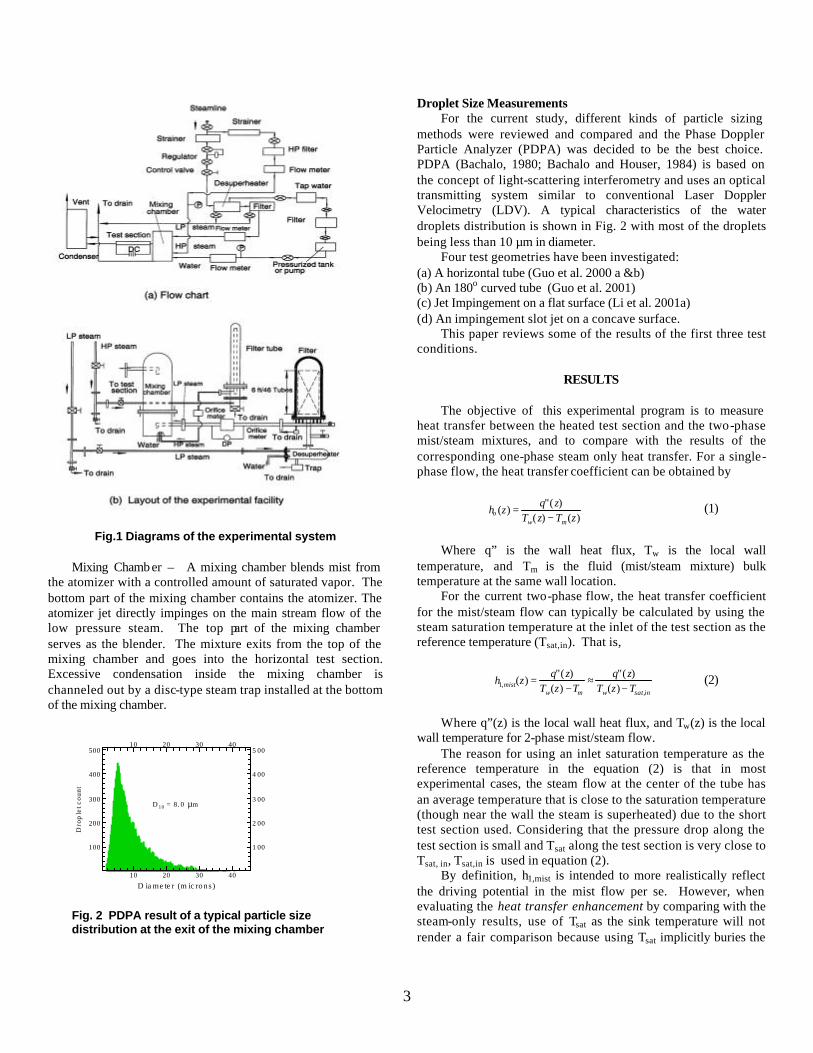
A test facility (Fig.1) was assembled comprising steam supplied and regulated at low pressure (up to 2 bar absolute) and at about 6 bar absolute. Both supply sources were de-superheated and filtered to ensure best purity and least particulates. Mist was added from pressure-atomized nozzles and mixed with measured amounts of low-pressure steam. The mixture was admitted to the test section. Exhaust from the test section was routed to a condenser. Condensate and liquid from captured droplets were collected at selected points to maintain mass flow information. Basically, the experimental setup (Fig. 1) consists of four systems: a steam system, a water system, an atomizing system, and the test section.
Steam System – The steam system consists of a low-pressure steam subsystem and a high-pressure steam subsystem. The low-pressure subsystem supplies the needed main steam flow. The high pressure (approximately 8.5 bar) steam subsystem furnishes the energy source for the “steam-assisted” pneumatic atomizer to generate mist from water. Steam pressure in the test sections reached 1.5 bars.
Water System – Two water systems were designed for two different atomizing systems. The low-pressure water system, used for the “steam-assist” pneumatic atomizer. A high-pressure water system is designed for the pressure atomizers, where the filtered tap water is compressed to a pressure of up to 68 bar (1000 psi) by a high pressure pump.
Atomizing System – After considering several atomizing systems, the pressure atomizer with high pressure water (1000 psi) was adopted in this study because the mean droplet size and the droplet mass ratio (less than 1% of the main steam flow) were considered more ideal for heat transfer enhancement.
3
Fig.1 Diagrams of the experimental system
Mixing Chamb er – A mixing chamber blends mist from the atomizer with a controlled amount of saturated vapor. The bottom part of the mixing chamber contains the atomizer. The atomizer jet directly impinges on the main stream flow of the low pressure steam. The top part of the mixing chamber serves as the blender. The mixture exits from the top of the mixing chamber and goes into the horizontal test section. Excessive condensation inside the mixing chamber is channeled out by a disc-type steam trap installed at the bottom of the mixing chamber.
10
10
20
20
30
30
40
40
D ia me te r (m ic rons)
100 1 00
200 2 00
300 3 00
400 4 00
500 5 00
Dro
ple
tcou
nt
D 10 = 8. 0 µm
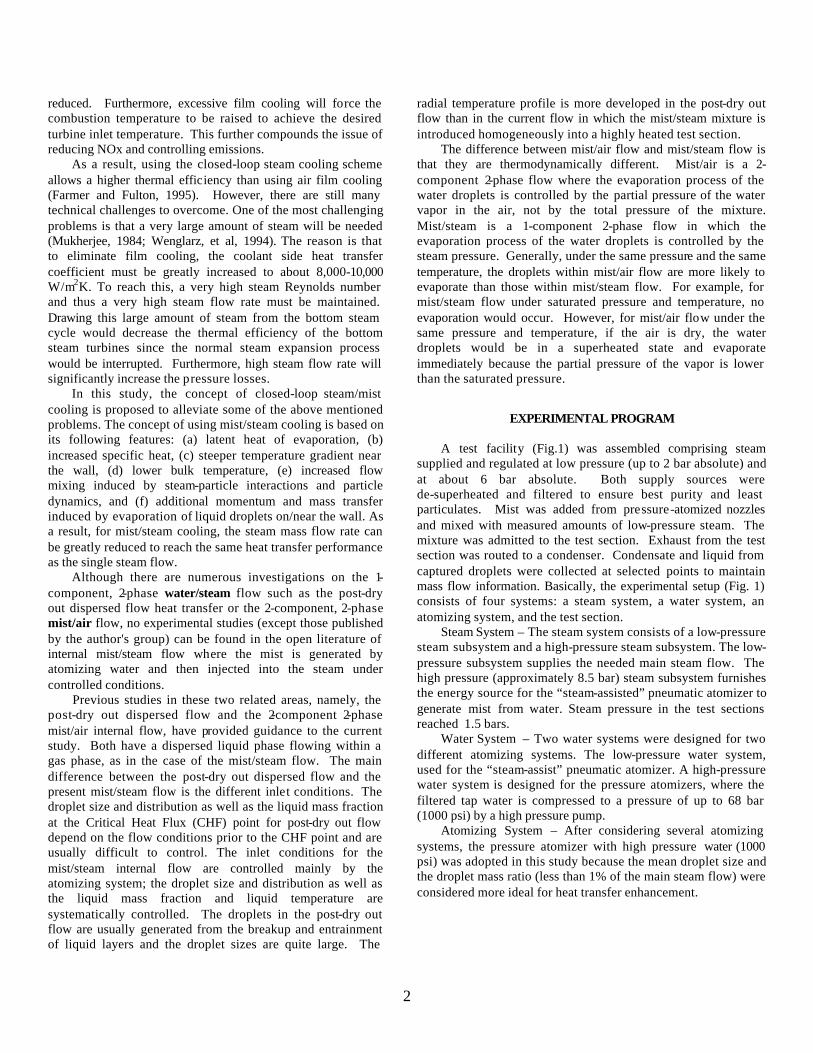
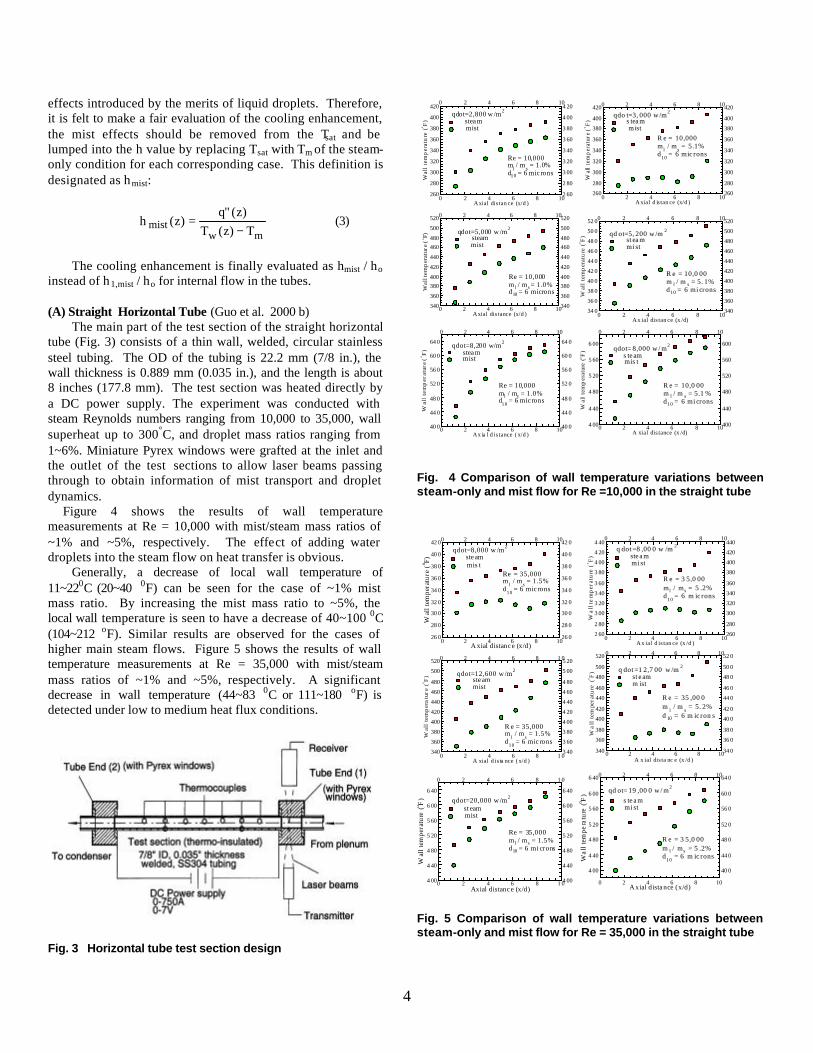
Fig. 2 PDPA result of a typical particle size distribution at the exit of the mixing chamber
Droplet Size Measurements For the current study, different kinds of particle sizing
methods were reviewed and compared and the Phase Doppler Particle Analyzer (PDPA) was decided to be the best choice. PDPA (Bachalo, 1980; Bachalo and Houser, 1984) is based on the concept of light-scattering interferometry and uses an optical transmitting system similar to conventional Laser Doppler Velocimetry (LDV). A typical characteristics of the water droplets distribution is shown in Fig. 2 with most of the droplets being less than 10 µm in diameter.
Four test geometries have been investigated: (a) A horizontal tube (Guo et al. 2000 a &b) (b) An 180o curved tube (Guo et al. 2001) (c) Jet Impingement on a flat surface (Li et al. 2001a) (d) An impingement slot jet on a concave surface. This paper reviews some of the results of the first three test conditions.
RESULTS
The objective of this experimental program is to measure heat transfer between the heated test section and the two-phase mist/steam mixtures, and to compare with the results of the corresponding one-phase steam only heat transfer. For a single-phase flow, the heat transfer coefficient can be obtained by
)()(
)(")(
zTzTzqzh
mwo −
= (1)
Where q” is the wall heat flux, Tw is the local wall
temperature, and Tm is the fluid (mist/steam mixture) bulk temperature at the same wall location.
For the current two-phase flow, the heat transfer coefficient for the mist/steam flow can typically be calculated by using the steam saturation temperature at the inlet of the test section as the reference temperature (Tsat,in). That is,
insatwmw
mist TzTzq
TzTzqzh
,,1 )(
)(")(
)(")(
−≈
−= (2)
Where q”(z) is the local wall heat flux, and Tw(z) is the local
wall temperature for 2-phase mist/steam flow. The reason for using an inlet saturation temperature as the
reference temperature in the equation (2) is that in most experimental cases, the steam flow at the center of the tube has an average temperature that is close to the saturation temperature (though near the wall the steam is superheated) due to the short test section used. Considering that the pressure drop along the test section is small and Tsat along the test section is very close to Tsat, in, Tsat,in is used in equation (2).
By definition, h1,mist is intended to more realistically reflect the driving potential in the mist flow per se. However, when evaluating the heat transfer enhancement by comparing with the steam-only results, use of Tsat as the sink temperature will not render a fair comparison because using Tsat implicitly buries the
4
effects introduced by the merits of liquid droplets. Therefore, it is felt to make a fair evaluation of the cooling enhancement, the mist effects should be removed from the Tsat and be lumped into the h value by replacing Tsat with Tm of the steam-only condition for each corresponding case. This definition is designated as hmist:
mw
mist T)z(T)z("q
)z(h−
= (3)
The cooling enhancement is finally evaluated as hmist / ho
instead of h1,mist / ho for internal flow in the tubes. (A) Straight Horizontal Tube (Guo et al. 2000 b)
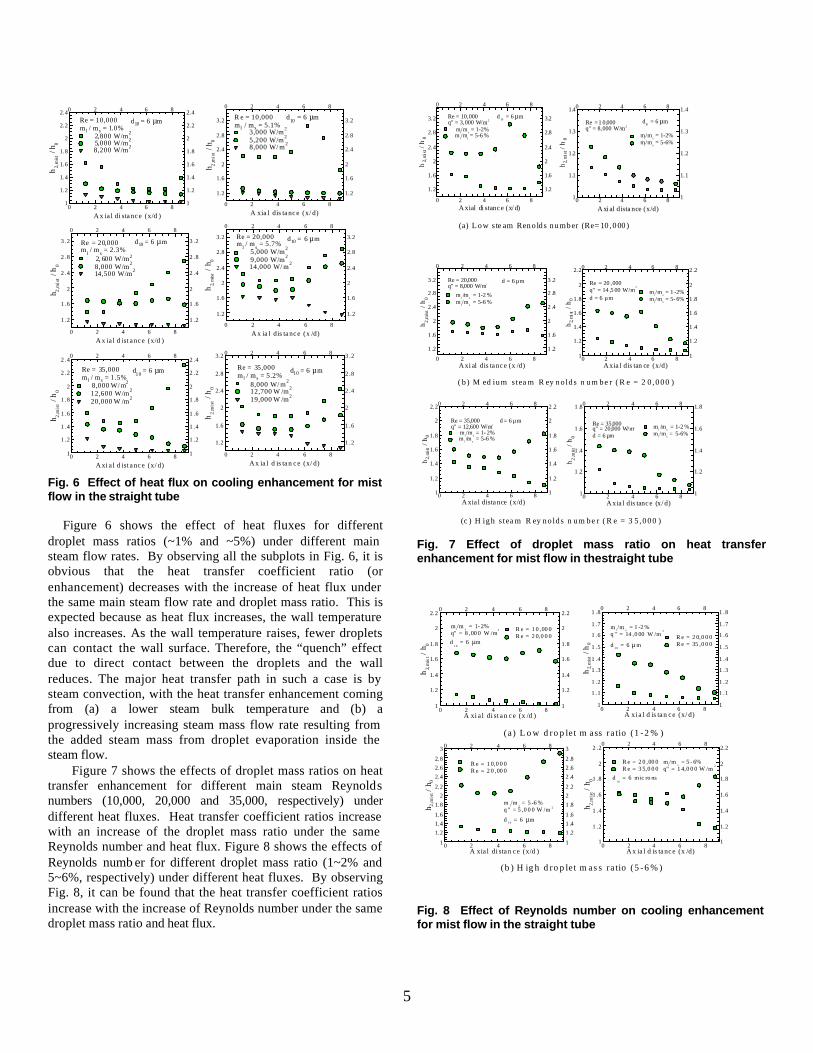
The main part of the test section of the straight horizontal tube (Fig. 3) consists of a thin wall, welded, circular stainless steel tubing. The OD of the tubing is 22.2 mm (7/8 in.), the wall thickness is 0.889 mm (0.035 in.), and the length is about 8 inches (177.8 mm). The test section was heated directly by a DC power supply. The experiment was conducted with steam Reynolds numbers ranging from 10,000 to 35,000, wall superheat up to 300°C, and droplet mass ratios ranging from 1~6%. Miniature Pyrex windows were grafted at the inlet and the outlet of the test sections to allow laser beams passing through to obtain information of mist transport and droplet dynamics. Figure 4 shows the results of wall temperature measurements at Re = 10,000 with mist/steam mass ratios of ~1% and ~5%, respectively. The effect of adding water droplets into the steam flow on heat transfer is obvious.
Generally, a decrease of local wall temperature of 11~220C (20~40 0F) can be seen for the case of ~1% mist mass ratio. By increasing the mist mass ratio to ~5%, the local wall temperature is seen to have a decrease of 40~100 0C (104~212 oF). Similar results are observed for the cases of higher main steam flows. Figure 5 shows the results of wall temperature measurements at Re = 35,000 with mist/steam mass ratios of ~1% and ~5%, respectively. A significant decrease in wall temperature (44~83 0C or 111~180 oF) is detected under low to medium heat flux conditions.
Fig. 3 Horizontal tube test section design
0
0
2
2
4
4
6
6
8
8
10
10
Axial dis tan ce (x/d )
260 2 60
280 2 80
300 3 00
320 3 20
340 3 40
360 3 60
380 3 80
400 4 00
420 4 20
Wal
lte
mp
erat
ure
(oF
) stea mmist
qdot=2,800 w /m2
Re = 10,000m
l/ m
s= 1.0%
d10 = 6 mic rons
0
0
2
2
4
4
6
6
8
8
10
10
Axial dis tance (x/d )340 340
360 360
380 380
400 400
420 420
440 440
460 460
480 480
500 500
520 520
Wal
ltem
per
atur
e(o
F) steammist
qdot=5,000 w /m2
Re = 10,000m l / ms = 1.0%d10 = 6 microns
0
0
2
2
4
4
6
6
8
8
10
10
Ax ia l d is tance ( x/d )40 0 40 0
44 0 44 0
48 0 48 0
52 0 52 0
56 0 56 0
60 0 60 0
64 0 64 0
Wal
lte
mp
erat
ure
(oF
) stea mmist
qdot=8,200 w/m2
Re = 10,000ml / ms = 1.0%d
10= 6 mic rons
0
0
2
2
4
4
6
6
8
8
10
10
Axial d is tan ce (x/d )
260 260
280 280
300 300
320 320
340 340
360 360
380 380
400 400
420 420
Wal
lte
mp
erat
ure
(oF
) s tea mmist
qdo t=3, 000 w /m2
R e = 10,000m
l/ m
s= 5.1%
d10
= 6 mic rons
0
0
2
2
4
4
6
6
8
8
10
10
Ax ial dis tan ce (x /d)
34 0 340
36 0 360
38 0 380
40 0 400
42 0 420
44 0 440
46 0 460
48 0 480
50 0 500
52 0 520
Wal
lte
mp
erat
ure
(oF
) st ea mmi st
qd ot=5, 200 w /m 2
R e = 10,0 00m l / m s = 5. 1%d10 = 6 mi crons
0
0
2
2
4
4
6
6
8
8
10
10
A xial dis tance (x /d)4 00 400
4 40 440
4 80 480
5 20 520
5 60 560
6 00 600
Wal
lte
mp
erat
ure
(oF
)
s te ammis t
qdot= 8,000 w / m2
R e = 10,0 00m l / m s = 5.1 %d10 = 6 mi crons
Fig. 4 Comparison of wall temperature variations between steam-only and mist flow for Re =10,000 in the straight tube
0
0
2
2
4
4
6
6
8
8
10
10
A xial distanc e (x/d)26 0 26 0
28 0 28 0
30 0 30 0
32 0 32 0
34 0 34 0
36 0 36 0
38 0 38 0
40 0 40 0
42 0 42 0
Wal
ltem
pera
ture
(o F) ste ammis t
qdot=8,000 w /m2
Re = 35,000m
l/ m
s= 1.5%
d10
= 6 mic rons
0
0
2
2
4
4
6
6
8
8
1 0
1 0
A xial d is ta nce ( x/d )
340 3 40
360 3 60
380 3 80
400 4 00
420 4 20
440 4 40
460 4 60
480 4 80
500 5 00
520 5 20
Wal
lte
mp
era
ture
(oF
) ste ammist
qdot=12,600 w /m2
R e = 35,000m
l/ m
s= 1.5%
d10
= 6 mic rons
0
0
2
2
4
4
6
6
8
8
1 0
1 0
Axial distanc e (x/d)4 00 4 00
4 40 4 40
4 80 4 80
5 20 5 20
5 60 5 60
6 00 6 00
6 40 6 40
Wal
ltem
pera
ture
(o F)
st eammist
qdot=20,000 w /m2
Re = 35,000m l / ms = 1.5%d10 = 6 mi crons
0
0
2
2
4
4
6
6
8
8
10
10
Ax ial d is tan ce (x /d )
2 60 260
2 80 280
3 00 300
3 20 320
3 40 340
3 60 360
3 80 380
4 00 400
4 20 420
4 40 440
Wa
llte
mp
erat
ure
(oF
) ste a mmi st
q dot =8 ,00 0 w /m 2
R e = 3 5,0 00m l / ms = 5 .2%d
10= 6 m ic rons
0
0
2
2
4
4
6
6
8
8
10
10
A x ial dis ta nc e (x /d )
340 34 0
360 36 0
380 38 0
400 40 0
420 42 0
440 44 0
460 46 0
480 48 0
500 50 0
520 52 0
Wa
llte
mpe
ratu
re(o
F)
st e amm ist
q dot =1 2,7 00 w /m 2
R e = 35 ,00 0m
l/ m
s= 5. 2%
d 10 = 6 m ic ron s
0
0
2
2
4
4
6
6
8
8
10
10
A xial dista nce (x/d)
4 00 40 0
4 40 44 0
4 80 48 0
5 20 52 0
5 60 56 0
6 00 60 0
6 40 64 0
Wal
ltem
pera
ture
(o F)
s te a mmi st
qd ot= 19 ,00 0 w / m2
R e = 3 5,0 00m l / ms = 5 .2%d
10= 6 m ic rons
Fig. 5 Comparison of wall temperature variations between steam-only and mist flow for Re = 35,000 in the straight tube
5
0
0
2
2
4
4
6
6
8
8
A x ia l d ist a nc e (x/d )
1 .2 1 .2
1 .6 1 .6
2 2
2 .4 2 .4
2 .8 2 .8
3 .2 3 .2
h 2,m
ist/h
0
2, 600 W/m2
8,000 W/m2
Re = 20,000m
l/ m
s= 2.3%
14,500 W/m2
d10 = 6 µm
0
0
2
2
4
4
6
6
8
8
A xi a l d ist a nc e (x/ d)
1 1
1 .2 1 .2
1 .4 1 .4
1 .6 1 .6
1 .8 1 .8
2 2
2 .2 2 .2
2 .4 2 .4
h 2,m
ist/h
0
8,000 W/ m2
12,600 W/m2
Re = 35,000m l / ms = 1.5%
20,000 W /m2
d10
= 6 µm
0
0
2
2
4
4
6
6
8
8
A x ia l di sta nc e (x/d )
1 1
1.2 1.2
1.4 1.4
1.6 1.6
1.8 1.8
2 2
2.2 2.2
2.4 2.4
h2,
mis
t/h
0
2,800 W/m2
5,000 W/m2
Re = 10,000m l / ms = 1.0%
8,200 W/m2
d10 = 6 µm
0
0
2
2
4
4
6
6
8
8
A x ia l dis ta nc e (x /d)
1.2 1.2
1.6 1.6
2 2
2.4 2.4
2.8 2.8
3.2 3.2
h2,
mis
t/
h 0
5,000 W/m2
9,000 W/m2
Re = 20,000m
l/ m
s= 5.7%
14,000 W/ m2
d10 = 6 µm
0
0
2
2
4
4
6
6
8
8
A xia l dis ta nc e (x/ d)
1.2 1.2
1.6 1.6
2 2
2.4 2.4
2.8 2.8
3.2 3.2
h 2,m
ist/h
0
3,000 W/m2
5,200 W/m2
R e = 10,000m l / ms = 5.1%
8,000 W/ m2
d10
= 6 µm
0
0
2
2
4
4
6
6
8
8
A x ia l d is ta n c e (x/ d)
1.2 1 .2
1.6 1 .6
2 2
2.4 2 .4
2.8 2 .8
3.2 3 .2
h2
,mis
t/h
0
8,000 W/ m2
12,700 W /m2
Re = 35,000m l / ms = 5.2%
19,000 W /m2
d10 = 6 µm
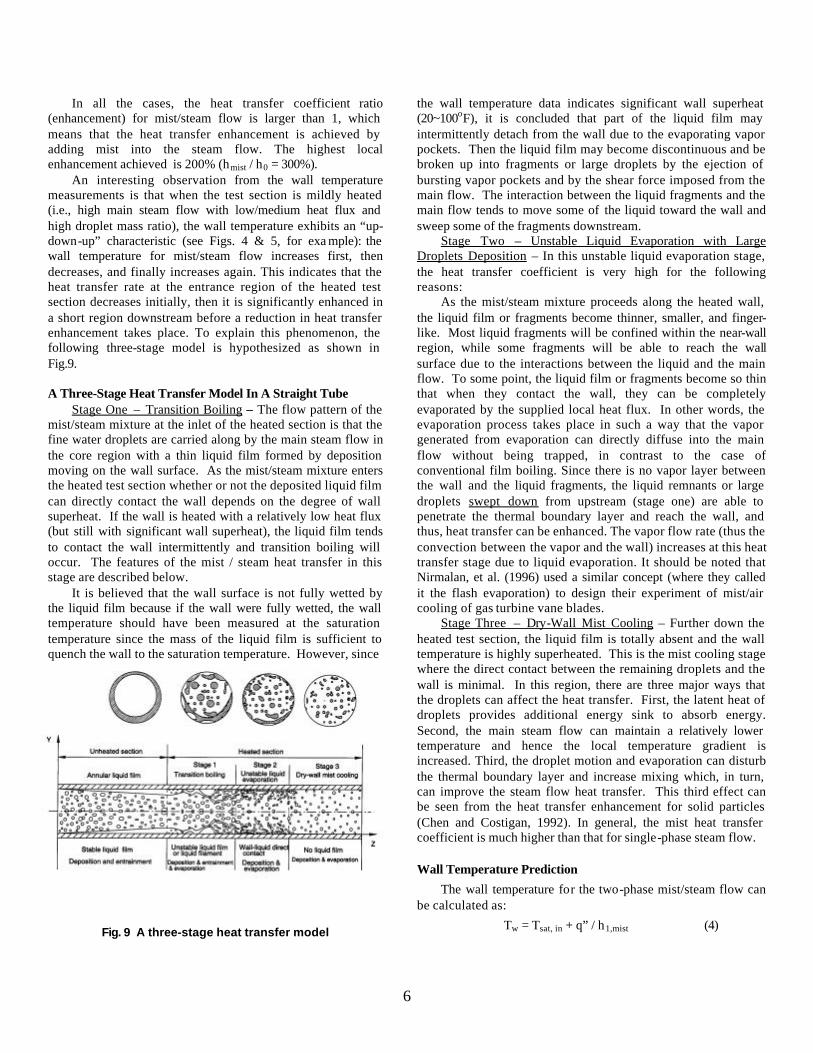
Fig. 6 Effect of heat flux on cooling enhancement for mist flow in the straight tube Figure 6 shows the effect of heat fluxes for different droplet mass ratios (~1% and ~5%) under different main steam flow rates. By observing all the subplots in Fig. 6, it is obvious that the heat transfer coefficient ratio (or enhancement) decreases with the increase of heat flux under the same main steam flow rate and droplet mass ratio. This is expected because as heat flux increases, the wall temperature also increases. As the wall temperature raises, fewer droplets can contact the wall surface. Therefore, the “quench” effect due to direct contact between the droplets and the wall reduces. The major heat transfer path in such a case is by steam convection, with the heat transfer enhancement coming from (a) a lower steam bulk temperature and (b) a progressively increasing steam mass flow rate resulting from the added steam mass from droplet evaporation inside the steam flow.
Figure 7 shows the effects of droplet mass ratios on heat transfer enhancement for different main steam Reynolds numbers (10,000, 20,000 and 35,000, respectively) under different heat fluxes. Heat transfer coefficient ratios increase with an increase of the droplet mass ratio under the same Reynolds number and heat flux. Figure 8 shows the effects of Reynolds numb er for different droplet mass ratio (1~2% and 5~6%, respectively) under different heat fluxes. By observing Fig. 8, it can be found that the heat transfer coefficient ratios increase with the increase of Reynolds number under the same droplet mass ratio and heat flux.
0
0
2
2
4
4
6
6
8
8
A xial di stanc e (x/ d)
1.2 1.2
1.6 1.6
2 2
2.4 2.4
2.8 2.8
3.2 3.2
h2,
mis
t/h
0
ml/m
s= 1-2%
ml/m
s= 5-6 %
Re = 10,000q" = 3,000 W/m2
d10
= 6 µm
0
0
2
2
4
4
6
6
8
8
A xi al dista nce (x/d)
1 1
1.1 1.1
1.2 1.2
1.3 1.3
1.4 1.4
h 2,m
ist/h
0
ml/m
s= 1-2%
ml/m
s= 5-6%
Re =1 0,000q" = 8,000 W/m2
d10
= 6 µm
(a) L ow ste am Reno lds number (Re= 10 ,000 )
( b ) M ed ium stea m R ey no lds n um be r ( R e = 2 0 ,000 )
0
0
2
2
4
4
6
6
8
8
A xi al dis ta nc e (x /d)
1 .2 1 .2
1 .6 1 .6
2 2
2 .4 2 .4
2 .8 2 .8
3 .2 3 .2
h 2,m
ist
/h0
ml/m
s= 1-2 %
ml/m
s= 5-6 %
Re = 20,000q" = 8,000 W/m2
d = 6 µm
0
0
2
2
4
4
6
6
8
8
A xia l dis tan ce (x/d)1 1
1.2 1 .2
1.4 1 .4
1.6 1 .6
1.8 1 .8
2 2
2.2 2 .2
h 2,m
ist
/h0
ml/m
s= 1 -2%
ml/m
s= 5- 6%
Re = 20 ,000q" = 14 ,5 00 W/m
2
d = 6 µm
0
0
2
2
4
4
6
6
8
8
A xia l dis tanc e (x/ d)1 1
1 .2 1.2
1 .4 1.4
1 .6 1.6
1 .8 1.8
h 2,m
ist/h
0
ml/m
s= 1-2 %
ml/m
s= 5-6%
Re = 35,000q" = 20,000 W/m2
d = 6 µm
0
0
2
2
4
4
6
6
8
8
A xia l dista nce (x/d)1 1
1.2 1 .2
1.4 1 .4
1.6 1 .6
1.8 1 .8
2 2
2.2 2 .2
h 2,m
ist
/h0
ml/m
s= 1- 2%
ml/m
s= 5-6 %
Re = 35,000q" = 12,600 W/m2
d = 6 µm
(c ) H igh s tea m R ey no lds n um be r ( R e = 3 5 ,000 )
Fig. 7 Effect of droplet mass ratio on heat transfer enhancement for mist flow in thestraight tube
(a ) L o w d ro p le t m ass ra tio (1 -2 % )
0
0
2
2
4
4
6
6
8
8
A xi a l d is ta n c e (x/ d)1 1
1 .1 1 .1
1 .2 1 .2
1 .3 1 .3
1 .4 1 .4
1 .5 1 .5
1 .6 1 .6
1 .7 1 .7
1 .8 1 .8
h2,
mis
t/h
0
R e = 2 0,0 0 0R e = 35 ,0 0 0
ml/m
s= 1 -2 %
q " = 14 ,0 00 W /m2
d1 0
= 6 µ m
0
0
2
2
4
4
6
6
8
8
A xia l di sta n c e (x/d )1 1
1.2 1 .2
1.4 1 .4
1.6 1 .6
1.8 1 .8
2 2
2.2 2 .2
2.4 2 .4
2.6 2 .6
2.8 2 .8
3 3
h 2,m
ist/
h 0
R e = 1 0,0 0 0R e = 2 0 ,00 0
ml/m
s= 5 -6 %
q " = 5 ,0 0 0 W /m 2
d1 0
= 6 µm
0
0
2
2
4
4
6
6
8
8
A x ia l d is ta nc e (x /d)1 1
1 .2 1.2
1 .4 1.4
1 .6 1.6
1 .8 1.8
2 2
2 .2 2.2
h 2,m
ist/
h 0
R e = 2 0 ,00 0R e = 3 5,0 0 0
ml/m
s= 5 - 6%
q" = 1 4,0 0 0 W /m2
d1 0
= 6 mic ro ns
(b ) H ig h d ro p le t m as s ra tio (5 -6 % )
0
0
2
2
4
4
6
6
8
8
A xi a l di st a n c e (x /d )1 1
1.2 1.2
1.4 1.4
1.6 1.6
1.8 1.8
2 2
2.2 2.2
h2,
mis
t/
h 0
R e = 1 0 ,00 0R e = 2 0,0 0 0
ml/m
s= 1- 2%
q" = 8 ,00 0 W /m2
d1 0
= 6 µm
Fig. 8 Effect of Reynolds number on cooling enhancement for mist flow in the straight tube
6
In all the cases, the heat transfer coefficient ratio (enhancement) for mist/steam flow is larger than 1, which means that the heat transfer enhancement is achieved by adding mist into the steam flow. The highest local enhancement achieved is 200% (hmist / h0 = 300%).
An interesting observation from the wall temperature measurements is that when the test section is mildly heated (i.e., high main steam flow with low/medium heat flux and high droplet mass ratio), the wall temperature exhibits an “up-down-up” characteristic (see Figs. 4 & 5, for exa mple): the wall temperature for mist/steam flow increases first, then decreases, and finally increases again. This indicates that the heat transfer rate at the entrance region of the heated test section decreases initially, then it is significantly enhanced in a short region downstream before a reduction in heat transfer enhancement takes place. To explain this phenomenon, the following three-stage model is hypothesized as shown in Fig.9.
A Three-Stage Heat Transfer Model In A Straight Tube Stage One – Transition Boiling – The flow pattern of the mist/steam mixture at the inlet of the heated section is that the fine water droplets are carried along by the main steam flow in the core region with a thin liquid film formed by deposition moving on the wall surface. As the mist/steam mixture enters the heated test section whether or not the deposited liquid film can directly contact the wall depends on the degree of wall superheat. If the wall is heated with a relatively low heat flux (but still with significant wall superheat), the liquid film tends to contact the wall intermittently and transition boiling will occur. The features of the mist / steam heat transfer in this stage are described below. It is believed that the wall surface is not fully wetted by the liquid film because if the wall were fully wetted, the wall temperature should have been measured at the saturation temperature since the mass of the liquid film is sufficient to quench the wall to the saturation temperature. However, since
Fig. 9 A three-stage heat transfer model
the wall temperature data indicates significant wall superheat (20~100oF), it is concluded that part of the liquid film may intermittently detach from the wall due to the evaporating vapor pockets. Then the liquid film may become discontinuous and be broken up into fragments or large droplets by the ejection of bursting vapor pockets and by the shear force imposed from the main flow. The interaction between the liquid fragments and the main flow tends to move some of the liquid toward the wall and sweep some of the fragments downstream. Stage Two – Unstable Liquid Evaporation with Large Droplets Deposition – In this unstable liquid evaporation stage, the heat transfer coefficient is very high for the following reasons: As the mist/steam mixture proceeds along the heated wall, the liquid film or fragments become thinner, smaller, and finger- like. Most liquid fragments will be confined within the near-wall region, while some fragments will be able to reach the wall surface due to the interactions between the liquid and the main flow. To some point, the liquid film or fragments become so thin that when they contact the wall, they can be completely evaporated by the supplied local heat flux. In other words, the evaporation process takes place in such a way that the vapor generated from evaporation can directly diffuse into the main flow without being trapped, in contrast to the case of conventional film boiling. Since there is no vapor layer between the wall and the liquid fragments, the liquid remnants or large droplets swept down from upstream (stage one) are able to penetrate the thermal boundary layer and reach the wall, and thus, heat transfer can be enhanced. The vapor flow rate (thus the convection between the vapor and the wall) increases at this heat transfer stage due to liquid evaporation. It should be noted that Nirmalan, et al. (1996) used a similar concept (where they called it the flash evaporation) to design their experiment of mist/air cooling of gas turbine vane blades.
Stage Three – Dry-Wall Mist Cooling – Further down the heated test section, the liquid film is totally absent and the wall temperature is highly superheated. This is the mist cooling stage where the direct contact between the remaining droplets and the wall is minimal. In this region, there are three major ways that the droplets can affect the heat transfer. First, the latent heat of droplets provides additional energy sink to absorb energy. Second, the main steam flow can maintain a relatively lower temperature and hence the local temperature gradient is increased. Third, the droplet motion and evaporation can disturb the thermal boundary layer and increase mixing which, in turn, can improve the steam flow heat transfer. This third effect can be seen from the heat transfer enhancement for solid particles (Chen and Costigan, 1992). In general, the mist heat transfer coefficient is much higher than that for single-phase steam flow. Wall Temperature Prediction
The wall temperature for the two-phase mist/steam flow can be calculated as:
Tw = Tsat, in + q” / h1,mist (4)
7
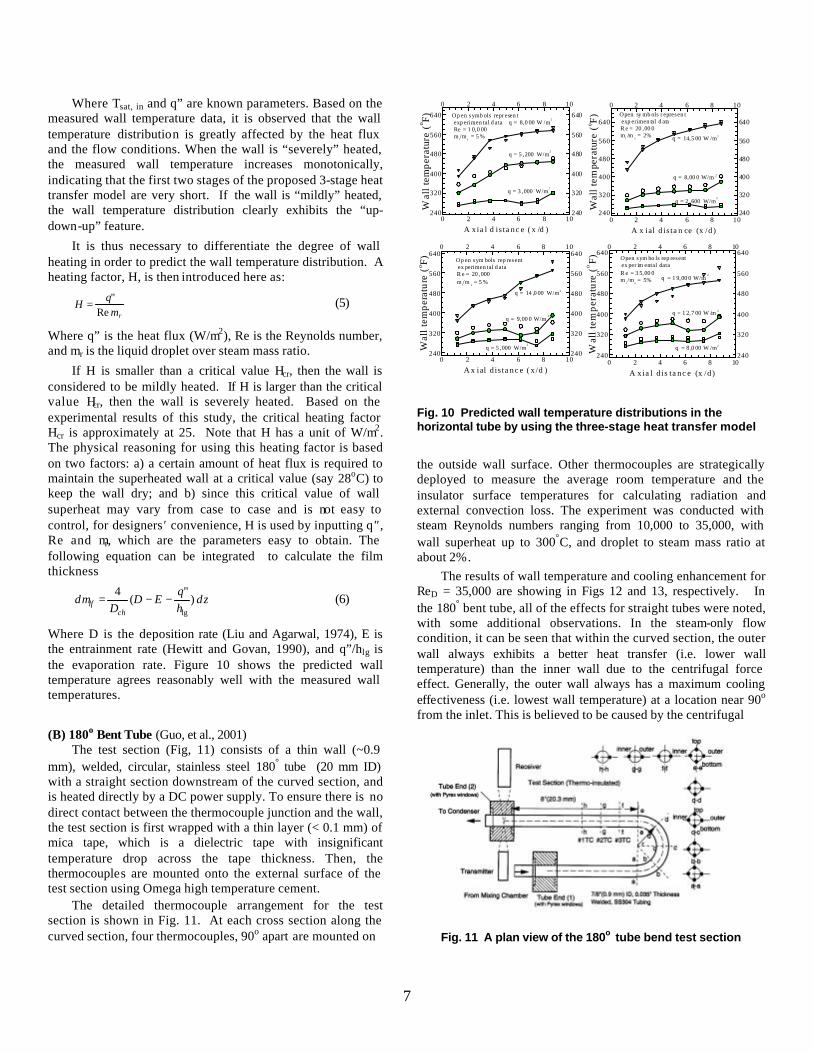
Where Tsat, in and q” are known parameters. Based on the measured wall temperature data, it is observed that the wall temperature distribution is greatly affected by the heat flux and the flow conditions. When the wall is “severely” heated, the measured wall temperature increases monotonically, indicating that the first two stages of the proposed 3-stage heat transfer model are very short. If the wall is “mildly” heated, the wall temperature distribution clearly exhibits the “up-down-up” feature.
It is thus necessary to differentiate the degree of wall heating in order to predict the wall temperature distribution. A heating factor, H, is then introduced here as:
rmqH
Re"
= (5)
Where q” is the heat flux (W/m2), Re is the Reynolds number, and mr is the liquid droplet over steam mass ratio.
If H is smaller than a critical value Hcr, then the wall is considered to be mildly heated. If H is larger than the critical value Hcr, then the wall is severely heated. Based on the experimental results of this study, the critical heating factor Hcr is approximately at 25. Note that H has a unit of W/m2. The physical reasoning for using this heating factor is based on two factors: a) a certain amount of heat flux is required to maintain the superheated wall at a critical value (say 28oC) to keep the wall dry; and b) since this critical value of wall superheat may vary from case to case and is not easy to control, for designers ′ convenience, H is used by inputting q″, Re and mr, which are the parameters easy to obtain. The following equation can be integrated to calculate the film thickness
dzhq
EDD
dmch
lf )"
(4
lg
−−= (6)
Where D is the deposition rate (Liu and Agarwal, 1974), E is the entrainment rate (Hewitt and Govan, 1990), and q”/hlg is the evaporation rate. Figure 10 shows the predicted wall temperature agrees reasonably well with the measured wall temperatures.
(B) 180o Bent Tube (Guo, et al., 2001) The test section (Fig, 11) consists of a thin wall (~0.9 mm), welded, circular, stainless steel 180° tube (20 mm ID) with a straight section downstream of the curved section, and is heated directly by a DC power supply. To ensure there is no direct contact between the thermocouple junction and the wall, the test section is first wrapped with a thin layer (< 0.1 mm) of mica tape, which is a dielectric tape with insignificant temperature drop across the tape thickness. Then, the thermocouples are mounted onto the external surface of the test section using Omega high temperature cement. The detailed thermocouple arrangement for the test section is shown in Fig. 11. At each cross section along the curved section, four thermocouples, 90o apart are mounted on
0
0
2
2
4
4
6
6
8
8
10
10
A xia l d is ta nc e ( x /d )
240 240
320 320
400 400
480 480
560 560
640 640
Wal
lte
mp
erat
ure
(o F)
q = 8,0 00 W /m2
q = 5 ,200 W/m2
q = 3 ,000 W/m2
Op en symb ols repr esen texp erimen tal d ataRe = 1 0,0 00m
l/m
s= 5 %
0
0
2
2
4
4
6
6
8
8
10
10
A x ial d is ta n ce (x /d )
240 240
320 320
400 400
480 480
560 560
640 640
Wal
lte
mpe
ratu
re(o F
)
q = 14,5 00 W /m2
q = 8,00 0 W/m 2
q = 2 ,600 W/m2
Open sy mb ols r epresen texp erimen tal d ataR e = 20 ,00 0m
l/m
s= 2%
0
0
2
2
4
4
6
6
8
8
10
10
A x ial d is ta nc e ( x /d )
240 240
320 320
400 400
480 480
560 560
640 640
Wal
lte
mp
erat
ure
(o F)
q = 14 ,0 00 W/m2
q = 9,00 0 W/m2
q = 5 ,000 W/m2
Op en sym bols rep resentex perimen tal d ataR e = 20 ,000m
l/m
s= 5 %
0
0
2
2
4
4
6
6
8
8
10
10
A xia l d is ta nc e (x /d )
240 240
320 320
400 400
480 480
560 560
640 640
Wal
lte
mp
erat
ure
(oF
)
q = 1 9,00 0 W/m2
q = 1 2,7 00 W /m 2
q = 8 ,0 00 W /m2
Open sym bo ls rep resentex per im ental dataR e = 3 5,00 0m
l/m
s= 5%
Fig. 10 Predicted wall temperature distributions in the horizontal tube by using the three-stage heat transfer model
the outside wall surface. Other thermocouples are strategically deployed to measure the average room temperature and the insulator surface temperatures for calculating radiation and external convection loss. The experiment was conducted with steam Reynolds numbers ranging from 10,000 to 35,000, with wall superheat up to 300°C, and droplet to steam mass ratio at about 2%. The results of wall temperature and cooling enhancement for ReD = 35,000 are showing in Figs 12 and 13, respectively. In the 180° bent tube, all of the effects for straight tubes were noted, with some additional observations. In the steam-only flow condition, it can be seen that within the curved section, the outer wall always exhibits a better heat transfer (i.e. lower wall temperature) than the inner wall due to the centrifugal force effect. Generally, the outer wall always has a maximum cooling effectiveness (i.e. lowest wall temperature) at a location near 90o from the inlet. This is believed to be caused by the centrifugal
Fig. 11 A plan view of the 180o tube bend test section
8
200
250
300
350
400
450
500
550
600
650
Wal
lte
mpe
ratu
re(o F
)
s te a m ,ou te r w a ll
m is t , o u te r w a lls te am , in ne r w a ll
m is t , in ne r w al l
q " = 9 ,90 0 W /m2
R e = 35 ,0 00m r = 1 - 2%d
1 0= 6 µm
4 5o
9 0o 1 3 5o
1 8 0 o0o
# 1T C # 2 TC #3 T C
(a )
200
300
400
500
600
700
800
Wal
lte
mpe
ratu
re(o
F)
s te a m ,o u te r w a ll
m is t , o u te r w a lls te a m , i nn e r w a ll
m is t , in n er w a ll
q " = 13 ,75 0 W /m2
R e = 3 5 ,0 0 0m
r= 1- 2 %
d10
= 6 µm
45o
90o
1 3 5o
18 0o0
o# 1 TC #2 T C # 3 TC
( b )
200
300
400
500
600
700
800
900
1000
Wal
lte
mp
erat
ure
(oF
) s te a m ,ou te r w a ll
m is t , o u te r w a lls tea m , in ne r w a ll
m is t , inn e r w a ll
q "= 2 0 ,75 0 W /m2
R e = 35 ,00 0m r = 1 -2 %d 1 0 = 6 µm
45 o 9 0o
1 35o
1 80o0
o# 1 TC # 2 TC #3 TC
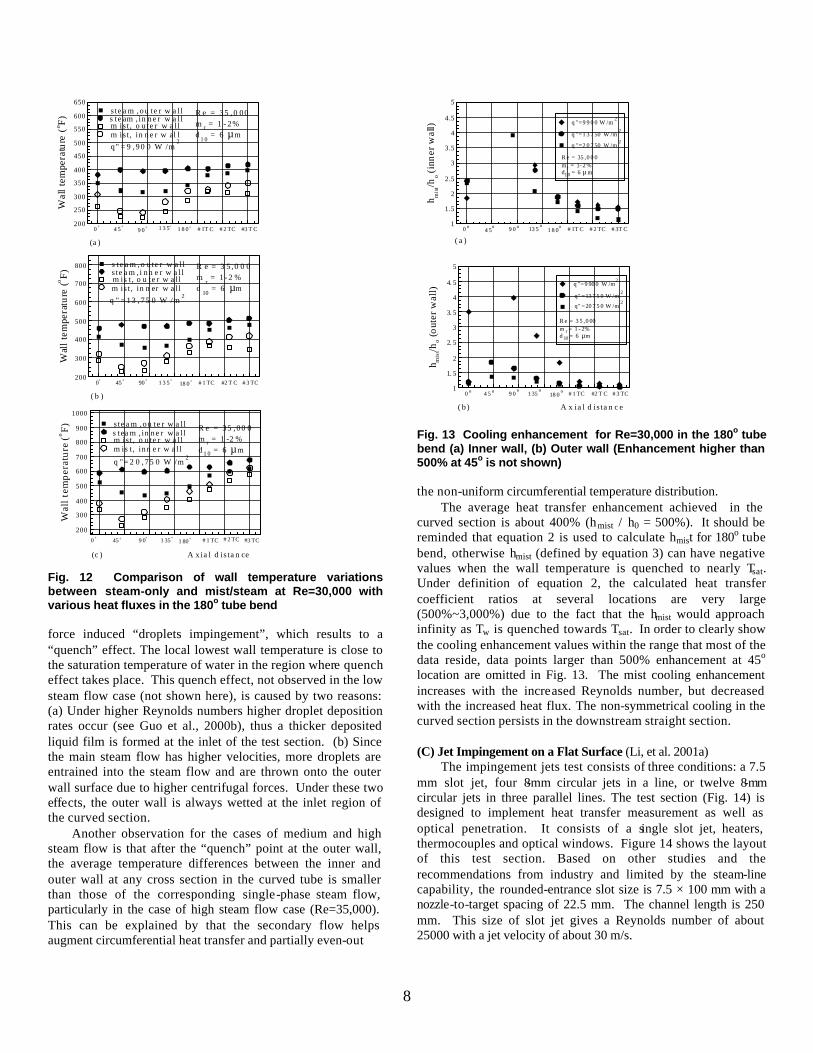
(c ) A x ia l d is ta n ce
Fig. 12 Comparison of wall temperature variations between steam-only and mist/steam at Re=30,000 with various heat fluxes in the 180o tube bend force induced “droplets impingement”, which results to a “quench” effect. The local lowest wall temperature is close to the saturation temperature of water in the region where quench effect takes place. This quench effect, not observed in the low steam flow case (not shown here), is caused by two reasons: (a) Under higher Reynolds numbers higher droplet deposition rates occur (see Guo et al., 2000b), thus a thicker deposited liquid film is formed at the inlet of the test section. (b) Since the main steam flow has higher velocities, more droplets are entrained into the steam flow and are thrown onto the outer wall surface due to higher centrifugal forces. Under these two effects, the outer wall is always wetted at the inlet region of the curved section. Another observation for the cases of medium and high steam flow is that after the “quench” point at the outer wall, the average temperature differences between the inner and outer wall at any cross section in the curved tube is smaller than those of the corresponding single-phase steam flow, particularly in the case of high steam flow case (Re=35,000). This can be explained by that the secondary flow helps augment circumferential heat transfer and partially even-out
1
1.5
2
2.5
3
3.5
4
4.5
5
h mis
t/ho(i
nner
wal
l) q "=9 9 0 0 W /m2
R e = 35 ,0 0 0mr = 1- 2 %d10 = 6 µ m
4 5o 9 0 o 13 5
o1 8 0
o0 o # 1T C # 2 TC # 3T C
( a )
q "=1 3 7 50 W /m2
q "=2 0 7 50 W /m2
1
1. 5
2
2. 5
3
3. 5
4
4. 5
5
h mis
t/ho
(out
erw
all)
q "=9 90 0 W /m2
R e = 3 5 ,0 00m r = 1 - 2%d 10 = 6 µm
4 5 o 9 0o
1 35o
18 0o0 o # 1 TC #2 T C # 3 TC
( b ) A x ia l d is ta n c e
q" =13 7 5 0 W /m2
q" =20 7 5 0 W /m2
Fig. 13 Cooling enhancement for Re=30,000 in the 180o tube bend (a) Inner wall, (b) Outer wall (Enhancement higher than 500% at 45o is not shown) the non-uniform circumferential temperature distribution. The average heat transfer enhancement achieved in the curved section is about 400% (hmist / h0 = 500%). It should be reminded that equation 2 is used to calculate hmist for 180o tube bend, otherwise hmist (defined by equation 3) can have negative values when the wall temperature is quenched to nearly Tsat. Under definition of equation 2, the calculated heat transfer coefficient ratios at several locations are very large (500%~3,000%) due to the fact that the hmist would approach infinity as Tw is quenched towards Tsat. In order to clearly show the cooling enhancement values within the range that most of the data reside, data points larger than 500% enhancement at 45o
location are omitted in Fig. 13. The mist cooling enhancement increases with the increased Reynolds number, but decreased with the increased heat flux. The non-symmetrical cooling in the curved section persists in the downstream straight section. (C) Jet Impingement on a Flat Surface (Li, et al. 2001a)
The impingement jets test consists of three conditions: a 7.5 mm slot jet, four 8-mm circular jets in a line, or twelve 8-mm circular jets in three parallel lines. The test section (Fig. 14) is designed to implement heat transfer measurement as well as optical penetration. It consists of a single slot jet, heaters, thermocouples and optical windows. Figure 14 shows the layout of this test section. Based on other studies and the recommendations from industry and limited by the steam-line capability, the rounded-entrance slot size is 7.5 × 100 mm with a nozzle-to-target spacing of 22.5 mm. The channel length is 250 mm. This size of slot jet gives a Reynolds number of about 25000 with a jet velocity of about 30 m/s.
9
Settling Chamber
Copper buses to heaters
1 cm
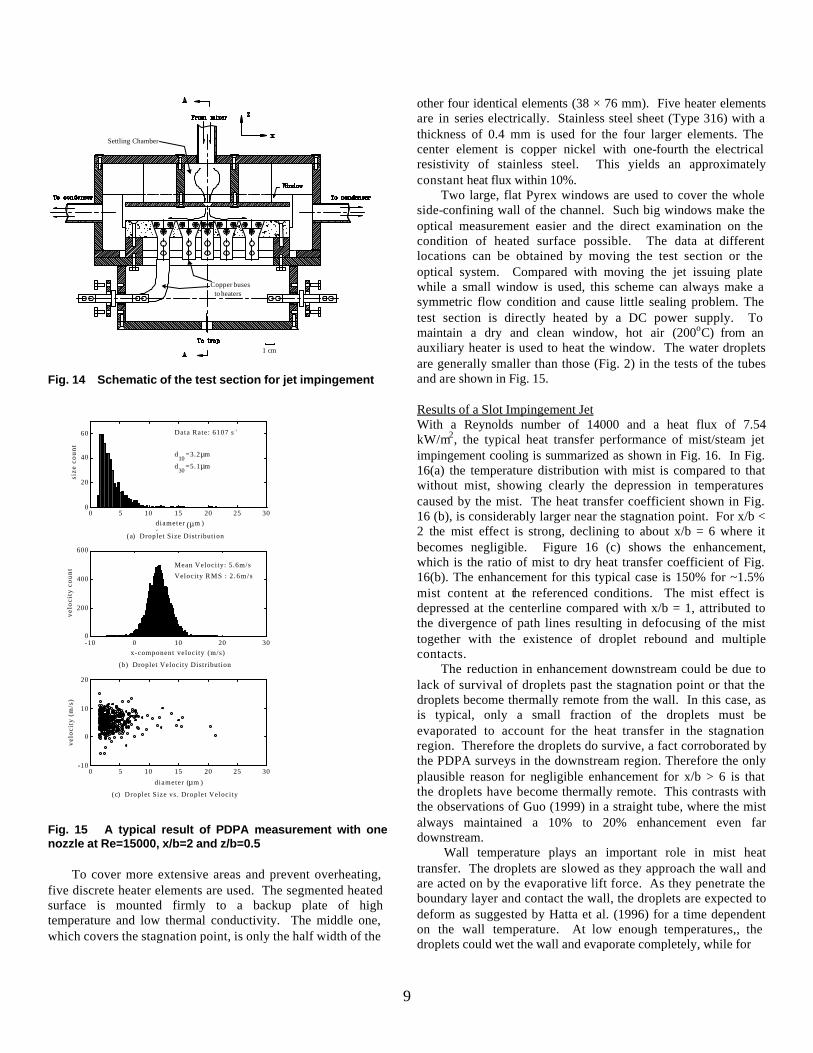
Fig. 14 Schematic of the test section for jet impingement
0 5 10 15 20 25 300
20
40
60
diameter(
(µm )
siz
e co
un
t
-10 0 10 20 300
200
400
600
x-component velocity (m/s)
vel
oci
ty c
ou
nt
0 5 10 15 20 25 30-10
0
10
20
diameter (µm )
vel
oci
ty (
m/s
)
Data Rate: 6107 s -1
d10
=3.2µm
d30
=5.1µm
Mean Velocity: 5.6m/s
Velocity RMS : 2 .6m/s
(a) Droplet Size Distribution
(b) Droplet Velocity Distribution
(c) Droplet Size vs. Droplet Velocity
Fig. 15 A typical result of PDPA measurement with one nozzle at Re=15000, x/b=2 and z/b=0.5 To cover more extensive areas and prevent overheating, five discrete heater elements are used. The segmented heated surface is mounted firmly to a backup plate of high temperature and low thermal conductivity. The middle one, which covers the stagnation point, is only the half width of the
other four identical elements (38 × 76 mm). Five heater elements are in series electrically. Stainless steel sheet (Type 316) with a thickness of 0.4 mm is used for the four larger elements. The center element is copper nickel with one-fourth the electrical resistivity of stainless steel. This yields an approximately constant heat flux within 10%.
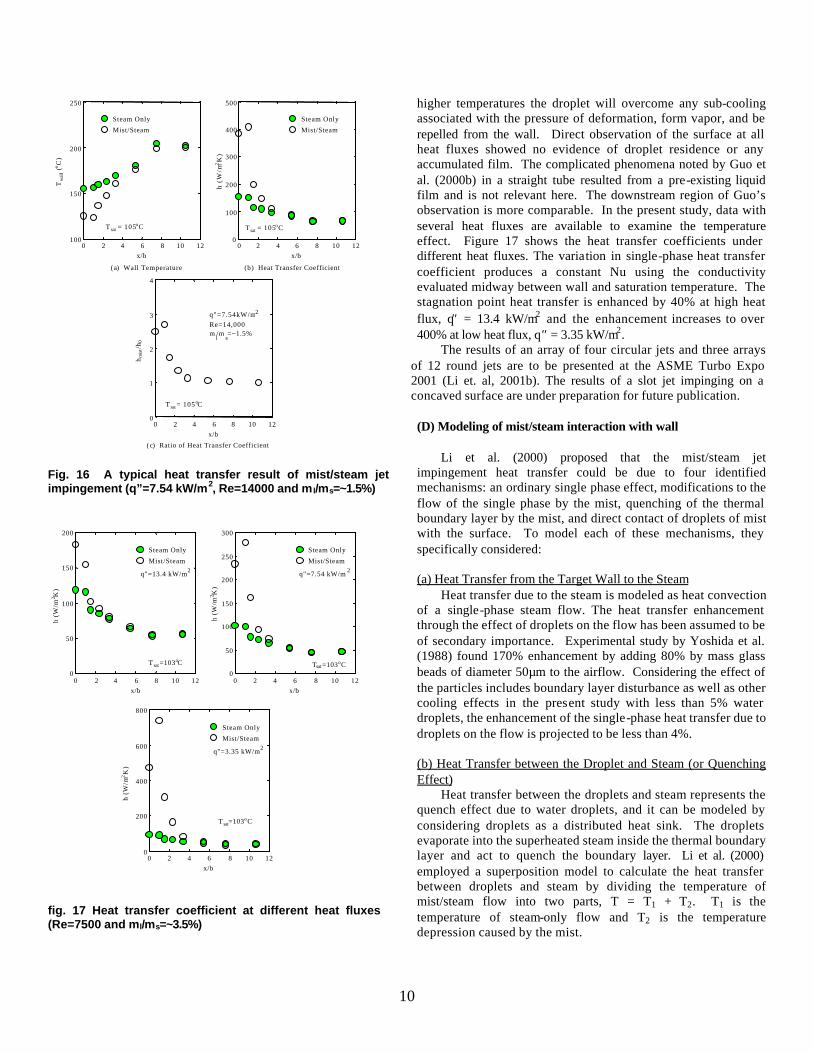
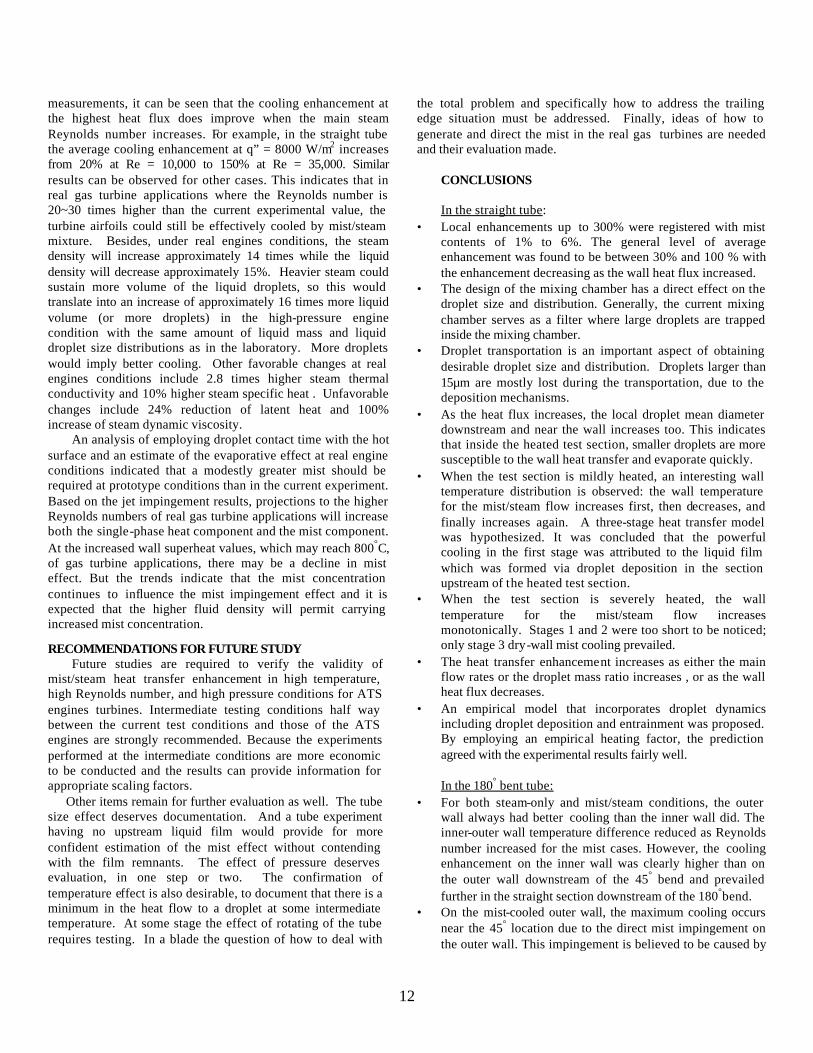
Two large, flat Pyrex windows are used to cover the whole side-confining wall of the channel. Such big windows make the optical measurement easier and the direct examination on the condition of heated surface possible. The data at different locations can be obtained by moving the test section or the optical system. Compared with moving the jet issuing plate while a small window is used, this scheme can always make a symmetric flow condition and cause little sealing problem. The test section is directly heated by a DC power supply. To maintain a dry and clean window, hot air (200oC) from an auxiliary heater is used to heat the window. The water droplets are generally smaller than those (Fig. 2) in the tests of the tubes and are shown in Fig. 15. Results of a Slot Impingement Jet With a Reynolds number of 14000 and a heat flux of 7.54 kW/m2, the typical heat transfer performance of mist/steam jet impingement cooling is summarized as shown in Fig. 16. In Fig. 16(a) the temperature distribution with mist is compared to that without mist, showing clearly the depression in temperatures caused by the mist. The heat transfer coefficient shown in Fig. 16 (b), is considerably larger near the stagnation point. For x/b < 2 the mist effect is strong, declining to about x/b = 6 where it becomes negligible. Figure 16 (c) shows the enhancement, which is the ratio of mist to dry heat transfer coefficient of Fig. 16(b). The enhancement for this typical case is 150% for ~1.5% mist content at the referenced conditions. The mist effect is depressed at the centerline compared with x/b = 1, attributed to the divergence of path lines resulting in defocusing of the mist together with the existence of droplet rebound and multiple contacts.
The reduction in enhancement downstream could be due to lack of survival of droplets past the stagnation point or that the droplets become thermally remote from the wall. In this case, as is typical, only a small fraction of the droplets must be evaporated to account for the heat transfer in the stagnation region. Therefore the droplets do survive, a fact corroborated by the PDPA surveys in the downstream region. Therefore the only plausible reason for negligible enhancement for x/b > 6 is that the droplets have become thermally remote. This contrasts with the observations of Guo (1999) in a straight tube, where the mist always maintained a 10% to 20% enhancement even far downstream.
Wall temperature plays an important role in mist heat transfer. The droplets are slowed as they approach the wall and are acted on by the evaporative lift force. As they penetrate the boundary layer and contact the wall, the droplets are expected to deform as suggested by Hatta et al. (1996) for a time dependent on the wall temperature. At low enough temperatures,, the droplets could wet the wall and evaporate completely, while for
10
0 2 4 6 8 10 12100
150
200
250
x/b
Tw
all
(oC
)
0 2 4 6 8 10 120
100
200
300
400
500
x/b
h (
W/m
2K
)
0 2 4 6 8 10 120
1
2
3
4
x/b
h mis
t/h 0
Steam Only
Mist/Steam
Steam Only
Mist/Steam
q"=7.54kW/m2
Re=14,000m
l/m
s=~1.5%
(a) Wall Temperature (b) Heat Transfer Coefficient
(c) Ratio of Heat Transfer Coefficient
T sat = 105oC
T sat = 105oC
T sat = 105oC
Fig. 16 A typical heat transfer result of mist/steam jet impingement (q”=7.54 kW/m2, Re=14000 and m l/ms=~1.5%)
0 2 4 6 8 10 120
50
100
150
200
x/b
h (W
/m2 K
)
0 2 4 6 8 10 120
50
100
150
200
250
300
x/b
0 2 4 6 8 10 120
200
400
600
800
x/b
Steam Only
Mist/Steam
q"=13.4 kW/m2
Steam Only
Mist/Steam
q"=7.54 kW/m 2
Steam Only
Mist/Steam
q"=3.35 kW/m2
h (W
/m2 K
)
h (W
/m2K
)
T sat =103oC Tsat =103oC
T sat=103oC
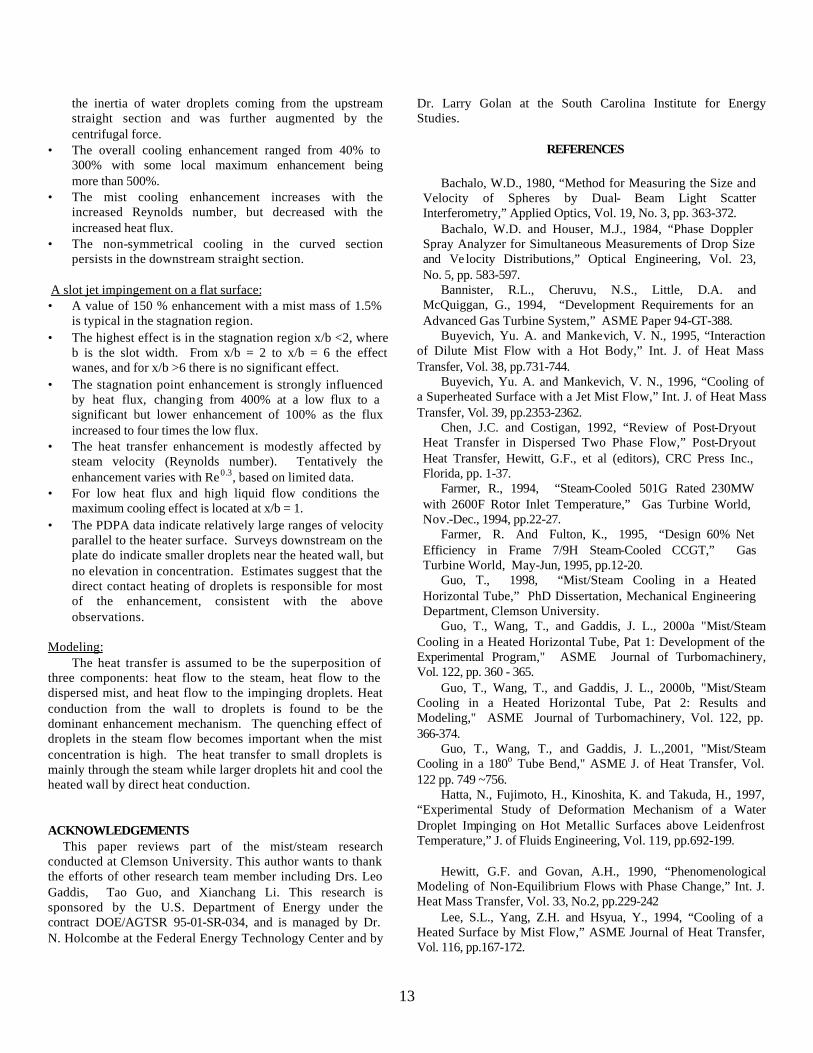
fig. 17 Heat transfer coefficient at different heat fluxes (Re=7500 and ml/ms=~3.5%)
higher temperatures the droplet will overcome any sub-cooling associated with the pressure of deformation, form vapor, and be repelled from the wall. Direct observation of the surface at all heat fluxes showed no evidence of droplet residence or any accumulated film. The complicated phenomena noted by Guo et al. (2000b) in a straight tube resulted from a pre-existing liquid film and is not relevant here. The downstream region of Guo’s observation is more comparable. In the present study, data with several heat fluxes are available to examine the temperature effect. Figure 17 shows the heat transfer coefficients under different heat fluxes. The variation in single-phase heat transfer coefficient produces a constant Nu using the conductivity evaluated midway between wall and saturation temperature. The stagnation point heat transfer is enhanced by 40% at high heat flux, q″ = 13.4 kW/m2 and the enhancement increases to over 400% at low heat flux, q″ = 3.35 kW/m2. The results of an array of four circular jets and three arrays
of 12 round jets are to be presented at the ASME Turbo Expo 2001 (Li et. al, 2001b). The results of a slot jet impinging on a concaved surface are under preparation for future publication. (D) Modeling of mist/steam interaction with wall
Li et al. (2000) proposed that the mist/steam jet impingement heat transfer could be due to four identified mechanisms: an ordinary single phase effect, modifications to the flow of the single phase by the mist, quenching of the thermal boundary layer by the mist, and direct contact of droplets of mist with the surface. To model each of these mechanisms, they specifically considered:
(a) Heat Transfer from the Target Wall to the Steam
Heat transfer due to the steam is modeled as heat convection of a single-phase steam flow. The heat transfer enhancement through the effect of droplets on the flow has been assumed to be of secondary importance. Experimental study by Yoshida et al. (1988) found 170% enhancement by adding 80% by mass glass beads of diameter 50µm to the airflow. Considering the effect of the particles includes boundary layer disturbance as well as other cooling effects in the present study with less than 5% water droplets, the enhancement of the single-phase heat transfer due to droplets on the flow is projected to be less than 4%.
(b) Heat Transfer between the Droplet and Steam (or Quenching Effect)
Heat transfer between the droplets and steam represents the quench effect due to water droplets, and it can be modeled by considering droplets as a distributed heat sink. The droplets evaporate into the superheated steam inside the thermal boundary layer and act to quench the boundary layer. Li et al. (2000) employed a superposition model to calculate the heat transfer between droplets and steam by dividing the temperature of mist/steam flow into two parts, T = T1 + T2. T1 is the temperature of steam-only flow and T2 is the temperature depression caused by the mist.
11
(c) Heat Transfer from the Target Wall to Droplets (or Direct Contact Cooling)
Unlike spray cooling, where the droplet momentum is supplied by a device, small mist droplets may not be able to hit the wall because of the drag force in the present study. Based on trajectory analysis by Wang et al. (2000), it is believed that larger droplets will hit the wall if the approach velocity is high enough. Though neglected in trajectory analysis herein, the droplets are subject to a lift “force” due to the momentum imbalance of asymmetric evaporation.
According to Buyevich and Mankevich (1995), the droplet will depart from (or bounce off) the wall if the impact velocity is lower than a critical velocity when the surface is superheated above 30oC. Heat transfer from the wall to the droplet will pass through a vapor layer for non-sticking droplets.
Once a droplet hits the wall, whether it rebounds from the wall depends on the wall temperature, the impact velocity, and the residence time of the droplet, which is the time, elapsed for a droplet staying on the wall momentarily until it reaches some superheat on the wall. The residence time is affected by wall superheat, surface tension, impact velocity, and thermodynamic properties. Typically, a high wall temperature will reject the droplet after a short time while a low wall temperature will permit the droplet to remain much longer. Li et al. (2000) applied a transient conduction model of a spherical cap geometry of a water droplet for a residence time to analyze the direct contact cooling of a single water droplet. The residence time was longer than that proposed by Hatta et al. (1997) for much higher temperatures. Li’s data demand that the contact time with the wall be inversely related to the wall temperature.
To predict the overall heat transfer by direct contact of those droplets which contact the wall, one must calculate trajectories for the droplets. The commercial code FLUENT was employed to compute two phase particle-laden flows.
Based on the experimental results of a slot impinging jet, with effects of mist experimentally observed to be multiples of the single-phase heat transfer, it is evident that the direct contact of droplets is the primary enhancement mechanism. After a detailed modeling of each heat transfer mechanism, Li et al. (2000) further argued that the evaporation of liquid is limited to a small percent of the total heat transfer. The model of Buyevich and Mankevich (1995 & 1996), which would have a fraction of contacting droplets stick and evaporate completely, was rejected because the observed heat flows were too low to have more than a tiny fraction of droplets evaporate completely.
Using the contact time and contact area as described above and droplet impact densities calculated using FLUENT, the modeling successfully calculated the heat flow within 7% of Li’s (1999) experimental data. The results of modeling also indicate that direct contact of droplets indeed is the primary enhancement mechanism and the quenching effect is relatively minor. The single-phase steam convection is proportional to temperature difference and the direct contact cooling is more
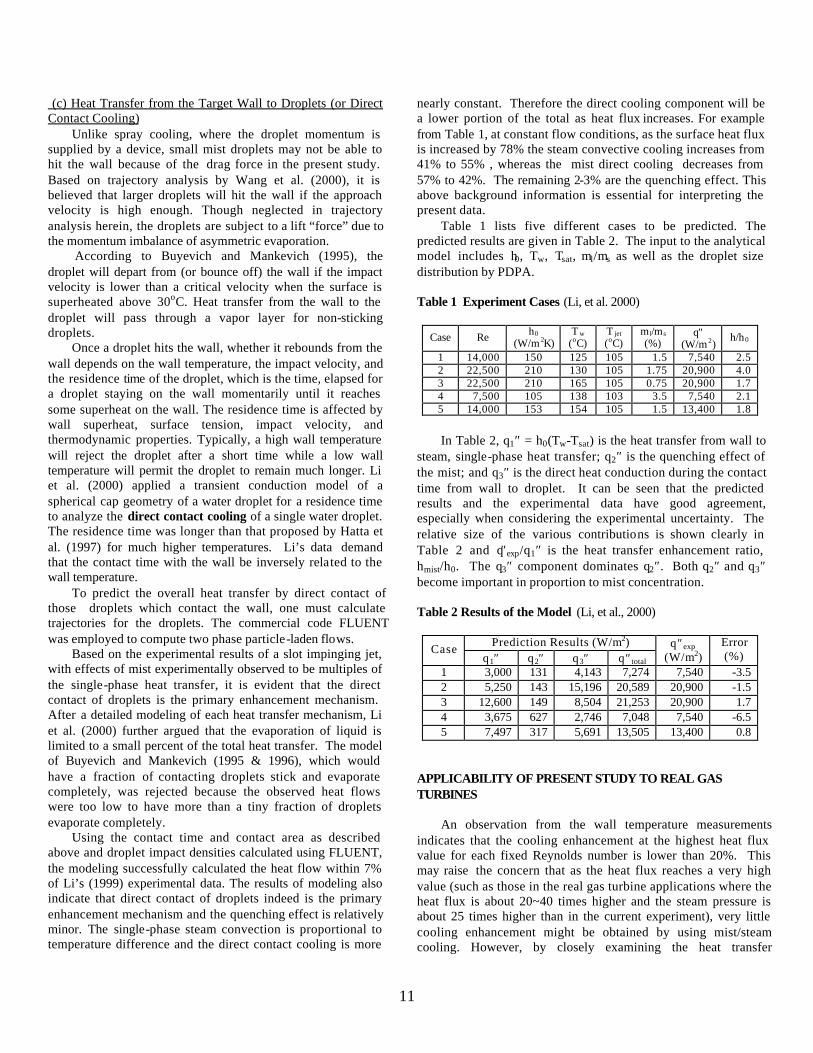
nearly constant. Therefore the direct cooling component will be a lower portion of the total as heat flux increases. For example from Table 1, at constant flow conditions, as the surface heat flux is increased by 78% the steam convective cooling increases from 41% to 55% , whereas the mist direct cooling decreases from 57% to 42%. The remaining 2-3% are the quenching effect. This above background information is essential for interpreting the present data.
Table 1 lists five different cases to be predicted. The predicted results are given in Table 2. The input to the analytical model includes h0, Tw, Tsat, ml/ms as well as the droplet size distribution by PDPA.
Table 1 Experiment Cases (Li, et al. 2000)
Case Re h0 (W/m 2K)
T w (oC)
T jet (oC)
ml/ms (%)
q″ (W/m 2)
h/h0
1 14,000 150 125 105 1.5 7,540 2.5 2 22,500 210 130 105 1.75 20,900 4.0 3 22,500 210 165 105 0.75 20,900 1.7 4 7,500 105 138 103 3.5 7,540 2.1 5 14,000 153 154 105 1.5 13,400 1.8
In Table 2, q1″ = h0(Tw-Tsat) is the heat transfer from wall to
steam, single-phase heat transfer; q2″ is the quenching effect of the mist; and q3″ is the direct heat conduction during the contact time from wall to droplet. It can be seen that the predicted results and the experimental data have good agreement, especially when considering the experimental uncertainty. The relative size of the various contributions is shown clearly in Table 2 and q″exp/q1″ is the heat transfer enhancement ratio, hmist/h0. The q3″ component dominates q2″. Both q2″ and q3″ become important in proportion to mist concentration. Table 2 Results of the Model (Li, et al., 2000)
Prediction Results (W/m2) Case q1″ q2″ q3″ q″ total
q″ exp (W/m2)
Error (%)
1 3,000 131 4,143 7,274 7,540 -3.5 2 5,250 143 15,196 20,589 20,900 -1.5 3 12,600 149 8,504 21,253 20,900 1.7 4 3,675 627 2,746 7,048 7,540 -6.5 5 7,497 317 5,691 13,505 13,400 0.8
APPLICABILITY OF PRESENT STUDY TO REAL GAS TURBINES
An observation from the wall temperature measurements indicates that the cooling enhancement at the highest heat flux value for each fixed Reynolds number is lower than 20%. This may raise the concern that as the heat flux reaches a very high value (such as those in the real gas turbine applications where the heat flux is about 20~40 times higher and the steam pressure is about 25 times higher than in the current experiment), very little cooling enhancement might be obtained by using mist/steam cooling. However, by closely examining the heat transfer
12
measurements, it can be seen that the cooling enhancement at the highest heat flux does improve when the main steam Reynolds number increases. For example, in the straight tube the average cooling enhancement at q” = 8000 W/m2 increases from 20% at Re = 10,000 to 150% at Re = 35,000. Similar results can be observed for other cases. This indicates that in real gas turbine applications where the Reynolds number is 20~30 times higher than the current experimental value, the turbine airfoils could still be effectively cooled by mist/steam mixture. Besides, under real engines conditions, the steam density will increase approximately 14 times while the liquid density will decrease approximately 15%. Heavier steam could sustain more volume of the liquid droplets, so this would translate into an increase of approximately 16 times more liquid volume (or more droplets) in the high-pressure engine condition with the same amount of liquid mass and liquid droplet size distributions as in the laboratory. More droplets would imply better cooling. Other favorable changes at real engines conditions include 2.8 times higher steam thermal conductivity and 10% higher steam specific heat . Unfavorable changes include 24% reduction of latent heat and 100% increase of steam dynamic viscosity.
An analysis of employing droplet contact time with the hot surface and an estimate of the evaporative effect at real engine conditions indicated that a modestly greater mist should be required at prototype conditions than in the current experiment. Based on the jet impingement results, projections to the higher Reynolds numbers of real gas turbine applications will increase both the single-phase heat component and the mist component. At the increased wall superheat values, which may reach 800°C, of gas turbine applications, there may be a decline in mist effect. But the trends indicate that the mist concentration continues to influence the mist impingement effect and it is expected that the higher fluid density will permit carrying increased mist concentration.
RECOMMENDATIONS FOR FUTURE STUDY Future studies are required to verify the validity of
mist/steam heat transfer enhancement in high temperature, high Reynolds number, and high pressure conditions for ATS engines turbines. Intermediate testing conditions half way between the current test conditions and those of the ATS engines are strongly recommended. Because the experiments performed at the intermediate conditions are more economic to be conducted and the results can provide information for appropriate scaling factors. Other items remain for further evaluation as well. The tube size effect deserves documentation. And a tube experiment having no upstream liquid film would provide for more confident estimation of the mist effect without contending with the film remnants. The effect of pressure deserves evaluation, in one step or two. The confirmation of temperature effect is also desirable, to document that there is a minimum in the heat flow to a droplet at some intermediate temperature. At some stage the effect of rotating of the tube requires testing. In a blade the question of how to deal with
the total problem and specifically how to address the trailing edge situation must be addressed. Finally, ideas of how to generate and direct the mist in the real gas turbines are needed and their evaluation made.
CONCLUSIONS In the straight tube:
• Local enhancements up to 300% were registered with mist contents of 1% to 6%. The general level of average enhancement was found to be between 30% and 100 % with the enhancement decreasing as the wall heat flux increased.
• The design of the mixing chamber has a direct effect on the droplet size and distribution. Generally, the current mixing chamber serves as a filter where large droplets are trapped inside the mixing chamber.
• Droplet transportation is an important aspect of obtaining desirable droplet size and distribution. Droplets larger than 15µm are mostly lost during the transportation, due to the deposition mechanisms.
• As the heat flux increases, the local droplet mean diameter downstream and near the wall increases too. This indicates that inside the heated test section, smaller droplets are more susceptible to the wall heat transfer and evaporate quickly.
• When the test section is mildly heated, an interesting wall temperature distribution is observed: the wall temperature for the mist/steam flow increases first, then decreases, and finally increases again. A three-stage heat transfer model was hypothesized. It was concluded that the powerful cooling in the first stage was attributed to the liquid film which was formed via droplet deposition in the section upstream of the heated test section.
• When the test section is severely heated, the wall temperature for the mist/steam flow increases monotonically. Stages 1 and 2 were too short to be noticed; only stage 3 dry-wall mist cooling prevailed.
• The heat transfer enhancement increases as either the main flow rates or the droplet mass ratio increases , or as the wall heat flux decreases.
• An empirical model that incorporates droplet dynamics including droplet deposition and entrainment was proposed. By employing an empirical heating factor, the prediction agreed with the experimental results fairly well.
In the 180° bent tube:
• For both steam-only and mist/steam conditions, the outer wall always had better cooling than the inner wall did. The inner-outer wall temperature difference reduced as Reynolds number increased for the mist cases. However, the cooling enhancement on the inner wall was clearly higher than on the outer wall downstream of the 45° bend and prevailed further in the straight section downstream of the 180°bend.
• On the mist-cooled outer wall, the maximum cooling occurs near the 45° location due to the direct mist impingement on the outer wall. This impingement is believed to be caused by
13
the inertia of water droplets coming from the upstream straight section and was further augmented by the centrifugal force.
• The overall cooling enhancement ranged from 40% to 300% with some local maximum enhancement being more than 500%.
• The mist cooling enhancement increases with the increased Reynolds number, but decreased with the increased heat flux.
• The non-symmetrical cooling in the curved section persists in the downstream straight section.
A slot jet impingement on a flat surface: • A value of 150 % enhancement with a mist mass of 1.5%
is typical in the stagnation region. • The highest effect is in the stagnation region x/b <2, where
b is the slot width. From x/b = 2 to x/b = 6 the effect wanes, and for x/b >6 there is no significant effect.
• The stagnation point enhancement is strongly influenced by heat flux, changing from 400% at a low flux to a significant but lower enhancement of 100% as the flux increased to four times the low flux.
• The heat transfer enhancement is modestly affected by steam velocity (Reynolds number). Tentatively the enhancement varies with Re0.3, based on limited data.
• For low heat flux and high liquid flow conditions the maximum cooling effect is located at x/b = 1.
• The PDPA data indicate relatively large ranges of velocity parallel to the heater surface. Surveys downstream on the plate do indicate smaller droplets near the heated wall, but no elevation in concentration. Estimates suggest that the direct contact heating of droplets is responsible for most of the enhancement, consistent with the above observations.
Modeling:
The heat transfer is assumed to be the superposition of three components: heat flow to the steam, heat flow to the dispersed mist, and heat flow to the impinging droplets. Heat conduction from the wall to droplets is found to be the dominant enhancement mechanism. The quenching effect of droplets in the steam flow becomes important when the mist concentration is high. The heat transfer to small droplets is mainly through the steam while larger droplets hit and cool the heated wall by direct heat conduction.
ACKNOWLEDGEMENTS This paper reviews part of the mist/steam research conducted at Clemson University. This author wants to thank the efforts of other research team member including Drs. Leo Gaddis, Tao Guo, and Xianchang Li. This research is sponsored by the U.S. Department of Energy under the contract DOE/AGTSR 95-01-SR-034, and is managed by Dr. N. Holcombe at the Federal Energy Technology Center and by
Dr. Larry Golan at the South Carolina Institute for Energy Studies.
REFERENCES
Bachalo, W.D., 1980, “Method for Measuring the Size and Velocity of Spheres by Dual- Beam Light Scatter Interferometry,” Applied Optics, Vol. 19, No. 3, pp. 363-372.
Bachalo, W.D. and Houser, M.J., 1984, “Phase Doppler Spray Analyzer for Simultaneous Measurements of Drop Size and Ve locity Distributions,” Optical Engineering, Vol. 23, No. 5, pp. 583-597.
Bannister, R.L., Cheruvu, N.S., Little, D.A. and McQuiggan, G., 1994, “Development Requirements for an Advanced Gas Turbine System,” ASME Paper 94-GT-388.
Buyevich, Yu. A. and Mankevich, V. N., 1995, “Interaction of Dilute Mist Flow with a Hot Body,” Int. J. of Heat Mass Transfer, Vol. 38, pp.731-744.
Buyevich, Yu. A. and Mankevich, V. N., 1996, “Cooling of a Superheated Surface with a Jet Mist Flow,” Int. J. of Heat Mass Transfer, Vol. 39, pp.2353-2362.
Chen, J.C. and Costigan, 1992, “Review of Post-Dryout Heat Transfer in Dispersed Two Phase Flow,” Post-Dryout Heat Transfer, Hewitt, G.F., et al (editors), CRC Press Inc., Florida, pp. 1-37.
Farmer, R., 1994, “Steam-Cooled 501G Rated 230MW with 2600F Rotor Inlet Temperature,” Gas Turbine World, Nov.-Dec., 1994, pp.22-27.
Farmer, R. And Fulton, K., 1995, “Design 60% Net Efficiency in Frame 7/9H Steam-Cooled CCGT,” Gas Turbine World, May-Jun, 1995, pp.12-20.
Guo, T., 1998, “Mist/Steam Cooling in a Heated Horizontal Tube,” PhD Dissertation, Mechanical Engineering Department, Clemson University.
Guo, T., Wang, T., and Gaddis, J. L., 2000a "Mist/Steam Cooling in a Heated Horizontal Tube, Pat 1: Development of the Experimental Program," ASME Journal of Turbomachinery, Vol. 122, pp. 360 - 365. Guo, T., Wang, T., and Gaddis, J. L., 2000b, "Mist/Steam Cooling in a Heated Horizontal Tube, Pat 2: Results and Modeling," ASME Journal of Turbomachinery, Vol. 122, pp. 366-374. Guo, T., Wang, T., and Gaddis, J. L.,2001, "Mist/Steam Cooling in a 180o Tube Bend," ASME J. of Heat Transfer, Vol. 122 pp. 749 ~756.
Hatta, N., Fujimoto, H., Kinoshita, K. and Takuda, H., 1997, “Experimental Study of Deformation Mechanism of a Water Droplet Impinging on Hot Metallic Surfaces above Leidenfrost Temperature,” J. of Fluids Engineering, Vol. 119, pp.692-199. Hewitt, G.F. and Govan, A.H., 1990, “Phenomenological Modeling of Non-Equilibrium Flows with Phase Change,” Int. J. Heat Mass Transfer, Vol. 33, No.2, pp.229-242
Lee, S.L., Yang, Z.H. and Hsyua, Y., 1994, “Cooling of a Heated Surface by Mist Flow,” ASME Journal of Heat Transfer, Vol. 116, pp.167-172.
14
Liu, B.Y.H. and Agarwal, J.K., 1974, “Experimental Observation of Aerosol Deposition in Turbulent Flow,” Aerosol Science, Vol. 5, pp.145-155. Li, X., 1999, “Cooling by a Mist/Steam Jet,” Ph.D. Dissertation, Dept. of Mechanical Engineering, Clemson University, SC, USA. Li, X., Gaddis, J. L., and Wang, T., 2000 "Modeling of Heat Transfer in a Mist/Steam Impingement Jet" ASME paper NHTC 2000-12044. Presented at the National Heat Transfer Conference in Pittsburgh, 2000. (to be appeared at the ASME Journal of Heat Transfer 2001)
Li, X, Gaddis, J. L., and Wang, T, 2001a, “ Mist/Steam Heat Transfer of Confined Slot Jet Impingement,” ASME Journal of Turbomachinery, Vol. 123, pp. 161 - 167.
Li, X, Gaddis, J. L., and Wang, T, 2001b, “ Mist/Steam Heat Transfer of Circular Confined Impinging Jets,”ASME paper 2001-GT-0151, to be presented at the ASME Turbo Expo 2001, New Orleans, June 2001.
Martin, H., 1977, “Heat and Mass Transfer between Impinging Gas Jets and Solid Surfaces,” in Advances in Heat Transfer, Vol. 13, pp.1-60
Mori, Y., Hijikata, K. and Yasunaga, T., 1982, “Mist Cooling of Very Hot Tubules with Reference to Through-Hole Cooling of Gas Turbine Blades,” Intl. J. Heat Mass Transfer, Vol 25, No.9, pp.1271-1278.
Mukavetz, D.W., 1994, “Advanced Turbine System (ATS) Turbine Modification for Coal and Biomass Fuels,” in Proceedings of the Advanced Turbine System Annual Program Review Meeting, Nov. 9-11, ORNL/Arlington, VA, pp. 91-95.
Nirmalan, N.V., Weaver, J.A. and Hylton, L.D., 1998, “An Experimental Study of Turbine Vane Heat Transfer with Water-Air Cooling,” J. of Turbomachinery, Vol. 120, No.1, pp.50-62.
Yoshida, H., Suenaga, K. and Echigo, R., 1988, “Turbulence Structure and Heat Transfer of A Two-Dimensional Impinging Jet with Gas-Solid Suspensions,” NHTC, Vol.2, pp.461-467. Wang, T., Gaddis, J. L., and Li, X., 2000,"Mist/Steam Cooling for Advanced Gas Turbine Systems: Vol. 3: In a Confined Slot Impingement Jet" DOE/AGTSR Final Report.
Wenglarz, R., Nirmalan, N., and Daehler, T., 1994," Advanced Turbine System (ATS) Turbine Modifications for Coal and Biomass fuels” Proceedings of the ATS Program Review Meeting Nov 9-11, ORNL/Arlington VA. pp 91-95.