Embed Size (px)
Citation preview
MISSOURI STATE AUDITOR'S OFFICE FISCAL NOTE (16-205) Subject
Initiative petition from Andy Zellers regarding a proposed amendment to Chapter 386 of the Revised Statutes of Missouri. (Received January 04, 2016)
Date
January 25, 2016 Description
This proposal would amend Chapter 386 of the Revised Statutes of Missouri. The amendment is to be voted on in November 2016.
Public comments and other input
The State Auditor's office requested input from the Attorney General's office, the Department of Agriculture, the Department of Economic Development, the Department of Elementary and Secondary Education, the Department of Higher Education, the Department of Health and Senior Services, the Department of Insurance, Financial Institutions and Professional Registration, the Department of Mental Health, the Department of Natural Resources, the Department of Corrections, the Department of Labor and Industrial Relations, the Department of Revenue, the Department of Public Safety, the Department of Social Services, the Governor's office, the Missouri House of Representatives, the Department of Conservation, the Department of Transportation, the Office of Administration, the Office of State Courts Administrator, the Missouri Senate, the Secretary of State's office, the Office of the State Public Defender, the State Treasurer's office, Adair County, Boone County, Callaway County, Cass County, Clay County, Cole County, Greene County, Jackson County Legislators, Jasper County, St. Charles County, St. Louis County, Taney County, the City of Cape Girardeau, the City of Columbia, the City of Jefferson, the City of Joplin, the City of Kansas City, the City of Kirksville, the City of Mexico, the City of Raymore, the City of St. Joseph, the City of St. Louis, the City of Springfield, the City of Union, the City of Wentzville, the City of West Plains, Cape Girardeau 63 School District, Hannibal 60 School District, State Technical College of Missouri, Metropolitan Community College, University of Missouri, St. Louis Community College, the Public Service Commission, and the Missouri Joint Municipal Electric Utility Commission. Mark R. Reading provided information to the State Auditor's Office as a proponent of this initiative petition.
Edward D. Greim of Graves Garrett LLC provided information to the State Auditor's Office as an opponent of this initiative petition.
Assumptions Officials from the Attorney General's office indicated Section 386.900.13, RSMo, of the proposal assigns new rulemaking responsibility to their office regarding mandatory disclosures of information by sellers of qualified electric generation units, as well as new investigatory and litigation duties. They assume they would need 1/4 full-time employee (FTE) to handle the complaints, enforcement and the rulemaking responsibilities assigned to their office, resulting in increased operating expenses of $13,890 for fiscal year 2017, $16,810 for fiscal year 2018, and $16,952 for fiscal year 2019. Officials from the Department of Agriculture indicated no fiscal impact on their department. Officials from the Department of Economic Development (DED) provided the following information: The Division of Energy (DE) indicated this petition will result in increased operating expenses of $723,522 for fiscal year 2017, $792,438 for fiscal year 2018, and $800,141 for fiscal year 2019. These costs will be offset by additional revenues to the Clean Energy Fund of $0 for fiscal year 2017, $355,548 for fiscal year 2018, and $355,548 for fiscal year 2019. Summarize how this bill would affect the agency Section 386.870 – Electric Vehicle Charging Stations The DE participates in Public Service Commission (PSC) regulatory cases to evaluate issues from a formal state policy and planning perspective consistent with its interests in clean, affordable, abundant energy, and its efficient use. DE is active in cases before the PSC related to energy efficiency and renewable energy and has responsibilities associated with certifying clean energy sources under Missouri’s Renewable Energy Standard (RES) and net metering statutes. As such, DE assumes it would be involved in the implementation of this provision by monitoring and participating in cases that allow regulated electric utilities to install and recover costs associated with electric vehicle recharging stations that are partially powered by a clean energy source or offset with renewable energy credits. Section 386.900 – Enhanced Net Metering and Easy Connection Act DE assumes it would be involved in the implementation of this provision that modifies the existing net metering and interconnection requirements for regulated electric utilities. It is assumed there would be a rulemaking docket to set the process and details associated with this proposal. Rulemaking cases before the PSC may be open for a year or more and include several full-day workshops. DE staff would participate in the workshops, monitor filings and review of other parties’ proposals, research best practices and develop
proposals and rule language, collaborate with other interested parties, and file comments. DE assumes it would monitor and participate in tariff and other related cases where enhanced net metering provisions are considered. Section 386.910 – Community Solar Act DE assumes it would be involved in the implementation of the Community Solar Act provisions and participate in the rulemaking docket to set the process and details associated with this section. Rulemaking cases before the PSC may be open for a year or more and include several full-day workshops. DE staff would participate in the workshops, monitor filings and review of other parties’ proposals, research best practices and develop proposals and rule language, collaborate with other interested parties, and file comments. DE assumes it would monitor and participate in tariff and other related cases where community solar facilities are established for purposes of determination of eligibility and certification under the RES. DE assumes this provision would result in additional RES certifications that would need to be performed. Section 386.1000 – Clean Energy Tax Credit DE is required to administer the Clean Energy Fund created by this section and promulgate rules to implement the Clean Energy Tax Credit. The proposal requires DE to receive applications and deposits, review and initially approve applications and required information within 30 days, review final approval applications, issue certificates and provide notifications, refund deposits for completed and disapproved projects, at least quarterly publish a list of the amount of tax credits initially and finally approved for each fiscal year and amounts reserved for future years, notify individual applicants of disapproved applications and approval within specified timeframes, notify applicants if the maximum amount of credits authorized have been allocated for the fiscal year and grant three-month extensions if needed for project completion with additional deposit payments. Long-range implications Fiscal impacts associated with the Clean Energy Tax Credits could continue until June 30, 2022. The authorization for the tax credit would sunset sooner if the 1,000 megawatt limit is reached. Economic benefits associated with construction of solar facilities would also have long-range implications. Assumptions and methodology used in arriving at state fiscal impact Section 386.870 – Electric Vehicle Charging Stations For purposes of this fiscal note, DE assumes it would be involved in cases to implement this provision but could do so with existing resources. However, there could be a cumulative fiscal impact to DE if multiple provisions related to PSC regulatory issues pass due to DE’s involvement in such cases.
Section 386.900 – Enhanced Net Metering and Easy Connection Act For purposes of this fiscal note, DE assumes it would be involved in the PSC rulemaking and related cases to implement this provision but could do so with existing resources. However, there could be a cumulative fiscal impact to DE if multiple provisions related to PSC regulatory issues pass due to DE’s involvement in such cases. 386.910-Community Solar Act For purposes of this fiscal note, DE assumes it would be involved in the PSC rulemaking and related cases to implement this provision but could do so with existing resources. However, there could be a cumulative fiscal impact to DE if multiple provisions related to PSC regulatory issues pass due to DE’s involvement in such cases. The RES requires investor-owned utilities in Missouri to either produce green power or purchase Renewable Energy Certificates (RECs) for compliance. One REC represents 1 megawatt-hour of electricity generated from an eligible renewable energy resource. The in-state renewable energy generation can receive a multiplier of 1.25 for RES compliance purpose. DE has statutory authority to certify eligible renewable energy resources before RECs associated with those renewable energy resources can be used for RES compliance. DE does not charge any certification fees. A community solar facility is defined as a solar photovoltaics facility with a capacity of 100-1000 kilowatts (kW) under this section. DE anticipates that in-state community solar facilities will request DE to certify their renewable energy resources/projects for the purpose of generating additional revenue from REC sales. DE’s review primarily focuses on environmental impacts of renewable electric generation facilities on air, water or land use. The actual staff time spent on each application varies from one project to another. Solar photovoltaics facilities with a larger capacity typically require more staff time for reviewing their third-party environmental impact assessments in addition to verifying applicable environmental permits. Staff time will be also needed for data requests and discussion, data collection, database management, report production and website maintenance. Current average staff time to review and certify renewable energy facilities ranges from 2 hours for small projects of a few hundred kW and 8-10 hours for larger projects of a few hundred kW to 1000 kW. It is assumed that small projects will account for two-thirds of the total community solar facilities and one-third will be larger projects. The weighted average of staff time (based on 2 hours for smaller projects and 8 hours for larger projects) is 4 hours (calculation: 2*{2/3}+8*{1/3)}). The number of projects at the assumed 200 kW ranges from 71 to 209 if the full amount of tax credits are used (Source: Mark Reading). By multiplying the average staff time of 4 hours, the annual staff time will range from 284 to 836 hours. For purposes of this fiscal note, DE assumes it could implement the provisions of this section related to RES environmental certifications with staff requested to implement the clean energy tax credit in Section 386.1000, RSMo (see below).
Section 386.1000 – Clean Energy Tax Credit The proposal provides for the total amount of tax credits of up to $50 million in the aggregate per fiscal year. This amount would be increased or decreased each year by the percentage of increase or decrease from the end of the previous calendar year of the Consumer Price Index, or successor index as published by the U.S. Department of Labor, or its successor agency. If the amount of the clean energy tax credits offered in any fiscal year, other than 2017, is less than the annual statutory cap, the cap for the following fiscal year would be increased by that amount with the carryover of any unused clean energy tax credit authority extending until it is used, with a maximum in any fiscal year of $70 million. For purposes of this fiscal note, it is assumed there would be a decrease in general revenues of $50 million per fiscal year. The tax credits would have unknown economic benefits from the construction and installation of solar energy systems. If all tax credits were used up to the cap of $50 million per year, and with consideration to the estimated cost and size of the projects, it is estimated there would be 4,718 residential project applications and 271 commercial project applications submitted for tax credit reviews (Source: Mark Reading). DE assumes that it would take approximately 2 hours each to do the initial review/approval of each application and another 2 hours to do the review and issuance of a certification after a project is completed for residential projects. Each of these would include clerical time for input/issuing letters/filing, etc. For larger commercial projects, an estimated 8 hours is anticipated for each of these two steps. See response above for detailed tasks required by the proposal. 18,872 hours for residential applications 4,336 hours for commercial applications 23,208 hours total DE assumes it will need a total of 11 FTE to implement the clean energy tax credit and community solar provisions of this proposal as follows: 6 – Energy Specialist I/II 2 – Energy Engineer II 1 – Energy Engineer III 2 – Administrative Office Support Assistant (AOSA) Energy Specialist I/II - Professional level staff to review the renewable energy project
applications and to complete project evaluation activities. Energy Engineer II/III - Professional staff with expertise in engineering aspects of
renewable energy projects to review the technical aspects of the projects, review of projects related to the Renewable Energy Standard and Renewable Energy Certificates and familiar with environmental impacts of renewable electric generation.
AOSA - Staff to assist with the administrative requirements of the reviews such as drafting and sending communication to applicants, maintaining the database of applicants, and tracking status of applications.
An application deposit of 2 cents/watt is required to be paid to DE and deposited in the Clean Energy Fund. The proposal provides that DE may retain, for the purposes of administering this section, up to half of each application deposit to administer the
provisions of this proposal but would not exceed one hundred dollars for residential taxpayers and two hundred and fifty dollars for all other taxpayers. Using the assumption above, if the full amount of tax credits were used each year and with consideration to the estimated cost and size of the projects, it is estimated there would be 4,718 residential project applications (at an average size of 6.1 kW) and 271 commercial project applications (at an average size of 200 kW) submitted for tax credit reviews. The application deposit for a residential project would be $122 and DE could retain 50% or $61 for a total of $287,798. The application deposit for a commercial project would be $4,000 and DE could retain a maximum of $250/application for a total of $67,750. For purposes of this fiscal note, DE assumes there could be up to $355,548 per year available from the Clean Energy Fund to administer the provisions of this proposal. As this is less than the estimated costs to implement the provisions of the proposal, DE assumes the shortfall would be from General Revenue funds. It is also assumed that General Revenue funds would be necessary to cover all DE’s costs in FY 2017 until such time as sufficient application deposits are received. DE also assumes that the Department of Economic Development’s existing tax credit database will be used to track the applications. Some IT costs to generate the necessary reports are estimated. Officials from the Department of Higher Education indicated this initiative petition would not have a fiscal impact on their department. Officials from the Department of Health and Senior Services indicated no fiscal impact on their department. Officials from the Department of Insurance, Financial Institutions and Professional Registration indicated this petition, if passed, will have no cost or savings to their department. Officials from the Department of Mental Health indicated this proposal creates no direct obligations or requirements to their department that would result in a fiscal impact. Officials from the Department of Natural Resources indicated the responsibilities of this proposal appear to fall under the Division of Energy. With Executive Order 13-03 the Division of Energy was transferred from their department to the Missouri Department of Economic Development, by Type I transfer. Therefore, they would not anticipate a direct fiscal impact from this proposal. Officials from the Department of Corrections indicated no impact. Officials from the Department of Labor and Industrial Relations indicated no fiscal impact on their department.
Officials from the Department of Revenue estimate this petition will result in increased operating expenses of $243,282 for fiscal year 2017, $181,985 for fiscal year 2018, and $183,470 for fiscal year 2019. The legislation creates a negative impact of up to $50 million per fiscal year to total state revenue by creating a new tax credit. Section 386.1000 The provisions of this section authorize the issuance of a clean energy tax credit to taxpayers incurring costs for the installation of a clean energy resource project. The taxpayer may claim 35 percent (35%) of the total cost of the project. The aggregate amount of tax credits cannot exceed $50 million per fiscal year, which will be increased or decreased each year by the Consumer Price Index. Section 386.1000.13 The department suggests changing the provisions pertaining to the transfer of the tax credit to the Department of Revenue because this is currently the department’s responsibility based on a previously issued executive order. Administrative Impact: Personal Tax: Personal Tax requires one (1) Revenue Processing Technician I (Range 10, Step L) for every 6,000 credits claimed. Corporate Tax: Corporate Tax requires three (3) Revenue Processing Technicians I (Range 10, Step L) for every 4,000 credits redeemed, 4,000 credits transferred, and for every 520 SB 1099 compliance mailings and correspondence. Integrated Tax System: The integrated tax system incurs additional costs of $43,680 to implement the provisions of this petition. Officials from the Department of Public Safety indicated they see no fiscal impact due to this petition. Officials from the Department of Social Services indicated no fiscal impact on their department. Officials from the Governor's office indicated there should be no fiscal impact to their office. Officials from the Missouri House of Representatives indicated no fiscal impact to their office.

Officials from the Department of Conservation indicated that no adverse fiscal impact to their department would be expected as a result of this initiative petition. Officials from the Office of Administration (OA) indicated the proposal: Allows utilities to recover costs and add in its rate base costs to install electric vehicle
charging stations intended to recharge electric motor vehicles, provided the energy consumed at each station is partially powered by a clean energy resource. This could result in a total state revenue reduction. OA defers to the DED for the estimated impact.
Authorizes the use of net-metering, with certain limits to facilitate the use of customer-sited or controlled clean energy resources.
Allows retail electric suppliers to recover any costs incurred in this act in that utility’s rate structure. To the extent any such costs, lost revenues or lost earning are recovered, they shall not raise the customer retail rates by an average of more than 1% in any year. This could impact total state revenue. OA defers to the PSC for the specific impact.
Allows participation in community solar facilities. Enacts a “Clean Energy” income tax credit for an amount equal to 35% of the total
cost of the clean energy project. The annual cap on the credits is $50 million, with any unused portion added to the next year's cap up to a maximum of $70 million. In addition, the cap can be adjusted based on the Consumer Price Index. The tax credit has a 3-year carry-back and a 10-year carry-forward provision and is transferable. This will result in a total state revenue reduction up to $50 million or the adjusted cap amount. This will also impact the calculation under Article X, Section 18(e), of the Missouri Constitution.
Establishes the Clean Energy Fund, which is to be used to advance clean energy through the efficient administration of the Clean Energy Tax Credit Program. This will result in an increase to total state revenue. The revenue in the fund will come from various application deposits, but could also come from appropriated moneys, gifts, contributions, grants or bequests. The DED will administer this fund. OA defers to the DED and the PSC for the estimated impact of the application deposits.
This proposal will have no fiscal impact to their office. Officials from the Office of State Courts Administrator indicated there is no fiscal impact on the courts. Officials from the Missouri Senate indicated no fiscal impact on their office. Officials from the Secretary of State's office indicated their office is required to pay for publishing in local newspapers the full text of each statewide ballot measure as directed by Article XII, Section 2(b) of the Missouri Constitution and Section 116.230-116.290, RSMo. Their office is provided with core funding to handle a certain amount of normal activity resulting from each year’s legislative session. Funding for this item is adjusted each year depending upon the election cycle with $1.3 million historically appropriated in odd numbered fiscal years and $100,000 appropriated in even numbered fiscal years to
meet these requirements. Through FY (fiscal year) 2013, the appropriation had historically been an estimated appropriation because the final cost is dependent upon the number of ballot measures approved by the General Assembly and the initiative petitions certified for the ballot. In FY 2013, at the August and November elections, there were 5 statewide Constitutional Amendments or ballot propositions that cost $2.17 million to publish (an average of $434,000 per issue). In FY 2015, the General Assembly changed the appropriation so that it was no longer an estimated appropriation and their office was appropriated $1.19 million to publish the full text of the measures. Due to this reduced funding, their office reduced the scope of the publication of these measures. In FY 2015, at the August and November elections, there were 9 statewide Constitutional Amendments or ballot propositions that cost $1.1 million to publish (an average of $122,000 per issue). Despite the FY 2015 reduction, their office will continue to assume, for the purposes of this fiscal note, that it should have the full appropriation authority it needs to meet the publishing requirements. Because these requirements are mandatory, they reserve the right to request funding to meet the cost of their publishing requirements if the Governor and the General Assembly again change the amount or continue to not designate it as an estimated appropriation. Officials from the Office of the State Public Defender indicated this initiative petition will not have any impact on their office. Officials from the State Treasurer's office indicated this proposal would have no impact to their office. Officials from Greene County indicated there are no estimated costs or savings to report from their county for this initiative petition. Officials from the City of Jefferson indicated because their city does not own any utility except for wastewater, there would be no fiscal impact should this petition become law. Officials from the City of Kansas City indicated no fiscal impact is anticipated if this proposal is adopted. Officials from University of Missouri indicated they have not seen cost impact studies on this initiative from their electric utility suppliers, but they do not believe this will have a significant impact on their university. Officials from the Public Service Commission (PSC) indicated: Section 386.870 allows an electrical corporation to recover its costs and add in its rate base prudently incurred costs to install electric vehicle charging stations provided the energy consumed is partially powered by a clean energy resource or offset with renewable energy credits. It is not clear if the renewable energy credits can be used to meet Section 386.870 and also used to meet the utility's renewable portfolio standard in Section 393.1030.
Section 386.870 also states investments made pursuant to this section shall not raise the retail rates charged to customers of electrical corporations by more than one half of one percent in any year. The PSC suggests this requirement be clarified. A similar cap is placed on the renewable mandate of Section 393.1045. It has been over 7 years since the enactment of this provision and parties continue to argue its meaning before the PSC. Section 386.890 defines "department" as the department of natural resources. Since other changes are being made to this section, "department" should be defined as the department of economic development, division of energy. Sections 386.890 and 386.900 both use the terms "Retail electric supplier" or "supplier", but in Section 386.890 a "retail electric supplier" or "supplier" is any rural electric cooperative under Chapter 394 that provides retail electric service in this state and in Section 386.900 a "retail electric supplier" or "supplier" is any municipal utility or electrical corporation regulated under this chapter that provides retail electric service in this state. Although the terms are in different statutes, it may be confusing to define the same term in a different manner. It may be clearer to use different terms applicable to the respective intent. Further since Section 386.890 is only applicable to rural electric cooperatives, it may make sense to move the entire provision to Chapter 394. Sections 386.890 and 386.900 use the term "wholesale generator". The PSC respectfully suggests this term be defined. Section 386.900 uses terms such as "commission-regulated supplier" and "public utilities" to describe suppliers that are subject to PSC jurisdiction. The PSC respectfully suggests the terms be used consistently. Section 386.900 requires the PSC to promulgate rules by June 1, 2017 and Section 386.910 requires the PSC to adopt rules by August 1, 2017. The PSC respectfully suggests these dates may be aggressive for final rules to be effective. Section 386.900.6.(2) references "subsection 4 of this section". This appears to be an inaccurate cross-reference as there is no subsection 4 of the section. Section 386.900.12 says the estimated generating capacity of all net metering systems shall count towards the respective retail electric supplier's accomplishment of any renewable energy portfolio target or mandate, but the renewable energy portfolio deals with "energy" not "capacity". Section 386.900.14 says any costs, including lost revenues and lost earnings opportunities. The PSC respectfully suggests "lost revenues" and "lost earnings opportunities" be clearly defined as to how to calculate those amounts. The interpretation and calculation of these terms has been the subject of on-going disagreement as they relate to the Missouri Energy Efficiency Investment Act.
Section 386.900.14 states the commission may evaluate the value of distributed generation and clean energy resources, but it is not clear how to determine those values. Section 386.900.14 states any costs, lost revenues or lost earnings recovered under this section shall not raise the retail rates charged to customers by an average of more than one percent in any year. The PSC suggests this requirement be clarified. A similar cap is placed on the renewable mandate of Section 393.1045. It has been over seven years since the enactment of this provision and parties continue to argue over its meaning before the commission. Section 386.910.5 states that when a community solar facility is placed in service, it shall have the option to lock in the current value-of-community-solar rate for a period of twenty years. It appears this provision would require the utility ratepayers to fund the facility at the current rate for 20 years without adjustment for changes in the utility's costs or revenues that would occur over the 20 year period. It is also not clear if the cost-of-solar value contemplates an earnings opportunity for the Commission-regulated utility. Section 386.1000 discusses a "clean energy tax credit". It is not clear why the tax credit is in the PSC statute and not in a tax-related statute. Officials from the Missouri Joint Municipal Electric Utility Commission (MJMEUC) indicated: Missouri Public Utility Alliance (MJMEUC is part of the alliance) through its electric division represents 65 of the 86 cities with municipal electric utilities. After careful review and analysis, they believe that implementation would reduce municipal electric utility revenues of approximately $23,900,000 annually based on: 1. Varying changes to the state’s net metering law. 2. Greater penetration of solar panels throughout the state because of a state funded tax
rebate for their purchase and installation. Other proposed changes would increase the cost of city operations by approximately $3,435,000 to a total of $27,335,000. Several of these proposals modify the state’s net metering law to require cities to carry forward to subsequent months excess customer generation. Current software is not designed to provide this functionality and each city would have to contract with their own vendor to modify their billing software. In addition several petition versions require the PSC to approve municipal rate increases by class based on actual expenses. This will necessitate regular cost of service studies and for cities to hire attorneys with experience before the PSC to present their cases for rate increases. In order to calculate costs they have contacted firms in both disciplines to provide estimated costs for these services.
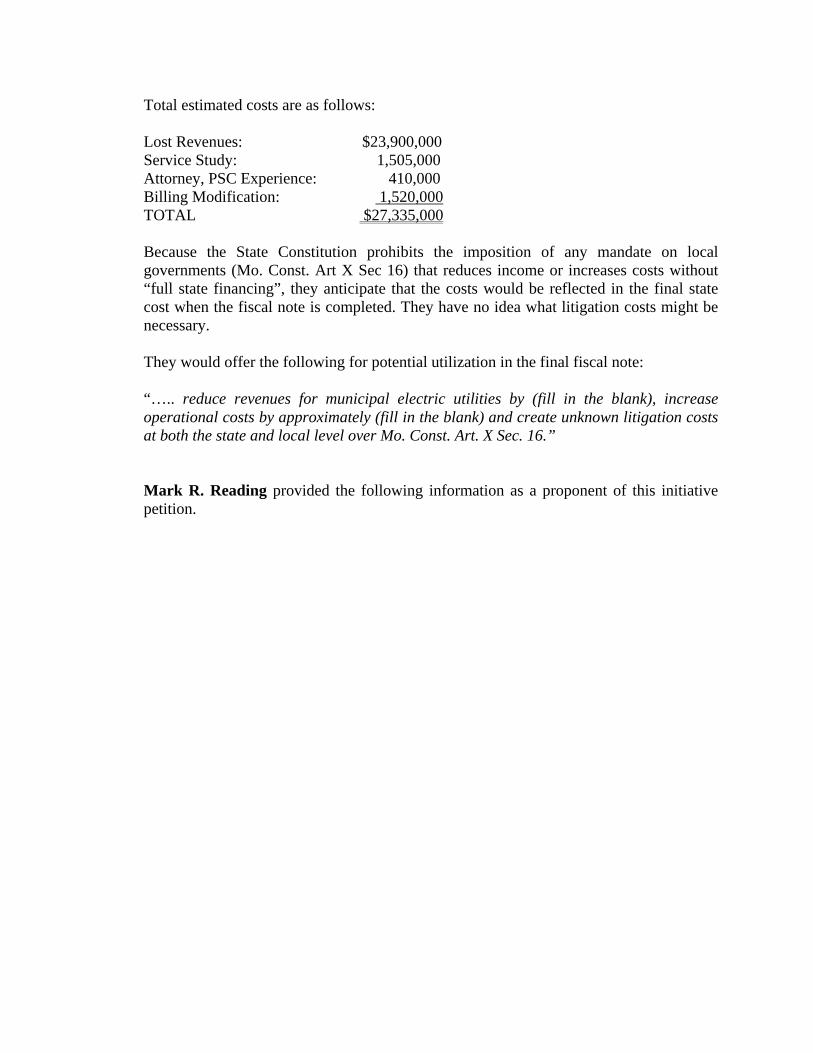
Total estimated costs are as follows: Lost Revenues: $23,900,000 Service Study: 1,505,000 Attorney, PSC Experience: 410,000 Billing Modification: 1,520,000 TOTAL $27,335,000 Because the State Constitution prohibits the imposition of any mandate on local governments (Mo. Const. Art X Sec 16) that reduces income or increases costs without “full state financing”, they anticipate that the costs would be reflected in the final state cost when the fiscal note is completed. They have no idea what litigation costs might be necessary. They would offer the following for potential utilization in the final fiscal note: “….. reduce revenues for municipal electric utilities by (fill in the blank), increase operational costs by approximately (fill in the blank) and create unknown litigation costs at both the state and local level over Mo. Const. Art. X Sec. 16.” Mark R. Reading provided the following information as a proponent of this initiative petition.
1
Submitted by:
______________________
Mark R. Reading 2604 Lakeland Drive
Jefferson City, MO 65109 (573) 694-6828
Primary Contact Person
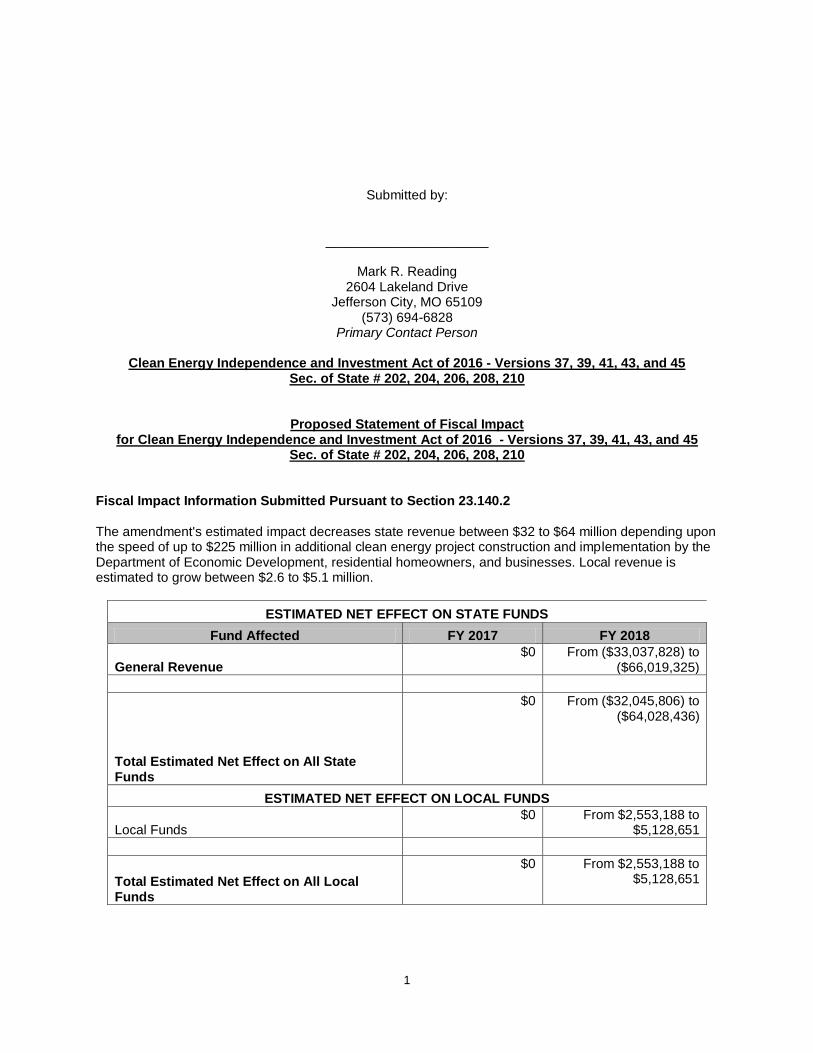
Clean Energy Independence and Investment Act of 2016 - Versions 37, 39, 41, 43, and 45 Sec. of State # 202, 204, 206, 208, 210
Proposed Statement of Fiscal Impact for Clean Energy Independence and Investment Act of 2016 - Versions 37, 39, 41, 43, and 45
Sec. of State # 202, 204, 206, 208, 210 Fiscal Impact Information Submitted Pursuant to Section 23.140.2 The amendment's estimated impact decreases state revenue between $32 to $64 million depending upon the speed of up to $225 million in additional clean energy project construction and implementation by the Department of Economic Development, residential homeowners, and businesses. Local revenue is estimated to grow between $2.6 to $5.1 million.
ESTIMATED NET EFFECT ON STATE FUNDS
Fund Affected FY 2017 FY 2018
General Revenue $0 From ($33,037,828) to
($66,019,325)
Total Estimated Net Effect on All State Funds
$0 From ($32,045,806) to ($64,028,436)
ESTIMATED NET EFFECT ON LOCAL FUNDS
Local Funds $0 From $2,553,188 to
$5,128,651
Total Estimated Net Effect on All Local Funds
$0 From $2,553,188 to $5,128,651
2
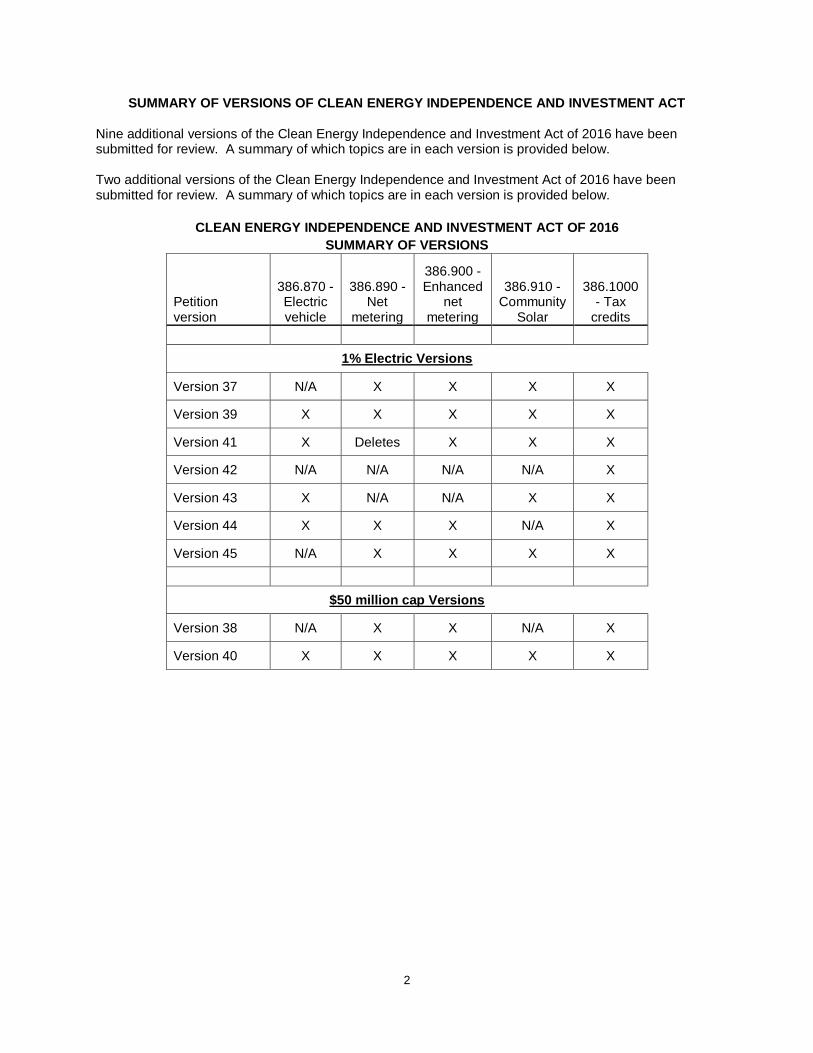
SUMMARY OF VERSIONS OF CLEAN ENERGY INDEPENDENCE AND INVESTMENT ACT
Nine additional versions of the Clean Energy Independence and Investment Act of 2016 have been submitted for review. A summary of which topics are in each version is provided below. Two additional versions of the Clean Energy Independence and Investment Act of 2016 have been submitted for review. A summary of which topics are in each version is provided below.
CLEAN ENERGY INDEPENDENCE AND INVESTMENT ACT OF 2016
SUMMARY OF VERSIONS
Petition version
386.870 - Electric vehicle
386.890 -Net
metering
386.900 - Enhanced
net metering
386.910 - Community
Solar
386.1000 - Tax
credits
1% Electric Versions
Version 37 N/A X X X X
Version 39 X X X X X
Version 41 X Deletes X X X
Version 42 N/A N/A N/A N/A X
Version 43 X N/A N/A X X
Version 44 X X X N/A X
Version 45 N/A X X X X
$50 million cap Versions
Version 38 N/A X X N/A X
Version 40 X X X X X
3
ANALYSIS OF FISCAL IMPACT OF CLEAN ENERGY INDEPENDENCE AND INVESTMENT ACT
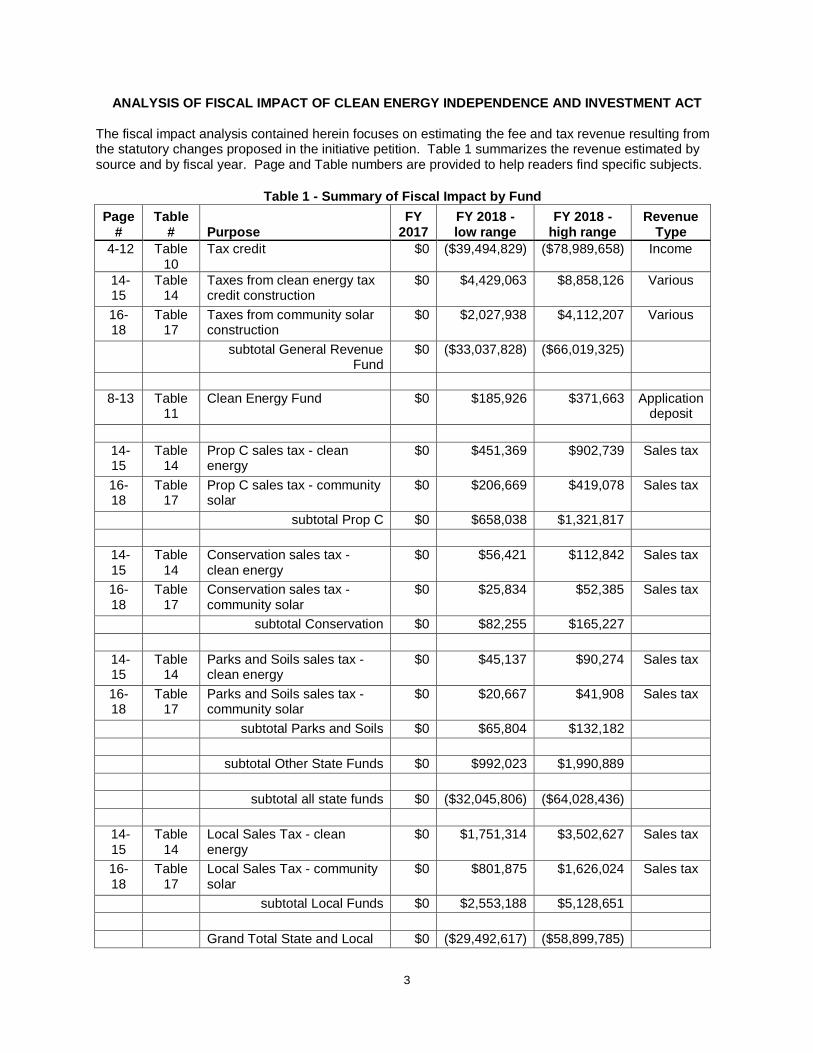
The fiscal impact analysis contained herein focuses on estimating the fee and tax revenue resulting from the statutory changes proposed in the initiative petition. Table 1 summarizes the revenue estimated by source and by fiscal year. Page and Table numbers are provided to help readers find specific subjects.
Table 1 - Summary of Fiscal Impact by Fund
Page #
Table # Purpose
FY 2017
FY 2018 - low range
FY 2018 - high range
Revenue Type
4-12 Table 10
Tax credit $0 ($39,494,829) ($78,989,658) Income
14-15
Table 14
Taxes from clean energy tax credit construction
$0 $4,429,063 $8,858,126 Various
16-18
Table 17
Taxes from community solar construction
$0 $2,027,938 $4,112,207 Various
subtotal General Revenue Fund
$0 ($33,037,828) ($66,019,325)
8-13 Table 11
Clean Energy Fund $0 $185,926 $371,663 Application deposit
14-15
Table 14
Prop C sales tax - clean energy
$0 $451,369 $902,739 Sales tax
16-18
Table 17
Prop C sales tax - community solar
$0 $206,669 $419,078 Sales tax
subtotal Prop C $0 $658,038 $1,321,817
14-15
Table 14
Conservation sales tax - clean energy
$0 $56,421 $112,842 Sales tax
16-18
Table 17
Conservation sales tax - community solar
$0 $25,834 $52,385 Sales tax
subtotal Conservation $0 $82,255 $165,227
14-15
Table 14
Parks and Soils sales tax - clean energy
$0 $45,137 $90,274 Sales tax
16-18
Table 17
Parks and Soils sales tax - community solar
$0 $20,667 $41,908 Sales tax
subtotal Parks and Soils $0 $65,804 $132,182
subtotal Other State Funds $0 $992,023 $1,990,889
subtotal all state funds $0 ($32,045,806) ($64,028,436)
14-15
Table 14
Local Sales Tax - clean energy
$0 $1,751,314 $3,502,627 Sales tax
16-18
Table 17
Local Sales Tax - community solar
$0 $801,875 $1,626,024 Sales tax
subtotal Local Funds $0 $2,553,188 $5,128,651
Grand Total State and Local $0 ($29,492,617) ($58,899,785)
4
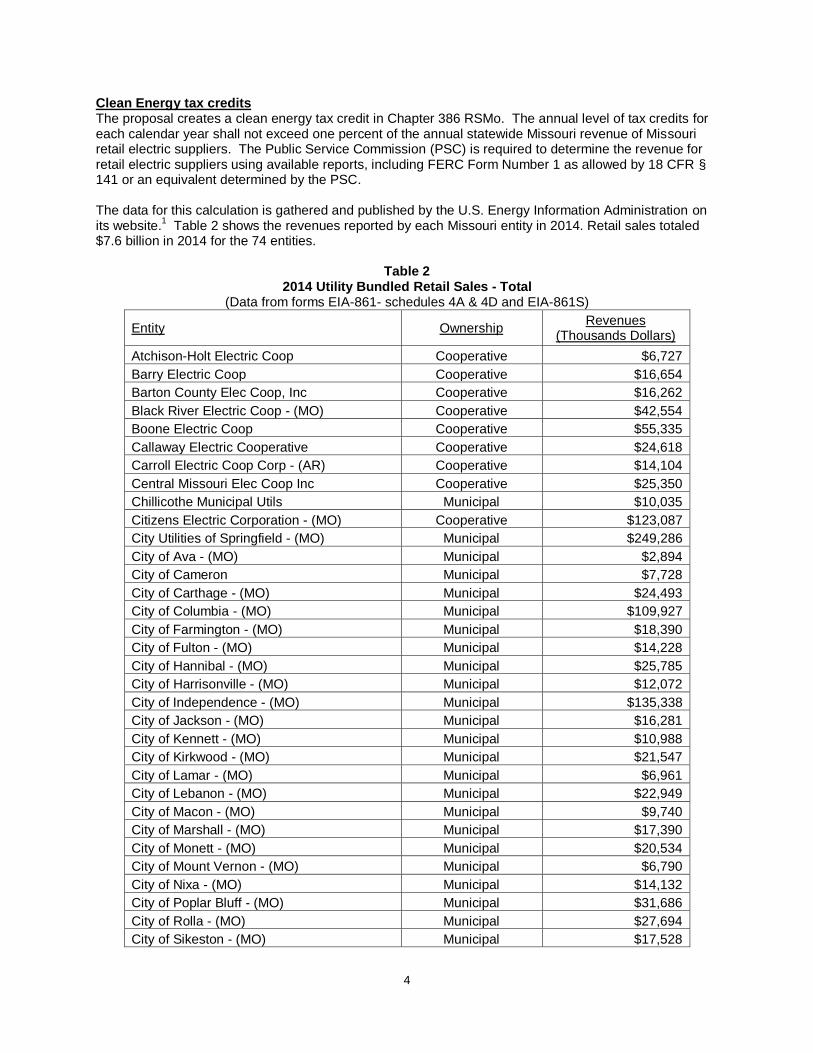
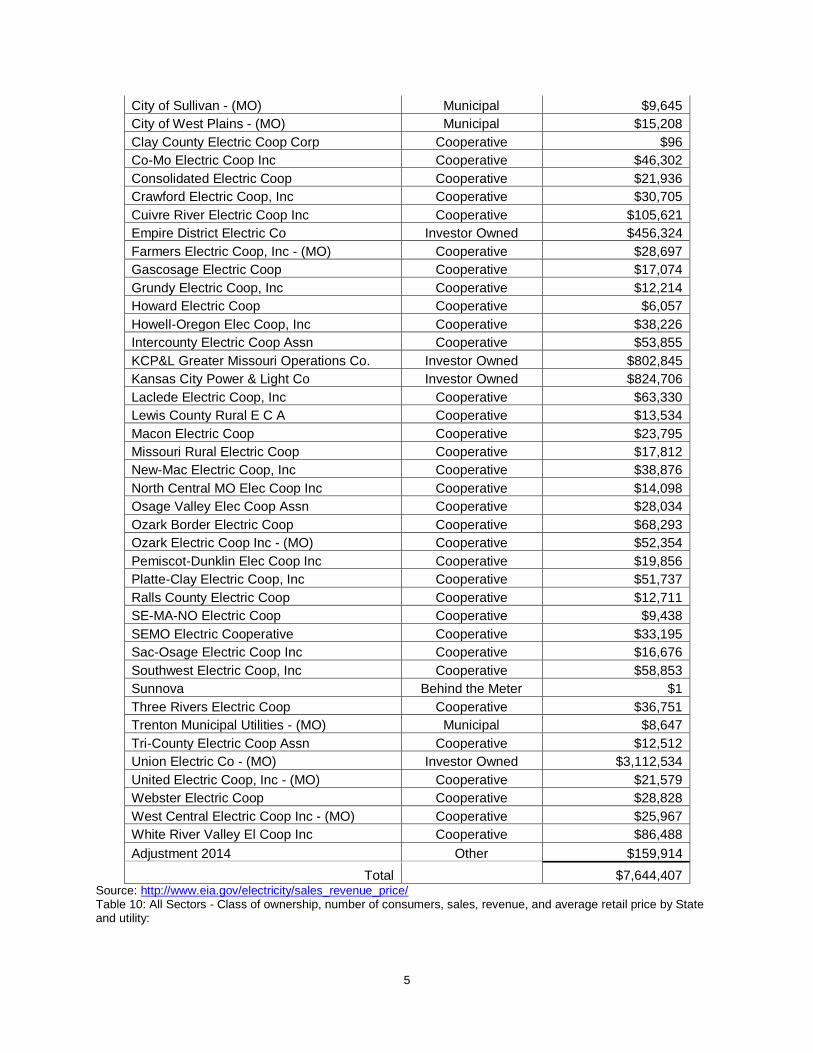
Clean Energy tax credits The proposal creates a clean energy tax credit in Chapter 386 RSMo. The annual level of tax credits for each calendar year shall not exceed one percent of the annual statewide Missouri revenue of Missouri retail electric suppliers. The Public Service Commission (PSC) is required to determine the revenue for retail electric suppliers using available reports, including FERC Form Number 1 as allowed by 18 CFR § 141 or an equivalent determined by the PSC. The data for this calculation is gathered and published by the U.S. Energy Information Administration on its website.
1 Table 2 shows the revenues reported by each Missouri entity in 2014. Retail sales totaled
$7.6 billion in 2014 for the 74 entities.
Table 2 2014 Utility Bundled Retail Sales - Total
(Data from forms EIA-861- schedules 4A & 4D and EIA-861S)
Entity Ownership Revenues
(Thousands Dollars)
Atchison-Holt Electric Coop Cooperative $6,727
Barry Electric Coop Cooperative $16,654
Barton County Elec Coop, Inc Cooperative $16,262
Black River Electric Coop - (MO) Cooperative $42,554
Boone Electric Coop Cooperative $55,335
Callaway Electric Cooperative Cooperative $24,618
Carroll Electric Coop Corp - (AR) Cooperative $14,104
Central Missouri Elec Coop Inc Cooperative $25,350
Chillicothe Municipal Utils Municipal $10,035
Citizens Electric Corporation - (MO) Cooperative $123,087
City Utilities of Springfield - (MO) Municipal $249,286
City of Ava - (MO) Municipal $2,894
City of Cameron Municipal $7,728
City of Carthage - (MO) Municipal $24,493
City of Columbia - (MO) Municipal $109,927
City of Farmington - (MO) Municipal $18,390
City of Fulton - (MO) Municipal $14,228
City of Hannibal - (MO) Municipal $25,785
City of Harrisonville - (MO) Municipal $12,072
City of Independence - (MO) Municipal $135,338
City of Jackson - (MO) Municipal $16,281
City of Kennett - (MO) Municipal $10,988
City of Kirkwood - (MO) Municipal $21,547
City of Lamar - (MO) Municipal $6,961
City of Lebanon - (MO) Municipal $22,949
City of Macon - (MO) Municipal $9,740
City of Marshall - (MO) Municipal $17,390
City of Monett - (MO) Municipal $20,534
City of Mount Vernon - (MO) Municipal $6,790
City of Nixa - (MO) Municipal $14,132
City of Poplar Bluff - (MO) Municipal $31,686
City of Rolla - (MO) Municipal $27,694
City of Sikeston - (MO) Municipal $17,528
5
City of Sullivan - (MO) Municipal $9,645
City of West Plains - (MO) Municipal $15,208
Clay County Electric Coop Corp Cooperative $96
Co-Mo Electric Coop Inc Cooperative $46,302
Consolidated Electric Coop Cooperative $21,936
Crawford Electric Coop, Inc Cooperative $30,705
Cuivre River Electric Coop Inc Cooperative $105,621
Empire District Electric Co Investor Owned $456,324
Farmers Electric Coop, Inc - (MO) Cooperative $28,697
Gascosage Electric Coop Cooperative $17,074
Grundy Electric Coop, Inc Cooperative $12,214
Howard Electric Coop Cooperative $6,057
Howell-Oregon Elec Coop, Inc Cooperative $38,226
Intercounty Electric Coop Assn Cooperative $53,855
KCP&L Greater Missouri Operations Co. Investor Owned $802,845
Kansas City Power & Light Co Investor Owned $824,706
Laclede Electric Coop, Inc Cooperative $63,330
Lewis County Rural E C A Cooperative $13,534
Macon Electric Coop Cooperative $23,795
Missouri Rural Electric Coop Cooperative $17,812
New-Mac Electric Coop, Inc Cooperative $38,876
North Central MO Elec Coop Inc Cooperative $14,098
Osage Valley Elec Coop Assn Cooperative $28,034
Ozark Border Electric Coop Cooperative $68,293
Ozark Electric Coop Inc - (MO) Cooperative $52,354
Pemiscot-Dunklin Elec Coop Inc Cooperative $19,856
Platte-Clay Electric Coop, Inc Cooperative $51,737
Ralls County Electric Coop Cooperative $12,711
SE-MA-NO Electric Coop Cooperative $9,438
SEMO Electric Cooperative Cooperative $33,195
Sac-Osage Electric Coop Inc Cooperative $16,676
Southwest Electric Coop, Inc Cooperative $58,853
Sunnova Behind the Meter $1
Three Rivers Electric Coop Cooperative $36,751
Trenton Municipal Utilities - (MO) Municipal $8,647
Tri-County Electric Coop Assn Cooperative $12,512
Union Electric Co - (MO) Investor Owned $3,112,534
United Electric Coop, Inc - (MO) Cooperative $21,579
Webster Electric Coop Cooperative $28,828
West Central Electric Coop Inc - (MO) Cooperative $25,967
White River Valley El Coop Inc Cooperative $86,488
Adjustment 2014 Other $159,914
Total $7,644,407 Source: http://www.eia.gov/electricity/sales_revenue_price/ Table 10: All Sectors - Class of ownership, number of consumers, sales, revenue, and average retail price by State and utility:
6
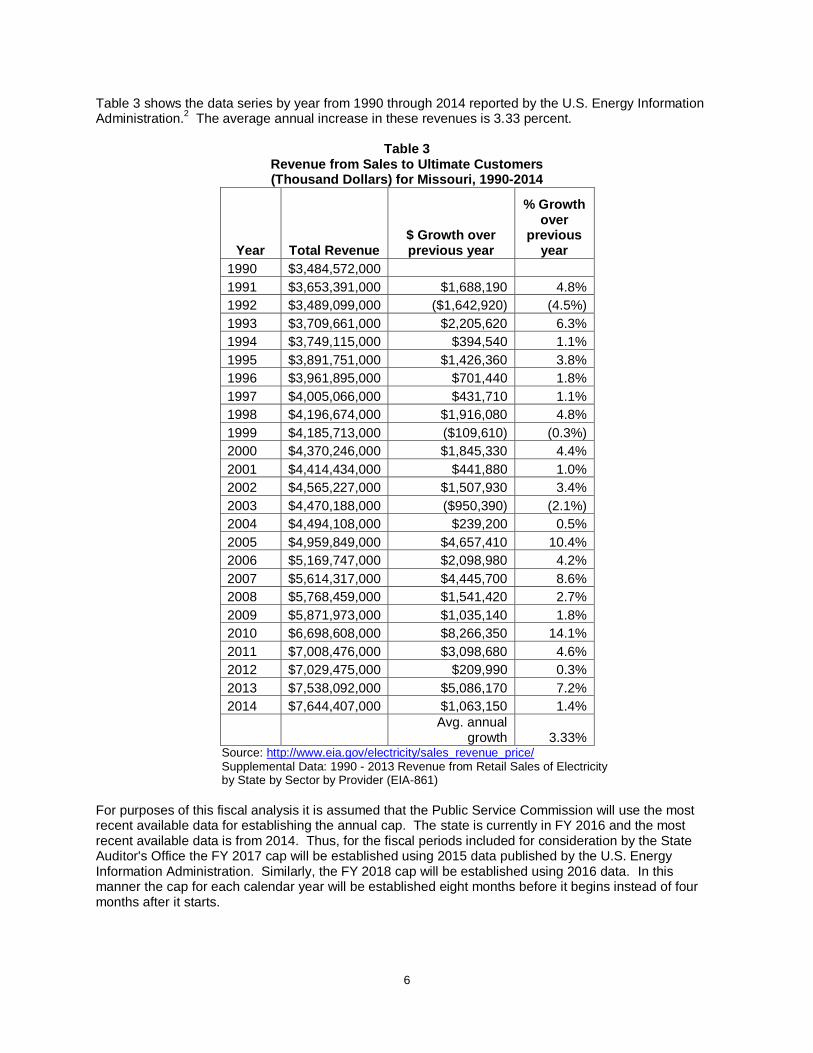
Table 3 shows the data series by year from 1990 through 2014 reported by the U.S. Energy Information Administration.
2 The average annual increase in these revenues is 3.33 percent.
Table 3
Revenue from Sales to Ultimate Customers (Thousand Dollars) for Missouri, 1990-2014
Year Total Revenue $ Growth over previous year
% Growth over
previous year
1990 $3,484,572,000
1991 $3,653,391,000 $1,688,190 4.8%
1992 $3,489,099,000 ($1,642,920) (4.5%)
1993 $3,709,661,000 $2,205,620 6.3%
1994 $3,749,115,000 $394,540 1.1%
1995 $3,891,751,000 $1,426,360 3.8%
1996 $3,961,895,000 $701,440 1.8%
1997 $4,005,066,000 $431,710 1.1%
1998 $4,196,674,000 $1,916,080 4.8%
1999 $4,185,713,000 ($109,610) (0.3%)
2000 $4,370,246,000 $1,845,330 4.4%
2001 $4,414,434,000 $441,880 1.0%
2002 $4,565,227,000 $1,507,930 3.4%
2003 $4,470,188,000 ($950,390) (2.1%)
2004 $4,494,108,000 $239,200 0.5%
2005 $4,959,849,000 $4,657,410 10.4%
2006 $5,169,747,000 $2,098,980 4.2%
2007 $5,614,317,000 $4,445,700 8.6%
2008 $5,768,459,000 $1,541,420 2.7%
2009 $5,871,973,000 $1,035,140 1.8%
2010 $6,698,608,000 $8,266,350 14.1%
2011 $7,008,476,000 $3,098,680 4.6%
2012 $7,029,475,000 $209,990 0.3%
2013 $7,538,092,000 $5,086,170 7.2%
2014 $7,644,407,000 $1,063,150 1.4%
Avg. annual
growth 3.33% Source: http://www.eia.gov/electricity/sales_revenue_price/ Supplemental Data: 1990 - 2013 Revenue from Retail Sales of Electricity by State by Sector by Provider (EIA-861)
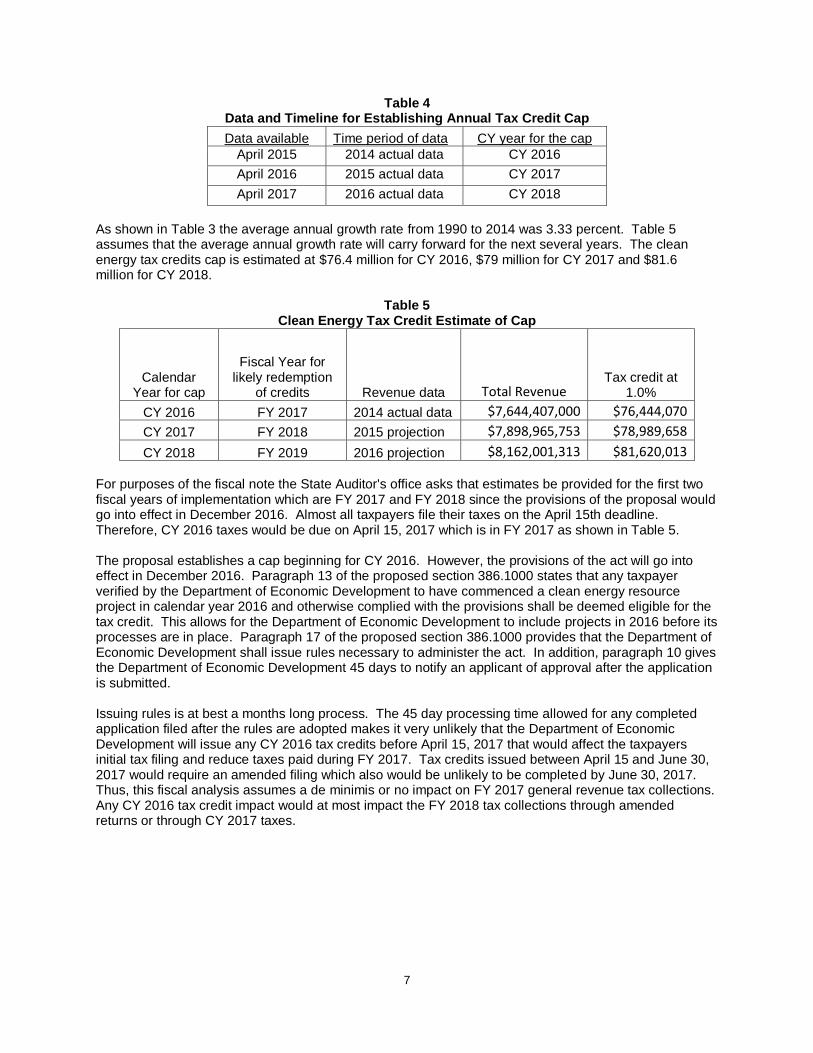
For purposes of this fiscal analysis it is assumed that the Public Service Commission will use the most recent available data for establishing the annual cap. The state is currently in FY 2016 and the most recent available data is from 2014. Thus, for the fiscal periods included for consideration by the State Auditor's Office the FY 2017 cap will be established using 2015 data published by the U.S. Energy Information Administration. Similarly, the FY 2018 cap will be established using 2016 data. In this manner the cap for each calendar year will be established eight months before it begins instead of four months after it starts.
7
Table 4 Data and Timeline for Establishing Annual Tax Credit Cap
Data available Time period of data CY year for the cap
April 2015 2014 actual data CY 2016
April 2016 2015 actual data CY 2017
April 2017 2016 actual data CY 2018
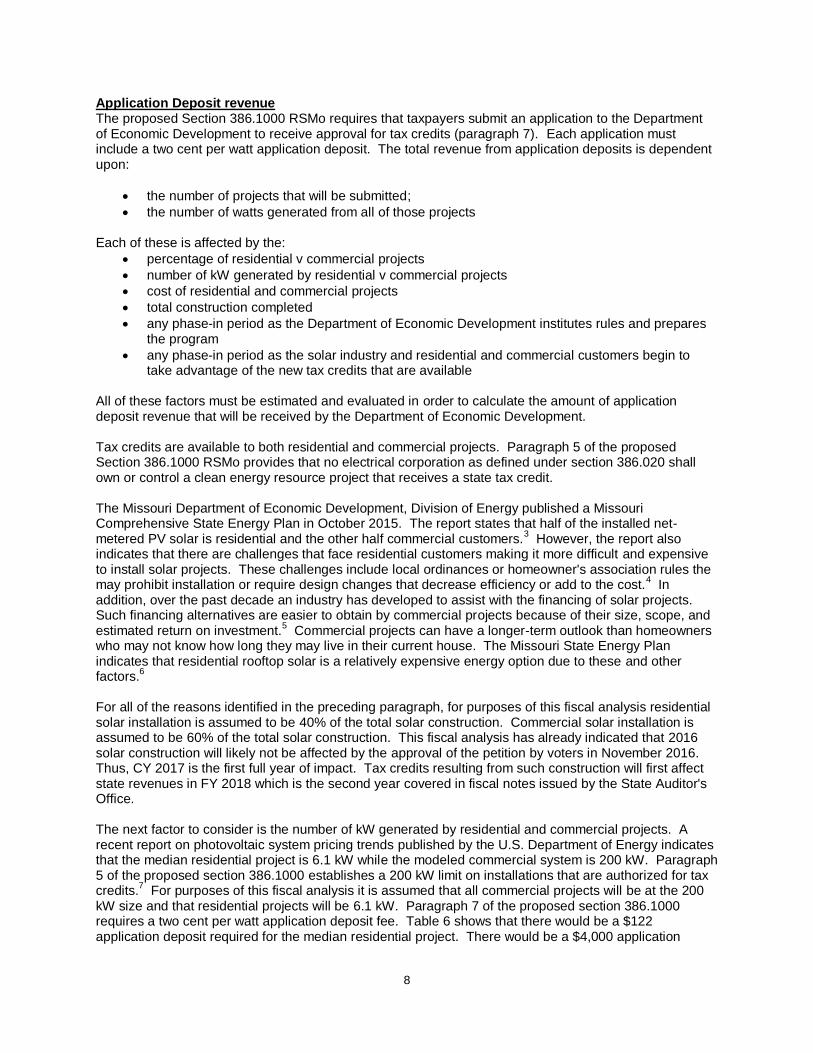
As shown in Table 3 the average annual growth rate from 1990 to 2014 was 3.33 percent. Table 5 assumes that the average annual growth rate will carry forward for the next several years. The clean energy tax credits cap is estimated at $76.4 million for CY 2016, $79 million for CY 2017 and $81.6 million for CY 2018.
Table 5 Clean Energy Tax Credit Estimate of Cap
Calendar Year for cap
Fiscal Year for likely redemption
of credits Revenue data Total Revenue Tax credit at
1.0%
CY 2016 FY 2017 2014 actual data $7,644,407,000 $76,444,070
CY 2017 FY 2018 2015 projection $7,898,965,753 $78,989,658
CY 2018 FY 2019 2016 projection $8,162,001,313 $81,620,013 For purposes of the fiscal note the State Auditor's office asks that estimates be provided for the first two fiscal years of implementation which are FY 2017 and FY 2018 since the provisions of the proposal would go into effect in December 2016. Almost all taxpayers file their taxes on the April 15th deadline. Therefore, CY 2016 taxes would be due on April 15, 2017 which is in FY 2017 as shown in Table 5. The proposal establishes a cap beginning for CY 2016. However, the provisions of the act will go into effect in December 2016. Paragraph 13 of the proposed section 386.1000 states that any taxpayer verified by the Department of Economic Development to have commenced a clean energy resource project in calendar year 2016 and otherwise complied with the provisions shall be deemed eligible for the tax credit. This allows for the Department of Economic Development to include projects in 2016 before its processes are in place. Paragraph 17 of the proposed section 386.1000 provides that the Department of Economic Development shall issue rules necessary to administer the act. In addition, paragraph 10 gives the Department of Economic Development 45 days to notify an applicant of approval after the application is submitted. Issuing rules is at best a months long process. The 45 day processing time allowed for any completed application filed after the rules are adopted makes it very unlikely that the Department of Economic Development will issue any CY 2016 tax credits before April 15, 2017 that would affect the taxpayers initial tax filing and reduce taxes paid during FY 2017. Tax credits issued between April 15 and June 30, 2017 would require an amended filing which also would be unlikely to be completed by June 30, 2017. Thus, this fiscal analysis assumes a de minimis or no impact on FY 2017 general revenue tax collections. Any CY 2016 tax credit impact would at most impact the FY 2018 tax collections through amended returns or through CY 2017 taxes.
8
Application Deposit revenue The proposed Section 386.1000 RSMo requires that taxpayers submit an application to the Department of Economic Development to receive approval for tax credits (paragraph 7). Each application must include a two cent per watt application deposit. The total revenue from application deposits is dependent upon:
the number of projects that will be submitted;
the number of watts generated from all of those projects Each of these is affected by the:
percentage of residential v commercial projects
number of kW generated by residential v commercial projects
cost of residential and commercial projects
total construction completed
any phase-in period as the Department of Economic Development institutes rules and prepares the program
any phase-in period as the solar industry and residential and commercial customers begin to take advantage of the new tax credits that are available
All of these factors must be estimated and evaluated in order to calculate the amount of application deposit revenue that will be received by the Department of Economic Development. Tax credits are available to both residential and commercial projects. Paragraph 5 of the proposed Section 386.1000 RSMo provides that no electrical corporation as defined under section 386.020 shall own or control a clean energy resource project that receives a state tax credit. The Missouri Department of Economic Development, Division of Energy published a Missouri Comprehensive State Energy Plan in October 2015. The report states that half of the installed net-metered PV solar is residential and the other half commercial customers.
3 However, the report also
indicates that there are challenges that face residential customers making it more difficult and expensive to install solar projects. These challenges include local ordinances or homeowner's association rules the may prohibit installation or require design changes that decrease efficiency or add to the cost.
4 In
addition, over the past decade an industry has developed to assist with the financing of solar projects. Such financing alternatives are easier to obtain by commercial projects because of their size, scope, and estimated return on investment.
5 Commercial projects can have a longer-term outlook than homeowners
who may not know how long they may live in their current house. The Missouri State Energy Plan indicates that residential rooftop solar is a relatively expensive energy option due to these and other factors.
6
For all of the reasons identified in the preceding paragraph, for purposes of this fiscal analysis residential solar installation is assumed to be 40% of the total solar construction. Commercial solar installation is assumed to be 60% of the total solar construction. This fiscal analysis has already indicated that 2016 solar construction will likely not be affected by the approval of the petition by voters in November 2016. Thus, CY 2017 is the first full year of impact. Tax credits resulting from such construction will first affect state revenues in FY 2018 which is the second year covered in fiscal notes issued by the State Auditor's Office. The next factor to consider is the number of kW generated by residential and commercial projects. A recent report on photovoltaic system pricing trends published by the U.S. Department of Energy indicates that the median residential project is 6.1 kW while the modeled commercial system is 200 kW. Paragraph 5 of the proposed section 386.1000 establishes a 200 kW limit on installations that are authorized for tax credits.
7 For purposes of this fiscal analysis it is assumed that all commercial projects will be at the 200
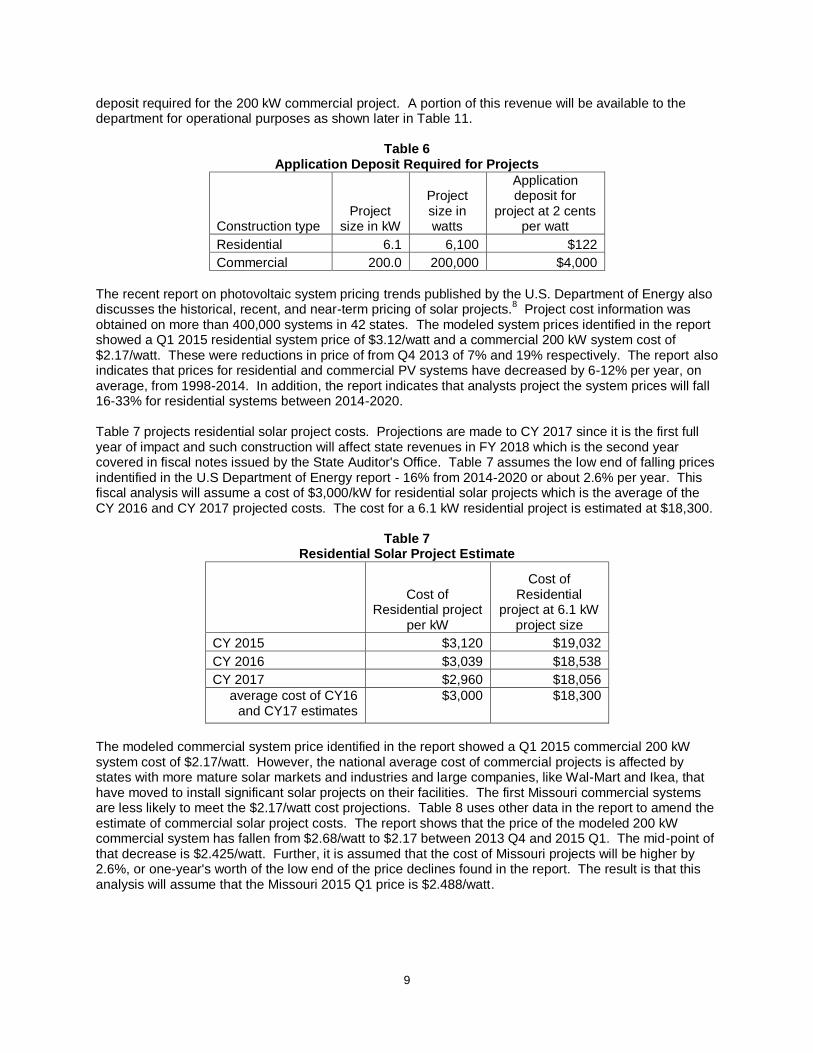
kW size and that residential projects will be 6.1 kW. Paragraph 7 of the proposed section 386.1000 requires a two cent per watt application deposit fee. Table 6 shows that there would be a $122 application deposit required for the median residential project. There would be a $4,000 application
9
deposit required for the 200 kW commercial project. A portion of this revenue will be available to the department for operational purposes as shown later in Table 11.
Table 6 Application Deposit Required for Projects
Construction type Project
size in kW
Project size in watts
Application deposit for
project at 2 cents per watt
Residential 6.1 6,100 $122
Commercial 200.0 200,000 $4,000
The recent report on photovoltaic system pricing trends published by the U.S. Department of Energy also discusses the historical, recent, and near-term pricing of solar projects.
8 Project cost information was
obtained on more than 400,000 systems in 42 states. The modeled system prices identified in the report showed a Q1 2015 residential system price of $3.12/watt and a commercial 200 kW system cost of $2.17/watt. These were reductions in price of from Q4 2013 of 7% and 19% respectively. The report also indicates that prices for residential and commercial PV systems have decreased by 6-12% per year, on average, from 1998-2014. In addition, the report indicates that analysts project the system prices will fall 16-33% for residential systems between 2014-2020. Table 7 projects residential solar project costs. Projections are made to CY 2017 since it is the first full year of impact and such construction will affect state revenues in FY 2018 which is the second year covered in fiscal notes issued by the State Auditor's Office. Table 7 assumes the low end of falling prices indentified in the U.S Department of Energy report - 16% from 2014-2020 or about 2.6% per year. This fiscal analysis will assume a cost of $3,000/kW for residential solar projects which is the average of the CY 2016 and CY 2017 projected costs. The cost for a 6.1 kW residential project is estimated at $18,300.
Table 7 Residential Solar Project Estimate
Cost of Residential project
per kW
Cost of Residential
project at 6.1 kW project size
CY 2015 $3,120 $19,032
CY 2016 $3,039 $18,538
CY 2017 $2,960 $18,056
average cost of CY16 and CY17 estimates
$3,000 $18,300
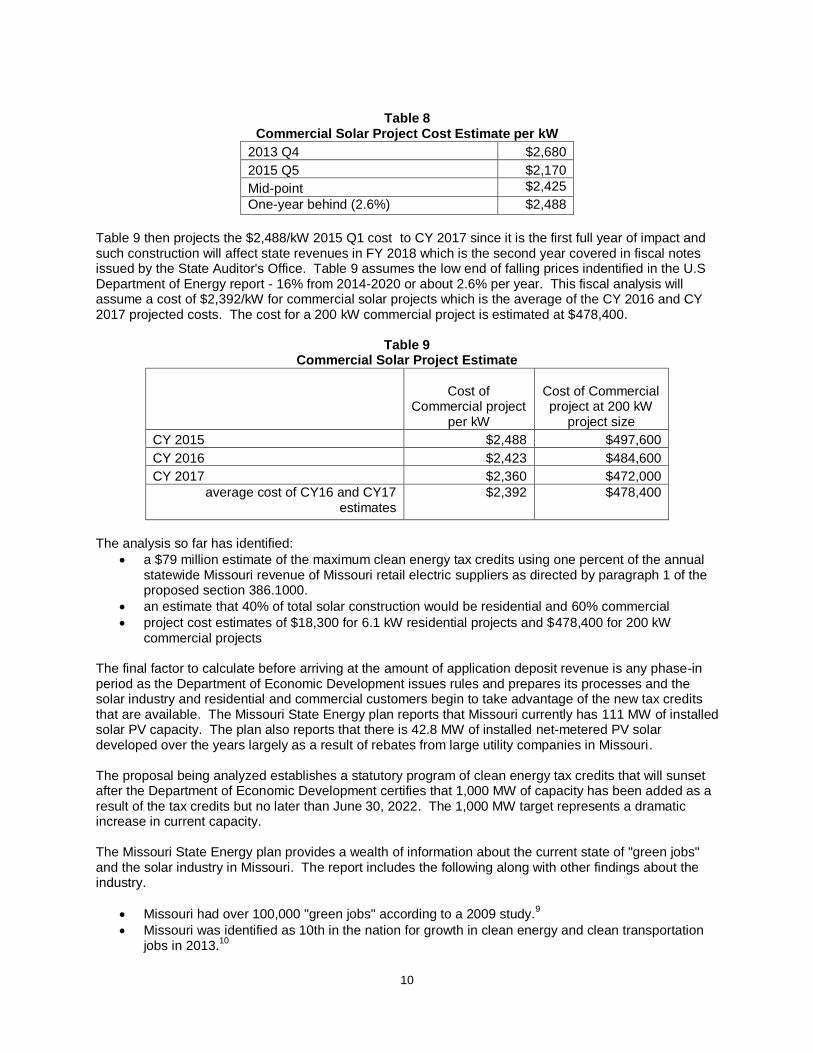
The modeled commercial system price identified in the report showed a Q1 2015 commercial 200 kW system cost of $2.17/watt. However, the national average cost of commercial projects is affected by states with more mature solar markets and industries and large companies, like Wal-Mart and Ikea, that have moved to install significant solar projects on their facilities. The first Missouri commercial systems are less likely to meet the $2.17/watt cost projections. Table 8 uses other data in the report to amend the estimate of commercial solar project costs. The report shows that the price of the modeled 200 kW commercial system has fallen from $2.68/watt to $2.17 between 2013 Q4 and 2015 Q1. The mid-point of that decrease is $2.425/watt. Further, it is assumed that the cost of Missouri projects will be higher by 2.6%, or one-year's worth of the low end of the price declines found in the report. The result is that this analysis will assume that the Missouri 2015 Q1 price is $2.488/watt.
10
Table 8
Commercial Solar Project Cost Estimate per kW
2013 Q4 $2,680
2015 Q5 $2,170
Mid-point $2,425
One-year behind (2.6%) $2,488
Table 9 then projects the $2,488/kW 2015 Q1 cost to CY 2017 since it is the first full year of impact and such construction will affect state revenues in FY 2018 which is the second year covered in fiscal notes issued by the State Auditor's Office. Table 9 assumes the low end of falling prices indentified in the U.S Department of Energy report - 16% from 2014-2020 or about 2.6% per year. This fiscal analysis will assume a cost of $2,392/kW for commercial solar projects which is the average of the CY 2016 and CY 2017 projected costs. The cost for a 200 kW commercial project is estimated at $478,400.
Table 9 Commercial Solar Project Estimate
Cost of Commercial project
per kW
Cost of Commercial project at 200 kW
project size
CY 2015 $2,488 $497,600
CY 2016 $2,423 $484,600
CY 2017 $2,360 $472,000
average cost of CY16 and CY17 estimates
$2,392 $478,400
The analysis so far has identified:
a $79 million estimate of the maximum clean energy tax credits using one percent of the annual statewide Missouri revenue of Missouri retail electric suppliers as directed by paragraph 1 of the proposed section 386.1000.
an estimate that 40% of total solar construction would be residential and 60% commercial
project cost estimates of $18,300 for 6.1 kW residential projects and $478,400 for 200 kW commercial projects
The final factor to calculate before arriving at the amount of application deposit revenue is any phase-in period as the Department of Economic Development issues rules and prepares its processes and the solar industry and residential and commercial customers begin to take advantage of the new tax credits that are available. The Missouri State Energy plan reports that Missouri currently has 111 MW of installed solar PV capacity. The plan also reports that there is 42.8 MW of installed net-metered PV solar developed over the years largely as a result of rebates from large utility companies in Missouri. The proposal being analyzed establishes a statutory program of clean energy tax credits that will sunset after the Department of Economic Development certifies that 1,000 MW of capacity has been added as a result of the tax credits but no later than June 30, 2022. The 1,000 MW target represents a dramatic increase in current capacity. The Missouri State Energy plan provides a wealth of information about the current state of "green jobs" and the solar industry in Missouri. The report includes the following along with other findings about the industry.
Missouri had over 100,000 "green jobs" according to a 2009 study.9
Missouri was identified as 10th in the nation for growth in clean energy and clean transportation jobs in 2013.
10
11
$187 million was invested by Missouri's solar industry in 2014 to install solar photovoltaic systems for residential, commercial, and utility use.
11
There are more than 97 solar companies at work throughout the supply chain in Missouri, employing 2,500 people including manufacturers, contractors, installers, project developers, distributors.
12
Missouri could create 8,500 new jobs to design, install, and operate energy efficiency measures by 2025 according to a 2011 study.
13
In 2010 Missouri ranked 6th in the nation in photovoltaic jobs.14
The clean energy tax credit does not sunset until the 1,000 MW target of additional capacity is met but no later than June 30, 2022. The size and the long-term nature of the 1,000 MW target should encourage the development of the Missouri solar industry even after it sunsets. It should also result in long-term planning and the build out of a native Missouri solar industry. The target also provides an incentive for the industry to meet the growth potential described in the Missouri State Energy Plan. In the long-term the impact of the 1,000 MW target will grow and build the industry. In addition, investment in solar will allow longer term benefits in reduced fuel usage, cleaner air, better health and the resulting lower costs among other things. The Missouri State Energy Plan identifies the public health impacts of various energy sources with clean energy sources providing significant positive benefits over other sources.
15 A 2013 study of Hawaii's solar tax credit program found that the State recovered the full
cost of the tax credit in 9 to 11 years - a rate of return on its investment ranging from 8.9% to 10.3%.16
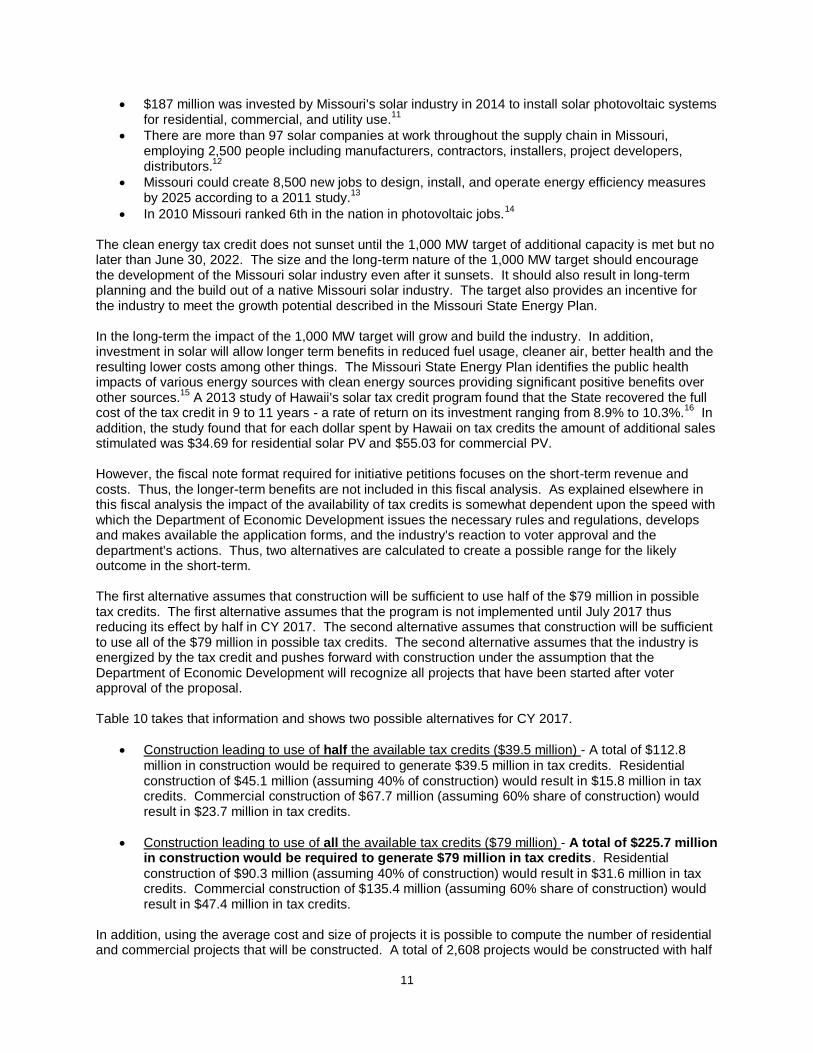
In addition, the study found that for each dollar spent by Hawaii on tax credits the amount of additional sales stimulated was $34.69 for residential solar PV and $55.03 for commercial PV. However, the fiscal note format required for initiative petitions focuses on the short-term revenue and costs. Thus, the longer-term benefits are not included in this fiscal analysis. As explained elsewhere in this fiscal analysis the impact of the availability of tax credits is somewhat dependent upon the speed with which the Department of Economic Development issues the necessary rules and regulations, develops and makes available the application forms, and the industry's reaction to voter approval and the department's actions. Thus, two alternatives are calculated to create a possible range for the likely outcome in the short-term. The first alternative assumes that construction will be sufficient to use half of the $79 million in possible tax credits. The first alternative assumes that the program is not implemented until July 2017 thus reducing its effect by half in CY 2017. The second alternative assumes that construction will be sufficient to use all of the $79 million in possible tax credits. The second alternative assumes that the industry is energized by the tax credit and pushes forward with construction under the assumption that the Department of Economic Development will recognize all projects that have been started after voter approval of the proposal. Table 10 takes that information and shows two possible alternatives for CY 2017.
Construction leading to use of half the available tax credits ($39.5 million) - A total of $112.8
million in construction would be required to generate $39.5 million in tax credits. Residential construction of $45.1 million (assuming 40% of construction) would result in $15.8 million in tax credits. Commercial construction of $67.7 million (assuming 60% share of construction) would result in $23.7 million in tax credits.
Construction leading to use of all the available tax credits ($79 million) - A total of $225.7 million in construction would be required to generate $79 million in tax credits. Residential
construction of $90.3 million (assuming 40% of construction) would result in $31.6 million in tax credits. Commercial construction of $135.4 million (assuming 60% share of construction) would result in $47.4 million in tax credits.
In addition, using the average cost and size of projects it is possible to compute the number of residential and commercial projects that will be constructed. A total of 2,608 projects would be constructed with half
12
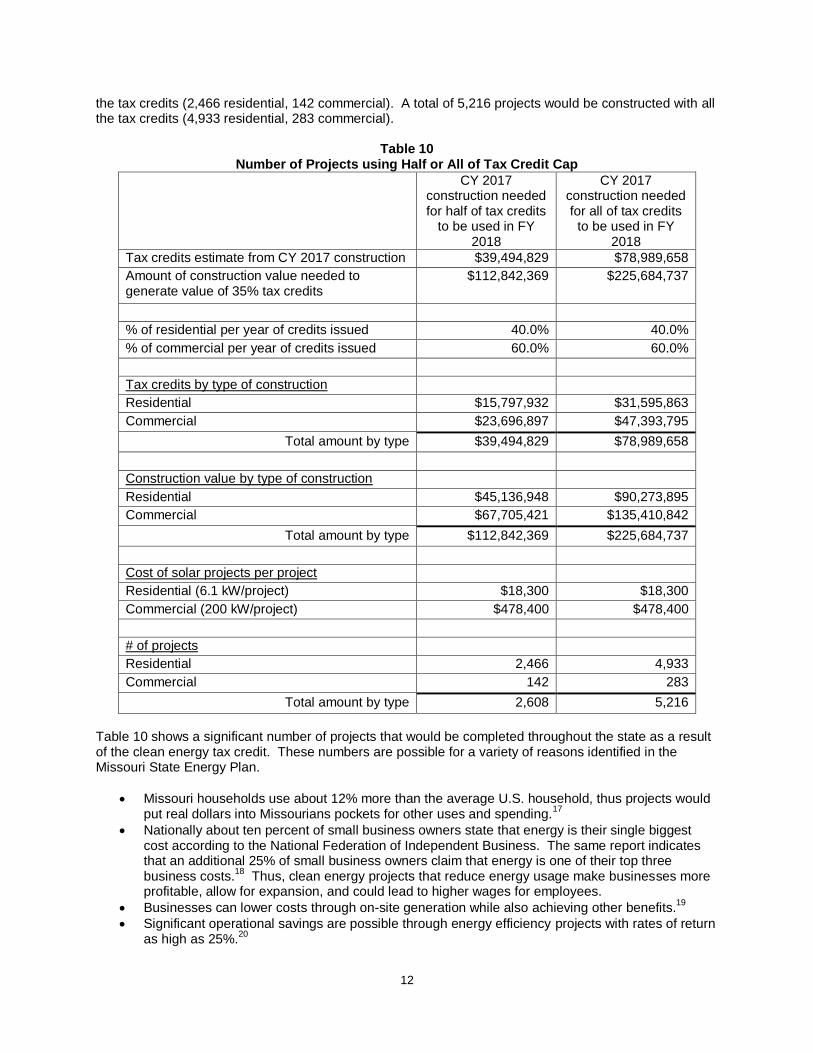
the tax credits (2,466 residential, 142 commercial). A total of 5,216 projects would be constructed with all the tax credits (4,933 residential, 283 commercial).
Table 10
Number of Projects using Half or All of Tax Credit Cap
CY 2017 construction needed for half of tax credits
to be used in FY 2018
CY 2017 construction needed for all of tax credits
to be used in FY 2018
Tax credits estimate from CY 2017 construction $39,494,829 $78,989,658
Amount of construction value needed to generate value of 35% tax credits
$112,842,369 $225,684,737
% of residential per year of credits issued 40.0% 40.0%
% of commercial per year of credits issued 60.0% 60.0%
Tax credits by type of construction
Residential $15,797,932 $31,595,863
Commercial $23,696,897 $47,393,795
Total amount by type $39,494,829 $78,989,658
Construction value by type of construction
Residential $45,136,948 $90,273,895
Commercial $67,705,421 $135,410,842
Total amount by type $112,842,369 $225,684,737
Cost of solar projects per project
Residential (6.1 kW/project) $18,300 $18,300
Commercial (200 kW/project) $478,400 $478,400
# of projects
Residential 2,466 4,933
Commercial 142 283
Total amount by type 2,608 5,216
Table 10 shows a significant number of projects that would be completed throughout the state as a result of the clean energy tax credit. These numbers are possible for a variety of reasons identified in the Missouri State Energy Plan.
Missouri households use about 12% more than the average U.S. household, thus projects would put real dollars into Missourians pockets for other uses and spending.
17
Nationally about ten percent of small business owners state that energy is their single biggest cost according to the National Federation of Independent Business. The same report indicates that an additional 25% of small business owners claim that energy is one of their top three business costs.
18 Thus, clean energy projects that reduce energy usage make businesses more
profitable, allow for expansion, and could lead to higher wages for employees.
Businesses can lower costs through on-site generation while also achieving other benefits.19
Significant operational savings are possible through energy efficiency projects with rates of return as high as 25%.
20
13
A wealth of financing alternatives now exist for clean energy projects.21
"Approximately 60% of the largest U.S. businesses have set public climate and energy goals to increase their use of renewable energy."
22
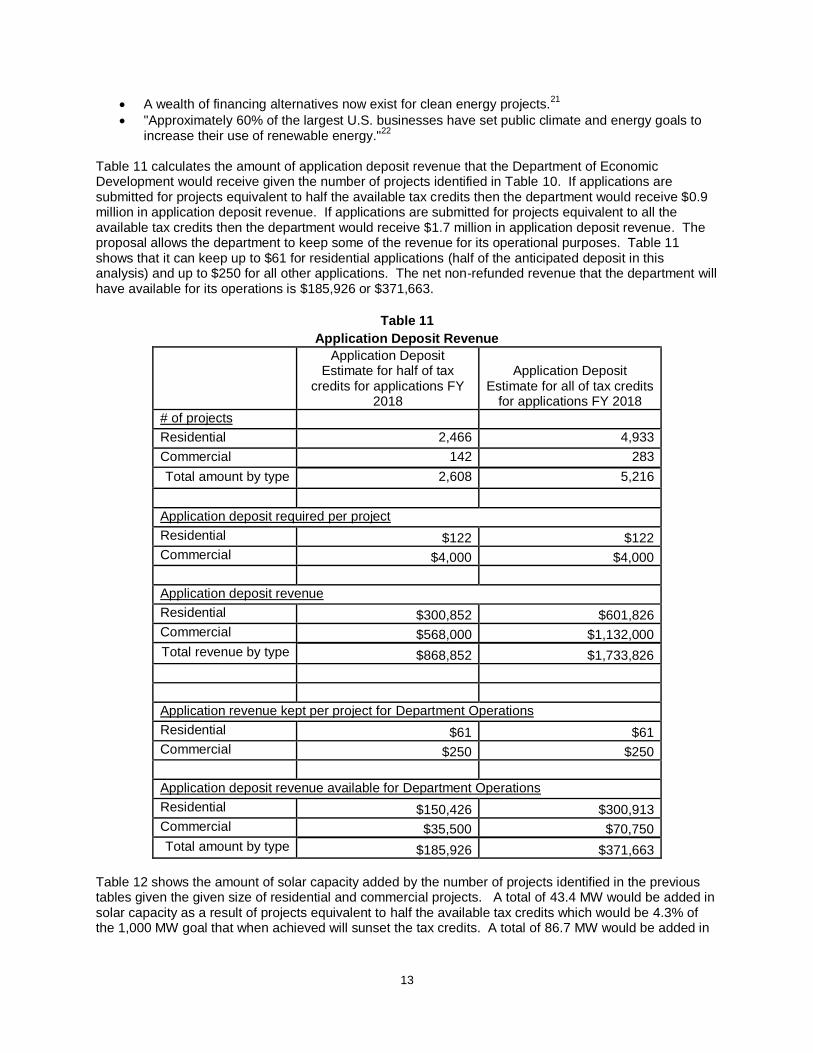
Table 11 calculates the amount of application deposit revenue that the Department of Economic Development would receive given the number of projects identified in Table 10. If applications are submitted for projects equivalent to half the available tax credits then the department would receive $0.9 million in application deposit revenue. If applications are submitted for projects equivalent to all the available tax credits then the department would receive $1.7 million in application deposit revenue. The proposal allows the department to keep some of the revenue for its operational purposes. Table 11 shows that it can keep up to $61 for residential applications (half of the anticipated deposit in this analysis) and up to $250 for all other applications. The net non-refunded revenue that the department will have available for its operations is $185,926 or $371,663.
Table 11
Application Deposit Revenue
Application Deposit Estimate for half of tax
credits for applications FY 2018
Application Deposit Estimate for all of tax credits
for applications FY 2018
# of projects
Residential 2,466 4,933
Commercial 142 283
Total amount by type 2,608 5,216
Application deposit required per project
Residential $122 $122
Commercial $4,000 $4,000
Application deposit revenue
Residential $300,852 $601,826
Commercial $568,000 $1,132,000
Total revenue by type $868,852 $1,733,826
Application revenue kept per project for Department Operations
Residential $61 $61
Commercial $250 $250
Application deposit revenue available for Department Operations
Residential $150,426 $300,913
Commercial $35,500 $70,750
Total amount by type $185,926 $371,663
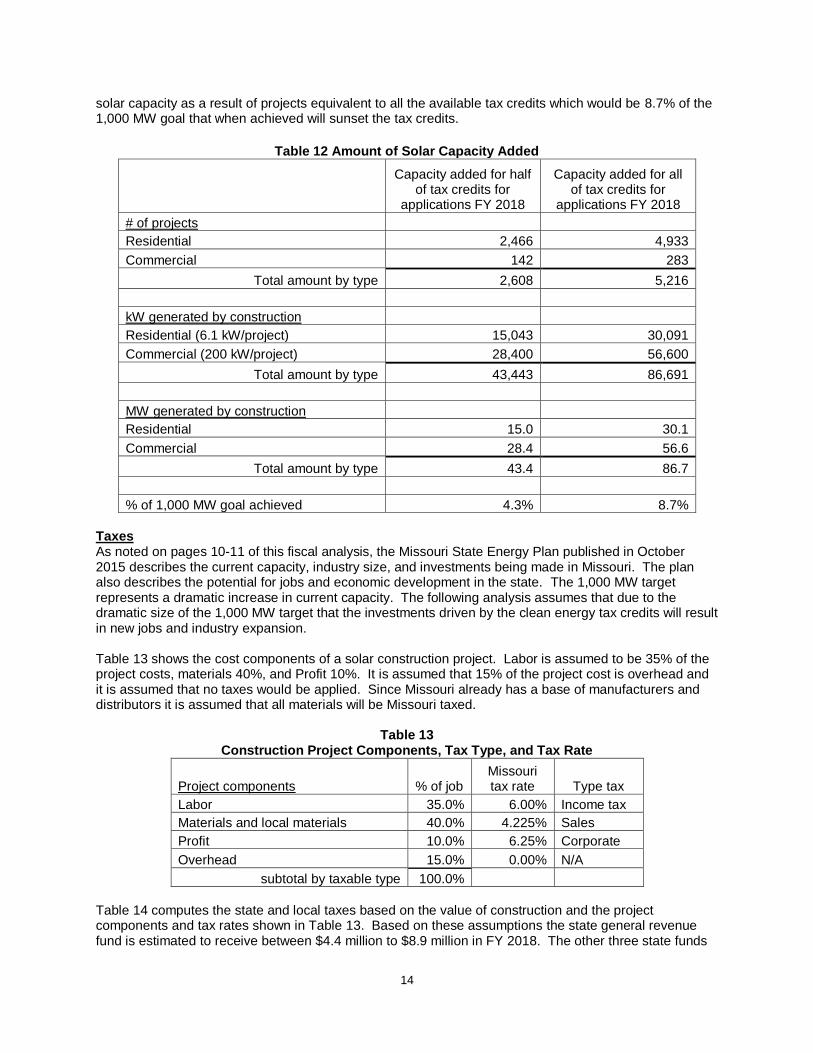
Table 12 shows the amount of solar capacity added by the number of projects identified in the previous tables given the given size of residential and commercial projects. A total of 43.4 MW would be added in solar capacity as a result of projects equivalent to half the available tax credits which would be 4.3% of the 1,000 MW goal that when achieved will sunset the tax credits. A total of 86.7 MW would be added in
14
solar capacity as a result of projects equivalent to all the available tax credits which would be 8.7% of the 1,000 MW goal that when achieved will sunset the tax credits.
Table 12 Amount of Solar Capacity Added
Capacity added for half of tax credits for
applications FY 2018
Capacity added for all of tax credits for
applications FY 2018
# of projects
Residential 2,466 4,933
Commercial 142 283
Total amount by type 2,608 5,216
kW generated by construction
Residential (6.1 kW/project) 15,043 30,091
Commercial (200 kW/project) 28,400 56,600
Total amount by type 43,443 86,691
MW generated by construction
Residential 15.0 30.1
Commercial 28.4 56.6
Total amount by type 43.4 86.7
% of 1,000 MW goal achieved 4.3% 8.7%
Taxes As noted on pages 10-11 of this fiscal analysis, the Missouri State Energy Plan published in October 2015 describes the current capacity, industry size, and investments being made in Missouri. The plan also describes the potential for jobs and economic development in the state. The 1,000 MW target represents a dramatic increase in current capacity. The following analysis assumes that due to the dramatic size of the 1,000 MW target that the investments driven by the clean energy tax credits will result in new jobs and industry expansion. Table 13 shows the cost components of a solar construction project. Labor is assumed to be 35% of the project costs, materials 40%, and Profit 10%. It is assumed that 15% of the project cost is overhead and it is assumed that no taxes would be applied. Since Missouri already has a base of manufacturers and distributors it is assumed that all materials will be Missouri taxed.
Table 13 Construction Project Components, Tax Type, and Tax Rate
Project components % of job Missouri tax rate Type tax
Labor 35.0% 6.00% Income tax
Materials and local materials 40.0% 4.225% Sales
Profit 10.0% 6.25% Corporate
Overhead 15.0% 0.00% N/A
subtotal by taxable type 100.0%
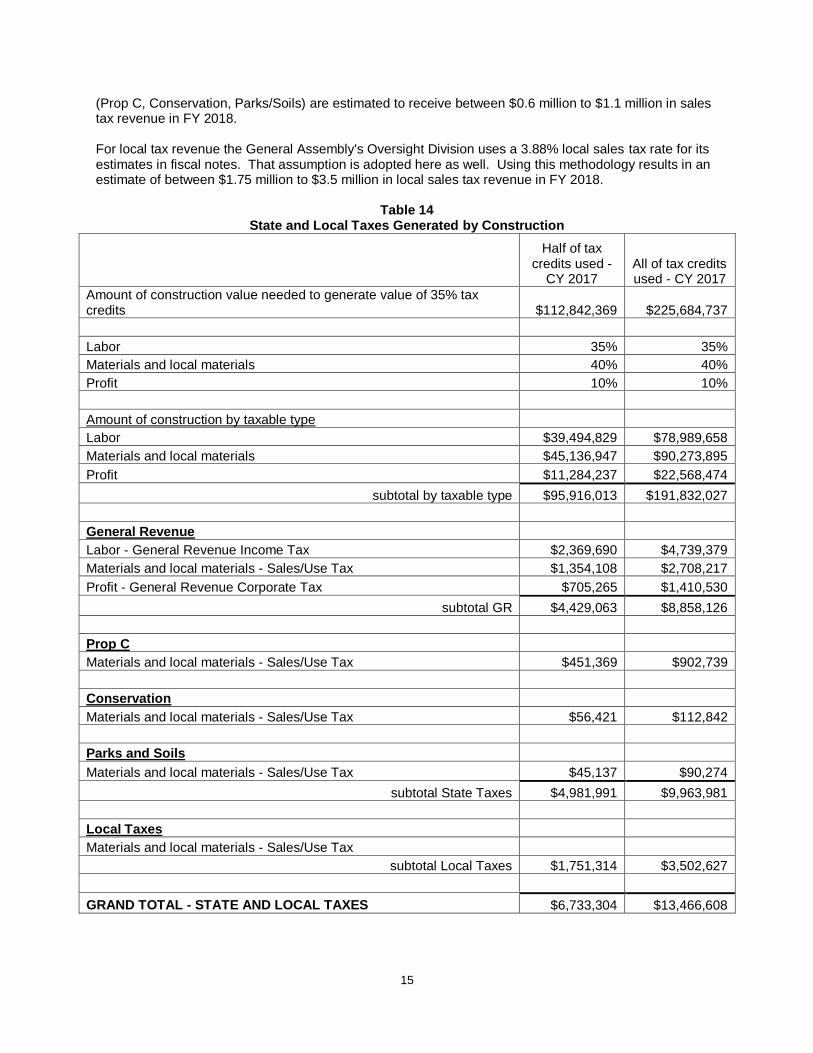
Table 14 computes the state and local taxes based on the value of construction and the project components and tax rates shown in Table 13. Based on these assumptions the state general revenue fund is estimated to receive between $4.4 million to $8.9 million in FY 2018. The other three state funds
15
(Prop C, Conservation, Parks/Soils) are estimated to receive between $0.6 million to $1.1 million in sales tax revenue in FY 2018. For local tax revenue the General Assembly's Oversight Division uses a 3.88% local sales tax rate for its estimates in fiscal notes. That assumption is adopted here as well. Using this methodology results in an estimate of between $1.75 million to $3.5 million in local sales tax revenue in FY 2018.
Table 14 State and Local Taxes Generated by Construction
Half of tax credits used -
CY 2017 All of tax credits used - CY 2017
Amount of construction value needed to generate value of 35% tax credits $112,842,369 $225,684,737
Labor 35% 35%
Materials and local materials 40% 40%
Profit 10% 10%
Amount of construction by taxable type
Labor $39,494,829 $78,989,658
Materials and local materials $45,136,947 $90,273,895
Profit $11,284,237 $22,568,474
subtotal by taxable type $95,916,013 $191,832,027
General Revenue
Labor - General Revenue Income Tax $2,369,690 $4,739,379
Materials and local materials - Sales/Use Tax $1,354,108 $2,708,217
Profit - General Revenue Corporate Tax $705,265 $1,410,530
subtotal GR $4,429,063 $8,858,126
Prop C
Materials and local materials - Sales/Use Tax $451,369 $902,739
Conservation
Materials and local materials - Sales/Use Tax $56,421 $112,842
Parks and Soils
Materials and local materials - Sales/Use Tax $45,137 $90,274
subtotal State Taxes $4,981,991 $9,963,981
Local Taxes
Materials and local materials - Sales/Use Tax
subtotal Local Taxes $1,751,314 $3,502,627
GRAND TOTAL - STATE AND LOCAL TAXES $6,733,304 $13,466,608
16
The taxes generated from the construction activity shown in Table 14 likely underestimate the state revenue that will be generated by the construction of clean energy projects even within the short time period allowed in the fiscal note. As noted earlier there are multiplier effects that ripple through the economy. The Department of Economic Development through MERIC has a sophisticated model that it uses to evaluate the impact of tax credits and other business investments made in the State of Missouri. Using the information in this fiscal analysis MERIC should be able to provide supplementary information regarding the extra economic activity and increased revenues. Similarly, generating additional clean energy within the State of Missouri will result in a decrease in the importation of power and energy producing raw materials from other states. Such money leakage from the state, businesses and citizens, decreases the amount of purchasing could be done for other purposes such as increased jobs within the state and thus the tax revenues that would be generated. For example, the Missouri State Energy Plan notes that Missouri is the sixth largest consumer of coal in the country and 92.5% of the coal used in 2013 was imported from Wyoming.
23 The plan reports that the state sends
billions of dollars out of state for purchases of imported coal, natural gas, and transportation fuels.24
Community Solar Act - Applies to Versions 28, 30, 31, 32, 34, and 36
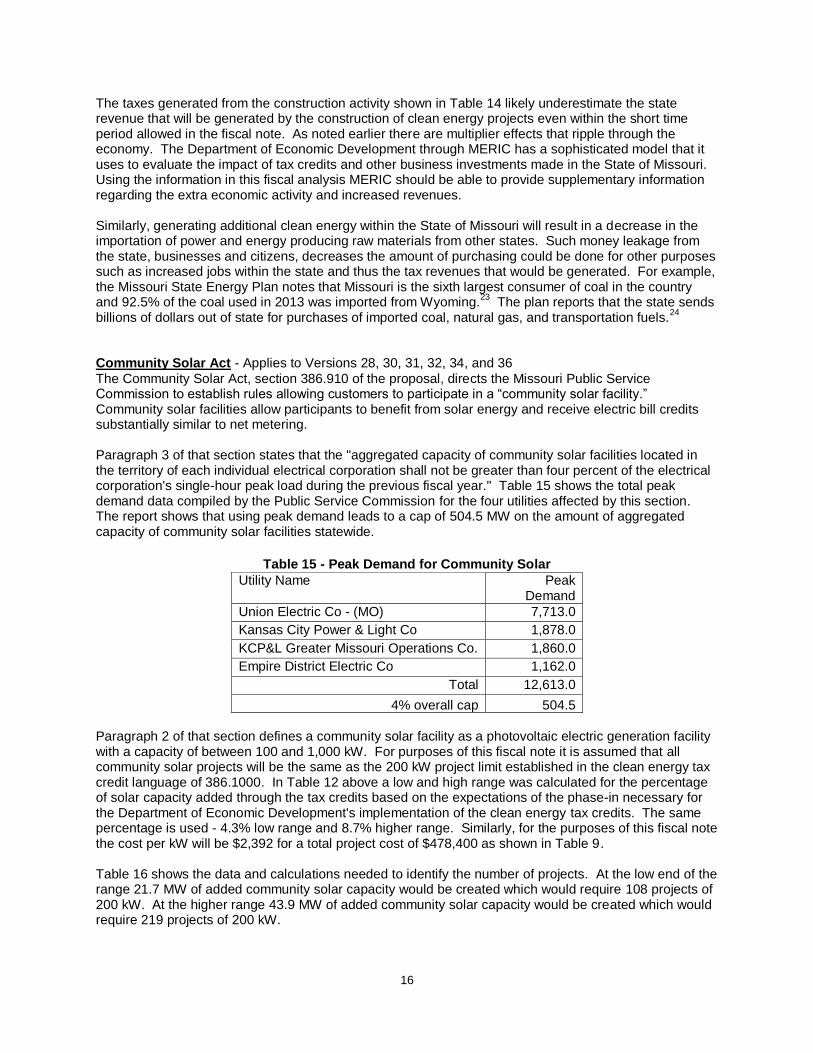
The Community Solar Act, section 386.910 of the proposal, directs the Missouri Public Service Commission to establish rules allowing customers to participate in a “community solar facility.” Community solar facilities allow participants to benefit from solar energy and receive electric bill credits substantially similar to net metering. Paragraph 3 of that section states that the "aggregated capacity of community solar facilities located in the territory of each individual electrical corporation shall not be greater than four percent of the electrical corporation's single-hour peak load during the previous fiscal year." Table 15 shows the total peak demand data compiled by the Public Service Commission for the four utilities affected by this section. The report shows that using peak demand leads to a cap of 504.5 MW on the amount of aggregated capacity of community solar facilities statewide.
Table 15 - Peak Demand for Community Solar
Utility Name Peak Demand
Union Electric Co - (MO) 7,713.0
Kansas City Power & Light Co 1,878.0
KCP&L Greater Missouri Operations Co. 1,860.0
Empire District Electric Co 1,162.0
Total 12,613.0
4% overall cap 504.5
Paragraph 2 of that section defines a community solar facility as a photovoltaic electric generation facility with a capacity of between 100 and 1,000 kW. For purposes of this fiscal note it is assumed that all community solar projects will be the same as the 200 kW project limit established in the clean energy tax credit language of 386.1000. In Table 12 above a low and high range was calculated for the percentage of solar capacity added through the tax credits based on the expectations of the phase-in necessary for the Department of Economic Development's implementation of the clean energy tax credits. The same percentage is used - 4.3% low range and 8.7% higher range. Similarly, for the purposes of this fiscal note the cost per kW will be $2,392 for a total project cost of $478,400 as shown in Table 9. Table 16 shows the data and calculations needed to identify the number of projects. At the low end of the range 21.7 MW of added community solar capacity would be created which would require 108 projects of 200 kW. At the higher range 43.9 MW of added community solar capacity would be created which would require 219 projects of 200 kW.
17
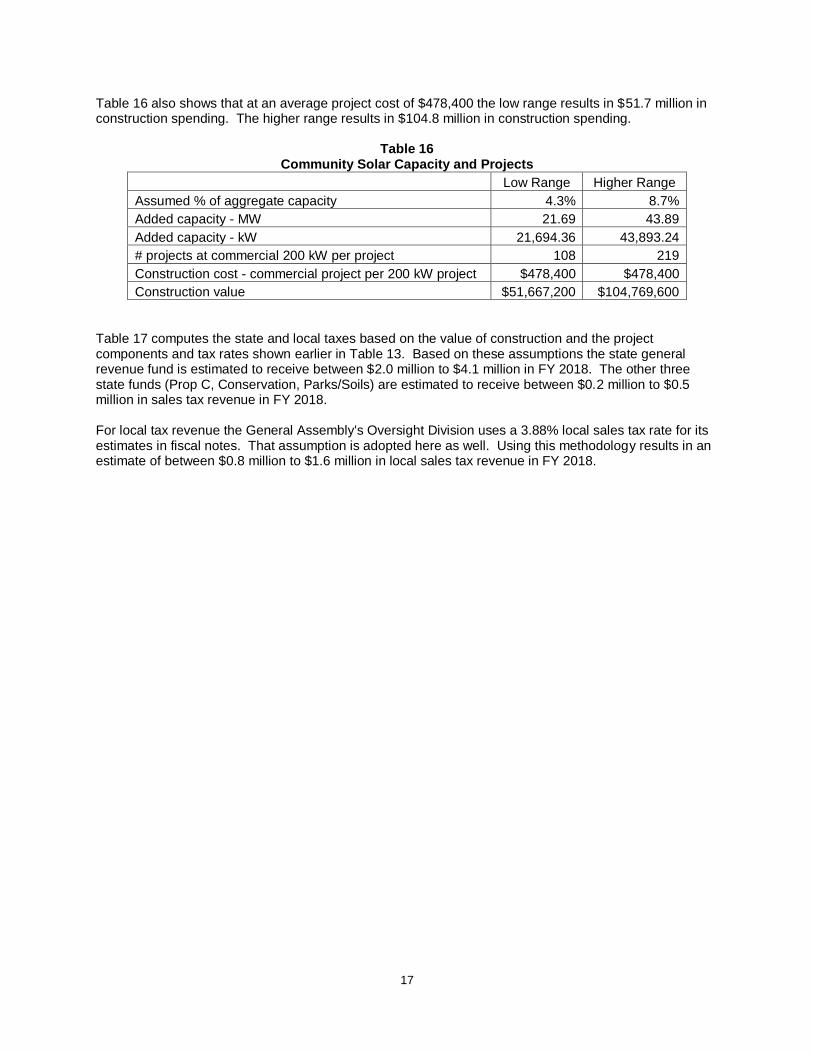
Table 16 also shows that at an average project cost of $478,400 the low range results in $51.7 million in construction spending. The higher range results in $104.8 million in construction spending.
Table 16 Community Solar Capacity and Projects
Low Range Higher Range
Assumed % of aggregate capacity 4.3% 8.7%
Added capacity - MW 21.69 43.89
Added capacity - kW 21,694.36 43,893.24
# projects at commercial 200 kW per project 108 219
Construction cost - commercial project per 200 kW project $478,400 $478,400
Construction value $51,667,200 $104,769,600
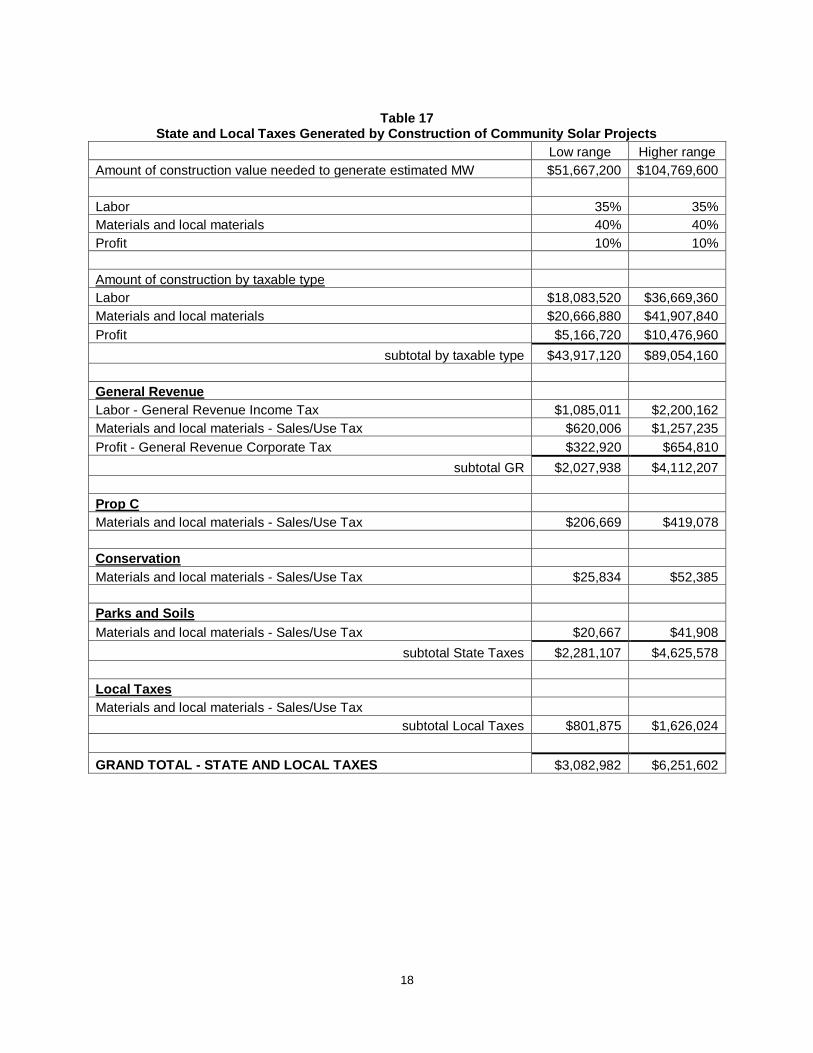
Table 17 computes the state and local taxes based on the value of construction and the project components and tax rates shown earlier in Table 13. Based on these assumptions the state general revenue fund is estimated to receive between $2.0 million to $4.1 million in FY 2018. The other three state funds (Prop C, Conservation, Parks/Soils) are estimated to receive between $0.2 million to $0.5 million in sales tax revenue in FY 2018. For local tax revenue the General Assembly's Oversight Division uses a 3.88% local sales tax rate for its estimates in fiscal notes. That assumption is adopted here as well. Using this methodology results in an estimate of between $0.8 million to $1.6 million in local sales tax revenue in FY 2018.
18
Table 17
State and Local Taxes Generated by Construction of Community Solar Projects
Low range Higher range
Amount of construction value needed to generate estimated MW $51,667,200 $104,769,600
Labor 35% 35%
Materials and local materials 40% 40%
Profit 10% 10%
Amount of construction by taxable type
Labor $18,083,520 $36,669,360
Materials and local materials $20,666,880 $41,907,840
Profit $5,166,720 $10,476,960
subtotal by taxable type $43,917,120 $89,054,160
General Revenue
Labor - General Revenue Income Tax $1,085,011 $2,200,162
Materials and local materials - Sales/Use Tax $620,006 $1,257,235
Profit - General Revenue Corporate Tax $322,920 $654,810
subtotal GR $2,027,938 $4,112,207
Prop C
Materials and local materials - Sales/Use Tax $206,669 $419,078
Conservation
Materials and local materials - Sales/Use Tax $25,834 $52,385
Parks and Soils
Materials and local materials - Sales/Use Tax $20,667 $41,908
subtotal State Taxes $2,281,107 $4,625,578
Local Taxes
Materials and local materials - Sales/Use Tax
subtotal Local Taxes $801,875 $1,626,024
GRAND TOTAL - STATE AND LOCAL TAXES $3,082,982 $6,251,602
19
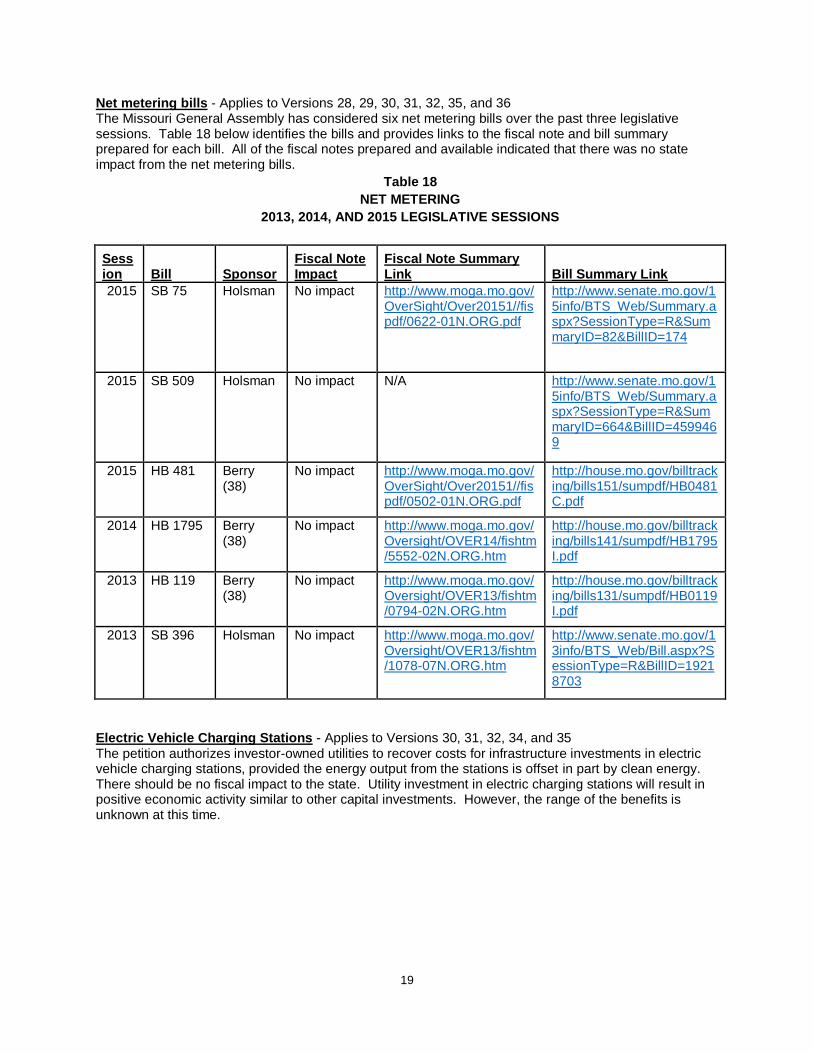
Net metering bills - Applies to Versions 28, 29, 30, 31, 32, 35, and 36 The Missouri General Assembly has considered six net metering bills over the past three legislative sessions. Table 18 below identifies the bills and provides links to the fiscal note and bill summary prepared for each bill. All of the fiscal notes prepared and available indicated that there was no state impact from the net metering bills.
Table 18
NET METERING
2013, 2014, AND 2015 LEGISLATIVE SESSIONS
Session Bill Sponsor
Fiscal Note Impact
Fiscal Note Summary Link Bill Summary Link
2015 SB 75 Holsman No impact http://www.moga.mo.gov/OverSight/Over20151//fispdf/0622-01N.ORG.pdf
http://www.senate.mo.gov/15info/BTS_Web/Summary.aspx?SessionType=R&SummaryID=82&BillID=174
2015 SB 509 Holsman No impact N/A http://www.senate.mo.gov/15info/BTS_Web/Summary.aspx?SessionType=R&SummaryID=664&BillID=4599469
2015 HB 481 Berry (38)
No impact http://www.moga.mo.gov/OverSight/Over20151//fispdf/0502-01N.ORG.pdf
http://house.mo.gov/billtracking/bills151/sumpdf/HB0481C.pdf
2014 HB 1795 Berry (38)
No impact http://www.moga.mo.gov/Oversight/OVER14/fishtm/5552-02N.ORG.htm
http://house.mo.gov/billtracking/bills141/sumpdf/HB1795I.pdf
2013 HB 119 Berry (38)
No impact http://www.moga.mo.gov/Oversight/OVER13/fishtm/0794-02N.ORG.htm
http://house.mo.gov/billtracking/bills131/sumpdf/HB0119I.pdf
2013 SB 396 Holsman No impact http://www.moga.mo.gov/Oversight/OVER13/fishtm/1078-07N.ORG.htm
http://www.senate.mo.gov/13info/BTS_Web/Bill.aspx?SessionType=R&BillID=19218703
Electric Vehicle Charging Stations - Applies to Versions 30, 31, 32, 34, and 35
The petition authorizes investor-owned utilities to recover costs for infrastructure investments in electric vehicle charging stations, provided the energy output from the stations is offset in part by clean energy. There should be no fiscal impact to the state. Utility investment in electric charging stations will result in positive economic activity similar to other capital investments. However, the range of the benefits is unknown at this time.
20
ENDNOTES
1 U.S. Energy Information Administration: Table 10: All Sectors - Class of ownership, number of
consumers, sales, revenue, and average retail price by State and utility http://www.eia.gov/electricity/sales_revenue_price/ 2 U.S. Energy Information Administration: Supplemental Data: 1990 - 2013 Revenue from Retail Sales of
Electricity by State by Sector by Provider (EIA-861) http://www.eia.gov/electricity/sales_revenue_price/ 3 Missouri Department of Economic Development, Division of Energy, "Missouri Comprehensive State
Energy Plan" October 2015, p. 25 https://energy.mo.gov/energy/docs/MCSEP.pdf 4 Missouri Department of Economic Development, Division of Energy, "Missouri Comprehensive State
Energy Plan" October 2015, p. 25-26 https://energy.mo.gov/energy/docs/MCSEP.pdf 5 Missouri Department of Economic Development, Division of Energy, "Missouri Comprehensive State
Energy Plan" October 2015, p. 162-164 https://energy.mo.gov/energy/docs/MCSEP.pdf 6 Missouri Department of Economic Development, Division of Energy, "Missouri Comprehensive State
Energy Plan" October 2015, p. 200 https://energy.mo.gov/energy/docs/MCSEP.pdf 7 National Renewable Energy Laboratory, "Photovoltaic System Pricing Trends: Historical, Recent, and
Near-Term Projections 2015 Edition", p. 5 http://www.nrel.gov/docs/fy15osti/64898.pdf 8 National Renewable Energy Laboratory, "Photovoltaic System Pricing Trends: Historical, Recent, and
Near-Term Projections 2015 Edition", p. 4 http://www.nrel.gov/docs/fy15osti/64898.pdf 9 Missouri Department of Economic Development, Division of Energy, "Missouri Comprehensive State
Energy Plan" October 2015, p. 172 https://energy.mo.gov/energy/docs/MCSEP.pdf 10
Missouri Department of Economic Development, Division of Energy, "Missouri Comprehensive State
Energy Plan" October 2015, p. 173 https://energy.mo.gov/energy/docs/MCSEP.pdf 11
Missouri Department of Economic Development, Division of Energy, "Missouri Comprehensive State
Energy Plan" October 2015, p. 176 https://energy.mo.gov/energy/docs/MCSEP.pdf 12
Missouri Department of Economic Development, Division of Energy, "Missouri Comprehensive State
Energy Plan" October 2015, p. 176 https://energy.mo.gov/energy/docs/MCSEP.pdf 13
Missouri Department of Economic Development, Division of Energy, "Missouri Comprehensive State
Energy Plan" October 2015, p. 174 https://energy.mo.gov/energy/docs/MCSEP.pdf
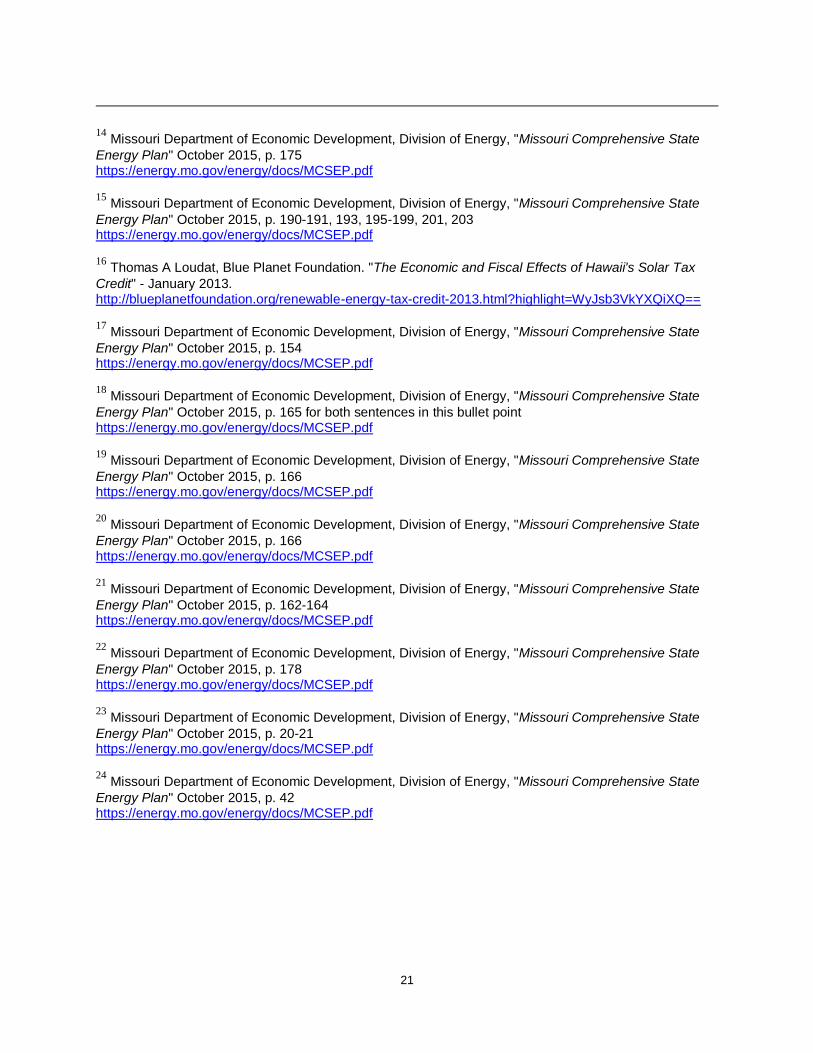
21
14
Missouri Department of Economic Development, Division of Energy, "Missouri Comprehensive State
Energy Plan" October 2015, p. 175 https://energy.mo.gov/energy/docs/MCSEP.pdf 15
Missouri Department of Economic Development, Division of Energy, "Missouri Comprehensive State
Energy Plan" October 2015, p. 190-191, 193, 195-199, 201, 203 https://energy.mo.gov/energy/docs/MCSEP.pdf 16
Thomas A Loudat, Blue Planet Foundation. "The Economic and Fiscal Effects of Hawaii's Solar Tax
Credit" - January 2013. http://blueplanetfoundation.org/renewable-energy-tax-credit-2013.html?highlight=WyJsb3VkYXQiXQ== 17
Missouri Department of Economic Development, Division of Energy, "Missouri Comprehensive State
Energy Plan" October 2015, p. 154 https://energy.mo.gov/energy/docs/MCSEP.pdf 18
Missouri Department of Economic Development, Division of Energy, "Missouri Comprehensive State
Energy Plan" October 2015, p. 165 for both sentences in this bullet point https://energy.mo.gov/energy/docs/MCSEP.pdf 19
Missouri Department of Economic Development, Division of Energy, "Missouri Comprehensive State
Energy Plan" October 2015, p. 166 https://energy.mo.gov/energy/docs/MCSEP.pdf 20
Missouri Department of Economic Development, Division of Energy, "Missouri Comprehensive State
Energy Plan" October 2015, p. 166 https://energy.mo.gov/energy/docs/MCSEP.pdf 21
Missouri Department of Economic Development, Division of Energy, "Missouri Comprehensive State
Energy Plan" October 2015, p. 162-164 https://energy.mo.gov/energy/docs/MCSEP.pdf 22
Missouri Department of Economic Development, Division of Energy, "Missouri Comprehensive State
Energy Plan" October 2015, p. 178 https://energy.mo.gov/energy/docs/MCSEP.pdf 23
Missouri Department of Economic Development, Division of Energy, "Missouri Comprehensive State
Energy Plan" October 2015, p. 20-21 https://energy.mo.gov/energy/docs/MCSEP.pdf 24
Missouri Department of Economic Development, Division of Energy, "Missouri Comprehensive State
Energy Plan" October 2015, p. 42 https://energy.mo.gov/energy/docs/MCSEP.pdf

Edward D. Greim provided the following information as an opponent of this initiative petition.
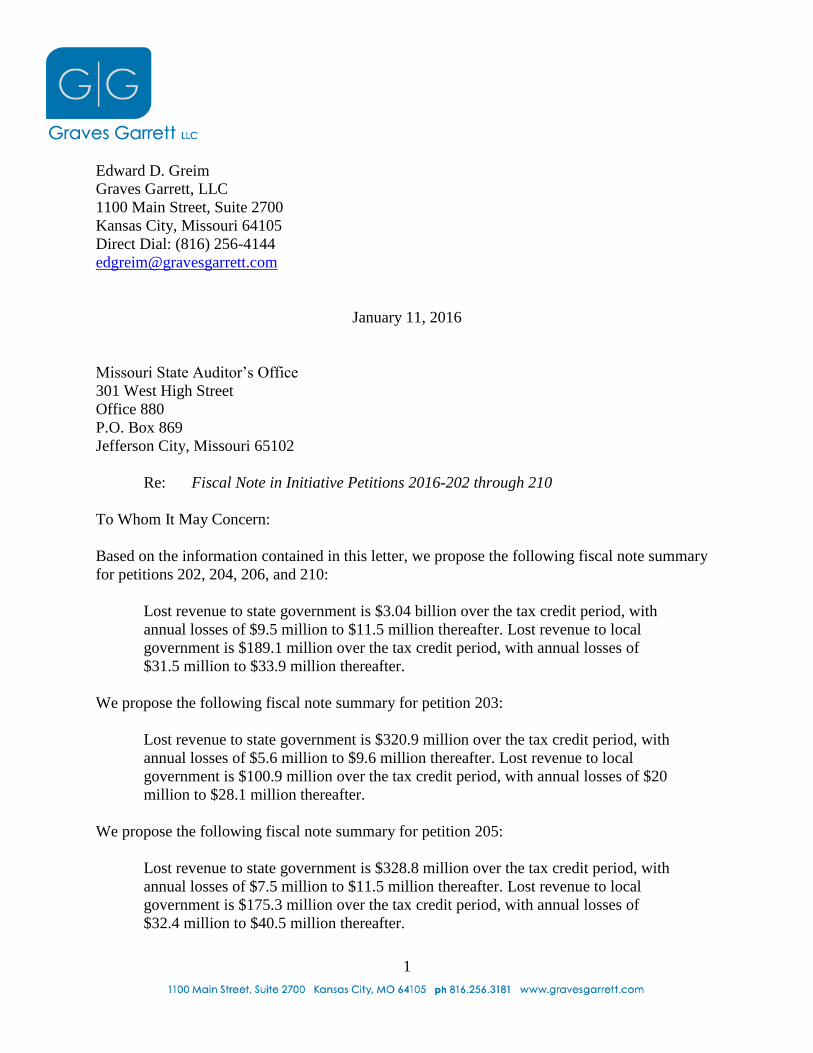
1
Edward D. Greim
Graves Garrett, LLC
1100 Main Street, Suite 2700
Kansas City, Missouri 64105
Direct Dial: (816) 256-4144
January 11, 2016
Missouri State Auditor’s Office
301 West High Street
Office 880
P.O. Box 869
Jefferson City, Missouri 65102
Re: Fiscal Note in Initiative Petitions 2016-202 through 210
To Whom It May Concern:
Based on the information contained in this letter, we propose the following fiscal note summary
for petitions 202, 204, 206, and 210:
Lost revenue to state government is $3.04 billion over the tax credit period, with
annual losses of $9.5 million to $11.5 million thereafter. Lost revenue to local
government is $189.1 million over the tax credit period, with annual losses of
$31.5 million to $33.9 million thereafter.
We propose the following fiscal note summary for petition 203:
Lost revenue to state government is $320.9 million over the tax credit period, with
annual losses of $5.6 million to $9.6 million thereafter. Lost revenue to local
government is $100.9 million over the tax credit period, with annual losses of $20
million to $28.1 million thereafter.
We propose the following fiscal note summary for petition 205:
Lost revenue to state government is $328.8 million over the tax credit period, with
annual losses of $7.5 million to $11.5 million thereafter. Lost revenue to local
government is $175.3 million over the tax credit period, with annual losses of
$32.4 million to $40.5 million thereafter.
2
We propose the following fiscal note summary for petition 207:
Lost revenue to state government is $3.02 billion over the tax credit period, with
annual losses of $5.7 million to $7.7 million thereafter. Lost revenue to local
government is $40.4 million over the tax credit period, with annual losses of
$11.5 million to $15.7 million thereafter.
We propose the following fiscal note summary for petitions 208 and 209:
Lost revenue to state government is $3.03 billion over the tax credit period, with
annual losses of $7.6 million to $9.6 million thereafter. Lost revenue to local
government is $114.8 million over the tax credit period, with annual losses of
$23.9 million to $28.1 million thereafter.
Introduction
Missouri electric utilities are tightly regulated by the Public Service Commission, which
regulates price, reliability, and customer service, among other areas. These utilities pay hundreds
of millions dollars of taxes to Missouri state government and local governments; taxes that do
not apply whenever electricity is never sold due to customer-generator production encouraged by
the initiative petitions. Petition signers and voters must be informed that any positive fiscal
impacts of the initiative petitions are speculative. Likewise, petition signers and voters must be
informed that the initiative petition will result in the loss of hundreds of millions of dollars of tax
revenue to state and local governments due to tax credits and decreases in electricity sales
volume.
Description of Policy
Initiative Petitions 202 – 210 contain one or more of three main statutory provisions:
(1) Changes to the Missouri Net Metering and Easy Connection Act; (2) Adoption of the
“Community Solar Act”; and (3) A state tax credit for projects producing electrical energy from
a clean energy resource – solar, wind, hydroelectric, or certain natural gas technologies.
1. Changes to Net Metering for Investor-owned electric utilities and municipal electric
utilities, and, in 206, rural electric cooperatives
A. Raise net metering cap to 7% (is currently 5%);
B. Makes utilities generally responsible for purchasing necessary additional
equipment/meter to accommodate the customer-generator’s facility;
C. Net excess energy credits expire every March, rather than after 12 months (but
there is no compensation for net excess energy credits);
3
D. Any costs incurred under this act by a retail electric supplier shall be recoverable
in that utility’s rate structure.
2. Community Solar Act
A. PSC adopts rules and regulations allowing groups of 5 or more electrical
corporation customers to offset energy usage with solar located in the service
territory of the electrical corporation where they have an account;
B. Facilities are 100 kilowatts to 1 megawatt;
C. Community solar facilities may, in total, generate electricity of 4% or less of
single-hour peak load, but that amount does not count toward net metering;
Electrical corporations can own half (max of 2%), which may be included in the
rate base. Others may own the other half (max of 2%);
D. Community Solar facilities are not eligible for tax credits provided in the petition;
E. Commission sets a community solar rate, not less than electrical corporation’s
average retail rate;
F. Value of allocated solar bill credits reduces customer’s total bill;
G. The current value-of-community-solar rate may be locked in for 20 years
beginning when a community solar facility is put in operation.
3. Tax credit
A. 35% tax credit for projects producing electrical energy from a clean energy
resource – solar, wind, hydroelectric, etc.
B. Total value of eligible credits shall not exceed 1% of the value of electricity used
in Missouri1 – defined as revenue from sale of electricity in Missouri; or tax
credits are capped at$50 million each year. Unused credits carryover year to year
until June 30, 2022
C. No tax credits after June 30, 2022, or after 1000 megawatts of new generation
have been installed using the tax credits.
Burdens on State Government
In determining the fiscal impact of each petition it is generally reasonable to assume that
the various statutory changes in the petitions will have independent fiscal impacts. The
reasonableness of this assumption is buoyed by the various iterations of the petitions themselves,
some of which propose tax credits with no proposed changes to the Net Metering and Easy
Connection Act. See Petitions 207 and 208.
i. Decreased tax collection due to changes to net metering – Initiative Petitions 202-207 and
209-210
1 The value of electricity used in Missouri in 2014 was 7.6 billion, and the value has increased
every year since 2003. See U.S. Energy Information Administration – Independent Statistics and
Analysis.
4
Raising the net metering cap from the current 5% of peak hour demand to 7% of peak
hour demand will, conservatively, result in a 2% decrease in electricity sales volume, when such
changes are paired with other changes suggested by the petition. This assumption is conservative
for several reasons. First, the current level of net metering is less than the current 5% cap due to
the cost of solar and other residential net metering equipment, meaning that the changes to
current net metering scheme may result in more than a simple increase from 5% to 7%. Second,
the declining price of solar and other renewable energy sources, paired with federal solar tax
credits (30% federal tax credit) and a 35% state tax credit as proposed in the petition provides a
strong financial incentive to solar or wind energy net metering, because customers can buy
increasingly affordable technology at an additional 55% discount2, suggesting that individuals
and corporations will take full advantage of the state and federal tax credits. In this sense,
however, the move to full 5% net metering will eventually occur due to declining prices for
residential and commercial customer energy generation, coupled with increasing prices in the
retail price of electricity. Third, the net-metering cap applies to single-hour peak load,
determined yearly, which means that the cap is a higher percentage of the single hour average
load. This fact means that the total increase in generation is higher than it appears. Fourth,
technology changes allow customers to decrease their bill by a greater percentage than they
decrease their usage. The commercialization of residential and commercial energy storage
technology, like home batteries,3 also allows customers to use their net-metering capacity more
efficiently, because customers can completely offset usage during costly high demand periods.
A 2% decrease in electricity sales volume will reduce Missouri state sales tax revenues
from investor-owned electric utilities by approximately $1.9 million annually. The cost from
2017 through 2022 is $7.9 million. This number is calculated using actual state sales taxes paid
in 2014 by investor-owned electric utilities. The additional decreases in sales tax revenues from
municipal electric utilities and, in petition 206, from electric cooperatives, are unknown but
substantial.4
ii. Decreased tax collections due to Community Solar Act – Initiative Petitions 202, 204-206,
208, and 210
Community solar facilities are in addition to net metering and represent an additional
capacity amounting to 4% of each electrical corporation’s single-hour peak load. Energy
generated from the community solar facility is allocated pro rata by the community solar facility
owner or operator. Energy production allocation is done via “bill credits” that decrease the sales
and gross receipts a utility receives from electricity sales. There is the potential for such bill
2 The 35% state tax credit reduces the basis eligible for the 30% federal tax credit.
3 One such energy storage/battery innovation is the Tesla Powerwall.
https://www.teslamotors.com/powerwall. 4 Assuming $7.6 billion in electricity is sold in Missouri per year (the actual 2014 figure), a 2%
decrease will decrease overall state sales tax revenues by 6.4 million annually, but some petitions
enact net metering changes on rural electric cooperatives, and some do not.
5
credits to decrease overall electrical bills by more than 4% because the “bill credits” are
calculated using a “value of solar rate” which is at least as high as the retail rate for electricity,
but may be higher. If, for example, solar energy received a 50% rate premium due to its benefits,
the amount of bill credits would increase and sales would decrease by more than the 6%, rather
than 4% figure. Half of these community solar facilities—the half not owned by electrical
corporations—may be operated in a manner, such as fractional ownership by customers or
ownership by a nonprofit, that avoid property tax, sales tax, and license/franchise taxes. There is
a strong financial incentive to operate these facilities in a fractional ownership model, similar to
net metering, because doing so avoids state sales tax (4.225%), local sales tax (generally, 3.5-
4%) and local utility license/franchise tax (generally, 5%).
A 2% decrease in electricity sales volume will reduce Missouri state sales tax revenues
from investor-owned electric utilities by approximately $1.9 million annually. The cost from
2017 through 2022 is $7.9 million. This number is calculated using actual state sales taxes paid
in 2014 by investor-owned electric utilities.
iii. Tax credits – Initiative Petitions 202-210
a. Decreased tax collections due to tax credits – Credits capped at 1% of value of electricity sold
in Missouri, annually ($76 million based on 2014 figures) – Initiative Petitions 202, 204, 206-
210
According to 2014 figures, Missouri retail customers bought 7.6 billion dollars’ worth of
electricity in 2014. It is very conservative to estimate that Missouri retail customers will continue
to buy the same value of electricity. Accordingly, the 35% tax credits in these petitions will,
conservatively, directly result in a loss of state income of up to $76 million, annually. However,
electricity rates are volatile, and rates may react violently given market changes and legal
changes proposed by the initiative petitions. As stated by the Department of Economic
Development, the total loss to state revenue in a single year could be $429.3 million, annually,
and $3 billion in total.
b. Decreased tax collections due to tax credits – Credits capped at $50 million annually –
Initiative Petitions 203 and 205
Similar to the loss described in subpart a, the 35% tax credits in these petitions will
directly result in a loss of state income of up to $50 million, annually.
c. Cost of eroding tax base due to new energy generation – Initiative Petitions 202-210
To determine the impact of new customer energy generation on state sales tax revenues,
we must first calculate the value of sales lost due to new customer-generated energy production.
Based on federal government data, we assume that the sun shines on average 5 hours per day in
6
Missouri. Accordingly, if the tax credits were phased out due to reaching the 1000
MWh/1,000,000 kWh maximum on new electricity generation, new production from such tax
credits would produce approximately 1,825,000 MWh per year, also expressed as 1,825,000,000
KWh, or 1,825 million KWh (1,000 MWh * 5 hours per day * 365 days per year). Based on an
assumed average retail price of electricity in Missouri of $100 per megawatt/hour 5, this new
production is valued at $182,500,000.
This new electricity generation is used by customers to offset charges they would
otherwise incur on their bills. Accordingly, this amount of electricity will no longer be sold by
Missouri utilities and electric cooperatives, and the state and local governments will lose sales
tax revenues. The Missouri state sales tax rate is 4.225%.
In practice, the 1 gigawatt limit on new customer-generated energy production may never
be met. Credible independent analysts believe the installed cost of solar will be $1.77 per watt in
2017 ($1770 per kilowatt).6 The cost is expected to further decline over time, but it is reasonable
to assume a constant $1.77 per watt installed cost for renewable energy resources according to
the petition because of the competing forces of price inflation and decreased production costs of
emerging technology. The petition itself limits tax credits to a maximum of $3.00 per watt, but
market forces should make rates in Missouri similar to those in other states, at or around $1.77.
For Initiative Petitions 202, 204, and 206-210, the total, annual loss to state governments
due to the tax credits is 76.9 million to 435 million over the tax credit period. There is an annual
loss in perpetuity after the tax credit period of 5.7 to 7.7 million, depending on how much new
customer-generation is developed. See attached table.
For Initiative Petitions 203 and 205, the total, annual loss to state governments due to the
tax credits is 50.6 million to 53.7 million over the tax credit period. There is an annual loss in
perpetuity after the tax credit period of 3.7 to 7.7 million, depending on how much new
customer-generation is developed. See attached table.
Burdens on Local Governments
5 In 2014, the average price of electricity in Missouri was $91.10 per megawatt/hour. The $100
an hour cost estimate is conservative as an average cost over the relevant period of the tax credits
and beyond. 6 Some solar companies have forecasted a cost of under $1.00 per watt full installed by 2017.
Comments of First Solar CEO, ‘By 2017, We’ll Be Under $1.00 per Watt Fully Installed’, June
24, 2015, http://www.greentechmedia.com/articles/read/First-Solar-CEO-By-2017-Well-be-
Under-1.00-Per-Watt-Fully-Installed.
7
Local governments face similar losses in revenue from the various petition provisions as
state government (with the exception of the direct losses to state government for the tax credits).
In fact, local governments face a more significant burden because utility revenues make up a
comparatively higher portion of the local governments’ tax base. Missouri’s electric utilities are
large sources of local tax revenue, including property tax, sales tax (on average 3.585%) and
license tax (approximately 5%). The amounts at issue are substantial. For example, Missouri
electric utilities paid over $522 million in license taxes to local governments in 2014.
Determining exactly how much of this revenue will be lost due to various provisions in the
petition is uncertain and may require the expenditure of substantial litigation costs by some or all
Missouri municipalities.
i. Decreased tax collection due to changes to net metering – Initiative Petitions 202-206 and
209-210
A 2% decrease in electricity sales volume will reduce local government tax revenues
from investor-owned electric utilities by approximately 12.4 million annually (.02 * [sales tax
and franchise/license taxes paid to Missouri local governments in 2014]). The cost from 2017
through 2022 is $74.4 million.
ii. Decreased tax collections due to Community Solar Act – Initiative Petitions 202, 204-206,
208, and 210
A 2% decrease in electricity sales volume will reduce local government tax revenues
from investor-owned electric utilities by approximately 12.4 million annually (.02 * [sales tax
and franchise/license taxes paid to Missouri local governments in 2014]). The cost from 2017
through 2022 is $74.4 million.
iii. Tax credits – Cost of eroding tax base due to new energy generation – Initiative Petitions
202-210
The calculation of lost revenue for local governments is substantially similar as the calculation
for state government lost sales tax. Local governments will collect less tax revenue from their
various local taxes due to the decrease in demand for utility-provided electricity. The availability
of lower local government taxes is a strong financial incentive for large-scale electricity users to
invest in customer-generator projects supported by the petition. Further, Missouri’s electric
utilities are invested in Missouri and its local communities. The initiative petitions may
jeopardize the jobs of Missouri electric utilities’ employees to the extent the utilities suffer
decreased revenue. Missouri electric utilities provide numerous other benefits to local
governments, all of which may be reduced or discontinued if the initiative petitions are enacted.
8
The population weighted combined average state and local sales tax in Missouri is
estimated at 7.81%.7 Based on this estimate, the population-weighted combined average local
sales tax is 3.585%. Assuming the tax credits sunset due to reaching the 1 Gigawatt production
cap, the yearly loss to local governments from lost sales tax from the tax credit is $6,541,578.
Assuming a license tax/franchise rate on electric utility service of 5%, which may be more or
less depending on the municipality, if any, where electricity is sold, the additional lost local
revenue from the loss of sales subject to license tax is $9,123,540.
For petitions 202, 204, and 206-210, the loss to local governments due to the tax credits is $40.4
million over the tax credit period, then $11.5 to $15.7 million annually. For initiative petitions
203 and 205, the loss to local governments due to the tax credits is $26.6 million over the tax
credit period, then $7.5 to $15.7 million annually.
In Conclusion
The initiative petitions will result in substantial, reasonably determinable losses in tax revenues
to Missouri state government and local governments. State government incurs tax losses through
the issuance of tax credits as well as the loss of electricity sales volume through certain changes
promulgated by the petitions, such as increases in net metering and community solar. The total
tax burden on state government imposed by the petitions range from $313 million over the tax
credit period, with $3.7 to $7.7 million in lost revenues in perpetuity, to approximately $498.6
million over the tax credit period,8 with $9.5 million to 11.5 million in lost revenues in perpetuity
thereafter.
Sincerely,
Edward D. Greim
Graves Garrett LLC
Additional Works Cited
Revenue from retail sales of electricity in Missouri
U.S. Energy Information Administration – Independent Statistics & Analysis - Table of Missouri
Revenues
https://www.eia.gov/electricity/data/browser/#/topic/6?agg=01&geo=000002&endsec=vg&linec
hart=ELEC.REV.MO-ALL.A&columnchart=ELEC.REV.MO-ALL.A&map=ELEC.REV.MO-
ALL.A&freq=A&ctype=linechart<ype=pin&rtype=s&pin=&rse=0&maptype=0
7 http://taxfoundation.org/sites/taxfoundation.org/files/docs/LOST--2015.png.
8 $475.8 million + [(1.9 million + 1.9 million)*6 years]
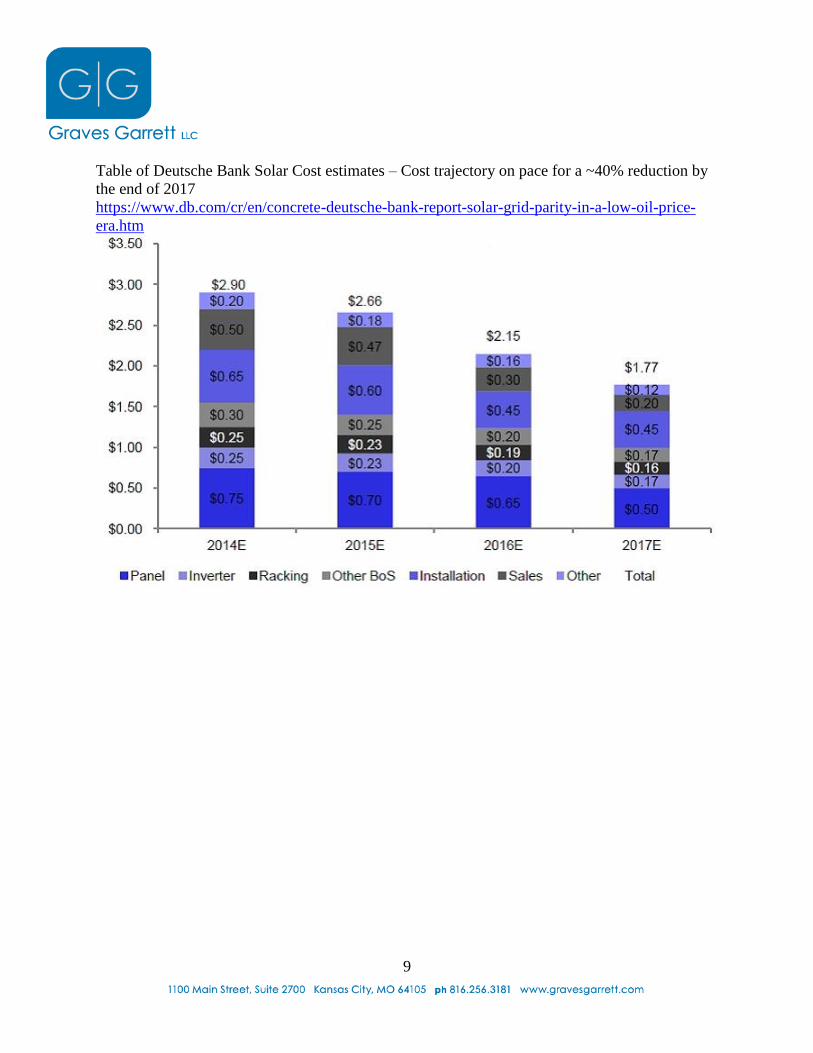
9
Table of Deutsche Bank Solar Cost estimates – Cost trajectory on pace for a ~40% reduction by
the end of 2017
https://www.db.com/cr/en/concrete-deutsche-bank-report-solar-grid-parity-in-a-low-oil-price-
era.htm
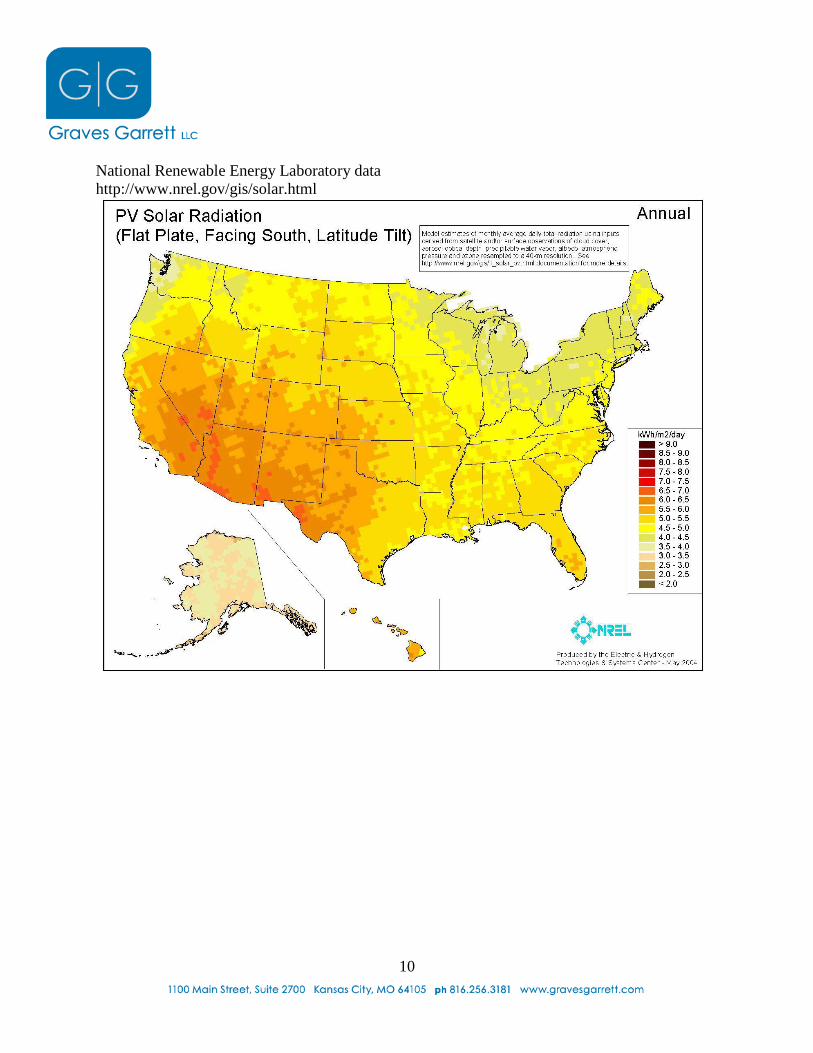
10
National Renewable Energy Laboratory data
http://www.nrel.gov/gis/solar.html

$/kW Installed Cost $1,770
MW's Installed 122.68
Tax Rebate Incentive % 35%
Tax Limit $76,000,000
Solar Capacity Factor 20.83% 5 hours / 24 hours
MW's of Output 223,854
$/MWh Retail Rate $100
Renewable Tax
Rebate
MW's
Installed
Cumulative
MW's Installed MWh's Solar
Avg Retail
Rate
Lost Utility
Revenue
State Sales
Tax Rate
Lost State Sales
Tax Revenue
Annual State Tax
Burden
Local Sales
Tax Rate
Lost Local Sales Tax
Revenue
Franchise
Tax Rate
Lost Local Franchise
Tax Revenue
Annual Local Tax
Burden
2017 $76,000,000 122.68 122.68 223,854 $100 $22,385,441 4.225% $945,785 $76,945,785 3.585% $802,518 5.000% $1,119,272 $1,921,790
2018 $76,000,000 122.68 245.36 447,709 $100 $44,770,882 4.225% $1,891,570 $77,891,570 3.585% $1,605,036 5.000% $2,238,544 $3,843,580
2019 $76,000,000 122.68 368.04 671,563 $100 $67,156,323 4.225% $2,837,355 $78,837,355 3.585% $2,407,554 5.000% $3,357,816 $5,765,370
2020 $76,000,000 122.68 490.72 895,418 $100 $89,541,765 4.225% $3,783,140 $79,783,140 3.585% $3,210,072 5.000% $4,477,088 $7,687,160
2021 $76,000,000 122.68 613.40 1,119,272 $100 $111,927,206 4.225% $4,728,924 $80,728,924 3.585% $4,012,590 5.000% $5,596,360 $9,608,951
2022 $76,000,000 122.68 736.08 1,343,126 $100 $134,312,647 4.225% $5,674,709 $81,674,709 3.585% $4,815,108 5.000% $6,715,632 $11,530,741
Total State Tax Burden $475,861,483 Total Local Tax Burden (Sales + Franchise) $40,357,593
Perpetual Impact if New Generation Reaches 1 Gigawatt Cap
1000.00 1,824,708 $100 $182,470,800 4.225% $7,709,391 $7,709,391 3.585% $6,541,578 5.000% $9,123,540 $15,665,118
Brightergy Renewable Tax Credit Fiscal Analysis (1% Value of Electricity Cap) - Initiative Petitions 202, 204, and 206-210
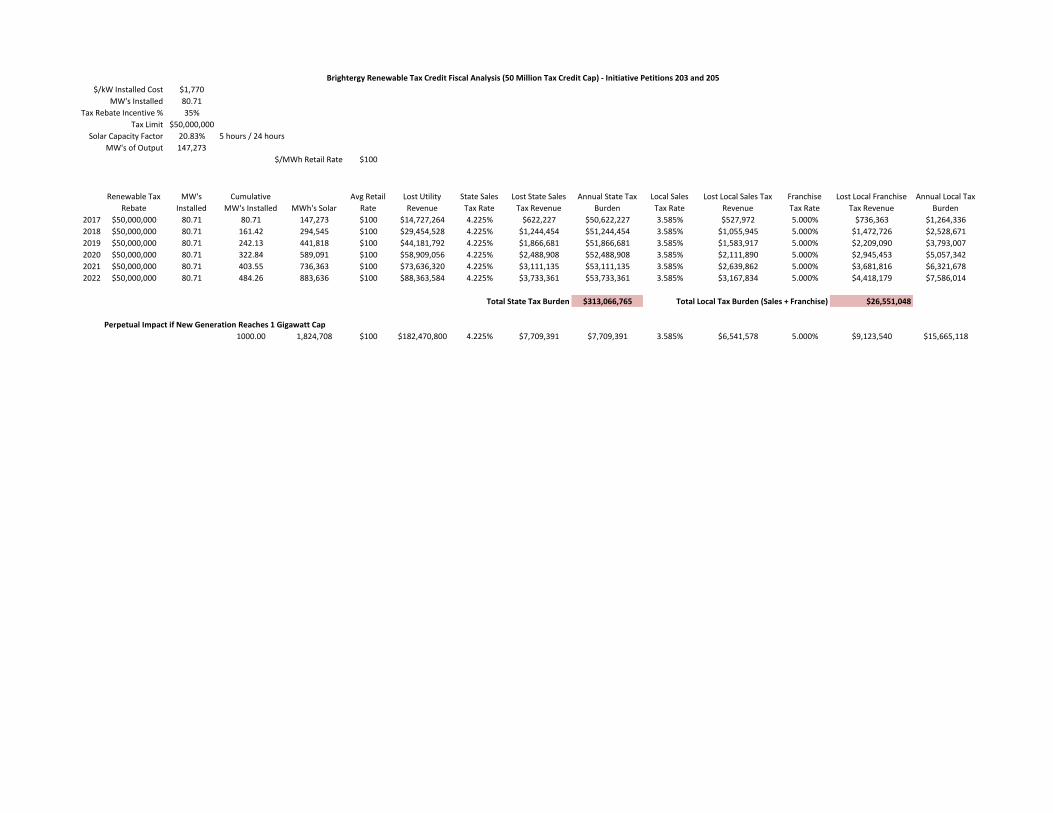
$/kW Installed Cost $1,770
MW's Installed 80.71
Tax Rebate Incentive % 35%
Tax Limit $50,000,000
Solar Capacity Factor 20.83% 5 hours / 24 hours
MW's of Output 147,273
$/MWh Retail Rate $100
Renewable Tax
Rebate
MW's
Installed
Cumulative
MW's Installed MWh's Solar
Avg Retail
Rate
Lost Utility
Revenue
State Sales
Tax Rate
Lost State Sales
Tax Revenue
Annual State Tax
Burden
Local Sales
Tax Rate
Lost Local Sales Tax
Revenue
Franchise
Tax Rate
Lost Local Franchise
Tax Revenue
Annual Local Tax
Burden
2017 $50,000,000 80.71 80.71 147,273 $100 $14,727,264 4.225% $622,227 $50,622,227 3.585% $527,972 5.000% $736,363 $1,264,336
2018 $50,000,000 80.71 161.42 294,545 $100 $29,454,528 4.225% $1,244,454 $51,244,454 3.585% $1,055,945 5.000% $1,472,726 $2,528,671
2019 $50,000,000 80.71 242.13 441,818 $100 $44,181,792 4.225% $1,866,681 $51,866,681 3.585% $1,583,917 5.000% $2,209,090 $3,793,007
2020 $50,000,000 80.71 322.84 589,091 $100 $58,909,056 4.225% $2,488,908 $52,488,908 3.585% $2,111,890 5.000% $2,945,453 $5,057,342
2021 $50,000,000 80.71 403.55 736,363 $100 $73,636,320 4.225% $3,111,135 $53,111,135 3.585% $2,639,862 5.000% $3,681,816 $6,321,678
2022 $50,000,000 80.71 484.26 883,636 $100 $88,363,584 4.225% $3,733,361 $53,733,361 3.585% $3,167,834 5.000% $4,418,179 $7,586,014
Total State Tax Burden $313,066,765 Total Local Tax Burden (Sales + Franchise) $26,551,048
Perpetual Impact if New Generation Reaches 1 Gigawatt Cap
1000.00 1,824,708 $100 $182,470,800 4.225% $7,709,391 $7,709,391 3.585% $6,541,578 5.000% $9,123,540 $15,665,118
Brightergy Renewable Tax Credit Fiscal Analysis (50 Million Tax Credit Cap) - Initiative Petitions 203 and 205
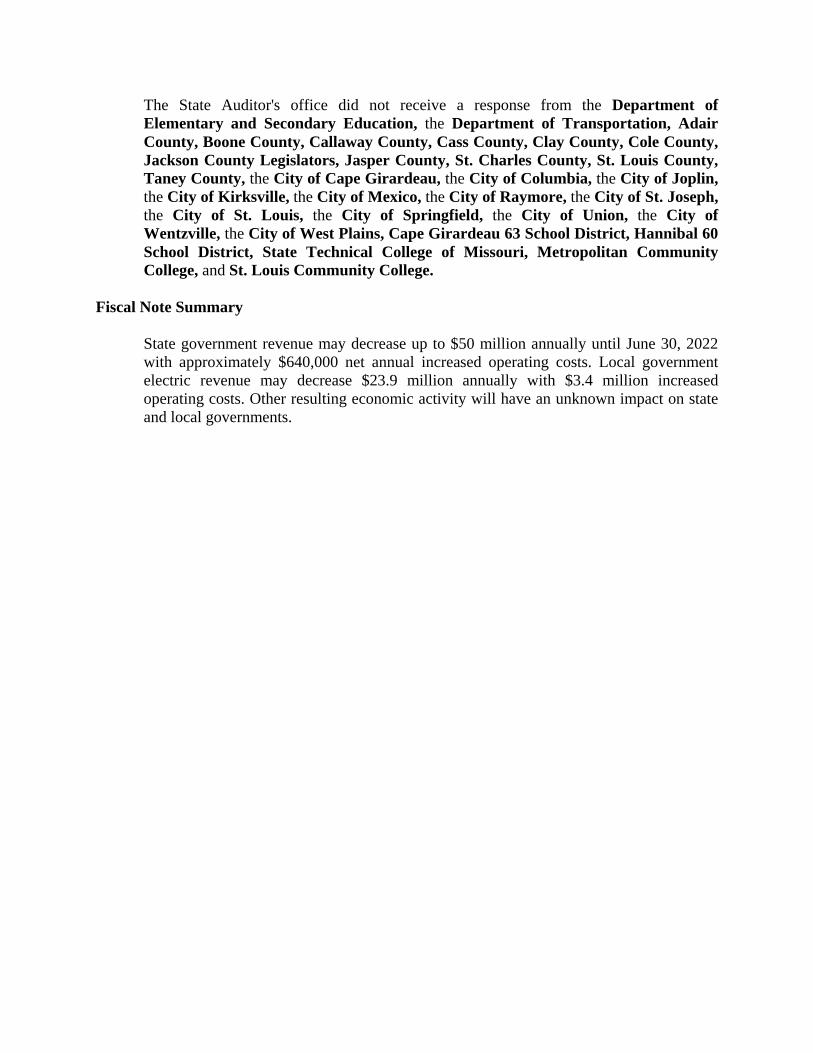
The State Auditor's office did not receive a response from the Department of Elementary and Secondary Education, the Department of Transportation, Adair County, Boone County, Callaway County, Cass County, Clay County, Cole County, Jackson County Legislators, Jasper County, St. Charles County, St. Louis County, Taney County, the City of Cape Girardeau, the City of Columbia, the City of Joplin, the City of Kirksville, the City of Mexico, the City of Raymore, the City of St. Joseph, the City of St. Louis, the City of Springfield, the City of Union, the City of Wentzville, the City of West Plains, Cape Girardeau 63 School District, Hannibal 60 School District, State Technical College of Missouri, Metropolitan Community College, and St. Louis Community College.
Fiscal Note Summary State government revenue may decrease up to $50 million annually until June 30, 2022 with approximately $640,000 net annual increased operating costs. Local government electric revenue may decrease $23.9 million annually with $3.4 million increased operating costs. Other resulting economic activity will have an unknown impact on state and local governments.