Embed Size (px)
Citation preview
Summary of Actual 2017 Regulation
Northwestern Division
Missouri River Mainstem Reservoir System
May 2018
Fort Peck
Garrison
Oahe Big Bend
Fort Randall
Gavins Point
Missouri River Basin
U.S. Army Corps of EngineersNorthwestern Division
Missouri River Basin Water Management DivisionOmaha, Nebraska
US Army Corpsof Engineers

i
Missouri River Mainstem Reservoir System
Summary of Actual 2017 Regulation
Table of Contents
Section No. Title Page
I. FOREWORD .......................................................................................................................1 II. REVIEW OF REGULATION .............................................................................................1 A. General .....................................................................................................................1 B. Precipitation and Water Supply Available in 2017..................................................1 1. Plains Snowpack ..........................................................................................1 2. Mountain Snowpack ....................................................................................9 3. Weather Conditions ...................................................................................12 4. 2017 Calendar Year Runoff .......................................................................24 C. System Regulation – January to December 2017 ..................................................29 1. Basin Conditions and System Regulation ..................................................29 2. Fort Peck Regulation..................................................................................33 3. Garrison Regulation ...................................................................................36 4. Oahe and Big Bend Regulation..................................................................39 5. Fort Randall Regulation .............................................................................42 6. Gavins Point Regulation ............................................................................45 D. Non-Routine Regulation and Other Items Pertaining to System Regulation ........49 E. Reservoir Elevations and Storage ..........................................................................50 F. Summary of Results ...............................................................................................54 1. Flood Control .............................................................................................54 2. Irrigation ....................................................................................................56 3. Water Supply ............................................................................................56 4. Water Quality Control................................................................................57 5. Navigation ..................................................................................................62 6. Hydropower Generation.............................................................................70 7. Recreation ..................................................................................................74 8. Fish and Wildlife........................................................................................75 9. Cultural Resources .....................................................................................79

ii
List of Tables ................................................................................................................................. iii List of Figures ................................................................................................................................ iv List of Plates ....................................................................................................................................v List of Abbreviations and Acronyms ............................................................................................. vi Definition of Terms...................................................................................................................... viii

iii
LIST OF TABLES
No. Title Page 1 Missouri River Basin – Plains Snowfall Totals (inches) .....................................................9 2 Mountain SWE Accumulation, 2016-17............................................................................11 3 2017 CY Runoff Volumes for Selected Reaches (1,000 acre-feet) ...................................25 4 Missouri River Basin 2017 Runoff above Sioux City, IA .................................................26 5 Fort Peck – Inflows, Releases and Elevations ...................................................................33 6 Garrison – Inflows, Releases and Elevations .....................................................................37 7 Oahe – Inflows, Releases and Elevations ..........................................................................40 8 Big Bend – Inflows, Releases and Elevations ...................................................................41 9 Fort Randall – Inflows, Releases and Elevations ...............................................................43 10 Gavins Point – Inflows, Releases and Elevations ..............................................................45 11 Reservoir Levels and Storages – July 31, 2017 .................................................................50 12 Reservoir Levels and Storages – December 31, 2017 .......................................................50 13 Water Quality Issues and Concerns ...................................................................................58 14 Missouri River Tonnage by Commodity (1,000 Tons) ......................................................63 15 Navigation Season Target Flows .......................................................................................66 16 Missouri River Navigation Tonnage and Season Length ..................................................67 17 Gross Federal Power System Generation – January 2017 through December 2017 .........71 18 Historical Generation and Load Data – Peaks, Eastern Division, Pick-Sloan Missouri
Basin Program ....................................................................................................................73 19 Historical Generation and Load Data – Total, Eastern Division, Pick-Sloan Missouri Basin Program ....................................................................................................................73 20 Visitation at System Reservoirs (Visits) ............................................................................74 21 Missouri River System - Interior Least Tern Survey Data ................................................77 22 Missouri River System - Piping Plover Survey Data.........................................................78
iv
LIST OF FIGURES
No. Title Page 1 December 2016 – February 2017 departure from normal temperature....…...………........2 2 December 2016 – February 2017 percent of normal precipitation..………………………3 3 Soil moisture percentile ranking, November 2016………………………………………..4 4 Snow depth in inches on December 5, 2016 ........................................................................4 5 Snow depth in inches on December 31, 2016 ......................................................................5 6 Snow depth in inches on February 4, 2017………………………………………………..6 7 Missouri River Basin snowpack and SWE on February 4, 2017...………………………..7 8 February 2017 departure from normal temperature (deg F)……………………………. ...7 9 Snow depth in inches on March 4, 2017……………………………………….. ................8 10 Missouri River Basin 2016-17 mountain SWE ……………………………………….. ..10 11A January-December 2017 Statewide Precipitation Ranks .................................................. 16 11B January-December 2017 Divisional Precipitation Ranks ..................................................16 12A January-December 2017 Statewide Temperature Ranks ...................................................17 12B January-December 2017 Divisional Temperature Ranks ..................................................17 13 The National Drought Mitigation Center’s drought maps for early January, April, July
and October 2017………………………….. .....................................................................18 14 Percent of normal precipitation maps for 2017, by month………………………….. ......19 15 Departure from normal temperature (deg F) for the 2017 three-month periods: January-
March, April-June, July-September and October-December ………………………….. .20 16A Missouri River actual and unregulated flows – Wolf Point, MT and Bismarck, ND ........21 16B Missouri River actual and unregulated flows – Sioux City, IA and St. Joseph, MO…… 22 16C Missouri River actual and unregulated flows – Boonville, MO and Hermann, MO…… .23 17 Missouri River Basin annual runoff above Sioux City, IA ................................................27 18 Missouri River Basin 2017 monthly runoff summation above Sioux City, Iowa .............28 19 Soil moisture ranking percentile, March 2, 2017 ...............................................................30 20 Observed winter ice season stage at Wolf Point, MT and Bismarck, ND and Fort Peck
and Garrison releases ……………………………………………………………………35 21A End-of-July pool elevations for Fort Peck and Garrison ...................................................52 21B End-of-July pool elevations for Oahe and total System storage ........................................53 22A Missouri River flood damages prevented by the System indexed to September 2017
levels ..................................................................................................................................55 22B Missouri River flood damages prevented by the System - original price levels ...............55 23A Missouri River total navigation tonnage from 1960 to 2017 (estimated) ..........................64 23B Missouri River commercial navigation tonnage from 1960 to 2017 (estimated) ..............64 24A Total navigation tonnage value using 2017 present worth computations ..........................65 24B Commercial navigation tonnage value using 2017 present worth computations ..............65 25A Actual flow, System releases and navigation target flows – Sioux City, IA and Omaha,
NE (calendar year) .............................................................................................................68 25B Actual flow, System releases and navigation target flows – Nebraska City, NE and
Kansas City, MO (calendar year).......................................................................................69 26 System power generation by project from 1954 to 2017 ...................................................72
v
LIST OF PLATES No. Title 1 Missouri River Basin Map 2 Summary of Engineering Data – Missouri River Mainstem System 3 Garrison Reservoir - estimated reservoir and coldwater fishery (CWF) habitat 2011 through
2017 4 Oahe Reservoir - estimated reservoir and coldwater fishery (CWF) habitat 2011 through 2017

vi
LIST OF ABBREVIATIONS AND ACRONYMS
AOP annual operating plan AF acre-feet cfs cubic feet per second BIA Bureau of Indian Affairs consultation government-to-government consultation CPFLP coldwater permanent fish life propagation CY calendar year (January 1 to December 31) DMS Data Management System deg C degrees Celsius deg F degrees Fahrenheit EA Environmental Assessment ENSO El Niño Southern Oscillation EOM End of Month Five Year Plan Cultural Resources Program Five Year Plan FTT Flow to Target HPRCC High Plains Regional Climate Center kAF thousand acre-feet kW kilowatt kWh kilowatt hour M million MAF million acre-feet Master Manual Master Water Control Manual MGD million gallons per day µg/l micrograms per liter mg/l milligrams per liter MRNRC Missouri River Natural Resources Committee MRBWM Missouri River Basin Water Management MV motor vessel MVD Corps’ Mississippi Valley Division MW megawatt MWh megawatt hour M&I municipal and industrial NDEQ Nebraska Department of Environmental Quality NHPA National Historic Preservation Act NOAA-CPC National Oceanic and Atmospheric Administration -
Climate Prediction Center NOAA-NCDC National Oceanic and Atmospheric Administration -
National Climatic Data Center NOAA-NWS National Oceanic and Atmospheric Administration -
National Weather Service NOHRSC National Operational and Hydrologic Remote Sensing
Center

vii
LIST OF ABBREVIATIONS AND ACRONYMS (cont’d)
NRCS-SNOTEL Natural Resources Conservation Service SNOwpack TELemetry
NWD Corps’ Northwestern Division NWK Corps’ Kansas City District NWO Corps’ Omaha District OPPD Omaha Public Power District PA 2004 Programmatic Agreement plover piping plover P-S MBP Pick-Sloan Missouri Basin Program RM river mile SD GFP South Dakota Game Fish and Parks SHPO State Historic Preservation Officer SR Steady Release SWE snow water equivalent System Missouri River Mainstem Reservoir System tern interior least tern THPO Tribal Historic Preservation Officer TMDL Total Maximum Daily Load T&E Threatened and Endangered USBR U.S. Bureau of Reclamation USDA USFWS USGS WCSC Western WPFLP
U.S. Department of Agriculture U.S. Fish and Wildlife Service United States Geological Survey Waterborne Commerce Statistics Center Western Area Power Administration warmwater permanent fish life propagation

viii
DEFINITION OF TERMS
Acre-foot (AF, ac-ft) is the quantity of water required to cover 1 acre to a depth of 1 foot and is equivalent to 43,560 cubic feet or 325,850 gallons.
Cubic foot per second (cfs) is the rate of discharge representing a volume of 1 cubic foot passing a given point during 1 second and is equivalent to approximately 7.48 gallons per second or 448.8 gallons per minute. The volume of water represented by a flow of 1 cubic foot per second for 24 hours is equivalent to 86,400 cubic feet, approximately 1.983 acre-feet, or 646,272 gallons. Conversely, 1.5 cfs for 24 hours is approximately 1 million gallons; therefore, 1.5 cfs is approximately 1 million gallons per day (MGD).
Discharge is the volume of water (or more broadly, volume of fluid plus suspended sediment) that passes a given point within a given period of time.
Drainage area of a stream at a specific location is that area, measured in a horizontal plane, enclosed by a topographic divide from which direct surface runoff from precipitation normally drains by gravity into the river above the specified point. Figures of drainage area given herein include all closed basins, or noncontributing areas, within the area unless otherwise noted.
Drainage basin is a part of the surface of the earth that is occupied by drainage system, which consists of a surface stream or body of impounded surface water together with all tributary surface streams and bodies of impounded water. Drought is three or more consecutive years of below-average calendar year runoff into the Missouri River above Sioux City, IA.
Gaging station is a particular site on a stream, canal, lake, or reservoir where systematic observations of hydrologic data are obtained.
Runoff in inches shows the depth to which the drainage area would be covered if all the runoff for a given time period were uniformly distributed on it.
Streamflow is the discharge that occurs in a natural channel. Although the term "discharge" can be applied to the flow of a canal, the word "streamflow" uniquely describes the discharge in a surface stream course. The term "streamflow" is more general than "runoff" as streamflow may be applied to discharge whether or not it is affected by diversion or regulation.
1
MISSOURI RIVER MAINSTEM RESERVOIR SYSTEM
Summary of Actual 2017 Regulation
I. FOREWORD
This document contains a summary of the actual regulation of the Missouri River Mainstem Reservoir System (System) for the 2017 Calendar Year (CY). Two other reports related to System regulation are also available, the System Description and Regulation and Final 2016-2017 Annual Operating Plan. All three reports can be obtained by contacting the Missouri River Basin Water Management Division (MRBWM), Northwestern Division, U.S. Army Corps of Engineers at 1616 Capitol Avenue, Suite 365, Omaha, Nebraska 68102-4909, phone (402) 996-3841. The reports are also available on the MRBWM website at www.nwd-mr.usace.army.mil/rcc.
A Missouri River Basin (Basin) map is presented on Plate 1 and the pertinent data for the System are shown on Plate 2.
II. REVIEW OF REGULATION – JANUARY-DECEMBER 2017
A. General
This report summarizes the System regulation as it pertains to all eight congressionally-authorized purposes. During 2017 the System was regulated in accordance with the Master Water Control Manual (Master Manual) and the applicable provisions of the Final 2016-17 Annual Operating Plan (AOP), which was made available for review and comment by representatives of State and Federal agencies, Tribes, the general public, and specific interest groups. For the purposes of this report, the upper Missouri River Basin (upper Basin) is the Missouri River Basin above Sioux City, IA and the lower Missouri River Basin (lower Basin) is the Missouri River Basin from Sioux City, IA to the mouth.
B. Precipitation and Water Supply Available in 2017
Plains snowpack, mountain snowpack and general weather conditions in the Missouri River Basin during the 2017 calendar year are discussed in the following sections. The 1981-2010 average reference period is used for plains and mountain snowpack, precipitation and temperature conditions.
1. Plains Snowpack
Plains snowpack during the 2016-2017 winter was generally light to moderate in eastern Montana, and moderate to heavy in North Dakota and northern South Dakota; plains snowpack was light in the remainder of the upper Basin. The moderate snowpack developed in North Dakota and South Dakota during several large winter storms in December. Winter season

2
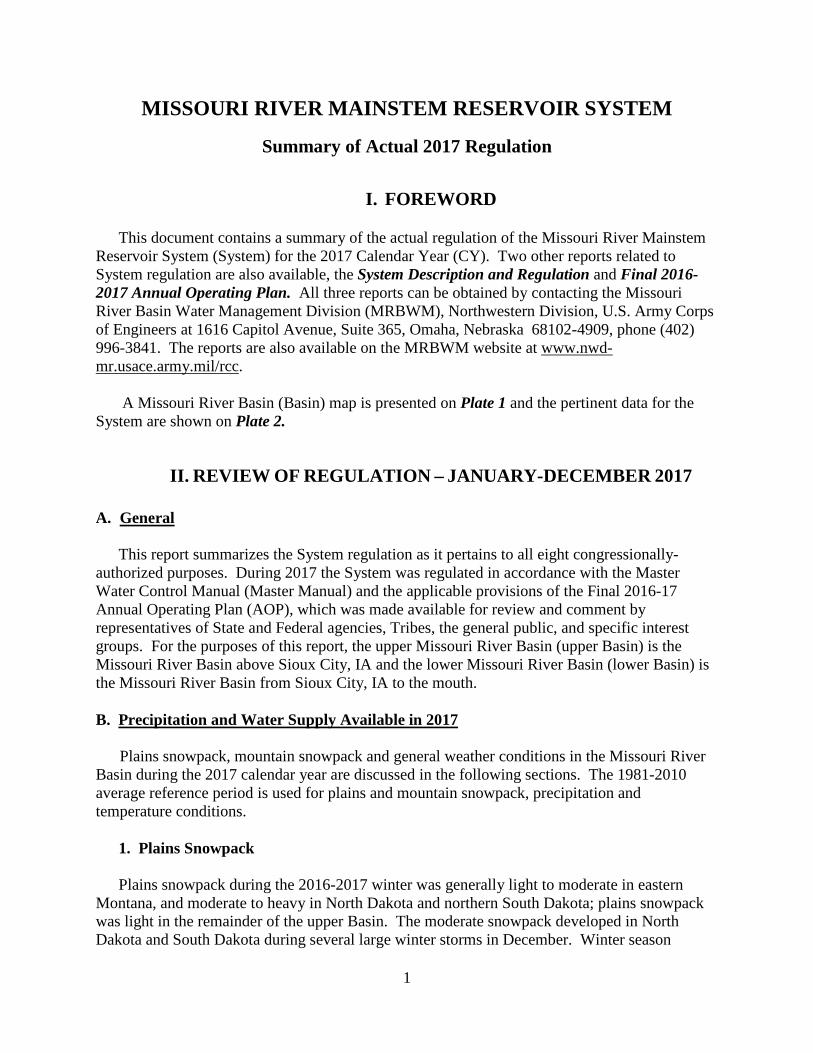
temperatures and precipitation were influenced by a mild La Niña climate pattern. From December 2016 to February 2017, the climatological winter, temperature departures were well-below normal (Figure 1) in Montana, northern Wyoming, western North Dakota and western South Dakota. Temperature departures were above normal in the eastern Dakotas and the lower Basin. Well-above normal winter precipitation throughout the upper Basin (Figure 2) also contributed to the development of the moderate plains snowpack.
Figure 1. December 2016 – February 2017 departure from normal temperature (deg F).
Source: High Plains Regional Climate Center (HPRCC).
3
Figure 2. December 2016 – February 2017 percent of normal precipitation. Source: HPRCC.
Prior to the first accumulations of the 2016-2017 winter plains snowpack, soil moisture conditions (Figure 3) were greater than the 70th percentile ranking (wetter than normal) in Montana, northwestern Wyoming, North Dakota, eastern South Dakota, eastern Nebraska and northwestern Iowa. Soil moisture was very wet in northern Montana due to heavy rainfall in the fall of 2016. Soil moisture was below the 30th percentile ranking (drier than normal) in western South Dakota and eastern Wyoming. Fall soil moisture is significant in its relation to spring runoff. During the onset of the winter, much of this moisture is frozen in the soil and is later released during the spring thaw. Soil moisture typically does not change during the winter; therefore, high or low fall soil moisture typically establishes wet or dry spring soil moisture conditions, respectively.
The snowpack across the Northern Plains began accumulating in earnest in central North Dakota during the last three days of November. Snowfall totals in North Dakota during the last three days of November ranged from 15 to 25 inches. Heavy accumulations included 18.7 inches at the Bismarck, ND airport; 20 inches in Mandan, ND; and 24.5 inches in northeastern Bismarck, ND. Northern South Dakota received about 10 inches of snowfall during this time period. As of December 5, much of the heavy snow remained on the plains (see Figure 4), and shallow accumulations of snow were also present in Montana, Wyoming, South Dakota, eastern North Dakota and northwest Iowa.

4
Figure 3. Soil moisture percentile ranking, November 2016. Source: NOAA CPC
Figure 4. Snow depth in inches on December 5, 2016.
5
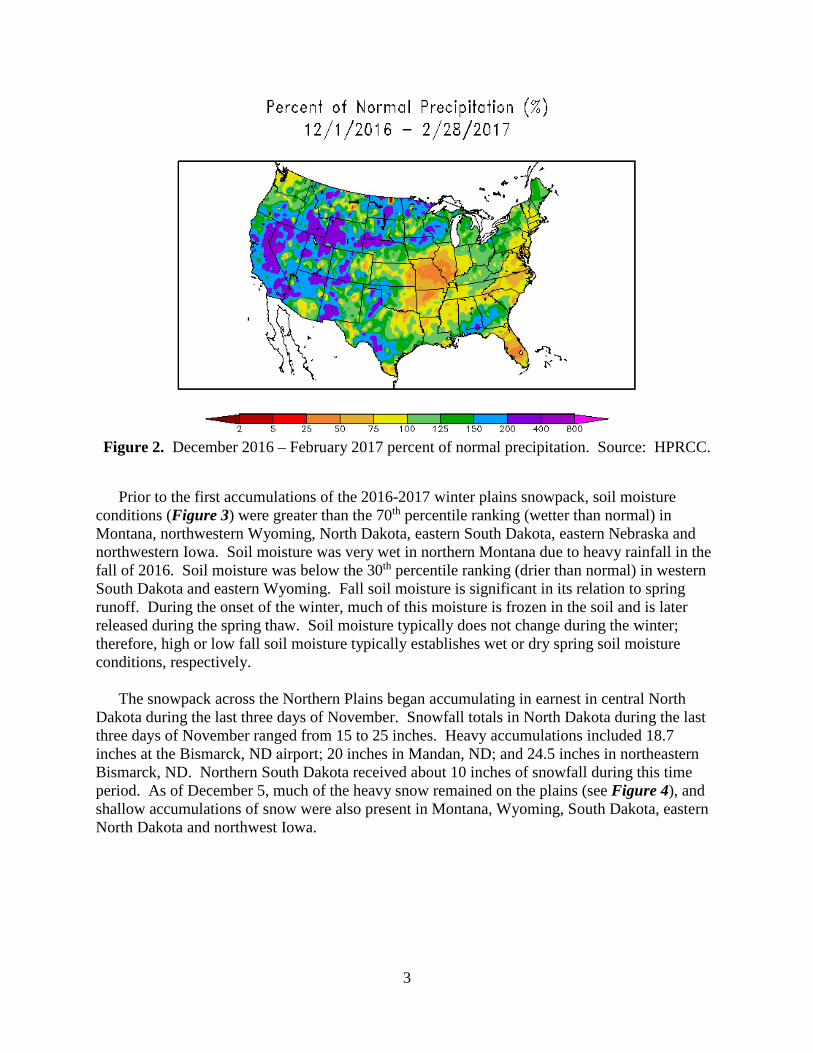
In December heavy plains snowfall occurred over southern Montana, northern Wyoming, North Dakota and northern South Dakota due to heavy precipitation accumulations and well-below-normal temperatures. Significant monthly snowfall amounts during December were 30.4 inches at Billings, MT; 15.9 inches at Great Falls, MT; 24.5 inches at Bismarck, ND; and 13.6 inches at Watertown, SD. Snowpack depths as of December 31, 2016 were greater than 12 inches over much of North Dakota and north-central South Dakota (see Figure 5). The greatest depth of snow in central North Dakota for the Basin was 24 inches near Bismarck.
Figure 5. Snow depth in inches on December 31, 2016.
Moderate precipitation and snowfall accumulations occurred during January. While the Rocky Mountains received well-above-normal precipitation as snowfall, the plains snowfall was more moderate and limited in extent. Temperature departures were well-below normal in Montana, Wyoming, the western Dakotas and western Nebraska, but normal to above normal in the eastern Dakotas and eastern Nebraska. January snowfall amounts ranged from 10 to 15 inches in southern Montana, North Dakota, and northern South Dakota. Very little snow fell in the lower Basin in January. By February 4, moderate to heavy snowpack still covered eastern and southern Montana, Wyoming, North Dakota and north central South Dakota (see Figure 6). Very little plains snowpack was present in north central Montana, eastern South Dakota, Wyoming, and most of the lower Basin.

6
Figure 6. Snow depth in inches on February 4, 2017.
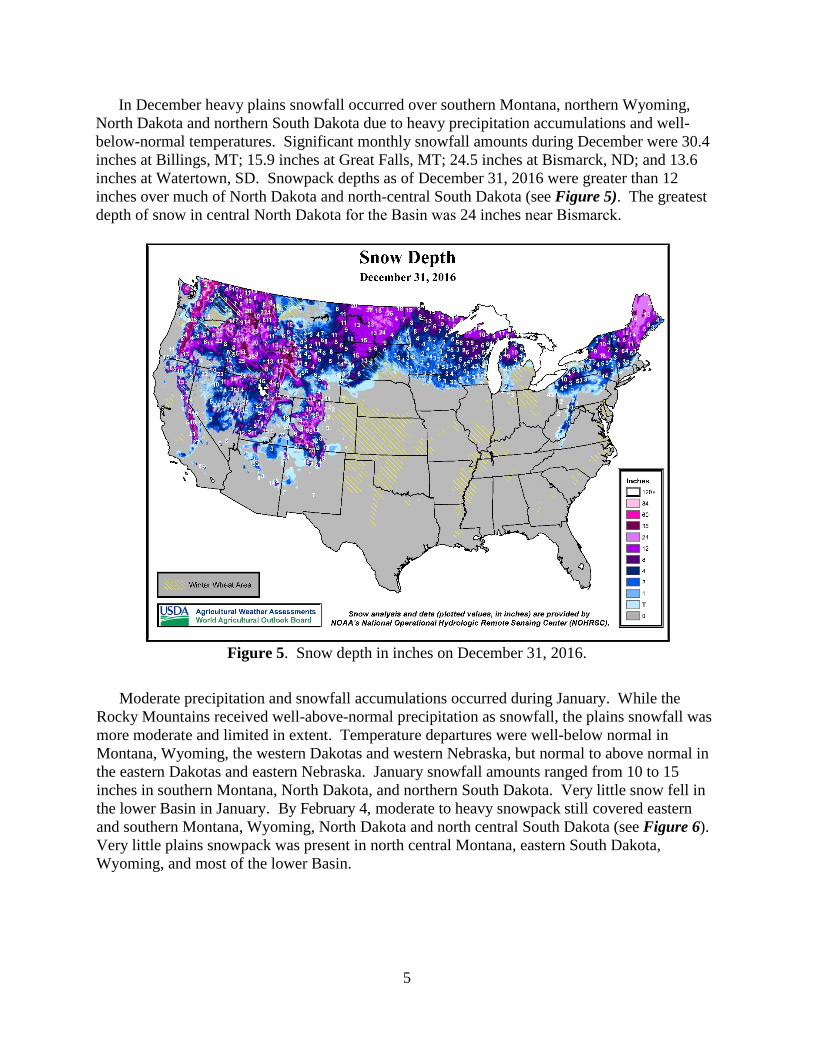
The peak plains snowpack coverage and snow water equivalent (SWE) occurred around February 4. The deepest SWE amounts were present in central North Dakota and north central South Dakota. Amounts in these areas generally ranged from 3 to 6 inches based on the NOAA’s National Operational Hydrologic Remote Sensing Center (NOHRSC) modeled snow assessment shown in Figure 7. In surrounding areas within the upper Basin, plains SWE ranged from 1 to 3 inches. MRBWM cooperative snow observers measured season high SWE amounts of 3.6 inches in Bismarck, ND; 7.3 inches in Beulah, ND; 4.1 inches near Jamestown, ND; 5 inches south of Carrington, ND; and 7.3 inches near McIntosh, SD.
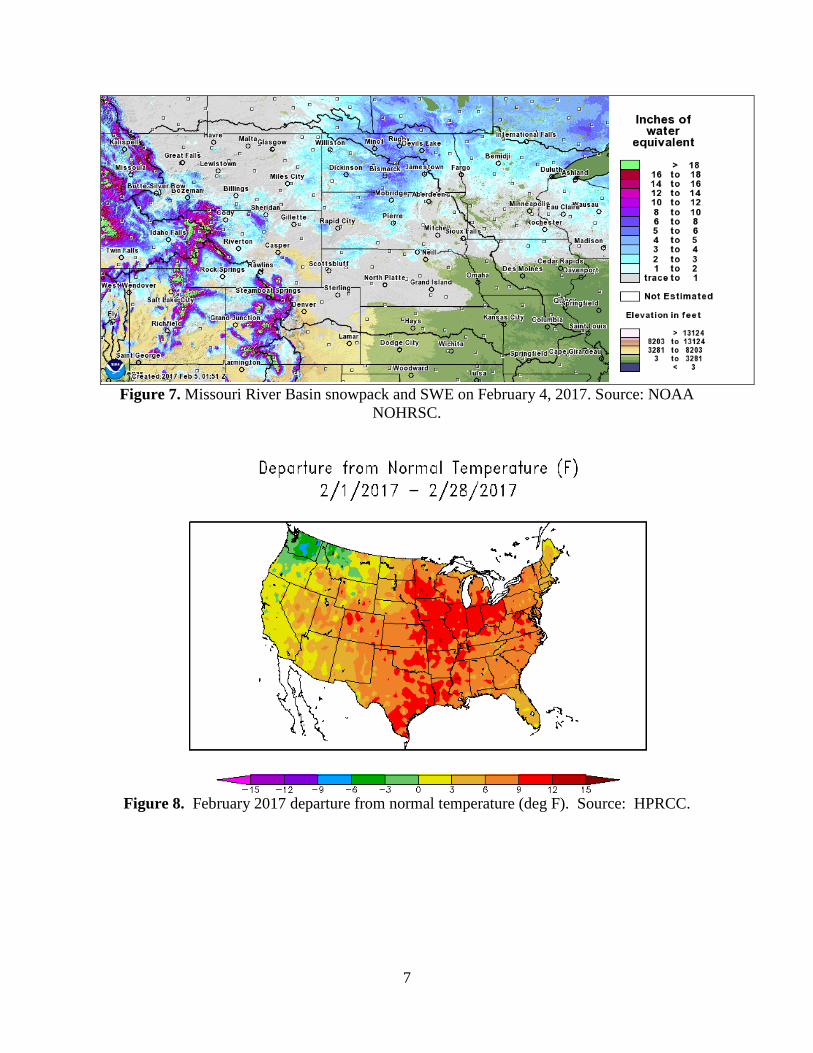
During February, precipitation as snowfall was below normal in the Dakotas and much of the lower Basin, while above-normal precipitation as snowfall continued to occur in Montana and Wyoming. February temperature departures were above normal throughout the plains (see Figure 8). Above-normal February temperatures caused much of the plains snowpack to melt. By March 4, light seasonal plains snowpack remained in central North Dakota with some light amounts also present in central and western Montana (see Figure 9). During March, additional light amounts of SWE less than 1 inch in depth accumulated in the upper Basin.
7
Figure 7. Missouri River Basin snowpack and SWE on February 4, 2017. Source: NOAA NOHRSC.
Figure 8. February 2017 departure from normal temperature (deg F). Source: HPRCC.
8
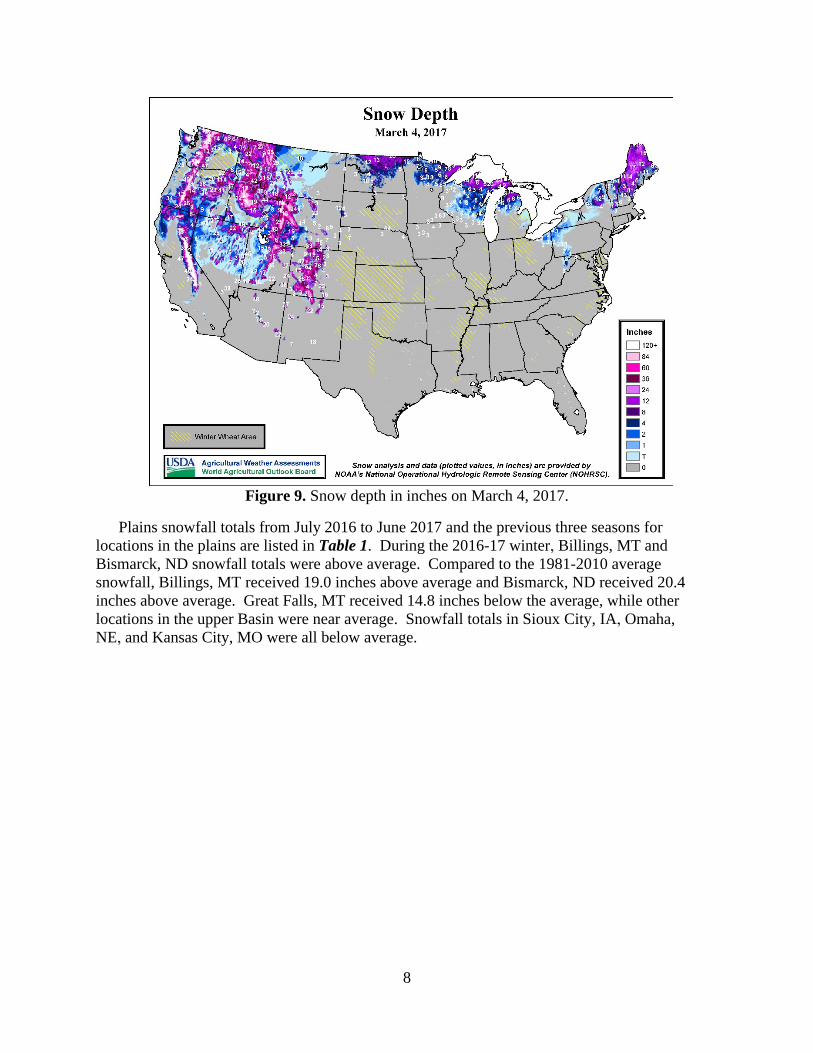
Figure 9. Snow depth in inches on March 4, 2017.
Plains snowfall totals from July 2016 to June 2017 and the previous three seasons for locations in the plains are listed in Table 1. During the 2016-17 winter, Billings, MT and Bismarck, ND snowfall totals were above average. Compared to the 1981-2010 average snowfall, Billings, MT received 19.0 inches above average and Bismarck, ND received 20.4 inches above average. Great Falls, MT received 14.8 inches below the average, while other locations in the upper Basin were near average. Snowfall totals in Sioux City, IA, Omaha, NE, and Kansas City, MO were all below average.

9
Table 1 Missouri River Basin - Plains Snowfall Totals (inches)
Location 2013-14
Total 2014-15
Total 2015-16
Total 2016-17
Total Annual Average
(1981-2010) Billings, MT 103.5* 55.4 28.1 74.1 55.1 Glasgow, MT 30.4 43.2 27.6 37.7 34.6 Great Falls, MT 74.6 57.9 46.9 48.4 63.2 Bismarck, ND 40.5 24.1 24.1 71.6 51.2 Aberdeen, SD 32.7 20.2 26.5 39.9 38.1 Watertown, SD 28.2 25.3 28.7 40.7 35.9 Sioux Falls, SD 45.3 31.9 68.5 42.9 44.5 Sioux City, IA 23.8 21.5 57.6 28.6 34.8 Omaha, NE 17.8 13.8 27.4 11.4 26.4 Kansas City, MO 26.1 14.2 5.9 4.9 18.8
*Maximum of recordSource: NOAA Online Weather Data (NOWData). Totals represent total snowfall from July to June of the following year.
2. Mountain Snowpack
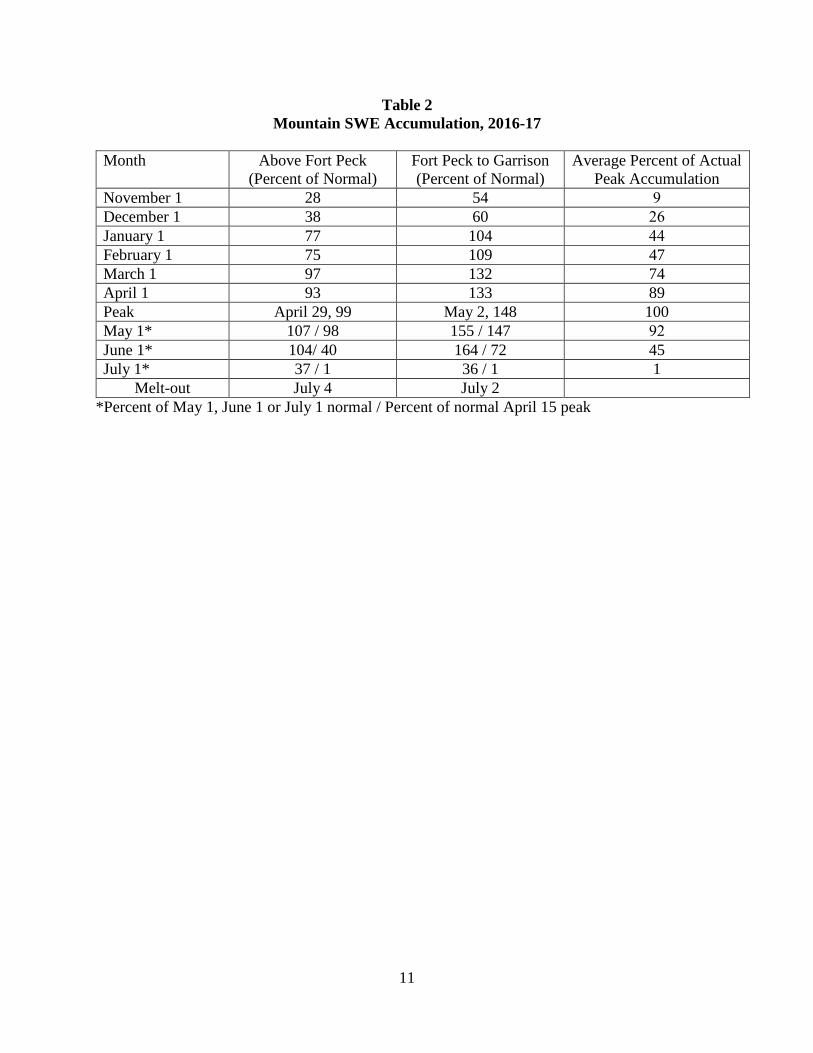
Mountain snowpack is monitored by the U.S. Department of Agriculture (USDA) Natural Resources Conservation Service’s (NRCS) network of SNOwpack TELemetry (SNOTEL) stations. For purposes of monitoring the mountain snowpack and forecasting spring and summer runoff from the Rocky Mountains, average mountain snowpack expressed as inches of SWE is computed from the SNOTEL stations within the reservoir reaches above Fort Peck and from Fort Peck to Garrison. The 2016-17 mountain snowpack accumulation and melt pattern for each of the two reaches is illustrated in Figure 10. Mountain SWE is discussed in the following paragraphs as a percent of the 1981-2010 average SWE occurring on the first day of each month. SWE accumulation for the two reaches is summarized in Table 2, which contains the mountain snowpack as a percent of the seasonal average and as a percent of the normal April 15 snowpack.

10
Figure 10. Missouri River Basin 2016-17 mountain SWE. Data Source: USDA-NRCS National Water and Climate Center.
In the Total above Fort Peck reach, the mountain snowpack was generally below average from October through July. Snowpack was below average until early March when above-normal precipitation began to increase the snow accumulation to average in the reach. Snowpack in the Total above Fort Peck reach was below average during the majority of the accumulation period and peaked at 99 percent of the 1981-2010 average peak on April 29 (see Figure 10). Normally the mountain snowpack peaks in this reach around April 15. Colder-than-normal temperatures and above-normal precipitation during May briefly delayed the mountain snowmelt, but warmer-than-normal temperatures near the end of May and in June caused the snowpack in this reach to melt rapidly. By July 4, all mountain snowpack in this reach as monitored by the SNOTEL network had melted (Table 2).
In the Total Fort Peck to Garrison reach (see Figure 10) snowpack accumulation began slowly. Above-normal precipitation and colder-than-normal temperatures from October to December caused increased accumulation rates beginning in mid-November, particularly in the upper Yellowstone, Wind and Bighorn River basins. The average mountain snowpack in this reach was below average until the middle of December. Mountain snowpack was near normal on January 1 and February 1. By March 1 the snowpack increased to 133 percent of average (Table 2). Continued above-normal precipitation and colder-than-normal temperatures through the end of April resulted in the mountain snowpack in this reach peaking later than normal on May 2 at 148 percent of average. Cold and wet conditions in the reach maintained above-average SWE through early June, when warmer-than-normal temperatures began to cause rapid snowmelt. All mountain snowpack in this reach as monitored by the SNOTEL network had melted by July 2.
11
Table 2 Mountain SWE Accumulation, 2016-17
Month Above Fort Peck (Percent of Normal)
Fort Peck to Garrison (Percent of Normal)
Average Percent of Actual Peak Accumulation
November 1 28 54 9 December 1 38 60 26 January 1 77 104 44 February 1 75 109 47 March 1 97 132 74 April 1 93 133 89 Peak April 29, 99 May 2, 148 100 May 1* 107 / 98 155 / 147 92 June 1* 104/ 40 164 / 72 45 July 1* 37 / 1 36 / 1 1
Melt-out July 4 July 2 *Percent of May 1, June 1 or July 1 normal / Percent of normal April 15 peak

12
3. Weather Conditions
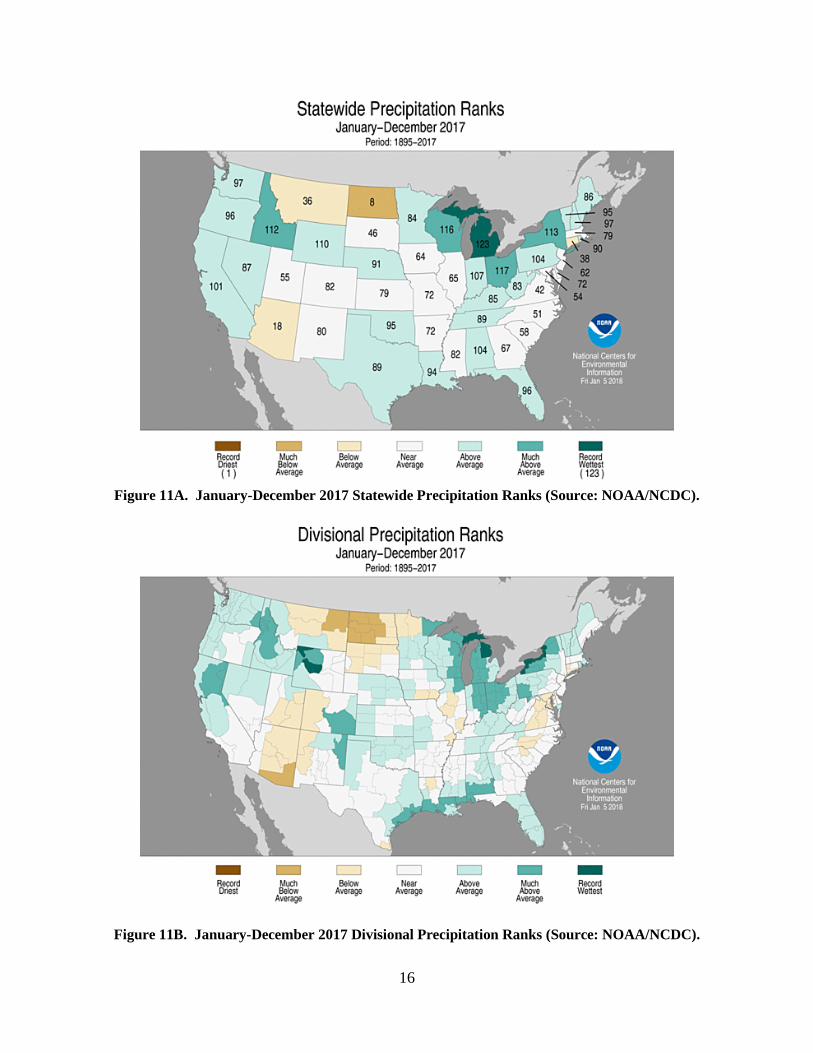
The upper Basin experienced contrasting precipitation conditions and much warmer-than-normal temperatures during 2017. January-December precipitation and temperature statewide rankings for the past 123 years are shown in Figure 11 and Figure 12, respectively. With regard to precipitation rankings, Montana ranked 36th driest (Below Average) and North Dakota ranked 8th driest (Much Below Average). South Dakota was ranked in the Near Average category while Wyoming was ranked in the Above Average category. With regard to temperature rankings, all upper Basin state temperatures were ranked Above Average and Much Above Average (112th coldest or higher). In the lower Basin, precipitation was Above or Near Average, and temperatures were Above Average.
Figure 13 includes the National Drought Mitigation Center’s drought maps of three-month periods during 2017. Figure 14 shows percent of normal precipitation maps for each month of 2017. Figure 15 shows departure from normal temperature maps for three-month periods in 2017.
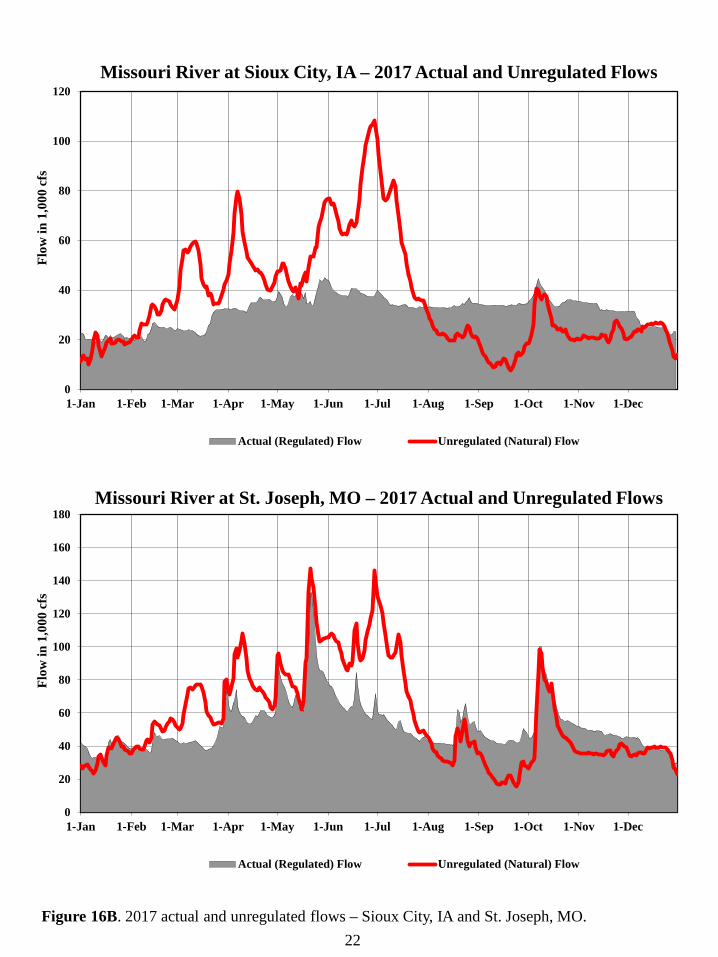
In 2017, the six Mainstem reservoirs on the Missouri River stored excess runoff in their respective Annual Flood Control and Multiple Use Zones and released those stored waters during the drier portions of the year. Plots of the actual or regulated flow versus the unregulated flow are shown in Figure 16A at Wolf Point, MT and Bismarck, ND; in Figure 16B at Sioux City, IA and St. Joseph, MO; and in Figure 16C at Boonville, MO and Hermann, MO. As it relates to actual and unregulated flows on the Missouri River, the following paragraphs describe precipitation and temperature conditions during three-month periods in 2017.
a. January – March
In early January, Moderate Drought (D1) conditions (Figure 13) were present in northeastern Wyoming and western South Dakota. Severe Drought conditions (D2) extended from southwestern South Dakota into Wyoming. Abnormally Dry (D0) conditions were also present in the western Dakotas and Montana, with an area of D1 conditions in western Montana.
During January, precipitation was above normal in much of Wyoming, southern South Dakota, Nebraska and Iowa (see Figure 14). Much of the January precipitation in the eastern Dakotas, Nebraska and Iowa occurred as freezing rain followed by snow; therefore, snowfall was below normal in these regions. January precipitation was above normal in localized areas in Montana and North Dakota, but departures were mixed. In February, above-normal precipitation continued in Wyoming, northern and western Montana and northern Nebraska. Below-normal precipitation occurred from southeastern Montana through South Dakota. In March, western and central Wyoming, and southern and southwestern Montana received above-normal precipitation, while the remaining upper Basin received below-normal precipitation. The eastern Dakotas were particularly dry in March, receiving less than 50 percent of normal precipitation.
The year began with colder-than-normal January temperatures in Montana, Wyoming, western North Dakota and western South Dakota. In the eastern Dakotas, Nebraska and Iowa, January temperatures were normal to slightly warmer than normal. Temperatures in February and March were near normal to warmer than normal in the upper Basin. As a result, January to
13
March temperature departures (see Figure 15) were above normal in the lower Basin, normal to above normal in the upper Basin plains, and normal to below normal in the Rocky Mountains and adjacent plains of Montana and Wyoming.
Winter season precipitation in the plains occurred primarily as snow or freezing rain, and mountain snowpack continued to build from January to March; therefore, high flow events that occurred in February and March in the upper Basin at Wolf Point, MT; Bismarck, ND; and Sioux City, IA (see Figure 16A and Figure 16B) were due primarily to runoff from plains snowpack, which melted in February and March.
b. April – June
By early April, spring snowmelt and precipitation reduced the D2 conditions to D1 conditions in southwestern South Dakota and western Montana (Figure 13). Furthermore, D0 conditions had diminished throughout Montana.
The weather during the April-June period was predominantly dry in the upper Basin with the exception of above-normal precipitation in western Montana and central Wyoming. During the most critical precipitation period for the plains region, precipitation was less than 50 percent of normal in a large portion of northeastern Montana, central and western North Dakota and northern South Dakota. April precipitation ranged from 150 percent of normal to 400 percent of normal in western and southern Montana and Wyoming (Figure 14), leading to above-average mountain snowpack accumulation rates in April. April precipitation totals included 3.3 inches (1.7 inches above normal) in Billings, MT and 4.6 inches (3.0 inches above normal) in Sheridan, WY. In contrast, precipitation was less than 75 percent of normal in much of the upper Basin plains. In the lower Basin, precipitation ranged from 125 to 200 percent of normal in Kansas and Missouri. Lower Basin precipitation totals included 6.0 inches (2.5 inches above normal) in Topeka, KS; 6.9 inches (3.1 inches above normal) in Lawrence, KS; 6.6 inches (2.9 inches above normal) in Kansas City, MO; 7.5 inches (3.2 inches above normal) in Sedalia, MO; 8.8 inches (4.3 inches above normal) in Columbia, MO; and 8.0 inches (3.7 inches above normal) in Jefferson City, MO. Runoff from significant rainfall events in the lower Basin resulted in high inflows into tributary reservoirs as well as high Missouri River flows in early May 2017 (see Figure 16C).
In May and June, below-normal precipitation occurred over most of the upper Basin. Most notably, less than 50 percent of normal precipitation fell over much of Montana, northwestern Wyoming and the Dakotas (Figure 14). In contrast, above-normal precipitation, ranging from 110 to 200 percent of normal, occurred over Nebraska, southeastern South Dakota, western Iowa and north-central Kansas. May monthly totals included 8.0 inches (3.8 inches above normal) in Concordia, KS; 6.3 inches (2.0 inches above normal) in Lincoln, NE; and 7.3 inches (2.7 inches above normal) near Valley, NE. In June, less than 70 percent of normal precipitation occurred over most of the upper Basin, and less than 50 percent of normal precipitation occurred over central and eastern Montana, western North Dakota, much of Wyoming, southern South Dakota and Nebraska.
May and June unregulated peak hydrographs at Wolf Point, MT; Bismarck, ND; and Sioux City, IA (see Figure 16A and Figure 16B) were primarily influenced by mountain snowmelt and

14
above-normal rainfall that occurred over Wyoming and southern Montana in April. Due to the dominance of mountain snowpack runoff on the unregulated peak flows at these locations, the influence of rainfall runoff is indistinguishable from snowmelt runoff. Figures 16A through 16C indicate how regulation of the System greatly reduced peak unregulated flows from Wolf Point to Sioux City, IA; however, the precipitation and runoff downstream of Sioux City reduces the effect of reservoir regulation. The heavy precipitation that occurred downstream of the System over southeastern South Dakota, Nebraska, and western Iowa, was the main cause of the late May actual and unregulated peak flow observed at St. Joseph, MO (see Figure 16B).
April–June temperatures (Figure 15) were generally 0 to 2 deg F above normal over most of the upper Basin with temperature departures ranging from 2 to 4 deg F above normal in Montana, western North Dakota and western South Dakota. Temperatures were also slightly above normal in the lower Basin.
c. July – September
Due to dry conditions in the upper Basin, drought conditions rapidly intensified from April through June (Figure 13). In early July, D2 conditions covered the eastern half of Montana, much of North Dakota, and northern South Dakota, while D1 and D0 conditions covered a larger area encompassing the D2 conditions. Extreme Drought (D3) conditions developed in northeastern Montana, western North Dakota and northern South Dakota.
Precipitation as a percent of normal varied greatly from month-to-month during the July – September period. Precipitation was well below normal in most of the Basin during July. Large areas of less than 50 percent of normal precipitation covered Montana, central Wyoming, North Dakota, South Dakota, Iowa and Kansas (see Figure 14). Dry conditions continued into August in Montana and Wyoming, where precipitation was less than 50 percent of normal in Montana, but mixed in Wyoming. In contrast, August precipitation was well above normal in North Dakota and South Dakota. In North Dakota, Williston received 3.7 inches of precipitation (2.3 inches above normal), and Bismarck received 5.1 inches of precipitation (2.8 inches above normal). Sioux Falls, SD received 5.4 inches of precipitation (2.4 inches above normal), and Sioux City, IA received 8.2 inches of precipitation (4.9 inches above normal). As a result, August runoff in the Oahe and Fort Randall reaches was more than three times the average monthly runoff, and runoff in the Gavins Point and Sioux City reaches was well above average (see Table 4). In Missouri, August precipitation totals included 10.2 inches (6.3 inches above normal) in Kansas City, MO; 11.3 inches (6.8 inches above normal) in Lee’s Summit, MO; and 5.7 inches (1.4 inches above normal) in Jefferson, City, MO.
During July and August, areas of localized heavy precipitation in Missouri resulted in high Missouri River flow events at Boonville, MO and Hermann, MO (see Figure 16C). Travel time of Gavins Point releases to Boonville and Hermann are 8 and 9 days, respectively. The slight difference between unregulated and actual (regulated) flows during these events demonstrates how the System may not be able to provide much flood reduction benefit when suddenly-developing rainfall events downstream of the System occur.
15
In September, above-normal precipitation continued in the Dakotas and Nebraska, and it extended westward into Montana and Wyoming. Some notable September totals were 2.7 inches (1.4 inches above normal) at Billings, MT; 3.3 inches (2.0 inches above normal) at Lake Yellowstone, WY; and 5.4 inches (2.8 inches above normal) at Watertown, SD. Although the recent heavy precipitation in the upper Basin did not have any influence on the unregulated flows from Wolf Point, MT to Sioux City, IA (see Figure 16A and Figure 16B), it did help to alleviate drought conditions in the upper Basin.
July – September temperatures (Figure 15) were generally near normal in the lower Basin and the Dakotas. Temperatures in Montana ranged from 1 to 4 deg F above normal, while temperatures in Wyoming ranged from 0 to 2 deg F below normal in the interior of the state, to slightly above normal in the outer regions of Wyoming.
d. October – December
Dry summer conditions in Montana led to further expansion of the D2 and D3 drought conditions, shown in early October in Figure 13, across northern and central Montana. Exceptional Drought (D4) conditions developed in north-central Montana. Areas of above-normal precipitation in central North Dakota led to some drought condition improvement; however, the dry conditions in western South Dakota led to the development of D3 drought conditions. Wetter-than-normal conditions reduced drought impacts in central Nebraska; however, the dry conditions in July–September in Kansas led to new drought development.
In October, the dry pattern returned to the upper Basin resulting in much of the upper Basin plains receiving less than 25 percent of normal precipitation (Figure 14). In contrast, precipitation in the southeastern portion of the upper Basin and the entire lower Basin was well above normal. Some notable October precipitation totals included 5.3 inches (3.1 inches above normal) at Sioux Falls, SD; 6.8 inches (4.7 inches above normal) at Sioux City, IA; 4.1 inches (1.9 inches above normal) at Omaha, NE; 4.1 inches (1.3 inches above normal) at St. Joseph, MO; 4.9 inches (1.7 inches above normal) at Kansas City, MO; and 6.6 inches (3.3 inches above normal) at Kirksville, MO. The occurrence of this precipitation caused a similar rise in both actual and unregulated flow in the Missouri River from St. Joseph, MO (Figure 16B) to Hermann, MO (Figure 16C) in October.
In November, the dry pattern moved eastward into the plains resulting in less than 25 percent of normal precipitation in the Dakotas, Nebraska, Kansas, Iowa and Missouri (Figure 14). With the development of weak La Niña climate conditions, the weather pattern favored above-normal precipitation in the Rocky Mountains and plains in Montana and Wyoming in November and December. Southwestern Montana and northwestern Wyoming were particularly wet, receiving greater than 200 percent of normal precipitation in both November and December.
Temperatures during the October–December period ranged from normal to 2 deg F above normal throughout a majority of the Missouri Basin (Figure 15). Three-month temperatures were normal to below normal in central and western Montana, and 2 to 4 deg F above normal in southern Wyoming and Colorado.
16
Figure 11A. January-December 2017 Statewide Precipitation Ranks (Source: NOAA/NCDC).
Figure 11B. January-December 2017 Divisional Precipitation Ranks (Source: NOAA/NCDC).

17
Figure 12A. January-December 2017 Statewide Temperature Ranks (Source: NOAA/NCDC).
Figure 12B. January-December 2017 Divisional Temperature Ranks (Source: NOAA/NCDC).

18
Figure 13. The National Drought Mitigation Center’s drought maps for early January, April, July and October 2017.

19
January 2017 February 2017 March 2017 April 2017
May 2017 June 2017 July 2017 August 2017
September 2017 October 2017 November 2017 December 2017 Figure 14. Percent of normal precipitation maps for 2017, by month. Reformatted from the High Plains Regional Climate Center
Climate Summary Maps.

Figure 15. Departure from normal temperature (deg F) for the 2017 three-month periods: January-March, April-June, July-September and October-December. Reformatted from the High Plains Regional Climate Center Climate Summary Maps.
20
January - March 2017 April - June 2017
July - September 2017 October - December 2017

0
5
10
15
20
25
30
35
40
1-Jan 1-Feb 1-Mar 1-Apr 1-May 1-Jun 1-Jul 1-Aug 1-Sep 1-Oct 1-Nov 1-Dec
Flow
in 1
,000
cfs
Actual (Regulated) Flow* Unregulated (Natural) Flow
0
20
40
60
80
100
120
1-Jan 1-Feb 1-Mar 1-Apr 1-May 1-Jun 1-Jul 1-Aug 1-Sep 1-Oct 1-Nov 1-Dec
Flow
in 1
,000
cfs
Actual (Regulated) Flow** Unregulated (Natural) Flow
Missouri River at Wolf Point, MT – 2017 Actual and Unregulated Flows
Missouri River at Bismarck, ND – 2017 Actual and Unregulated Flows
Figure 16A. 2017 actual and unregulated flows – Wolf Point, MT and Bismarck, ND. 21
*Actual flow prior to March 8, 2017 and after December 25, 2017 is ice affected.
**Actual flow prior to March 22, 2017 and after December 22, 2017 is ice affected.
0
20
40
60
80
100
120
1-Jan 1-Feb 1-Mar 1-Apr 1-May 1-Jun 1-Jul 1-Aug 1-Sep 1-Oct 1-Nov 1-Dec
Flow
in 1
,000
cfs
Actual (Regulated) Flow Unregulated (Natural) Flow
0
20
40
60
80
100
120
140
160
180
1-Jan 1-Feb 1-Mar 1-Apr 1-May 1-Jun 1-Jul 1-Aug 1-Sep 1-Oct 1-Nov 1-Dec
Flow
in 1
,000
cfs
Actual (Regulated) Flow Unregulated (Natural) Flow
Missouri River at Sioux City, IA – 2017 Actual and Unregulated Flows
Missouri River at St. Joseph, MO – 2017 Actual and Unregulated Flows
Figure 16B. 2017 actual and unregulated flows – Sioux City, IA and St. Joseph, MO. 22

0
50
100
150
200
250
300
350
400
1-Jan 1-Feb 1-Mar 1-Apr 1-May 1-Jun 1-Jul 1-Aug 1-Sep 1-Oct 1-Nov 1-Dec
Flow
in 1
,000
cfs
Actual (Regulated) Flow Unregulated (Natural) Flow
0
100
200
300
400
500
600
700
800
1-Jan 1-Feb 1-Mar 1-Apr 1-May 1-Jun 1-Jul 1-Aug 1-Sep 1-Oct 1-Nov 1-Dec
Flow
in 1
,000
cfs
Actual (Regulated) Flow Unregulated (Natural) Flow
Missouri River at Boonville, MO – 2017 Actual and Unregulated Flows
Missouri River at Hermann, MO – 2017 Actual and Unregulated Flows
Figure 16C. 2017 actual and unregulated flows – Boonville, MO and Hermann, MO. 23

24
4. 2017 Calendar Year Runoff
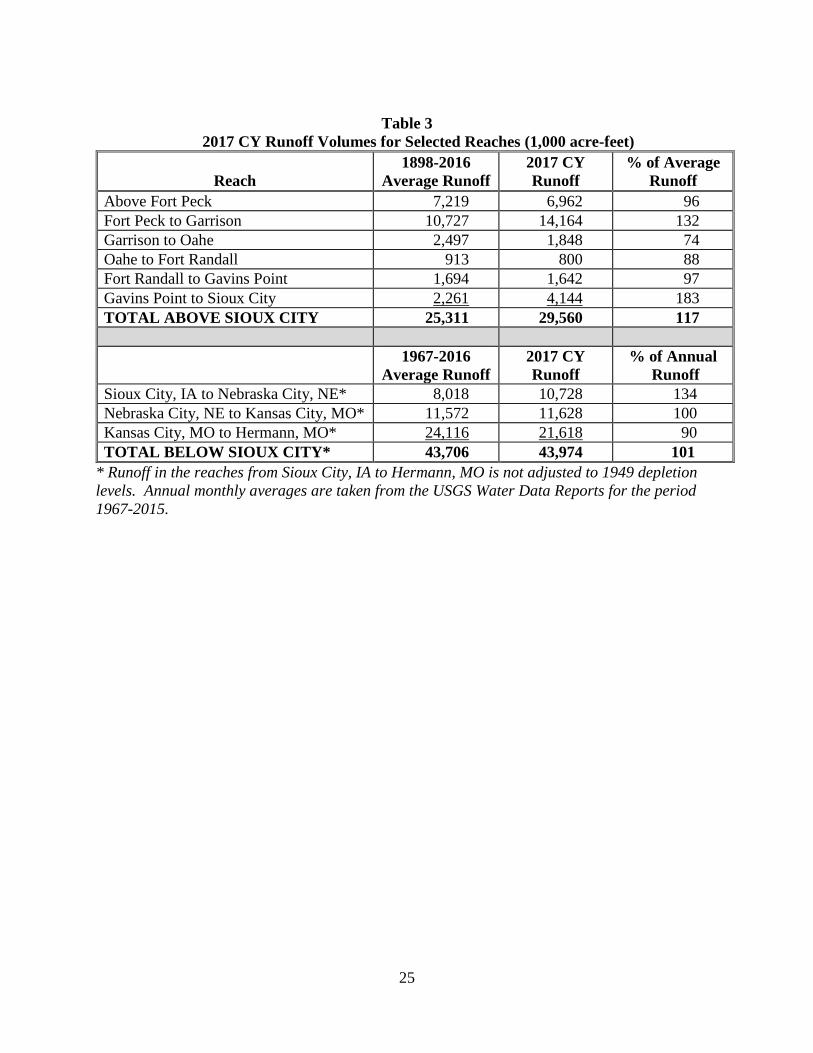
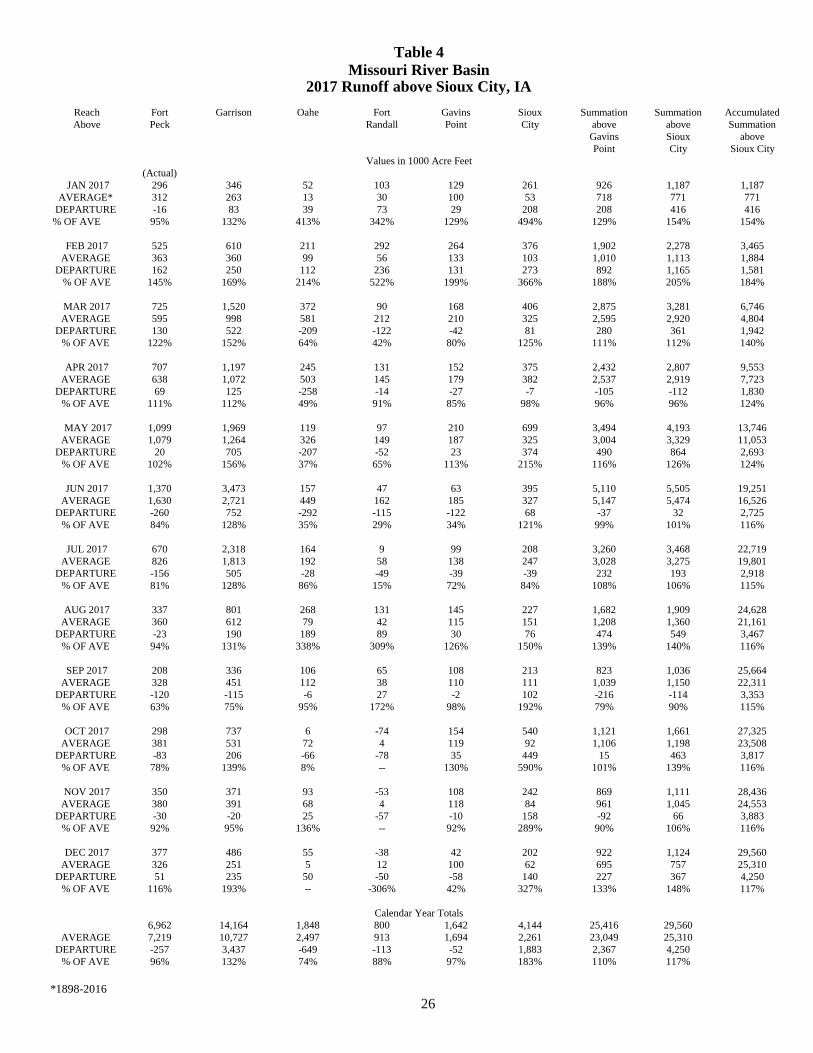
The 2017 unregulated runoff volume for the upper Basin above Sioux City, IA totaled 29.6 million acre-feet (MAF), 117 percent of average, based on the historical period of 1898-2016, as shown in Table 3 and Figure 17. Table 4 lists the runoff for the upper Basin by month and reach and is the adjusted compilation of the runoff into the System. As the year progresses, this table is filled in with observed monthly runoff data for those months that have occurred and with forecasted runoff data for the remaining months in the year. This forecast forms a basis for intra-system balancing of storage accumulated in the System and is updated by MRBWM on the first of each month to forecast the runoff for the remainder of the year. The monthly accumulation of actual runoff is shown under the "Accumulated Summation above Sioux City" column. As the season progresses, more of the actual runoff is accumulated, and the estimate of annual runoff volume becomes more reliable. The majority of the annual runoff has usually occurred by the end of July, and the remainder of the year can be estimated with a greater degree of accuracy. Table 3 compares 2017 monthly and calendar year totals to the 1898-2016 historic period of record.
Total runoff in the lower Basin, from Sioux City, IA to Hermann, MO totaled 44.0 MAF, 101 percent of average (see Table 3). Of the six reaches in the upper Basin (above Sioux City) outlined in Table 3, runoff was above average in Fort Peck to Garrison and the Gavins Point to Sioux City reaches. Runoff was below average in the other four reaches in the upper Basin. Of the three reaches in the lower Basin, the runoff in the reach between Sioux City, IA and Nebraska City, NE was above average, average in the reach between Nebraska City and Kansas City, MO, and below average in the reach from Kansas City to Hermann, MO.
Figure 18 illustrates the monthly variation of the runoff summation above Sioux City, IA compared to the long-term average variation of runoff based on the 1898-2016 historic period. Runoff in January (154%) and February (205%) was above average due to warmer-than-normal temperatures melting much of the plains snowpack. Runoff in March (112%) and April (96%) was about average. Runoff during these two months was primarily from rainfall runoff. During the May-July period, when mountain snow is melting and spring rains are occurring, runoff in the Garrison reach was above average; however, the rest of the upper basin experienced normal to below-normal runoff. About 50 percent of the annual upper basin runoff historically occurs in the May-July period. In 2017, the May-July upper basin runoff was 13.2 MAF, 110 percent of average. About 20 percent of the annual upper basin runoff historically occurs in the August-December period. In 2017, the August-December upper basin runoff was 6.8 MAF, 124 percent of average.
25
Table 3 2017 CY Runoff Volumes for Selected Reaches (1,000 acre-feet)
Reach 1898-2016
Average Runoff 2017 CY Runoff
% of Average Runoff
Above Fort Peck 7,219 6,962 96 Fort Peck to Garrison 10,727 14,164 132 Garrison to Oahe 2,497 1,848 74 Oahe to Fort Randall 913 800 88 Fort Randall to Gavins Point 1,694 1,642 97 Gavins Point to Sioux City 2,261 4,144 183 TOTAL ABOVE SIOUX CITY 25,311 29,560 117
1967-2016 Average Runoff
2017 CY Runoff
% of Annual Runoff
Sioux City, IA to Nebraska City, NE* 8,018 10,728 134 Nebraska City, NE to Kansas City, MO* 11,572 11,628 100 Kansas City, MO to Hermann, MO* 24,116 21,618 90 TOTAL BELOW SIOUX CITY* 43,706 43,974 101
* Runoff in the reaches from Sioux City, IA to Hermann, MO is not adjusted to 1949 depletionlevels. Annual monthly averages are taken from the USGS Water Data Reports for the period 1967-2015.
Reach Fort Garrison Oahe Fort Gavins Sioux Summation Summation Accumulated
Above Peck Randall Point City above above Summation
Gavins Sioux above
Point City Sioux City
(Actual)
JAN 2017 296 346 52 103 129 261 926 1,187 1,187
AVERAGE* 312 263 13 30 100 53 718 771 771
DEPARTURE -16 83 39 73 29 208 208 416 416
% OF AVE 95% 132% 413% 342% 129% 494% 129% 154% 154%
FEB 2017 525 610 211 292 264 376 1,902 2,278 3,465
AVERAGE 363 360 99 56 133 103 1,010 1,113 1,884
DEPARTURE 162 250 112 236 131 273 892 1,165 1,581
% OF AVE 145% 169% 214% 522% 199% 366% 188% 205% 184%
MAR 2017 725 1,520 372 90 168 406 2,875 3,281 6,746
AVERAGE 595 998 581 212 210 325 2,595 2,920 4,804
DEPARTURE 130 522 -209 -122 -42 81 280 361 1,942
% OF AVE 122% 152% 64% 42% 80% 125% 111% 112% 140%
APR 2017 707 1,197 245 131 152 375 2,432 2,807 9,553
AVERAGE 638 1,072 503 145 179 382 2,537 2,919 7,723
DEPARTURE 69 125 -258 -14 -27 -7 -105 -112 1,830
% OF AVE 111% 112% 49% 91% 85% 98% 96% 96% 124%
MAY 2017 1,099 1,969 119 97 210 699 3,494 4,193 13,746
AVERAGE 1,079 1,264 326 149 187 325 3,004 3,329 11,053
DEPARTURE 20 705 -207 -52 23 374 490 864 2,693
% OF AVE 102% 156% 37% 65% 113% 215% 116% 126% 124%
JUN 2017 1,370 3,473 157 47 63 395 5,110 5,505 19,251
AVERAGE 1,630 2,721 449 162 185 327 5,147 5,474 16,526
DEPARTURE -260 752 -292 -115 -122 68 -37 32 2,725
% OF AVE 84% 128% 35% 29% 34% 121% 99% 101% 116%
JUL 2017 670 2,318 164 9 99 208 3,260 3,468 22,719
AVERAGE 826 1,813 192 58 138 247 3,028 3,275 19,801
DEPARTURE -156 505 -28 -49 -39 -39 232 193 2,918
% OF AVE 81% 128% 86% 15% 72% 84% 108% 106% 115%
AUG 2017 337 801 268 131 145 227 1,682 1,909 24,628
AVERAGE 360 612 79 42 115 151 1,208 1,360 21,161
DEPARTURE -23 190 189 89 30 76 474 549 3,467
% OF AVE 94% 131% 338% 309% 126% 150% 139% 140% 116%
SEP 2017 208 336 106 65 108 213 823 1,036 25,664
AVERAGE 328 451 112 38 110 111 1,039 1,150 22,311
DEPARTURE -120 -115 -6 27 -2 102 -216 -114 3,353
% OF AVE 63% 75% 95% 172% 98% 192% 79% 90% 115%
OCT 2017 298 737 6 -74 154 540 1,121 1,661 27,325
AVERAGE 381 531 72 4 119 92 1,106 1,198 23,508
DEPARTURE -83 206 -66 -78 35 449 15 463 3,817
% OF AVE 78% 139% 8% -- 130% 590% 101% 139% 116%
NOV 2017 350 371 93 -53 108 242 869 1,111 28,436
AVERAGE 380 391 68 4 118 84 961 1,045 24,553
DEPARTURE -30 -20 25 -57 -10 158 -92 66 3,883
% OF AVE 92% 95% 136% -- 92% 289% 90% 106% 116%
DEC 2017 377 486 55 -38 42 202 922 1,124 29,560
AVERAGE 326 251 5 12 100 62 695 757 25,310
DEPARTURE 51 235 50 -50 -58 140 227 367 4,250
% OF AVE 116% 193% -- -306% 42% 327% 133% 148% 117%
Calendar Year Totals
6,962 14,164 1,848 800 1,642 4,144 25,416 29,560
AVERAGE 7,219 10,727 2,497 913 1,694 2,261 23,049 25,310
DEPARTURE -257 3,437 -649 -113 -52 1,883 2,367 4,250
% OF AVE 96% 132% 74% 88% 97% 183% 110% 117%
*1898-2016
26
Table 4
2017 Runoff above Sioux City, IAMissouri River Basin
Values in 1000 Acre Feet

27

28

29
C. System Regulation – January to December 2017
1. Basin Conditions and System Regulation
Runoff above Sioux City, IA in 2017 was 29.6 MAF, 117 percent of average (Table 4). Runoff in 2016 was 24.1 MAF, 95 percent of average. Because System storage was in the Annual Flood Control and Multiple Use Zone almost the entire year, good service was provided to all authorized purposes in 2017.
a. Conditions in January and February
System storage reached 56.1 MAF, the base of the Annual Flood Control and Multiple Use Zone on January 3, when all the stored flood waters from 2016 were evacuated. The 2017 runoff season started in early January when warmer-than-normal temperatures in the upper Basin resulted in some melting of the plains snow. As seen on Table 4, runoff was above average in January and February. On February 1 the mountain snowpack SWE was 77 percent of average in the Fort Peck reach and 104 percent of average in the Garrison reach (see Table 2).
b. Conditions on March 1
On March 1 the System storage was 57.1 MAF, 1.0 MAF above the base of the Annual Flood Control and Multiple Use Zone. There was very light plains snow cover over most of the upper Basin on March 1. Isolated areas of moderate to heavy snowpack were present in central North Dakota. Soil moisture conditions in early March were generally wetter than normal in Wyoming, Montana, North Dakota and South Dakota (Figure 19). Soil moisture was very wet in western Wyoming and central and northern Montana. Dry soil moisture conditions were present in eastern Wyoming, western South Dakota, Nebraska, Kansas and Missouri. March-April runoff was expected to be slightly above average in the upper Basin due to 1) the wetter-than-normal soil conditions in Montana, Wyoming and North Dakota and 2) the CPC outlook for above-normal precipitation in March and April. By March 1, mountain SWE increased to 97 percent of average in the Fort Peck reach. In the Fort Peck to Garrison reach, mountain SWE was 132 percent of average, due to above-normal precipitation in the mountains in February (see Figure 10). The March 1 annual runoff forecast was 29.1 MAF, 115 percent of average. Per the Master Manual, the March 15 System storage check of 57.4 MAF set navigation flow support to the full service flow level for the first half of the navigation season. System releases were increased to 26,000 cfs beginning on March 22 to begin full service flow support on the Missouri River at all four downstream navigation target locations.
c. Conditions on April 1
System storage on April 1 was 58.4 MAF, 2.3 MAF above the base of the Annual Flood Control and Multiple Use Zone. Precipitation during the January-March period was well-above normal in Montana, Wyoming and Nebraska, while it was generally normal to below normal in the Dakotas (see Figure 14). Temperatures during the January-March period were below normal in Montana, Wyoming and the western Dakotas (see Figure 15), but were above normal in the eastern Dakotas and the lower Basin. The March runoff summation (Table 4) above Sioux City

30
was 3.3 MAF, 112 percent of average, and the accumulated runoff through March was 6.7 MAF, 140 percent of average. Very little plains snowpack remained in early March (see Figure 9).
Figure 19. Soil moisture ranking percentile, March 2, 2017. Source: NOAA National Centers for Environmental Prediction, North American Land Data Assimilation Systems.
On April 1, the mountain SWE was 93 percent of the April 1 average above Fort Peck and 133 percent of average in the Fort Peck to Garrison reach. The April 1 annual runoff forecast was 29.4 MAF, 116 percent of average. Although mountain snowpack normally peaks around April 15, snow continued to accumulate in the Fort Peck and Garrison reaches due to above- normal precipitation and below-normal temperatures in the Rocky Mountains. The mountain snowpack SWE peaked on April 29 at 99 percent of the average peak above Fort Peck and on May 2 at 148 percent of the average peak from Fort Peck to Garrison (Table 2). April runoff was 2.8 MAF, 96 percent of average.
Based on the April 1 calendar year runoff forecast above Gavins Point, System and tributary storage, and Plate VI-I of the Master Manual, the service level was increased, or expanded, from 35,000 to 40,000 cfs.
In early April (see Figure 13) Abnormally Dry (D0) drought conditions were present in southwestern Montana, northeastern Wyoming, western South Dakota and southwestern North Dakota. Moderate Drought (D1) conditions were present in northeastern Wyoming and western South Dakota. Soil moisture decreased slightly in the plains due to below-normal precipitation, but soil conditions improved in the mountainous regions including the Black Hills of South Dakota due to mountain precipitation.

31
d. Conditions on May 1
The May 1 annual runoff forecast was increased to 29.7 MAF, 117 percent of average, due to the high peak snowpack accumulation in the Fort Peck to Garrison reach and the CPC outlook for above-normal precipitation in the upper Basin from May through July. System storage on May 1 was 58.9 MAF, 2.8 MAF above the base of the Annual Flood Control and Multiple Use Zone.
May precipitation was below normal in much of the upper Basin and above normal in the lower Basin (see Figure 14). Although precipitation was generally below normal, localized precipitation in southeastern South Dakota and Nebraska resulted in above-average runoff in the Gavins Point and Sioux City reaches. The seasonal mountain snowmelt began in earnest in May and was the main factor in above-average runoff in the Fort Peck and Garrison reaches. May runoff was 4.2 MAF, 126 percent of average (see Table 4).
e. Conditions in June and July
System storage continued to increase to a June 1 level of 60.3 MAF, 4.2 MAF above the base of the Annual Flood Control and Multiple Use Zone. The June 1 annual runoff forecast was 29.9 MAF, 118 percent of average. June precipitation was well-below average (Figure 14) and temperatures were above average in the Basin. June runoff was 5.5 MAF, 101 percent of average. Runoff was 128 percent of average in the Garrison reach and 121 percent of average in the Sioux City reach; however, runoff was well-below average in all other reaches.
As of July 1, System storage was 61.8 MAF, 5.7 MAF above the base of the Annual Flood Control and Multiple Use Zone. System storage peaked at 61.8 MAF on July 10, occupying about 35 percent of the System's 16.3 MAF designated flood control storage space. Based on the July 1 System storage check of 61.8 MAF, the expanded service level was reduced to full service navigation flow support for the second half of the navigation season. The reduction in service level reflected the expansion of drought conditions in the upper Basin. The July 1 annual runoff forecast was reduced to 28.5 MAF, 113 percent of average, due to the rapid decline of the mountain snowpack in June and the rapidly developing Extreme (D3) Drought conditions in the plains. June and July precipitation was well-below normal in the upper Basin. July runoff was 3.5 MAF, 106 percent of average.
f. Conditions from August through December
August 1 System storage was 61.4 MAF, 5.3 MAF above the base of the Annual Flood Control and Multiple Use Zone. The August 1 annual runoff forecast was 27.9 MAF, 110 percent of average and reflected continuing drought development in the upper Basin. August precipitation was well-above normal in the Dakotas, Nebraska and northwestern Iowa, but precipitation was well-below normal in Montana, parts of Wyoming and western South Dakota. As a result of the above-average precipitation in the Dakotas and Nebraska, August runoff was 1.9 MAF, 140 percent of average.

32
September 1 System storage was 60.4 MAF, 4.3 MAF above the base of the Annual Flood Control and Multiple Use Zone. Based on the September 1 System storage check, the Gavins Point winter release would be at least 17,000 cfs. The September 1 and October 1 annual runoff forecasts were 28.7 MAF, 113 percent of average, and 28.5 MAF, 112 percent of average, respectively. Large areas of heavy precipitation occurred from mid to late September throughout the upper Basin (see Figure 14); however, runoff in September was 1.0 MAF, 90 percent of average, due to continuing drought conditions in the upper Basin. Despite the below normal precipitation in much of the upper Basin in October, October runoff was above average. The October runoff of 1.7 MAF, 139 percent of average, was a result of late September precipitation, some of which fell as snow in the mountains, and was realized as runoff in October.
November 1 System storage was 58.2 MAF, 2.1 MAF above the base of the Annual Flood Control and Multiple Use Zone. The November 1 annual runoff forecast was 29.2 MAF, 115 percent of average. November precipitation in the upper Basin was generally below normal in the plains of northeastern Montana, North Dakota, South Dakota and the entire lower Basin. In contrast, precipitation was above normal in the remainder of Montana and Wyoming (see Figure 14). November runoff was 1.1 MAF, 106 percent of average. To hasten the evacuation of the remaining 2.1 MAF of stored flood waters, the navigation season was extended 10 days and Gavins Point winter releases were set at 21,500 cfs.
December 1 System storage was 57.3 MAF, 1.2 MAF above the base of the Annual Flood Control and Multiple Use Zone. The runoff forecast on December 1 was raised to 29.4 MAF, 116 percent of average. December runoff was 1.1 MAF, 148 percent of average, due to the warmer temperatures in December, which allowed open water conditions to continue on the Missouri River and its tributaries above the System reservoirs. System storage on December 31 was 56.5 MAF, 0.4 MAF above the base of the Annual Flood Control and Multiple Use Zone, which was scheduled to be evacuated during the remainder of the winter season (January-February of 2018).

33
2. Fort Peck Regulation – January to December 2016
a. General
Fort Peck, the third largest Corps storage reservoir, serves all authorized purposes. Fort Peck’s primary functions are: (1) to capture the snowmelt runoff and localized rainfall runoff from the large drainage area above Fort Peck Dam, which are metered out at controlled release rates to meet the authorized purposes while reducing flood damages in the Fort Peck to Garrison reach; (2) to serve as a secondary storage location for water accumulated in the System reservoirs from reduced System releases due to major downstream flood control regulation, thus helping to alleviate large pool increases in Garrison, Oahe and Fort Randall; and (3) to provide the water needed to meet all authorized purposes that draft storage during low-water years.
Table 5 lists the average monthly inflows and releases and the end-of-month (EOM) pool elevation for Fort Peck for 2016 and 2017 as well as the averages since the System first filled in 1967.
Table 5 Fort Peck – Inflows, Releases and Elevations
Month
Monthly Inflow (cfs) Monthly Release (cfs) EOM Elevation (feet)
2017 2016 1967-2016 2017 2016 1967-
2016 2017 2016 1967-2016
January 5,900 5,400 7,200 6,700 6,800 10,400 2233.9 2233.8 2227.5 February 9,100 7,200 8,600 5,000 6,200 10,700 2234.9 2234.1 2226.9 March 9,400 5,900 11,600 4,700 6,000 7,800 2236.2 2233.9 2228.0 April 10,300 7,600 10,100 6,300 6,500 7,300 2237.2 2234.2 2228.8 May 15,700 13,600 15,500 8,700 7,400 9,000 2239.1 2235.9 2230.5 June 15,200 9,400 19,300 9,800 8,600 10,400 2240.2 2235.8 2232.8 July 7,200 6,900 12,000 9,900 8,300 10,400 2238.9 2235.1 2232.9 August 6,300 5,500 7,900 10,100 8,000 10,000 2237.5 2233.8 2231.8 September 6,400 6,400 7,700 7,500 6,300 8,800 2236.8 2233.4 2230.9 October 6,300 11,000 7,400 5,800 4,600 7,800 2236.4 2234.8 2230.4 November 6,600 7,000 7,100 6,000 4,900 8,100 2236.0 2235.0 2229.8 December 7,100 4,800 6,500 6,800 6,500 9,200 2235.8 2234.1 2228.7
b. Winter Season 2016-17
The Fort Peck reservoir level was at elevation 2235.0 feet on December 1, 2016, 1.0 foot above the base of the Annual Flood Control and Multiple Use Zone and 0.5 foot above the previous year’s level. The reservoir reached elevation 2234.0 feet, the base of the Annual Flood Control Multiple Use Zone, on January 11. During the winter season the average monthly
34
releases from Fort Peck were below average: December 2016 was 6,500 cfs (average is 9,200 cfs); January was 6,700 cfs (average is 10,400 cfs); and February was 5,000 cfs (average is 10,700 cfs). The Fort Peck reservoir froze over on January 3 and was free of ice on April 3.
c. Winter River and Ice Conditions below Fort Peck
No special release reductions were required due to ice-jam flooding downstream of Fort Peck. Sub-zero (deg F) temperatures were experienced at the beginning of December 2016 and in early January. Ice-cover formation on the Missouri River downstream of Fort Peck resulted in the Missouri River stage rising over 6 feet in the Wolf Point, MT reach from December 6-10, 2016. As seen in Figure 20, the stage then declined to near 15 feet over the next couple weeks and remained in the range of 13 - 16 feet through the winter. The stage increased about 2 feet in late February when air temperatures reached highs between 42 and 51 deg F in the Wolf Point area. Those temperatures resulted in some lower elevation snowmelt and runoff entering the Missouri River from the Milk River upstream of Wolf Point. The end of the winter season occurred around mid-March with air temperatures reaching highs in the upper 40s (deg F). The Missouri River at Wolf Point stage rose to 17 feet on March 18 from ice and snowmelt runoff from the upstream tributaries, such as the Milk River, and from the Missouri River drainage area between Fort Peck Dam and Wolf Point. The USGS reported on March 21 that the ice was out of the Missouri River channel at Wolf Point. The Missouri River stage at Wolf Point remained well below the 23-foot flood stage during the winter. No reports of ice-affected flooding on the Missouri River below Fort Peck were recorded during the 2016-17 winter season.
d. Spring Open Water Season 2017
Inflows in April and May were near average while inflows in June were below average for Fort Peck. Releases from Fort Peck were below average in April and near average in May and June. Average monthly inflows to the reservoir were 10,300 cfs (102 percent of average) in April, 15,700 cfs (101 percent of average) in May and 15,200 cfs (79 percent of average) in June. Fort Peck releases were 6,300 cfs (86 percent of average) in April, 8,700 cfs (97 percent of average) in May, and 9,800 cfs (94 percent of average) in June. Fort Peck reservoir rose 4.0 feet from its March 31 elevation of 2236.2 feet to 2240.2 feet near the end of June, 6.2 feet above the base of the Annual Flood Control and Multiple Use Zone. Fort Peck reservoir rose 2.9 feet during the critical fish spawning period from 2236.2 feet (March 31) to 2239.1 feet (May 31).
e. Summer Open Water Season 2017
Average monthly release rates from Fort Peck were near average during July, 9,900 cfs (95 percent of average) and 10,100 cfs during August (101 percent of average) and were below average in September, 7,500 cfs (85 percent of average). Inflows for that same three-month period were all below average (74 percent of three-month average) with 7,200 cfs, 6,300 cfs, and 6,400 cfs, respectively. Over the three-month period the reservoir level steadily decreased 3.4 feet from 2240.2 feet (June 30) to 2236.8 feet (September 30).

6,000
8,000
10,000
12,000
14,000
16,000
18,000
20,000
22,000
0
2
4
6
8
10
12
14
16
11/1 12/1 1/1 2/1 3/1 4/1
Flow
in c
fs
Stag
e in
Fee
t
2016 2017
Missouri River at Bismarck, ND
Garrison Releases Observed Stage Flood Stage
Flood Stage = 14.5 feet
2,000
3,000
4,000
5,000
6,000
7,000
8,000
0
5
10
15
20
25
30
11/1 12/1 1/1 2/1 3/1 4/1
Flow
in c
fs
Stag
e in
Fee
t
2016 2017
Missouri River at Wolf Point, MT
Fort Peck Releases Observed Stage Flood Stage
Figure 20. Observed winter ice season stage at Wolf Point, MT and Bismarck, ND and Fort Peck and Garrison releases.
Flood Stage = 23 feet
35

36
f. Fall Open Water Season 2017
Releases during the fall continued the late summer trend and were below average. Average monthly releases were 5,800 cfs in October (74 percent of average), 6,000 cfs in November (74 percent of average) and 6,800 cfs in December (74 percent of average). The lower-than-average releases were made to balance storage in the upper three reservoirs. Inflows steadily increased during the fall with 6,300 cfs in October (85 percent of average), 6,600 cfs in November (93 percent of average), and 7,100 cfs in December (109 percent of average). The pool elevation decreased 1.0 foot over the three-month period from 2236.8 feet (September 30) to 2235.8 feet (December 31), 1.8 feet above the base of the Annual Flood Control and Multiple Use Zone.
g. Summary
The highest 2017 Fort Peck midnight pool elevation occurred on June 28 at 2240.2 feet, 6.2 feet above the base of the Annual Flood Control and Multiple Use Zone. The lowest 2017 midnight pool elevation was 2233.9 feet on January 17, 0.1 foot below the base of the Annual Flood Control and Multiple Use Zone. The 2017 average daily inflow of 8,800 cfs was 87 percent of average. The 2017 average daily release of 7,300 cfs was 79 percent of average.
3. Garrison Regulation – January to December 2017
a. General
Garrison, the largest Corps storage reservoir, is another key component in the regulation of the System. Its primary functions are (1) to capture the snowmelt runoff and localized rainfall runoff from the large drainage area between the Fort Peck and Garrison dams, which are metered out at controlled release rates to meet the authorized purposes while reducing flood damages in the Garrison to Oahe reach, particularly the urban Bismarck area; (2) to serve as a secondary storage location for water accumulated in the System from reduced System releases due to major downstream flood control regulation, thus helping to alleviate large pool increases in Oahe and Fort Randall; and (3) to provide water needed to meet all authorized purposes that draft storage during low-water years.
Table 6 lists the average monthly inflows and releases and the EOM pool elevation for Garrison for 2016 and 2017 as well as the averages since the System first filled in 1967.

37
Table 6 Garrison – Inflows, Releases and Elevations
Month
Monthly Inflow (cfs) Monthly Release (cfs) EOM Elevation (feet)
2017 2016 1967-2016 2017 2016 1967-
2016 2017 2016 1967-2016
January 13,300 11,500 15,100 15,900 17,400 22,300 1837.5 1838.8 1832.2 February 17,700 15,100 18,400 13,200 19,100 23,400 1838.3 1838.1 1831.2 March 30,700 14,200 26,300 14,000 16,100 19,000 1841.5 1837.9 1832.6 April 27,300 15,200 22,700 26,700 14,900 18,700 1841.5 1837.6 1833.2 May 41,300 29,300 29,600 32,100 18,100 21,600 1843.1 1840.0 1834.7 June 54,100 34,300 47,800 34,400 20,900 24,900 1846.4 1841.9 1838.9 July 33,000 17,700 33,000 33,500 20,300 25,800 1846.2 1841.2 1840.0 August 19,800 12,100 18,400 33,000 20,100 24,900 1843.2 1839.1 1838.2 September 16,700 15,100 16,900 23,500 16,900 20,800 1841.6 1838.4 1837.0 October 17,600 18,400 17,300 16,200 13,000 18,800 1841.3 1839.1 1836.4 November 17,300 17,400 15,800 15,100 13,100 19,600 1841.8 1839.5 1835.3 December 14,500 10,500 13,700 16,500 15,700 19,700 1840.5 1838.1 1833.8
b. Winter Season 2016-17
The Garrison reservoir level was at elevation 1839.4 feet on December 1, 2016, 1.9 feet above the base of the Annual Flood Control and Multiple Use Zone and 1.3 feet below the previous year’s level. The reservoir level declined through December and January and reached 1837.5 feet, the base of the Annual Flood Control and Multiple Use Zone, on January 29. The Garrison average monthly winter releases were below average: December 2106 was 15,700 cfs (average is 19,700 cfs); January was 15,900 cfs (average is 22,300 cfs); and February was 13,200 cfs (average is 23,400 cfs). The Garrison reservoir froze over on January 2 and was free of ice on April 14.
c. Winter River and Ice Conditions Below Garrison
The Missouri River in the Bismarck, ND area rose about 6 feet, from a stage of about 4 feet to a stage of about 10 feet, from December 7-11, 2016, during the season’s initial river ice formation. This type of rise in stage during river ice formation is normal. The river ice-cover conditions were generally continuous from December 7, 2016 through early February. As seen in Figure 20, the peak winter ice-affected Missouri River stage at Bismarck was just under 10 feet from December 10-13, 2016. The peak stage was more than 4 feet below the Bismarck flood stage of 14.5 feet and more than 3 feet below the Corps’ winter freeze-in maximum target stage of 13 feet. The ice cover on the Missouri River in the Bismarck reach remained from December 7, 2016 through early February. In early February open leads on the right bank
38
developed during the short periods of above-freezing daytime highs. A margin of ice cover remained on the left bank until March 20, when the Missouri River was free of ice. The river experienced declining stages through the winter following the initial ice formation in December 2016 until mid-March. In mid-March sub-freezing temperatures resulted in river ice formation. The ice completely covered the river channel from bank to bank for about a week. From March 8-17, the stage rose 5 feet in the Bismarck area due to the refreeze, reaching a peak stage of 9.2 feet. No reports of ice-affected flooding on the Missouri River below Garrison were recorded during the 2016-17 winter season.
d. Spring Open Water Season 2017
Above-average winter precipitation in Wyoming, Montana, and North Dakota contributed to above-normal inflows at Garrison despite below-normal precipitation during the spring. When the plains snowpack completed its melt, the above-normal snowpack in the Fort Peck to Garrison reach began melting, sustaining the above-normal inflows at Garrison through June. With the above-average inflows, the Garrison pool level increased 4.9 feet, from 1841.5 feet (March 31) to 1846.4 feet at the end of June, 8.9 feet above the base of the Annual Flood Control and Multiple Use Zone. Garrison reservoir rose 1.6 feet during the critical fish spawning period from 1841.5 feet (March 31) to 1843.1 feet (May 31). Inflows were 27,300 cfs (120 percent of average) in April, 41,300 cfs (140 percent of average) in May and 54,100 cfs (113 percent of average) in June. Releases were 26,700 cfs in April (143 percent of average), 32,100 cfs in May (149 percent of average), and 34,400 cfs in June (138 percent of average).
e. Summer Open Water Season 2017
Inflows into Garrison reservoir receded to near average rates during July (33,000 cfs; 100 percent of average), August (19,800 cfs; 108 percent of average), and September (16,700 cfs; 99 percent of average). Above-average releases continued during July (33,500 cfs; 130 percent of average), August (33,000 cfs; 133 percent of average), and September (23,500 cfs; 113 percent of average) to evacuate all stored flood waters by the start of next year’s runoff season. During the three-month period, the pool crested at 1846.6 feet on July 5, 9.1 feet into the 12.5-foot Annual Flood Control and Multiple Use Zone. Following the crest, the Garrison pool slowly declined 5.0 feet to 1841.6 feet at the end of September. A daily peaking pattern was established at Garrison from May 17 through August 28 to protect T&E species nesting on sandbars below the project.
f. Fall Open Water Season 2017
Inflows were near average during October, November, and December, 17,600 cfs (102 percent of average), 17,300 cfs (109 percent of average), and 14,500 cfs (106 percent of average), respectively. Releases were below average in October (16,200 cfs; 86 percent of average), November (15,100 cfs; 77 percent of average), and December (16,500 cfs; 84 percent of average). Releases were increased in December to provide more winter hydropower generation and in anticipation of the freeze-in of the Missouri River between Washburn and Bismarck, ND, which occurred on December 25. The December 31 Garrison pool elevation was 1840.5 feet, 3.0 feet above the base of the Annual Flood Control and Multiple Use Zone.

39
g. Lake Audubon / Snake Creek Embankment
During the 2000-07 drought, a restriction was put in place to limit the water level difference between Lake Audubon and Lake Sakakawea to 43 feet. This restriction required a pool restriction for Lake Audubon as a result of an underseepage evaluation of the Lake Audubon embankment by the Corps’ Omaha District. Since the Garrison Reservoir has returned to more average elevations following the 8-year drought, this water level difference restriction has not been an issue. Lake Audubon was drawn down to a winter level of 1844.8 feet in the fall.
h. Summary
The Garrison pool elevation peaked at 1846.6 feet on July 5 at midnight, 9.1 feet above the base of the Annual Flood Control and Multiple Use Zone. The lowest Garrison midnight pool level during 2017 occurred on January 29 at 1837.5 feet or at the base of the Annual Flood Control and Multiple Use Zone. The average annual inflow of 25,300 cfs was 110 percent of average. The average annual release of 22,900 cfs was 106 percent of average.
4. Oahe and Big Bend Regulation – January to December 2017
a. General
Oahe, the second largest Corps storage reservoir, serves all authorized purposes. Oahe’s primary functions are (1) to capture snowmelt and localized rainfall runoff from the large drainage area between the Garrison and Oahe dams, which are metered out at controlled release rates to meet the authorized purposes, while reducing flood damages in the Oahe to Big Bend reach, especially in the urban Pierre and Fort Pierre areas; (2) to serve as a primary storage location for water accumulated in the System from reduced System releases due to major downstream flood control regulation, thus helping to alleviate large reservoir level increases in Big Bend, Fort Randall and Gavins Point; and (3) to provide water needed to meet all authorized purposes that draft storage during low-water years, particularly downstream water supply and navigation. In addition, hourly and daily releases from Big Bend and Oahe fluctuate widely to meet varying power loads. Over the long term, their release rates are geared to back up navigation releases from Fort Randall and Gavins Point in addition to providing storage space to permit a smooth transition in the scheduled annual fall drawdown of Fort Randall. Big Bend, with less than 2 MAF of total storage, is primarily used for hydropower production, so releases from Oahe are generally passed directly through Big Bend.
Table 7 lists the average monthly inflows and releases and the EOM pool elevation for Oahe for 2016 and 2017 as well as the averages since the System first filled in 1967.

40
Table 7 Oahe – Inflows, Releases and Elevations
Month
Monthly Inflow (cfs) Monthly Release (cfs) EOM Elevation (feet)
2017 2016 1967-2016 2017 2016 1967-
2016 2017 2016 1967-2016
January 16,400 16,100 22,700 18,700 24,800 20,800 1607.9 1607.5 1599.2 February 17,000 23,700 26,800 16,400 17,600 18,200 1608.0 1608.7 1600.8 March 18,500 17,900 30,700 19,000 16,200 18,200 1607.8 1609.0 1603.2 April 29,400 20,900 27,000 26,100 17,700 21,000 1608.3 1609.3 1604.2 May 32,400 20,500 28,200 24,100 8,700 21,900 1609.8 1611.7 1605.3 June 34,800 22,300 30,900 31,500 16,900 26,600 1610.3 1612.2 1605.7 July 33,500 21,500 28,400 33,200 23,500 30,900 1610.2 1611.7 1604.8 August 35,200 20,800 26,500 29,700 24,500 33,400 1610.6 1610.4 1602.9 September 25,900 18,400 22,500 25,100 18,800 29,600 1610.2 1609.8 1601.0 October 16,800 13,500 20,500 17,500 12,700 23,800 1609.5 1609.7 1599.9 November 16,800 14,600 21,000 22,400 15,400 22,500 1608.3 1609.1 1599.3 December 16,100 17,100 20,000 22,700 18,300 20,500 1606.6 1608.4 1599.0
A settlement agreement was approved in an order of dismissal by the United States District Court, District of South Dakota on August 8, 2003, in the case of Lower Brule Sioux Tribe et al. v. Rumsfeld, et al. (Civil No. 02-3014 (D.S.D.)). The agreement provides that the Corps willconsult with the Lower Brule Tribe and the Crow Creek Sioux Tribe during any review and revision of the Master Manual. This agreement also provides that the Corps will coordinate the regulation of Big Bend and the water level of the Big Bend reservoir with the two Tribes to include the following: the Corps will normally strive to maintain a Big Bend pool level between elevation 1419.0 feet and 1421.5 feet and, when the level of the Big Bend reservoir drops below elevation 1419.0 feet or exceeds elevation 1421.5 feet, the Chief of MRBWM will provide notice to such persons as the Tribes shall designate in writing. When it is anticipated that the water level will drop below 1418.0 feet or rise above 1422.0 feet or, in the event the water level falls below 1418.0 feet or rises above 1422.0 feet, the Commander, NWD, or his designee, shall immediately contact the Chairpersons of the Tribes or their designees to notify them of the situation and discuss proposed actions to remedy the situation. During 2017 the Big Bend reservoir level varied in the narrow range between elevations 1419.0 feet to 1421.5 feet. As per the settlement agreement, no additional coordination was necessary.
Table 8 lists the average monthly inflows and releases and the EOM pool elevation for Big Bend for 2016 and 2017 as well as the averages since the System first filled in 1967.

41
Table 8 Big Bend – Inflows, Releases and Elevations
Month
Monthly Inflow (cfs) Monthly Release (cfs) EOM Elevation (feet)
2017 2016 1967-2016 2017 2016 1967-
2016 2017 2016 1967-2016
January 17,100 23,400 20,400 17,000 22,500 20,400 1420.8 1421.1 1420.5 February 16,500 16,600 18,200 16,400 16,900 18,200 1420.8 1420.7 1420.4 March 17,600 14,800 18,800 18,200 15,100 18,700 1420.0 1420.2 1420.4 April 24,100 17,900 21,200 23,200 17,200 20,900 1420.7 1420.7 1420.5 May 22,200 8,300 22,000 22,500 8,000 21,800 1420.2 1420.8 1420.4 June 28,900 15,300 26,700 28,800 15,700 26,500 1419.9 1420.1 1420.3 July 30,200 21,700 30,100 29,200 20,900 29,700 1420.6 1420.6 1420.2 August 27,900 23,100 32,700 27,700 22,700 32,200 1420.2 1420.3 1420.2 September 23,500 17,800 29,000 22,600 17,300 28,500 1420.4 1420.1 1420.3 October 15,900 11,800 23,500 15,700 11,000 23,000 1420.2 1420.8 1420.5 November 20,400 14,800 22,200 20,200 14,700 22,100 1420.4 1420.7 1420.4 December 20,500 16,900 20,300 19,800 16,900 20,000 1421.1 1420.6 1420.5
b. Winter Season 2016-17
No ice-induced flooding problems were experienced downstream of Oahe and Big Bend during the 2016-17 winter. A minimum generation of 100 MW, which is approximately a one unit release of 8,000 cfs, was implemented at Oahe from January 4-9 and January 11-19. The one unit minimum ensures that water is always flowing in the Missouri River downstream of Oahe Dam to reduce river ice formation directly below the dam. The Missouri River conditions were closely monitored by the Corps staff.
Unlike the 2015-16 winter season when the Oahe reservoir remained free of an ice cover, the Oahe reservoir froze over on January 15 and was free of ice on March 8.
Big Bend was regulated in the winter season to follow power-peaking requirements and thus hourly releases varied widely. The average daily release during the winter season varied between 0 and 25,200 cfs. The Big Bend reservoir froze over on December 15, 2016 and was free of ice on March 23.
c. Spring Open Water Season 2017
Oahe inflows for the three-month period were below average in March and slightly above average in April and May due to the above-average winter precipitation. March, April, and May monthly inflows were 18,500 cfs (60 percent of average), 29,400 cfs (109 percent of average),

42
and 32,400 cfs (115 percent of average), respectively. Oahe releases were also slightly above average in March-May with a combined average of 23,100 cfs (113 percent of average). Oahe reservoir rose 2.0 feet during the critical fish spawning period from 1607.8 feet (March 31) to 1609.8 feet (May 31).
d. Summer Open Water Season 2017
Oahe inflows remained above average for June through September with a combined average of 32,400 cfs (120% of average). June releases were 31,500 cfs (118% of average), July releases were 33,200 cfs (107% of average), August releases were 29,700 cfs (89% of average), and September releases were 25,100 cfs (85% of average). The reservoir pool rose 0.4 foot during the 4-month period to 1610.2 feet on September 30.
e. Fall Open Water Season 2017
Inflows were below average for October through December. Inflows in October were 16,800 cfs (82 percent of average), 16,800 cfs in November (80 percent of average), and 16,100 cfs in December (81 percent of average). Average monthly releases for October were 17,500 cfs (74 percent of average), and increased during November and December to 22,400 cfs (100 percent of average) and 22,700 cfs (111 percent of average), respectively. The December 31 pool elevation was 1606.6 feet, 0.9 foot below the base of the Annual Flood Control and Multiple Use Zone.
f. Summary
The highest 2017 Oahe midnight reservoir level of 1611.1 feet occurred on September 3, 3.6 feet above the base of the 9.5 foot Annual Flood Control and Multiple Use Zone. The 2017 minimum midnight pool elevation of 1606.6 feet occurred on December 31, 0.9 foot below the base of the Annual Flood Control and Multiple Use Zone. Oahe’s 2017 average annual inflow was 24,400 cfs, 96 percent of average. Oahe’s 2017 average annual release was 23,900 cfs, 100 percent of average. Big Bend’s annual minimum midnight pool elevation of 1419.6 feet was recorded on March 29 and the annual maximum midnight pool elevation of 1421.3 feet was recorded on February 19.
5. Fort Randall Regulation – January to December 2017
a. General
Fort Randall, the fourth largest System reservoir, serves all authorized purposes. Fort Randall’s primary functions are: (1) to capture snow and localized rainfall runoffs in the drainage area between Big Bend and Fort Randall dams, which are metered out at controlled release rates to meet the authorized purposes while reducing flood damages in the Fort Randall reach where several areas have homes and cabins in close proximity to the river; (2) to serve as a primary storage location along with the upstream projects for water accumulated in the System when System releases are reduced due to major downstream flood control regulation, thus

43
helping to alleviate large pool increases in the very small Gavins Point Project; (3) to store the water necessary to increase winter hydropower energy by implementing an annual fall drawdown of the reservoir with a winter reservoir refilling that is unique to Fort Randall; and (4) to provide water needed to meet all authorized purposes, particularly navigation and downstream water supply, that draft storage during low-water years.
Table 9 lists the Fort Randall average monthly inflows and releases in cfs and the EOM pool elevation in feet for 2016 and 2017 as well as the historic averages since the System was first filled in 1967.
Table 9 Fort Randall – Inflows, Releases and Elevations
Month
Monthly Inflow (cfs) Monthly Release (cfs) EOM Elevation (feet)
2017 2016 1967-2016 2017 2016 1967-
2016 2017 2016 1967-2016
January 20,300 26,600 22,000 14,900 20,800 15,300 1346.0 1345.4 1347.0 February 21,900 21,400 20,100 11,600 13,900 13,400 1353.4 1351.2 1351.9 March 20,700 17,900 21,600 18,200 13,800 15,700 1355.1 1354.2 1356.0 April 27,500 23,700 23,700 26,000 15,600 21,100 1356.0 1359.6 1357.6 May 25,800 12,300 24,900 25,200 13,200 25,000 1356.1 1358.8 1357.4 June 31,900 17,600 29,600 32,700 20,900 28,400 1355.4 1356.3 1357.8 July 32,100 22,800 31,300 30,800 23,900 32,600 1356.0 1355.2 1356.6 August 31,800 24,800 33,800 29,400 24,200 34,800 1357.1 1355.1 1355.4 September 25,200 19,100 29,800 30,000 20,800 34,500 1353.1 1353.4 1351.3 October 16,100 10,500 23,200 26,300 20,500 32,200 1343.9 1344.7 1343.4 November 21,300 14,700 22,100 27,000 20,400 28,600 1338.3 1338.8 1337.0 December 21,300 18,400 21,200 20,800 16,300 17,200 1338.8 1340.9 1341.0
b. Winter Season 2016-17
No reports of ice-affected flooding on the Missouri River below Fort Randall were recorded during the 2016-17 winter season. Fort Randall’s average daily winter release ranged from 7,700 to 18,000 cfs. The Fort Randall reservoir froze over on January 4 and was free of ice on March 17.
c. Spring Open Water Season 2017
The Fort Randall pool elevation was 1353.4 feet on February 28. The pool level rose to its typical spring and summer pool level of 1355.2 feet by early April. Releases were adjusted as needed to back up System releases from Gavins Point and to maintain the Gavins Point pool in

44
the desired range. The average March release of 18,200 cfs was 116 percent of average and the average April release of 26,000 cfs was 123 percent of average. These releases corresponded with inflows of 20,700 cfs in March (96 percent of average) and 27,500 cfs in April (116 percent of average). During May, Fort Randall average inflows were 25,800 cfs (104 percent of average) and releases averaged 25,200 cfs (101 percent of average).
d. Summer Open Water Season 2017
Inflows averaged 31,900 cfs in June (108 percent of average), 32,100 cfs in July (103 percent of average), and 31,800 cfs in August (94 percent of average). Releases from Fort Randall averaged 32,700 cfs in June (115 percent of average), 30,800 cfs in July (94 percent of average), and 29,400 cfs in August (84 percent of average). September releases averaged 30,000 cfs (87 percent of average). September inflows averaged 25,200 cfs (85 percent of average). The Fort Randall reservoir reached its annual peak elevation of 1357.7 feet on August 25. The reservoir was above its typical elevation of 1355.0 feet during July to early September to limit the rise at Oahe.
A daily hydropower peaking pattern is typically established at Fort Randall during the nesting season to provide flexibility to regulate over a range of releases while minimizing impacts to T&E species nesting below the project. A hydropower peaking pattern was not needed during the 2017 nesting season. Due to multiple unit outages during the nesting season, releases from Fort Randall remained generally steady throughout the day because the flood tunnels were utilized.
e. Fall Open Water Season 2017
Normal regulation of Fort Randall includes the lowering of the pool level at the end of the navigation season to 1337.5 feet, 17.5 feet below the normal summer level, to make room for capture of winter powerplant releases from the upper reservoirs. During a full navigation season, the pool is maintained above 1353.0 feet through the Labor Day weekend before starting the lowering of the pool. Inflows and releases were below average in October and near average November-December. On August 31, the pool level was 1357.1 feet. The lowering of Fort Randall pool started after Labor Day and reached its lowest 2017 level on December 5.
f. Summary
The highest 2017 Fort Randall midnight reservoir level of 1357.7 feet occurred on August 25. The lowest 2017 midnight reservoir level was 1337.0 feet on December 5. The averageannual inflow was 24,700 cfs, 98 percent of average, and the average annual release was 24,400 cfs, 98 percent of average.
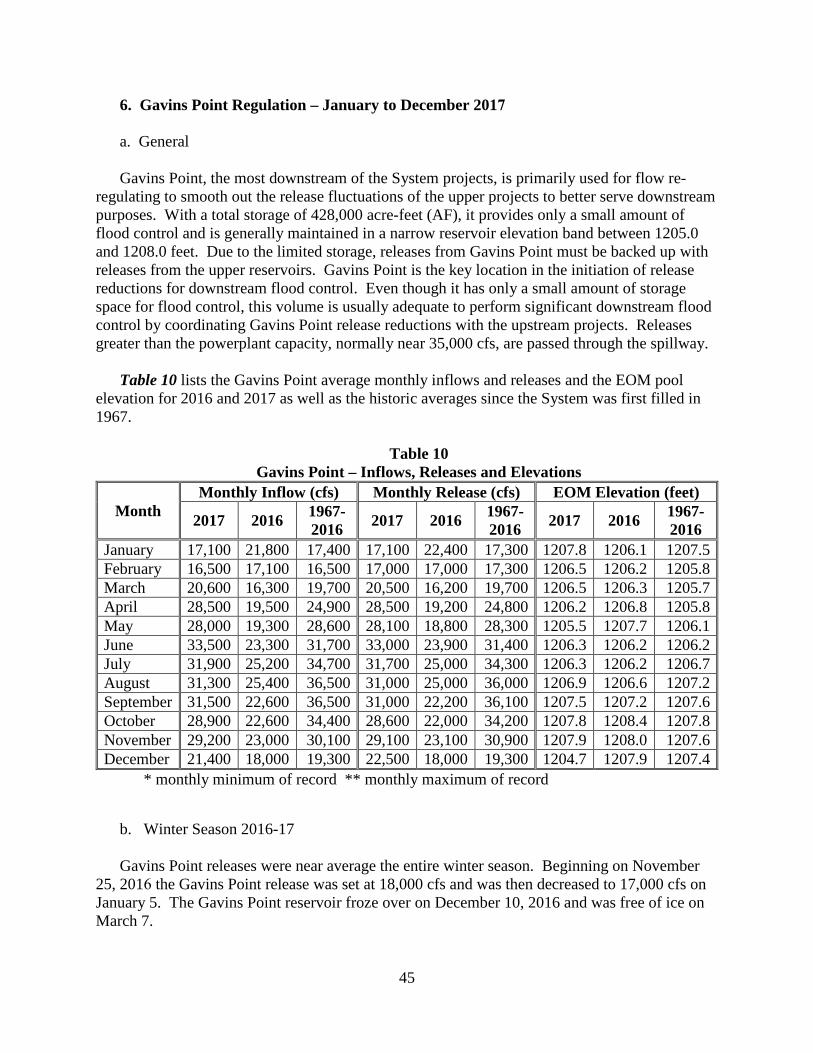
45
6. Gavins Point Regulation – January to December 2017
a. General
Gavins Point, the most downstream of the System projects, is primarily used for flow re-regulating to smooth out the release fluctuations of the upper projects to better serve downstream purposes. With a total storage of 428,000 acre-feet (AF), it provides only a small amount of flood control and is generally maintained in a narrow reservoir elevation band between 1205.0 and 1208.0 feet. Due to the limited storage, releases from Gavins Point must be backed up with releases from the upper reservoirs. Gavins Point is the key location in the initiation of release reductions for downstream flood control. Even though it has only a small amount of storage space for flood control, this volume is usually adequate to perform significant downstream flood control by coordinating Gavins Point release reductions with the upstream projects. Releases greater than the powerplant capacity, normally near 35,000 cfs, are passed through the spillway.
Table 10 lists the Gavins Point average monthly inflows and releases and the EOM pool elevation for 2016 and 2017 as well as the historic averages since the System was first filled in 1967.
Table 10 Gavins Point – Inflows, Releases and Elevations
Month Monthly Inflow (cfs) Monthly Release (cfs) EOM Elevation (feet)
2017 2016 1967-2016 2017 2016 1967-
2016 2017 2016 1967-2016
January 17,100 21,800 17,400 17,100 22,400 17,300 1207.8 1206.1 1207.5 February 16,500 17,100 16,500 17,000 17,000 17,300 1206.5 1206.2 1205.8 March 20,600 16,300 19,700 20,500 16,200 19,700 1206.5 1206.3 1205.7 April 28,500 19,500 24,900 28,500 19,200 24,800 1206.2 1206.8 1205.8 May 28,000 19,300 28,600 28,100 18,800 28,300 1205.5 1207.7 1206.1 June 33,500 23,300 31,700 33,000 23,900 31,400 1206.3 1206.2 1206.2 July 31,900 25,200 34,700 31,700 25,000 34,300 1206.3 1206.2 1206.7 August 31,300 25,400 36,500 31,000 25,000 36,000 1206.9 1206.6 1207.2 September 31,500 22,600 36,500 31,000 22,200 36,100 1207.5 1207.2 1207.6 October 28,900 22,600 34,400 28,600 22,000 34,200 1207.8 1208.4 1207.8 November 29,200 23,000 30,100 29,100 23,100 30,900 1207.9 1208.0 1207.6 December 21,400 18,000 19,300 22,500 18,000 19,300 1204.7 1207.9 1207.4
* monthly minimum of record ** monthly maximum of record
b. Winter Season 2016-17
Gavins Point releases were near average the entire winter season. Beginning on November 25, 2016 the Gavins Point release was set at 18,000 cfs and was then decreased to 17,000 cfs on January 5. The Gavins Point reservoir froze over on December 10, 2016 and was free of ice on March 7.

46
c. Winter River and Ice Conditions below Gavins Point
The lowest Sioux City, IA stage recorded during the 2016-17 winter season was 8.5 feet on December 9, 2016, which was 0.2 foot higher than the previous year’s low of 8.3 feet. This drop in stage followed two nights of temperatures in the teens (deg F) and two days of maximum air temperatures that were in the 20s (deg F). These conditions resulted in the formation of floating ice in the Missouri River. The first official ice report for the Missouri River below Gavins Point for the 2016-17 winter season was made on December 8, 2016. That report indicated floating ice pans 5 to 10 feet in diameter from Ponca, NE downstream to Omaha, NE, and the ice cover ranged from 5 to 80 percent.
Reports of floating ice were reported in the Sioux City, IA area during three different periods: December 8-27, 2016, January 3-23 and February 6-10. Ice observers noted 5 to 80 percent floating ice with pan sizes ranging from 2 to 30 feet from Sioux City, IA downstream to the Chamois Power Plant near Chamois, MO. No reports of ice-affected flooding or lack of water supply on the Missouri River below Gavins Point were recorded during the 2016-17 winter season.
d. Spring Open Water Season 2017
The bimodal spring pulse from Gavins Point was not conducted in 2017. Since 2012, the Corps and the U.S. Fish and Wildlife Service (USFWS) have been working collaboratively with the Missouri River Recovery Implementation Committee (MRRIC) to aggressively pursue completing the recommendations laid out by the Independent Science Advisory Panel (ISAP). At the center of this effort is the development of the Management Plan/EIS that will establish an overarching adaptive management process for implementation of Corps actions required to avoid jeopardizing all of the listed species in the Missouri River basin. The draft EIS was released for public comment in December 2016. Since the Corps is consulting with the USFWS as this plan is being developed about what management actions are required, the agencies believed it was prudent to forego a spring pulse during the 2017 Missouri River operating season and that this suspension was not likely to have an adverse effect on the listed species.
Per the Master Manual, the March 15 System storage check of 57.4 MAF set navigation flow support to the full service flow level for the first half of the navigation season. The initial Gavins Point release of 26,000 cfs to support navigation was reached on March 22. Flow support for the 2017 navigation season began on March 23 at Sioux City, IA; March 25 at Omaha, NE; March 26 at Nebraska City, NE; March 28 at Kansas City, MO; and April 1 at the mouth of the Missouri River near St. Louis, MO.
Based on the April 1 calendar year runoff forecast above Gavins Point, System and tributary storage, and Plate VI-I of the Master Manual, the service level was increased, or expanded, from 35,000 to 40,000 cfs. With the expanded service level, the navigation flow targets increased accordingly by 5,000 cfs: 36,000 cfs at Sioux City, IA and Omaha, NE; 42,000 cfs at Nebraska City, NE; and 46,000 cfs at Kansas City, MO. Due to the Missouri River at Kansas City exceeding the Missouri River full service flood target flow of 76,000 cfs, the Gavins Point releases were not initially increased to meet the expanded service level (Figure 25AB). Once the

47
forecasted Missouri River flows at the downstream flood targets, Omaha, Nebraska City and Kansas City, had receded below the flood target levels, Gavins Point releases were increased to 30,000 cfs on April 12 to meet the expanded service level at downstream locations.
At the end beginning of May, flows at Nebraska City and Kansas City exceeded their respective flood target levels for the increased service level. Gavins Point releases were reduced from 30,000 to 21,000 cfs at a rate of 3,000 cfs/day from May 1-3 to provide downstream flood risk reduction. After the forecasted flows at the target locations had receded below their respective flood target levels, the Gavins Point releases were increased from May 6-8 to 30,000 cfs at a rate of 3,000 cfs/day.
In order to prevent T&E birds from nesting on low sandbar habitat on the Missouri River downstream of Gavins Point Dam during the May nesting season, two Gavins Point release cycles were conducted. The cycles consisted of a Gavins Point release of 34,000 cfs for one day followed by a release of 30,000 cfs for two days. The cycles also provide flood risk reduction by limiting higher releases to one out of three days.
On May 18, the MRBWM’s lower Missouri River forecast indicated that the Missouri River flows at Omaha, Nebraska City and Kansas City would exceed the flood target levels. The Gavins Point releases were reduced over a several-day period from 34,000 cfs to 20,000 cfs to coincide with the time that the flow was peaking at those locations. Once the downstream flows had receded, the Gavins Point release was increased to 34,000 cfs by May 28. Releases were reduced to 33,000 cfs on June 2 and maintained at that rate until July 6.
e. Summer Open Water Season 2017
Based on the July 1 System storage check of 61.8 MAF, the expanded service level was reduced to full service navigation flow support during the second half of the navigation season. The reduction in service level was a result of the expansion of drought conditions in the upper Basin, which resulted in a lowering of the forecasted annual runoff above Gavins Point. In addition, the July 1 System storage check resulted in a normal 8-month navigation season length. The Gavins Point release was reduced to 32,000 cfs on July 7 and further reduced to 31,000 cfs on July 18. Full service flow support was maintained at all target locations through the remainder of the summer.
f. Fall Open Water Season 2016
Based on the September 1 System storage check of 60.4 MAF, the winter release rate from Gavins Point was to be no less than 17,000 cfs. The Gavins Point release was maintained at 31,000 cfs until October 3. In early October, rain in eastern South Dakota, eastern Nebraska and Iowa caused downstream Missouri River tributary flows to increase. The Missouri River flows rose above the full service flood target levels at Omaha, Nebraska City and Kansas City. In order to provide some downstream flood risk reduction, the Gavins Point release was reduced to 26,000 cfs from October 5-17. Releases were increased to 31,000 cfs by October 23.

48
During November, the Gavins Point release was maintained at 31,000 cfs. Releases were reduced to 28,000 cfs on November 12 and held at that rate until December 3, which provided a 10-day navigation season extension. Higher-than-average runoff during the late summer and fall resulted in the winter System release rate being set at 21,500 cfs. End-of-navigation season release reductions began on December 4, and the winter release was reached on December 8.
g. Summary
The highest Gavins Point midnight reservoir level in 2017 was 1208.3 feet, reached on February 21. The lowest midnight reservoir level in 2016 was 1204.7 feet, reached on December 31. The average annual inflow to Gavins Point was 26,500 cfs, 1,100 cfs below the averageinflow of 27,600 cfs. The average annual System release was 26,500 cfs, 1,000 cfs below the average release of 27,500 cfs.

49
D. Non-Routine Regulation and Other Items Pertaining to System Regulation
Numerous regulation activities are performed each year that, although at one time may have been considered special, are now considered routine. These include release restrictions from a particular project for a period of time to permit hydrographic surveys, to facilitate limited construction within or adjacent to the downstream channel, and to pattern releases to facilitate measurements of downstream discharges and water surface profiles. Two events that occurred recently with a connection to regulation activities are discussed in the following paragraphs.
On March 5, 2014, a takings claim was filed in the United States Court of Federal Claims by approximately 200 plaintiffs against the U.S. Army Corps of Engineers (Corps) for alleged flooding along the Missouri River from 2007 to 2013 (Ideker Farms, Inc., et al. v. U.S.). The claim was amended on October 15, 2014 adding approximately 170 new plaintiffs and CY 2014 flooding claims. The plaintiffs allege that the Corps, in the operation of the Missouri River Mainstem Reservoir System since the Master Manual was updated in 2004 and 2006, in conjunction with habitat creation efforts to comply with the 2003 Amended USFWS Biological Opinion, has caused an increase in flooding along the Missouri River. Plaintiffs contend, therefore, that through these actions the U.S. government has "taken" their property, in violation of the Fifth Amendment of the U.S. Constitution, for which they are entitled just compensation. Phase 1 of the initial trial involving 44 “representative properties” was held for six weeks in March and April 2017 in Kansas City and eight weeks in April through June in Washington D.C. Closing arguments were held for one week in November 2017 in Kansas City and concluded via teleconference in early December.
On February 2, 2015, Natural Resources Defense Council and Defenders of Wildlife filed suit alleging violations of the Endangered Species Act (ESA) by the Corps, U.S. Fish and Wildlife Service (USFWS), and U.S. Bureau of Reclamation (Reclamation) based on operations at Fort Peck on the Missouri River and the Intake Diversion Dam on the Yellowstone River. The plaintiffs later amended their complaint in early 2015 to include allegations of violations of the Clean Water Act and National Environmental Policy Act. Three irrigation districts in Montana joined the lawsuit as defendants. On September 4, 2015, the U.S. District Court in Montana (Great Falls Division) granted plaintiffs’ motion to issue a preliminary injunction, prohibiting the Corps and Reclamation from proceeding with construction of a proposed fish by-pass channel at the Intake Dam on the Yellowstone River. On January 5, 2016, the Court approved the parties joint motion/agreement to stay (or put on hold) the litigation while the Corps and Reclamation complete an Environmental Impact Statement (EIS) on proposed fish passage at Intake dam, to include consideration of an open water fish passage alternative. The Final Environmental Impact Statement was issued in October 2016, a new biological opinion was issued in November 2016 and a Record of Decision was signed in December 2016. On April 29, 2017, the court granted the government’s motion to dissolve the preliminary injunction, but also granted plaintiffs’ motion to file an amended complaint based on the new decision documents. The Fourth Supplemental and Amended complaint was filed on April 20, 2017 and on July 25, 2017, the Court granted plaintiffs’ new motion to issue a preliminary injunction, again prohibiting the agencies from proceeding with the project. On December 21, 2017, the plaintiffs’ filed a memorandum in support of their motion for summary judgment, requesting the Court set aside the approvals for the Intake project and declare the Corps’ ongoing operations at Fort Peck Dam is violating Sections 7 and 9 of the ESA.

50
E. Reservoir Elevations and Storage
Reservoir elevations and storage levels of the System reservoirs at the end of July 2017 are presented in Table 11 and the same information for the end of December 2017 is presented as Table 12. The upper three reservoirs, Fort Peck, Garrison and Oahe, contain nearly 90 percent of the total System storage and pool levels can vary, especially during high inflow (flood) or low inflow (drought) periods. The lower three reservoirs are generally regulated in such a manner that their pool levels do not fluctuate much from year to year. For the upper three reservoirs, the 12-month change columns for the end of July indicate that Fort Peck and Garrison were higher than the previous year, ranging from 3.8 to 5.0 feet higher, respectively, while Oahe was 1.5 feet lower. By the end of December, Fort Peck and Garrison remained above the base of their respective Annual Flood Control and Multiple Use Zones, ranging from 1.8 to 3.5 feet above their bases. Oahe was 0.9 foot below the base of its Annual Flood Control and Multiple Use Zone.
Table 11 Reservoir Levels and Storages – July 31, 2017
Project Reservoir Elevation Reservoir Storage in 1,000 AF
Elevation (feet)
12-Month Change (feet) Total Above Min.
Level* 12-Month Change
Fort Peck 2238.9 +3.8 15,869 11,781 +847 Garrison 1846.2 +5.0 20,576 15,782 +1,625 Oahe 1610.2 -1.5 19,503 14,188 -493 Big Bend 1420.6 +0.0 1,666 35 +2 Fort Randall 1356.0 +0.8 3,494 2,025 +67 Gavins Point 1206.3 +0.1 335 40 +4
Table 12 Reservoir Levels and Storages – Dec 31, 2017
Project Reservoir Elevation Reservoir Storage in 1,000 AF
Elevation (feet)
12-Month Change (feet) Total Above Min.
Level* 12-Month Change
Fort Peck 2235.8 +1.7 15,182 11,094 +354 Garrison 1840.5 +2.4 18,713 13,919 +779 Oahe 1606.6 -1.8 18,392 13,077 -570 Big Bend 1421.1 +0.5 1,691 60 +21 Fort Randall 1338.8 -2.1 2,260 791 -122 Gavins Point 1204.7 -3.2 298 3 -74 *Net usable storage above minimum reservoir levels established for power, recreation,irrigation diversions and other purposes.

51
Figures 21A and 21B show the end-of-July pool elevations for Fort Peck, Garrison and Oahe plus total System end-of-July storage for 2015 through 2017. Individual tables with the historic maximum, average and minimum pool elevations for each reservoir are also shown on Figures 21A and 21B.

Elevationin feet msl
Exclusive Flood Control
Annual Flood Control & Multiple Use
Carryover Multiple Use
Permanent Pool
1673.0
1854.0
1850.0
1837.5
1775.0
2220.1
Missouri River System ReservoirsEnd-of-July Pool Elevations and Total System Storage
Garrison
Figure 21A. End-of-July pool elevations for Fort Peck and Garrison.
Fort PeckExclusive Flood Control
Annual Flood Control & Multiple Use
Carryover Multiple Use
Permanent Pool
2030.0
2250.0
2246.0
2234.0
2160.0
Elevationin feet msl
52
Maximum Pool 2252.3 6/15/2011Average Pool 2229.9Minimum Pool 2196.2 3/20/2007
Maximum for 2017 2240.2 6/27/2017Minimum for 2017 2233.9 1/31/2017
Daily Midnight Project Data 1967-2016
31Jul2015 - 2236.231Jul2016 - 2235.1
31Jul2017 - 2238.9
Maximum Pool 1854.8 7/3/1975Average Pool 1835.3Minimum Pool 1805.8 5/12/2005
Maximum for 2017 1846.6 7/11/2017Minimum for 2017 1837.5 2/9/2017
Daily Midnight Project Data 1967-2016
31Jul2015 - 1844.231Jul2016 - 1841.2
31Jul2017 - 1846.2

Figure 21B. End-of-July pool elevations for Oahe and total System storage.
Total System Storage
Oahe
53
Missouri River System ReservoirsEnd-of-July Pool Elevations and Total System Storage
Elevationin feet msl
Exclusive Flood Control
Annual Flood Control & Multiple Use
Carryover Multiple Use
Permanent Pool
1415.0
1620.0
1617.0
1607.5
1540.0Maximum Pool 1619.7 6/26/2011Average Pool 1602.1Minimum Pool 1570.2 8/31/2006
Maximum for 2017 1611.1 9/4/2017Minimum for 2017 1606.6 12/30/2017
Daily Midnight Project Data 1967-2016
31Jul2017 - 1610.231Jul2016 - 1611.731Jul2015 - 1613.3
Maximum Storage 72.8 7/1/2011Average Storage 55.3Minimum Storage 33.9 2/8/2007
Maximum for 2017 61.8 7/9/2017Minimum for 2017 55.9 1/13/2017
Daily Midnight Project Data 1967-2016
Storagein MAF
Exclusive Flood Control
Annual Flood Control & Multiple Use
Carryover Multiple Use
Permanent Pool
0.0
72.4
67.7
56.1
17.6
31Jul2016 - 59.431Jul2015 - 61.431Jul2017 - 61.4

54
F. Summary of Results
1. Flood Control
The March 15 and July 1 System storages were 57.4 and 61.8 MAF, respectively. Per the criteria outlined in the Master Manual, full service flow support was provided for the first half and second half of the 8-month navigation season during 2017. Operation of Federal projects during significant runoff events in the Omaha and Kansas City Districts resulted in flood damage reduction. As shown on Figures 17A through 17C, flows at locations downstream of the mainstem projects were significantly reduced due to operation of the mainstem reservoirs.
The total flood damages prevented by all Corps controlled reservoir projects in the Missouri River Basin during 2017 were estimated to be about $451 million ($241 million Omaha District; $210 million Kansas City District). Flood damages prevented by the System reservoirs during 2017 were estimated to be $244 million ($152 million Omaha District; $92 million Kansas City District). The System flood damages prevented indexed to the September 2017 price level is illustrated in Figure 22A. Since 1938, the total flood control damages prevented by the System were $62.5 billion, an annual average of $781 million, indexed to September 2017 price levels. The total un-indexed flood damages prevented at the original price levels is $35.7 billion, an annual average of $446 million (see Figure 22B). The bulk of the damages prevented occurred during the 6-year period from 1993 to 1999 and the 4-year period from 2008 to 2011. For comparison purposes, Figures 22A and 22B include the construction cost of the dams. Indexed to 2017 price levels, the dams cost approximately $27.7 billion, whereas the original un-indexed cost was $1.2 billion.
Figures 17A through 17C show the 2017 regulated (actual experienced) and unregulated (with no System reservoirs and tributary reservoirs) Missouri River flows downstream of Fort Peck Dam at Wolf Point, MT, downstream of Garrison Dam at Bismarck, ND, and downstream of Gavins Point Dam at Sioux City, IA, St. Joseph, MO, Boonville, MO and Hermann, MO.

27.7
14.3
8.7
0.43.5 2.2
9.1
0.13.4
0.0 0.3 0.0 0.1 0.0 0.2 0.0 0.53.5 4.1 2.8
6.3
0.1 0.3 1.0 0.9 0.7 0.2
62.5
0
10
20
30
40
50
60
70C
ost o
f Dam
s19
38-9
219
9319
9419
9519
9619
9719
9819
9920
0020
0120
0220
0320
0420
0520
0620
0720
0820
0920
1020
1120
1220
1320
1420
1520
1620
17
Tota
l
Billion Dollars – Indexed to September 2017 Levels
1.23.0
4.4
0.21.8 1.2
5.2
0.02.0
0.0 0.2 0.0 0.0 0.0 0.1 0.0 0.42.9 3.3 2.3
5.4
0.0 0.2 1.0 0.9 0.2
35.7
05
10152025303540
Cos
t of D
ams
1938
-92
1993
1994
1995
1996
1997
1998
1999
2000
2001
2002
2003
2004
2005
2006
2007
2008
2009
2010
2011
2012
2013
2014
2015
2016
2017
Tota
l
Billion Dollars – Original Price Levels
55
Figure 22A. Missouri River flood damages prevented by the System indexed to September 2017 levels.
Figure 22B. Missouri River flood damages prevented by the System - original price levels.

56
2. Irrigation
Federally developed irrigation projects are not being served directly from the System reservoirs. The reservoirs, however, are being utilized by numerous private irrigators as well as Federally financed projects that take water from the Missouri River. About 900 private irrigators pump directly from the reservoirs or river reaches.
3. Water Supply
Problems at municipal and industrial (M&I) intakes located in the river reaches and System reservoirs are related primarily to intake or river access problems rather than inadequate water supply. Intake owners today are generally better prepared to handle periods of low water with adjustments to intakes or regulation procedures. Some of these adjustments involve using warm water to keep ice formation from building up on intake screens; installing new pumps; lowering intakes; installing sediment redirection vanes and ice deflectors; obtaining, or arranging to obtain, alternate sources of water; and cleaning screens more thoroughly and frequently. While these remedial actions are expensive to install and operate, they significantly improved the ability of the intakes to operate at lower river stages and reservoir levels.
Due to the historic releases in 2011, stretches of the Missouri River, specifically reaches directly downstream of the projects, experienced significant channel degradation. During the 2012-13 and 2013-14 winters, minimum releases required some additional coordination with downstream intake owners to ensure that their intakes were operational. The September 1 storage check indicated a winter release of no less than 17,000 cfs, which did not result in any intake access issues.
57
4. Water Quality Control
a. Overview
During 2017 the Omaha District (NWO) conducted fixed-station ambient water quality monitoring at the mainstem reservoirs and on the lower Missouri River. Water quality conditions of the water discharged through each of the mainstem dams was continuously monitored. More detailed water quality monitoring information is available in the NWO water quality reports on the NWO website at http://www.nwo.usace.army.mil/Missions/WaterInformation/WaterQuality/Reports.aspx
NWO has identified seven priority water quality issues that have relevance to the mainstem reservoirs. These identified priority issues are:
1. Determine how regulation of the mainstem dams and reservoirs affect water quality in theimpounded reservoirs. Utilize the CE-QUAL-W2 hydrodynamic and water qualitymodel to facilitate this effort.
2. Evaluate how eutrophication is progressing in the mainstem reservoirs, especiallyregarding the expansion of hypoxic conditions in the hypolimnion during summerstratification.
3. Determine how flows released from mainstem reservoirs affect water quality in thedownstream Missouri River. Utilize the HEC-RAS water quality model to facilitate thiseffort.
4. Determine how current water quality conditions in the Missouri River (e.g., watertemperature, turbidity) may be affecting pallid sturgeon populations in the MissouriRiver.
5. Provide water quality information to support decision making (e.g., Corps reservoirregulation elements for effective surface water quality and aquatic habitat management,Tribes and States in the development of their Section 303(d) lists and development andimplementation of total maximum daily loads (TMDLs) at NWO tributary projects).
6. Identify existing and potential surface water quality problems at NWO tributary projectsand develop and implement appropriate solutions.
7. Evaluate surface water quality conditions and trends at NWO tributary projects.
Table 13 provides a summary of water quality issues and concerns at each of the mainstem reservoirs and the lower Missouri River based on NWO monitoring and a review of current State integrated water quality reports.
b. Occurrence of “Two-Story” Fisheries at Mainstem Reservoirs
The Fort Peck, Garrison, and Oahe reservoirs maintain “two-story” fisheries that are comprised of warmwater and coldwater species. The ability of the reservoirs to maintain “two-story” fisheries is due to their thermal stratification in the summer that allows coldwater habitat to be maintained in the deeper, colder region of the reservoir (i.e. hypolimnion). Warmwater fish species inhabit the warmer, shallower areas of the reservoirs (i.e. epilimnion), while coldwater fish species inhabit the hypolimnion. Certain coldwater fish species are used extensively as forage by both coldwater and warmwater predator fish species in the reservoirs. Coldwater

Table 13 Water Quality Issues and Concerns
Project
Total Maximum Daily Load (TMDL) Considerations* Fish Consumption
Advisories
Other Potential Water Quality Concerns On 303(d)
List Impaired Uses Pollutant/Stressor TMDL
Completed Advisory in Effect
Identified Contamination
Fort Peck • Fort Peck Lake
Yes (MT) Drinking Water Supply Lead
Mercury No Yes Mercury ---
Recreation Aquatic plants - native NA**
• Missouri River, Fort Peck Damto the Milk River Yes (MT) Aquatic Life
Coldwater Fishery
Water temperature No No --- --- Degraded riparian vegetation
Other flow regime alterations NA**
• Missouri River, Milk River to the Poplar River Yes (MT) Aquatic Life
Warmwater Fishery
Water temperature No No --- --- Degraded riparian vegetation
Other flow regime alterations NA**
• Missouri River, Poplar River to North Dakota Yes (MT) Aquatic Life
Warmwater Fishery Water temperature No
No --- --- Other flow regime alterations NA**
Garrison • Lake Sakakawea
Yes (ND)*** Fish Consumption Methyl-mercury No Yes Mercury Coldwater fishery during drought conditions.
Tailwater dissolved oxygen levels.
• Missouri River, Garrison Dam to Lake Oahe No --- --- --- Yes Mercury
Low dissolved oxygen in Garrison Dam tailwaters (associated with late summer hypolimnetic lake withdrawals).
Oahe • Lake Oahe
Yes (SD)
Coldwater Permanent Fish Life Fish/Wildlife Propagation Recreation Stock Watering
Mercury in Fish Tissue No Yes Mercury
Fish consumption advisory also issued by the State of North Dakota and Cheyenne River Sioux Tribe for Lake Oahe within their jurisdictions.
Big Bend • Lake Sharpe
Yes Coldwater Permanent Fish Life Temperature Dissolved Oxygen No No ---
TMDL completed for sediment. A nonpoint source management project is being implemented in the Bad River watershed.
Fort Randall • Lake Francis Case
No --- --- --- No --- Low dissolved oxygen in Fort Randall Dam tailwaters (associated with late summer hypolimnetic reservoir withdrawals).
• Missouri River, Fort Randall Dam to Lewis and Clark Lake
Yes (NE, SD)
Warmwater Aquatic Life (NE) Warmwater Perm. Fish Life (SD) Fish/Wildlife Propagation (SD) Recreation (SD) Stock Watering (SD)
Mercury in Fish Tissue (NE, SD) No Yes (NE, SD) Mercury ---
Gavins Point • Lewis and Clark Lake
Yes (NE, SD)
Aquatic Life (NE) Warmwater Perm. Fish Life (SD) Fish/Wildlife Propagation (SD) Recreation (SD) Stock Watering (SD)
Chlorophyll-a (NE) Mercury in Fish Tissue (SD) No Yes (SD) Mercury Sedimentation.
Emergent aquatic vegetation.
• Missouri River, Gavins Point Dam to the Big Sioux River Yes (SD)
Warmwater Perm. Fish Life (SD) Fish/Wildlife Propagation (SD) Recreation (SD) Stock Watering (SD)
Mercury in Fish Tissue No Yes (SD) Mercury Reduced suspended sediment and turbidity impacts to pallid sturgeon. Assimilative capacity and flow reduction.
• Missouri River, Big Sioux River to Platte River Yes (NE) Recreation E. coli No No ---
Reduced suspended sediment and turbidity impacts to pallid sturgeon. Assimilative capacity and flow reduction.
• Missouri River, Platte River(NE) to NE-KS Stateline
Yes (MO, NE) Recreation E. coli Yes (NE) No ---
Reduced suspended sediment and turbidity impacts to pallid sturgeon. Assimilative capacity and flow reduction.
* Information taken from published state integrated water quality reports and impaired waters 303(d) listings as of January 1, 2017. ** Impairment identified in Montana’s integrated report, but not on 303(d) list for development of a TMDL. *** Delisted in 2010 for impairment of the designated use “Fish and other Aquatic Biota” (warm water temperature and low dissolved oxygen) when Lake Sakakawea pool elevations recovered from drought
conditions.
58

59
forage species that inhabit the reservoirs include the rainbow smelt (Osmerus mordax) and lake herring/lake cisco (Coregonus artedi). Maintaining healthy populations of these coldwater forage fish is important to maintaining both the coldwater and warmwater recreational fisheries in the three reservoirs.
c. Bottom-Withdrawal Reservoirs
Bottom-withdrawal reservoirs have outlet structures located near the deepest part of the reservoir. During the summer thermal stratification period, bottom withdrawal releases cold water from the deep portion of the reservoir that may be hypoxic during latter periods of stratification. Hypoxic conditions in the hypolimnion can result in the release of water with low dissolved oxygen and high levels of nutrients and other constituents. Bottom outlets can cause density interflows or underflows through the reservoir and generally provide little or no direct control over the quality of the water released through the bottom withdrawal. Garrison and Fort Randall are bottom withdrawal projects with both their power and flood tunnels drawing water from the bottom of the impounded reservoirs. Fort Peck Dam has a near-bottom withdrawal (i.e. 60 feet above the reservoir bottom) for the power and flood tunnels. The power tunnels at Oahe Dam draw water at a mid-depth elevation (i.e. 114 feet above the reservoir bottom); however, the flood tunnels draw water from the bottom of the reservoir. The Big Bend and Gavins Point powerplants both draw water from the bottom of the reservoir; however, these are shallower, run-of-the-river reservoirs and water drawn into the powerplants is usually fairly well mixed through the reservoir water column.
d. Fort Peck Reservoir
Fort Peck reservoir is not assigned a coldwater fishery use by the State of Montana in their water quality standards. However, the reservoir supports a stocked put-grow-take salmon fishery and a naturally reproducing lake trout (Salvelinus namaycush) and lake cisco fishery; all are considered coldwater species. Since a coldwater fishery is currently supported in Fort Peck reservoir, it is seemingly an existing use to be protected pursuant to the anti-degradation provisions of the Federal Clean Water Act (40 CFR 131.3).
Dissolved oxygen concentrations below Montana’s 5 mg/L, 7-day mean minimum water quality standard were monitored at the Fort Peck powerplant for the first time in 2012. A special water quality study was conducted by NWO in 2012 to evaluate the situation. When monitored on September 25, the area immediately downstream of the dam to just beyond the energy dissipation structures was below 5 mg/L dissolved oxygen, while the area from just downstream of the energy dissipation structures through the dredge cuts area was just above 5 mg/L. During 2013-2017 dissolved oxygen in the water discharged through the Fort Peck powerplant remained above the 5 mg/L minimum water quality standard with minimum instantaneous values of 5.4 mg/L (2013), 6.1 mg/L (2014), 5.9 mg/L (2015), 6.5 (2016), and 6.4 (2017). The situation will continue to be evaluated to determine if corrective measures to meet State water quality standards may be needed.

60
e. Garrison Reservoir
The State of North Dakota’s water quality standards classifies Garrison reservoir as a coldwater fishery. To protect the coldwater fishery use the State has promulgated the following water quality standards for Garrison reservoir: a water temperature criterion of ≤ 59 deg F (or 15 degrees C), a dissolved oxygen criterion of ≥ 5 mg/L, and a minimum reservoir volume of 500,000 AF (0.5 MAF) that meets these criteria.
Water temperature and dissolved oxygen depth profiles that were measured during water quality monitoring conducted at Garrison reservoir over the 5-year period 2013 through 2017 were used to estimate the volume of water in the reservoir that meets the coldwater fishery habitat conditions defined by the State of North Dakota. Plate 3 shows estimated reservoir and coldwater fishery habitat volumes, by year, for 2013 through 2017. Water quality monitoring in 2017 indicates that North Dakota’s 0.5 MAF minimum water quality standards criterion for coldwater fishery habitat was seemingly met; however, temporal variability in data collected at Garrison does allow for some uncertainty in this measurement.
To better assess the occurrence and support of coldwater fishery habitat in Garrison reservoir the NWO is currently updating their CE-QUAL-W2 hydrodynamic and water quality modeling of the reservoir. A comprehensive water quality report of Garrison reservoir, including application of the CE-QUAL-W2 model and how Corps regulation of the dam and reservoir influence water quality conditions, is planned for completion by mid-2018.
Dissolved oxygen concentrations below North Dakota’s 5 mg/L water quality standard have been monitored in late summer at the Garrison powerplant. To date, there is no evidence of current or past fish kills in the Garrison tailwaters. A Special Water Quality Study of the situation is being considered, and the situation will continued to be evaluated to determine if corrective measures to meet State water quality standards may be needed.
f. Oahe Reservoir
South Dakota’s water quality standards protect Oahe for a Coldwater Permanent Fish Life Propagation (CPFLP) use (i.e. coldwater fishery). As such, a water temperature criterion of ≤ 65 deg F (or 18.3 degrees C) and a dissolved oxygen criterion of ≥ 6 mg/L have been promulgated by South Dakota to protect the coldwater fishery of Oahe.
The occurrence of coldwater fishery habitat (i.e. water temperature ≤ 18.3 degrees C and dissolved oxygen ≥ 6 mg/L) in Oahe was estimated from water quality monitoring conducted over the 5-year period 2013 through 2017. Plate 4 shows estimated reservoir and coldwater fishery habitat volumes, by year, for 2013 through 2017. At least 2 MAF of coldwater fishery habitat was present in Oahe for all years.
g. Big Bend Reservoir
The State of South Dakota classifies Big Bend for a CPFLP use and currently lists the designated coldwater fishery as impaired due to warm water temperatures and low dissolved

61
oxygen levels, and targets the reservoir for development of a Total Maximum Daily Load (TMDL) in the near future. South Dakota should consider reclassification of Big Bend Reservoir from a coldwater fishery to a warmwater fishery based on a use attainability assessment of “natural conditions”. Natural summer water temperatures of the Oahe powerplant discharge, especially during lower pool levels, do not meet the temperature requirements for a CPFLP use in Big Bend.
h. Fort Randall Reservoir
Hypolimnetic water is passed through Fort Randall Dam during power production in the summer and dissolved oxygen levels in the Fort Randall Dam tailwaters fall below South Dakota’s water quality standards’ minimum dissolved oxygen criterion of 5 mg/L for protection of the designated Warmwater Permanent Fish Life Propagation (WPFLP) use. The low dissolved oxygen levels in the tailwaters are not impairing the designated WPFLP use as regions of refugia exist in the impacted area, and there is no evidence of current or past summer fish kills in the tailwaters attributable to low dissolved oxygen levels. If warranted, low dissolved oxygen levels in the Fort Randall tailwaters, during periods of hypolimnetic releases, could be mitigated by spilling surface water with higher dissolved oxygen concentrations down the spillway. The situation will continue to be evaluated to determine if corrective measures to meet South Dakota’s water quality standards may be needed.
i. Gavins Point Reservoir
Gavins Point reservoir is currently identified as impaired by the States of South Dakota and Nebraska in their 303(d) listing of impaired waters. South Dakota identifies impairment to the designated uses of WPFLP, Fish/Wildlife Propagation, Recreation, and Stock Watering due to elevated mercury levels in fish tissue. Nebraska identifies impairment to the use of aquatic life due to high chlorophyll-a levels. Of the six mainstem reservoirs, Gavins Point is exhibiting the most impact from nutrient loading and eutrophication. Eutrophication concerns at Gavins Point will likely increase as the reservoir continues to age. The current estimated volume loss of the Carryover Multiple Use Pool Zone (28 percent) in Gavins Point exceeds the State of Nebraska’s criterion (25 percent volume loss) for listing the reservoir as impaired for aesthetics. Gavins Point is not currently listed as impaired for sedimentation by the State of Nebraska.

62
5. Navigation
a. Barge Traffic
System releases provide navigation flow support in the Missouri River Bank Stabilization and Navigation Project (BSNP). Minimum navigation flow support, which is 6,000 cfs below full service, provides flow to ensure a minimum 8-foot channel depth. Full service navigation flow support provides flow to ensure a minimum 9-foot deep and 300-foot wide channel in the BSNP. Navigation flow support for the first half of the season is determined by the March 15 System storage check. Navigation flow support for the second half of the season, as well as season length, is determined by the July 1 System storage check. System releases are set to meet navigation target flows at four Missouri River locations – Sioux City, Omaha, Nebraska City, and Kansas City.
Based on the March 15 System storage of 57.4 MAF, navigation flow support was at a full service level for the first half of the navigation season.
System storage on April 1 was 58.4 MAF, 2.3 MAF above the base of the Annual Flood Control and Multiple Use Zone. Based on the April 1 calendar year runoff forecast above Gavins Point, System and tributary storage, and Plate VI-I of the Master Manual, the service level was increased, or expanded, from 35,000 cfs to 40,000 cfs.
Based on the July 1 System storage of 61.8 MAF, the expanded service level was reduced to full service level for the second half of the season with a normal 8-month season length. The reduction in service level reflected the expansion of drought conditions in the upper Basin.
On February 19, the year’s first commercial load entered the Missouri River at St. Louis, MO. The Corps’ Missouri River Project Office at Napoleon, MO recorded 29 loads and no empties being brought into the Missouri River before April 1, the start of the navigation season. The last commercial tow taken off the Missouri River in 2017 was on December 7.
b. Tonnage
Table 14 shows the final Missouri River tonnage data for 2012-16 compiled by the Waterborne Commerce Statistics Center (WCSC). Final navigation data is generally one year behind the summary report reporting year because the WCSC needs an extended period of time to compile the data. The 2016 total of 4.656 million tons includes 3.807 million tons for sand and gravel, 0.290 million tons for waterways materials, and 0.559 million tons for long-haul commercial tonnage. In 2016 the total tonnage increased by 0.254 million tons compared to 2015. The long-haul tonnage at 0.559 million tons is an increased by 0.290 million tons from 2015. The largest long-haul commercial tonnage, excluding sand, gravel and waterway material, occurred in 1977 at 3.34 million tons. Figure 23A shows total navigation tonnage on the Missouri River. Figure 23B shows the long-haul commercial navigation tonnage not including sand, gravel and waterway materials. The long-haul commercial tonnage in 2017 is estimated at 0.634 million tons, based on carrier interviews, towboat activity and barge counts from the Corps’ daily boat reports. Figure 24A shows the navigation tonnage value of the commodities

63
since 1960, using 2017 present-worth computations. Figure 24B shows the navigation tonnage value of long-haul commercial commodities since 1960. The Figures 23A, 23B, 24A and 24B tonnages and tonnage values for 2017 are estimates and will change once final WCSC tabulations are available.
Navigation season target flows for past years are presented in Table 15. Table 16 shows the scheduled lengths of past System-supported navigation seasons, with total tonnage and ton-miles for each year. Figures 25A and 25B present flows at the four navigation flow-target locations. There was no navigation support from the Kansas River projects in 2017.
Table 14 Missouri River Tonnage by Commodity (1,000 Tons)
Commodity Classification Group 2012 2013 2014 2015 2016 Farm Products 20 12 53 50 231 Corn 0 0 9 34 97 Wheat 0 0 0 3 2 Soybeans 20 12 44 13 133 Misc Farm Product 0 0 0 0 0 Nonmetallic Minerals 3,479 3,664 4,113 3,946 3,826 Sand/Gravel 3,421 3,609 4,072 3,901 3,807 Misc Nonmetallic 61 55 41 45 19 Food and Kindred 0 0 7 0 0 Pulp and Paper 0 0 0 0 0 Chemicals 34 53 64 72 140 Fertilizer 34 53 64 72 140 Other Chemicals 0 0 0 0 0 Petroleum (including coke) 6 54 44 13 68 Stone/Clay/Glass 79 71 85 83 98 Primary Metals 0 0 0 6 3 Waterway Materials 288 251 305 232 290 Other 0 0 0 0 0
Total Commercial 3,906 4,105 4,671 4,402 4,656 Total Long-Haul Commercial 197 245 293 269 559

Missouri RiverTotal Navigation Tonnage
01,0002,0003,0004,0005,0006,0007,0008,0009,000
10,000
60 62 64 66 68 70 72 74 76 78 80 82 84 86 88 90 92 94 96 98 00 02 04 06 08 10 12 14 16
Commercial Waterway Materials Sand and Gravel Estimated
Missouri RiverCommercial Navigation Tonnage
Thousand Tons
Thousand Tons
Commercial Tonnage Excludes Sand, Gravel & Waterway Materials
0
500
1,000
1,500
2,000
2,500
3,000
3,500
60 62 64 66 68 70 72 74 76 78 80 82 84 86 88 90 92 94 96 98 00 02 04 06 08 10 12 14 16
All Others Primary Metal Stone, Clay, Cem Petro & Coke Chemicals
Food & Kindred Non-Metallic Farm Products Estimated
Figure 23A. Missouri River total navigation tonnage from 1960 to 2017 (estimated).
Figure 23B. Missouri River commercial navigation tonnage from 1960 to 2017 (estimated).
64
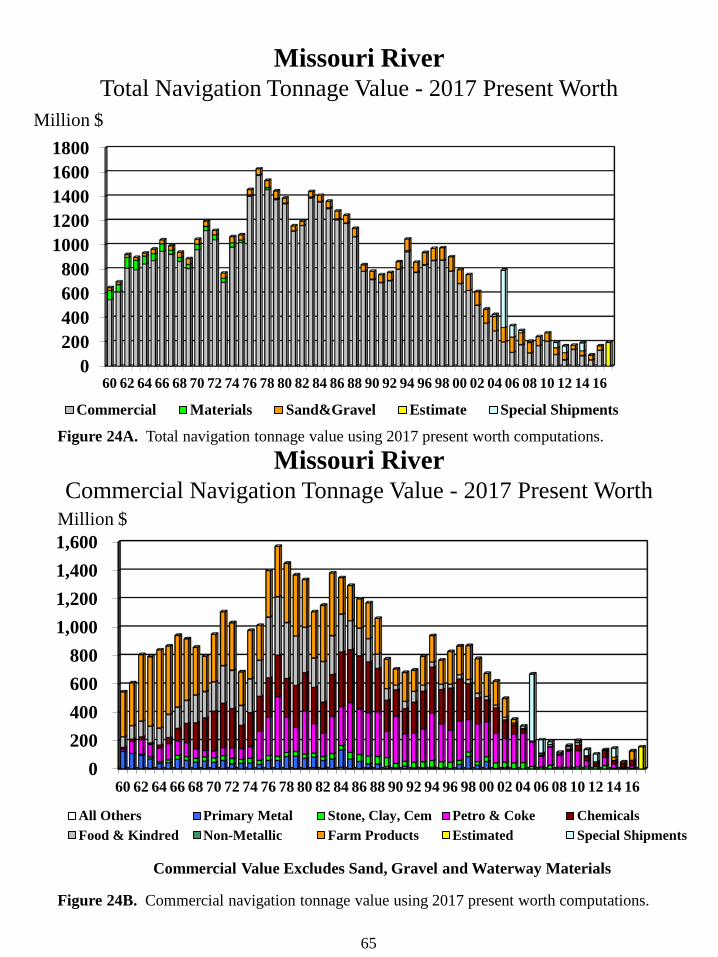
0200400600800
10001200140016001800
60 62 64 66 68 70 72 74 76 78 80 82 84 86 88 90 92 94 96 98 00 02 04 06 08 10 12 14 16
Commercial Materials Sand&Gravel Estimate Special Shipments
Missouri RiverTotal Navigation Tonnage Value - 2017 Present Worth
0200400600800
1,0001,2001,4001,600
60 62 64 66 68 70 72 74 76 78 80 82 84 86 88 90 92 94 96 98 00 02 04 06 08 10 12 14 16
All Others Primary Metal Stone, Clay, Cem Petro & Coke ChemicalsFood & Kindred Non-Metallic Farm Products Estimated Special Shipments
Missouri RiverCommercial Navigation Tonnage Value - 2017 Present Worth
Million $
Million $
Commercial Value Excludes Sand, Gravel and Waterway Materials
Figure 24A. Total navigation tonnage value using 2017 present worth computations.
Figure 24B. Commercial navigation tonnage value using 2017 present worth computations.
65

Year Months Sioux City Omaha Nebraska City Kansas City Year Months Sioux City Omaha Nebraska City Kansas City
1967 Apr-Jun 28 28 34 38 1990-93 Apr-Oct(4) 25 25 31 35
Jul-Nov 31 31 37 41 1994 Apr-Dec 31 31 37 41
1968 Apr-Nov 31 31 37 41 1995 Apr-May 31 31 37 41
1969 Apr-Jun(1) 35-40 35-40 41-46 45-50 Jun-Dec(1) 46-56 46-56 52-62 56-66
Jul(1) 36 36 42 46 1996 Apr(1) 41 41 47 51
Aug-Sep(1) 50-55 50-55 55-60 55-60 May(1) 41-51 41-51 47-57 51-61
Oct-Nov(1) 40-45 40-45 45-50 50-55 Jun-Dec(1) 56 56 62 66
1970 Apr-May 31 31 37 41 1997 Apr-Dec(5) * * * *
May-Sep(1) 36 36 42 46 1998 Apr-Dec(5) 31 31 37 41
Oct-Nov(1) 40 40 46 50 1999 Apr-Dec(1) 31-43 31-43 37-49 41-53
1971 Apr-May(1) 36 36 42 46 2000 Apr-Jun 31 31 37 41
May-Nov(1) 45-50 45-50 50-55 55-60 Jul-Dec(3) 29.5 29.5 35.5 39.5
1972 Apr-Nov(1) 40-50 40-50 45-55 50-60 2001 Apr-Dec(3) 28 28 34 38
1973-74 Apr-Nov 31 31 37 41 2002 Apr-Jun(3) 27 27 33 37
1975 Apr 31 31 37 41 Jul-Dec(3) 25 25 31 35
May-Nov(1) 35-60 35-60 41-66 45-70 2003 Apr-Nov(4) 25 25 31 35
1976 Apr-Jul(1) 34-38 34-38 40-44 44-48 2004-08 Apr-Oct(6) 25 25 31 35
Aug-Dec(1) 31-34 31-34 37-40 41-44 2009 Apr-Nov(7) 25/31 25/31 31/37 35/41
1977 Apr-Nov 31 31 37 41 2010 Apr-Dec(1) 31-43 31-43 37-49 41-53
1978 Apr 31 31 37 41 2011 Apr(1) 31-41 31-41 37-47 41-51
May-Jul(1) 35-46 35-46 41-52 45-56 mid-Apr(1) 41-46 41-46 47-52 51-56
Aug-Nov(1) 46-51 46-51 52-57 56-61 May(1) 46-56 46-56 52-62 56-66
1979 Apr-Jul(1) 36-42 36-42 42-48 46-52 mid-May(5) * * * *
Aug-Nov(1) 31-36 31-36 37-42 41-46 2012 Apr-Dec 31 31 37 41
1980 Apr-Nov 31 31 37 41 2013 Apr-Jun(6) 25 25 31 35
1981 Apr-Nov(2) 31 31 37 41 Jul-Dec(3) 28 28 34 38
1982 Apr-Sep 31 31 37 41 2014 Apr-Jun(3) 28 28 34 38
Oct 31-36 31-36 37-42 41-46 Jul-Dec(1) 31-46 31-46 37-52 41-56
Nov-Dec(1) 36-46 36-46 42-52 46-56 2015 Apr-Dec 31 31 37 41
1983 Apr-Jun 31 31 37 41 2016 Apr-Dec 31 31 37 41
Jul 31-36 31-36 37-42 41-46 2017 Apr-Jun(1) 36 36 42 46
Aug-Nov(1) 36 36 42 46 Jul-Dec 31 31 37 41
1984 Apr-Jun 31 31 37 41
Jul-Dec(1) 31-44 31-44 37-50 41-54
1985 Apr-Dec 31 31 37 41
1986 Apr(1) 36-41 36-41 42-47 46-51
May-Dec(1) 41-46 41-46 47-52 51-56
1987 Apr-Nov 31 31 37 41
1988 Apr-Nov(2) 31 31 37 41
1989 Apr-Aug(3) 28 28 34 38
Sep-Oct(3) 28 28 34 35
(5) Releases determined by flood control storage evacuation critiera and not adjusted to meet specific navigation targets.
(6) Minimum service targets at Sioux City and Omaha not met during periods when there was no navigation in those reaches.
(7) Minimum service targets at Sioux City were not met during periods when there was no navigation in those reaches.
(4) Navigation targets at minimum service as a water conservation measure.
66
Table 15
Navigation Season Target Flows
(1,000 cfs)
(2) Full service flows provided for shortened season.
(3) Navigation targets below full service as a water conservation measure.
(1) Downstream flow targets above full-service navigation level as a flood control storage evacuation measure.

Reservoir System Reservoir System
Supported Length Total Supported Length Total
of Season Commercial Traffic Total Traffic of Season Commercial Traffic Total Traffic
Year (Months) (Tons) (1) (Tons) (2) (1,000 Ton-Miles) (2) Year (Months) (Tons) (1) (Tons) (2) (1,000 Ton-Miles) (2)
1967 (3) 8 2,562,657 6,659,219 1,179,235 2000 8 1,344,000 8,733,000 628,575
1968 8 (4) 2,254,489 6,724,562 1,047,935 2001 8 1,288,000 9,732,000 566,150
1969 8 (4) 2,123,152 7,001,107 1,053,856 2002 8 (9) 1,009,000 8,266,000 409,980
1970 8 (5) 2,462,935 7,519,251 1,190,232 2003 8 (10) 667,000 8,050,000 256,788
1971 8 (4) 2,791,929 7,483,708 1,329,899 2004 6 1/2 (11) 525,498 8,192,219 181,995
1972 8 (4) 2,665,579 7,182,841 1,280,385 2005 6 1/2 (11) 284,641 7,935,747 129,882
1973 8 1,817,471 6,370,838 844,406 2006 6 1/2 (11) 195,290 8,295,226 84,483
1974 8 2,576,018 7,673,084 1,227,525 2007 6 3/4 (11) 302,769 6,684,625 119,177
1975 8 (4) 2,317,321 6,208,426 1,105,811 2008 7 (11) 174,800 5,670,968 86,203
1976 8 (4) 3,111,376 6,552,949 1,535,912 2009 8 269,563 5,035,744 114,865
1977 8 3,335,780 6,734,850 1,596,284 2010 8(4) 379,492 4,829,714 132,747
1978 8 (4) 3,202,822 7,929,184 1,528,614 2011 8(4) 230,439 3,831,925 62,253
1979 8 (4) 3,145,902 7,684,738 1,518,549 2012 8 197,000 3,906,000 56,631
1980 8 2,909,279 5,914,775 1,335,309 2013 8 244,576 4,104,505 110,280
1981 7 1/4 (6) 2,466,619 5,251,952 1,130,787 2014 8(4) 293,125 4,670,661 89,932
1982 8 (4) 2,513,166 4,880,527 1,131,249 2015 8 269,200 4,402,000 78,300
1983 8 (4) 2,925,384 6,301,465 1,300,000 2016 8 559,020 4,655,884 201,943
1984 8 (4) 2,878,720 6,386,205 1,338,939 2017 8 633,620 (13) 4,918,000 (13) 120,000 (12)
1985 8 (4) (7) 2,606,461 6,471,418 1,201,854
1986 8 (4) (7) 2,343,899 6,990,778 1,044,299
1987 8 2,405,212 6,735,968 1,057,526
1988 7 1/2 2,156,387 6,680,878 949,356
1989 6 3/4 1,906,508 5,352,282 796,799
1990 6 3/4 1,329,000 5,841,000 552,509
1991 6 3/4 1,563,000 5,729,000 537,498
1992 6 3/4 1,403,000 5,783,000 593,790
1993 8 (8) 1,570,000 5,631,000 615,541
1994 8 1,800,000 8,501,000 774,491
1995 8 (4) 1,439,000 6,884,000 604,171
1996 8 (4) 1,547,000 8,165,000 680,872
1997 8 (4) 1,651,000 8,172,000 725,268
1998 8 (4) 1,735,000 8,379,000 777,727
1999 8 (4) 1,576,000 9,252,000 699,744
(1) Includes commercial tonnage except for sand and gravel or waterway materials. Tonnage compiled by Waterborne Commerce Statistics Center (WCSC).
(2) Includes commodities; sand, gravel, and crushed rock; and waterway improvement materials. Tonnage by WCSC.
(9) To protect endangered shore birds below Gavins Point Dam, the Corps did not support navigation from July 3 to August 14, 2002. Average days towing industry off the river was 23 days.
(10) 6-day shortening of season to follow CWCP. From Aug 11 to Sep 1 Corps did not support navigation flows to comply with lawsuit to follow 2000 Biological Opinion. Navigation industry left the
river during this period.
(12) Estimated using boat report barge counts.
(13) Estimated using WCSC preliminary projections.
67
(7) 10-day extension provided for 1985 season in trade for 10-day delayed support of 1986 season.
(8) Lower Missouri River closed: 57 days in 1993, 20 days in 1995, and 18 days in 1999.
(11) Season shortening; 47 days, 2004; 48 days, 2005; 44 days, 2006; 35 days, 2007; 30 days, 2008
Table 16
Missouri River Navigation
Tonnage and Season Length
(6) Full service flows for shortened season in preference to reduced service.
(3) Mainstem Reservoir System first reached normal operating storage level in 1967.
(4) 10-day extension of season provided.
(5) 10-day extension and 10-day early opening provided.

0
5
10
15
20
25
30
35
40
45
50
Jan-17 Feb-17 Mar-17 Apr-17 May-17 Jun-17 Jul-17 Aug-17 Sep-17 Oct-17 Nov-17 Dec-17
Flow
in 1
,000
cfs
Actual (Regulated) Flow Navigation Target Flow System (Gavins) Releases
Missouri River at Sioux City, IA
Figure 25A. Actual flow, System releases and navigation target flows – Sioux City, IA and Omaha, NE (calendar year).
68
0
5
10
15
20
25
30
35
40
45
50
55
60
65
Jan-17 Feb-17 Mar-17 Apr-17 May-17 Jun-17 Jul-17 Aug-17 Sep-17 Oct-17 Nov-17 Dec-17
Flow
in 1
,000
cfs
Actual (Regulated) Flow Navigation Target Flow System (Gavins) Releases
Missouri River at Omaha, NE

0
20
40
60
80
100
120
140
160
Jan-17 Feb-17 Mar-17 Apr-17 May-17 Jun-17 Jul-17 Aug-17 Sep-17 Oct-17 Nov-17 Dec-17
Flow
in 1
,000
cfs
Actual (Regulated) Flow Navigation Target Flow System (Gavins) Releases
0
10
20
30
40
50
60
70
80
90
100
Jan-17 Feb-17 Mar-17 Apr-17 May-17 Jun-17 Jul-17 Aug-17 Sep-17 Oct-17 Nov-17 Dec-17
Flow
in 1
,000
cfs
Actual (Regulated) Flow Navigation Target Flow System (Gavins) Releases
Missouri River at Nebraska City, NE
Missouri River at Kansas City, MO
Figure 25B. Actual flow, System releases and navigation target flows – Nebraska City, NE and Kansas City, MO (calendar year).
69

70
6. Power – Eastern Division, Pick-Sloan Missouri Basin Program (P-S MBP)
The hydropower energy generated by the system is transmitted over a Federal transmission system that traverses 7,875 circuit miles. On October 1, 2015 Western’s transmission system became integrated with the Southwest Power Pool (SPP) regional transmission organization. During 2017, service was provided to over 350 wholesale customers. Customers receiving service include 200 municipalities, 2 Federal agencies, 30 state agencies, 24 USBR projects, 5 irrigation districts, 36 rural electric cooperatives, 6 public utility districts, 9 private utilities, 25 Native American services and 18 power marketers. Additional marketing benefits have been realized with Western becoming an asset owning market participant within the SPP integrated market place in 2017.
Per the Omaha Public Power District (OPPD) statistics, the average OPPD customer uses approximately 11,650 kilowatt hours (kWh) of energy annually. Based on the total System generation of 9.5 billion kWh, the energy generated in 2017 by this portion of the Federal power system could have supplied all of the yearly needs of about 817,000 residential OPPD customers. In addition to the clean, renewable energy supplied to our customers, system hydropower provides an added measure of stability to the SPP regional power system. Large coal-fired and nuclear units are backed up by other SPP member resources and the Federal hydropower generation. Members of the SPP market benefit by being able to call for reserves during emergency events. In addition, hydropower and other SPP generation are integrated with wind generation to provide balance to the SPP system.
The reliability of System hydropower helps to maintain adequate reserves in both the Northwest Power Pool in Western Area Power Administration, Upper Great Plains West (WAUW) and the SPP.
Hydropower generation in 2017 was 9.5 billion kWh, which was 102 percent of average since the System first filled in 1967. The 2017 generation was 1.9 billion kWh more than the 2016 generation of 7.6 billion kWh and 4.6 billion kWh more than the record low of 4.9 billion kWh, generated in 2008. Total generation was near average in 2017 due to a slightly above- normal runoff year in the upper Basin. Western purchased about 1.1 billion kWh between January 1 and December 31, at a cost of $20.3 million, to supplement System hydropower production.
System generation with individual project distribution for each calendar year in million megawatt hours (MWh) since 1954 is shown on Figure 26. The total generation from the Federal system (peak capacity and energy sales) for 2017 is shown in Table 17. The tabulations in Table 18 and Table 19 summarize the peak and total gross generation for the Eastern Division, P-S MBP marketing area system for the past operating year. Actual settlement figures at the end of the billing periods differ somewhat from the calendar month figures shown.

71
Table 17 Gross Federal Power System Generation – January 2017 through December 2017
Energy Generation 1000 kWh
Peak Hour kW Generation Date
Corps Powerplants – Mainstem Fort Peck 841,738 169,000 August 2 Garrison 2,593,529 535,000 May 12 Oahe 2,627,158 701,000 July 21 Big Bend 960,415 324,000 July 14 Fort Randall 1,681,977 267,000 September 2 Gavins Point 812,530 119,000 May 28 Corps Subtotal 9,517,347 2,063,000 August 2
USBR Powerplants Canyon Ferry 349,694 54,000 April, May &
June Yellowtail* 563,559 95,500 March, October &
November USBR Subtotal 913,253
Federal System Total 10,430,579 * Includes only half of total Yellowtail generation, which is marketed by the Eastern Division, P-S MBP.

Figure 26. System power generation by project from 1954 to 2017
72
0
2
4
6
8
10
12
14
16
54 58 62 66 70 74 78 82 86 90 94 98 02 06 10 14
Mill
ion
MW
h
System Power Generation1954 - 2017
Gavins Point Fort Randall Big Bend Oahe Garrison Fort Peck

Table 18 Historical Generation and Load Data – Peaks
Eastern Division, Pick-Sloan Missouri Basin Program* Data at Plant (1000 kW)
January 1, 2017 through December 31, 2017
Period
Corps of Engineers
Hourly Generation (Gross)**
(plus)
USBR Hourly
Generation (Gross)**
(equals)
Federal Hour
Generation (Gross)**
(plus)
Interchange and
Purchases Received**
(equals)
Peak Total
System Load
Peak Date
Peak Hour
January 1,243 79 1,322 358 1,680 Jan 13 900
February 1,141 86 1,227 587 1,814 Feb 09 900
March 780 76 856 757 1,613 Mar 02 800
April 1,266 110 1,376 73 1,449 Apr 11 800
May 1,413 124 1,537 0 1,537 May 02 1700
June 1,771 125 1,896 0 1,896 Jun 28 1800
July 1,919 112 2,031 0 2,031 Jul 11 1700
August 2,057 110 2,167 0 2,167 Aug 02 1700
September 1,685 84 1,769 0 1,769 Sep 12 1700
October 1,135 115 1,250 0 1,250 Oct 24 1100
November 1,411 110 1,521 141 1,662 Nov 09 900
December 1,386 111 1,497 289 1,786 Dec 27 1800 * This tabulation summarizes the total gross generation and power operations for the Eastern Division marketingarea system shown on Table 17. ** During hour of peak total system load.
Table 19 Historical Generation and Load Data – Total
Eastern Division, Pick-Sloan Missouri Basin Program* Data at Plant (1000 kWh)
January 1, 2017 through December 31, 2017
Period
Corps of Engineers Generation
(Gross)
(plus) USBR
Generation (Gross)
(equals) Federal
Generation (Gross)
(plus)
Scheduled Interchange
and Purchases Received
(equals) Total
System Load
January 594,001 38,198 632,199 273,824 906,023
February 461,713 41,323 503,036 358,448 861,484
March 581,633 66,848 648,481 196,697 845,178
April 818,990 75,361 894,351 25,646 919,997
May 897,619 86,168 983,787 -10,759 973,028
June 1,053,326 83,894 1,137,220 1,120 1,138,340
July 1,117,827 40,237 1,158,064 2,924 1,160,988
August 1,061,357 69,544 1,130,901 951 1,131,852
September 854,927 60,138 915,065 11,302 926,367
October 682,433 77,919 760,352 41,277 801,629
November 703,120 69,927 773,047 58,278 831,325
December 690,380 68,222 758,602 130,466 889,068
*Powerplants from Table 17. 73

7. Recreation
The System reservoirs provide outstanding opportunities for boating, fishing, swimming, camping and other outdoor recreation pursuits. Tourism related to the reservoirs is a major economic factor in all of the states adjoining the System. However, when the reservoirs are drawn down due to extended drought periods, as they were in some recent years, recreation may be adversely affected primarily due to access issues. Most of the recreational impacts of a drought are experienced at the upper three large reservoirs – Fort Peck, Garrison and Oahe. Due to the manner in which they are regulated, the lower three reservoirs are not significantly impacted by drought. Reservoir levels were at near normal levels through the 2017 recreation season and no accessibility problems were reported at mainstem projects’ boat ramps.
Access areas at the upper three reservoirs include Corps-owned as well as Tribal, state and privately-owned facilities. In 2002, many of the Federal recreation areas and boat ramps in South Dakota were turned over in fee title to the State of South Dakota and the Bureau of Indian Affairs through the Title VI process. Since the land transfer, both the Federal treasury and the Corps have provided money to the South Dakota Game Fish and Parks, Cheyenne River Sioux Tribe and Lower Brule Sioux Tribe for operations and stewardship of the Title VI lands they received. Congress is also capitalizing a trust fund to cover these costs in the future.
The methodology used for the Corps to determine visitation hours was revised during 2013. No visitation data is available for 2013. Visitation data for 2014-17 is presented in Table 20. The new methodology represents the number of unique individual visits for a specific activity or purpose that people used the reservoir and surrounding lands in any capacity. For example, a group of four people camping for the weekend counts as four visits. Four people pheasant hunting together counts as four visits per day. There are different weights and load factors assigned to different site types. The methodology also add in a certain ratio of dispersed use for areas that the Corps has no feasible way to monitor or meter.
Table 20 Visitation at System Reservoirs (Visits)
Project 2014 2015 2016 2017* Fort Peck 548,073 407,783 544,689 429,051 Garrison 1,351,900 1,488,471 1,590,185 1,747,553 Oahe 1,934,347 2,361,246 2,411,398 1,859,654 Big Bend 931,574 1,268,595 1,062,289 924,994 Fort Randall 896,671 896,847 836,647 800,651 Gavins Point 2,175,314 2,369,151 1,955,423 1,994,459 System Total 7,837,879 8,792,093 8,400,631 7,756,362
*Preliminary estimates.
74

75
8. Fish and Wildlife
a. Fish Management
Rainbow smelt are the primary forage species in both Garrison and Oahe reservoirs. Successful rainbow smelt reproduction is dependent on many factors including stable reservoir levels during the smelt spawning period, generally in April and early May. Most eggs are laid in water less than a foot deep and are subject to desiccation through wave action and slight drops in water level.
The near-average and above-average runoff in April and May, respectively, resulted in steady-to-rising pools in the Fort Peck, Garrison, and Oahe reservoirs throughout the spring and early summer.
b. Threatened and Endangered Species (T&E)
(1) Pallid Sturgeon
This was the 13th year of operating for the endangered pallid sturgeon (pallid sturgeon) per the revised Master Manual. The bimodal spring pulse from Gavins Point was not conducted in 2017, as detailed in section II.C.6.d. of this report.
(2) Piping Plovers and Least Terns
Since 1986 the System has been regulated for the piping plover (plover, threatened) and least tern (tern, endangered), when they were federally listed as T&E species. The terns and plovers nest on sparsely vegetated sandbars, islands and shoreline of the Missouri River and the reservoirs. Real-time telemetered streamgaging stations have been installed along the Missouri River to monitor river stages and flows during the nesting season. These gages provide a check, as well as a stage history, throughout the season to help relate the effects of regulation and natural events at intervals along the river. The gage data must be supplemented with observations of nesting activities and conditions to provide the information that is needed for regulation of the reservoirs. A dynamic flow routing model has been developed to predict river stages along the river reaches downstream from the Fort Peck, Garrison, Fort Randall, and Gavins Point dams for different combinations of daily and hourly power peaking. However, only the reach downstream of Garrison dam has been updated with post-2011 Flood cross-sectional data.
Beginning in 1999, Omaha District created a computerized T&E species Data Management System (DMS). Report data, which is updated daily, includes nest records, census and productivity data, site descriptions, field journals and field observations. This database is a valuable tool in aiding regulation decisions benefiting the terns and plovers in years when the reservoirs are regulated to protect nesting terns and plovers.
Although the Corps prevented inundation of nests where possible and created habitat following the listing, fledging ratios continued to be lower than predicted by the USFWS 1990
76
Biological Opinion until 1998, when fledge ratios exceeded the goal for both species. Predation, habitat degradation, severe weather, nest inundation, record runoff and other factors contributed to the low fledging rates. The record fledging that occurred for both species between 1998 and 2005 is primarily attributed to the large amount of habitat created by the high runoff years of 1995, 1996 and 1997 and the declining reservoir levels during the 2000-07 drought. The creation of additional habitat has also allowed greater flexibility in the release levels at Fort Randall and Gavins Point, the lower two System projects.
The above-average 2017 runoff resulted in rising reservoirs during the nesting season. The rising reservoir levels limited habitat and affected nest success. Known and presumed predation throughout the system was the most common cause of nest failure in 2017. A detailed description of the factors affecting tern and plover nesting, fledge ratios and habitat conditions and creation activities by reservoir and river reach can be found in the Missouri River Recovery Program Annual Adaptive Management Report for 2017 (www.moriverrecovery.org).
The population distribution and productivity for terns and plovers for 2000 through 2017 are shown in Table 21 and Table 22, respectively. Data for the period 1986 – 1999 can be found in earlier Summary of Actual Regulation Reports. Productivity estimates for these birds on the Missouri River do not include terns and plovers raised in captivity from 1995 to 2002. Adult bird totals listed in Table 21 and Table 22 are considered breeders even though they may not have had nesting success. The term "fledglings/pair" refers to the number of young birds produced per breeding pair. The fledge ratio is an estimate, as the fate of every single fledgling is impossible to ascertain. Numbers for 2013 were not comparable to the numbers in this table because of the change in survey methodology. However, the estimates can be found in the MRRP 2013 Annual Report.

2000 2001 2002 2003 2004 2005 2006 2007 2008 2009 2010 2011 2012 2013*** 2014 2015 2016 2017
Fort Peck Lake
Adults 0 0 0 2 0 0 2 2 0 0 0 0 0 0 0 0 0
Fledglings/Pair 0 0 0 0 0 0 3 0 0 0 0 0 0 0 0 0
Fort Peck to Lake Sakakawea
Adults 13 39 34 38 48 34 36 77 22 46 26 0 0 8 12 10 11
Fledglings/Pair 0.15 0.97 0.59 0.63 0.50 2.18 1.17 1.38 1.45 0.87 1.00 0.00 0.00 0.00 0.00 0 0.00
Lake Sakakawea
Adults 10 34 21 25 16 26 48 53 14 15 11 3 14 19 18 52 23
Fledglings/Pair 0.20 0.76 0.86 0.56 0.88 0.31 0.71 0.72 2.57 1.07 0.00 0.00 0.29 0.11 0.89 0.38 0.17
Garrison to Lake Oahe
Adults 105 125 126 144 142 157 139 123 73 108 134 0 105 131 157 213 197
Fledglings/Pair 1.03 1.26 1.83 1.28 1.13 0.73 0.81 1.06 1.34 0.48 1.36 0.00 0.99 0.55 1.06 0.24 1.22
Adults 85 94 106 70 73 131 128 186 111 71 48 39 100 89 93 87 101
Fledglings/Pair 1.01 1.34 1.32 1.20 1.26 0.87 1.14 0.48 0.58 0.96 0.17 1.33 1.06 0.29 0.49 0.25 0.51
Fort Randall to Niobrara
Adults 72 71 84 50 71 76 55 74 58 23 10 0 87 99 155 138 145
Fledglings/Pair 1.26 0.14 0.71 0.92 0.37 0.47 0.69 0.30 1.14 0.43 0.00 0.00 1.10 0.73 1.63 1.41 1.05
Lake Lewis and Clark
Adults 44 58 46 46 13 4 0 85 225 214 272 231 211 131 164 145 142
Fledglings/Pair 0.38 1.17 1.04 0.39 0.00 0.00 0.00 1.58 0.67 0.76 1.01 0.15 1.43 0.52 1.46 0.98 0.56
Gavins Point to Ponca
Adults 149 232 314 366 359 476 383 410 278 211 159 0 209 243 318 416 422
Fledglings/Pair 1.72 1.09 1.32 0.75 1.04 1.34 0.63 0.59 1.14 1.00 1.17 0 1.2 0.79 1.46 0.98 0.85
Total Adults 551 653 731 741 722 904 802** 1,010 781 696 650 273 726 720 917 1061 1041
Fledglings/Pair 1.22 1.04 1.27 0.87 0.95 1.09 0.80** 0.75 0.98 0.80 1.02 0.32 1.19 0.6 1.31 0.8 0.86
- Data not collected
* Partial Survey Results
{} No Birds Found
+ Subsampling of Selected Nesting Areas
** Includes adults and fledglings from Lake Francis Case
*** 2013 data is not added due to survey methodology change. See 2013 MRRP Annual Report for additional information.
Notes: The data do not include least terns and piping plovers raised in captivity from 1995 to 2002. The data represent only wild fledged birds.
From 1990 to 2003 the 10-Year Least Tern Fledge Ratio was 0.70 (1990 and 2000 Biological Opinions).
From 2004 to current 5-year running average goal is 0.94 (2003 Amended Biological Opinion)
Data in this table may differ from previous reports. As information becomes available, this table is updated.
Refer to previous MRBWM Summary Reports for 1986-1999 data.
Lake Oahe/Lake Sharpe
Missouri River System - Interior Least Tern Survey Data
Table 21
77

2000 2001 2002 2003 2004 2005 2006 2007 2008 2009 2010 2011 2012 2013** 2014 2015 2016 2017
Fort Peck Lake
Adults 0 4 2 17 9 26 20 16 9 12 3 2 0 0 4 2 0
Fledglings/Pair 0 1 2 0.35 2.22 1.08 1.2 0.5 0.22 0.33 0 0 0 0 0 0 0
Fort Peck to Lake Sakakawea
Adults 4 3 2 6 0 2 5 0 0 0 0 0 0 0 0 0 0
Fledglings/Pair 0 1.33 0 2.67 0 4 0.4 0 0 0 0 0 0 0 0 0 0
Lake Sakakawea
Adults 277 424 469 528 738 746 430 399 363 85 38 24 200 155 252 400 156
Fledglings/Pair 1.61 1.25 1.65 1.06 1.5 0.89 0.61 0.7 0.68 0.21 0.89 1.67 1.4 0.48 0.73 1 0.31
Garrison to Lake Oahe
Adults 99 149 119 149 164 220 175 222 218 275 287 0 98 221 392 336 266
Fledglings/Pair 1.41 1.53 2.03 1.66 1.16 0.8 0.77 0.97 1.37 0.94 0.84 0 1 2.05 1.26 0.36 1.3
Adults 141 184 203 301 372 364 331 273 281 158 44 20 125 210 251 227 211
Fledglings/Pair 1.45 1.41 2.16 1.84 1.41 1.21 0.99 0.62 0.9 0.47 0.1 0.4 1.76 0.45 0.49 0.56 0.63
Fort Randall to Niobrara
Adults 62 38 35 37 42 42 37 21 26 16 6 0 43 106 145 173 170
Fledglings/Pair 0.87 0.74 1.03 1.46 0.71 0.81 0.38 0 1 1 0 0 1.81 1.08 2.34 1.69 1.29
Lake Lewis and Clark
Adults 28 34 44 14 0 24 4 20 57 122 152 134 179 186 188 124 194
Fledglings/Pair 0.5 0.71 1.68 1.57 0 0.17 0.5 1.8 1.37 1.8 1.25 0.22 1.35 0.57 1.37 1.05 1.23
Gavins Point to Ponca
Adults 186 218 260 286 262 340 309 300 320 238 74 2 137 238 380 570 532
Fledglings/Pair 2.17 1.85 2.29 1.9 1.87 1.97 0.78 0.39 1.39 1.09 1.86 0 1.82 1.73 2.23 1.69 0.95
Total Adults 797 1054 1134 1338 1587 1764 1311 1251 1274 906 604 182 782 1116 1612 1832 1529
Fledglings/Pair 1.58 1.41 1.91 1.5 1.49 1.15 0.78 0.66 1.06 0.94 1.01 0.43 1.49 1.12 1.4 1.12 0.98
- Data not collected
* Partial Survey Results
{} No Birds Found
+ Subsampling of Selected Nesting Areas
** 2013 data is not added due to survey methodology change. See 2013 MRRP Annual Report for additional information.
Notes: The data do not include least terns and piping plovers raised in captivity from 1995 to 2002. The data represent only wild fledged birds.
From 1990 to 2000 the 15-Year Piping Plover Fledge Ratio Goal was 1.44 (1990 Biological Opinion).
From 2001 to 2003 the goal was 1.13 (2000 Biological Opinion)
From 2004 to current the 10-year running average goal is 1.22 (2003 Amended Biological Opinion)
Data in this table may differ from previous reports. As information becomes available, this table is updated.
Refer to previous MRBWM Summary Reports for 1986-1999 data.
Lake Oahe/Lake Sharpe
Missouri River System - Piping Plover Survey Data
Table 22
78

79
9. Cultural Resources As acknowledged in the 2004 Programmatic Agreement (PA) for the Operation and
Management of the Missouri River Main Stem System, wave action and the fluctuation of reservoirs levels results in erosion along the banks of the reservoirs. Shoreline erosion can have severe effects on cultural resources. During drought conditions, cultural resource sites are exposed as the pool levels decline.
The PA established a shared stewardship philosophy of protection of historic properties.
The objective of a PA is to address “…potential adverse effects of complex projects or multiple undertakings…” and to collaboratively develop a preservation program that would avoid, minimize and mitigate the effects of the System regulation. All Tribes, whether signatory to the PA or not, may request government-to-government consultation on System regulation and the resulting effect on historic and cultural properties and other resources.
A Cultural Resource Program Five Year Plan was developed in consultation with Tribes,
States, Agencies and interested parties. This plan outlines how the Corps will accomplish its responsibilities under the National Historic Preservation Act and the PA. The plan includes inventory, testing and evaluation, mitigation and other specific activities that will allow the Corps to avoid, minimize and mitigate the adverse effects to cultural sites on the Corps’ lands within the System. The “Final Five Year Plan”, dated February 2012 (see website http://www.nwo.usace.army.mil/Missions/CivilWorks/CulturalResources.aspx) is currently being implemented.
One consultation meeting on the PA was held during the 2017 reporting period. The
purpose of consultation meetings is to engage in communications and discuss whether operational changes are likely to affect historic and cultural properties, identify those properties and discuss how to address those affects.
A letter, dated September 14, 2017, was sent to the Missouri River Basin Tribes offering
consultation on the 2017-2018 AOP. To date, no Tribes have requested consultation nor provided verbal or written comments on the AOP. The Corps has semi-annual public meetings where basin stakeholders provide input on the upcoming year’s reservoir operations. Four Tribes were recorded participating in the fall AOP public meetings in October 2017.
The Corps actively addresses shoreline erosion which can damage or significantly alter
cultural resource sites. During 2017, two Omaha District cultural resource protection projects were planned. The one located at Gavins Point was completed. The planned project at Garrison was not completed in 2017 due to high water and it is now planned for completion in 2018, reservoir conditions permitting. There are also two projects planned at Big Bend during 2018.

80
This page intentionally left blank.

[_
[_[_
[_
[_[_
[_[_
CA
NYO
N F
ERRY
BO
YSEN
TIB
ER
YELL
OW
TAIL
GLE
ND
O
BO
NN
Y
NO
RTO
NK
IRW
IN
RED
WIL
LOW
CLA
RK
CA
NYO
N
WEB
STER
TREN
TON
JAM
ESTO
WN
GLE
N E
LDER
CED
AR
BLU
FF
HEA
RT
BU
TTE
MED
ICIN
E C
REE
K
SHA
DEH
ILL
LOVE
WEL
L
PAC
TOLA
KEY
HO
LE
END
ERS
Om
aha
Dis
trict
Har
ry S
Tru
man
Milf
ord
Stoc
kton
Wils
on
Rat
hbun
Tuttl
e C
reek Po
mon
a
Smith
ville Lo
ngvi
ewC
hatfi
eld
Bow
man
Hal
ey
Pipe
stem
Long
Bra
nch
Col
d B
rook
Bul
l Hoo
k
Perr
y
Har
lan
Cou
nty
Clin
ton
Mel
vern
Pom
me
De
Terr
e
Hill
sdal
eK
anop
olis
Cot
tonw
ood
Sprin
gs
Che
rry
Cre
ekB
ear C
reek
Ced
ar C
anyo
n
Blu
e Sp
rings
Papi
o C
reek
(4)
Salt
Cre
ek (1
0)
Snak
e C
reek
Sprin
g C
reek
Kel
ly R
oad
Wes
terly
Cre
ek
Hel
ena
Pier
re
Den
ver
Linc
oln
Bis
mar
ck
Chey
enne
Jeff
erso
n C
ity
Tope
ka
Kans
as C
ity D
istri
ct
Oa
he
Re
se
rvo
irO
ah
e R
es
erv
oir
Ga
rris
on
Re
se
rvo
irG
arr
iso
n R
es
erv
oir
Fo
rt P
ec
k R
es
erv
oir
Fo
rt P
ec
k R
es
erv
oir
Fo
rt R
an
da
ll R
es
erv
oir
Fo
rt R
an
da
ll R
es
erv
oir
Big
Be
nd
Re
se
rvo
irB
ig B
en
d R
es
erv
oir
Ga
vin
s P
oin
t R
es
erv
oir
Ga
vin
s P
oin
t R
es
erv
oir
Hav
re
Hu
ron
Sa
lina
Ca
spe
r
No
rfo
lk
Ab
erd
ee
nM
ob
rid
ge
Bill
ing
s
Dic
kin
son
Jam
est
ow
n
Will
isto
n
Va
len
tin
e
St.
Jo
sep
h
Wo
lf P
oin
t
Sio
ux
Cit
y
Mile
s C
ity
Gre
at F
alls
Ka
nsa
s C
ity
Sio
ux
Falls
Gra
nd
Isla
nd
No
rth
Pla
tte
Om
ah
a
Ra
pid
Cit
y
PLAT
E 1.
Mis
sour
i Riv
er B
asin
Map
.
USA
CE
Trib
utar
y Pr
ojec
t
Stat
e C
apit
ol[_USA
CE
Mis
sour
i Riv
er
USA
CE
Mis
sour
i Riv
er
M
ains
tem
Res
ervo
irs
Mai
nste
m R
eser
voirs
Dis
trict
Bou
ndar
y
USB
R S
ECTI
ON
7 P
RO
JEC
T
U.S
. AR
MY
CO
RPS
OF
ENG
INEE
RS
NO
RTH
WES
TER
N D
IVIS
ION
MIS
SOU
RI R
IVER
BA
SIN
WAT
ER M
AN
AG
EMEN
T D
IVIS
ION

Summary of Engineering Data -- Missouri River Mainstem SystemItem Subject Garrison Dam - Oahe Dam -No. Lake Sakakawea Lake Oahe
1 Location of Dam Near Glasgow, Montana Near Garrison, ND Near Pierre, SD2 River Mile - 1960 Mileage Mile 1771.5 Mile 1389.9 Mile 1072.33 Total & incremental drainage 57,500 181,400 (2) 123,900 243,490 (1) 62,090
areas in square miles4 Approximate length of full 134, ending near Zortman, MT 178, ending near Trenton, ND 231, ending near Bismarck, ND
reservoir (in valley miles)5 Shoreline in miles (3) 1520 (elevation 2234) 1340 (elevation 1837.5) 2250 (elevation 1607.5)6 Average total & incremental 10,200 25,600 15,400 28,900 3,300
inflow in cfs7 Max. discharge of record 137,000 (June 1953) 348,000 (April 1952) 440,000 (April 1952)
near damsite in cfs8 Construction started - calendar yr. 1933 1946 19489 In operation (4) calendar yr. 1940 1955 1962
Dam and Embankment10 Top of dam, elevation in feet msl 2280.5 1875 166011 Length of dam in feet 21,026 (excluding spillway) 11,300 (including spillway) 9,300 (excluding spillway)12 Damming height in feet (5) 220 180 20013 Maximum height in feet (5) 250.5 210 24514 Max. base width, total & w/o 3500, 2700 3400, 2050 3500, 1500
berms in feet15 Abutment formations ( under dam & Bearpaw shale and glacial fill Fort Union clay shale Pierre shale
embankment)16 Type of fill Hydraulic & rolled earth fill Rolled earth filled Rolled earth fill & shale berms17 Fill quantity, cubic yards 125,628,000 66,500,000 55,000,000 & 37,000,00018 Volume of concrete, cubic yards 1,200,000 1,500,000 1,045,00019 Date of closure 24 June 1937 15 April 1953 3 August 1958
Spillway Data20 Location Right bank - remote Left bank - adjacent Right bank - remote21 Crest elevation in feet msl 2225 1825 1596.522 Width (including piers) in feet 820 gated 1336 gated 456 gated23 No., size and type of gates 16 - 40' x 25' vertical lift gates 28 - 40' x 29' Tainter 8 - 50' x 23.5' Tainter24 Design discharge capacity, cfs 275,000 at elev 2253.3 827,000 at elev 1858.5 304,000 at elev 1644.425 Discharge capacity at maximum 230,000 660,000 80,000
operating pool in cfsReservoir Data (6)
26 Max. operating pool elev. & area 2250 msl 245,000 acres 1854 msl 383,000 acres 1620 msl 386,000 acres27 Max. normal op. pool elev. & area 2246 msl 240,000 acres 1850 msl 365,000 acres 1617 msl 362,000 acres28 Base flood control elev & area 2234 msl 211,000 acres 1837.5 msl 308,000 acres 1607.5 msl 311,000 acres29 Min. operating pool elev. & area 2160 msl 89,000 acres 1775 msl 125,000 acres 1540 msl 115,000 acres
Storage allocation & capacity30 Exclusive flood control 2250-2246 971,000 a.f. 1854-1850 1,495,000 a.f. 1620-1617 1,107,000 a.f.31 Flood control & multiple use 2246-2234 2,704,000 a.f. 1850-1837.5 4,211,000 a.f. 1617-1607.5 3,208,000 a.f.32 Carryover multiple use 2234-2160 10,700,000 a.f. 1837.5-1775 12,951,000 a.f. 1607.5-1540 13,353,000 a.f.33 Permanent 2160-2030 4,088,000 a.f. 1775-1673 4,794,000 a.f. 1540-1415 5,315,000 a.f.34 Gross 2250-2030 18,463,000 a.f. 1854-1673 23,451,000 a.f. 1620-1415 22,983,000 a.f.35 Reservoir filling initiated November 1937 December 1953 August 195836 Initially reached min. operating pool 27 May 1942 7 August 1955 3 April 196237 Estimated annual sediment inflow 17,200 a.f./year 1073 yrs. 21,600 a.f./year 1,086 yrs. 14,800 a.f./year 1553 yrs.
Outlet Works Data38 Location Right bank Right Bank Right Bank39 Number and size of conduits 2 - 24' 8" diameter (nos. 3 & 4) 1 - 26' dia. and 2 - 22' dia. 6 - 19.75' dia. upstream, 18.25'
dia. downstream40 Length of conduits in feet (8) No. 3 - 6,615, No. 4 - 7,240 1529 3496 to 365941 No., size, and type of service gates 1 - 28' dia. cylindrical gate 1 - 18' x 24.5' Tainter gate per 1 - 13' x 22' per conduit, vertical
6 ports, 7.6' x 8.5' high (net conduit for fine regulation lift, 4 cable suspension and opening) in each control shaft 2 hydraulic suspension (fine
regulation)42 Entrance invert elevation (msl) 2095 1672 142543 Avg. discharge capacity per conduit Elev. 2250 Elev. 1854 Elev. 1620
& total 22,500 cfs - 45,000 cfs 30,400 cfs - 98,000 cfs 18,500 cfs - 111,000 cfs44 Present tailwater elevation (ft msl) 2032-2036 5,000 - 35,000 cfs 1669-1677 15,000- 60,000 cfs 1422-1427 20,000-55,000 cfs
Power Facilities and Data45 Avg. gross head available in feet (14) 194 161 17446 Number and size of conduits No. 1-24'8" dia., No. 2-22'4" dia. 5 - 29' dia., 25' penstocks 7 - 24' dia., imbedded penstocks47 Length of conduits in feet (8) No. 1 - 5,653, No. 2 - 6,355 1829 From 3,280 to 4,00548 Surge tanks PH#1: 3-40' dia., PH#2: 2-65' dia. 65' dia. - 2 per penstock 70' dia., 2 per penstock49 No., type and speed of turbines 5 Francis, PH#1-2: 128.5 rpm, 5 Francis, 90 rpm 7 Francis, 100 rpm
1-164 rpm , PH#2-2: 128.6 rpm50 Discharge cap. at rated head in cfs PH#1, units 1&3 170', 2-140' 150' 41,000 cfs 185' 54,000 cfs
8,800 cfs, PH#2-4&5 170'-7,200 cfs51 Generator nameplate rating in kW 1&3: 43,500; 2: 18,250; 4&5: 40,000 3 - 121,600, 2 - 109,250 112,29052 Plant capacity in kW 185,250 583,300 786,03053 Dependable capacity in kW (9) 181,000 388,000 534,00054 Avg. annual energy, million kWh (12) 1,035 2,248 2,61055 Initial generation, first and last unit July 1943 - June 1961 January 1956 - October 1960 April 1962 - June 196356 Estimated cost September 1999
completed project (13) $158,428,000 $305,274,000 $346,521,000
Fort Peck Dam -Fort Peck Lake

Plate 2
Summary of Engineering Data -- Missouri River Mainstem SystemBig Bend Dam - Fort Randall Dam - Gavins Point Dam - Total Item Remarks
Lake Sharpe Lake Francis Case Lewis & Clark Lake No.21 miles upstream Chamberlain, SD Near Lake Andes, SD Near Yankton, SD 1 (1) Includes 4,280 squareMile 987.4 Mile 880.0 Mile 811.1 2 miles of non-contributing249,330 (1) 5,840 263,480 (1) 14,150 279,480 (1) 16,000 3 areas.
(2) Includes 1,350 square80, ending near Pierre, SD 107, ending at Big Bend Dam 25, ending near Niobrara, NE 755 miles 4 miles of non-contributing
areas.200 (elevation 1420) 540 (elevation 1350) 90 (elevation 1204.5) 5,940 miles 5 (3) With pool at base of flood28,900 30,000 1,100 32,000 2,000 6 control.
(4) Storage first available for440,000 (April 1952) 447,000 (April 1952) 480,000 (April 1952) 7 regulation of flows.
(5) Damming height is height1959 1946 1952 8 from low water to maximum1964 1953 1955 9 operating pool. Maximum
height is from average1440 1395 1234 10 streambed to top of dam.10,570 (including spillway) 10,700 (including spillway) 8,700 (including spillway) 71,596 11 (6) Based on latest available78 140 45 863 feet 12 storage data.95 165 74 13 (7) River regulation is attained1200, 700 4300, 1250 850, 450 14 by flows over low-crested
spillway and through Pierre shale & Niobrara chalk Niobrara chalk Niobrara chalk & Carlile shale 15 turbines.
(8) Length from upstream faceRolled earth, shale, chalk fill Rolled earth fill & chalk berms Rolled earth & chalk fill 16 of outlet or to spiral case.17,000,000 28,000,000 & 22,000,000 7,000,000 358,128,000 cu. yds 17 (9) Based on 8th year (1961)540,000 961,000 308,000 5,554,000 cu. yds. 18 of drought drawdown24 July 1963 20 July 1952 31 July 1955 19 (From study 8-83-1985).
(10) Affected by level of LakeLeft bank - adjacent Left bank - adjacent Right bank - adjacent 20 Francis case. Applicable to1385 1346 1180 21 pool at elevation 1350.376 gated 1000 gated 664 gated 22 (11) Spillway crest.8 - 40' x 38' Tainter 21 - 40' x 29' Tainter 14 - 40' x 30' Tainter 23 (12) 1967-2016 Average390,000 at elev 1433.6 620,000 at elev 1379.3 584,000 at elev 1221.4 24 (13) Source: Annual Report on270,000 508,000 345,000 25 Civil Works Activities of the
Corps of Engineers. ExtractReport Fiscal Year 1999.
1423 msl 62,000 acres 1375 msl 102,000 acres 1210 msl 29,000 acres 1,206,000 acres 26 (14) Based on Study 8-83-19851422 msl 60,000 acres 1365 msl 94,000 acres 1208 msl 25,000 acres 1,146,000 acres 27 (15) 67,275 kW on per unit basis1420 msl 58,000 acres 1350 msl 76,000 acres 1204.5 msl 21,000 acres 984,000 acres 28 64,684 kW on facility basis1415 msl 51,000 acres 1320 msl 36,000 acres 1204.5 msl 21,000 acres 437,000 acres 29
1423-1422 61,000 a.f. 1375-1365 986,000 a.f. 1210-1208 54,000 a.f. 4,674,000 a.f. 301422-1420 118,000 a.f. 1365-1350 1,306,000 a.f. 1208-1204.5 79,000 a.f. 11,626,000 a.f. 31
1350-1320 1,532,000 a.f. 38,536,000 a.f. 321420-1345 1,631,000 a.f. 1320-1240 1,469,000 a.f. 1204.5-1160 295,000 a.f. 17,592,000 a.f. 331423-1345 1,810,000 a.f. 1375-1240 5,293,000 a.f. 1210-1160 428,000 a.f. 72,428,000 a.f. 34November 1963 January 1953 August 1955 3525 March 1964 24 November 1953 22 December 1955 363,445 a.f./year 525 yrs. 15,800 a.f./year 334 yrs. 2,700 a.f./year 159 yrs. 77,400 37
Left Bank 38None (7) 4 - 22' diameter None (7) 39
1013 402 - 11' x 23' per conduit, vertical 41 lift, cable suspension
1385 (11) 1229 1180 (11) 42Elev 1375 43
32,000 cfs - 128,000 cfs1351-1355(10) 25,000-100,000 cfs 1228-1237 10,000-60,000 cfs 1153-1161 15,000-60,000 cfs 44
70 117 48 764 feet 45None: direct intake 8 - 28' dia., 22' penstocks None: direct intake 46
1,074 55,083 47None 59' dia, 2 per alternate penstock None 488 Fixed blade, 81.8 rpm 8 Francis, 85.7 rpm 3 Kaplan, 75 rpm 36 units 49
67' 103,000 cfs 112' 44,500 cfs 48' 36,000 cfs 50
67,275 (15) 40,000 44,100 51517,470 320,000 132,300 2,501,200 kw 52497,000 293,000 74,000 1,967,000 kw 53 Corps of Engineers, U.S. Army975 1,720 724 9,336 million kWh 54 Compiled byOctober 1964 - July 1966 March 1954 - January 1956 September 1956 - January 1957 July 1943 - July 1966 55 Northwestern Division
56 Missouri River Region$107,498,000 $199,066,000 $49,617,000 $1,166,404,000 August 2017

Plate 3. Garrison Reservoir - estimated reservoir and coldwater fishery (CWF) habitat 2013 through 2017.

Plate 4. Oahe Reservoir - estimated reservoir and coldwater fishery (CWF) habitat 2013 through 2017.