Embed Size (px)
Citation preview
iMO 780-1559 (5-01)
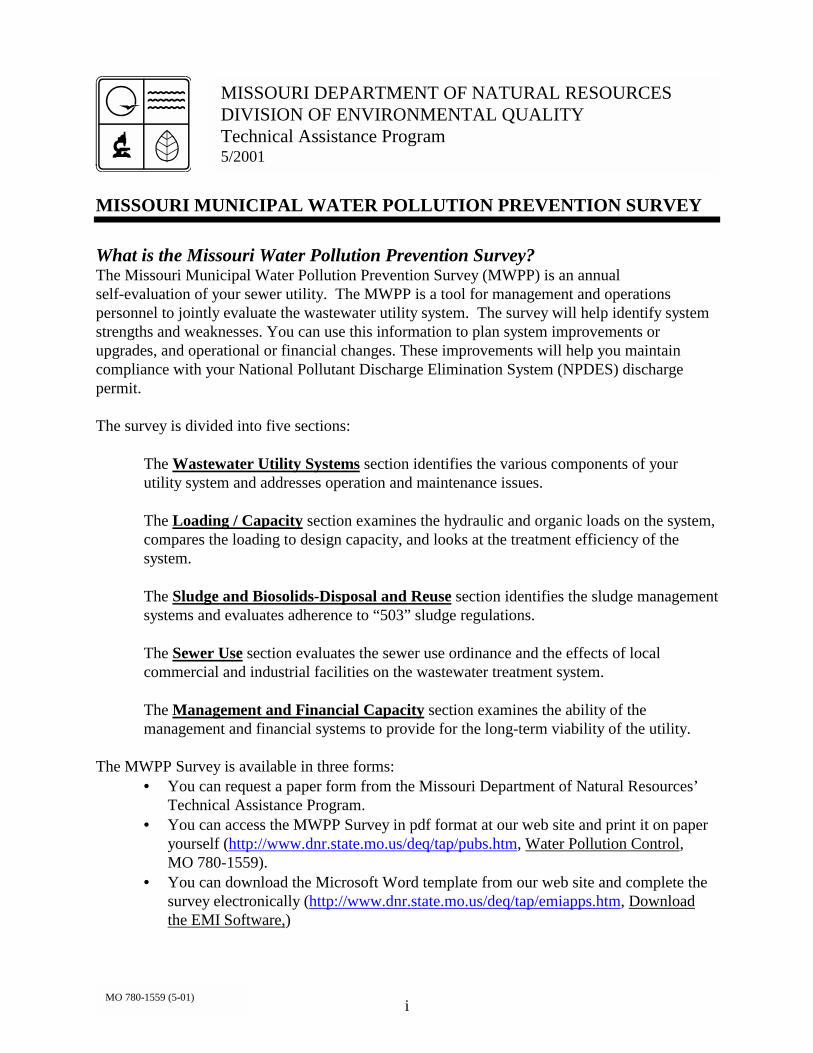
MISSOURI MUNICIPAL WATER POLLUTION PREVENTION SURVEY
What is the Missouri Water Pollution Prevention Survey?The Missouri Municipal Water Pollution Prevention Survey (MWPP) is an annualself-evaluation of your sewer utility. The MWPP is a tool for management and operationspersonnel to jointly evaluate the wastewater utility system. The survey will help identify systemstrengths and weaknesses. You can use this information to plan system improvements orupgrades, and operational or financial changes. These improvements will help you maintaincompliance with your National Pollutant Discharge Elimination System (NPDES) dischargepermit.
The survey is divided into five sections:
The Wastewater Utility Systems section identifies the various components of yourutility system and addresses operation and maintenance issues.
The Loading / Capacity section examines the hydraulic and organic loads on the system,compares the loading to design capacity, and looks at the treatment efficiency of thesystem.
The Sludge and Biosolids-Disposal and Reuse section identifies the sludge managementsystems and evaluates adherence to “503” sludge regulations.
The Sewer Use section evaluates the sewer use ordinance and the effects of localcommercial and industrial facilities on the wastewater treatment system.
The Management and Financial Capacity section examines the ability of themanagement and financial systems to provide for the long-term viability of the utility.
The MWPP Survey is available in three forms:• You can request a paper form from the Missouri Department of Natural Resources’
Technical Assistance Program.• You can access the MWPP Survey in pdf format at our web site and print it on paper
yourself (http://www.dnr.state.mo.us/deq/tap/pubs.htm, Water Pollution Control, MO 780-1559).
• You can download the Microsoft Word template from our web site and complete thesurvey electronically (http://www.dnr.state.mo.us/deq/tap/emiapps.htm, Downloadthe EMI Software,)
MISSOURI DEPARTMENT OF NATURAL RESOURCESDIVISION OF ENVIRONMENTAL QUALITYTechnical Assistance Program5/2001
iiMO 780-1559 (5-01)
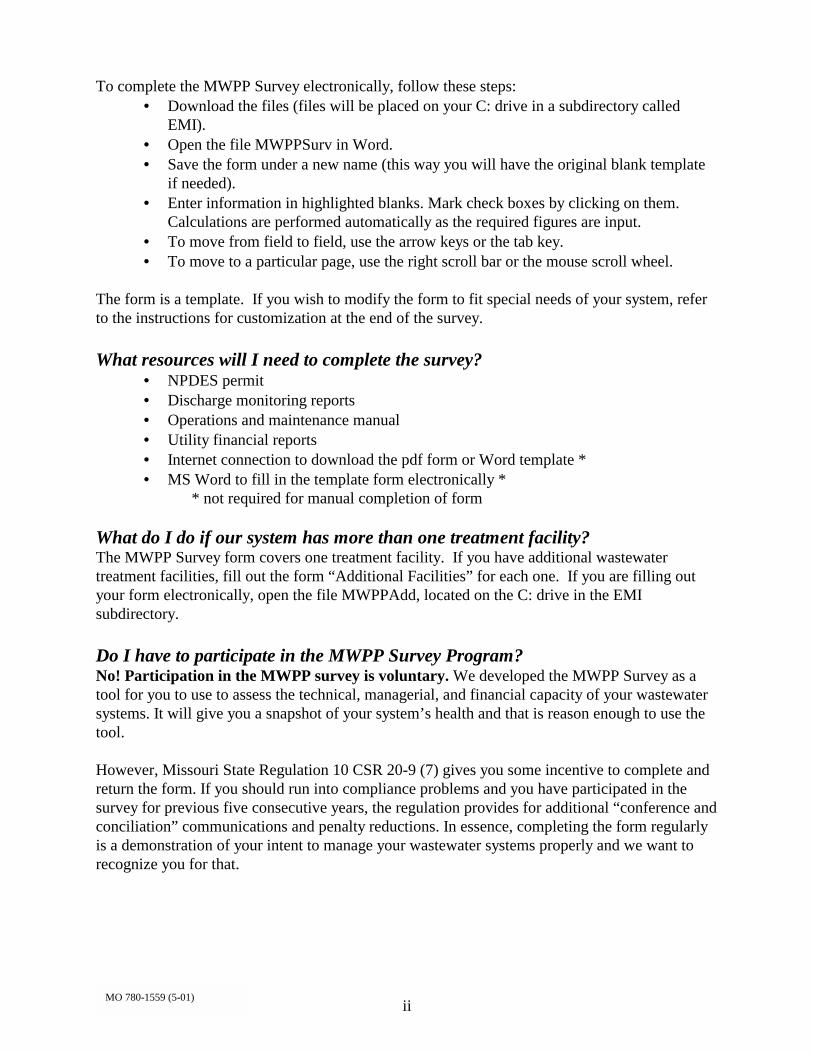
To complete the MWPP Survey electronically, follow these steps:• Download the files (files will be placed on your C: drive in a subdirectory called
EMI).• Open the file MWPPSurv in Word.• Save the form under a new name (this way you will have the original blank template
if needed).• Enter information in highlighted blanks. Mark check boxes by clicking on them.
Calculations are performed automatically as the required figures are input.• To move from field to field, use the arrow keys or the tab key.• To move to a particular page, use the right scroll bar or the mouse scroll wheel.
The form is a template. If you wish to modify the form to fit special needs of your system, referto the instructions for customization at the end of the survey.
What resources will I need to complete the survey?• NPDES permit• Discharge monitoring reports• Operations and maintenance manual• Utility financial reports• Internet connection to download the pdf form or Word template *• MS Word to fill in the template form electronically *
* not required for manual completion of form
What do I do if our system has more than one treatment facility?The MWPP Survey form covers one treatment facility. If you have additional wastewatertreatment facilities, fill out the form “Additional Facilities” for each one. If you are filling outyour form electronically, open the file MWPPAdd, located on the C: drive in the EMIsubdirectory.
Do I have to participate in the MWPP Survey Program?No! Participation in the MWPP survey is voluntary. We developed the MWPP Survey as atool for you to use to assess the technical, managerial, and financial capacity of your wastewatersystems. It will give you a snapshot of your system’s health and that is reason enough to use thetool.
However, Missouri State Regulation 10 CSR 20-9 (7) gives you some incentive to complete andreturn the form. If you should run into compliance problems and you have participated in thesurvey for previous five consecutive years, the regulation provides for additional “conference andconciliation” communications and penalty reductions. In essence, completing the form regularlyis a demonstration of your intent to manage your wastewater systems properly and we want torecognize you for that.

iiiMO 780-1559 (5-01)
If you would like credit for participating in the program, mail a copy of your completed surveyto:
Department of Natural ResourcesTechnical Assistance ProgramP.O. Box 176Jefferson City, MO 65102-0176
If you completed the survey in Word, print a copy of the completed form and mail it in. Betteryet, e-mail an electronic copy as a Word document attachment to us at [email protected].
What if I have questions about the survey?Call the Technical Assistance Program at 1-800-361-4827 or (573) 526-6627 or e-mail us. Wewill be glad to help you assess and build your system’s capacity.
Thank You for Participating
In the MWPP Survey!

ivMO 780-1559 (5-01)
1MO 780-1559 (5-01)
MISSOURI MUNICIPAL WATER POLLUTION PREVENTION SURVEY
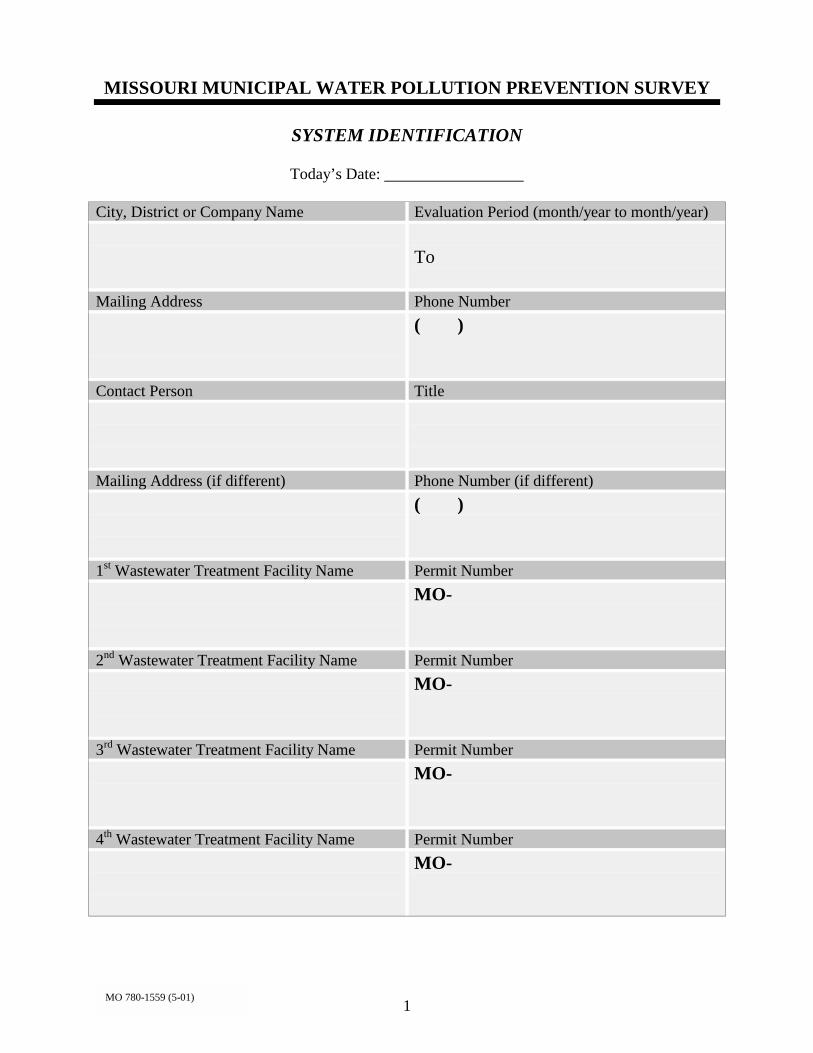
SYSTEM IDENTIFICATION
Today’s Date:
City, District or Company Name Evaluation Period (month/year to month/year)
To
Mailing Address Phone Number( )
Contact Person Title
Mailing Address (if different) Phone Number (if different)( )
1st Wastewater Treatment Facility Name Permit NumberMO-
2nd Wastewater Treatment Facility Name Permit NumberMO-
3rd Wastewater Treatment Facility Name Permit NumberMO-
4th Wastewater Treatment Facility Name Permit NumberMO-

2MO 780-1559 (5-01)
WASTEWATER UTILITY SYSTEMS
I. WASTEWATER TREATMENT PROCESSES
Check the boxes of the wastewater treatment processes that make up your wastewater treatmentsystem:
Preliminary Treatment Systems:
Bar Screen Grit Channel Comminutor Other
Primary Treatment Systems:
Primary Clarifier Other
Secondary Treatment Systems:
Lagoon:
Number of Cells Mechanical Aeration
Fixed Film:
Trickling Filter Rotating Biological Contact Sand Filter
Activated Sludge:
Package Plant Contact Stabilization Oxidation Ditch
Sequential Batch Reactor Extended Aeration Other
Advanced or Tertiary Treatment Systems:
Description
Disinfection Systems:
Chlorine Ultraviolet Ozone Other
Effluent - Stream Discharge:
Continuous Discharge Controlled Discharge No-discharge
Effluent - Land Application:
Overland Flow Irrigation System Wetlands
3MO 780-1559 (5-01)
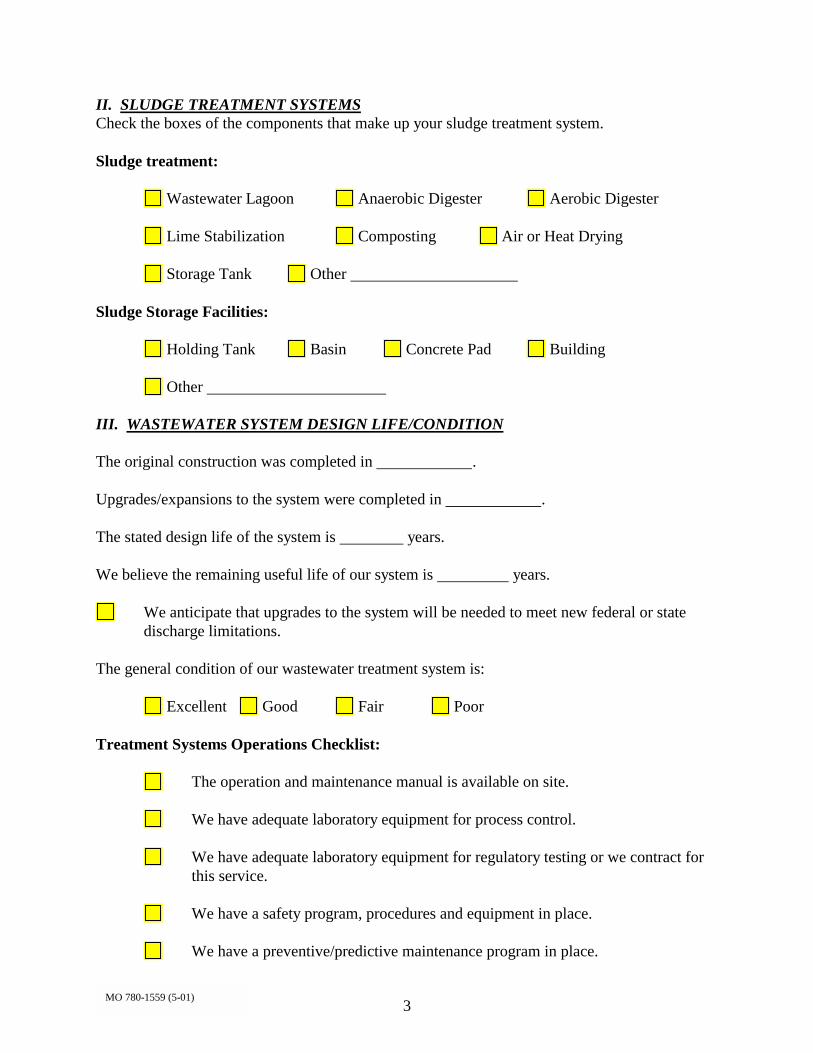
II. SLUDGE TREATMENT SYSTEMSCheck the boxes of the components that make up your sludge treatment system.
Sludge treatment:
Wastewater Lagoon Anaerobic Digester Aerobic Digester
Lime Stabilization Composting Air or Heat Drying
Storage Tank Other
Sludge Storage Facilities:
Holding Tank Basin Concrete Pad Building
Other
III. WASTEWATER SYSTEM DESIGN LIFE/CONDITION
The original construction was completed in .
Upgrades/expansions to the system were completed in .
The stated design life of the system is years.
We believe the remaining useful life of our system is years.
We anticipate that upgrades to the system will be needed to meet new federal or statedischarge limitations.
The general condition of our wastewater treatment system is:
Excellent Good Fair Poor
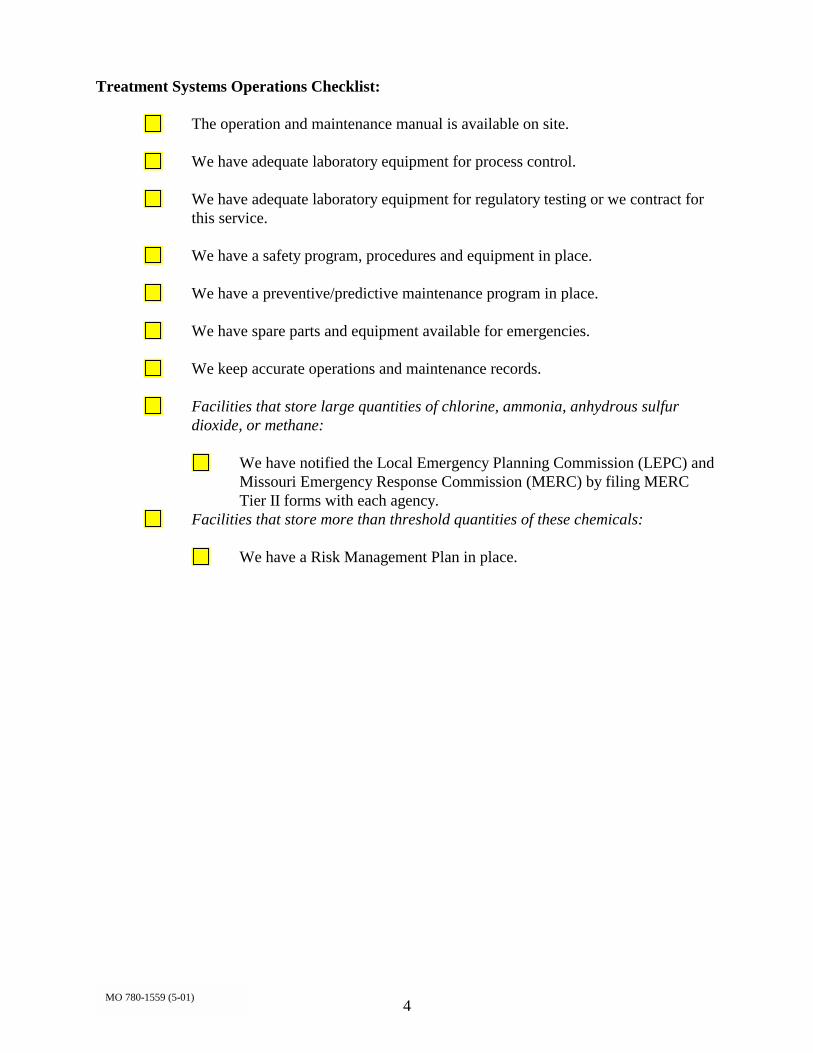
Treatment Systems Operations Checklist:
The operation and maintenance manual is available on site.
We have adequate laboratory equipment for process control.
We have adequate laboratory equipment for regulatory testing or we contract forthis service.
We have a safety program, procedures and equipment in place.
We have a preventive/predictive maintenance program in place.
4MO 780-1559 (5-01)
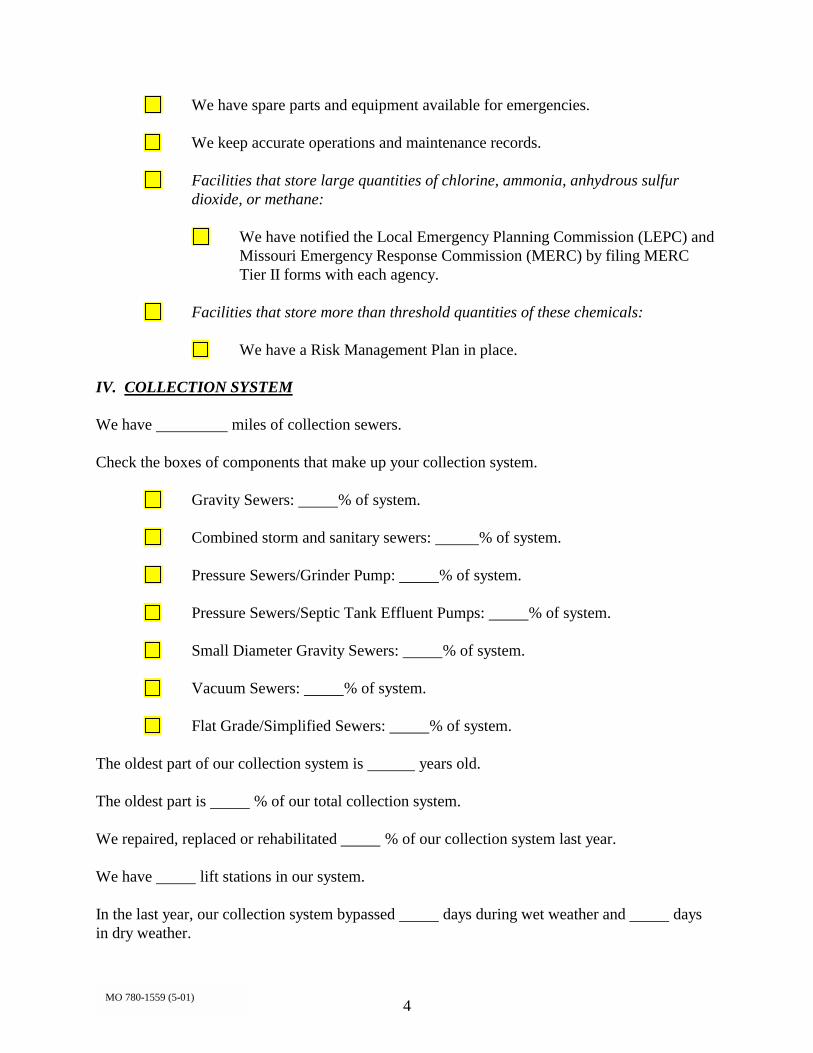
We have spare parts and equipment available for emergencies.
We keep accurate operations and maintenance records.
Facilities that store large quantities of chlorine, ammonia, anhydrous sulfurdioxide, or methane:
We have notified the Local Emergency Planning Commission (LEPC) andMissouri Emergency Response Commission (MERC) by filing MERCTier II forms with each agency.
Facilities that store more than threshold quantities of these chemicals:
We have a Risk Management Plan in place.
IV. COLLECTION SYSTEM
We have miles of collection sewers.
Check the boxes of components that make up your collection system.
Gravity Sewers: % of system.
Combined storm and sanitary sewers: % of system.
Pressure Sewers/Grinder Pump: % of system.
Pressure Sewers/Septic Tank Effluent Pumps: % of system.
Small Diameter Gravity Sewers: % of system.
Vacuum Sewers: % of system.
Flat Grade/Simplified Sewers: % of system.
The oldest part of our collection system is years old.
The oldest part is % of our total collection system.
We repaired, replaced or rehabilitated % of our collection system last year.
We have lift stations in our system.
In the last year, our collection system bypassed days during wet weather and daysin dry weather.
5MO 780-1559 (5-01)
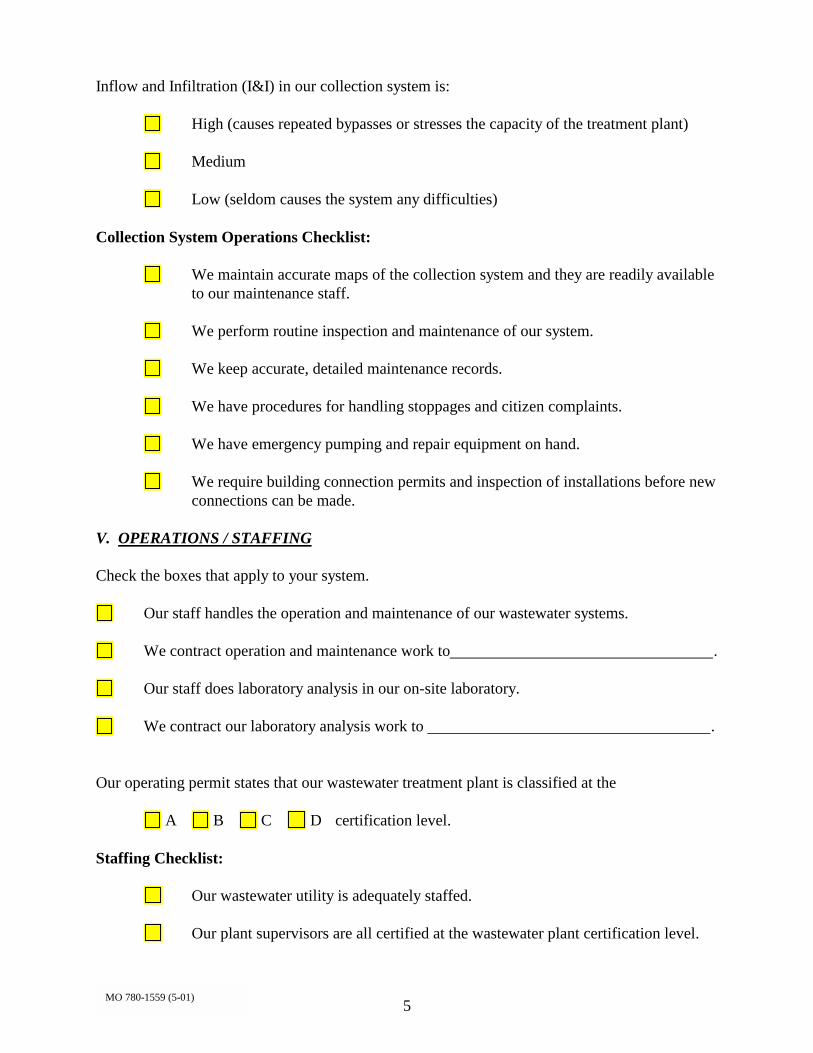
Inflow and Infiltration (I&I) in our collection system is:
High (causes repeated bypasses or stresses the capacity of the treatment plant)
Medium
Low (seldom causes the system any difficulties)
Collection System Operations Checklist:
We maintain accurate maps of the collection system and they are readily availableto our maintenance staff.
We perform routine inspection and maintenance of our system.
We keep accurate, detailed maintenance records.
We have procedures for handling stoppages and citizen complaints.
We have emergency pumping and repair equipment on hand.
We require building connection permits and inspection of installations before newconnections can be made.
V. OPERATIONS / STAFFING
Check the boxes that apply to your system.
Our staff handles the operation and maintenance of our wastewater systems.
We contract operation and maintenance work to .
Our staff does laboratory analysis in our on-site laboratory.
We contract our laboratory analysis work to .
Our operating permit states that our wastewater treatment plant is classified at the
A B C D certification level.
Staffing Checklist:
Our wastewater utility is adequately staffed.
Our plant supervisors are all certified at the wastewater plant certification level.
6MO 780-1559 (5-01)
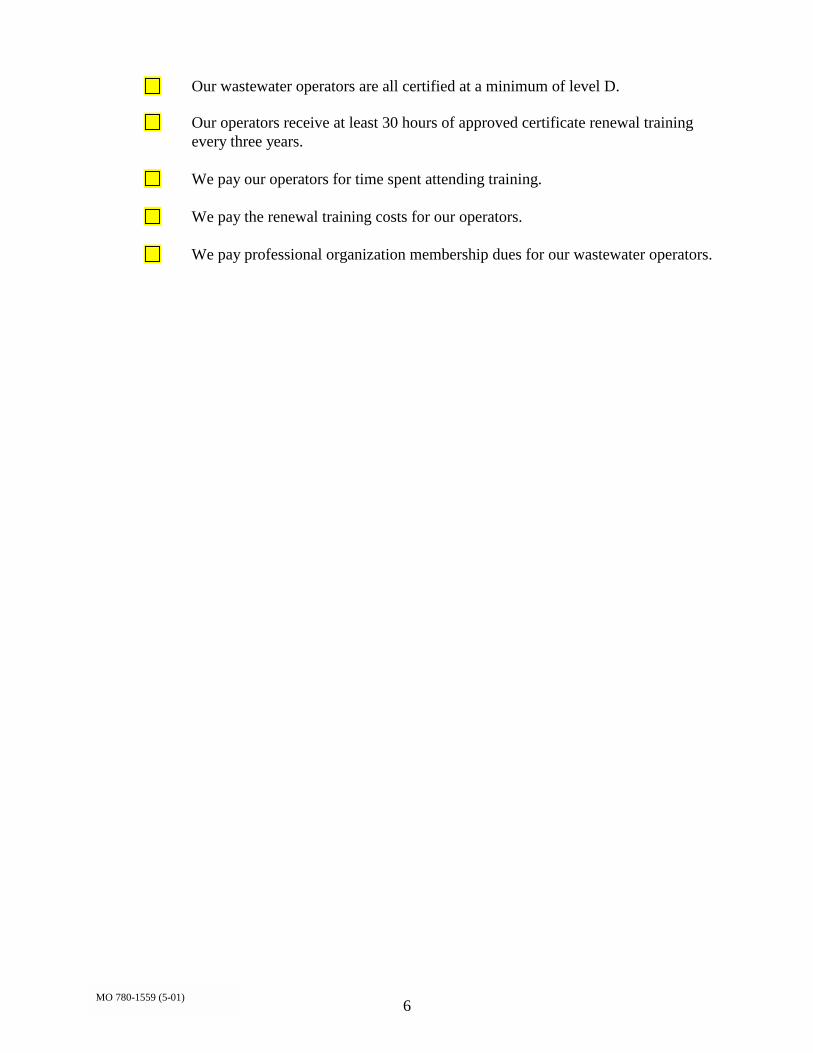
Our wastewater operators are all certified at a minimum of level D.
Our operators receive at least 30 hours of approved certificate renewal trainingevery three years.
We pay our operators for time spent attending training.
We pay the renewal training costs for our operators.
We pay professional organization membership dues for our wastewater operators.
7MO 780-1559 (5-01)
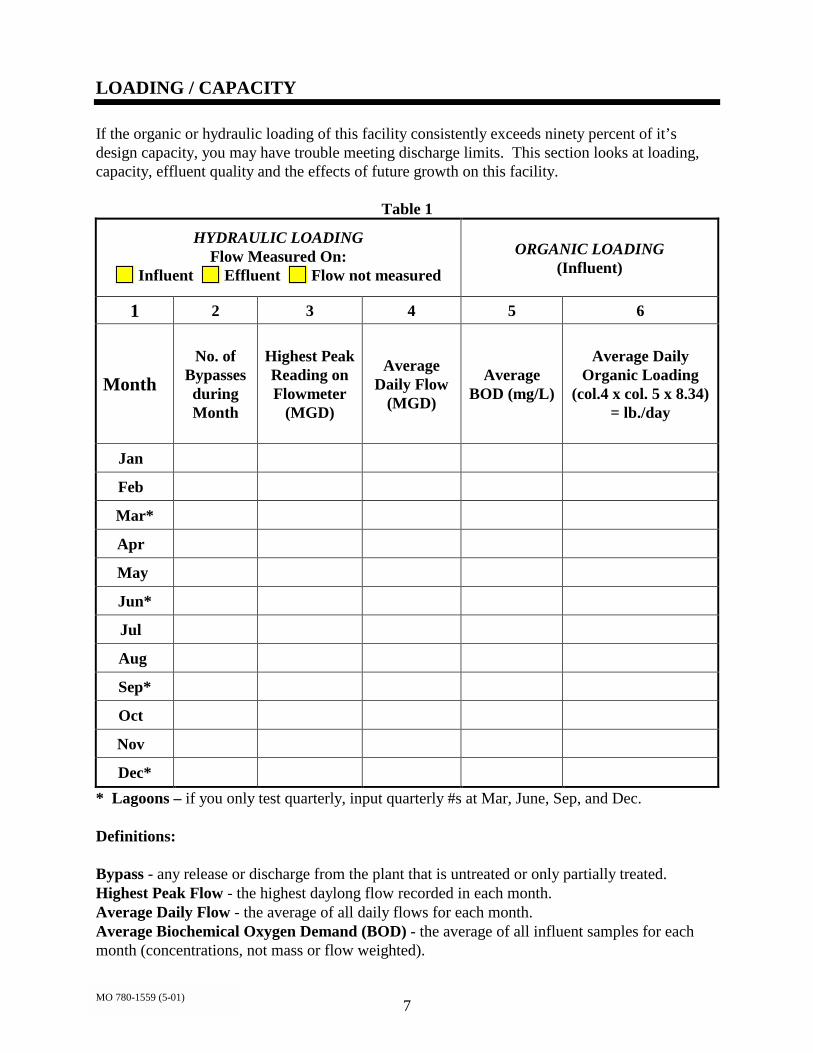
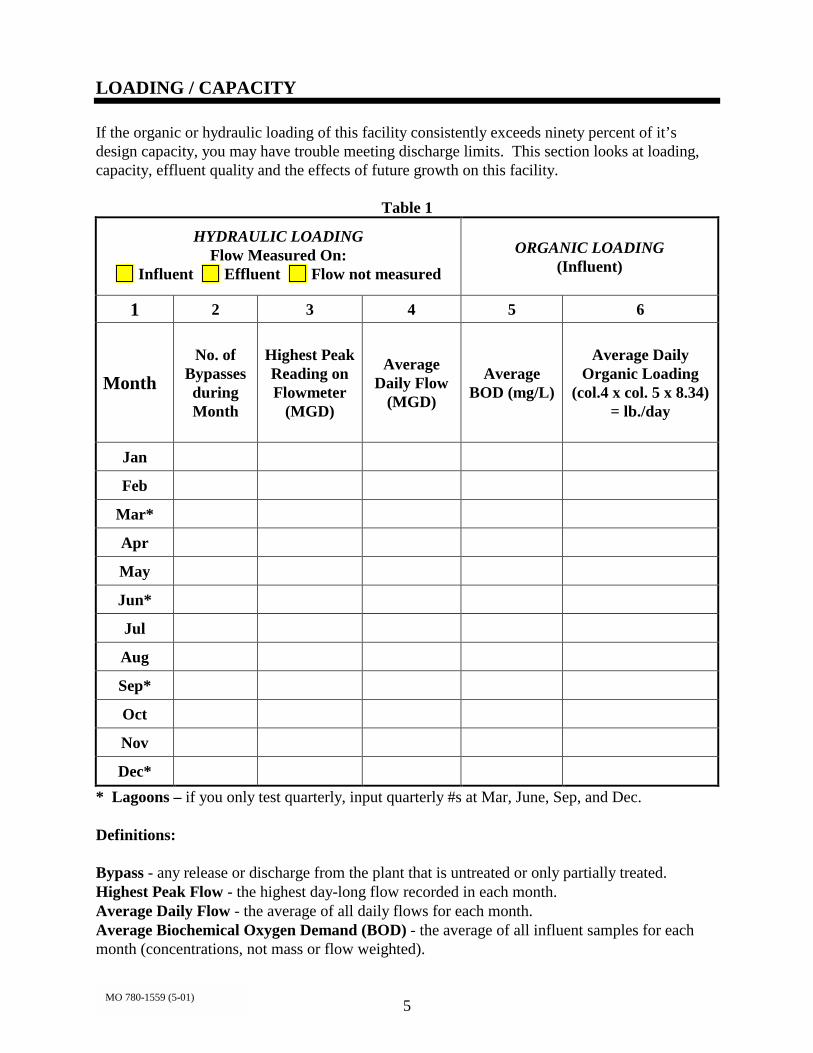
LOADING / CAPACITY
If the organic or hydraulic loading of this facility consistently exceeds ninety percent of it’sdesign capacity, you may have trouble meeting discharge limits. This section looks at loading,capacity, effluent quality and the effects of future growth on this facility.
Table 1
HYDRAULIC LOADINGFlow Measured On:
Influent Effluent Flow not measuredORGANIC LOADING
(Influent)
1 2 3 4 5 6
MonthNo. of
BypassesduringMonth
Highest PeakReading onFlowmeter
(MGD)
AverageDaily Flow
(MGD)
AverageBOD (mg/L)
Average DailyOrganic Loading
(col.4 x col. 5 x 8.34)= lb./day
Jan
Feb
Mar*
Apr
May
Jun*
Jul
Aug
Sep*
Oct
Nov
Dec** Lagoons – if you only test quarterly, input quarterly #s at Mar, June, Sep, and Dec.
Definitions:
Bypass - any release or discharge from the plant that is untreated or only partially treated.Highest Peak Flow - the highest daylong flow recorded in each month.Average Daily Flow - the average of all daily flows for each month.Average Biochemical Oxygen Demand (BOD) - the average of all influent samples for eachmonth (concentrations, not mass or flow weighted).
8MO 780-1559 (5-01)
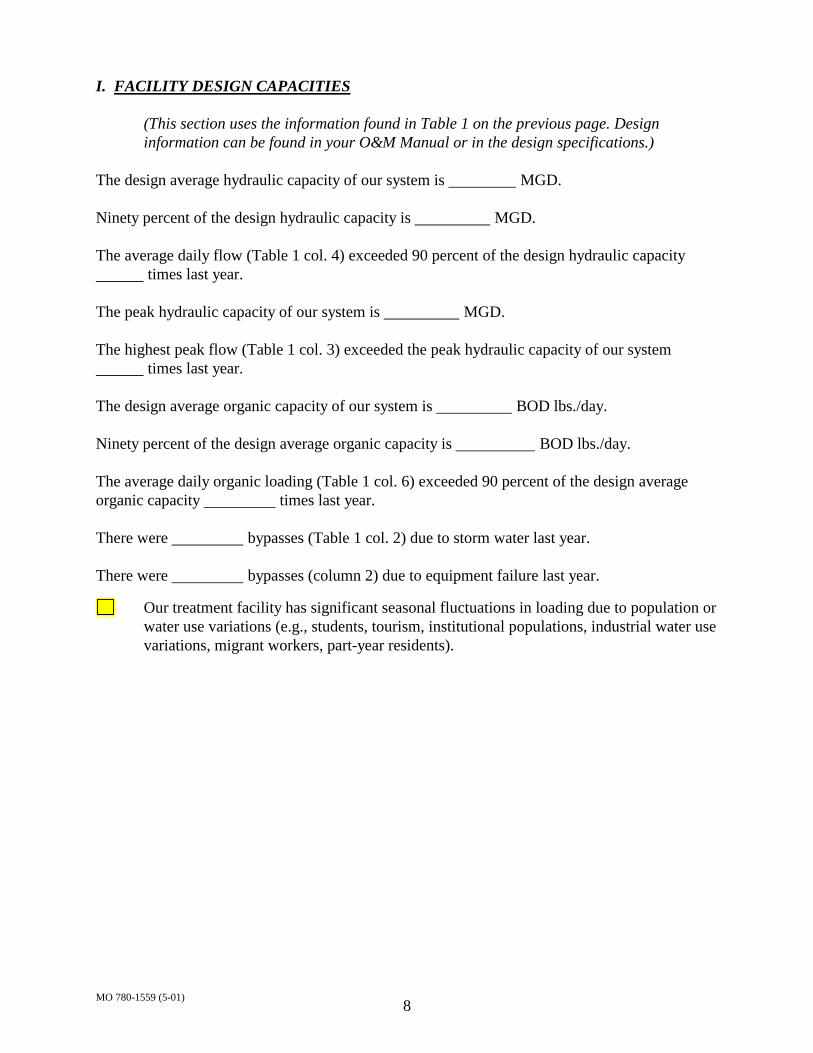
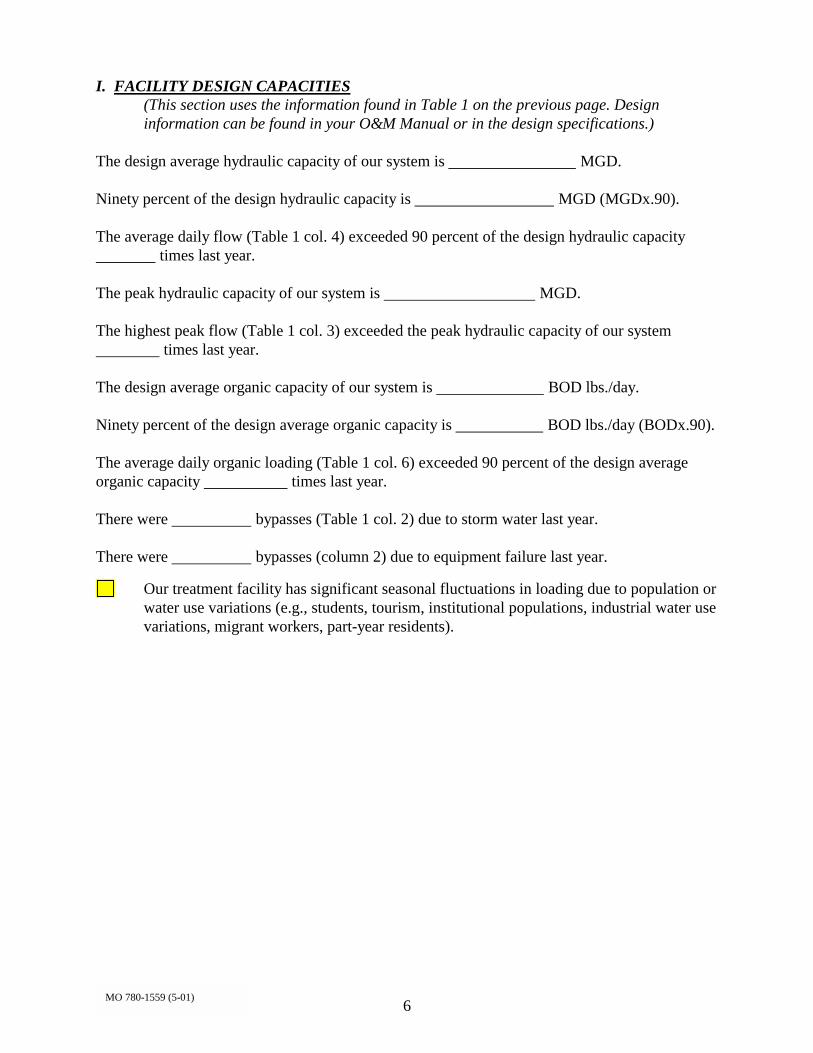
I. FACILITY DESIGN CAPACITIES
(This section uses the information found in Table 1 on the previous page. Designinformation can be found in your O&M Manual or in the design specifications.)
The design average hydraulic capacity of our system is MGD.
Ninety percent of the design hydraulic capacity is MGD.
The average daily flow (Table 1 col. 4) exceeded 90 percent of the design hydraulic capacity times last year.
The peak hydraulic capacity of our system is MGD.
The highest peak flow (Table 1 col. 3) exceeded the peak hydraulic capacity of our system times last year.
The design average organic capacity of our system is BOD lbs./day.
Ninety percent of the design average organic capacity is BOD lbs./day.
The average daily organic loading (Table 1 col. 6) exceeded 90 percent of the design averageorganic capacity times last year. There were bypasses (Table 1 col. 2) due to storm water last year.
There were bypasses (column 2) due to equipment failure last year.
Our treatment facility has significant seasonal fluctuations in loading due to population orwater use variations (e.g., students, tourism, institutional populations, industrial water usevariations, migrant workers, part-year residents).

9MO 780-1559 (5-01)
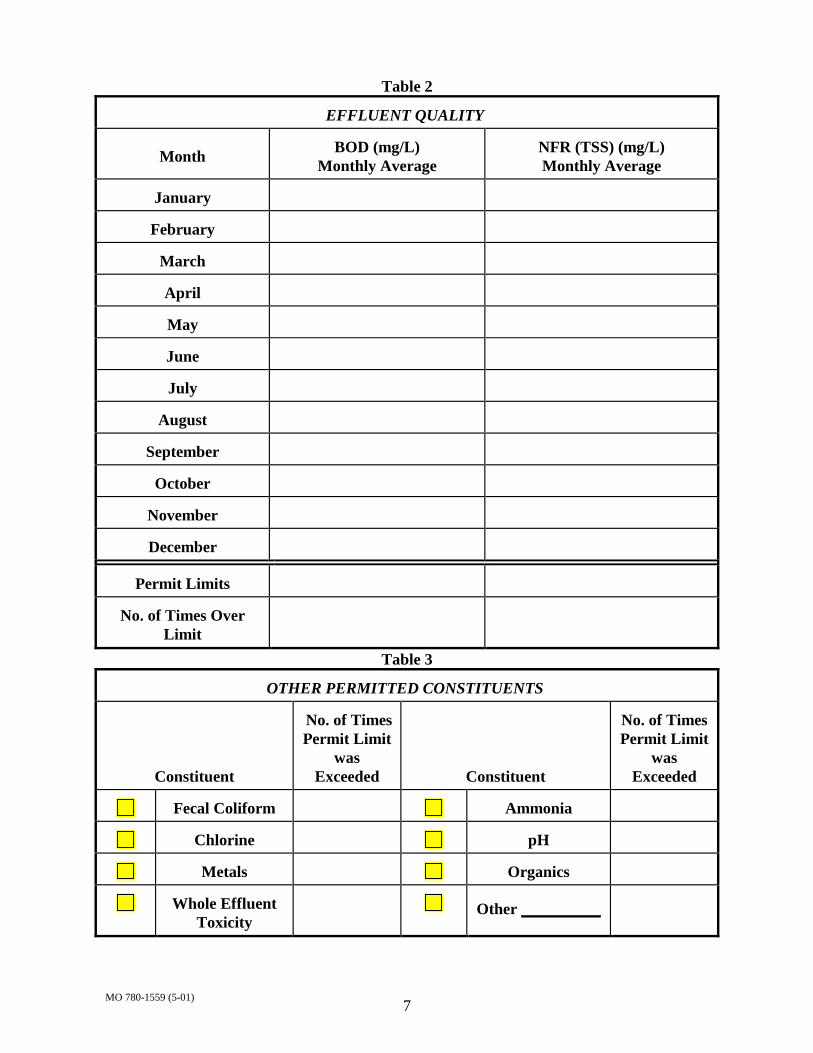
Table 2
EFFLUENT QUALITY
Month BOD (mg/L)Monthly Average
NFR (TSS) (mg/L)Monthly Average
January
February
March
April
May
June
July
August
September
October
November
December
Permit Limits
No. of Times OverLimit
Table 3
OTHER PERMITTED CONSTITUENTS
Constituent
No. of TimesPermit Limit
wasExceeded Constituent
No. of TimesPermit Limit
wasExceeded
Fecal Coliform Ammonia
Chlorine pH
Metals Organics
Whole EffluentToxicity
Other
10MO 780-1559 (5-01)
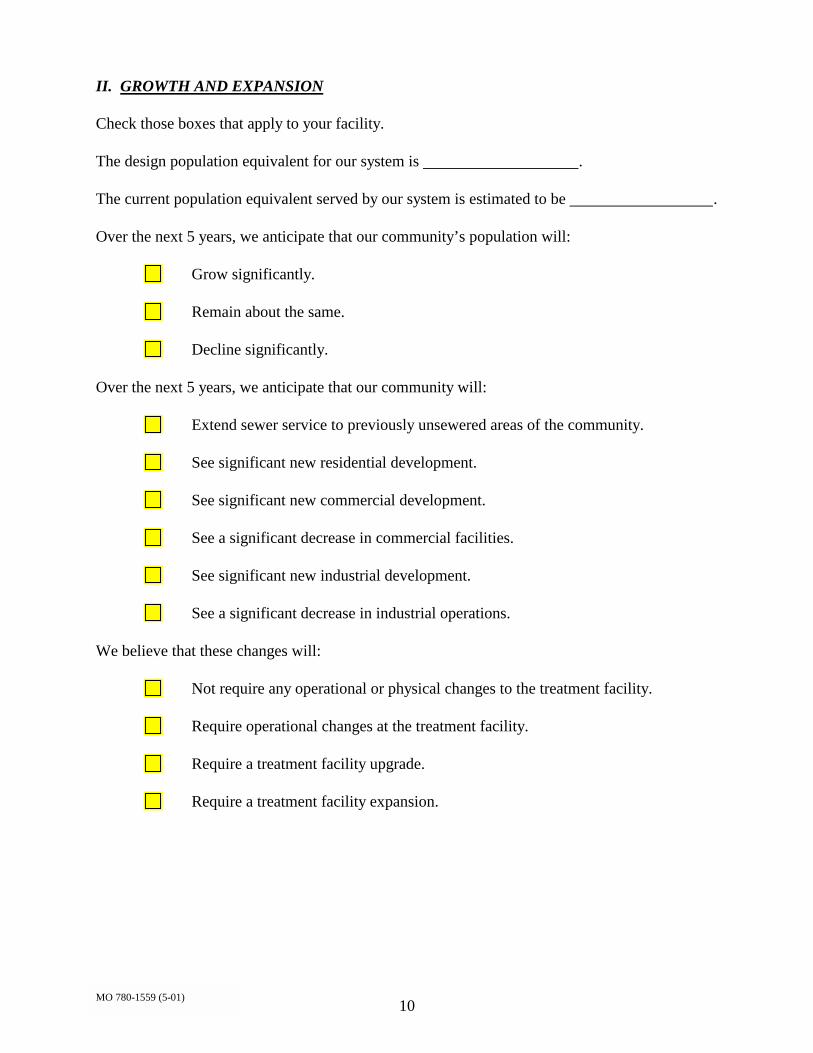
II. GROWTH AND EXPANSION
Check those boxes that apply to your facility.
The design population equivalent for our system is .
The current population equivalent served by our system is estimated to be .
Over the next 5 years, we anticipate that our community’s population will:
Grow significantly.
Remain about the same.
Decline significantly.
Over the next 5 years, we anticipate that our community will:
Extend sewer service to previously unsewered areas of the community.
See significant new residential development.
See significant new commercial development.
See a significant decrease in commercial facilities.
See significant new industrial development.
See a significant decrease in industrial operations.
We believe that these changes will:
Not require any operational or physical changes to the treatment facility.
Require operational changes at the treatment facility.
Require a treatment facility upgrade.
Require a treatment facility expansion.
11MO 780-1559 (5-01)
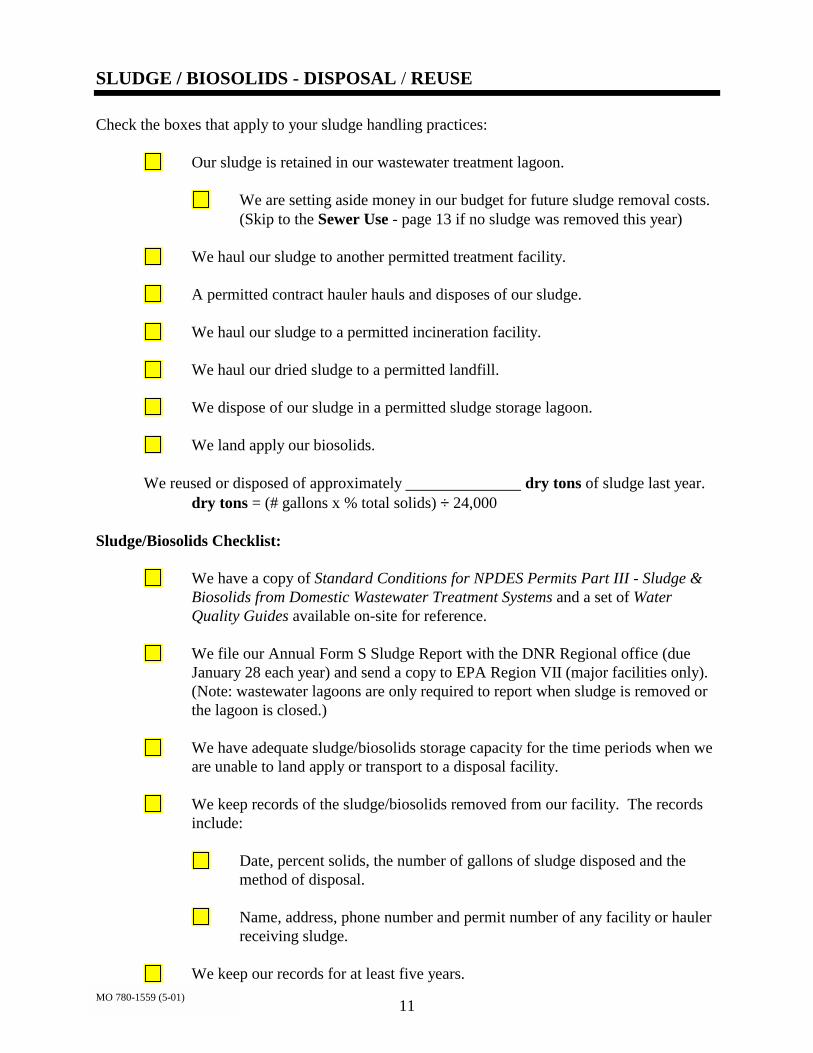
SLUDGE / BIOSOLIDS - DISPOSAL / REUSE
Check the boxes that apply to your sludge handling practices:
Our sludge is retained in our wastewater treatment lagoon.
We are setting aside money in our budget for future sludge removal costs.(Skip to the Sewer Use - page 13 if no sludge was removed this year)
We haul our sludge to another permitted treatment facility.
A permitted contract hauler hauls and disposes of our sludge.
We haul our sludge to a permitted incineration facility.
We haul our dried sludge to a permitted landfill.
We dispose of our sludge in a permitted sludge storage lagoon.
We land apply our biosolids.
We reused or disposed of approximately dry tons of sludge last year.dry tons = (# gallons x % total solids) ÷ 24,000
Sludge/Biosolids Checklist:
We have a copy of Standard Conditions for NPDES Permits Part III - Sludge &Biosolids from Domestic Wastewater Treatment Systems and a set of WaterQuality Guides available on-site for reference.
We file our Annual Form S Sludge Report with the DNR Regional office (dueJanuary 28 each year) and send a copy to EPA Region VII (major facilities only).(Note: wastewater lagoons are only required to report when sludge is removed orthe lagoon is closed.)
We have adequate sludge/biosolids storage capacity for the time periods when weare unable to land apply or transport to a disposal facility.
We keep records of the sludge/biosolids removed from our facility. The recordsinclude:
Date, percent solids, the number of gallons of sludge disposed and themethod of disposal.
Name, address, phone number and permit number of any facility or haulerreceiving sludge.
We keep our records for at least five years.
12MO 780-1559 (5-01)
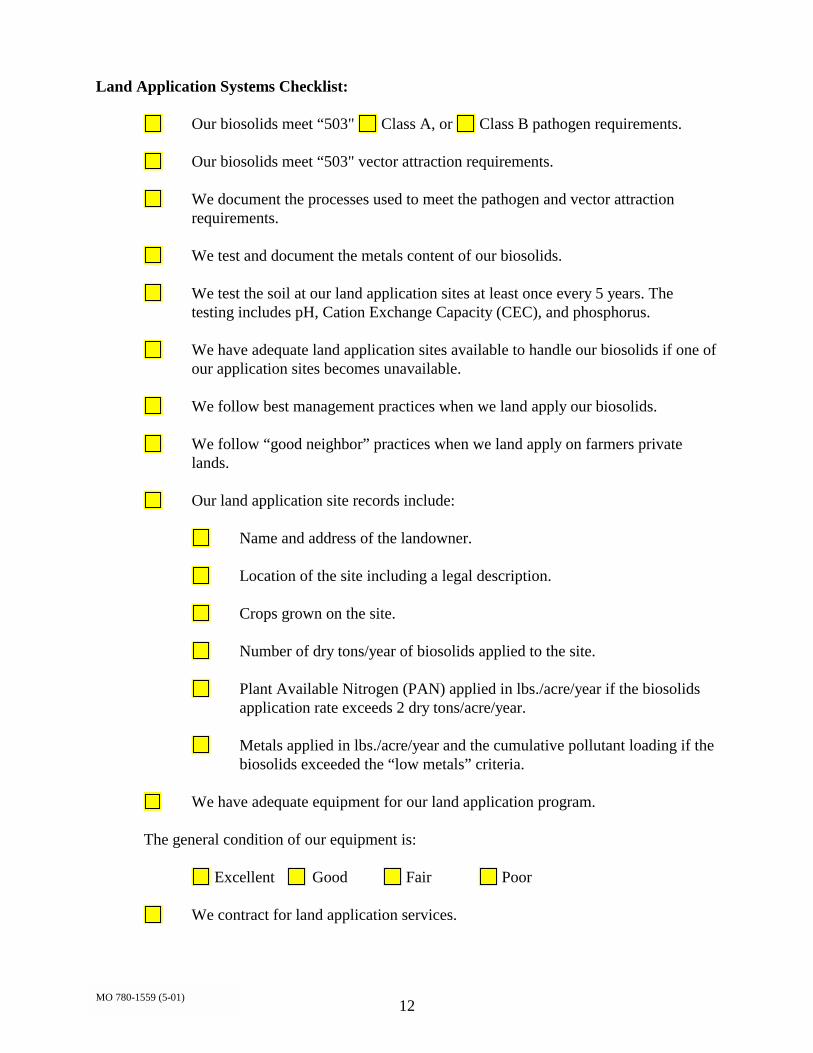
Land Application Systems Checklist:
Our biosolids meet “503" Class A, or Class B pathogen requirements.
Our biosolids meet “503" vector attraction requirements.
We document the processes used to meet the pathogen and vector attractionrequirements.
We test and document the metals content of our biosolids.
We test the soil at our land application sites at least once every 5 years. Thetesting includes pH, Cation Exchange Capacity (CEC), and phosphorus.
We have adequate land application sites available to handle our biosolids if one ofour application sites becomes unavailable.
We follow best management practices when we land apply our biosolids.
We follow “good neighbor” practices when we land apply on farmers privatelands.
Our land application site records include:
Name and address of the landowner.
Location of the site including a legal description.
Crops grown on the site.
Number of dry tons/year of biosolids applied to the site.
Plant Available Nitrogen (PAN) applied in lbs./acre/year if the biosolidsapplication rate exceeds 2 dry tons/acre/year.
Metals applied in lbs./acre/year and the cumulative pollutant loading if thebiosolids exceeded the “low metals” criteria.
We have adequate equipment for our land application program.
The general condition of our equipment is:
Excellent Good Fair Poor
We contract for land application services.
13MO 780-1559 (5-01)
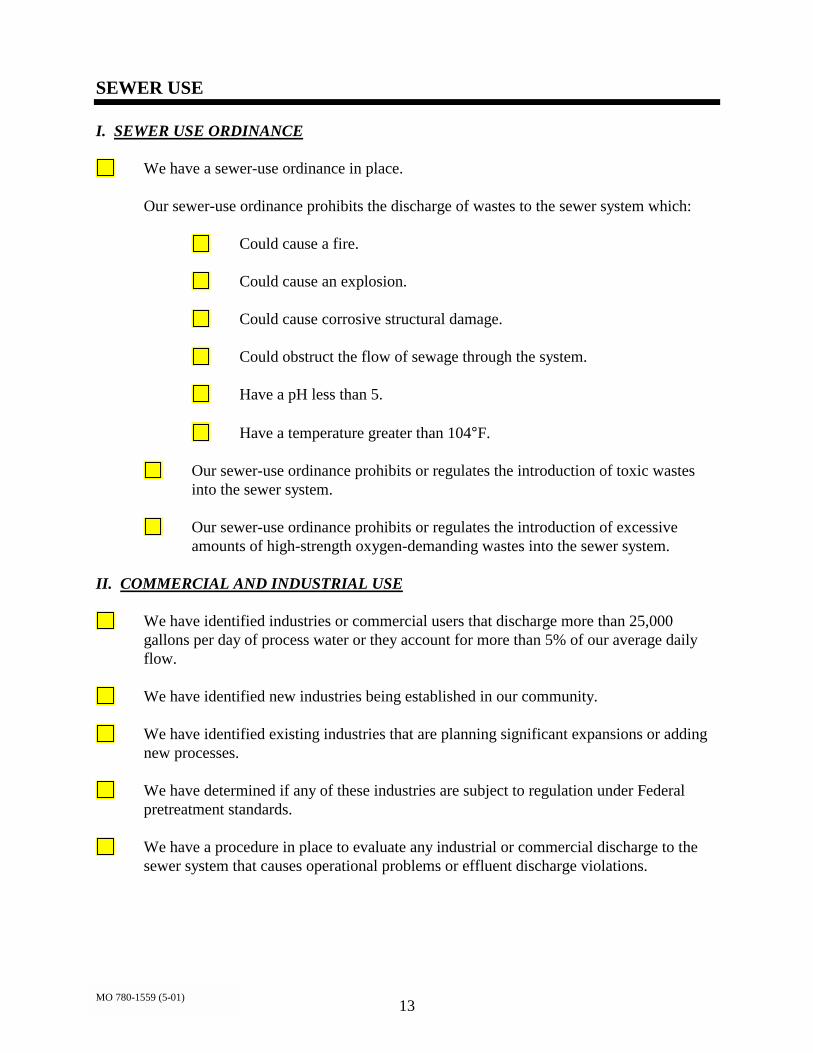
SEWER USE
I. SEWER USE ORDINANCE
We have a sewer-use ordinance in place.
Our sewer-use ordinance prohibits the discharge of wastes to the sewer system which:
Could cause a fire.
Could cause an explosion.
Could cause corrosive structural damage.
Could obstruct the flow of sewage through the system.
Have a pH less than 5.
Have a temperature greater than 104°F.
Our sewer-use ordinance prohibits or regulates the introduction of toxic wastesinto the sewer system.
Our sewer-use ordinance prohibits or regulates the introduction of excessiveamounts of high-strength oxygen-demanding wastes into the sewer system.
II. COMMERCIAL AND INDUSTRIAL USE
We have identified industries or commercial users that discharge more than 25,000gallons per day of process water or they account for more than 5% of our average dailyflow.
We have identified new industries being established in our community.
We have identified existing industries that are planning significant expansions or addingnew processes.
We have determined if any of these industries are subject to regulation under Federalpretreatment standards.
We have a procedure in place to evaluate any industrial or commercial discharge to thesewer system that causes operational problems or effluent discharge violations.
14MO 780-1559 (5-01)
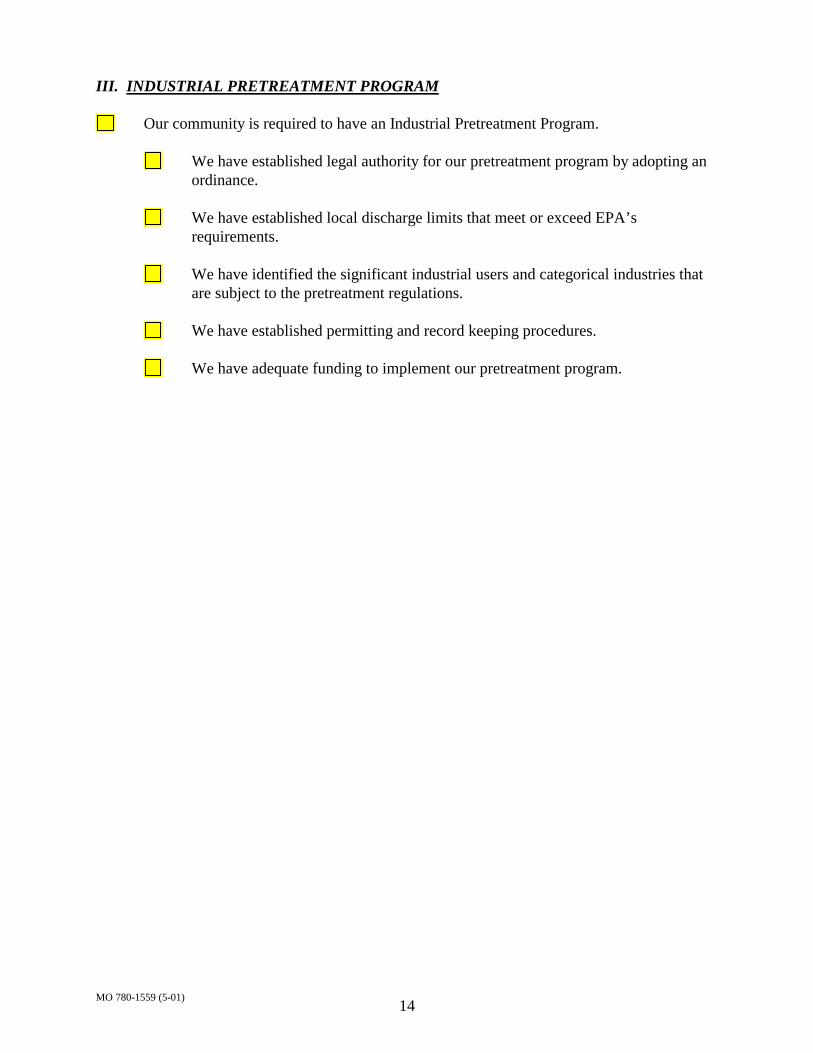
III. INDUSTRIAL PRETREATMENT PROGRAM
Our community is required to have an Industrial Pretreatment Program.
We have established legal authority for our pretreatment program by adopting anordinance.
We have established local discharge limits that meet or exceed EPA’srequirements.
We have identified the significant industrial users and categorical industries thatare subject to the pretreatment regulations.
We have established permitting and record keeping procedures.
We have adequate funding to implement our pretreatment program.
15MO 780-1559 (5-01)
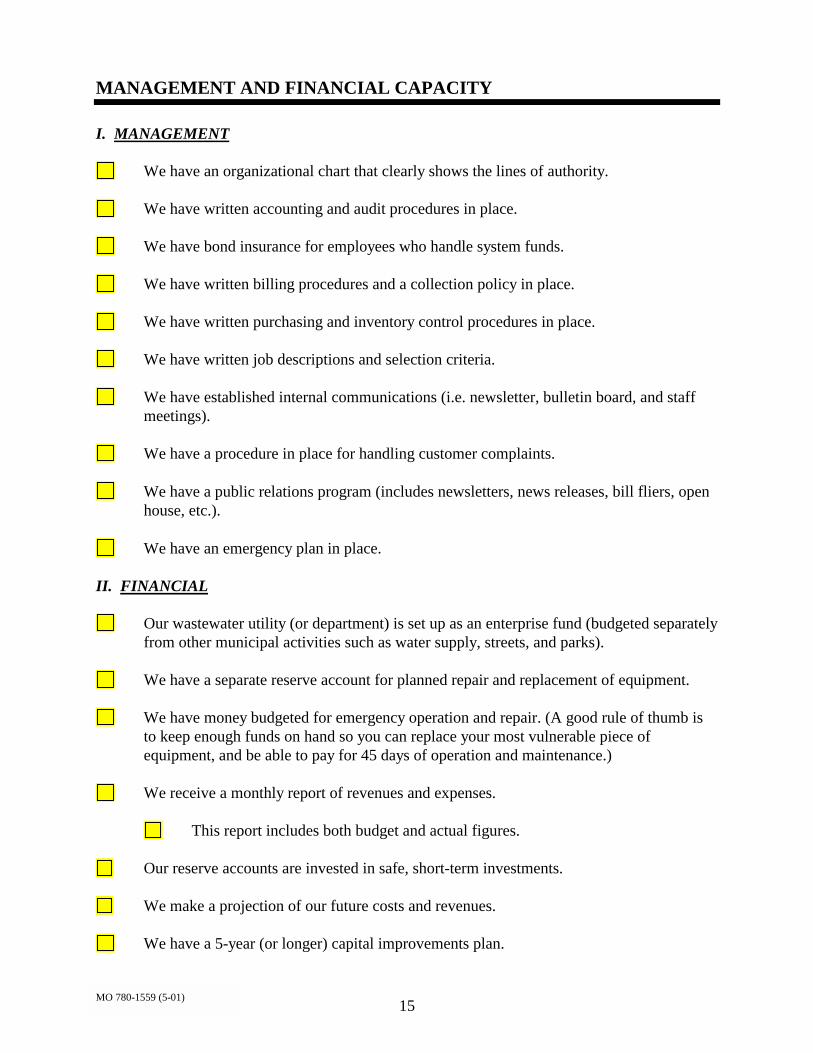
MANAGEMENT AND FINANCIAL CAPACITY
I. MANAGEMENT
We have an organizational chart that clearly shows the lines of authority.
We have written accounting and audit procedures in place.
We have bond insurance for employees who handle system funds.
We have written billing procedures and a collection policy in place.
We have written purchasing and inventory control procedures in place.
We have written job descriptions and selection criteria.
We have established internal communications (i.e. newsletter, bulletin board, and staffmeetings).
We have a procedure in place for handling customer complaints.
We have a public relations program (includes newsletters, news releases, bill fliers, openhouse, etc.).
We have an emergency plan in place.
II. FINANCIAL
Our wastewater utility (or department) is set up as an enterprise fund (budgeted separatelyfrom other municipal activities such as water supply, streets, and parks).
We have a separate reserve account for planned repair and replacement of equipment.
We have money budgeted for emergency operation and repair. (A good rule of thumb isto keep enough funds on hand so you can replace your most vulnerable piece ofequipment, and be able to pay for 45 days of operation and maintenance.)
We receive a monthly report of revenues and expenses.
This report includes both budget and actual figures.
Our reserve accounts are invested in safe, short-term investments.
We make a projection of our future costs and revenues.
We have a 5-year (or longer) capital improvements plan.
16MO 780-1559 (5-01)
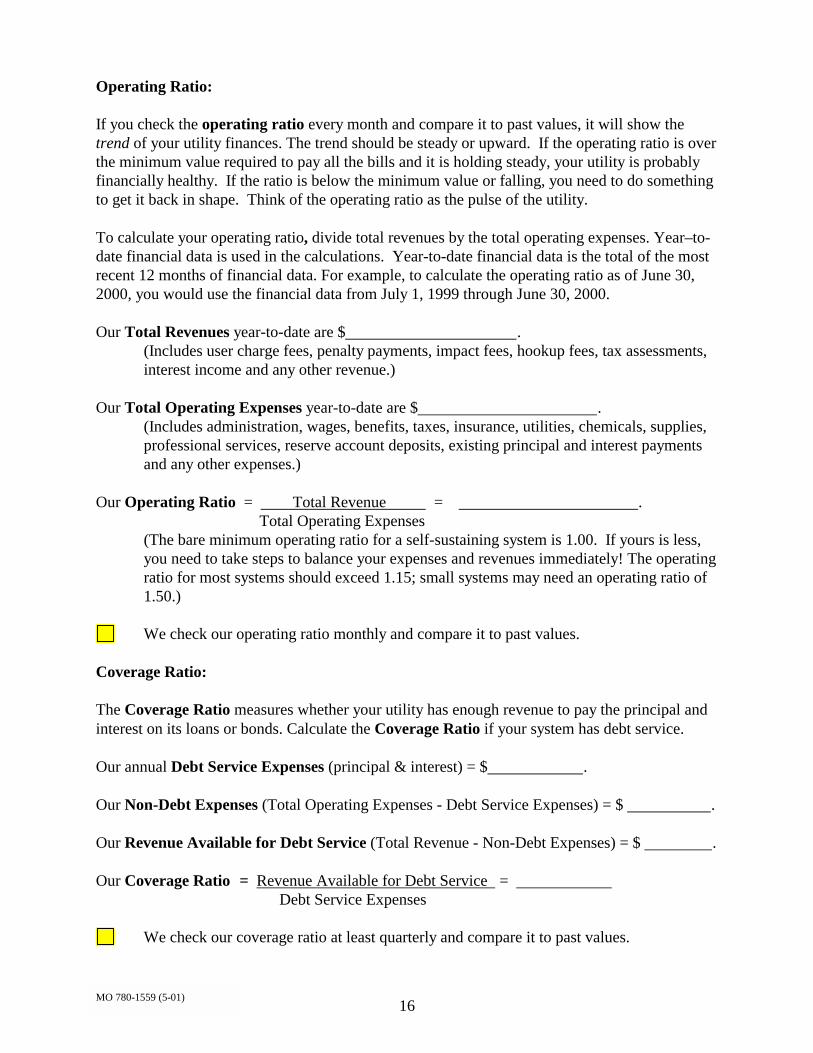
Operating Ratio:
If you check the operating ratio every month and compare it to past values, it will show thetrend of your utility finances. The trend should be steady or upward. If the operating ratio is overthe minimum value required to pay all the bills and it is holding steady, your utility is probablyfinancially healthy. If the ratio is below the minimum value or falling, you need to do somethingto get it back in shape. Think of the operating ratio as the pulse of the utility.
To calculate your operating ratio, divide total revenues by the total operating expenses. Year–to-date financial data is used in the calculations. Year-to-date financial data is the total of the mostrecent 12 months of financial data. For example, to calculate the operating ratio as of June 30,2000, you would use the financial data from July 1, 1999 through June 30, 2000.
Our Total Revenues year-to-date are $ . (Includes user charge fees, penalty payments, impact fees, hookup fees, tax assessments,interest income and any other revenue.)
Our Total Operating Expenses year-to-date are $ .(Includes administration, wages, benefits, taxes, insurance, utilities, chemicals, supplies,professional services, reserve account deposits, existing principal and interest paymentsand any other expenses.)
Our Operating Ratio = Total Revenue = . Total Operating Expenses
(The bare minimum operating ratio for a self-sustaining system is 1.00. If yours is less,you need to take steps to balance your expenses and revenues immediately! The operatingratio for most systems should exceed 1.15; small systems may need an operating ratio of1.50.)
We check our operating ratio monthly and compare it to past values.
Coverage Ratio:
The Coverage Ratio measures whether your utility has enough revenue to pay the principal andinterest on its loans or bonds. Calculate the Coverage Ratio if your system has debt service.
Our annual Debt Service Expenses (principal & interest) = $ .
Our Non-Debt Expenses (Total Operating Expenses - Debt Service Expenses) = $ .
Our Revenue Available for Debt Service (Total Revenue - Non-Debt Expenses) = $ .
Our Coverage Ratio = Revenue Available for Debt Service = Debt Service Expenses
We check our coverage ratio at least quarterly and compare it to past values.
17MO 780-1559 (5-01)
Our coverage ratio meets the requirements of our outstanding bonds and loans.(Usually the terms of a bond or loan require a coverage ratio of 1.25 or higher.)
User Charge:
Having an adequate user charge in place is essential for operating and maintaining yourwastewater utility.
We have a user charge ordinance in place.
We review our user charge rates at least once every two years and adjust rates as needed.
Our rate structure is fair and equitable.
The operation and maintenance costs of our system are charged to customers on a“proportional to use” basis (required for EPA grant and SRF loan recipients).
We have surcharges for high-strength or high-volume wastewater flows released into thesewage system (if there are such discharges).
We keep our customers well informed of the rate structure.
The number of customers connected to our system, including those we do not charge = .
The number of customers who regularly pay their bills every month = .
Our collection rate = # of customer accounts collected X 100 = %. total number of customer accounts
(If the collection rate is less than 95%, you should take steps to improve collections.)
Average Treatment Costs:
Our average cost to treat 1000 gallons of wastewater =
Total Operating Expenses per year x 1000 gallons = $ per 1000 gal.(Average Daily Flow gal/day) x (365 days/yr.)
We calculate our average treatment costs/1000 gallons each year and compare this figureto past values.
Our treatment costs/1000 gallons have remained stable or risen at a manageable rate overthe past year.
18MO 780-1559 (5-01)
RESOURCES
I. TECHNICAL ASSISTANCE
Department of Natural Resources, Technical Assistance Program (TAP)1-800-316-4827 or (573) 526-6627http://www.dnr.state.mo.us/deq/tap/lgov.htm
√ Show-Me Ratemaker software √ Treatment systems troubleshooting√ User charge analysis assistance √ Operator certification and training information√ Model sewer use ordinance √ Sludge management information√ Project financing information √ Lagoon closure guidance√ Assistance and information links √ Environmental Management Institute for local√=Risk management plans government officials
Department of Natural Resources, Energy Center(573) 751-4000http://www.dnr.state.mo.us/de/energy.htm
√ Energy efficiency assistance for electric motors, buildings, operations and processes√ Grants and loans for energy efficiency projects
Department of Natural Resources, Regional Offices and Environmental Programs1-800-361-4827 (call TAP for referral)http://www.dnr.state.mo.us/deq/index.html
√ Permitting information √ State Revolving Fund projects coordination√ Enforcement questions √ Pretreatment program questions √ Technical assistance
Midwest Assistance Program1-800-822-2981http://www.map-inc.org
√ Technical assistance √ Environmental system troubleshooting√ Environmental training
Missouri Rural Water Association(573) 474-6990http://www.moruralwater.org√ Technical assistance √ Environmental system troubleshooting√ Environmental training √ Smoke testing
19MO 780-1559 (5-01)
Regional Planning CommissionsCall TAP for phone number of commission that serves your area.1-800-361-4827
√ Grant applications √ Grant administration√ Project planning √ Community planning√ Training
II. TECHNICAL RESOURCESProduct catalogues, on-line discussion groups, conferences, training, and environmental news.
National Small Flows Clearing House (NSFC)National Environmental Training Center for Small Communities (NETCSC)P.O. Box 6064West Virginia UniversityMorgantown, WV 26506-6064(800) 624-8301 or (304) 293-4149Fax: (304) 293-3161http://www.nsfc.wvu.eduhttp://www.netc.wvu.edu
Water Environment Federation (WEF)601 Wythe StreetAlexandria, VA 22314-1994(800) 666-0206 or (703) 684-2452Fax: (703) 684-2492http://www.wef.org
American Public Works Association (APWA)2345 Grand BoulevardSuite 500Kansas City, MO 64108-2641(816) 472-6100Fax: (816)472-1610http://www.apwa.net
Association of Metropolitan Sewerage Agencies1000 Connecticut Avenue, NW, Suite 410Washington D.C. 20036-5302(202) 833-AMSAFax: (202) 833-4657http://amsa-cleanwater.org
20MO 780-1559 (5-01)
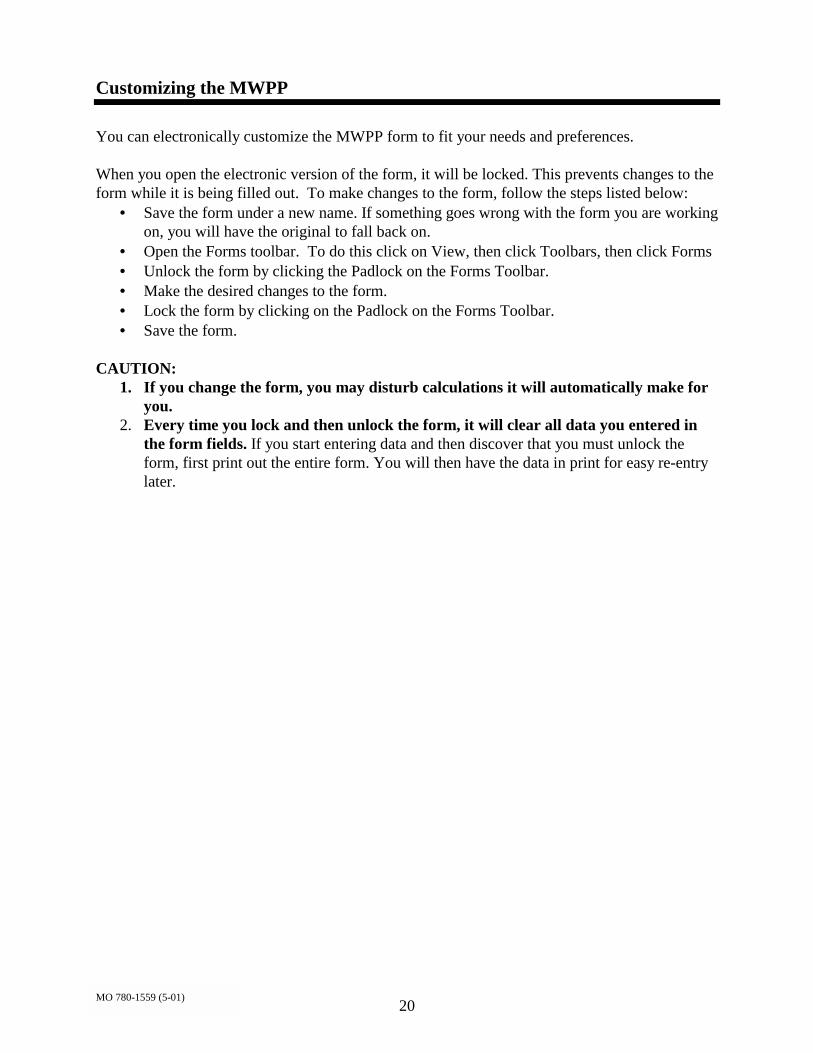
Customizing the MWPP
You can electronically customize the MWPP form to fit your needs and preferences.
When you open the electronic version of the form, it will be locked. This prevents changes to theform while it is being filled out. To make changes to the form, follow the steps listed below:
• Save the form under a new name. If something goes wrong with the form you are workingon, you will have the original to fall back on.
• Open the Forms toolbar. To do this click on View, then click Toolbars, then click Forms• Unlock the form by clicking the Padlock on the Forms Toolbar.• Make the desired changes to the form.• Lock the form by clicking on the Padlock on the Forms Toolbar.• Save the form.
CAUTION:1. If you change the form, you may disturb calculations it will automatically make for
you.2. Every time you lock and then unlock the form, it will clear all data you entered in
the form fields. If you start entering data and then discover that you must unlock theform, first print out the entire form. You will then have the data in print for easy re-entrylater.
1MO 780-1559 (5-01)
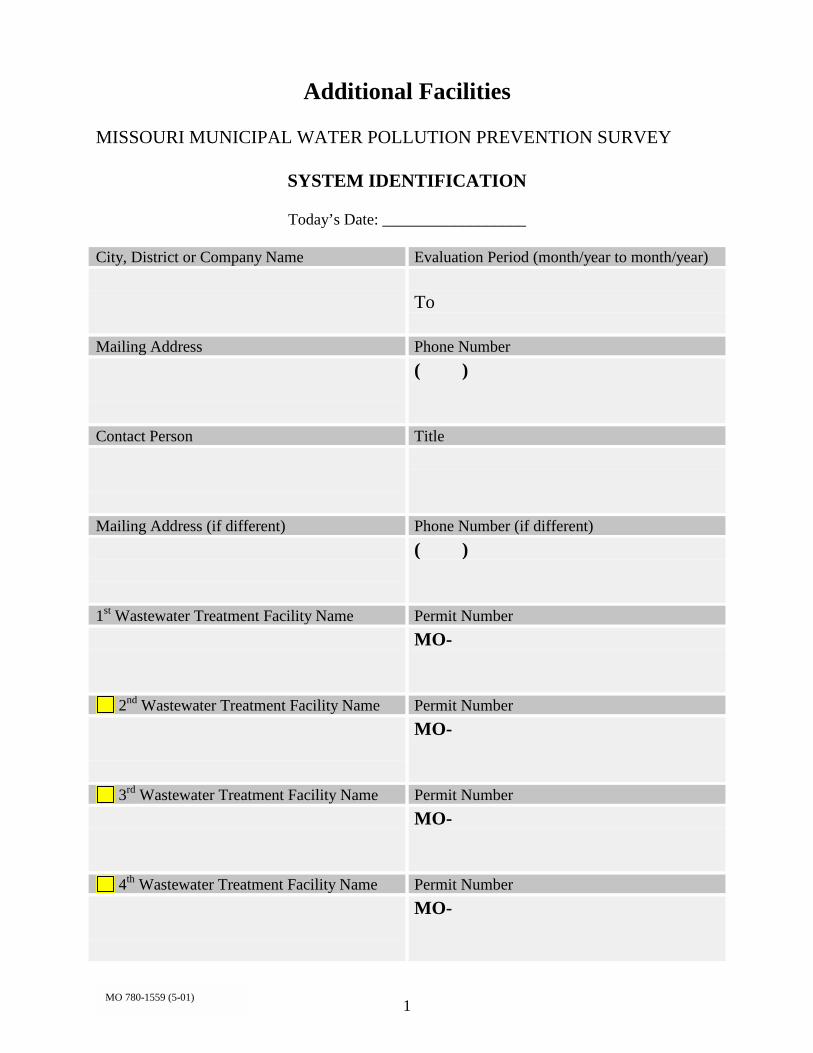
Additional Facilities
MISSOURI MUNICIPAL WATER POLLUTION PREVENTION SURVEY
SYSTEM IDENTIFICATION
Today’s Date: __________________
City, District or Company Name Evaluation Period (month/year to month/year)
To
Mailing Address Phone Number( )
Contact Person Title
Mailing Address (if different) Phone Number (if different)( )
1st Wastewater Treatment Facility Name Permit NumberMO-
2nd Wastewater Treatment Facility Name Permit NumberMO-
3rd Wastewater Treatment Facility Name Permit NumberMO-
4th Wastewater Treatment Facility Name Permit NumberMO-
2MO 780-1559 (5-01)
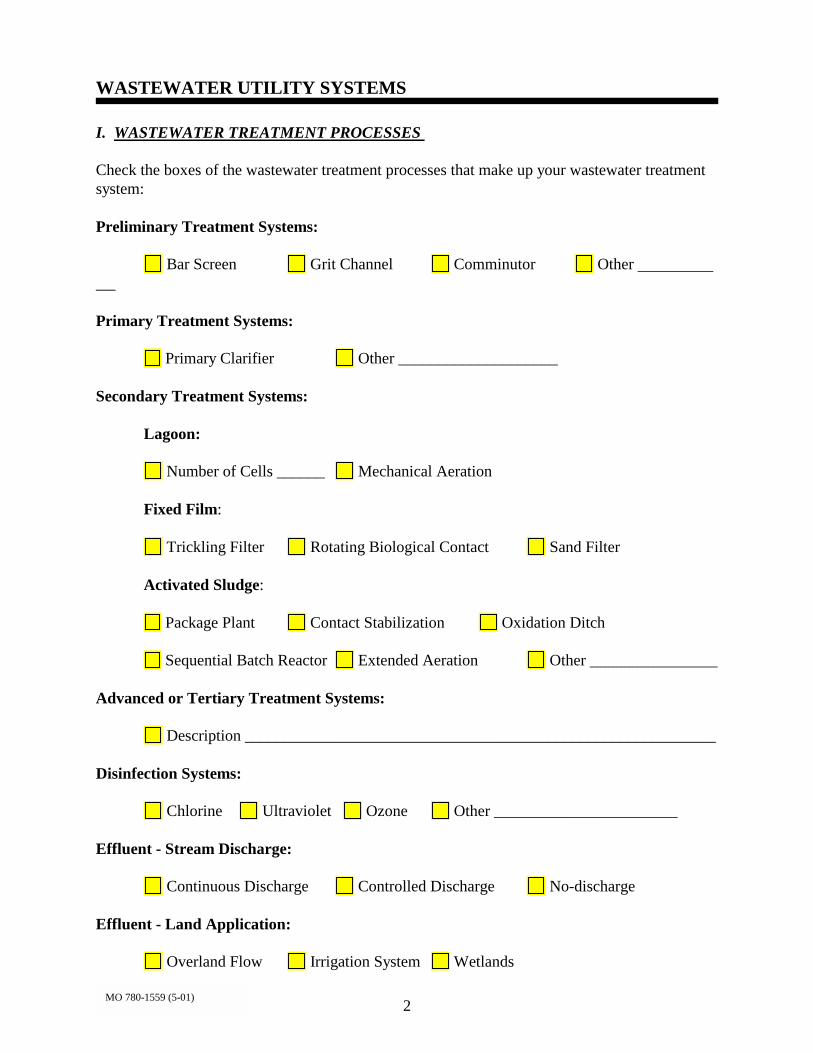
WASTEWATER UTILITY SYSTEMS
I. WASTEWATER TREATMENT PROCESSES
Check the boxes of the wastewater treatment processes that make up your wastewater treatmentsystem:
Preliminary Treatment Systems:
Bar Screen Grit Channel Comminutor Other
Primary Treatment Systems:
Primary Clarifier Other ____________________
Secondary Treatment Systems:
Lagoon:
Number of Cells ______ Mechanical Aeration
Fixed Film:
Trickling Filter Rotating Biological Contact Sand Filter
Activated Sludge:
Package Plant Contact Stabilization Oxidation Ditch
Sequential Batch Reactor Extended Aeration Other ________________
Advanced or Tertiary Treatment Systems:
Description ___________________________________________________________
Disinfection Systems:
Chlorine Ultraviolet Ozone Other _______________________
Effluent - Stream Discharge:
Continuous Discharge Controlled Discharge No-discharge
Effluent - Land Application:
Overland Flow Irrigation System Wetlands
3MO 780-1559 (5-01)
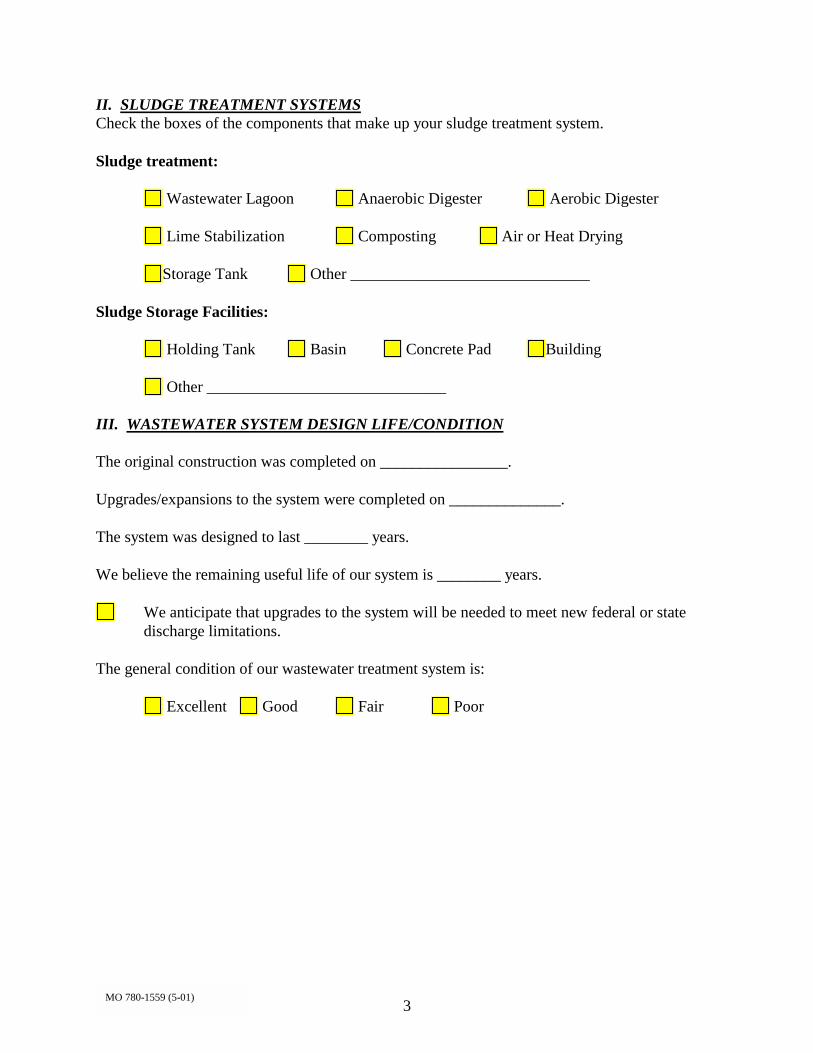
II. SLUDGE TREATMENT SYSTEMSCheck the boxes of the components that make up your sludge treatment system.
Sludge treatment:
Wastewater Lagoon Anaerobic Digester Aerobic Digester
Lime Stabilization Composting Air or Heat Drying
Storage Tank Other ______________________________
Sludge Storage Facilities:
Holding Tank Basin Concrete Pad Building
Other ______________________________
III. WASTEWATER SYSTEM DESIGN LIFE/CONDITION
The original construction was completed on ________________.
Upgrades/expansions to the system were completed on ______________.
The system was designed to last ________ years.
We believe the remaining useful life of our system is ________ years.
We anticipate that upgrades to the system will be needed to meet new federal or statedischarge limitations.
The general condition of our wastewater treatment system is:
Excellent Good Fair Poor
4MO 780-1559 (5-01)
Treatment Systems Operations Checklist:
The operation and maintenance manual is available on site.
We have adequate laboratory equipment for process control.
We have adequate laboratory equipment for regulatory testing or we contract forthis service.
We have a safety program, procedures and equipment in place.
We have a preventive/predictive maintenance program in place.
We have spare parts and equipment available for emergencies.
We keep accurate operations and maintenance records.
Facilities that store large quantities of chlorine, ammonia, anhydrous sulfurdioxide, or methane:
We have notified the Local Emergency Planning Commission (LEPC) andMissouri Emergency Response Commission (MERC) by filing MERCTier II forms with each agency.
Facilities that store more than threshold quantities of these chemicals:
We have a Risk Management Plan in place.
5MO 780-1559 (5-01)
LOADING / CAPACITY
If the organic or hydraulic loading of this facility consistently exceeds ninety percent of it’sdesign capacity, you may have trouble meeting discharge limits. This section looks at loading,capacity, effluent quality and the effects of future growth on this facility.
Table 1
HYDRAULIC LOADINGFlow Measured On:
Influent Effluent Flow not measuredORGANIC LOADING
(Influent)
1 2 3 4 5 6
MonthNo. of
BypassesduringMonth
Highest PeakReading onFlowmeter
(MGD)
AverageDaily Flow
(MGD)
AverageBOD (mg/L)
Average DailyOrganic Loading
(col.4 x col. 5 x 8.34)= lb./day
Jan
Feb
Mar*
Apr
May
Jun*
Jul
Aug
Sep*
Oct
Nov
Dec** Lagoons – if you only test quarterly, input quarterly #s at Mar, June, Sep, and Dec.
Definitions:
Bypass - any release or discharge from the plant that is untreated or only partially treated.Highest Peak Flow - the highest day-long flow recorded in each month.Average Daily Flow - the average of all daily flows for each month.Average Biochemical Oxygen Demand (BOD) - the average of all influent samples for eachmonth (concentrations, not mass or flow weighted).
6MO 780-1559 (5-01)
I. FACILITY DESIGN CAPACITIES(This section uses the information found in Table 1 on the previous page. Designinformation can be found in your O&M Manual or in the design specifications.)
The design average hydraulic capacity of our system is MGD.
Ninety percent of the design hydraulic capacity is MGD (MGDx.90).
The average daily flow (Table 1 col. 4) exceeded 90 percent of the design hydraulic capacity times last year.
The peak hydraulic capacity of our system is MGD.
The highest peak flow (Table 1 col. 3) exceeded the peak hydraulic capacity of our system times last year.
The design average organic capacity of our system is BOD lbs./day.
Ninety percent of the design average organic capacity is BOD lbs./day (BODx.90).
The average daily organic loading (Table 1 col. 6) exceeded 90 percent of the design averageorganic capacity times last year. There were bypasses (Table 1 col. 2) due to storm water last year.
There were bypasses (column 2) due to equipment failure last year.
Our treatment facility has significant seasonal fluctuations in loading due to population orwater use variations (e.g., students, tourism, institutional populations, industrial water usevariations, migrant workers, part-year residents).
7MO 780-1559 (5-01)
Table 2
EFFLUENT QUALITY
Month BOD (mg/L)Monthly Average
NFR (TSS) (mg/L)Monthly Average
January
February
March
April
May
June
July
August
September
October
November
December
Permit Limits
No. of Times OverLimit
Table 3
OTHER PERMITTED CONSTITUENTS
Constituent
No. of TimesPermit Limit
wasExceeded Constituent
No. of TimesPermit Limit
wasExceeded
Fecal Coliform Ammonia
Chlorine pH
Metals Organics
Whole EffluentToxicity
Other __________
8MO 780-1559 (5-01)
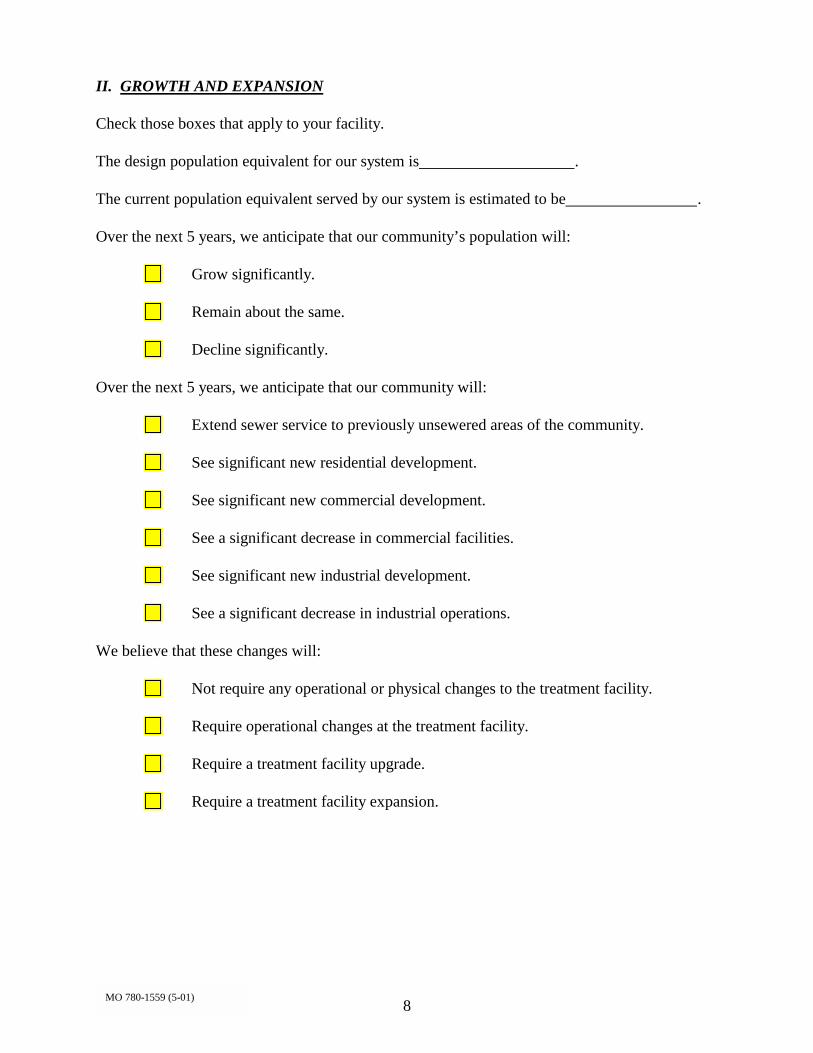
II. GROWTH AND EXPANSION
Check those boxes that apply to your facility.
The design population equivalent for our system is .
The current population equivalent served by our system is estimated to be .
Over the next 5 years, we anticipate that our community’s population will:
Grow significantly.
Remain about the same.
Decline significantly.
Over the next 5 years, we anticipate that our community will:
Extend sewer service to previously unsewered areas of the community.
See significant new residential development.
See significant new commercial development.
See a significant decrease in commercial facilities.
See significant new industrial development.
See a significant decrease in industrial operations.
We believe that these changes will:
Not require any operational or physical changes to the treatment facility.
Require operational changes at the treatment facility.
Require a treatment facility upgrade.
Require a treatment facility expansion.