Embed Size (px)
Citation preview
presented to
Missoula Community Transportation Safety Plan
Missoula Transportation Safety Advisory Committee – Meeting 1
Transportation leadership you can trust.
presented byCambridge Systematics, Inc.
February 21, 2013
Audrey Wennink
Project Team
Montana Department of Transportation» Carol Strizich» Pam Langve-Davis
Consultant Team from Cambridge Systematics, Inc.» Audrey Wennink – Senior Analyst» Sam Lawton – Project Manager» Sam Lawton – Project Manager
2
Agenda
Welcome and Introductions
Community Transportation Safety Planning (CTSP) Pro cess Overview
Transportation Safety Advisory Committee (TSAC) Rol e & Responsibilities
TSAC Membership DiscussionTSAC Membership Discussion
Missoula Crash Data Overview
Community Safety Issues Discussion
CTSP Vision
CTSP Goal
Next Steps
3
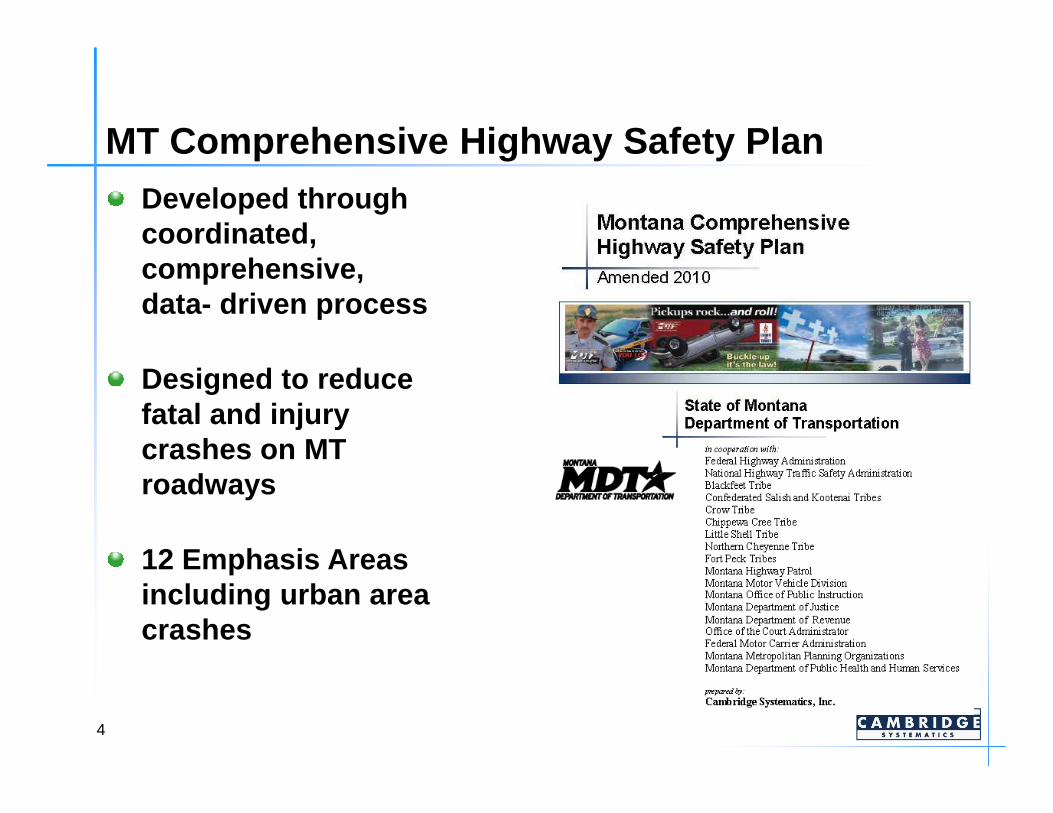
MT Comprehensive Highway Safety PlanDeveloped through coordinated, comprehensive, data- driven process
Designed to reduce fatal and injury fatal and injury crashes on MT roadways
12 Emphasis Areas including urban area crashes
4
Community Transportation Safety Plans
Target reduction of fatal and injury crashes based on local crash data and analysis
Devise safety strategies that can be implemented at the local level
Customize strategies based on local priorities, organizational structures, programs, leadership
5
Purpose of Transportation Safety Plan
The Missoula community seeks to develop a multimodal Community Transportation Safety
Plan to document the area’s transportation safety issues and identify a comprehensive set safety issues and identify a comprehensive set of strategies to reduce the number and severity
of traffic crashes.
6
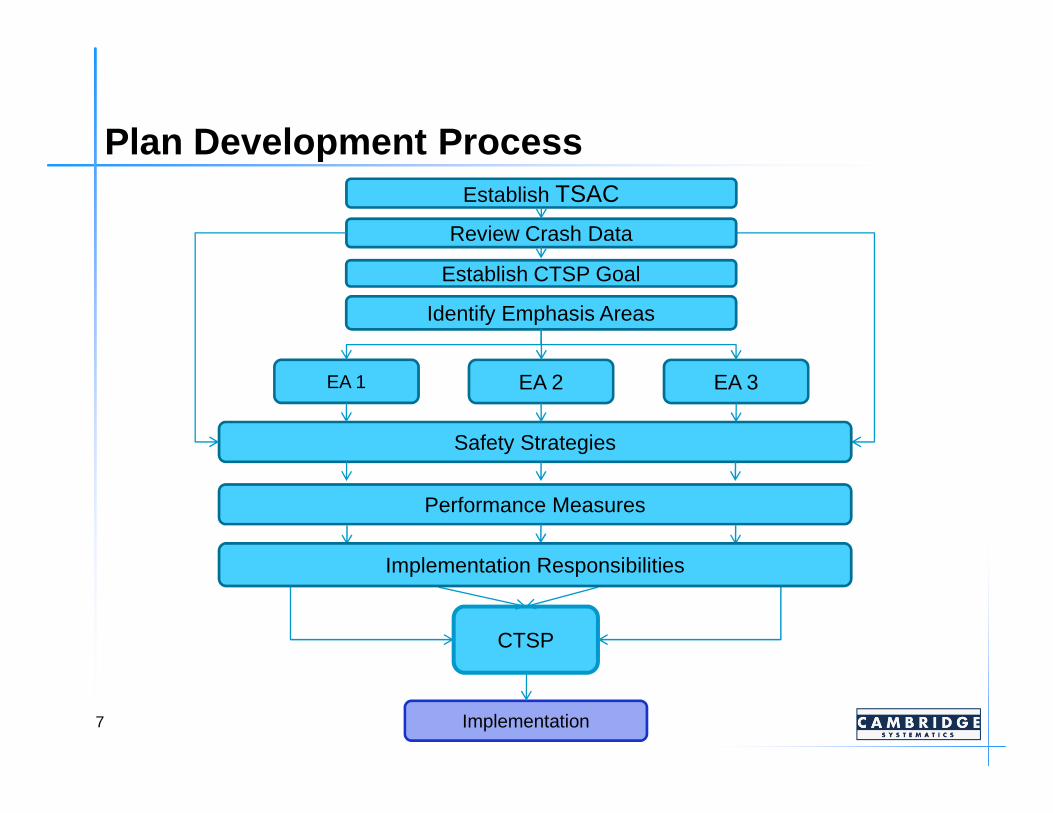
Plan Development ProcessEstablish TSAC
Review Crash Data
Establish CTSP Goal
Identify Emphasis Areas
EA 1 EA 2 EA 3
7
Safety Strategies
Performance Measures
CTSP
Implementation
Implementation Responsibilities
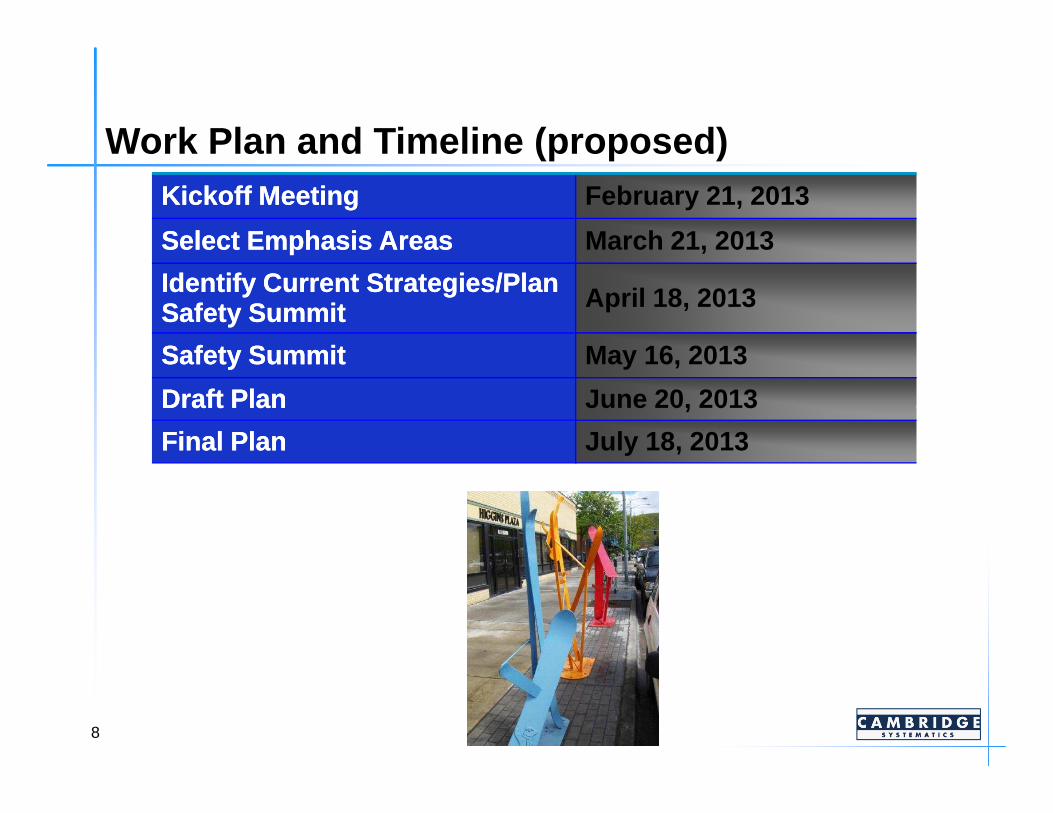
Work Plan and Timeline (proposed)Kickoff MeetingKickoff Meeting February 21, 2013
Select Emphasis AreasSelect Emphasis Areas March 21, 2013
Identify Current Strategies/Plan Identify Current Strategies/Plan Safety SummitSafety Summit April 18, 2013
Safety SummitSafety Summit May 16, 2013
Draft PlanDraft Plan June 20, 2013
8
Draft PlanDraft Plan June 20, 2013
Final PlanFinal Plan July 18, 2013
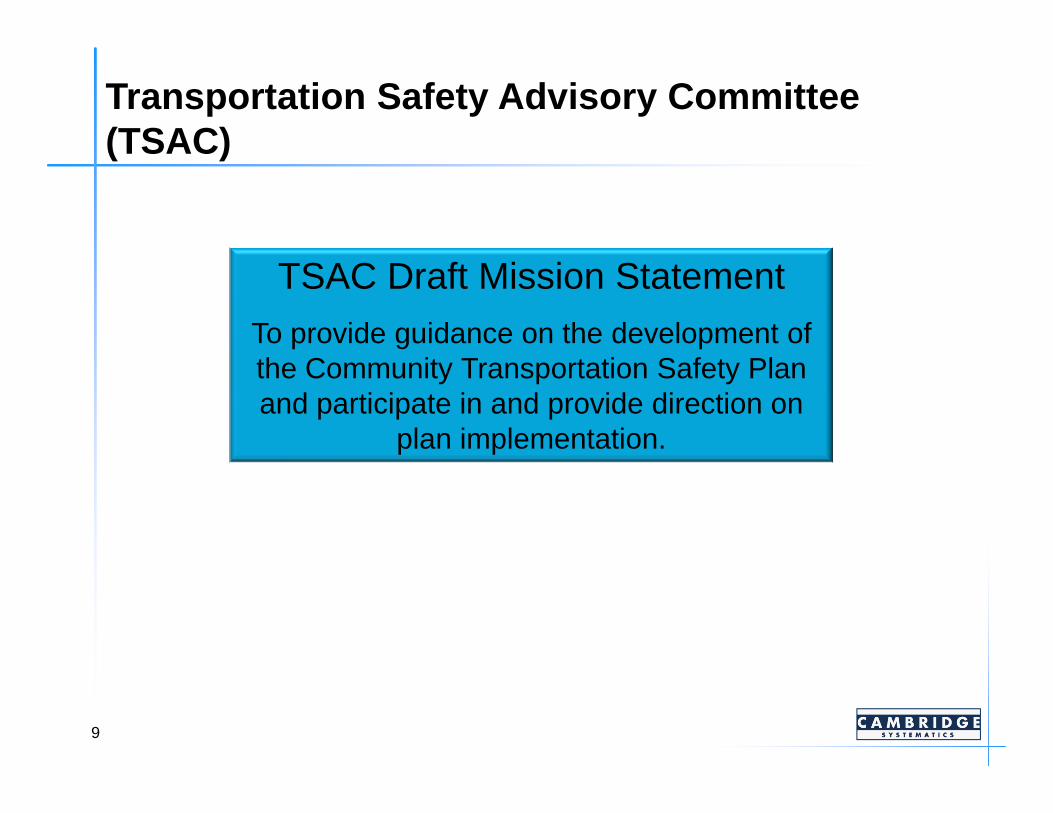
Transportation Safety Advisory Committee (TSAC)
TSAC Draft Mission Statement
To provide guidance on the development of the Community Transportation Safety Plan and participate in and provide direction on
9
and participate in and provide direction on plan implementation.
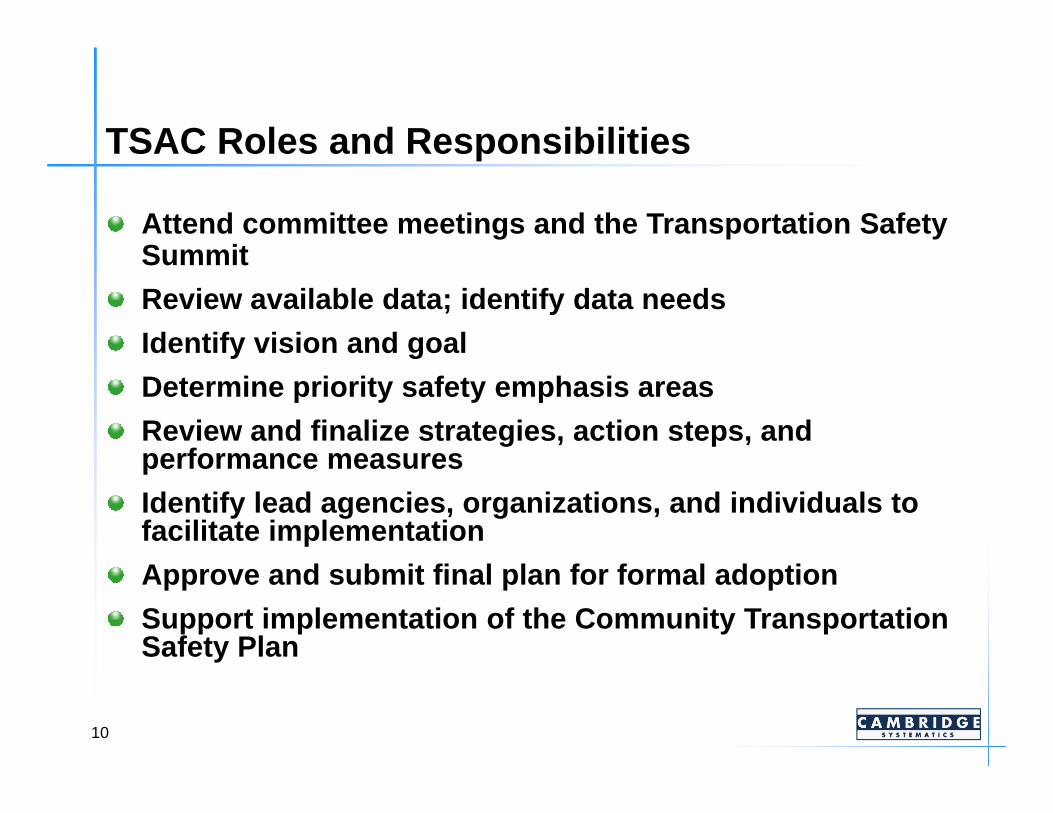
TSAC Roles and Responsibilities
Attend committee meetings and the Transportation Sa fety Summit
Review available data; identify data needs
Identify vision and goal
Determine priority safety emphasis areas
Review and finalize strategies, action steps, and performance measures
Identify lead agencies, organizations, and individu als to facilitate implementation
Approve and submit final plan for formal adoption
Support implementation of the Community Transportat ion Safety Plan
10
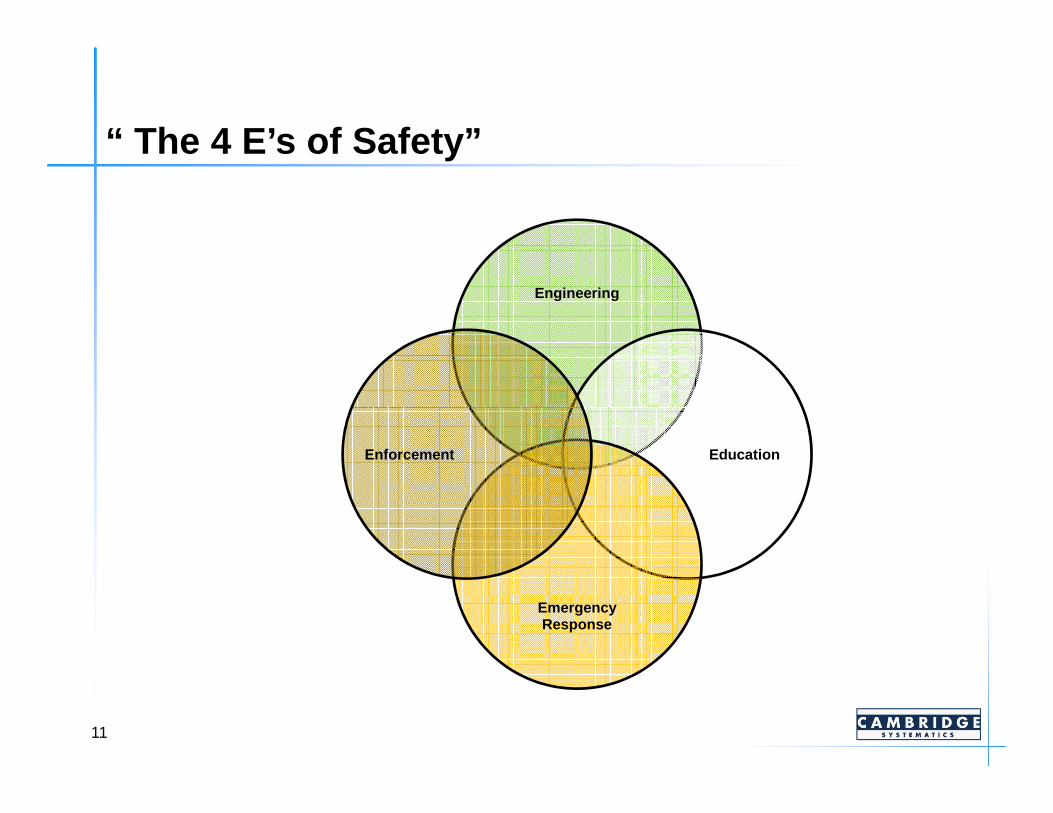
“ The 4 E’s of Safety”
Engineering
11
Education
EmergencyResponse
Enforcement

Proposed TSAC MembershipMissoula Planning DepartmentCity of Missoula Bicycle/Pedestrian OfficeMontana Rail LinkMissoula County DUI Task ForceMissoula County Public
Missoula Police DepartmentMissoula County Sherriff’s OfficeMontana Highway PatrolMissoula County Public WorksMissoula City Public WorksMissoula Fire DepartmentMissoula County Public
SchoolsSt. Patrick HospitalMissoula County Office of Emergency ManagementMissoula Emergency Services
Missoula Fire DepartmentMissoula Rural Fire DepartmentMontana Dept. of Transp.Mountain LineMissoula International Airport
12
Proposed TSAC Membership (continued)
University of Montana Office of Public SafetyCity of Missoula Development ServicesMontana Department of Public Health and Human Public Health and Human ServicesMissoula Aging ServicesASUM Office of Transportation, UCOthers?
13
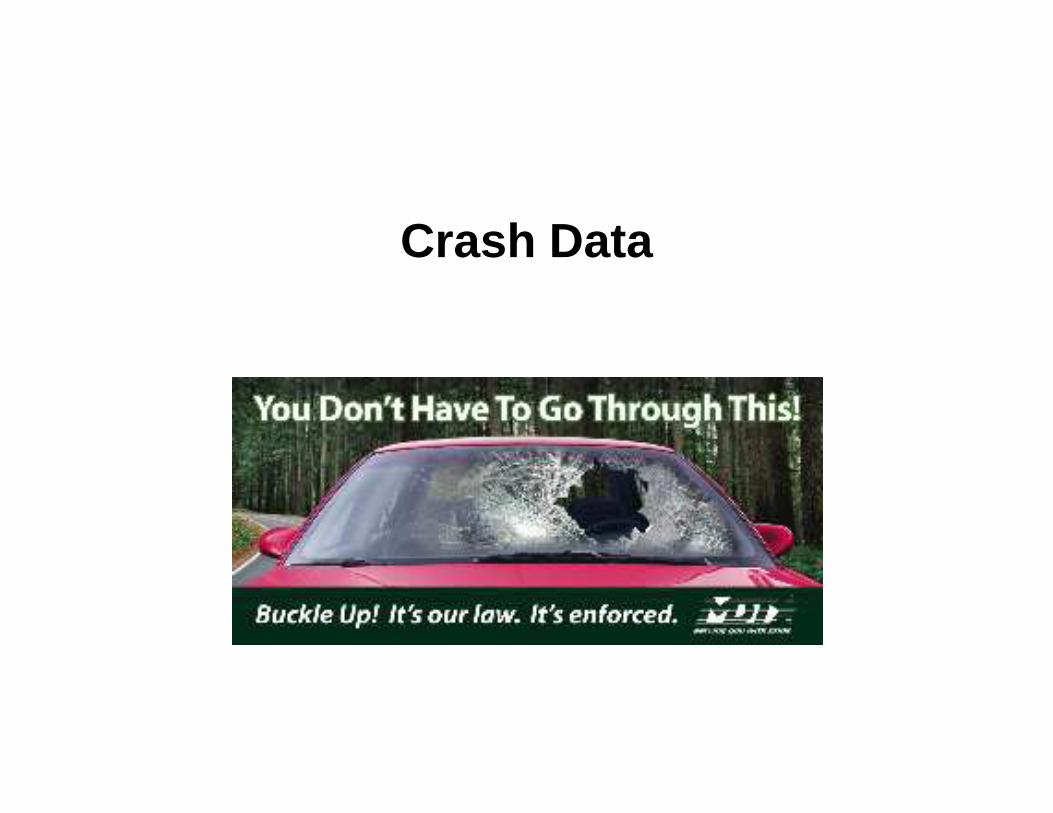
Crash Data

Crash Data Analysis ProcessBehavior, e.g.» Distracted» Speeding» Impaired» Safety Belt Use
Infrastructure/Crash Types, e.g.Infrastructure/Crash Types, e.g.» Intersections» Road departure
Demographics, e.g. » Under 25» 65 and older
15

Missoula Crash Severity (2009-2011)
1292
1198 1180
800
1000
1200
1400
Property Damage Only
Other Injury Crash
16
Source: MDT-Safety Management System, 2013
261 236 230
9275 74
12788 85
3 3 90
200
400
600
2009 2010 2011
Non Severe Injury Crash
Incapacitating Crash
Fatal Crash
BehaviorBehavior
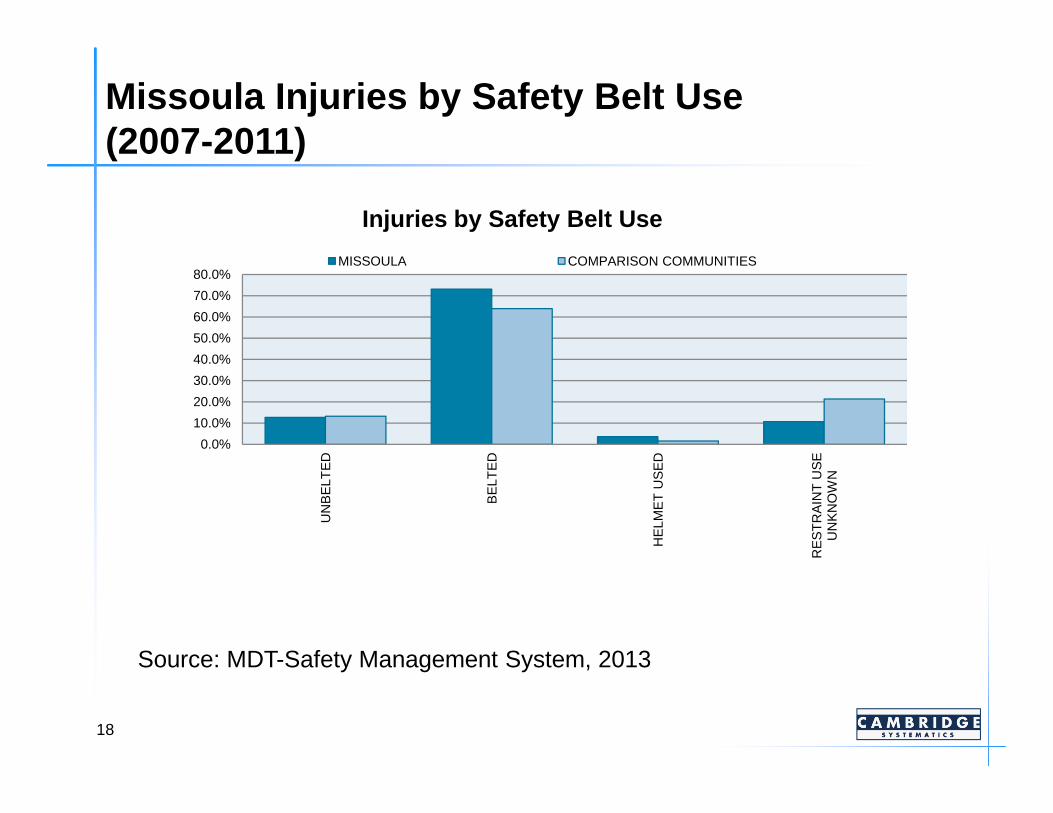
Missoula Injuries by Safety Belt Use (2007-2011)
20.0%
30.0%
40.0%
50.0%
60.0%
70.0%
80.0%
Injuries by Safety Belt Use
MISSOULA COMPARISON COMMUNITIES
18
Source: MDT-Safety Management System, 2013
0.0%
10.0%
20.0%
UN
BE
LTE
D
BE
LTE
D
HE
LME
T U
SE
D
RE
ST
RA
INT
US
E
UN
KN
OW
N

Missoula Drivers by Impairment – All Crashes(2007-2011)
2.0%
3.0%
4.0%
5.0%
6.0%
MISSOULA COMPARISON COMMUNITIES
19
Source: MDT-Safety Management System, 2012
0.0%
1.0%
2.0%
YE
S (
ALC
OH
OL
PR
ES
EN
T)
YE
S (
DR
UG
S
PR
ES
EN
T)
YE
S (
ALC
OH
OL
AN
D D
RU
GS
P
RE
SE
NT
)
NO
T R
EP
OR
TE
D
UN
KN
OW
N
NO
T S
TAT
ED

Missoula Driver Contributing Circumstances All Crashes – (2007-2011)
5.0%
10.0%
15.0%
20.0%
25.0%MISSOULA COMPARISON COMMUNITIES
20Source: MDT-Safety Management System, 2012
0.0%
5.0%
OT
HE
R*(
DR
IVE
R)
DR
UG
S
ALC
OH
OL
FA
ILE
D T
O Y
IELD
RIG
HT
OF
WA
Y
DIS
RE
GA
RD
ED
TR
AF
FIC
SIG
NS
EX
CE
ED
ED
ST
AT
ED
SP
EE
D …
TO
O F
AS
T F
OR
CO
ND
ITIO
NS
MA
DE
AN
IMP
RO
PE
R T
UR
N
WR
ON
G S
IDE
OR
WR
ON
G W
AY
FO
LLO
WE
D T
OO
CLO
SE
LY
IMP
RO
PE
R L
AN
E C
HA
NG
E
IMP
RO
PE
R B
AC
KIN
G …
IMP
RO
PE
R P
AS
SIN
G
IMP
RO
PE
R S
IGN
ALS
IMP
RO
PE
R P
AR
KIN
G
FE
LL A
SLE
EP
, FA
INT
ED
ET
C.
LIC
. RE
ST
. NO
T C
OM
PLI
ED
INA
TT
EN
TIV
E D
RIV
ING
CE
LL P
HO
NE
CA
RE
LES
S D
RIV
ING

DemographicsDemographics

Missoula Drivers by Gender – All Crashes(2007-2011)
10.0%20.0%30.0%40.0%50.0%60.0%
MISSOULA COMPARISON COMMUNITIES
22
Source: MDT-Safety Management System, 2013
0.0%10.0%
MA
LE
FE
MA
LE
NO
T S
TAT
ED
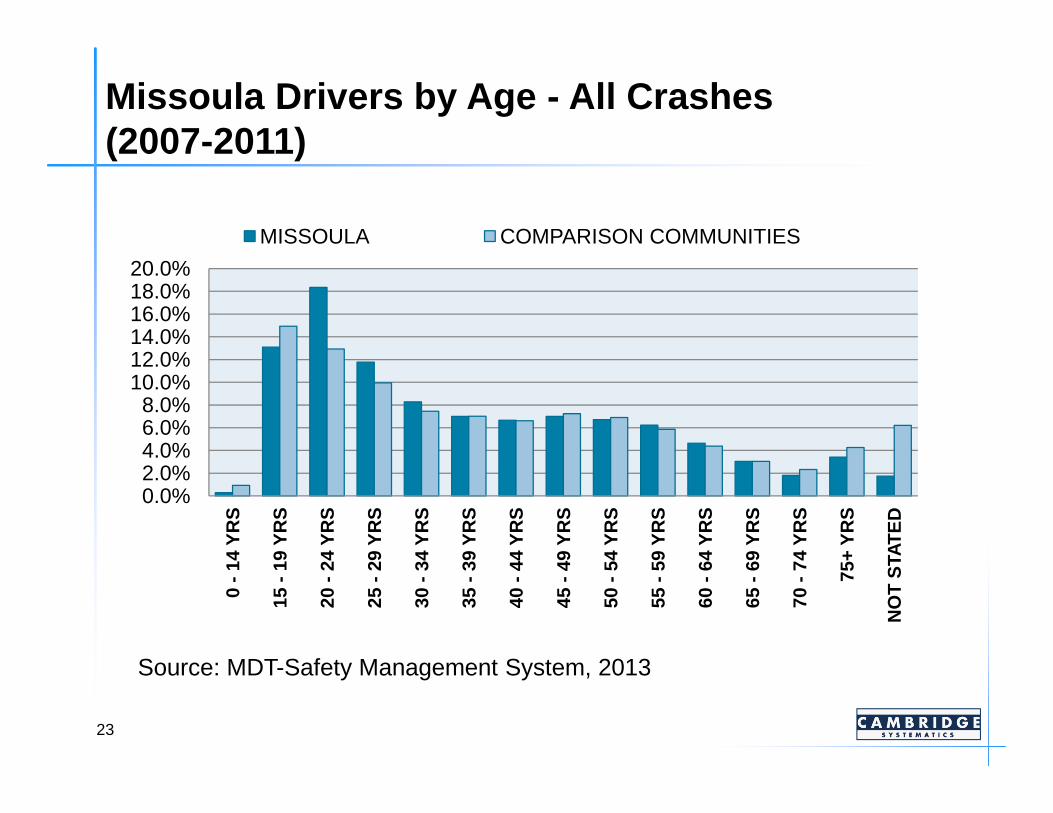
Missoula Drivers by Age - All Crashes(2007-2011)
8.0%10.0%12.0%14.0%16.0%18.0%20.0%
MISSOULA COMPARISON COMMUNITIES
23
Source: MDT-Safety Management System, 2013
0.0%2.0%4.0%6.0%8.0%
0 -
14 Y
RS
15 -
19 Y
RS
20 -
24 Y
RS
25 -
29 Y
RS
30 -
34 Y
RS
35 -
39 Y
RS
40 -
44 Y
RS
45 -
49 Y
RS
50 -
54 Y
RS
55 -
59 Y
RS
60 -
64 Y
RS
65 -
69 Y
RS
70 -
74 Y
RS
75+
YR
S
NO
T S
TAT
ED
Crash TypeCrash Type
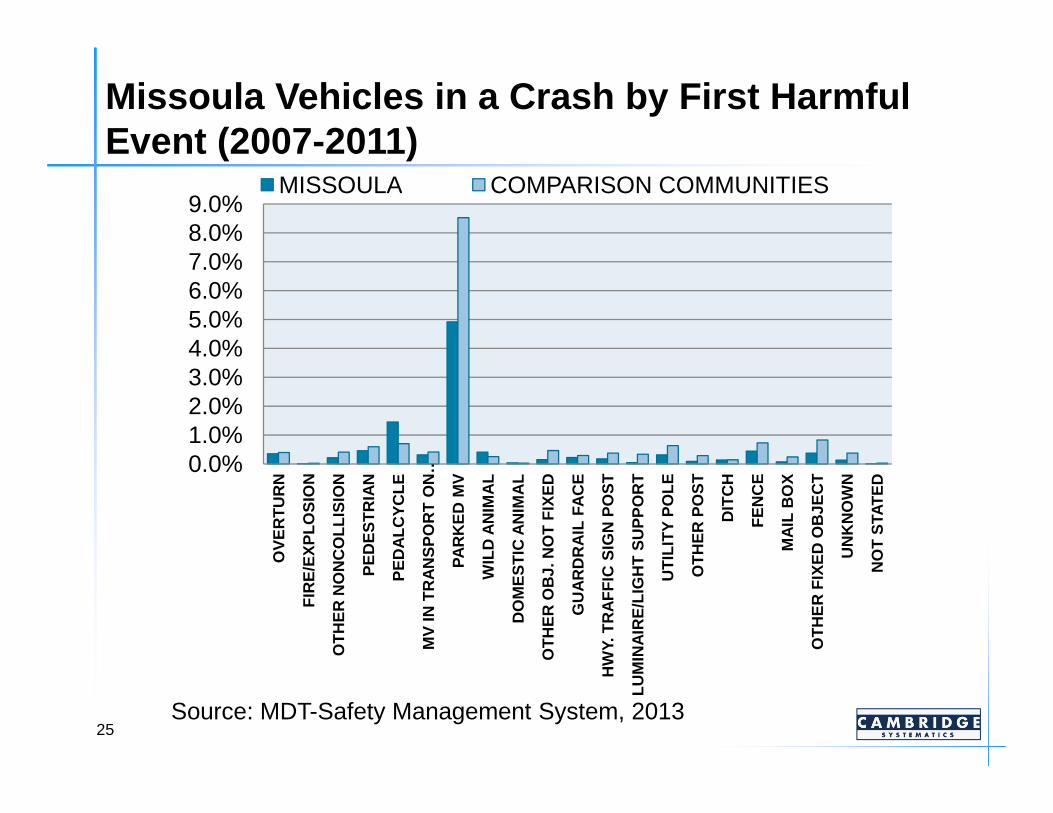
Missoula Vehicles in a Crash by First Harmful Event (2007-2011)
2.0%3.0%4.0%5.0%6.0%7.0%8.0%9.0%
MISSOULA COMPARISON COMMUNITIES
25Source: MDT-Safety Management System, 2013
0.0%1.0%2.0%
OV
ER
TU
RN
FIR
E/E
XP
LOS
ION
OT
HE
R N
ON
CO
LLIS
ION
PE
DE
ST
RIA
N
PE
DA
LCY
CLE
MV
IN T
RA
NS
PO
RT
ON
…
PA
RK
ED
MV
WIL
D A
NIM
AL
DO
ME
ST
IC A
NIM
AL
OT
HE
R O
BJ.
NO
T F
IXE
D
GU
AR
DR
AIL
FA
CE
HW
Y. T
RA
FF
IC S
IGN
PO
ST
LUM
INA
IRE
/LIG
HT
SU
PP
OR
T
UT
ILIT
Y P
OLE
OT
HE
R P
OS
T
DIT
CH
FE
NC
E
MA
IL B
OX
OT
HE
R F
IXE
D O
BJE
CT
UN
KN
OW
N
NO
T S
TAT
ED

Other FactorsOther Factors
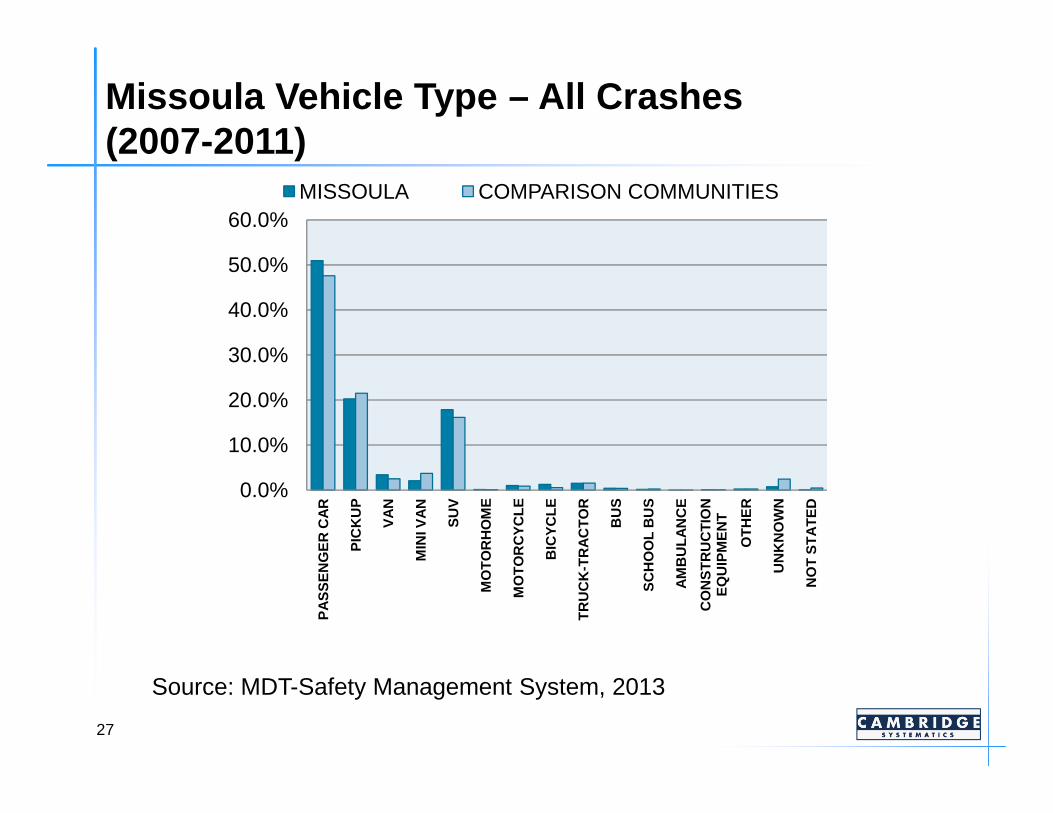
Missoula Vehicle Type – All Crashes(2007-2011)
20.0%
30.0%
40.0%
50.0%
60.0%MISSOULA COMPARISON COMMUNITIES
27
Source: MDT-Safety Management System, 2013
0.0%
10.0%
20.0%
PA
SS
EN
GE
R C
AR
PIC
KU
P
VA
N
MIN
I VA
N
SU
V
MO
TO
RH
OM
E
MO
TO
RC
YC
LE
BIC
YC
LE
TR
UC
K-T
RA
CT
OR
BU
S
SC
HO
OL
BU
S
AM
BU
LAN
CE
CO
NS
TR
UC
TIO
N
EQ
UIP
ME
NT
OT
HE
R
UN
KN
OW
N
NO
T S
TA
TE
D
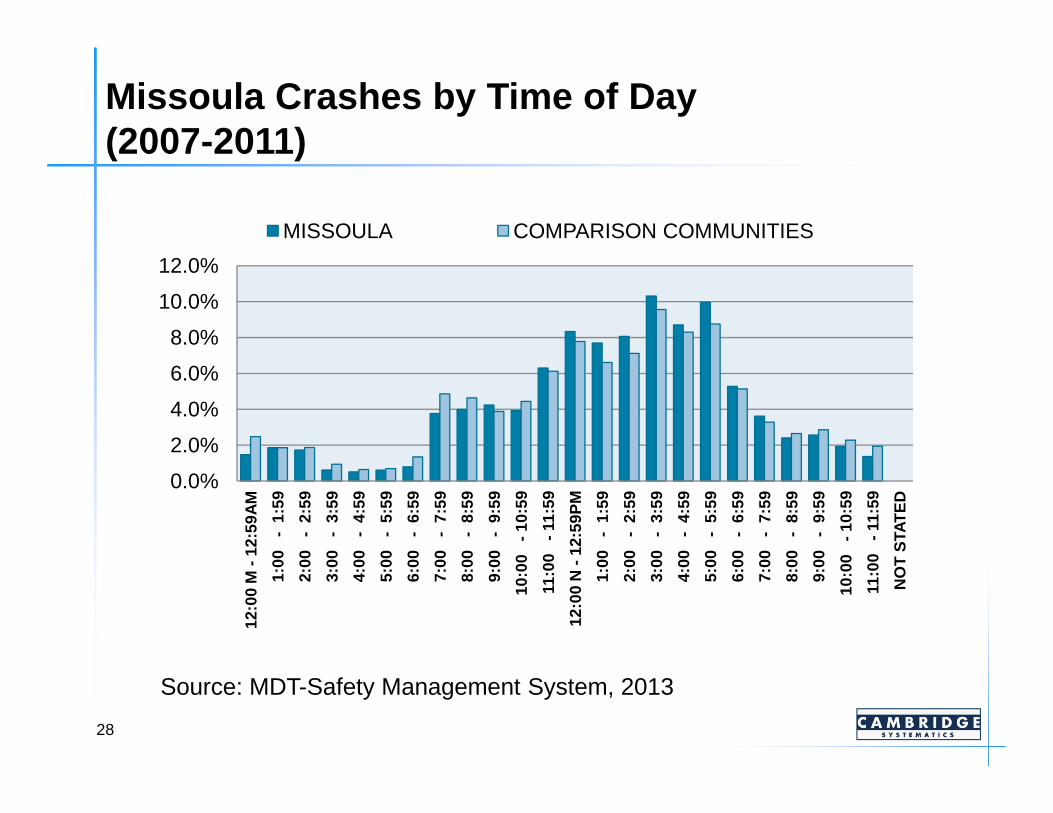
Missoula Crashes by Time of Day(2007-2011)
4.0%
6.0%
8.0%
10.0%
12.0%
MISSOULA COMPARISON COMMUNITIES
28
Source: MDT-Safety Management System, 2013
0.0%
2.0%
4.0%
12:0
0 M
-12
:59A
M
1:00
-
1:59
2:00
-
2:59
3:00
-
3:59
4:00
-
4:59
5:00
-
5:59
6:00
-
6:59
7:00
-
7:59
8:00
-
8:59
9:00
-
9:59
10:0
0
-10
:59
11:0
0
-11
:59
12:0
0 N
-12
:59P
M
1:00
-
1:59
2:00
-
2:59
3:00
-
3:59
4:00
-
4:59
5:00
-
5:59
6:00
-
6:59
7:00
-
7:59
8:00
-
8:59
9:00
-
9:59
10:0
0
-10
:59
11:0
0
-11
:59
NO
T S
TAT
ED

Missoula Crashes by Day of Week(2007-2011)
10.0%
15.0%
20.0%
25.0%
MISSOULA COMPARISON COMMUNITIES
29
Source: MDT-Safety Management System, 2013
0.0%
5.0%
SU
ND
AY
MO
ND
AY
TU
ES
DA
Y
WE
DN
ES
DA
Y
TH
UR
SD
AY
FR
IDA
Y
SA
TU
RD
AY
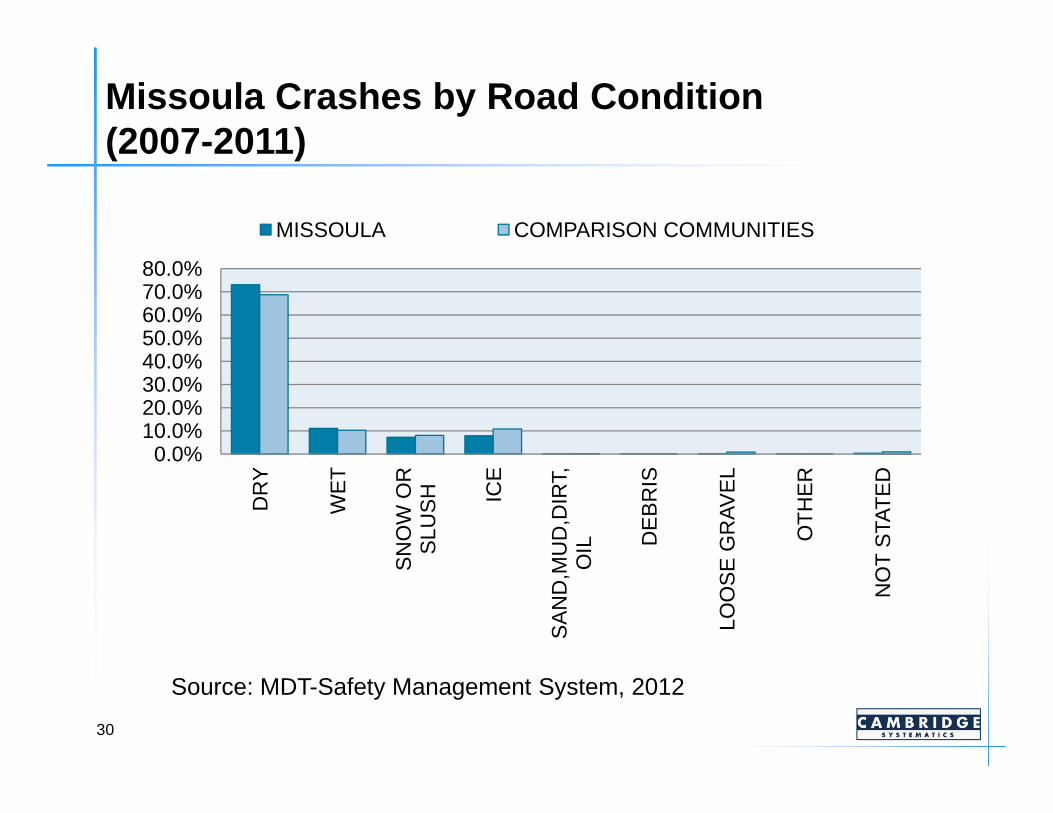
Missoula Crashes by Road Condition(2007-2011)
20.0%30.0%40.0%50.0%60.0%70.0%80.0%
MISSOULA COMPARISON COMMUNITIES
30
Source: MDT-Safety Management System, 2012
0.0%10.0%20.0%
DR
Y
WE
T
SN
OW
OR
S
LUS
H ICE
SA
ND
,MU
D,D
IRT,
OIL D
EB
RIS
LOO
SE
GR
AV
EL
OT
HE
R
NO
T S
TAT
ED
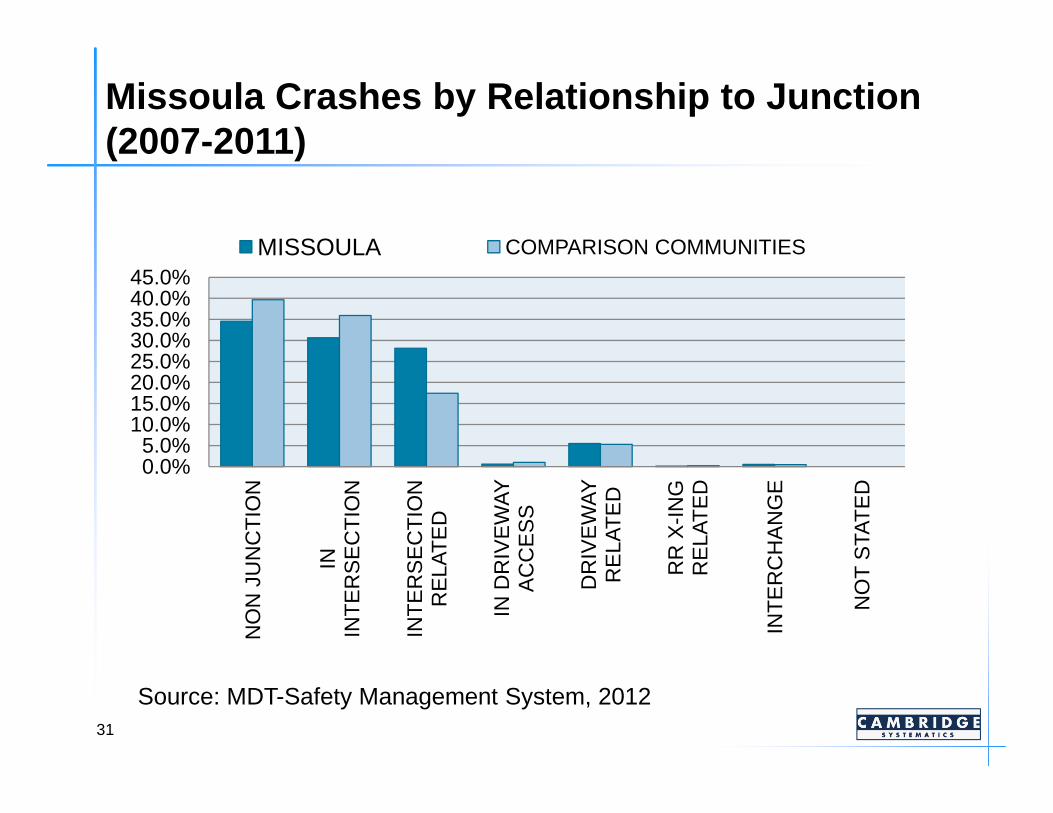
Missoula Crashes by Relationship to Junction (2007-2011)
15.0%20.0%25.0%30.0%35.0%40.0%45.0%
MISSOULA COMPARISON COMMUNITIES
31
Source: MDT-Safety Management System, 2012
0.0%5.0%
10.0%15.0%
NO
N J
UN
CT
ION
IN
INT
ER
SE
CT
ION
INT
ER
SE
CT
ION
R
ELA
TE
D
IN D
RIV
EW
AY
A
CC
ES
S
DR
IVE
WA
Y
RE
LAT
ED
RR
X-I
NG
R
ELA
TE
D
INT
ER
CH
AN
GE
NO
T S
TAT
ED
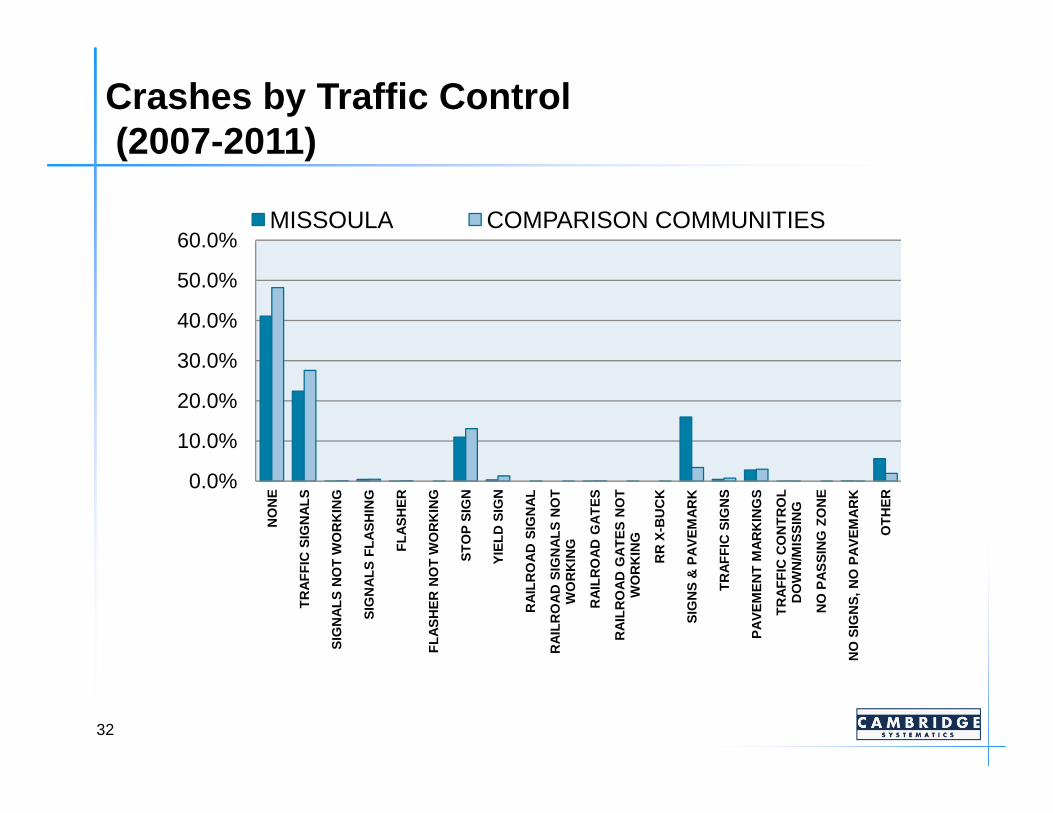
Crashes by Traffic Control(2007-2011)
20.0%
30.0%
40.0%
50.0%
60.0%MISSOULA COMPARISON COMMUNITIES
32
0.0%
10.0%
20.0%
NO
NE
TR
AF
FIC
SIG
NA
LS
SIG
NA
LS N
OT
WO
RK
ING
SIG
NA
LS F
LAS
HIN
G
FLA
SH
ER
FLA
SH
ER
NO
T W
OR
KIN
G
ST
OP
SIG
N
YIE
LD S
IGN
RA
ILR
OA
D S
IGN
AL
RA
ILR
OA
D S
IGN
ALS
NO
T
WO
RK
ING
RA
ILR
OA
D G
AT
ES
RA
ILR
OA
D G
AT
ES
NO
T
WO
RK
ING
RR
X-B
UC
K
SIG
NS
& P
AV
EM
AR
K
TR
AF
FIC
SIG
NS
PA
VE
ME
NT
MA
RK
ING
S
TR
AF
FIC
CO
NT
RO
L D
OW
N/M
ISS
ING
NO
PA
SS
ING
ZO
NE
NO
SIG
NS
, NO
PA
VE
MA
RK
OT
HE
R
Initial Findings
Intersections
Young drivers
Inattentive/careless
33
Safety VisionSafety Vision
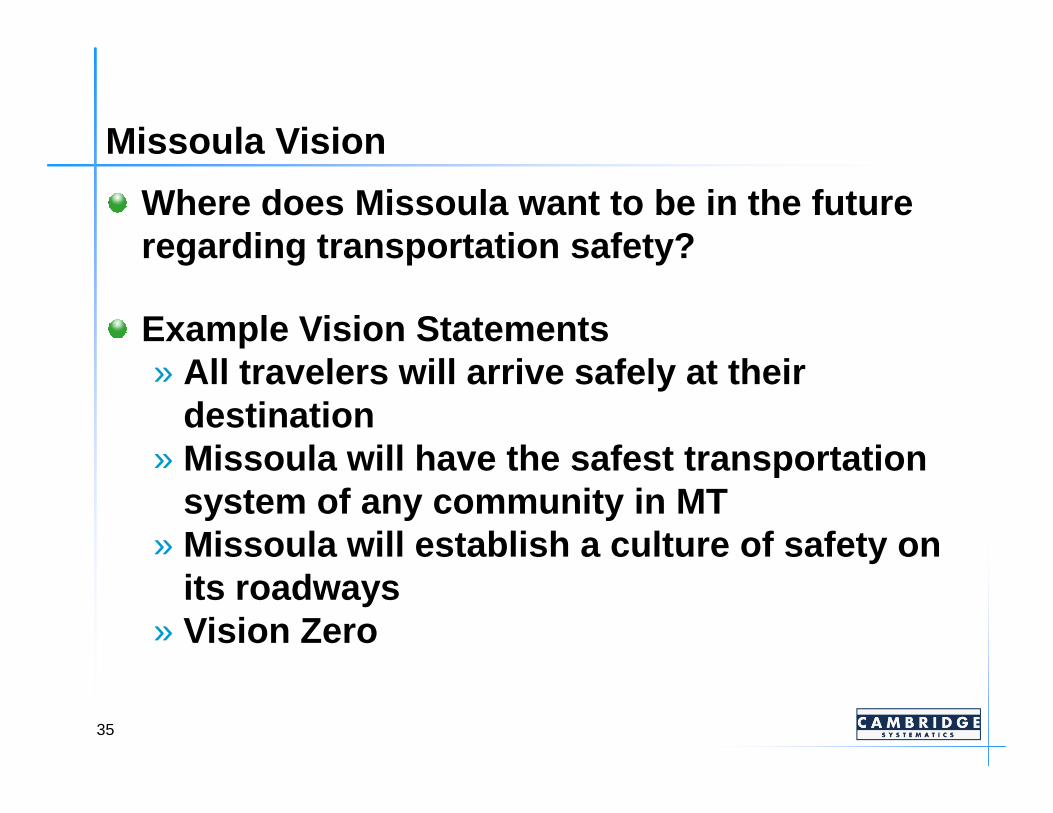
Missoula Vision
Where does Missoula want to be in the future regarding transportation safety?
Example Vision Statements» All travelers will arrive safely at their
destinationdestination» Missoula will have the safest transportation
system of any community in MT» Missoula will establish a culture of safety on
its roadways» Vision Zero
35
Missoula Safety Vision
Target Zero
36

CTSP GoalCTSP Goal
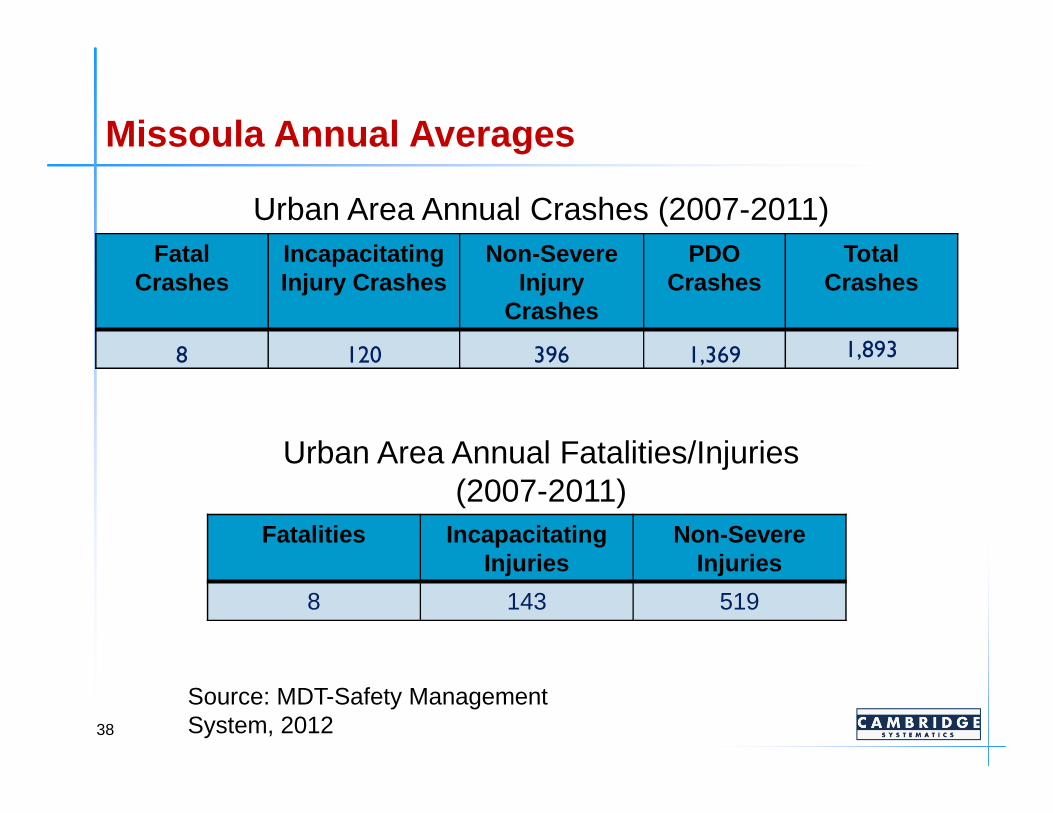
Missoula Annual Averages
Fatal Crashes
Incapacitating Injury Crashes
Non-Severe Injury
Crashes
PDOCrashes
Total Crashes
8 120 396 1,369 1,893
Urban Area Annual Crashes (2007-2011)
38
Fatalities Incapacitating Injuries
Non-SevereInjuries
8 143 519
Urban Area Annual Fatalities/Injuries (2007-2011)
Source: MDT-Safety Management System, 2012

Examples - Traffic Safety Goals
ButteButte
To reduce motor To reduce motor vehicle vehicle crashes by 20 crashes by 20 percent by 2017, from percent by 2017, from an annual average of an annual average of
671 crashes to an 671 crashes to an annual average of 537 annual average of 537
Shelby/Toole CountyShelby/Toole County
Reduce annual average severe crashes
within Toole County by one third from
2010 to 2015, resulting in an
annual average of 537 annual average of 537 crashescrashes.. resulting in an
average of no more than four severe
injury crashes per year.
39
BozemanBozeman
Reduce fatalities and injuries by 25% by
2018.

CTSP Goals - Sample Approaches
20 percent reduction in severe injuries ( fatalities + incapacitating injuries)
Reduction in a specific number of severe injuries
One death is one too many – zero fatalitiesOne death is one too many – zero fatalities
Reduce fatal and incapacitating injuries by half by 2030 (MT CHSP)
40
Missoula Safety Goal
Reduce the five-year average of fatal and severe in jury crashes by 5 percent per year, for a reduction by 2 5 percent by 2018.
41
Next StepsNext Steps
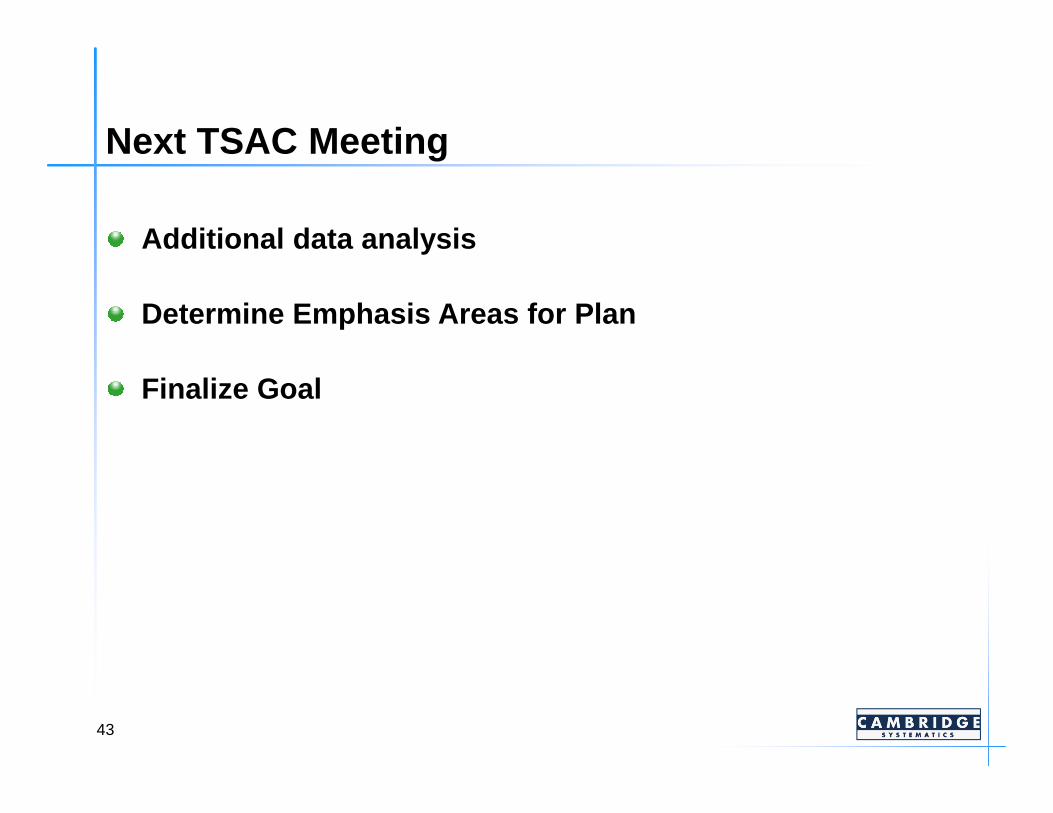
Next TSAC Meeting
Additional data analysis
Determine Emphasis Areas for Plan
Finalize Goal
43
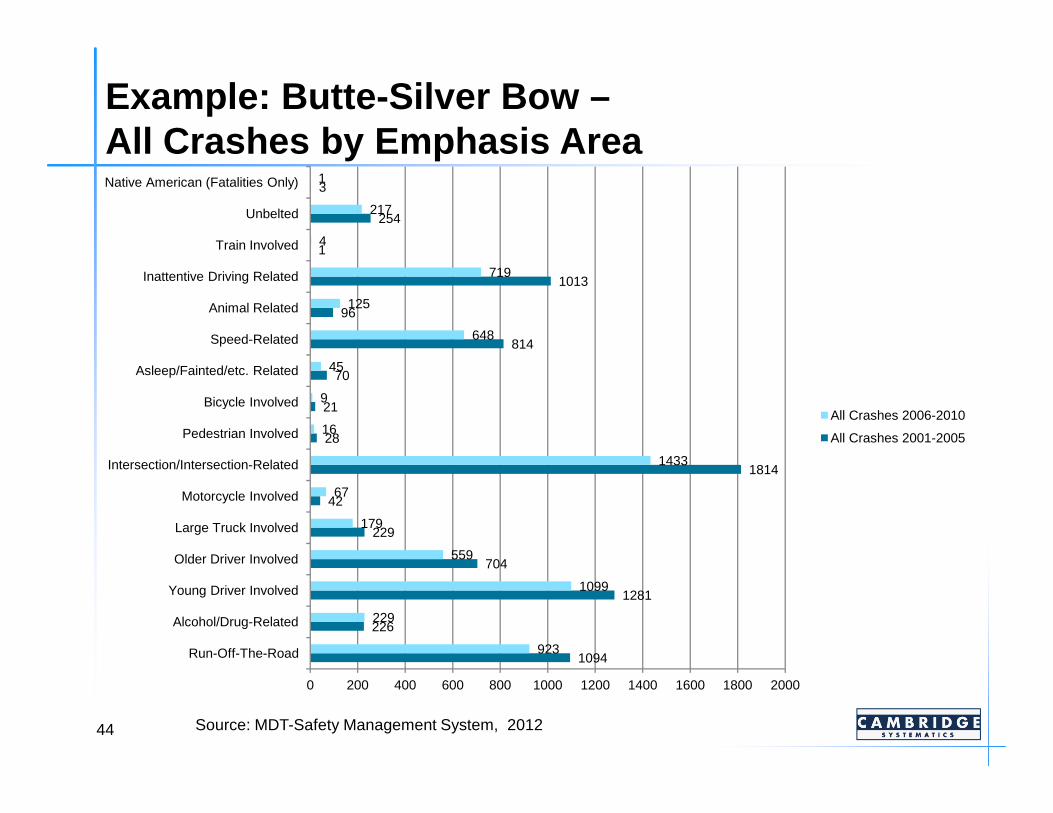
Example: Butte-Silver Bow –All Crashes by Emphasis Area
21
70
814
96
1013
1
254
3
9
45
648
125
719
4
217
1
Bicycle Involved
Asleep/Fainted/etc. Related
Speed-Related
Animal Related
Inattentive Driving Related
Train Involved
Unbelted
Native American (Fatalities Only)
1094
226
1281
704
229
42
1814
28
21
923
229
1099
559
179
67
1433
16
0 200 400 600 800 1000 1200 1400 1600 1800 2000
Run-Off-The-Road
Alcohol/Drug-Related
Young Driver Involved
Older Driver Involved
Large Truck Involved
Motorcycle Involved
Intersection/Intersection-Related
Pedestrian Involved
Bicycle InvolvedAll Crashes 2006-2010
All Crashes 2001-2005
44 Source: MDT-Safety Management System, 2012
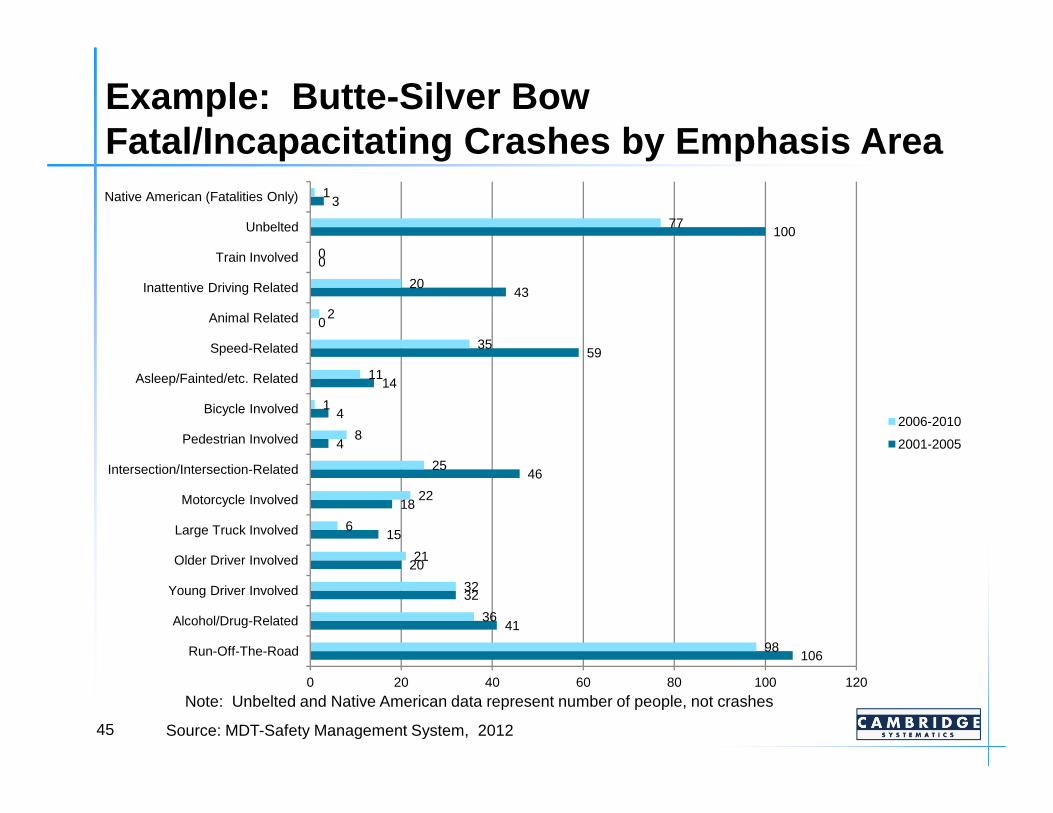
Example: Butte-Silver Bow Fatal/Incapacitating Crashes by Emphasis Area
4
14
59
0
43
0
100
3
1
11
35
2
20
0
77
1
Bicycle Involved
Asleep/Fainted/etc. Related
Speed-Related
Animal Related
Inattentive Driving Related
Train Involved
Unbelted
Native American (Fatalities Only)
45
106
41
32
20
15
18
46
4
4
98
36
32
21
6
22
25
8
1
0 20 40 60 80 100 120
Run-Off-The-Road
Alcohol/Drug-Related
Young Driver Involved
Older Driver Involved
Large Truck Involved
Motorcycle Involved
Intersection/Intersection-Related
Pedestrian Involved
Bicycle Involved2006-2010
2001-2005
Note: Unbelted and Native American data represent number of people, not crashes
Source: MDT-Safety Management System, 2012

Next StepsSelect dates & locations for next two meetings» Develop agenda and materials
Select potential dates & location for Safety Summit (May)
Identify other potential TSAC members
Homework: » What are Missoula’s most significant transportation safety
issues?» What programs are currently in place? » What more should or could be done?» Think about Plan Goal for finalization at next meet ing
46

Open DiscussionOpen Discussion