Embed Size (px)
Citation preview
Miss
issip
pi W
ater
Res
ourc
es C
onfe
renc
eJa
ckso
n Hi
lton
Jack
son,
MS
2014
Mississippi Water Resources ConferenceHilton Jackson Jackson, MS
2014
EXHIBITORS:
CONFERENCE ORGANIZERS: Mississippi Department of Environmental Quality | Mississippi Water Resources Research Institute | U.S. Geological Survey
Mississippi Department of Environmental QualityYazoo-MS Delta Levee Board
SPONSORS:Mississippi Department of Environmental QualityMississippi Water Resources Research InstituteU.S. Geological Survey
Mississippi Water Resources Conference2014
iii
Poster SessionAn Integrated Watershed Approach to Water Sanitation and Hygiene Priorities for Lake Chivero, Zimbabwe .................................................................................................................................................................... 2Buka, H., Linhoss, A., Pote, J.
Distribution and Cycling of Mercury Species in Wetlands and Reservoirs in Northern Mississippi ................... 13Cizdziel, J., Brown, G.
Quantification of Harmful Algal Blooms (HABs) in the Grand Bay in Jackson County, MS .............................. 14Dampier, J., Dash, P., Begonia, M.
Groundwater Level Forecasting in Sunflower County, Mississippi using Artificial Neural Networks ................. 15Guzmán, S., Paz, J., Tagert, M.
Quantitative Estimation of Suspended Sediments and Associated Mercury Concentration in Enid Lake Using Remote Sensing Techniques ................................................................................................................ 16Hossain, A., Chao, X., Cizdziel, J., Jia, Y.
Regional Rainfall Frequency Analysis and drought reduction in the Tombigbee River Basin ........................ 17Ramirez-Avila, J., McAnally, W., Tagert, M., Ortega-Achury, S.
Leaching of copper from different copper treated woodwastes ..................................................................... 25Singleton, B., Borazjani, H., Cox, M.
Coastal Water QualityThe Red Creek Consolidated Mitigation Bank and the Challenges of Stream Restoration in Gulf Coastal Plain Soils and Weather ............................................................................................................................. 28Maurer, B.
Investigating the Water Quality of Four Large Mississippi Lakes and Grand Bay, MS-AL Gulfcoast ............... 29Dash, P., Ikenga, J., Pinckney, J.
The Role of Long-term Monitoring In Understanding Phosphate Spills Into A National Estuarine Research Reserve ..................................................................................................................................................... 30Cressman, K., Woodrey, M., Ruple, D.
Contents
SPONSORS:
Mississippi Water Resources Conference2014
iv
Delta Water ManagementNutrient Reduction In Mississippi: Partnering For Success ..................................................................................... 32Bhowal, P.
Benefits of On-Farm Water Storage Systems in Porter Bayou Watershed .......................................................... 33Tagert, M., Paz, J., Pote, J., Kirmeyer, R.
Indirect Regulation of the MRVA Aquifer: Options for the Mississippi Delta....................................................... 34Massey, J.
Groundwater AssessmentQuality of water in public supply wells located in the Southeastern Coastal Plain and Coastal Lowlands aquifer systems, Mississippi, 2013 ............................................................................................................ 44Welch, H., Barlow, J.
Enhancing the USGS Streamgaging Network in the Mississippi River Basin: Continuous Water-Quality and Groundwater Data ........................................................................................................................................... 45Roberts, B.
An Assessment of Private Wells Used for Drinking Water in Mississippi and Alabama ...................................... 46Barrett, J., Grammer, P.
Austin’s Quadrant: a new framework for assessing water use models ........................................................ 47Czarnecki, J., Kröger, R., Omer, A.
Water Policy/Management The Mississippi Freshwater Assessment: A New Tool for Supporting Decision Making for Mississippi’s Freshwater Resources ............................................................................................................................................... 50Piazza, B.
Mississippi Water Resources Inventory & Projections for Economic Development ........................................... 51Linhoss, A., Balwebber, J., Pote, J.
The Migratory Bird Habitat Initiative: Managing Waterbird Habitats After The 2010 Gulf Oil Spill ................... 52Kaminski, R., Davis, J., Webb, L., Tapp, J., Weegman, M.
Diamondhead MS BMP Demonstration Site, Outreach Tools and Model Ordinance. .................................... 53Gallo, W.
Contents
Mississippi Water Resources Conference2014
v
Delta Groundwater Evaluating the impacts of crop rotations on groundwater recharge and water table depth in the Mississippi Delta ......................................................................................................................................................... 56Dakhlalla, A., Parajuli, P.
Identifying A Mechanism For An Infiltration Threshold From The Sunflower River, MS To The Underlying Alluvial Aquifer .......................................................................................................................................................... 57Patton, A., Davidson, G., Rigby, J., Barlow, J.
Empirical evidence of recharge in the Mississippi Alluvial Aquifer ...................................................................... 58Johnson, D., Barlow, J.
Groundwater Depletion in the Mississippi Delta as Observed by the Gravity Recovery and Climate Experiment (GRACE) Satellite System ...................................................................................................... 59Hossain, A.
Climate National Weather Service Flood Surveys & Post-Event Analysis of Hurricane Isaac ......................................... 68Lincoln, W.
Flood Inundation Mapping to Aid Emergency Management Planning in the Cities of Hattiesburg and Petal ........................................................................................................................................................................... 83Storm, J.
Flow Characteristics of Selected River Basins in Mississippi .................................................................................. 84Runner, M.
Climate Variability Impacts on Crop and Sediment Yields ................................................................................. 85Parajuli, P., Jayakody, P., Sassenrath, G.
Wetlands A STELLA model for estimating phosphorus removal from wastewater in a vertical-flow constructed wetland system ......................................................................................................................................................... 88Ouyang, Y.
Water Depth In An Oxbow Lake-Wetland And Its Influence On Soil Chemistry, Cypress Tree Growth, And Groundwater Recharge .................................................................................................................................. 89Lahiri, C., Davidson, G., Threlkeld, S.
Distribution and Cycling of Mercury Species in Wetlands and Reservoirs in Northern Mississippi ................... 90Cizdziel, J., Brown, G.
Contents
Mississippi Water Resources Conference2014
vi
Nutrients and ModelingNumerical Modeling of Flow and Mercury Distribution in Enid Lake, Mississippi ................................................ 92Chao, X., Hossain, A., Cizdziel, J., Jia, Y.
Refinement and regionalization of phosphorus assessment tools in Mississippi ................................................. 93Ramirez-Avila, J., Oldham, J., Ortega-Achury, S., Osmond, D., Martin, J., Locke, M., Read, J.
Developing Numeric Nutrient Criteria For Mississippi ............................................................................................ 94Young, A., Caviness, K.
Sub-Watershed Assessment/ManagementDelineation of Watersheds in Northwestern Mississippi to the Sub-Watershed Level ....................................... 96Rose, C.
Pathogen Indicator Monitoring in the Ross Barnett Reservoir ............................................................................. 97Capps, P., Hicks, M., Surbeck, C.
Water quality modeling in the Ross Barnett Reservoir .......................................................................................... 98Jackson, G.
Nutrient Reduction Using low-grade weirs as a BMP: Effects on nutrient remediation and microbial denitrification .................. 100Poganski, B., Kröger, R.
Effects of organic carbon amendments on nitrogen removal in agricultural drainage ditch sediments... 101Faust, D., Kröger, R.
Assessing new BMPS: efficiencies of a Tailwater Recover System and On-farm Storage Reservoir ............. 102Omer, A., Kröger, R.
Contents
Poster Session
1
Post
er S
essio
nPOSTER SESSION
Hazel BukaMississippi State University
An Integrated Watershed Approach to Water Sanitation and Hygiene priorities for Lake Chivero, Zimbabwe
James CizdzielUniversity of Mississippi
Distribution and Cycling of Mercury Species in Wetlands and Reservoirs in Northern Mississippi
Jeanna M. DampierJackson State University
Quantification of Harmful Algal Blooms (HABs) in the Grand Bay in Jackson County, MS
Sandra GuzmanMississippi State University
Groundwater Level Forecasting in Sunflower County, Mississippi using Artificial Neural Networks
Azad HossainUniversity of Mississippi
Quantitative Estimation of Suspended Sediments and Associated Mercury Concentration in Enid Lake Using Remote Sensing Techniques
John J. Ramirez-Avila Mississippi State University
Regional Rainfall Frequency Analysis and Drought Reduction in the Tombigbee River Basins
Bradley SingletonMississippi State University
Leaching of Copper From Different Copper Treated Woodwastes
Mississippi Water Resources Conference2014
2
An Integrated Watershed Approach to Water Sanitation and Hygiene Priorities for Lake
Chivero, Zimbabwe Buka, H., Linhoss, A., Pote, J.
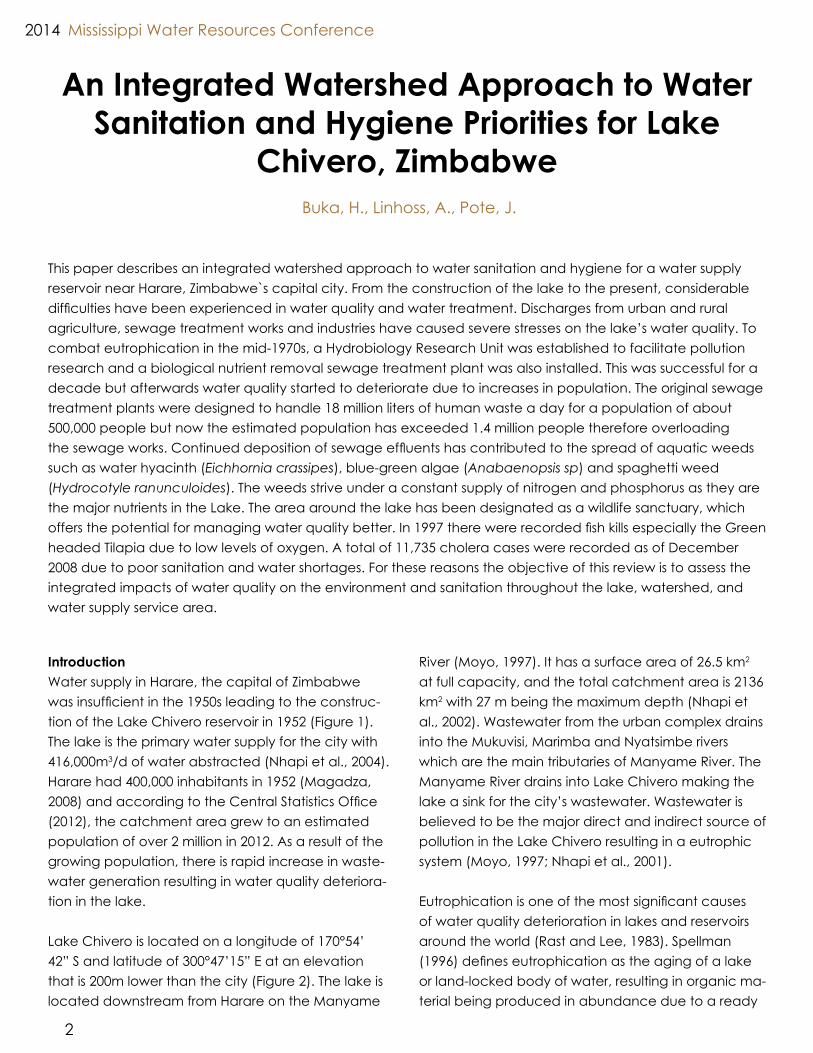
This paper describes an integrated watershed approach to water sanitation and hygiene for a water supply reservoir near Harare, Zimbabwe`s capital city. From the construction of the lake to the present, considerable difficulties have been experienced in water quality and water treatment. Discharges from urban and rural agriculture, sewage treatment works and industries have caused severe stresses on the lake’s water quality. To combat eutrophication in the mid-1970s, a Hydrobiology Research Unit was established to facilitate pollution research and a biological nutrient removal sewage treatment plant was also installed. This was successful for a decade but afterwards water quality started to deteriorate due to increases in population. The original sewage treatment plants were designed to handle 18 million liters of human waste a day for a population of about 500,000 people but now the estimated population has exceeded 1.4 million people therefore overloading the sewage works. Continued deposition of sewage effluents has contributed to the spread of aquatic weeds such as water hyacinth (Eichhornia crassipes), blue-green algae (Anabaenopsis sp) and spaghetti weed (Hydrocotyle ranunculoides). The weeds strive under a constant supply of nitrogen and phosphorus as they are the major nutrients in the Lake. The area around the lake has been designated as a wildlife sanctuary, which offers the potential for managing water quality better. In 1997 there were recorded fish kills especially the Green headed Tilapia due to low levels of oxygen. A total of 11,735 cholera cases were recorded as of December 2008 due to poor sanitation and water shortages. For these reasons the objective of this review is to assess the integrated impacts of water quality on the environment and sanitation throughout the lake, watershed, and water supply service area.
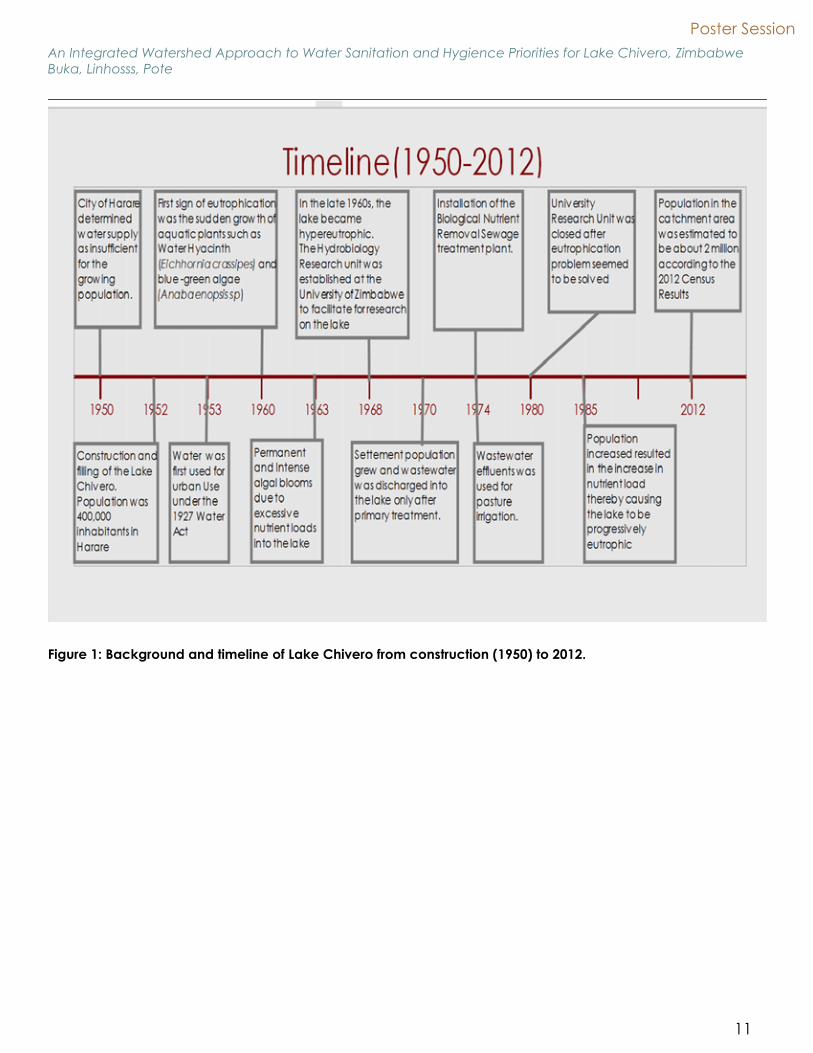
IntroductionWater supply in Harare, the capital of Zimbabwe was insufficient in the 1950s leading to the construc-tion of the Lake Chivero reservoir in 1952 (Figure 1). The lake is the primary water supply for the city with 416,000m3/d of water abstracted (Nhapi et al., 2004). Harare had 400,000 inhabitants in 1952 (Magadza, 2008) and according to the Central Statistics Office (2012), the catchment area grew to an estimated population of over 2 million in 2012. As a result of the growing population, there is rapid increase in waste-water generation resulting in water quality deteriora-tion in the lake.
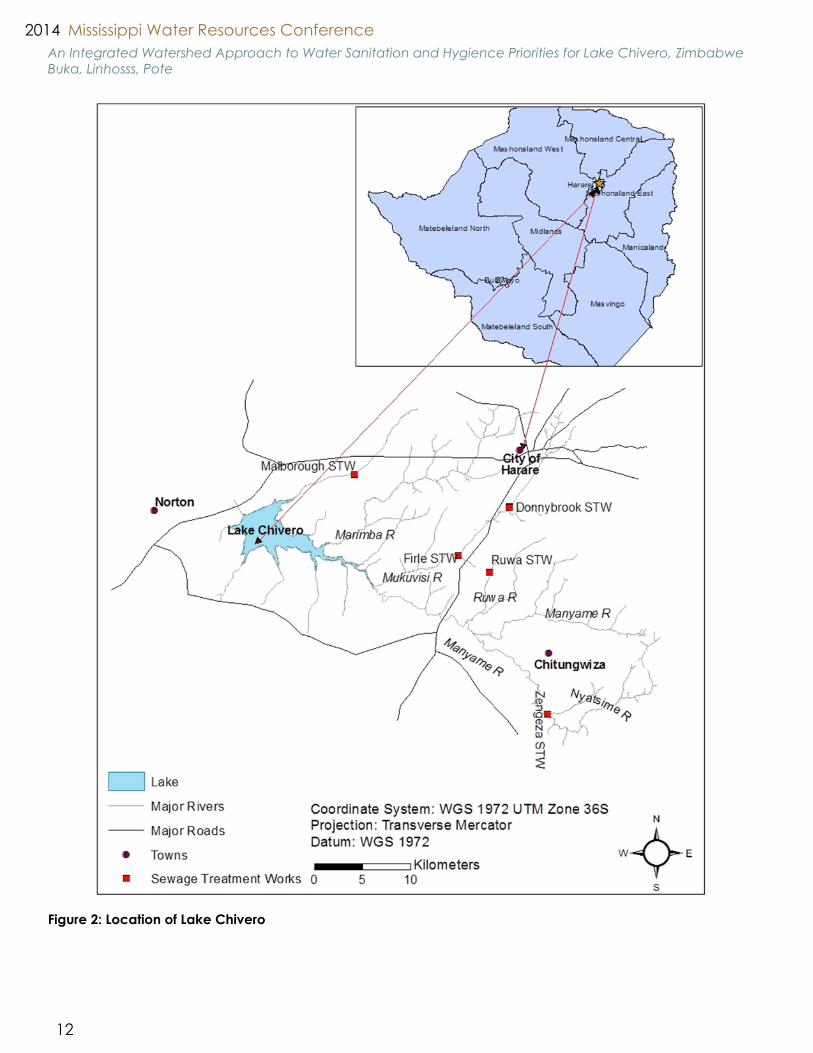
Lake Chivero is located on a longitude of 170°54’ 42” S and latitude of 300°47’15” E at an elevation that is 200m lower than the city (Figure 2). The lake is located downstream from Harare on the Manyame
River (Moyo, 1997). It has a surface area of 26.5 km2 at full capacity, and the total catchment area is 2136 km2 with 27 m being the maximum depth (Nhapi et al., 2002). Wastewater from the urban complex drains into the Mukuvisi, Marimba and Nyatsimbe rivers which are the main tributaries of Manyame River. The Manyame River drains into Lake Chivero making the lake a sink for the city’s wastewater. Wastewater is believed to be the major direct and indirect source of pollution in the Lake Chivero resulting in a eutrophic system (Moyo, 1997; Nhapi et al., 2001).
Eutrophication is one of the most significant causes of water quality deterioration in lakes and reservoirs around the world (Rast and Lee, 1983). Spellman (1996) defines eutrophication as the aging of a lake or land-locked body of water, resulting in organic ma-terial being produced in abundance due to a ready
Poster Session
3
supply of nutrients accumulated over the years. Un-desirable nutrient inputs are usually from wastewater discharge, land runoff, precipitation, dry fallout, and groundwater principally nitrogen (Moyo, 1997; Nhapi et al, 2002).
In Zimbabwe, the permissible nitrogen and phospho-rous concentrations is 0.3mgL-1 for Total Nitrogen (TN) and 0.01 mgL-1 for Total Phosphorus (TP) as established by JICA, 1996 (Moyo, 1997). Above these levels the lake is considered to be eutrophic. The nutrients that are input through wastewater have detrimental im-pacts on both ecological and human systems.
ObjectivesThis review will describe the changing condition of the lake as it relates to environmental quality and hu-man health. The objective of this study is to (1) con-duct a comprehensive review of the water quality and health issues in the Lake Chivero watershed and (2) develop recommendations and conclusions for developing and integrated watershed approach to Water, Sanitation, and Hygiene (WASH) in the area.
Legislative Institutional FrameworkFrom the 1890’s up to 1927, water in Zimbabwe was governed by a set of loosely coordinated pieces of legislation which were managed under the Water Ordinance of 1913. This ordinance was repealed by the 1927 and later the 1976 Water Act (Mtisi, 2011). However, the 1976 Act was replaced by the Zimba-bwe National Water Authority (ZINWA) Act of 1999. The 1999 Water Act set parameters of access and use of water and facilitated the establishment of catch-ment and sub-catchment areas based on hydrologi-cal boundaries (Mtisi, 2011).
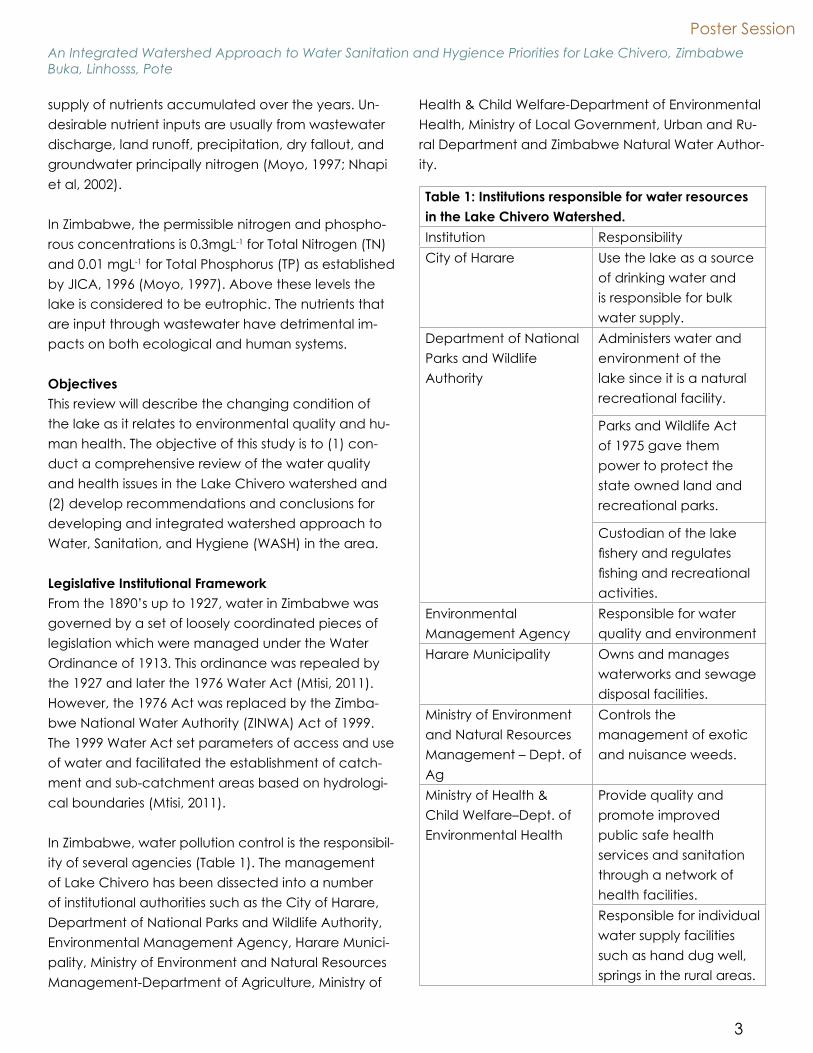
In Zimbabwe, water pollution control is the responsibil-ity of several agencies (Table 1). The management of Lake Chivero has been dissected into a number of institutional authorities such as the City of Harare, Department of National Parks and Wildlife Authority, Environmental Management Agency, Harare Munici-pality, Ministry of Environment and Natural Resources Management-Department of Agriculture, Ministry of
Health & Child Welfare-Department of Environmental Health, Ministry of Local Government, Urban and Ru-ral Department and Zimbabwe Natural Water Author-ity.
An Integrated Watershed Approach to Water Sanitation and Hygience Priorities for Lake Chivero, ZimbabweBuka, Linhosss, Pote
Table 1: Institutions responsible for water resources in the Lake Chivero Watershed.Institution ResponsibilityCity of Harare Use the lake as a source
of drinking water and is responsible for bulk water supply.
Department of National Parks and Wildlife Authority
Administers water and environment of the lake since it is a natural recreational facility.
Parks and Wildlife Act of 1975 gave them power to protect the state owned land and recreational parks.
Custodian of the lake fishery and regulates fishing and recreational activities.
Environmental Management Agency
Responsible for water quality and environment
Harare Municipality Owns and manages waterworks and sewage disposal facilities.
Ministry of Environment and Natural Resources Management – Dept. of Ag
Controls the management of exotic and nuisance weeds.
Ministry of Health & Child Welfare–Dept. of Environmental Health
Provide quality and promote improved public safe health services and sanitation through a network of health facilities. Responsible for individual water supply facilities such as hand dug well, springs in the rural areas.
Mississippi Water Resources Conference2014
4
An Integrated Watershed Approach to Water Sanitation and Hygience Priorities for Lake Chivero, ZimbabweBuka, Linhosss, Pote
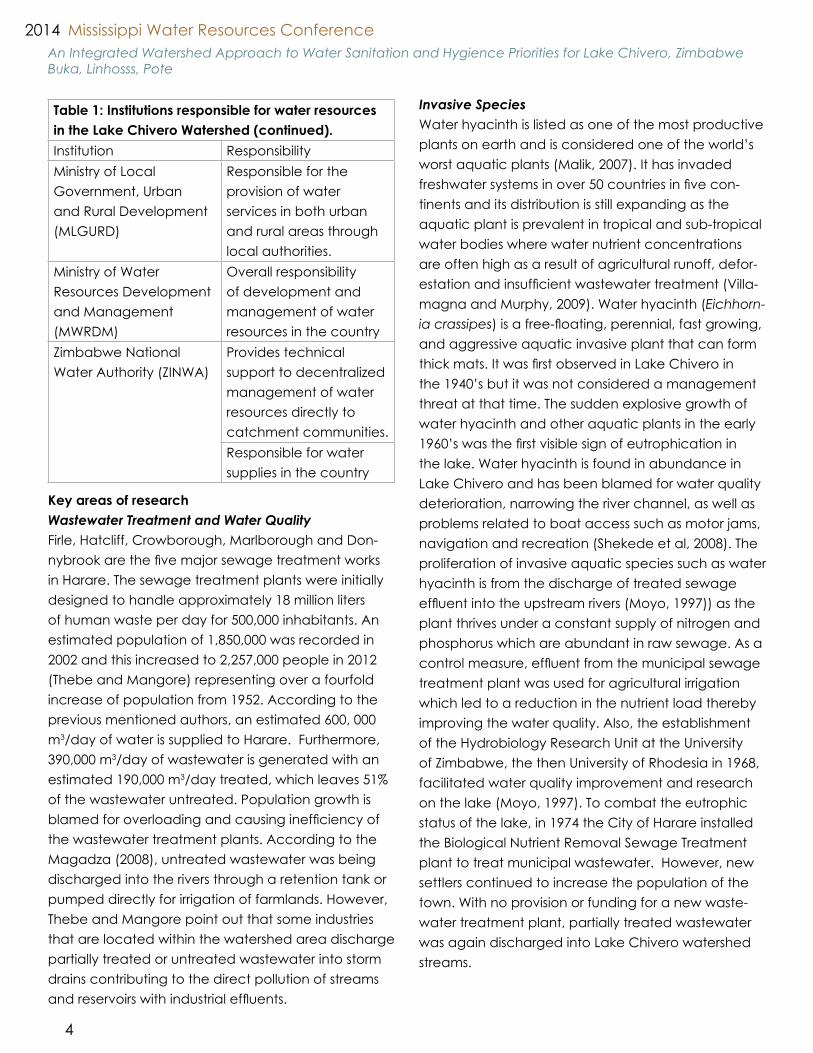
Key areas of research Wastewater Treatment and Water QualityFirle, Hatcliff, Crowborough, Marlborough and Don-nybrook are the five major sewage treatment works in Harare. The sewage treatment plants were initially designed to handle approximately 18 million liters of human waste per day for 500,000 inhabitants. An estimated population of 1,850,000 was recorded in 2002 and this increased to 2,257,000 people in 2012 (Thebe and Mangore) representing over a fourfold increase of population from 1952. According to the previous mentioned authors, an estimated 600, 000 m3/day of water is supplied to Harare. Furthermore, 390,000 m3/day of wastewater is generated with an estimated 190,000 m3/day treated, which leaves 51% of the wastewater untreated. Population growth is blamed for overloading and causing inefficiency of the wastewater treatment plants. According to the Magadza (2008), untreated wastewater was being discharged into the rivers through a retention tank or pumped directly for irrigation of farmlands. However, Thebe and Mangore point out that some industries that are located within the watershed area discharge partially treated or untreated wastewater into storm drains contributing to the direct pollution of streams and reservoirs with industrial effluents.
Invasive SpeciesWater hyacinth is listed as one of the most productive plants on earth and is considered one of the world’s worst aquatic plants (Malik, 2007). It has invaded freshwater systems in over 50 countries in five con-tinents and its distribution is still expanding as the aquatic plant is prevalent in tropical and sub-tropical water bodies where water nutrient concentrations are often high as a result of agricultural runoff, defor-estation and insufficient wastewater treatment (Villa-magna and Murphy, 2009). Water hyacinth (Eichhorn-ia crassipes) is a free-floating, perennial, fast growing, and aggressive aquatic invasive plant that can form thick mats. It was first observed in Lake Chivero in the 1940’s but it was not considered a management threat at that time. The sudden explosive growth of water hyacinth and other aquatic plants in the early 1960’s was the first visible sign of eutrophication in the lake. Water hyacinth is found in abundance in Lake Chivero and has been blamed for water quality deterioration, narrowing the river channel, as well as problems related to boat access such as motor jams, navigation and recreation (Shekede et al, 2008). The proliferation of invasive aquatic species such as water hyacinth is from the discharge of treated sewage effluent into the upstream rivers (Moyo, 1997)) as the plant thrives under a constant supply of nitrogen and phosphorus which are abundant in raw sewage. As a control measure, effluent from the municipal sewage treatment plant was used for agricultural irrigation which led to a reduction in the nutrient load thereby improving the water quality. Also, the establishment of the Hydrobiology Research Unit at the University of Zimbabwe, the then University of Rhodesia in 1968, facilitated water quality improvement and research on the lake (Moyo, 1997). To combat the eutrophic status of the lake, in 1974 the City of Harare installed the Biological Nutrient Removal Sewage Treatment plant to treat municipal wastewater. However, new settlers continued to increase the population of the town. With no provision or funding for a new waste-water treatment plant, partially treated wastewater was again discharged into Lake Chivero watershed streams.
Table 1: Institutions responsible for water resources in the Lake Chivero Watershed (continued).Institution ResponsibilityMinistry of Local Government, Urban and Rural Development (MLGURD)
Responsible for the provision of water services in both urban and rural areas through local authorities.
Ministry of Water Resources Development and Management (MWRDM)
Overall responsibility of development and management of water resources in the country
Zimbabwe National Water Authority (ZINWA)
Provides technical support to decentralized management of water resources directly to catchment communities.Responsible for water supplies in the country

Poster Session
5
An Integrated Watershed Approach to Water Sanitation and Hygience Priorities for Lake Chivero, ZimbabweBuka, Linhosss, Pote
According to Mhlanga (1995), the major outbreaks of water hyacinth were recorded in 1956, 1971 and 1989/90. Droughts, eutrophication and water hya-cinth control methods were the major contributing factors. Seed dispersed at the bottom of the lake during drought periods, the availability of nutrients from the sewage treatment plants and the ideal cli-mate conditions led to the proliferation of the weed. Discontinued use of chemicals to control the weed in 1986 and the failure of mechanical methods to eradi-cate water hyacinth contributed to the major out-break in 1989/90 (Mhlanga, 1995).Excessive amounts of water hyacinth, blue-green algae, and other organic matter began to have a serious impact on drinking water in terms of both raw-water abstraction and water treatment (Moyo, 1997). The cost of chem-icals increased and the filter runs decreased from 28 h to 10 h due to raw water quality deterioration, inefficiency and overloading of the treatment plants. In addition, algae concentrations and an increase of water pH from 8.0 to 9.6 led to unusual problems in the flocculation and clarification processes as large quantities were carried over to the sand filters.
Recently, in order to combat the hyacinth problem, 150,000 Neochetina weevils (Water hyacinth weevils) were imported from Australia (Kunatsa and Mu-fundirwa, 2013). Natural enemies of water hyacinth, Neochetina Eichhornia and N. bruchi are in the order of Coleoptera in the Curculionidae family (Ober-holzer, 2001). The weevil successfully reduced water hyacinth vigor by decreasing plant size, vegetative and flower seed production, and facilitating the transfer of fungi and bacteria microorganisms into the plant tissues (Venter et al., 2012). According to Ober-holzer (2001), the larvae bore into the petioles and the growth point causing water logging and ultimate death. The weevils eliminated about 95% of the plants but, they died off when their food source diminished. Because water hyacinth is a vigorous grower, it resur-faced again causing more problems in the lake.
According to the UNEP Global Alert Service the spread of water hyacinth declined from 42% in 1976 to 22% in 2000 but in 2005 a new invasive plant, spa-
ghetti weed (Hydrocotyle ranunculoides), surfaced (UNEP, 2008). A study conducted in September 2000 on weed infestation patterns in the lake showed that the spaghetti weed has replaced water hyacinth as the main aquatic weed. Spaghetti weed, is a pe-rennial herb which has dense growth over static or slowly-flowing water (Sainty and Jacobs, 2003), the weed has a potential to spread in nutrient enriched waterways. Observations by Chikwenhere in Sep-tember 2000, showed that spaghetti weed formed a continuous fringe extending 3-4 m from the northern shoreline into the water (Chikwenhere, 2001). The en-tire weed belt around the lake was about 4m deep, and covered approximately 6.5% of the surface area (Villamagna and Murphy, 2010).
Fish Kills In 1956, green headed tilapia (Oreochromis macro-chir) was introduced to the lake. This breed flourished because it fed and digested the plentiful blue green algae (Moyo, 1997) thereby making it a major fish species from Lake Chivero, important for food pro-duction. On the contrary, the same breed is very susceptible to low dissolved oxygen and is often the only fish species to die under low dissolved oxygen conditions (Moyo, 1997). Oxygen levels below 5mgL-1 have been cited as unsuitable for aquatic life.
Fish deaths have occurred since 1971 and during the last week of March in 1996, there was a cold spell that triggered a lake turnover which resulted in mas-sive fish kills (Moyo, 1997). The turnover brought low levels of dissolved oxygen and toxic levels of ammo-nia to the surface (Moyo, 1997). A study conducted by Magadza, (1997) showed ammonia poisoning as the primary cause of the fish kills and observed that unacceptable levels of ammonia also exposed fish to higher incidences of bacterial gill disease.
Human HealthAs population increased in Harare and the Lake Chivero watershed area, the proportion of wastewa-ter returns to rainfall/runoff inflows increased to the extent that wastewater return is now the main inflow into the lake during the dry season (Magadza, 2003).
Mississippi Water Resources Conference2014
6
An Integrated Watershed Approach to Water Sanitation and Hygience Priorities for Lake Chivero, ZimbabweBuka, Linhosss, Pote
Inadequate investment in wastewater treatment fa-cilities and poor infrastructure maintenance resulted in the accumulation of nutrients, toxins, and bacteria in the lake, which not only pose an environmental risk but also a health risk. For example, the chemical control of water hyacinth, using 2.4 Dichlorophenoxy-acetic acid (2.4-D), increased the incidences of still births and malformed babies. The increase of Cyano-bacteria was also coincident with a surge in enteritis in the City of Harare (Moyo, 1997). Microcystin-LR is the most toxic cyanobacteria in eutrophic fresh-water and can form harmful algal blooms (HABs). The recommended level of microcystin in lake for potable water supply is 1µgl but a study conducted in Lake Chivero showed an average concentration of 19.9µg/l (Ndebele and Magadza, 2006) and has been linked to liver cancer incidences.
Water treatment has also become costly to the extent that the Harare City Council is no longer able to supply all of the residents with access to sewage facilities or drinking water (Moyo, 1997). The propor-tion of households with access to excreta disposal in Harare declined by about 2.5% from 2002-2009 (ZIMDAT, 2010). During periods of municipal water supply failure some residents from Chitungwiza ob-tain water from open sources, such as the Manyame River, which carries partially treated and often under-treated sewage. There has been a high incidence of waterborne diseases in areas of Norton and Chi-tungwiza as a result of untreated water finding its way into drinking water sources (Masere et al., 2012). The discharge of raw or partially treated sewage exposed a greater Harare population to a variety of water borne parasites such as Protozoa (e.g. Trichomonas sp), Strongiloides sp of nematode parasites which are discharged as cysts, Trematoda (e.g. Clonorchis sp) transmitted by ingestion of inadequately cooked fish and lastly Schistosomes transmitted by making con-tact with water containing cercaria e.g. during fishing (Magadza, 2003). Cholera is closely linked to inad-equate environmental management and is transmit-ted mainly through contaminated water and food via the Cholera Bacteria. As of December 2008, a total of 11,735 cholera cases in Harare were reported
with 484 deaths since August 2008 (The Cape Argus (SA) 2008). The 2008/09 cholera outbreak affected 52 out of 62 districts throughout Zimbabwe and resulted in 98,531 cumulative cases and 4,282 deaths (UNICEF, 2011). The water and sanitation-related diseases such as Cholera, diarrhea and typhoid outbreaks in the country was as a result of poor state of the health and WASH sectors. According to the UNICEF Fact-sheet “Small towns, Water, Sanitation and Hygiene Program,” an estimate of 46% of Zimbabweans have access to improved sanitation facilities with Harare having an overall coverage of water supply and sani-tation estimated to be 60% and 40% respectively.
Recommendations Over much of the last decade, access to safe water supply and basic sanitation in Zimbabwe has been greatly affected by the general economic decline, reduced institutional and community capacity, power shortages, cyclical droughts and the effects of HIV and AIDS (UNICEF, 2011). Population increase, inadequate urban planning and lack of financial re-sources has contributed negatively to the provision of basic sanitation in Harare as most sewage treatment facilities are aging and overloaded. According to Magadza (2003), major problems leading to the dis-charge of inadequately treated wastewater in Lake Chivero are frequent power outages, inadequate funds to procure supplies of water purification chemi-cals and depletion of technical staff seeking greener pastures out of the country.
Political InfluenceDominance exercised by political functionaries, who have little understanding of the consequences of en-vironment deterioration, has negative environmental impacts. For example, poor salaries, under-funding of essential works and diversion of ratepayers’ funds to self-aggrandizement projects contribute to environ-mental damage through poor public services such as waste collection, infrastructure and city hygiene breakdown (Magadza, 2003). This can be addressed by implementing the International Lake Environment Committee, World Lake Vision principle of good governance, which is based on fairness, transparency

Poster Session
7
An Integrated Watershed Approach to Water Sanitation and Hygience Priorities for Lake Chivero, ZimbabweBuka, Linhosss, Pote
and the empowerment of all stakeholders (Magadza, 2008). Encouraging citizens and stakeholders to par-ticipate in identifying and resolving critical lake prob-lems can also be beneficial. This can be achieved by developing a strategy to educate youth and the community on integrated water resource manage-ment and by making use of research findings to develop simple but cost effective and efficient water quality analysis techniques and bio-monitoring tech-niques. According to Nhapi et al., (2004) a rational approach for the lake is recycling sewage to agricul-tural land. This combined with pollution prevention and water re-use could yield savings on chemicals, energy and mechanical costs needed to remove nitrogen at sewage treatment plants.
Nutrient ControlExcessive nutrients in Lake Chivero have resulted in many environmental problems including invasive spe-cies, algae blooms, fish kills, and human health issues. Controlling and reducing nutrient inputs into the lake is the first step in improving water quality for human use and aquatic life.
Water supplies are becoming scarce in the lake Chivero catchment area. Most residential towns, rural villages and farms have limited or no access to WASH facilities resulting in people using unhygienic alternatives for waste disposal which poses the risk of both human disease and environmental harm. However, the use of flush toilets leads to more waste-water generation and more water use. The Practical Action Website suggests a variety of technologies that promote WASH facilities without increasing the demand for water treatment. Technologies such as the use of bio-latrines, which makes use of dry tech-nology thereby reducing the demand for water, ventilated improved latrines which are odorless and easy to clean, ecological sanitation approach which is based on the nutrient cycling where urine and waste are regarded as resources and can be used as organic fertilizer if they are treated and well compos-ted and finally, the use of twin pit latrine to help solve, address and improve sanitation and health of these communities.
Wastewater has been successfully used in the past for pasture irrigation. For example, 87% of the waste-water effluent from Firle was used for pasture irriga-tion (Nhapi et al., 2006). However, only three farms were designated for this treatment method (1,500 ha) (Thebe and Mangore). With a limited area for appli-cation along with a growing population wastewater has been over applied to these farms making them unproductive. Pasture irrigation can be implemented again but the responsible authorities need to allocate more land and possibly introduce effluent irrigation of other crops such as maize for animal feeds. Accord-ing to Nhapi et al., 2006, maize has a high nutrient uptake compared to other pasture grass such as Ki-kuyu grass (Pennisetum clandestinum) and star grass (Cynodon plectostochus).
Other recommendations for nutrient control include constructing an alternative water source for the city and recycling nutrients in urban areas. Currently, the lake is both the water supply source and the waste-water sink for the city. Nhapi et al., (2002), suggested the construction of another water source to supply the City of Harare that is out of the catchment area or upstream from the city. The previous authors also recommend recycling nutrients in controlled urban agriculture to reduce fertilizer runoff.
Human health According to Hranova et al., (2001), one of the four main principles at the core of Integrated Water Resources Management (IWRM), as enunciated in the Dublin Principles, is that water development and management should be based on a participatory approach that involves users, planners and policy makers at all levels. In order to improve WASH in the area, people in and around the catchment area should be educated through outreach programs. This can be achieved if government agencies such as the Ministry of Environment and Natural Resources and the Ministry of Health sponsor workshops on water sanitation solutions. Example solutions may include providing simple and effective ways to treat water such as providing each household with water treat-ment pills or filters, encouraging communities togeth-
Mississippi Water Resources Conference2014
8
An Integrated Watershed Approach to Water Sanitation and Hygience Priorities for Lake Chivero, ZimbabweBuka, Linhosss, Pote
er to reduce accumulation of wastes and arrange clean-up programs, and boiling water.
Water HyacinthWater hyacinth is listed as one of the most productive plants on earth and is considered one of the world’s worst aquatic plants (Malik, 2007). Measures to con-trol it have resulted in environmental problems and risks to human health. There is a need to adopt some of the beneficial use of water hyacinth to address and control its problems. Malik (2007), argues that people’s participation and government interventions can help the utilization and control strategies of water hyacinth while at the same time benefitting the com-munity through job creation and poverty reduction.
Biological control of water hyacinth using the Neo-chetina weevils has proved to be successful in Lake Chivero. According to the Kunatsa and Mufundirwa (2013), 95% of the weed was eradicated but unfor-tunately the weevils died as the food source dimin-ished. This method can be used again but long-term adaptive management strategy needs to be imple-mented that is aimed at reintroducing the weevils every 3-5 years to compensate for the loss and death of weevils from food source shortages.
Invasive species such as water hyacinth have been blamed for water quality deterioration, narrowing river channels, problems in boat access, navigation and recreation. They also pose a threat to human health as the mats act as habitat for mosquitos. In the past, total eradication of the weed has proved not to be the best option as it has resulted in high costs and negative effects to the environment and human health through the use of chemicals. However, the invasive species, may well become the cornerstone of raw material production to the growing industries in resource-poor economies (Ojeifo et al., 2013), espe-cially in the developing countries such as Zimbabwe. The invasive plant has the ability to grow in heavily polluted water and can be used as a phytoreme-diation agent cleaning up contaminated waters. It is speculated that water hyacinth biomass can be used in waste water treatment, heavy metal and dye
remediation, as substrate for bioethanol and biogas production, for electricity generation, industrial uses, medicines, animal feed, agriculture and sustain-able development (Patel, 2012). Water hyacinth could serve as “nature’s kidney” for proper effluent treatment and also be used for decontaminating inorganic nutrients, toxic metals as well as persistent organic pollutants (Malik, 2007). If these beneficial uses of water hyacinth are implemented, jobs may be created through harvesting the weed. In order to make the beneficial uses of water hyacinth more profitable there is a need for institutional support from the government and non-governmental organiza-tions to translate the benefits into income generating projects.
Biogas for Nutrient and Water Hyacinth controlMost sewage treatment plants in the catchment area are aging and overloaded resulting in inefficiency. This problem can be addressed by channeling munic-ipality and industrial waste for biogas production. Ac-cording to Jingura and Matengai (2009), Zimbabwe has abundant biomass from agriculture, municipal and industrial wastes that can be used to develop biogas technology. In Harare an estimate of 660 tons of waste is produced daily with an estimate of 588 tons collected daily. In addition, Harare produces approximately 300,000 t/day of sewage sludge (Jin-gura and Matengai, 2009). Anaerobic digestion for biogas production has been practiced and there are already more than 400 bio-digesters in the country (Jingura and Matengai, 2009). However, there is need for research on the performance of the digesters and the cost benefit analysis as there is little information available.
According to the study conducted by Malik (2007), water hyacinth can be converted to biogas and furthermore, it yields better if it is mixed with animal waste. Unfortunately, the previous author argues that using water hyacinth for digestion in traditional digest-ers presents some problems such as large digester size and lower conversion efficiency from high water content. However, these problems can be addressed by designing appropriate water hyacinth digesters.
Poster Session
9
An Integrated Watershed Approach to Water Sanitation and Hygience Priorities for Lake Chivero, ZimbabweBuka, Linhosss, Pote
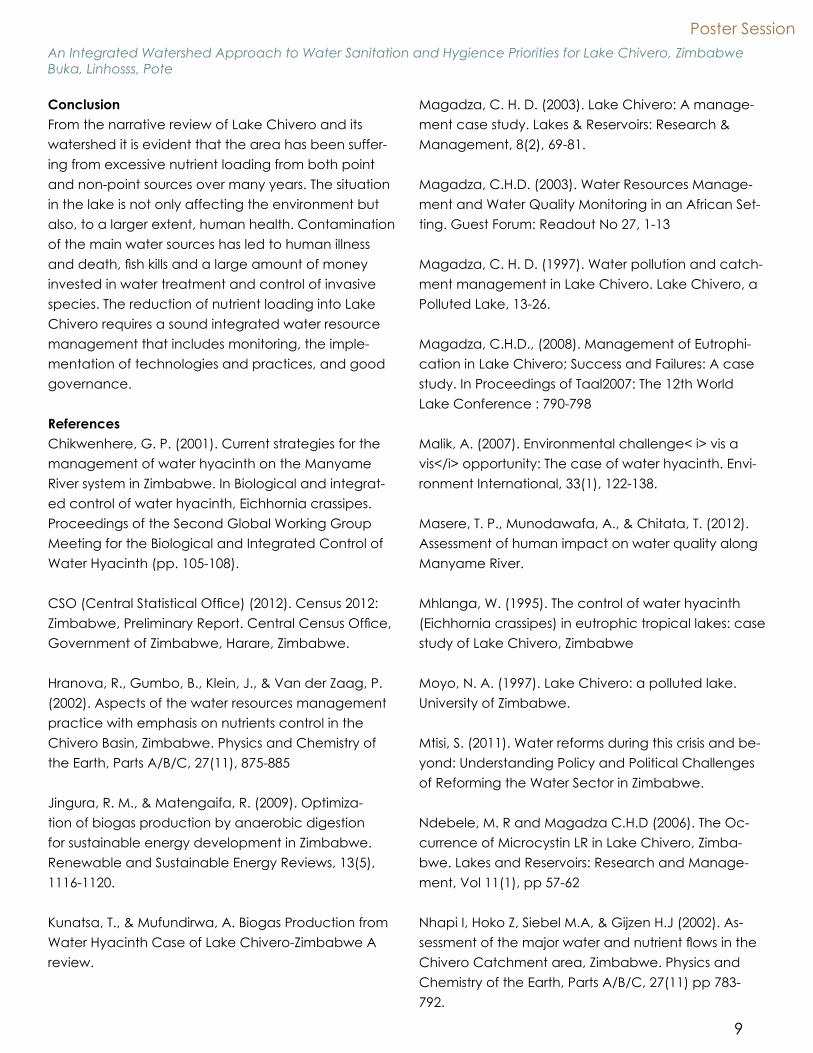
Conclusion From the narrative review of Lake Chivero and its watershed it is evident that the area has been suffer-ing from excessive nutrient loading from both point and non-point sources over many years. The situation in the lake is not only affecting the environment but also, to a larger extent, human health. Contamination of the main water sources has led to human illness and death, fish kills and a large amount of money invested in water treatment and control of invasive species. The reduction of nutrient loading into Lake Chivero requires a sound integrated water resource management that includes monitoring, the imple-mentation of technologies and practices, and good governance.
ReferencesChikwenhere, G. P. (2001). Current strategies for the management of water hyacinth on the Manyame River system in Zimbabwe. In Biological and integrat-ed control of water hyacinth, Eichhornia crassipes. Proceedings of the Second Global Working Group Meeting for the Biological and Integrated Control of Water Hyacinth (pp. 105-108).
CSO (Central Statistical Office) (2012). Census 2012: Zimbabwe, Preliminary Report. Central Census Office, Government of Zimbabwe, Harare, Zimbabwe.
Hranova, R., Gumbo, B., Klein, J., & Van der Zaag, P. (2002). Aspects of the water resources management practice with emphasis on nutrients control in the Chivero Basin, Zimbabwe. Physics and Chemistry of the Earth, Parts A/B/C, 27(11), 875-885
Jingura, R. M., & Matengaifa, R. (2009). Optimiza-tion of biogas production by anaerobic digestion for sustainable energy development in Zimbabwe. Renewable and Sustainable Energy Reviews, 13(5), 1116-1120.
Kunatsa, T., & Mufundirwa, A. Biogas Production from Water Hyacinth Case of Lake Chivero-Zimbabwe A review.
Magadza, C. H. D. (2003). Lake Chivero: A manage-ment case study. Lakes & Reservoirs: Research & Management, 8(2), 69-81.
Magadza, C.H.D. (2003). Water Resources Manage-ment and Water Quality Monitoring in an African Set-ting. Guest Forum: Readout No 27, 1-13
Magadza, C. H. D. (1997). Water pollution and catch-ment management in Lake Chivero. Lake Chivero, a Polluted Lake, 13-26.
Magadza, C.H.D., (2008). Management of Eutrophi-cation in Lake Chivero; Success and Failures: A case study. In Proceedings of Taal2007: The 12th World Lake Conference : 790-798
Malik, A. (2007). Environmental challenge< i> vis a vis</i> opportunity: The case of water hyacinth. Envi-ronment International, 33(1), 122-138.
Masere, T. P., Munodawafa, A., & Chitata, T. (2012). Assessment of human impact on water quality along Manyame River.
Mhlanga, W. (1995). The control of water hyacinth (Eichhornia crassipes) in eutrophic tropical lakes: case study of Lake Chivero, Zimbabwe
Moyo, N. A. (1997). Lake Chivero: a polluted lake. University of Zimbabwe.
Mtisi, S. (2011). Water reforms during this crisis and be-yond: Understanding Policy and Political Challenges of Reforming the Water Sector in Zimbabwe.
Ndebele, M. R and Magadza C.H.D (2006). The Oc-currence of Microcystin LR in Lake Chivero, Zimba-bwe. Lakes and Reservoirs: Research and Manage-ment, Vol 11(1), pp 57-62
Nhapi I, Hoko Z, Siebel M.A, & Gijzen H.J (2002). As-sessment of the major water and nutrient flows in the Chivero Catchment area, Zimbabwe. Physics and Chemistry of the Earth, Parts A/B/C, 27(11) pp 783-792.
Mississippi Water Resources Conference2014
10
Nhapi, I., Siebel, M.A. & Gijzen, H.J. 2001. Assessment of the major water and nutrient flows in the Chivero catchment area, Zimbabwe. 2nd WARFSA/WaterNet Symposium: Integrated Water Resources Manage-ment: Theory, Practice, Cases; Cape Town, 30 – 31 October 2001.
Nhapi, I., Siebel, M.A. & Gijzen, H.J. 2004. The Impact of Urbanization on the Water Quality of Lake Chivero, Zimbabwe. J. Ch. Inst. Water Environ. Manage. 18 (1): 44-49.
Nhapi, I., Siebel, M.A. and Gijzen, H.J. 2006. A Strat-egy for the Centralised Management of Wastewater in Harare, Zimbabwe. Water SA Journal of the Water Research Commission of South Africa (in press)
Oberholzer, H. Agricultural Research Council, PPRI, Weeds Research Division: www.arc.agric.za.
Ojeifo, M., Ekokotu, P. A., Olele, N. F., & Ekelemu, J. K. A Review of the Utilization of Water Hyacinth: Alterna-tive and Sustainable Control.
Patel, S. (2012). Threats, management and envisaged utilizations of aquatic weed Eichhornia crassipes: an overview. Reviews in Environmental Science and Bio/Technology, 11(3), 249-259.
Practical Action Website. Last accessed May 29 2014. Available at http://practicalaction.org/improved-toilets-3
Rast, W., Fred, Lee .G. (1983). Nutrient Loading Esti-mates for Lakes. Journal of Environmental Engineer-ing, 109 Pp 502-517.
Sainty, G., & Jacobs, S., (2003). Water plants in Austra-lia. 4th Edition pp 230-231.
Shekede, M.D., Kusangaya. S, & Schmidt, K., (2008). Spatio-temporal variations of aquatic weeds abun-dance and coverage in Lake Chivero, Zimbabwe. Physics and Chemistry of the Earth, 33 pp 714-721.
Spellman, F.R., (1996). Stream Ecology and Self- Puri-fication: An Introduction for Wastewater and Water Specialists.
Thebe, T.A & Mangore E.N. Unpublished Report. Avail-able at http://www.ais.unwater.org/ais/pluginfile.php/231/mod_page/content/84/zimbabwe_coun-try_repor_%20for_capacity_development_project_on_was_2.pdf Last Accessed May 29, 2014
The Cape Argus (SA), 8 Oct 2008. The rising water crisis that leads straight to grave. Reproduced in ZWNEWS 09/10/08 http://www.zwnews.com
UNEP Global Environmental Alert Service (GEAS), Water hyacinth – Can its aggressive invasion be controlled? Available at http://www.unep.org/pdf/UNEP_GEAS_APRIL_2013.pdf
UNICEF Zimbabwe Website, Last accessed May 29 2014. Available at http://www.unicef.org/zimbabwe/water_san_hygiene.html
UNICEF Zimbabwe, Last accessed May 29 2014. Avail-able at http://www.unicef.org/zimbabwe/ZIM_re-sources_smalltownslaunch.pdf
Venter, N., Hill, M. P., Hutchinson, S. L., & Ripley, B. S. (2013). Weevil borne microbes contribute as much to the reduction of photosynthesis in water hyacinth as does herbivory. In Biological Control, 64(2), 138-142.
Villamagna, A.M & Murphy, B.R., (2009). Ecological and Socio-economic impacts of water hyacinth. Freshwater Biology 55,282-298.
Zimbabwe Statistics Database (ZIMDAT). 2010. Ministry of Health and Child Welfare: NHP00- National Health Profile 2000-2008.
An Integrated Watershed Approach to Water Sanitation and Hygience Priorities for Lake Chivero, ZimbabweBuka, Linhosss, Pote
Poster Session
11
An Integrated Watershed Approach to Water Sanitation and Hygience Priorities for Lake Chivero, ZimbabweBuka, Linhosss, Pote
Figure 1: Background and timeline of Lake Chivero from construction (1950) to 2012.
Mississippi Water Resources Conference2014
12
An Integrated Watershed Approach to Water Sanitation and Hygience Priorities for Lake Chivero, ZimbabweBuka, Linhosss, Pote
Figure 2: Location of Lake Chivero
Poster Session
13
Distribution and Cycling of Mercury Species in Wetlands and Reservoirs in Northern Mississippi
Cizdziel, J., Brown, G.
Methylmercury (MeHg) is a neurotoxin that accumulates in tissues and biomagnifies up the aquatic food chain. Fish consumption advisories have been issued Enid Lake and the Yocona River, a large reservoir and its tributary in north-central Mississippi. This study examined the origin, distribution, and cycling of mercury species in the Yocona River, Enid Lake and associated wetlands. Environmental conditions can have a dramatic impact on the production, transport and fate of Hg species in a given area. Wetlands play a critical role in the cycling of Hg in watersheds and have been shown to be net sources of MeHg to ecosystems. Total-Hg and MeHg were determined seasonally over the course of two years in the inflow and outflow of Enid and Sardis Lakes, in associ-ated wetlands. The Hg species were also measured during storm events (i.e., in runoff from urban, agricultural, and wetland/forest areas). A range of water quality parameters were measured to determine the primary fac-tors controlling the distribution and transport of Hg species in the watershed. The project served as an important step toward building a mass balance for mercury in Enid Lake. Key findings include: • Wetland areas were determined to be hotspots for MeHg in the watershed with relatively high concentrations in water and fish • Levels of Hg in river water were highest at peak flows during storm events. • Forest soil and wetland sediment had higher levels of Hg and organic matter than agriculture soils. • Hg levels were highest in the urban runoff, followed by forest/wetland, and agriculture. • Runoff from highly erodible agricultural areas likely provides the largest input of Hg to Enid Lake by transport of particle-bound-Hg. • MeHg in wetland water was about double that found in lake water, and both spiked during the summer months, with wetlands reaching as high as 1.3 ng/L. • MeHg in the wetland water was negatively correlated with oxidizing reducing potential. • The net flux of T-Hg in Enid Lake was the most negative in the winter due to lowering of lake water levels to accommodate spring rains, and most positive during storm events, suggesting that rain storm events contribute a significant portion of Hg to the lakes. • The net flux of MeHg in Enid Lake was more negative in the summer than fall and spring due to higher methylation and evaporation rates.
Mississippi Water Resources Conference2014
14
Quantification of Harmful Algal Blooms (HABs) in the Grand Bay in Jackson County, MS
Dampier, J., Dash, P., Begonia, M.
Harmful Algal Blooms (HABs) are caused by species of tiny plants, phytoplankton. HABs may cause harm through the production of potent chemical toxins or by their accumulated biomass. Impacts include massive fish kills, loss of sales revenue primarily from fisheries and tourism, loss of commercially valuable and culturally vital shellfish resources, illness and death in populations of protected marine species, and threats to human health. Among the many HAB impacts in the northern Gulf of Mexico, those due to coastal blooms of the diatoms genus Pseudo-nitzschia with its associated toxin domoic acid, and the dinoflagellates of the genus Karenia with its associated toxin brevetoxin are of particular concern. This work (a field, laboratory and satellite remote sensing research) focused on quantifying HABs in the Grand Bay. It encompasses the collection of field data which is analyzed in the laboratory for pigments, suspended sediments, dissolved materials, and toxins as well as a satellite remote sensing component focused on developing techniques for mapping HABs from space. Recently, a procedure was developed to estimate cyanobacterial concentrations by quantifying chlorophyll a and the primary cyanobacterial pigment phycocyanin using OCM satellite data. This required the development of an atmospheric correction and vicarious calibration methodology for satellite data in inland and coastal waters. It has been tested to work for data from several satellite sensors such as OCM, SeaWiFS, MODIS, MERIS and QuickBird. This research is focused on use of satellite sensors, NPP VIIRS and MODIS AQUA, and the developed techniques to quantify HABs in the Grand Bay. In addition to algal toxins, the toxicity of environmental pollutants (i.e., heavy metals such as Pb, Cd, etc.) in the water was investigated and the mutual relationships between the heavy metals and HABs will be examined. This research will enhance the current state of knowledge on detection and mapping of the HABs in the Grand Bay and thus support state and coastal community efforts to manage fisheries in the region.
Poster Session
15
Groundwater Level Forecasting in Sunflower County, Mississippi using Artificial Neural
NetworksGuzmán, S., Paz, J., Tagert, M.
The Mississippi Delta Region is one of the most important in the United States given the high productivity levels of crops such as corn, cotton, rice, and soybean. Most of these crops require supplemental irrigation to sustain yield and to reduce the impacts of extended periods of dryness during the growing season. Due to the expan-sion of croplands , the annual volume of groundwater withdrawals have increased dramatically over the past two decades, exceeding aquifer recharge and generating an important reduction in the aquifer levels. In this study, we present the preliminary groundwater level simulation results for a well in Sunflower County that is within the Mississippi River Valley Shallow Alluvial (MRVA) aquifer. The performance of two different artificial neu-ral networks (ANN) for groundwater level forecasting was evaluated in order to identify an optimal architecture that can simulate decreasing trends of the groundwater level in summer season. Two algorithms, Levenberg-Marquardt and Bayesian Regularization, were evaluated in order to obtain a model that shows better results in the simulation of changes in groundwater level and provide acceptable predictions up to 3 months ahead. The ANN predictive performance was assessed based on the comparison between Root Mean Square Er-ror (RMSE) for each algorithm. Neural networks learn and recognize patterns in the nonlinear temporal data through mathematical analysis and computational architecture inspired by how the human brain works given a set of examples. This methodology is a tool to predict in a short period of time, groundwater levels at specific control points that would be used in an optimized regional plan to manage water withdrawals, and help farm-ers and water managers decide how to implement plan control procedures and conservation practices.

Mississippi Water Resources Conference2014
16
Quantitative Estimation of Suspended Sediments and Associated Mercury
Concentration in Enid Lake Using Remote Sensing TechniquesHossain, A., Chao, X., Cizdziel, J., Jia, Y.
The streams, lakes, and reservoirs in the Yazoo River Basin provide significant natural and recreational resources in Mississippi. However, since the soils in this region are highly erodible, large amount of sediments are discharged into the water bodies. Sediments are often associated with pollutants, which cause many water bodies in this region to be impaired due to the contaminated sediments. Mercury is one of the widely distributed and persistent pollutants in this environment. Mississippi currently has 11 water bodies under fish consumption advisories for mercury, including Enid Lake. To study the mercury contamination issue in the Enid Lake, the National Center for Computational Hydroscience and Engineering at the University of Mississippi has an on-going research project funded by the Mississippi Water Resources Research Institute and USGS to study the transport, fate, and risk of mercury in Enid Lake. As one of the tasks of this project the potential of the remote sensing techniques were explored to estimate the mercury concentration associated with suspended sediments in Enid Lake. Suspended sediment concentration has been estimated and mapped successfully using remote sensing for the last three decades. Different approaches and algorithms had been developed over time for SSC estimation using optical satellite data. Several studies had success in estimating total suspended sediments (TSS) using simple linear regression techniques involving the Moderate-resolution Imaging Spectroradiometer (MODIS) visible and near infra red (VNIR) data and in situ measurements. Similar approach was used in this study to estimate TSS and associated mercury concentration in Enid Lake, MS. The correlation coefficients of the regression equations were obtained using in situ measurements of TSS and mercury from two field campaigns, and near-real time reflectance values of the VNIR bands of MODIS imagery. Preliminary results indicate that these regression equations can be used for quantitative estimation of TSS and associated mercury in Enid Lake with reasonable accuracy.
Poster Session
17
Regional Rainfall Frequency Analysis and Drought Reduction in the Tombigbee River
BasinRamirez-Avila, J., McAnally, W., Tagert, M., Ortega-Achury, S.
A regional frequency analysis was conducted for precipitation to bring more detailed information about the amount and distribution of rainfall over the Tombigbee River Basin to promote efficient water resources man-agement in the study area. In addition, the results of the regional frequency analysis were combined with cli-matological drought reduction information to determine the probability that a cumulative precipitation depth needed to end a drought will be equaled or exceeded at least once in a specific season in the Tombigbee River Basin. A total of 28 precipitation gages in eastern and northeastern Mississippi and western Alabama were included in the study representing 1,352 station years of record. A regional analysis methodology was utilized, and the Tombigbee River Basin was considered a homogeneous region to increase the dataset and improve the reliability of precipitation-frequency estimates. The International Center for Integrated Water Resources (ICIWaRM) Regional Analysis of Frequency Tool (ICI-RAFT) was used to develop the regional frequency analysis. The software involves the application of the L-moments to characterize the variability, skewness and kurtosis of the data, determine heterogeneity in the region, and assist in the identification of appropriate regional prob-ability distribution(s). Verification of results indicated that the selected frequency distributions provide reliable exceedance values for precipitation. Results also showed that spring would be the season with a more prob-able chance of recovery from a moderate or severe drought in the Tombigbee River Basin.
IntroductionPrecipitation in the TRB generally is the result of con-vective showers from surface heating of moist air or the frontal lifting of moist air over polar continental air masses moving into the states from the north (Paulson et al, 1991).
Rainfall from 28 climate stations within the basin in-cluded in the NOAA’s National Climatic Data Center (NCDC) (Figure 1) averages 1441 mm annually from 1981 to 2010. Rainfall is distributed geographically, ranging from a high of 1581 mm in the eastern station located in Halleyville, AL to a low of 1337 mm in the southern station located in Gainesville, AL.
The drought termination refers to the moisture needs associated with recharge, demand and runoff that have been brought back to normal or above normal (Karl et al., 1987). The criterion proposed by Palmer (1965) to determine the end of a drought is defined by a PHDI value of -0.5 while drought amelioration is
achieved when a PHDI value of -2.0 is reached. Other factor to be considered is the probability that a re-gion will actually receive the amount of precipitation needed to ameliorate or reduce a drought.A region that does not normally experience exces-sively heavy precipitation during a specific season may be less probable to receive a sufficient rainfall amount for ending a drought than a region with record of occurrence of extreme precipitation events during the same season.
A RFA was conducted to bring more detailed infor-mation about the amount and distribution of pre-cipitation over the TRB to promote efficient water resources management in the area. Results of the RFA were combined with climatological drought re-duction information to determine the probability that a cumulative precipitation depth needed to end a drought will be equaled or exceeded at least once in a specific season of the year.

Mississippi Water Resources Conference2014
18
MethodsRegional Frequency Analysis MethodologyThe methodology used for deriving rainfall frequency estimates for the Tombigbee River Basin is an Index Flood RFA approach as outlined by Hosking and Wal-lis (1997). To complete the analysis, the International Center for Integrated Water Resources, ICIWaRM’s Regional Analysis of Frequency Tool (ICI-RAFT) was used. The purpose of ICI-RAFT is to estimate the frequency/intensity of a rainfall event of a particular duration using rainfall observations on the ground. ICI-RAFT has been formally reviewed and approved by the USA Corp of Engineers Hydrologic Engineer-ing Center (USACE-HEC) and the Institute for Water Resources (USACE-IWR).
Data Screening. The first step in the procedure of analysis and the use of the software is to test for outli-ers, inconsistencies, and shifts. The ICI-RAFT software, based on the methodology proposed by Hosking and Wallis (1997), estimates a discordancy parameter based on the difference between L-moment ratios of a site and the average L-moment ratios of a group of similar sites (region). The discordancy parameters can be used to determine abnormalities in a dataset and aid in identifying homogeneous regions. A beginning month on each season (December, March, June and September) and duration in months (3 months) was entered to define the time frame for the analysis.
Regionalization. A homogeneous region is considered a geographic delineated area or the collection of sites with similar characteristics pertinent to the rainfall frequency. In this study, the stations were grouped in a unique homogeneous region. A heterogeneity measure (H) is determined by the model to compare between site variations in sample L-moments for a group of sites with what would be expected for a homogeneous region.
Choosing a Frequency Distribution. The ICI-RAFT soft-ware estimates the Pearson’s R-values and z-scores for up to 14 standard frequency distributions for which the data is fitted. These parameters give an indication of the closeness of fit of each standard distribution
to the sample data of the region being analyzed. A Pearson R-value close to 1 and a z-score close to 0 (|z|≤1.64) indicate a good fit.
Estimation of the Frequency Distribution. The regional distribution was fit to scaled or normalized site data, the resulting regional exceedence curve will be then multiplied by a mean value representative of the selected site. Two options are available: using the L-Mean (L1) computed from the selected sites rainfall data provided in the input file or using an Index Flood value for that site. The Index Flood method uses the Mean Precipitation for the specified period of analy-sis. This method of computing the at-site estimate of the X-year storm event should be an improvement over direct at-site estimates.
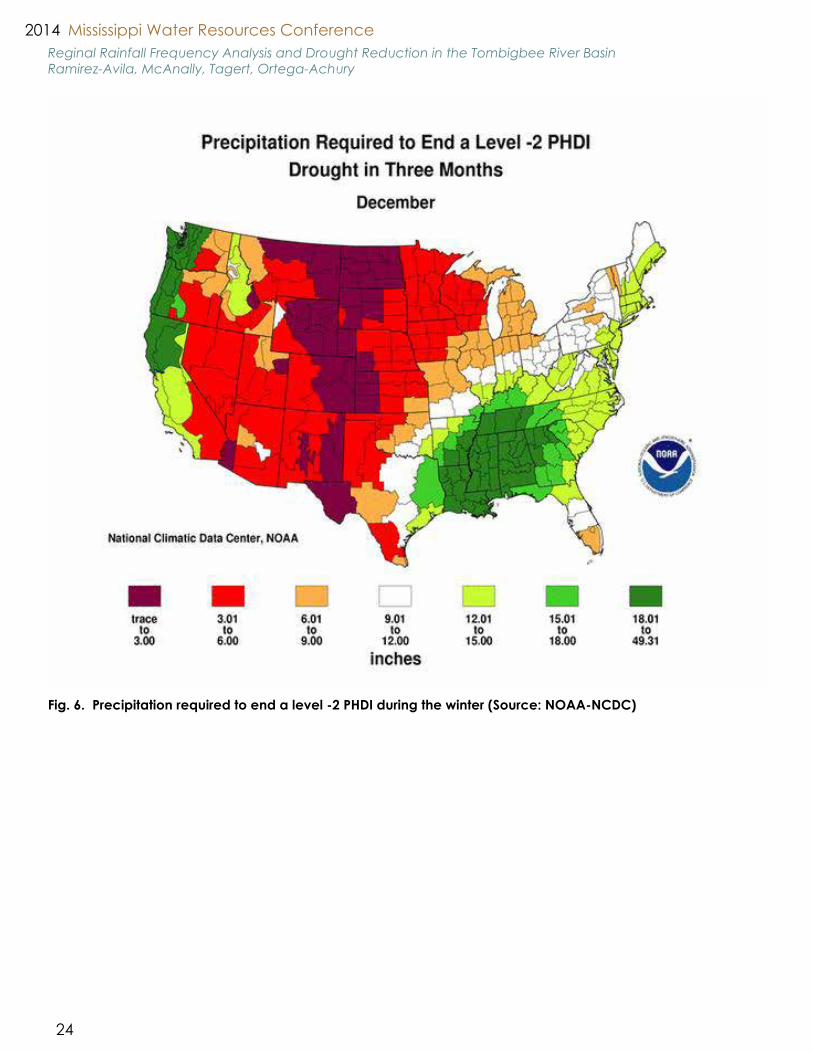
Precipitation Needed to End a DroughtThe probability that a cumulative precipitation depth needed to end a drought will be equaled or exceed-ed at least once in a specific season at the TRB used results from the RFA previously developed and the climatological drought reduction information gener-ated by NOAA-NCDC at its website (http://www.ncdc.noaa.gov/temp-and-precip/).
The map of the precipitation to end drought for each possible PHDI level at each season of the year (3-month duration) was requested. By using the Pear-son Type 3 frequency distribution fitting, the recur-rence interval and the exceedence probability of the minimum and maximum precipitation depth to end a drought reported at each requested map for each season was estimated.
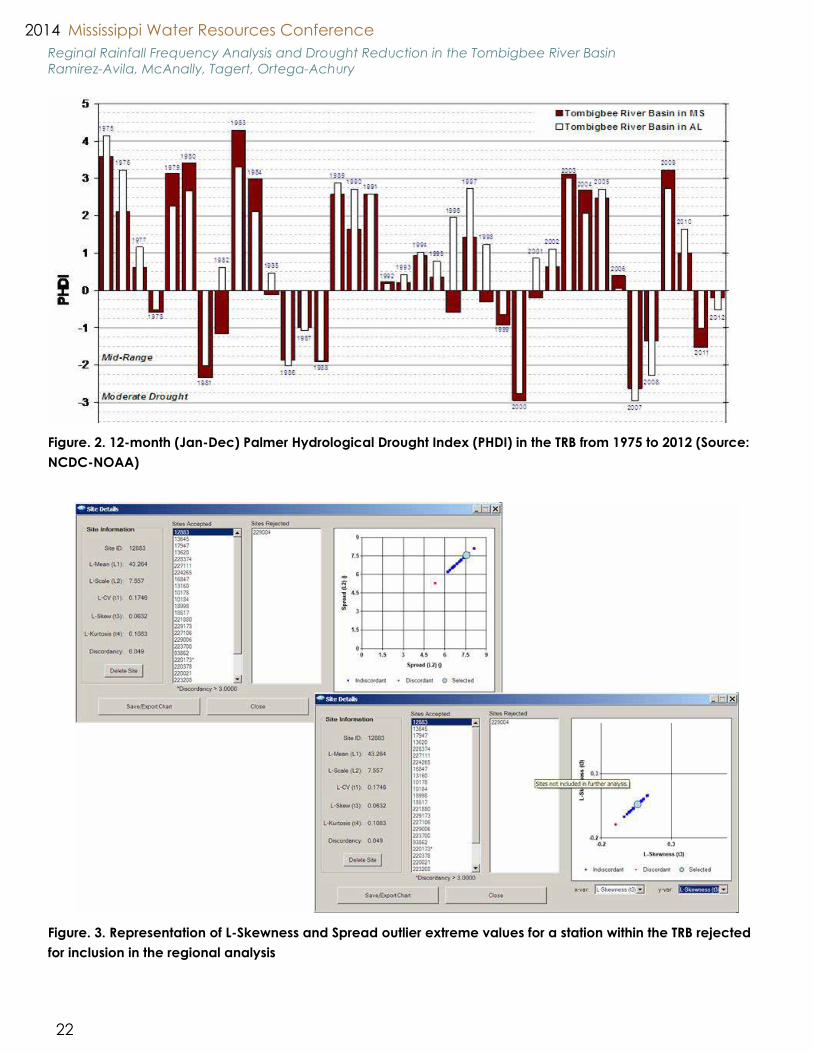
ResultsRainfall Regional Frequency AnalysisScreening of data. The screening analysis filtered one station to be included into the regionalization analy-sis. The exclusion was caused by a limited availability of information into the entire time series of this station (12 complete years with data), which caused the L-skewness and the spread value (L2) to be observed as outlier values within all the stations dataset (Figure 3).
Reginal Rainfall Frequency Analysis and Drought Reduction in the Tombigbee River BasinRamirez-Avila, McAnally, Tagert, Ortega-Achury

Poster Session
19
Identification of homogeneous regions. Homogeneity criteria were satisfied with the 27 possible accepted stations. TRB potentially could be treated as one ho-mogeneous region (Table 1).
Table 1. Homogeneity measures for the regionaliza-tion schemes examined at 1, 3 and 6 months dura-tion dataRegionalization
schemeNumber of sites H
Winter 27 -1.11Spring 27 -1.01Summer 27 0.72Fall 27 -1.23Annual 27 -0.35
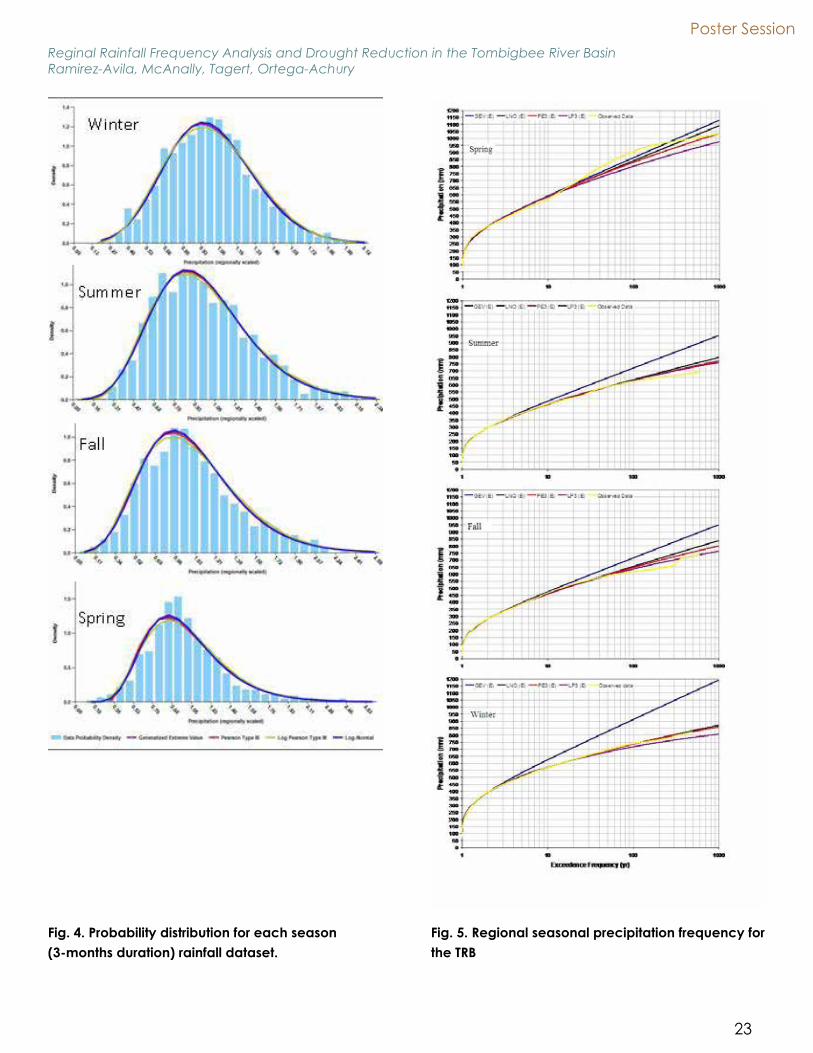
Selection of frequency distribution(s). The good-ness of fit measures Pearson “R” and “z” were used to aid to identify the distribution(s) yielding the ro-bust estimations of quantiles for each season [Table 2 - Pearson Type III (PE3), Log-Pearson Type III (LPE), Log-Normal (LNO) and the General Extreme Value (GEV)]. |z|≤1.64 corresponds to the failure to reject the hypothesized distribution at a CI of 90% (Hosking and Wallis, 1997).
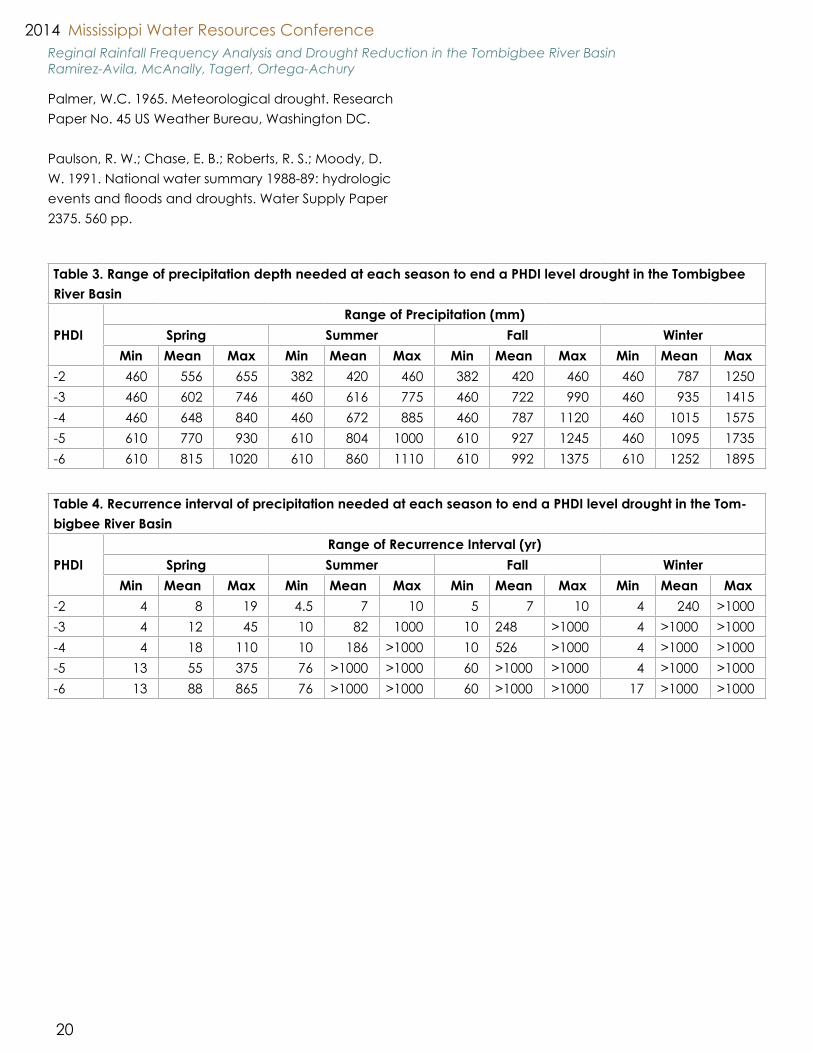
Exceedence Probability of Precipitation Needed to End a DroughtSummer and fall have similar magnitude of the mini-mum amount of precipitation needed to end any drought (level -2 to level -6), which is an expected condition as both seasons have relatively similar mean cumulative precipitation depths, 307-mm in winter and 296-mm in spring. Similar condition ob-
served when spring and winter seasons are com-pared, (401-mm in winter and 398-mm in spring).
ConclusionsA regional index flood model was developed for the four 3-month seasonal duration. One regional scheme (TRB as one homogeneous region) was vali-dated and used to the performance of the complete analysis.
The regional frequency method and the use of the ICI-RAFT software are convenient for delivering reli-able and reproducible estimates of rainfall frequen-cies over areas with big extension such as the TRB.
A future investigation of rainfall frequency in the TRB would include precipitations with different duration (1h, 2h, 3h, 6h, 24 h) to estimate rainfall intensities. Combining the evaluated methodology and compu-tational tools, producing rainfall Intensity-Frequency-Duration estimates would help in updating existing estimates, which are considered for use in the design of storm water management facilities and water sup-ply.
Literature CitedHosking, J. R. M. and J. R. Wallis. 1997. Regional Fre-quency Analysis: An Approach Based on L-Moments. Cambridge University Press, Cambridge, UK.
Karl, T., F. Quinlan, nd D.S. Ezell. 1987. Drought termi-nation and amelioration: Its climatological probabil-ity. J. of Climate and applied meteorology. (26) 9, 1198-1209.
Reginal Rainfall Frequency Analysis and Drought Reduction in the Tombigbee River BasinRamirez-Avila, McAnally, Tagert, Ortega-Achury
Table 2. Summary of goodness of fit statistic considering the Tombigbee River Basin a homogeneous region
DurationDistribution
PE3 LP3 LNO GEVPearson R z* Pearson R z Pearson R z Pearson R z
Winter 0.988 -0.49 0.9857 - 0.9881 -2.54 0.987 -1.37Spring 0.9642 -8.59 0.9705 - 0.9726 -8.71 0.9752 -7.34Summer 0.9885 2.07 0.989 - 0.9874 0.54 0.9877 2.50Fall 0.9872 -1.35 0.9841 - 0.9885 -3.69 0.9887 -0.47Annual 0.9869 -1.25 0.9871 - 0.9874 -1.33 0.9869 -1.50
Mississippi Water Resources Conference2014
20
Palmer, W.C. 1965. Meteorological drought. Research Paper No. 45 US Weather Bureau, Washington DC.
Paulson, R. W.; Chase, E. B.; Roberts, R. S.; Moody, D. W. 1991. National water summary 1988-89: hydrologic events and floods and droughts. Water Supply Paper 2375. 560 pp.
Reginal Rainfall Frequency Analysis and Drought Reduction in the Tombigbee River BasinRamirez-Avila, McAnally, Tagert, Ortega-Achury
Table 3. Range of precipitation depth needed at each season to end a PHDI level drought in the Tombigbee River Basin
PHDIRange of Precipitation (mm)
Spring Summer Fall WinterMin Mean Max Min Mean Max Min Mean Max Min Mean Max
-2 460 556 655 382 420 460 382 420 460 460 787 1250-3 460 602 746 460 616 775 460 722 990 460 935 1415-4 460 648 840 460 672 885 460 787 1120 460 1015 1575-5 610 770 930 610 804 1000 610 927 1245 460 1095 1735-6 610 815 1020 610 860 1110 610 992 1375 610 1252 1895
Table 4. Recurrence interval of precipitation needed at each season to end a PHDI level drought in the Tom-bigbee River Basin
PHDIRange of Recurrence Interval (yr)
Spring Summer Fall WinterMin Mean Max Min Mean Max Min Mean Max Min Mean Max
-2 4 8 19 4.5 7 10 5 7 10 4 240 >1000-3 4 12 45 10 82 1000 10 248 >1000 4 >1000 >1000-4 4 18 110 10 186 >1000 10 526 >1000 4 >1000 >1000-5 13 55 375 76 >1000 >1000 60 >1000 >1000 4 >1000 >1000-6 13 88 865 76 >1000 >1000 60 >1000 >1000 17 >1000 >1000

Poster Session
21
Reginal Rainfall Frequency Analysis and Drought Reduction in the Tombigbee River BasinRamirez-Avila, McAnally, Tagert, Ortega-Achury
Figure. 1. Location of climatic stations within the TRB
Mississippi Water Resources Conference2014
22
Reginal Rainfall Frequency Analysis and Drought Reduction in the Tombigbee River BasinRamirez-Avila, McAnally, Tagert, Ortega-Achury
Figure. 2. 12-month (Jan-Dec) Palmer Hydrological Drought Index (PHDI) in the TRB from 1975 to 2012 (Source: NCDC-NOAA)
Figure. 3. Representation of L-Skewness and Spread outlier extreme values for a station within the TRB rejected for inclusion in the regional analysis
Poster Session
23
Reginal Rainfall Frequency Analysis and Drought Reduction in the Tombigbee River BasinRamirez-Avila, McAnally, Tagert, Ortega-Achury
Fig. 4. Probability distribution for each season (3-months duration) rainfall dataset.
Fig. 5. Regional seasonal precipitation frequency for the TRB
Mississippi Water Resources Conference2014
24
Reginal Rainfall Frequency Analysis and Drought Reduction in the Tombigbee River BasinRamirez-Avila, McAnally, Tagert, Ortega-Achury
Fig. 6. Precipitation required to end a level -2 PHDI during the winter (Source: NOAA-NCDC)
Poster Session
25
Leaching of copper from different copper treated woodwastes
Singleton, B., Borazjani, H., Cox, M.
There has been a significant increase in production of copper treated lumber since voluntary halt in produc-tion of chromated copper arsenate (CCA) for residential use by the wood treating industry. Disposal of copper treated wood wastes have become an environmental issue for companies using these products for residential applications. This study evaluated recovery of copper from sawdust of copper azole(CA),micronized cop-per azole(MCA), azole copper quat(ACQ), and micronized copper quat(MCQ) using two different extraction procedures(toxicity characteristic leaching procedure(TCLP), and sonication) in acidic water. No significant dif-ferences in copper recovery were observed between CA and MCA by both extraction procedures. The same results were observed for ACQ and MCQ also. However, copper recovery for MCQ and ACQ were significantly higher than CA, and MCA.

Mississippi Water Resources Conference2014
26
Coa
stal
Wat
er Q
ualit
y
Coastal Water Quality
27
Coastal Water Quality
Brad Mauer (The Nature Conservancy)
The Red Creek Consolidated Mitigation Bank and the Challenges of Stream Restoration in Gulf Coastal Plain Soils and Weather
Padmanava Dash (Mississippi State University)
Investigating the Water Quality of Four Large Mississippi Lakes and Grand Bay, MS-AL Gulfcoast
Kimberly Cressman (Mississippi Department of Marine Resources)
The Role of Long-term Monitoring In Understanding Phosphate Spills Into a National Estuarine Research Reserve
Coa
stal
Wat
er Q
ualit
y
Mississippi Water Resources Conference2014
28
The Red Creek Consolidated Mitigation Bank and the Challenges of Stream Restoration in
Gulf Coastal Plain Soils and WeatherMaurer, B.
Since the Mobile and Vicksburg districts of the Corps began regulating impacts to streams, the Mississippi Department of Transportation has been proactive in acquiring advance credits for future impacts in several watersheds. One such project is the Red Creek Consolidated Mitigation Bank, located in coastal Jackson County and established in partnership with The Nature Conservancy. Approved in 2011, this wetland and stream bank is providing credits on wet pine flats, bayhead and bottomland hardwood forest, and 3,345 linear feet of stream restoration primarily on two reaches of a tributary to Red Creek. The site is part of an ecologically-significant conservation area in the Pascagoula River watershed. The two restoration reaches have distinctive features; a Priority 2 Restoration was completed on steep and highly entrenched section of the upper stream to arrest severe headcutting. In the second reach, Priority 1 stream relocation was completed in a low-gradient bottomland forest to prevent active downcutting. Completed in the spring of 2012, the stream restoration work was subject to several substantial rain storms (including Hurricane Isaac, which dropped 15-20 inches on the site) before soils had settled and vegetation was fully established. In addition, unforeseen seepage areas developed on some of the steeper slopes causing slumping in the toe areas. Significant damage from storms in these seepage areas and later universally throughout much of the project forced a re-evaluation of the design before repairs were completed. This presentation will discuss and contrast the two restoration reaches, including the challenges of choosing Best Management Practices (BMPs)for stream restoration, and establishing vegetation in erodible, relatively low-nutrient soils and unfavorable weather conditions (hot and dry with periodic intense rainfall). Finally, we will evaluate the damage and repairs to restoration reaches, and how the untimely storms quickly taught us what worked best and what needed improvement.
Coastal Water Quality
29
Investigating the Water Quality of Four Large Mississippi Lakes and Grand Bay, MS-AL
GulfcoastDash, P., Ikenga, J., Pinckney, J.
Harmful Algal Blooms (HABs), harmful microorganisms, and toxic metals represent three main water quality de-teriorating agents in the water-bodies. The objectives of this research were to take a systems level approach to investigate the water quality of four large Mississippi freshwater lakes including lakes Sardis, Enid, Grenada and Ross Barnett Reservoir and the Grand Bay in Mississippi Alabama gulf coast. Ten field campaigns were under-taken to the freshwater lakes and six sampling trips were organized to the Grand Bay to collect water samples, to measure the physical parameters including temperature, salinity, dissolved oxygen and pH, to measure remote sensing reflectance and backscattering at twelve discrete sites in each of the water bodies. The water samples were collected for high performance liquid chromatography (HPLC) photopigments, colored dis-solved organic matter (CDOM), suspended particulate matter (SPM), phycotoxins, nutrients, absorption, bacte-rial counts, toxic metals, and microscopy analyses. In all these water-bodies, organic SPM surpassed its inorgan-ic counterpart, which indicates that organics have a bigger share in the water quality deterioration in these systems. The photo-pigments derived relative abundances of major algal groups suggested the abundance of cyanobacteria, diatoms and dinoflagellates in all these systems. An investigation of the species composition will reveal the detail community structure. Phycotoxins and several types of bacteria and toxic metals were found in all the water bodies. The observation of these water quality issues warrants continuous operational monitor-ing of the water quality, investigation of fate and transport of pollutants, and implementation of best manage-ment practices for all these water-bodies.

Mississippi Water Resources Conference2014
30
The Role of Long-term Monitoring In Understanding Phosphate Spills Into A National
Estuarine Research ReserveCressman, K., Woodrey, M., Ruple, D.
Grand Bay National Estuarine Research Reserve (GBNERR) is an 18,400-acre protected area in southeastern Jackson County, MS. The GBNERR, along with 27 other Reserves, collects long-term environmental data, including water quality, weather and nutrient parameters, following accepted national protocols as part of a System-Wide Monitoring Program (SWMP). In 2005, a phosphate facility on GBNERR’s western border released wastewater into Bangs Lake. Data from SWMP were used to help determine the timing and duration of the event. The pH measured by a data logger deployed at the Bangs Lake water quality station dropped to 3.7. Orthophosphate, tested monthly in the water column and usually below the detection limit of 0.01 mg/L, spiked to over 4 mg/L: more than 400 times higher than normal. PO4 concentrations returned to baseline levels after Hurricane Katrina and remained below 0.01 mg/L until September 2012, when Hurricane Isaac led to another release into Bangs Lake. Routine nutrient sampling three weeks after Isaac found phosphate levels over 1 mg/L in Bangs Lake. Phosphate was also high at further distances from the plant. As of December 2013, other stations’ water column phosphate concentrations had returned to normal, but phosphate in Bangs Lake remained higher than historical levels. Research by collaborators at nearby institutions has helped fill in details of the magnitude and spatial patterns of the 2012 spill. This work, combined with the long-term context of SWMP data, led to the formation of a Phosphate Working Group, which will continue to explore the ecological effects of this long-term addition of phosphorus to Bangs Lake.
Del
ta W
ater
Man
agem
ent
Delta Water Management
31
Delta Water Management
Pradip Bhowal (Mississippi Department of Environmental Quality)
Nutrient Reduction in Mississippi: Partnering for Success
Mary Love Tagert (Mississippi State University)
Benefits of On-Farm Water Storage Systems in Porter Bayou Watershed
Joe Massey (Mississippi State University)
Indirect Regulation of the MRVA Aquifer: Options for the Mississippi Delta
Del
ta W
ater
Man
agem
ent

Mississippi Water Resources Conference2014
32
Nutrient Reduction In Mississippi: Partnering For Success
Bhowal, P.
Mississippi is blessed with abundant water resources, and protection of these water resources is essential to ensure sustainability of Mississippi’s ecosystems and economies. One of the biggest challenges for Mississippi’s surface waters, the Mississippi River and the Gulf of Mexico is the presence of excess nutrients in these waters. The Gulf of Mexico contains a hypoxic zone that is a result of nutrient-rich water from the Mississippi River flowing into the Gulf. Nutrients, in the form of nitrogen and phosphorus, come from a variety of sources including farmlands and lawns where fertilizers are used, wastewater treatment facilities, animal wastes from farms and pasturelands. Accordingly, the issues of nutrient pollution and Gulf Hypoxia have become priorities for Mississippi’s Delta, Upland and Coastal regions that contribute significant nutrients loading to the Gulf. Mississippi’s approach to reduce nutrient loadings within basins and to the Gulf of Mexico is a highly collaborative, stakeholder supported process centered on development and implementation of comprehensive nutrient reduction strategies for the Delta (December 2009), Coastal (March 2011), and Upland (March 2011) regions of the state. These strategies identified 11 strategic elements to help reduce nutrient loading to Mississippi’s surface waters. Over 50 staff from multiple state and federal resource agencies and other organizations in Mississippi have been working together to help develop and implement these comprehensive nutrient reduction strategies. Implementation includes engaging stakeholders, characterizing watersheds, determining status and trends, documenting management programs, establishing quantitative targets, selecting analytical tools, identifying/implementing established and innovative best management practices (BMPs), designing monitoring work, providing incentive and funding, and communicating results. These nutrient reduction strategies are currently being implemented in 10 priority watersheds in the Delta (7), Upland (2), and Coastal (1) regions of the state.
Delta Water Management
33
Benefits of On-Farm Water Storage Systems in Porter Bayou Watershed
Tagert, M., Paz, J., Pote, J., Kirmeyer, R.
Since the 1970’s, groundwater levels in the Mississippi Alluvial Aquifer have decreased as the number of irrigated acres in the Mississippi Delta has increased. Today, there are roughly 18,000 permitted irrigation wells dependent on water from the Mississippi Alluvial Aquifer, with approximately 50,000 new irrigated acres added both in 2011 and 2012. As concern has grown over groundwater declines and increasing fuel costs to run irrigation pumps, farmers have been implementing more irrigation conservation measures, such as on farm water storage (OFWS) systems. These systems began appearing in the Mississippi Delta in 2010 in conjunction with the implementation of the Mississippi River Basin Healthy Watersheds Initiative (MRBI). OFWS systems typically are surrounded by fields that are padded and piped, directing rainfall and runoff to a tailwater recovery ditch, from where it is then pumped into a pond for storage. Water is pumped from the pond and used for irrigation at a later date. These systems offer farmers the dual benefit of providing water for irrigation and also capturing nutrient rich tailwater for on farm reuse. This presentation will give an update on the project, which has monitored water savings and nutrient levels at two OFWS systems, one each at Metcalf Farm and at Pitts Farm, in the Porter Bayou Watershed, Mississippi. Data collection began in February 2012 and is ongoing, with water samples collected for analysis every three weeks throughout the growing season from March-October and every six weeks through the off season. Cumulative readings were also taken on flow meters to measure water use from the storage pond. The ability of these systems to reduce downstream nutrient concentrations has been mixed, with systems performing better when the tailwater recovery ditch is not full and can contain runoff on site. Thus, better management will improve the nutrient reduction potential of these systems. The water savings potential of these systems has been substantial. Metcalf Farm used 42 and 17 million gallons of water from the storage pond in 2012 and 2013, respectively; Pitts Farm used 60 and 56 million gallons of water from the storage pond in 2012 and 2013, respectively. These amounts reflect savings in groundwater that was not pumped from the Mississippi Alluvial Aquifer.
Mississippi Water Resources Conference2014
34
INTRODUCTION When Pfeiffer and Lin (2010) studied the groundwater savings associated with a program that subsidized the adoption of low energy precision application (LEPA) center pivot technology in Kansas, they found that groundwater use actually increased over the 10 year study period. This occurred even though LEPA provides irrigation efficiencies as high as 95% (Howell et al., 1995) and the LEPA adoption rate among ~20,000 Kansas irrigators approached 70%. The authors determined that for every 1% increase in the percent of acres irrigated using LEPA, total water extraction increased by 1.8%, compared to what would have happened had the acres been irrigated by standard center pivot.
While this outcome is paradoxical at first inspection, it makes more sense when one considers that the LEPA-based program occurred within the context of a highly dynamic economy and environment. Such an outcome is not unique to Kansas (Ward and Pulido-Velazquez, 2008), or even groundwater (Alcott, 2005). Possible explanations for why water use in Kansas increased rather than declined as expected include (a) a worsening drought required more irrigation to grow crops, more than offsetting efficiency gains provided by the LEPA program, (2) changes in commodity prices favored production
of corn over less water-demanding crops, and (3) efficiency improvements increase the total number of acres that can be reliably serviced during times of peak irrigation demand by the relatively “fixed” pumping capacities (e.g., gallons per minute per acre) of existing irrigation systems.
The key lesson from the Pfeiffer and Lin (2010) study is that irrigation efficiency improvements alone were not sufficient to cause a net reduction in groundwater use. It should be expected that in the absence of additional use restrictions or quotas, water “saved” through improvements in efficiency will be used to grow more crops as farmers universally think of ‘irrigation efficiency’ in terms of ‘maximized economic production’ rather than something that results in a net reduction in water use (Knox et al., 2011). This is not to say that improving irrigation efficiency is counter-productive per se. On the contrary, continuous improvements in irrigation efficiency will remain a necessary and critical component to water management in the 21st century. But as Pfeiffer and Lin (2010) note, “the behavioral response of groundwater users should be considered in conservation policy” but this lesson “remains unlearned, however, as many in the United States and around the world continue the subsidization of efficient irrigation technology as a method to reduce the consumptive use of water.”
Indirect Regulation of the MRVA Aquifer: Options for the Mississippi Delta
Massey, J.
The Mississippi River Valley Alluvial (MRVA) aquifer supplies approximately 90% of the irrigation used in the Mississippi delta, making it an invaluable asset to agriculture and the delta’s economy. Approaches to effectively manage the aquifer are being sought as per Mississippi code 51-3-1. A combination of direct and indirect regulatory approaches that take into account market forces and human nature will likely be required. This paper reviews indirect approaches to groundwater management that might help foster adoption of water-conserving irrigation practices while also aiding in the long-term management of the aquifer.
Delta Water Management
35
When human behavior is not accommodated, the expected “wet” gains of efficiency-only programs often manifest as “paper” gains as saved water is used for purposes other than preserving an aquifer (Howell, 2001).
Management approaches to address groundwater depletion can be broadly categorized as being direct or indirect (Shah, 2009; Vaux, 2011). Direct refers to managing at the level of the water user. Examples include permitting, metering, monitoring of water extraction, assessment of extraction fees, and establishing minimum well spacing requirements. Direct management works best when groundwater is being used by a relatively small number of large-volume extractors (e.g., industry; municipalities). Indirect refers to managing within the broader political, economic, and sociological segments of the water economy without directly touching the cause of groundwater depletion. Familiar examples of indirect management include education, licensing, and certification programs.
India provides an example of where indirect approaches to groundwater management are required. India has over 20 million tube wells that were installed over the past 200 years with essentially no rules or regulation, resulting in both “anarchy” and sharply declining groundwater levels (Shah, 2009). Direct regulation of groundwater withdrawals is physically and fiscally impossible owing to the high transaction costs that would be associated with metering, monitoring, and enforcement of millions of wells spread across the country. Hence, indirect methods are being sought to ‘tame’ rather than ‘control’ this anarchy (Shah, 2009).
The objective of this paper is to briefly review literature on indirect approaches to groundwater management that might be useful in (a) fostering greater adoption of improved irrigation practices in the Mississippi delta, and (b) assisting in the long-term management of the MRVA aquifer. The
overall purpose is to foster dialogue and encourage outside-the-box thinking to help address the complex issue of groundwater management in the 21st century.
Lessons from Electrical Utility Behavior Programs An area where some progress is being made in coupling advances in human behavioral science with resource conservation is the energy sector. Utilities can’t mandate energy efficiency and savings at the individual user level. Thus, they are seeking indirect methods that work within the broader economic and sociological aspects of the energy economy to reduce energy demand. For example, electrical utilities have found that traditional programs that subsidize the cost of compact fluorescent light bulbs, programmable thermostats, and other energy-saving devices routinely fall short of their savings goals (Mazur-Stommen and Farley, 2013). Traditionally, these so-called “widget” programs focused on adoption of hardware and did not account for the role that human behavior and decision-making play in energy use. However, a recent study found that savings are often largest for households whose electricity use was compared directly to that of their neighbors (Mazur-Stommen and Farley, 2013; Zatlin, 2014). This phenomenon, which relates to ‘social norm’ aspects of human behavior where people don’t like falling outside the ‘norm’ of their peer group, suggests that economics is not always the sole motivator of persons asked to conserve. The American Council for an Energy-Efficiency Economy (ACEEE) has grouped utility-run behavior programs into three broad categories:
Cognition programs focus on delivering information to consumers. Categories include general and targeted communication efforts, social media, classroom education, and training.
Calculus programs rely on consumers making economically rational decisions. Categories include feedback, games, incentives, home energy audits, and installation.
Indirect Regulation of the MRVA Aquifer: Options for the Mississippi DeltaMassey
Mississippi Water Resources Conference2014
36
Social interaction programs rely on interaction among people for their effectiveness. Categories include social marketing, person-to person efforts, eco-teams, peer champions, online forums, and gifts.
In the present paper, it is postulated that it will be beneficial and even necessary to incorporate human behavioral science, similar to that being done in the energy sector, as a means to facilitate the adoption of efficient irrigation practices in the Mississippi delta and to aid in the long-term management of the MRVA aquifer. Additional selected concepts and aspects of human behavior and ways that these might be employed in the Mississippi delta to aid in the (indirect) management of the MRVA aquifer are briefly discussed below.
The Hawthorne (Study Participation) EffectThe Hawthorne effect occurs when a person’s behavior is affected merely by the feeling of being observed or simply by the individual’s participation in an experiment. This phenomenon has long been known as a potential source of error in human experiments (Schwartz et al., 2013). In the Schwartz et al. study, households received five postcards notifying, and then reminding, them of their participation in a study of household electricity use: The initial postcards indicated that,
“You have been selected to be part of a one-month study of how much electricity you use in your home. This study will start on Wednesday July 20, 2011, close to the day of your meter reading this month. No action is needed on your part. We will send you a weekly reminder postcard about the study. Thank you. This study is being conducted by researchers at Carnegie Mellon University with help from your utility company.”
No other information was sent except for four weekly reminders. The Control group (no postcards) and 2-yr prior usage data for each household were used for treatment and baseline energy use comparisons. The results showed that statistically-
significant reductions in electricity use were measured—even though the treatment households received no additional information, instruction, or incentives to change. The effect was attributed to heightened awareness of energy consumption.
As is typical, however, electricity savings in the households vanished when the postcards stopped arriving. To extend the observed energy savings, Schwartz et al. (2013) discussed the need for a Hawthorne Strategy (Lied and Kazandjian, 1998) to ‘remind people about things that matter but that can get neglected in the turmoil of everyday life.’
A Hawthorne Strategy for the Mississippi River Valley Alluvial aquifer?In terms of the MRVA aquifer, the beneficial impacts of the Hawthorne effect on groundwater use is likely already occurring as a result of the Mississippi Department of Environmental Quality’s delta metering program initiated in 2013. The very act of installing flow meters heightens awareness, reducing water use. However absent a Hawthorne strategy to ‘remind producers about things that matter’, such as how vital the MRVA aquifer is to the long-term economic viability of the Mississippi delta, the conservation benefits of the metering program may be relatively short-lived. Ideas for a MRVA aquifer Hawthorne Strategy to keep the conservation of the MRVA aquifer in the minds of growers include advertisements on billboards, local newspapers, radio spots, and other venues that remind growers and others how unique the MRVA aquifer is and how vital it is to the entire economy of the Mississippi delta.
BenchmarkingAnother approach that could be used to sustain and perhaps even enhance the conservation benefits of the MDEQ’s flow meter program is benchmarking. Benchmarking is the process of comparing one’s business processes and performance metrics to industry bests or best practices from other industries (Global Benchmarking Network, 2014). An example of how benchmarking is being used by electrical utilities to
Indirect Regulation of the MRVA Aquifer: Options for the Mississippi DeltaMassey
Delta Water Management
37
reduce energy use in homes and businesses is the myenergy program (https://www.myenergy.com/). Here, people enter in their zip code and energy use (or download it directly from their local utility) and their energy use is then compared to that of their neighbors.
A benchmarking program has been initiated for irrigators in the United Kingdom by the UK Irrigation Association (http://www.ukia.org/). This program currently focuses on potato production. Seasonal water use data is entered by the producers anonymously over the internet and water-use comparisons are made with that of their peers. The process is confidential and allows producers to see how their operations compare to a best-practice farm. The program uses a harvest index (e.g., $ per unit irrigation applied) for comparisons. If a productivity gap is identified by this process, recommended best management practices are provided.
In terms of the Mississippi Delta, benchmarking could be a natural fit for the Mississippi State University Extension’s REACH program.
Real-Time FeedbackAnother behavioral-science approach to conservation increasingly used by public utilities is real-time feedback. With broader adoption of ‘smart’ electrical meters, utilities are able to provide customers with real-time electricity usage via smartphone applications and other means. Research suggests that by providing feedback to customers on when and how much electricity they are using, consumption can be reduced by 5 to 20 percent (Vines et al., 2013). How best to use feedback as a compliment to traditional energy savings, i.e., ‘widget’ programs, is still being determined, but this approach fits with the business adage that ‘what gets measured gets managed.’
In terms of potential application of feedback systems to help indirectly manage irrigation withdrawals from the MRVA aquifer, recent
advances in telemetry and smartphone technologies could be used to create networks that provide real-time comparisons of irrigation use with a cohort of cooperating producers (Figure 1). As before, REACH farm sites would be logical test sites for this approach. A similar approach could be used to provide real-time status reports on the condition of the MRVA aquifer (Figure 2).
Aquifer “Give-Back” ProgramIn 2013, the Maine lobster fishery was certified as “sustainable” by the London-based Marine Stewardship Council (Trotter, 2013). The certification recognizes the decades-long effort of Maine’s fishermen and fisherwomen to conserve and protect the lobster fisheries so vital to the economy and ecology of the state. Business owners that do not fish for lobsters, but whose businesses are directly tied to the success of these fisheries, have recognized that they should play a role in helping to manage Maine’s lobsters too. As a result, Give-Back programs have been established whereby business voluntarily donate a small portion of their proceeds to support research and education that helps to sustain the lobsters (Lobster Institute, 2011).
The idea of ‘giving back’ has become part of the business philosophy of a small but growing number of business owners such as Steve Melchiskey (Jones, 2014). Melchiskey was the first to donate proceeds from his Big Claw Wine Company to the Lobster Institute, a research organization that works directly with fishermen to conserve lobsters. Mr. Melchiskey personally contacted the Institute and expressed an interest in donating. He explained his desire to donate as, “It is not okay to make money off of a resource and not give anything back.” The Big Claw wine company pioneered the model that the Institute uses now for all give-back programs. They adopted his idea and have adapted it to other organizations that wish to support the institute in their research and operation costs (Jones, 2014). In assessing the economy of the Mississippi delta, one could reasonably argue that the vast majority
Indirect Regulation of the MRVA Aquifer: Options for the Mississippi DeltaMassey
Mississippi Water Resources Conference2014
38
Indirect Regulation of the MRVA Aquifer: Options for the Mississippi DeltaMassey
of businesses in the delta owe their existence to agriculture. In turn, agriculture depends heavily on the MRVA aquifer for nearly 90% of irrigation used. As such, the decline of the aquifer is not only an issue for producers, but also all other business directly and indirectly tied to the agriculture. If an Aquifer Give-Back program were to be established in the Mississippi delta, business such as seed and chemical companies, well drilling operations, valve and irrigation supply companies, consulting firms and many others might voluntarily donate proceeds that could be used to foster education and research on the aquifer. Details as to where and how any resulting funds should be managed require additional consideration, but some of the proceeds would be used to (1) host scientists and policy experts from other regions of the U.S. and world to foster exchange of ideas and experiences on water management. Additional funds would be used to (2) provide scholarships for students training in water and irrigation science as more people will needed to successfully manage the delta’s water resources in the future.
The goal of the Aquifer Give-Back program being proposed here is to broaden community awareness and appreciation of the MRVA aquifer as a world-class resource worthy of world-class stewardship. As such, it would serve as another form of indirect management of the MRVA aquifer if direct regulation is deemed infeasible. An Aquifer Give-Back program could foster a ‘we are in this together’ attitude that has helped the Maine lobster industry achieve prolonged stewardship of an economically and ecologically valuable resource.
Fostering a Conservation Mindset is KeyAnother goal of the indirect management approaches discussed in this paper is to enhance and sustain a Conservation-Mindset present among delta producers (Figure 3). If direct regulation of the aquifer is not feasible, then alternative methods of management will be required. The alternative to direct management is indirect management. In actuality, a combination of direct and indirect
approaches will be required to slow the decline of the aquifer. If the findings of Pfeiffer and Lin (2010) et al. hold relevance to the Mississippi delta, and there is no reason to believe that they do not, efficiency programs alone will not ultimately prevent further decline of the aquifer. Human nature and market forces must also be taken into consideration. In the absence of policies/programs that result in a net reduction in withdrawals from the aquifer and/or a net increase in recharge into the aquifer, the aquifer’s decline will continue.
The success of the Boll Weevil Eradication program (National Cotton Council, 2014) provides historical precedence of state and local authorities working closely with producers to address a complex resource issue. There is also evidence to the contrary that serves as a cautionary tale as to what happens when laissez faire management results in vexing problems: the mismanagement of the “once-in-a-century” glyphosate herbicide (Duke and Powles, 2008) comes to mind. The complexity of resource management in the 21st century requires that we learn from past mistakes and incorporate the recent findings of human behavioral science into our management approaches (Allcott and Mullainathan, 2010). Our understanding of these issues is incomplete, as Shah (2009) notes that ‘the science of how groundwater behaves is well developed compared to our understanding of how the users of groundwater behave.’ However, many of the necessary policies, players, and technologies are available to address the decline in the MRVA aquifer. If properly designed and deployed, science-based methods of direct and indirect management will play key roles in protecting the MRVA aquifer, a resource of regional, national, and international significance.
References CitedAlcott, B. 2005. Jevon’s paradox. Ecological Economics 54(2005) 9-21.
Allcott, H. and S. Mullainathan. 2010. “Behavior and Energy Policy.” Science. 327 (5970), pp. 1204-1205.
Delta Water Management
39
Indirect Regulation of the MRVA Aquifer: Options for the Mississippi DeltaMassey
Duke, S.O. and S.B. Powles. 2008. Glyphosate: a once-in-a-century herbicide. Pest. Manag. Sci. 64(4): 319-325.
Ehrhardt-Martinez, K., K.A. Donnelly, and J.A. Laitner. 2010. Advanced Metering Initiatives and Residential Feedback Programs for Household Electricity-Saving Opportunities. Report No. E105. American Council for an Energy-Efficient Economy. Washington, DC. 140 p.Global Benchmarking Network. Accessed 16 March 2014. Available on-line at: http://www.globalbenchmarking.org/home/
Howell, T.A., A. Yazar, A.D. Schneider, D.A. Dusek, and K.S. Copeland. 1995. Yield and water use efficiency of corn in response to LEPA irrigation. Trans. Soc. Ag. Eng. 38(6):1737-1747.
Howell, T.A. 2001. Enhancing water use efficiency in irrigated agriculture. Agronomy Journal. 93(2):281-289.
Jones, C.A. 2014. Maine Lobster “Give-Back” programs. Unpublished report submitted in partial fulfillment of requirements for the Environment & Sustainability minor. Mississippi State University.
Knox, J.W., M.G. Kay, and E.K. Weatherhead.2011. Water regulation, crop production, and agricultural water management-Understanding farmer perspectives on irrigation efficiency. Ag. Water Mngt. 108:3-8.
Lied, T., and V. Kazandjian. 1998. A Hawthorne strategy: Implications for performance measurements and improvement. Clin. Perf. Qual. Heath Care 6(4): 201-204.
Mazur-Stommen, S. and K. Farley, 2013. ACEEE Field Guide to Utility-Run Behavior Programs. Research Report B132. American Council for an Energy-Efficient Economy. Available on-line at: http://www.aceee.org/research-report/b132.
National Cotton Council, 2014. Boll Weevil
Eradication: A Complete Success. Available on-line at: http://www.cotton.org/tech/pest/bollweevil/eradication2.cfm
Pfeiffer, L. and C.-Y. C. Lin. 2010. The effect of irrigation technology on groundwater use. Choices magazine, 3rd quarter, 25(3). Agricultural and Applied Economics Association.
Schwartz, D., B. Fischhoff, T. Krishnamurti, and F. Sowell. 2013. The Hawthorne effect and energy awareness. Proc. Nat. Acad. Sci. 110(38):15242-6. Available on-line at: www.pnas.org/cgi/doi/10.1073/pnas.1301687110
Shah, T. 2009. Taming the Anarchy. Groundwater governance in south Asia. Resources for the Future. Washington, DC. 310 p.
The Lobster Bulletin. 2011. The Lobster Institute Spring 2011 newsletter. Available on-line at: http://umaine.edu/lobsterinstitute/files/2012/04/spring-2011-bulletincolor.pdf
Trotter, B. 2013. International council certifies Maine lobster fishery as sustainable. Available on-line at: http://bangordailynews.com/2013/03/10/business/msc-certifies-maine-lobster-fishery-as-sustainable/
Vaux, H. 2011. Groundwater under stress: the importance of management. Environ. Earth Sci. 62:19-23.
Vine, D., Buys, L. and Morris, P. 2013. The Effectiveness of Energy Feedback for Conservation and Peak Demand: A Literature Review. Open Journal of Energy Efficiency, 2, 7-15. doi: 10.4236/ojee.2013.21002.
Ward, F.A. and M. Pulido-Velazquez, 2008. Water conservation in irrigation can increase water use. Proc. Nat. Acad. Sci. 105(47):18215-18220. Available on-line at: http://www.pnas.org/content/105/47/18215.full.pdf+html

Mississippi Water Resources Conference2014
40
Indirect Regulation of the MRVA Aquifer: Options for the Mississippi DeltaMassey
Zatlin, D. 2014. Competition to reduce energy use results in savings for six Brooklyn neighborhoods. http://www.nyserda.ny.gov/About/Newsroom/2011-Announcements/2011-11-21-Competition-to-Reduce-Energy-Use-Results-In-Savings-for-Six-Brooklyn-Neighborhoods.aspx?p=1
Figure 1. Conceptual design to provide real-time feedback on irrigation water use to producers in the Missis-sippi delta as an indirect management approach for the MRVA aquifer. (Map credit: REACH website, Mississippi State University)
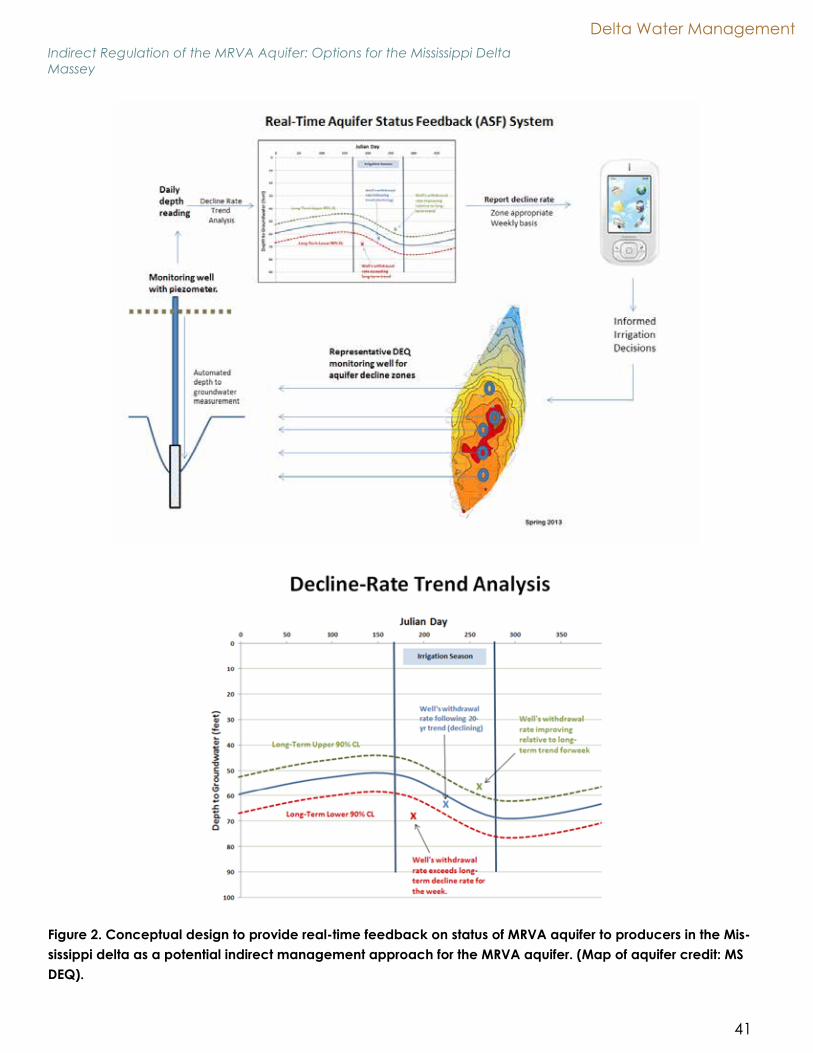
Delta Water Management
41
Indirect Regulation of the MRVA Aquifer: Options for the Mississippi DeltaMassey
Figure 2. Conceptual design to provide real-time feedback on status of MRVA aquifer to producers in the Mis-sissippi delta as a potential indirect management approach for the MRVA aquifer. (Map of aquifer credit: MS DEQ).
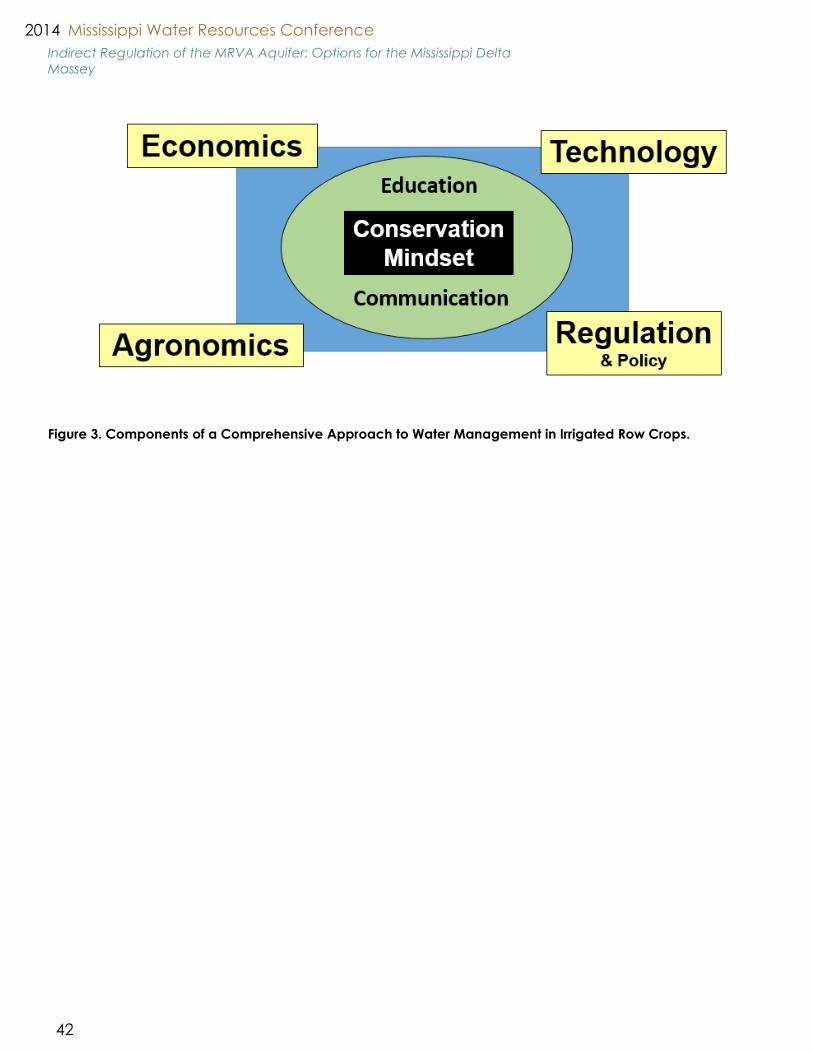
Mississippi Water Resources Conference2014
42
Gro
und
wat
er A
sses
smen
t
Indirect Regulation of the MRVA Aquifer: Options for the Mississippi DeltaMassey
Figure 3. Components of a Comprehensive Approach to Water Management in Irrigated Row Crops.

Groundwater Assessment
43
Groundwater Assessment
Heather L. Welch (U.S. Geological Survey)
Quality of Water in Public Supply Wells Located in the Southeastern Coastal Plain and Coastal Lowlands Aquifer Systems, Mississippi, 2013
B. Allen Roberts (U.S. Geological Survey)
Enhancing the USGS Streamgaging Network in the Mississippi River Basin: Continuous Water-Quality and Groundwater Data
Jason Barrett (Mississippi State University)
An Assessment of Private Wells Used for Drinking Water in Mississippi and Alabama
Joby M. Prince Czarnecki (Mississippi State University)
Austin’s Quadrant: A New Framework for Assessing Water Use Models
Gro
und
wat
er A
sses
smen
t

Mississippi Water Resources Conference2014
44
Quality of water in public supply wells located in the Southeastern Coastal Plain and Coastal
Lowlands aquifer systems, Mississippi, 2013Welch, H., Barlow, J.
Groundwater provides over one-third of the water used for public supply in the United States and nearly half of the water used for public water supply in the southeastern United States. In 2013, the U.S. Geological Survey’s National Water Quality Assessment Program began studies to provide nationally consistent water-quality data from principal aquifer systems that account for the majority of withdrawals for public supply throughout the United States. Two of these principal aquifers, the Southeastern Coastal Plain and Coastal Lowlands aquifer systems, were selected for sampling in 2013. These aquifer systems are located in the southeastern part of the United States, and each consists of unconsolidated to semiconsolidated sand, silt and clay deposits that thicken and dip coastward. The Southeastern Coastal Plain aquifer system spans approximately 90,000 sq miles and includes parts of 6 states, and the Coastal Lowlands aquifer system spans approximately 98,000 sq miles and includes parts of 5 states. Public-supply wells were selected for sampling using an equal-area grid approach to ensure a spatially unbiased sampling distribution.

Groundwater Assessment
45
Enhancing the USGS Streamgaging Network in the Mississippi River Basin: Continuous Water-
Quality and Groundwater DataRoberts, B.
The U.S. Geological Survey (USGS), Mississippi Water Science Center, in cooperation with the U.S. Army Corp of Engineers, Vicksburg District, is in the process of enhancing selected streamgages throughout the Mississippi River Basin to include continuous hourly water-quality and groundwater data. In Mississippi, the USGS is installing a ultraviolet nitrate sensor to collect continuous nitrate data, and a water-quality sonde to collect continuous temperature, specific conductance, turbidity, chlorophyll-a, and dissolved organic matter data on the Missis-sippi River near Vicksburg, Miss., and the Bogue Phalia near Leland, Miss. Both sites will be operated in conjunc-tion with the USGS National Water Quality Assessment Program to understand nitrate dynamics during extreme hydrologic conditions such as baseflow and storms and to provide a more complete data set for future nitrate load calculations.
Mississippi Water Resources Conference2014
46
An Assessment of Private Wells Used for Drinking Water in Mississippi and Alabama
Barrett, J., Grammer, P.
Most residents of Mississippi and Alabama are served by one of the over 1,700 public water systems in these states. Having access to a public water system provides citizens with safety and quality of water through the regulatory enforcement of the Mississippi State Department of Health-Bureau of Public Water Supply (MSDH) and the Alabama Department of Environmental Management (ADEM). Mississippi and Alabama citizens on private wells do not have the luxury of knowing the quality and/or quantity of their water on a regular basis. Unfortunately, a reliable method for determining the population that depends on a private well for their water supply has not existed since the 1990 census. This presentation will compare currently available methods and present a new methodology for estimating private well usage in Mississippi and Alabama. This novel method uses connections reported to the Safe Drinking Water Information System adjusted to account for non-residential connections, along with census data to generate improved estimates that are quite different from other available sources. This method has been used to generate well usage estimates for all counties in Mississippi and Alabama that can be utilized to better strategize water infrastructure improvements and well monitoring programs.
Groundwater Assessment
47
Austin’s Quadrant: a new framework for assessing water use models
Czarnecki, J., Kröger, R., Omer, A.
Although water resources are frequently discussed as an issue of Tragedy of the Commons, this paradigm has well-published shortcomings which make it irrelevant in some situations. A new framework for water use mod-els is proposed where regions are evaluated on two continua, infrastructure and supply. A quadrant is formed wherein regions in quadrant I experience both ample water supply and adequate infrastructure with which to utilize available supply. Regions falling within quadrants II and IV experience a shortage of either supply (II) or infrastructure (IV) but adequate levels of the opposite factor. Regions falling within quadrant III bear the double burden of limited supply and infrastructure. This paper explores case studies within the four quadrants and at-tempts to answer the questions: (1) what does it take to move from quadrants III or IV to quadrants II or I, and more importantly (2) how do regions in quadrant I not move into quadrant II? Engineered infrastructure must increase concomitantly with governance infrastructure or regions will slide farther down the supply continuum. Education and outreach hold the most promise to shoring up the future of water resources for these regions. Users who make the connection between individual use and its effect on aquifer supply are more likely to engage in conserving behavior and to be more accepting of regulation of use. If adequate education alone is unable to stem overuse, then at least regulation will be supported.

Mississippi Water Resources Conference2014
48
Wat
er P
olic
y/M
anag
emen
t

Water Policy/Management
49
Water Policy/Management
Bryan Piazza (The Nature Conservancy)
The Mississippi Freshwater Assessment: A New Tool for Supporting Decision Making for Mississippi’s Freshwater Resources
Anna Linhoss (Mississippi State University)
Mississippi Water Resources Inventory and Projections for Economic Development
Richard Kaminski (Mississippi State University)
The Migratory Bird Habitat Initiative: Managing Waterbird Habitats After the 2010 Gulf Oil Spill
Warren “Cory” Gallo (Mississippi State University)
Diamondhead MS BMP Demonstration Site, Outreach Tools and Model Ordinance
Wat
er P
olic
y/M
anag
emen
t
Mississippi Water Resources Conference2014
50
The Mississippi Freshwater Assessment: A New Tool for Supporting Decision Making for
Mississippi’s Freshwater Resources Piazza, B.
TNC is in the early phases a project to compile, analyze, and present scientific information to improve conservation and protection of Mississippi’s freshwater resources. This comprehensive statewide freshwater assessment is a scientifically sound evaluation of watershed and landscape integrity (i.e., land use and cover, floodplain connectivity, channelization), water quality, surface flow, groundwater trends, and biological health (i.e., trends in species diversity indicators,) of all of the state’s watersheds. The data resource and analysis tool will provide a powerful, online mapper with decision-support capability to facilitate the development of freshwater science and conservation objectives and prioritize freshwater conservation statewide. It will be freely available and useful for any stakeholder, including policy- and decision-makers, environmental resource managers, local watershed conservation groups, and the general public, and will allow both technical and lay audiences to evaluate the effects of current and future water use and watershed development proposals. This assessment will provide the capability to draw attention to the status of Mississippi’s watersheds, develop agency, NGO, and industry partnerships, and provide quickly accessible facts and figures to support science-based and sound policy outcomes about water. This presentation will describe the framework, components, and capabilities of the assessment system, and will investigate an example of a similar system built for Louisiana. When complete, our Mississippi Freshwater Assessment will integrate with Louisiana’s system as well as TNC’s Gulf of Mexico Resilience decision support tool (maps.coastalresilience.org) to move toward the ultimate goal of providing a common approach and framework for supporting decision making and management of freshwater and coastal resources across the northern Gulf of Mexico.
Water Policy/Management
51
Mississippi Water Resources Inventory & Projections for Economic Development
Linhoss, A., Balwebber, J., Pote, J.
Mississippi’s water resources are an important part of the state’s economy, environment, and quality of life. Wa-ter is an essential commodity and the importance of water to Mississippi’s economy is clear given the number of economic sectors that rely on the resource (e.g. agriculture, industry, energy, and public supply). However, the economic value of water is in many ways immeasurable because (1) it provides life whose economic value is incalculable, (2) there many external factors that are often not accounted for in the market value of water (e.g. pollution and environmental impacts), (3) users often self-supply and do not pay a market value for the resource, and (4) water is a complex resource whose value depends on volume, timing, reliability, and quality. The objective of this research is to assess the value of Mississippi’s water resources within an integrative environ-mental and economic development framework. Mississippi is blessed with rich water resources. The state has the second highest rate of annual rainfall in the continental U.S. and major ground water aquifers underlie 83% of the state. River flow through Mississippi is dominated by the Mississippi River which discharges an average of 723,000 cubic feet per second. When combined, the rest of the rivers in Mississippi discharge approximately 60,000 cubic feet per second, which is only 7% of the flow in the Mississippi River. Eight dams in the state (0.2%) have the primary purpose of water supply and Mississippi has the least number of reservoirs with the purpose of water supply, relative to neighboring states. Mississippi’s water use is dominated by groundwater and agri-culture. 32% of Mississippi’s water withdrawal permits are from surface water and the remaining 68% are from ground water. Irrigation for agriculture is the primary groundwater beneficial use category and industry is the primary surface water beneficial use category. Mississippi’s high dependence on groundwater runs opposite the trend for most of the comparison states and Mississippi withdraws the least amount of groundwater relative to neighboring states. As Mississippi moves forward through economic and community development it is impor-tant to recognize the environmental and economic values of water. This research provides a broad perspec-tive for assessing water use in Mississippi as well as understanding the vulnerable aspects of our water resources.
Mississippi Water Resources Conference2014
52
The Migratory Bird Habitat Initiative: Managing Waterbird Habitats After The 2010 Gulf Oil Spill
Kaminski, R., Davis, J., Webb, L., Tapp, J., Weegman, M.
In response to the 2010 Deepwater Horizon Gulf Oil Spill, the USDA Natural Resources Conservation Service (NRCS) funded the Migratory Bird Habitat Initiative (MBHI), providing landowners in eight Gulf coastal states $40 M in cost-share assistance to manage wetland habitats for waterbirds inland from the spill through 1-3-year contracts. As part of the comprehensive MBHI, we quantified (1) waterbird use of MBHI managed (i.e., primarily artificial flooding), non-managed, and other wetlands and (2) potential food resources for these birds in wetlands in the Lower Mississippi Alluvial Valley (MAV). Managed Wetlands Reserve Program (WRP) lands received significantly greater use by waterbirds than passively or non-managed WRP easements. In Louisiana and Mississippi, nearly 3 times more dabbling ducks (Anatini) and all ducks combined (Anatinae) were observed on MBHI than on non-managed WRP wetlands. Additionally, waterbirds other than waterfowl and shorebirds were nearly twice more abundant on MBHI than non-managed WRP wetlands. In Arkansas and Missouri, MBHI wetlands attracted over 2 times more dabbling ducks than non-managed WRP wetlands. Concerning food abundance and habitat carrying capacity for waterbirds, MBHI wetlands in Louisiana and Mississippi contained ≥1.26 and ≥1.53 times more total seed biomass and biomass of seeds known to be eaten by waterfowl, respectively, than non-managed WRP wetlands. In Arkansas and Missouri, seed biomass during winter was 21% greater on MBHI wetlands than non-managed WRP wetlands. While no significant differences in aquatic invertebrate biomass or number of invertebrate families were detected between managed and non-managed WRP wetlands in Arkansas and Missouri, production of invertebrates during autumn was 3 times greater on MBHI wetlands than non-managed WRP wetlands. During winter, invertebrate biomass was approximately 40% greater on MBHI and non-managed WRP wetlands than public-owned managed wetlands in these states. Our evaluation implies that MBHI management increased waterbird use and potential foraging carrying capacity of WRP wetlands for waterbirds and possibly provided alternative habitats for these birds inland from oil impacted Gulf coastal wetlands. Continued financial incentives to landowners in the MAV and nationally to manage wetlands at conservation easements following restoration have the potential to increase contribution of private lands to waterbird habitat availability and carrying capacity.

Water Policy/Management
53
Diamondhead MS BMP Demonstration Site, Outreach Tools and Model Ordinance
Gallo, W.
Researchers at Mississippi State University along with the Mississippi Department of Environmental Quality (MDEQ) have developed new BMP demonstrations, educational outreach material and policy tools for coastal Mississippi. A proposal for a BMP demonstration site was developed that promotes resilient community design and development in Diamondhead, MS. The demonstration site is designed to accommodate future com-mercial development, protect watershed health, and demonstrate small and large scale structural BMPs from infiltration basins to regional detention. Two presentations and two brochures were also developed that focus on homeowners and policy makers. Both sets of documents are designed to provide a broad overview of the tools, policies and practices homeowners and policy makers can adapt to better protect their a home wa-tershed and a community watershed. All documents will be available for use from the MDEQ to meet NPDES Phase II education and outreach requirements. Lastly, a new model ordinance was created based on a review of other model ordinances throughout the country and adapted for the specific needs of coastal Mississippi. The ordinance is designed to be flexible and adaptable to any community’s requirements by providing op-tions and insights into the choices available throughout the document. This document will also be available for municipalities use from the MDEQ.

Mississippi Water Resources Conference2014
54
Del
ta G
roun
dw
ater
Delta Groundwater
55
Delta Groundwater
Adbullah O. Dakhlalla (Mississippi State University)
Evaluating the Impacts of Crop Rotations on Groundwater Recharge and Water Table Depth in the Mississippi Delta
Austin C. Patton (University of Mississippi)
Identifying a Mechanism for an Infiltration Threshold from the Sunflower River, MS to the Underlying Alluvial Aquifer
David R. Johnson (U.S. Army Corps of Engineers)
Empirical Evidence of Recharge in the Mississippi Alluvial Aquifer
Azan Hossain (University of Mississippi)
Groundwater Depletion in the Mississippi Delta as Observed by the Gravity Recovery and Climate Experiment (GRACE) Satellite System
Del
ta G
roun
dw
ater

Mississippi Water Resources Conference2014
56
Evaluating the Impacts of Crop Rotations on Groundwater Recharge and Water Table
Depth in the Mississippi DeltaDakhlalla, A., Parajuli, P.
The Mississippi River Valley Alluvial Aquifer (MRVA), which underlies the Big Sunflower River Watershed (BSRW), is the most heavily used aquifer in Mississippi. Because the MRVA is primarily used for irrigating crops such as corn, cotton, soybean, and rice, the water levels have been declining rapidly over the past few decades. Each crop rotation practice demands certain irrigation amounts and applications, which in turn can affect the hydrogeology of the aquifer. The objective of this study is to assess the impacts of crop rotation practices on groundwater recharge rates and water table depths in the BSRW using the Soil and Water Assessment Tool (SWAT) model. The SWAT model was hydrologically calibrated for monthly streamflow using observed streamflow data from 3 USGS gage stations (Merigold, Sunflower, and Leland). Because this study focuses on groundwater processes, the model was also calibrated for water table depths at several ground water wells throughout the BSRW. The observed water table depths used to calibrate the model were provided by the Yazoo Management District (YMD). The model was evaluated based on the coefficient of determination, Nash-Sutcliffe Efficiency, and root mean square error statistics. The crop rotation scenarios that will be employed in this study are corn after soybean, soybean after rice, and continuous soybean. This study will provide some insight into which crop rotation practices cause the most fluctuations on groundwater recharge and water table depths.
Delta Groundwater
57
Identifying A Mechanism For An Infiltration Threshold From The Sunflower River, MS To The
Underlying Alluvial Aquifer Patton, A., Davidson, G., Rigby, J., Barlow, J.
Long-term groundwater level and river stage measurements at a USGS coupled groundwater stream-gaging station located on the Sunflower River at Sunflower, MS show an apparent stage-threshold for infiltration to the underlying alluvial aquifer. This site is located near the center of a large regional cone of depression in the Mississippi River Valley alluvial aquifer and therefore provides insight into the effects of groundwater declines on streamflow in the Big Sunflower River. Groundwater levels respond to changes in river stage only when river stage exceeds 34 m msl (mean sea level). The purpose of this research was to identify the responsible mecha-nism. Two hypotheses were considered: (1) scour of infiltration-limiting fine-grained bottom sediments during high flow rate events at higher stage, and (2) lateral infiltration at high stage into more permeable coarser grained sedimentary layers intersecting the stream channel at higher elevation.
Mississippi Water Resources Conference2014
58
Empirical evidence of recharge in the Mississippi Alluvial Aquifer
Johnson, D., Barlow, J.
Multiple groundwater models have been constructed to model the alluvial aquifer. These models differ significantly in the allocation of water for recharge. This paper will examine the potential sources of recharge and estimate their magnitudes. Other literature will be used to validate the assumptions presented in this paper.
Delta Groundwater
59
Groundwater Depletion in the Mississippi Delta as Observed by the Gravity Recovery and
Climate Experiment (GRACE) Satellite SystemHossain, A.
The Gravity Recovery and Climate Experiment (GRACE), launched in early 2002, is a satellite mission jointly managed by the US National Aeronautics and Space Administration (NASA) and the German Aerospace Cen-ter (DLR). Its goal is to map Earth’s gravity field with high precision, approximately on a monthly basis. Global representations of Earth’s gravity field are produced based on a K-band microwave system, which measures the distance (loosely controlled at about 220 km) between two identical satellites nearly continuously as they revolve in a tandem, near polar orbit, at an initial 485 km altitude. The gravitational effects of changes in atmo-spheric surface pressure and ocean bottom pressure are removed using numerical model analyses, such that the remaining variability can be attributed primarily to the redistribution of terrestrial water storage, thus provide measurements of column integrated terrestrial water storage (TWS) for the entire globe. Several recent studies clearly demonstrated that GRACE-derived estimates of variations of total water storage (all of the snow, ice, surface water, soil water and groundwater in a region), when combined with auxiliary hydrological datasets, can provide groundwater storage change estimates of sufficient accuracy to benefit water management. This paper summarizes the recent studies that conducted to investigate the groundwater depletion in the Mississippi Delta using GRACE data. This paper also presents the results obtained from the analysis of last ten years month-ly GRACE Level 3 data for the Mississippi Delta areas.
IntroductionGRACE is a satellite mission jointly managed by the US National Aeronautics and Space Administration (NASA) and the German Aerospace Center (DLR). This mission is dedicated to map Earth’s gravity field with high precision, approximately on a monthly basis (Tapley et al. 2004). The mission was launched in March 2002 and is continued providing high quality data. It’s operation is based on a K-band microwave system, which measures, nearly continuously, the range (maintained at about 220 km) between two identical satellites as they revolve in a tandem, near polar orbit, at an initial altitude of 485 km. It produces global representations of Earth’s gravity field on a near-monthly basis as sets of spherical harmonic coefficients up to degree and order 120, based on highly precise K-band microwave measurements of the distance between two identical satellites orbiting Earth in tandem (Tapley et al. 2004). The process is based on the technique that analyzes the variance spectrum of GRACE spherical harmonic coefficients
as a function of degree and order, and compare it with an analogous variance spectrum derived from modeled water storage fields, with the goal of maxi-mizing the signal-to noise ratio in the GRACE retriev-als.
The non-hydrological gravitational contributions are removed from GRACE level 2 data products based on numerical models of the underlying processes, including atmospheric and oceanic circulation and solid Earth tides. That means, the gravitational ef-fects of changes in atmospheric surface pressure and ocean bottom pressure are removed using numerical model analyses, such that the remaining variability can be attributed primarily to the redistribution of terrestrial water storage. Therefore, measurements of column integrated terrestrial water storage (TWS) for the entire globe are obtained.
The horizontal resolution of GRACE is limited to about 150 000 km2 (Rowlands et al. 2005; Yeh et al. 2006).
Mississippi Water Resources Conference2014
60
Vertically, the GRACE TWS observation is a single number that integrates changes in groundwater, soil moisture, vegetation, surface water, snow, and ice. To realize the full potential of GRACE for hydrology, the derived regional-scale column-integrated month-ly water storage anomalies must be disaggregated horizontally, vertically, and in time. Therefore, skillful disaggregation of GRACE terrestrial water storage anomalies into changes in these individual compo-nents would greatly improve their value for hydrologi-cal research and applications.
One approach for vertical disaggregation of GRACE data is to use auxiliary information to isolate individual components. Rodell et al. (2007) computed ground-water storage variations averaged over the Mississippi River basin and its four major sub-basins by using soil moisture and snow water equivalent output from the Global Land Data Assimilation System (GLDAS)(Rodell et al. 2004) to estimate and remove those compo-nents from GRACE TWS, assuming vegetation and surface water contributions to be negligible.
Another approach is based on a more sophisticated disaggregation method to merge GRACE-derived TWS with the one simulated by a land surface model (LSM) via data assimilation. This approach has a number of advantages. First, despite coarser spatial resolution, the GRACE observations yield reasonably reliable estimates of TWS anomalies (Swenson et al. 2006). Therefore, assimilation of these data into an LSM has the potential to improve the accuracy of TWS in LSM simulations (Ellett et al. 2006), much as assimilation of remotely sensed snow cover (Clark et al. 2006; Rodell and Houser 2004), snow water equiva-lent (Slater and Clark 2006), soil moisture (Reichle et al. 2007), and skin temperature (Bosilovich et al. 2007) have had a positive impact on LSM simulations. Second, our current understanding of hydrological processes, as captured by the model, is used to en-hance the satellite observations, and provide down-scaling and quality control of GRACE observations while enabling the synthesis of multiple observation types in a physically consistent manner. Third, an as-similated observation of TWS influences a number of
processes within an LSM in addition to water storage.
GRACE Level 3 DataGRACE Level 3 data provides monthly land mass grids that contain terrestrial water storage anomalies (in aquifers, river basins, etc.) from GRACE time-variable gravity data relative to a time-mean. Each monthly grid represents the difference in the masses for that month, and the average over Jan 2004 to Dec 2009. The data covers entire globe from July 31, 2002 to present time. The spatial resolution of the data is 1 degree (Latitude) x 1 degree (Longitude). It is in Geo-graphic projection with WGS 84 Ellipsoid. The data can be obtained in NETCDF format (release 5.0) from http://podaac.jpl.nasa.gov/dataset/TELLUS_LAND_NC_RL05. Figure 1 and Figure 2 show the processed GRACE Level 3 data for the entire globe and the US respectively.
Ground Water Depletion in MS DeltaIn Mississippi ground water constitutes 80% of all the freshwater used and serves the water-supply needs for the majority of the population. The demand for freshwater supplies is expected to increase due to increasing population and the accompanying eco-nomic growth. The Mississippi River Valley alluvial aqui-fer is the most heavily pumped aquifer in Mississippi. It supplies about 2 billion gallons per day of water for agricultural and industrial use in the Mississippi Delta.
In the Mississippi embayment area water resources have a profound effect on the economy, which is based largely on agriculture. Mississippi ranks first for aquaculture and fourth for cotton in 2007 with a total value of over $600 million (U.S. Department of Agricul-ture, 2010).
Ground water depletion in the Mississippi embayment area including Mississippi Delta is a major concern. Konikow (2013) reported that the total net volumetric ground water depletion in the Mississippi embayment area during the period of 1900-2000 and 1900-2008 are 117.6 km3 and 182.0 km3 respectively.
Groundwater Depletion in the Mississippi Delta as Observed by the GRACE Satellite System Hossain
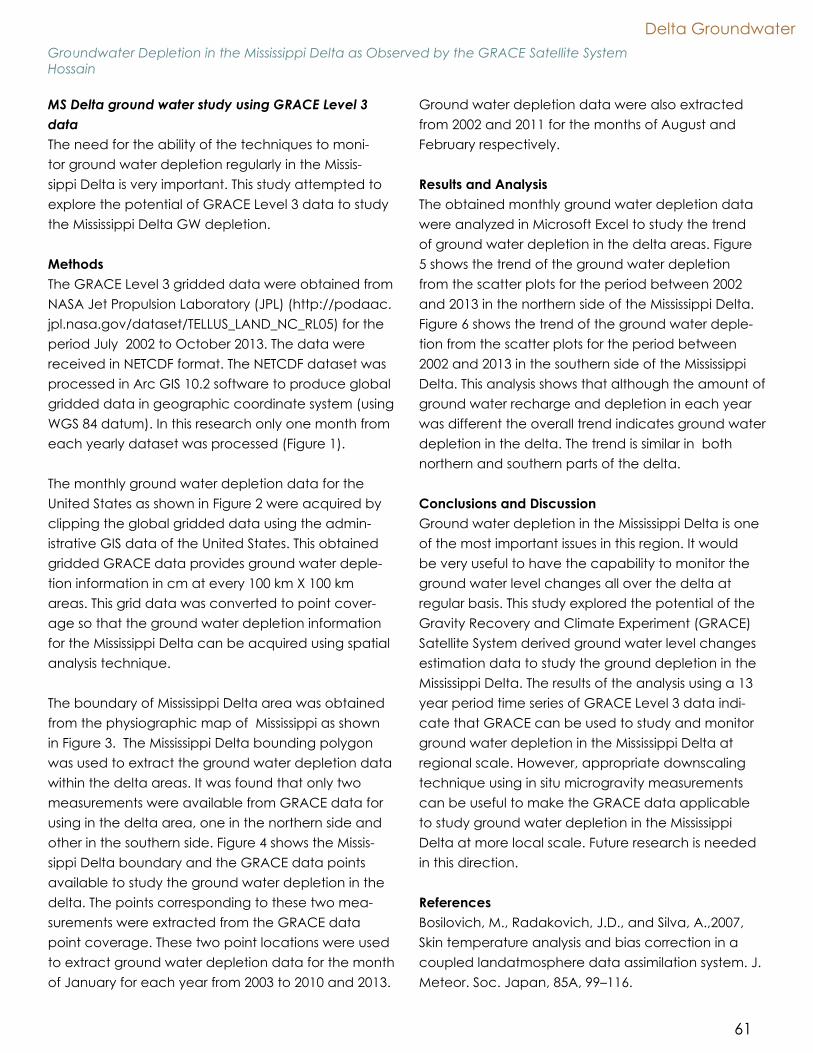
Delta Groundwater
61
MS Delta ground water study using GRACE Level 3 dataThe need for the ability of the techniques to moni-tor ground water depletion regularly in the Missis-sippi Delta is very important. This study attempted to explore the potential of GRACE Level 3 data to study the Mississippi Delta GW depletion.
MethodsThe GRACE Level 3 gridded data were obtained from NASA Jet Propulsion Laboratory (JPL) (http://podaac.jpl.nasa.gov/dataset/TELLUS_LAND_NC_RL05) for the period July 2002 to October 2013. The data were received in NETCDF format. The NETCDF dataset was processed in Arc GIS 10.2 software to produce global gridded data in geographic coordinate system (using WGS 84 datum). In this research only one month from each yearly dataset was processed (Figure 1).
The monthly ground water depletion data for the United States as shown in Figure 2 were acquired by clipping the global gridded data using the admin-istrative GIS data of the United States. This obtained gridded GRACE data provides ground water deple-tion information in cm at every 100 km X 100 km areas. This grid data was converted to point cover-age so that the ground water depletion information for the Mississippi Delta can be acquired using spatial analysis technique.
The boundary of Mississippi Delta area was obtained from the physiographic map of Mississippi as shown in Figure 3. The Mississippi Delta bounding polygon was used to extract the ground water depletion data within the delta areas. It was found that only two measurements were available from GRACE data for using in the delta area, one in the northern side and other in the southern side. Figure 4 shows the Missis-sippi Delta boundary and the GRACE data points available to study the ground water depletion in the delta. The points corresponding to these two mea-surements were extracted from the GRACE data point coverage. These two point locations were used to extract ground water depletion data for the month of January for each year from 2003 to 2010 and 2013.
Ground water depletion data were also extracted from 2002 and 2011 for the months of August and February respectively.
Results and AnalysisThe obtained monthly ground water depletion data were analyzed in Microsoft Excel to study the trend of ground water depletion in the delta areas. Figure 5 shows the trend of the ground water depletion from the scatter plots for the period between 2002 and 2013 in the northern side of the Mississippi Delta. Figure 6 shows the trend of the ground water deple-tion from the scatter plots for the period between 2002 and 2013 in the southern side of the Mississippi Delta. This analysis shows that although the amount of ground water recharge and depletion in each year was different the overall trend indicates ground water depletion in the delta. The trend is similar in both northern and southern parts of the delta.
Conclusions and DiscussionGround water depletion in the Mississippi Delta is one of the most important issues in this region. It would be very useful to have the capability to monitor the ground water level changes all over the delta at regular basis. This study explored the potential of the Gravity Recovery and Climate Experiment (GRACE) Satellite System derived ground water level changes estimation data to study the ground depletion in the Mississippi Delta. The results of the analysis using a 13 year period time series of GRACE Level 3 data indi-cate that GRACE can be used to study and monitor ground water depletion in the Mississippi Delta at regional scale. However, appropriate downscaling technique using in situ microgravity measurements can be useful to make the GRACE data applicable to study ground water depletion in the Mississippi Delta at more local scale. Future research is needed in this direction.
ReferencesBosilovich, M., Radakovich, J.D., and Silva, A.,2007, Skin temperature analysis and bias correction in a coupled landatmosphere data assimilation system. J. Meteor. Soc. Japan, 85A, 99–116.
Groundwater Depletion in the Mississippi Delta as Observed by the GRACE Satellite System Hossain
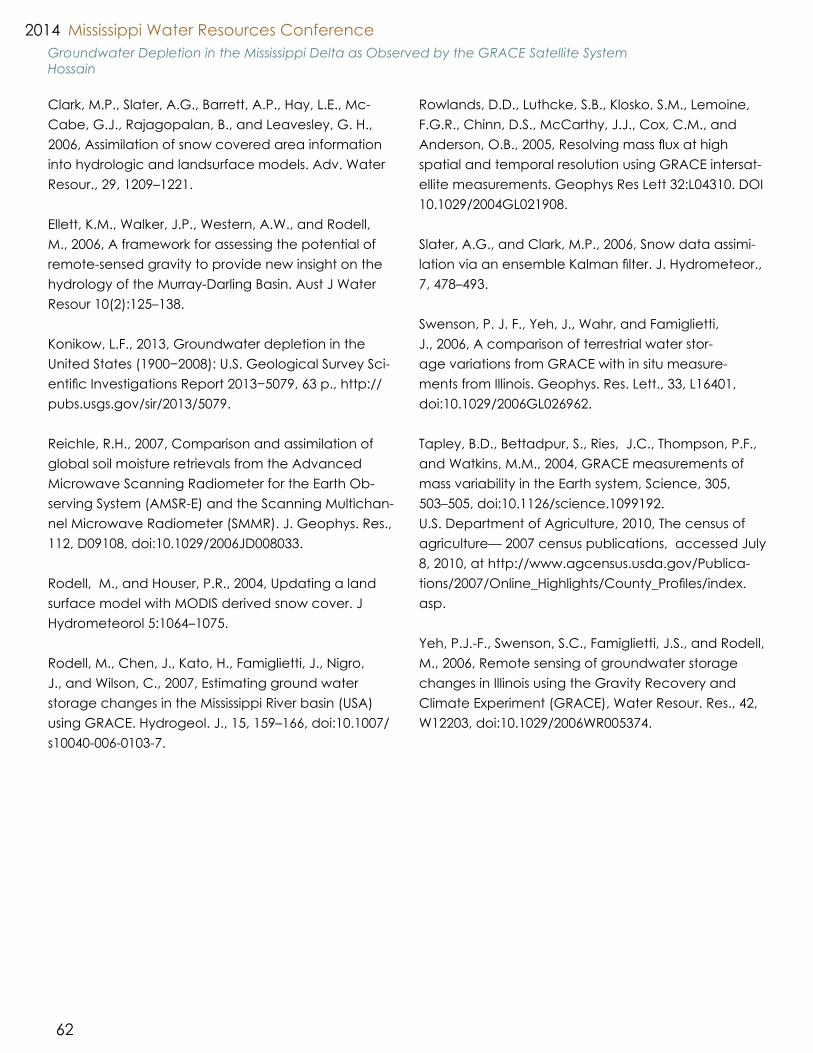
Mississippi Water Resources Conference2014
62
Clark, M.P., Slater, A.G., Barrett, A.P., Hay, L.E., Mc-Cabe, G.J., Rajagopalan, B., and Leavesley, G. H., 2006, Assimilation of snow covered area information into hydrologic and landsurface models. Adv. Water Resour., 29, 1209–1221.
Ellett, K.M., Walker, J.P., Western, A.W., and Rodell, M., 2006, A framework for assessing the potential of remote-sensed gravity to provide new insight on the hydrology of the Murray-Darling Basin. Aust J Water Resour 10(2):125–138.
Konikow, L.F., 2013, Groundwater depletion in the United States (1900−2008): U.S. Geological Survey Sci-entific Investigations Report 2013−5079, 63 p., http://pubs.usgs.gov/sir/2013/5079.
Reichle, R.H., 2007, Comparison and assimilation of global soil moisture retrievals from the Advanced Microwave Scanning Radiometer for the Earth Ob-serving System (AMSR-E) and the Scanning Multichan-nel Microwave Radiometer (SMMR). J. Geophys. Res., 112, D09108, doi:10.1029/2006JD008033.
Rodell, M., and Houser, P.R., 2004, Updating a land surface model with MODIS derived snow cover. J Hydrometeorol 5:1064–1075.
Rodell, M., Chen, J., Kato, H., Famiglietti, J., Nigro, J., and Wilson, C., 2007, Estimating ground water storage changes in the Mississippi River basin (USA) using GRACE. Hydrogeol. J., 15, 159–166, doi:10.1007/s10040-006-0103-7.
Rowlands, D.D., Luthcke, S.B., Klosko, S.M., Lemoine, F.G.R., Chinn, D.S., McCarthy, J.J., Cox, C.M., and Anderson, O.B., 2005, Resolving mass flux at high spatial and temporal resolution using GRACE intersat-ellite measurements. Geophys Res Lett 32:L04310. DOI 10.1029/2004GL021908.
Slater, A.G., and Clark, M.P., 2006, Snow data assimi-lation via an ensemble Kalman filter. J. Hydrometeor., 7, 478–493.
Swenson, P. J. F., Yeh, J., Wahr, and Famiglietti, J., 2006, A comparison of terrestrial water stor-age variations from GRACE with in situ measure-ments from Illinois. Geophys. Res. Lett., 33, L16401, doi:10.1029/2006GL026962.
Tapley, B.D., Bettadpur, S., Ries, J.C., Thompson, P.F., and Watkins, M.M., 2004, GRACE measurements of mass variability in the Earth system, Science, 305, 503–505, doi:10.1126/science.1099192.U.S. Department of Agriculture, 2010, The census of agriculture— 2007 census publications, accessed July 8, 2010, at http://www.agcensus.usda.gov/Publica-tions/2007/Online_Highlights/County_Profiles/index.asp. Yeh, P.J.-F., Swenson, S.C., Famiglietti, J.S., and Rodell, M., 2006, Remote sensing of groundwater storage changes in Illinois using the Gravity Recovery and Climate Experiment (GRACE), Water Resour. Res., 42, W12203, doi:10.1029/2006WR005374.
Groundwater Depletion in the Mississippi Delta as Observed by the GRACE Satellite System Hossain
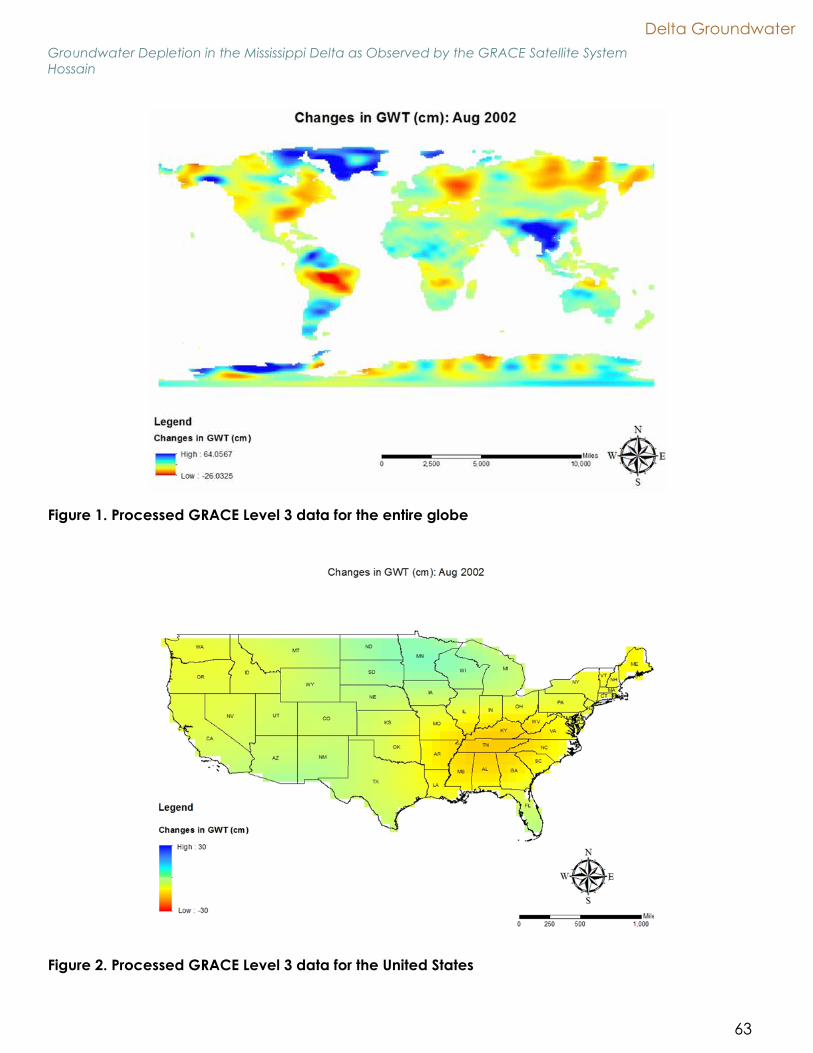
Delta Groundwater
63
Groundwater Depletion in the Mississippi Delta as Observed by the GRACE Satellite System Hossain
Figure 1. Processed GRACE Level 3 data for the entire globe
Figure 2. Processed GRACE Level 3 data for the United States
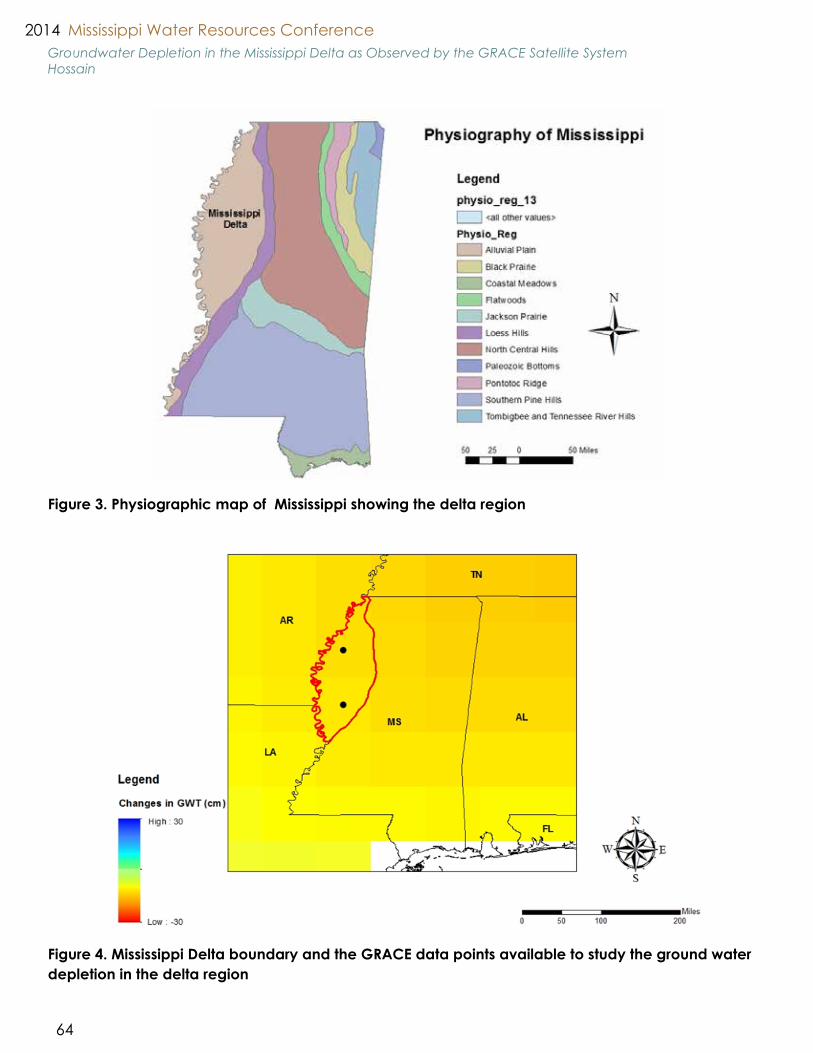
Mississippi Water Resources Conference2014
64
Figure 3. Physiographic map of Mississippi showing the delta region
Figure 4. Mississippi Delta boundary and the GRACE data points available to study the ground water depletion in the delta region
Groundwater Depletion in the Mississippi Delta as Observed by the GRACE Satellite System Hossain
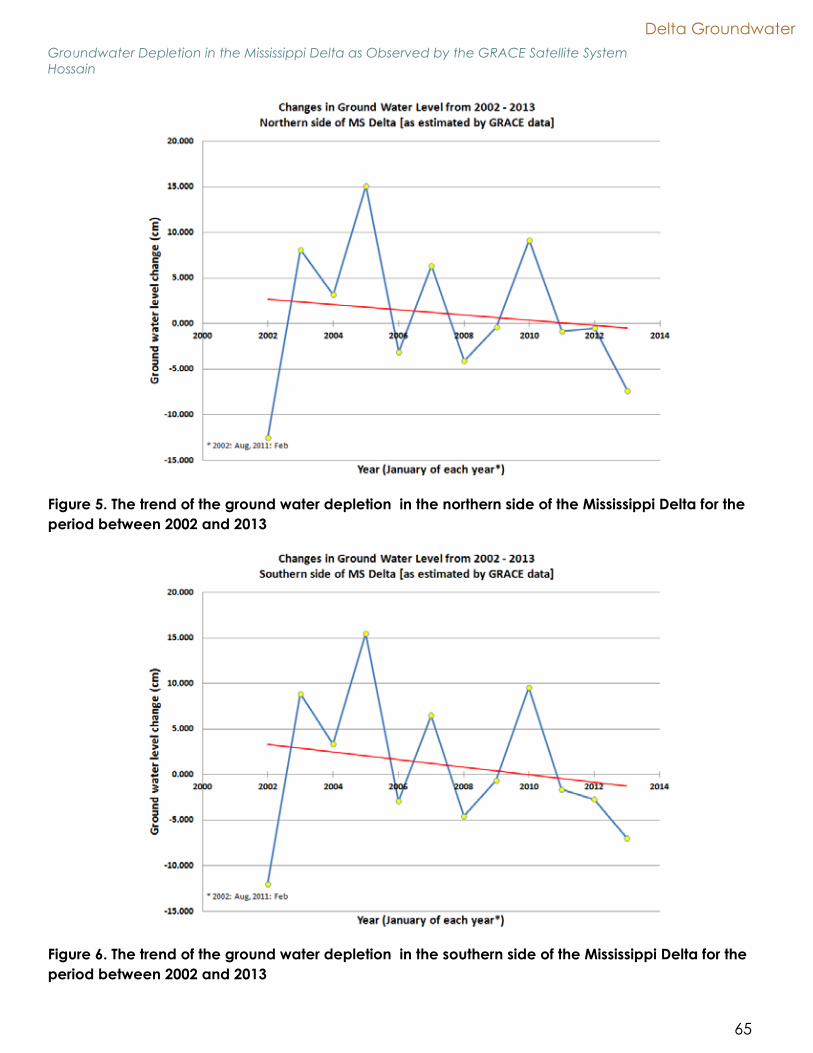
Delta Groundwater
65
Groundwater Depletion in the Mississippi Delta as Observed by the GRACE Satellite System Hossain
Figure 5. The trend of the ground water depletion in the northern side of the Mississippi Delta for the period between 2002 and 2013
Figure 6. The trend of the ground water depletion in the southern side of the Mississippi Delta for the period between 2002 and 2013

Mississippi Water Resources Conference2014
66
Clim
ate
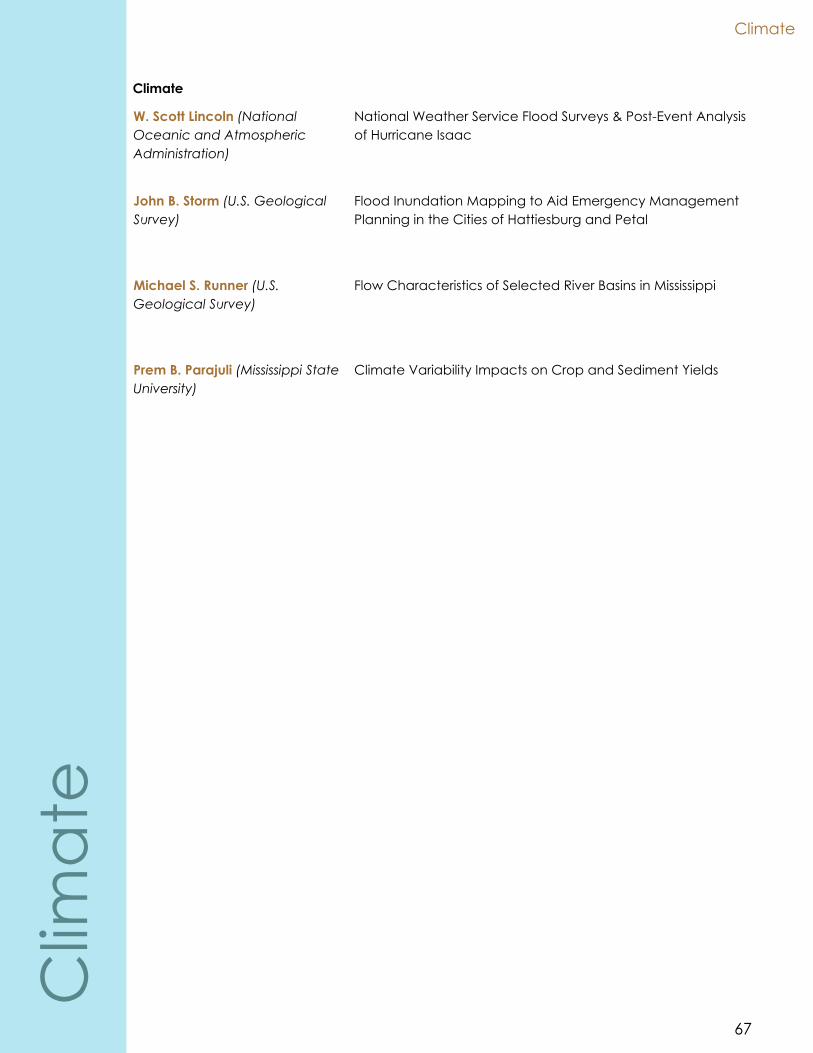
Climate
67
Climate
W. Scott Lincoln (National Oceanic and Atmospheric Administration)
National Weather Service Flood Surveys & Post-Event Analysis of Hurricane Isaac
John B. Storm (U.S. Geological Survey)
Flood Inundation Mapping to Aid Emergency Management Planning in the Cities of Hattiesburg and Petal
Michael S. Runner (U.S. Geological Survey)
Flow Characteristics of Selected River Basins in Mississippi
Prem B. Parajuli (Mississippi State University)
Climate Variability Impacts on Crop and Sediment Yields
Clim
ate
Mississippi Water Resources Conference2014
68
National Weather Service Flood Surveys & Post-Event Analysis of Hurricane Isaac
Lincoln, W. S.
After the substantial impact to the United States East Coast from Hurricane Sandy, Hurricane Isaac may become the forgotten hurricane of 2012. With its above average size and slow forward motion, Isaac produced higher storm surge than typically seen by a storm of its wind category, and also dropped notably heavy rainfall across portions of southeast Louisiana and south Mississippi. Over a four day period from August 28th to August 31st, rainfall totals ranged from 10-15 inches across most of the area, with a few areas seeing more than 20 inches. This significant rainfall caused flooding of numerous rivers in the forecast area of the National Weather Service (NWS) Lower Mississippi River Forecast Center, especially areas within the county warning area of the New Orleans/Baton Rouge Weather Forecast Office. Because of the rare nature of the event, a team composed of NWS staff from multiple offices was assembled to record the impacts, survey flood crests when necessary, and discuss the event with local residents. Post-event flood surveys were conducted over a number of days in early September, 2012, particularly across the Wolf, Tchoutacabouffa, Biloxi, and Escatawpa River watersheds in Mississippi and the Tangipahoa River watershed in Louisiana. A vast amount of observations, anecdotal data, and recommendations were collected by the survey teams and summarized in a report for the River Forecast Center and the Weather Forecast Office. Flooding of numerous locations was of a magnitude seen only on very rare occasions and may have been the worst flooding yet-experienced by numerous long term residents. Luckily, due to the sparse population density in most of the river floodplain areas, impacts were not as severe as would typically be expected. Findings from the post-event flood surveys and analysis of data from numerous sources will be presented to further our understanding of Isaac’s hydrologic impact.
IntroductionHurricane Isaac was a very slow moving tropical sys-tem that affected the central Gulf Coast over several days, starting with outer rain bands arriving on Au-gust 28th, 2012. By August 31st, 2012, the very heavy rainfall in conjunction with storm surge had caused numerous forecast locations to exceed flood stage. The region most impacted by flooding associated with Hurricane Isaac included the forecast areas of National Weather Service (NWS) Weather Forecast Office (WFO) Lake Charles, NWS WFO New Orleans/Baton Rouge, NWS WFO Jackson, and NWS WFO Mobile, and was almost entirely within the hydrologic service area (HSA) of the Lower Mississippi River Fore-cast Center (LMRFC) (Figure 1). By mid-September, flooding associated with Isaac had subsided, leaving behind 16 minor flood stage crests, 5 moderate flood
stage crests, and 12 major flood stage crests; out of these, 3 were new record crests. Recognizing the widespread, significant nature of the flood event, the NWS LMRFC coordinated the creation of flood survey teams to document the impacts and discuss forecast services with our customers and partners. This docu-ment highlights some of the findings of the survey teams and discusses post-event analysis of collected data. The full, detailed technical report based upon the Hurricane Isaac flood surveys can be found on the NWS LMRFC website (http://www.weather.gov/lmrfc).
Track and Forecast OverviewHurricane Isaac became the ninth tropical depres-sion of the 2012 hurricane season about 715 miles east of the Leeward Islands on Tuesday, August 21. By

Climate
69
daybreak Sunday, August 26, the National Hurricane Center (NHC) noted that several computer models showed Isaac turning northward toward the eastern Gulf Coast but later that day the forecast track was shifted westward significantly, with forecasters noting a “Large spread among the more reliable track mod-els” in the midday discussion. As result, a Hurricane Watch was issued for the Louisiana coast and did include metropolitan New Orleans and Lake Pon-tchartrain. On Sunday evening, the center of Isaac was just south of Key West, Florida. NHC highlighted two critical elements: 1) the abnormally large extent of the wind field and 2) the decrease in the forward speed of the storm. The public was advised that over the next 48 hours, tropical storm conditions were expected to reach the northern Gulf by late Mon-day and Hurricane conditions would arrive Tuesday. Initial predictions were 6-12ft of storm surge for areas from Morgan City, LA, to Destin, FL, and total rainfall amounts of 5-10 in with maximum amounts up to 15 in possible along the central and eastern Gulf Coast.
By Monday, August 27, numerical weather models had locked into a landfall along the central portion of the Gulf of Mexico. NHC products continued to highlight the fact that Isaac had an abnormally large wind field and significant storm hazards extended well away from the storm’s center. It was also noted that Isaac would slow in its forward speed and take a turn to the northwest on Tuesday. Isaac eventually be-came a marginal category 1 hurricane near the time of landfall, but remained almost stationary near the Louisiana coastline through the day on Wednesday and Thursday (August 29th and 30th). The forward motion began to increase by Friday (August 31st), with only a few lingering bands of showers affecting southeast Louisiana and southern Mississippi.
Climatologically, heaviest rainfall totals with coastal storms are closely tied to the landfall location and forward speed. The uncertainty with Isaac’s forecast track, forward speed, and ultimate point of land-fall was problematic for quantitative precipitation forecasts, the primary forcing for medium-term river forecasting. Over the course of just two days, forecast
landfall locations ranged from near Panama City, FL, in the east to near the mouth of the Mississippi River, in the west (Figure 2). Final landfall was just to the west of this range.
Post-flood Survey MethodologySurveys of areas impacted by Hurricane Isaac’s flood-producing rainfall were conducted from Wednesday, September 5th, 2012, through Saturday, September 8th, 2012. National Weather Service staff members from several different offices were involved in the survey team, which was composed of:
1. Dr. Suzanne Van Cooten, Hydrologist-in-Charge, NWS Lower Mississippi River Forecast Center
2. Jeffrey Graschel, Service Coordination Hy-drologist, NWS Lower Mississippi River Forecast Center
3. Katelyn Costanza, Senior Hydrologist, NWS Lower Mississippi River Forecast Center
4. W. Scott Lincoln, Hydrologist, NWS Lower Mis-sissippi River Forecast Center
5. David Schlotzhauer, Hydrologist, NWS Lower Mississippi River Forecast Center
6. Jonathan Brazzell, Service Hydrologist, NWS Lake Charles
7. Roger McNeil, Service Hydrologist, NWS Bir-mingham
8. Marty Pope, Service Hydrologist, NWS Jackson
During each day of surveys, individuals were split into different teams (typically 2-4 persons) and sent to the affected areas in Louisiana and Mississippi. The survey team members sought to document evidence of flooding and speak with our partner agencies such as the local emergency management officials. The survey teams also spoke with local residents impact-ed by the flooding to get a feel for how our forecasts were received and note potential issues that should be resolved to improve our services. Post-flood TimelineData gathering and data analysis for Hurricane Isaac took a substantial amount of time to complete. The
National Weather Service Flood Surveys and Post-Event Analysis of Hurricane IsaacLincoln
Mississippi Water Resources Conference2014
70
following is a brief overview survey and analysis activi-ties:
• September 5th-8th, 2012: The National Weath-er Service (NWS) Lower Mississippi River Fore-cast Center (LMRFC) coordinated flood survey teams• Document impacts• Discuss forecast services with customers/
partners• Surveys occurred from September 5th-8th,
2012• September-December, 2012: Survey note
compilation and analysis• Summarizing notes• GIS analysis
• January 2013: Report delivered to New Or-leans Weather Forecast Office (WFO)• Summary compiled into 90+ page report
including 5 appendices• Findings, lessons learned, future action
items• January 2013: New Orleans rain gauge site
visit• June 2013: Finalized coordination of crests
with USGS• September 2013: Collaboration with Sewer-
age and Water Board of New Orleans (SWB-NO)
Flood Survey SummaryMost survey notes were hand written and provided varying detail of observed impacts. This is due to sur-veys being conducted by numerous different persons independently at the same time, each with different opinions of information to include, and each with different handwriting styles. It was decided that the easiest way to compile and visualize this information was to digitize the locations and plot the notes on a map (Figure 3) using the Google Maps editor. The map was shared with everyone who participated in the surveys and allowed for additional information to be added or edited.
It was made apparent that significant flooding had occurred in many areas, with possible record flooding
occurring along the Wolf River in Mississippi. Two river forecast locations without automated gauge infor-mation did not have any gauge readings near the time of crest. It was determined that those locations would need to have crests estimated to maintain the data period of record. The following sections highlight the flooding along the Wolf River and the Tchoutac-abouffa River, where crests had to be estimated.
Wolf RiverFlood surveys for the Wolf River watershed were con-ducted by the NWS teams over a several day period from September 5th to 7th, 2012. A map of the Wolf River watershed is shown in Figure 4.
Widespread bent and snapped trees/brush were observed in the floodplain near the MS26 bridge. The Pearl River County Emergency Manager (EM) indi-cated to the flood survey team that water was over the southbound lanes of I-59 during the peak of the event. Information from the EM office and local me-dia suggested that this flooding was at the Wolf River bridge.
Widespread bent and snapped trees/brush were ob-served in the floodplain near the Silver Run Rd bridge. Evidence of damage was up to about 1.0 ft higher than the bridge deck. Scouring was noted on down-stream side of bridge approach guardrails (Figure 5). Anecdotal evidence from an individual residing at the corner of Silver Run Rd and Oscar Lee Rd suggests that the flood elevation may have exceeded that of any flood since at least 1934.
Flooding of a small camp near the river off of Go Go Rd moved a camper about 100 yards downstream from its original site (identified by what appeared to be a light pole and power hook-ups). The camper was dropped against trees and a pile of damaged brush.
Widespread bent and snapped trees/brush were observed in the floodplain near the McNeill-McHenry Rd bridge. Water appeared to have reached an elevation about 1.0 ft higher than the road at the
National Weather Service Flood Surveys and Post-Event Analysis of Hurricane IsaacLincoln

Climate
71
bridge approaches. The bridge itself was an arch design, thus the higher middle portion of the bridge did not flood. Large branches and other tree debris were noted on top of the bridge support pilings of the upstream side.
Widespread bent and snapped trees/brush were ob-served in the small floodplain near the Crane Creek bridge on Crane Creek Rd. Mud marks and debris suggested that flash flooding reached an elevation 1.0-3.0 ft over the bridge deck.
Widespread bent trees/brush were observed in the floodplain near the US53 bridge. Evidence suggested that water reached within 1.0-3.0 ft of the bridge deck and did not inundate the road.
Widespread bent trees/brush were observed in the floodplain near the Cable Bridge Rd bridge (Figure 6). Evidence suggested that water reached within 1.0-3.0 ft of the bridge deck and did not inundate the road.
Information from Harrison County Emergency Man-agement Office indicated that the water elevation was very near the elevation of I-10 near the bridge. Evidence from the survey suggested that water may have reached the shoulder of the bridge approach-es, but did not inundate the road or bridge deck (Figure 7).
Widespread bent brush and trees were observed in the floodplain covering a width roughly 0.5-1.0 miles along Bells Ferry Rd. Mud marks were noted several feet above the road level throughout this stretch, reaching heights of 3.0-4.0 ft in places. Numerous properties were affected near the gauge location, especially along Magnolia Dr and Tucker Rd where some homes received water damage. Magnolia Rd appeared to have been under several feet of mov-ing water, especially away from intersection with Bells Ferry Rd, and drifts of sand 1.0-2.0 ft high lined the road in places.
Numerous residents were interviewed by the survey
team along this river reach, along both Magnolia Dr. and Tucker Rd. A resident with a clear high water mark in a garage at the corner of Magnolia and Bells Ferry gave permission for the team to survey the mark to the staff gauge (Figure 8). Resident directly across the street indicated location of high water on his home, which was used for QC. Other residents provided comparisons of this event to the crest from the 1995 event.
USGS staff also collected high water marks in the area of Bells Ferry Rd during the post-storm flooding associ-ated with Hurricane Isaac (K. Van Wilson, personal communication, Sep 2012 and June 2013). Estimated elevations from the NWS survey, the USGS survey, and anecdotal information from local residence is illus-trated by Figure 9. Tchoutacabouffa RiverA flood survey for the lower Tchoutacabouffa River watershed area was conducted by the NWS teams on September 6th, 2012. The survey was focused on the area around the Harrison County manual staff gauge on Lamey Bridge (Figure 10).
Some bent brush and trees were observed on the point bar of a large meander bend at Lamey Bridge Rd crossing of Tchoutacabouffa. New apartments and condos built very near the cut bank of the me-ander bend experienced small slides from scouring in their back yards, which workers were attempting to fill with dirt during the time of the surveys. Another area was surveyed just off of Lamey Bridge Rd. along Tuxachanie Creek just upstream of the confluence with the Tchoutacabouffa. No damage or evidence of water was noted along Longwood Circle. Just up-stream, some evidence of water was noted along the lower portions of H Street, with evidence that some homes may have taken water damage.
The survey team interviewed one resident of the Riv-erbend Cove Apartment complex who stayed during most of the event. The resident showed the survey team where water had crested (Figure 11). He also indicated that at the crest, water was just below the
National Weather Service Flood Surveys and Post-Event Analysis of Hurricane IsaacLincoln
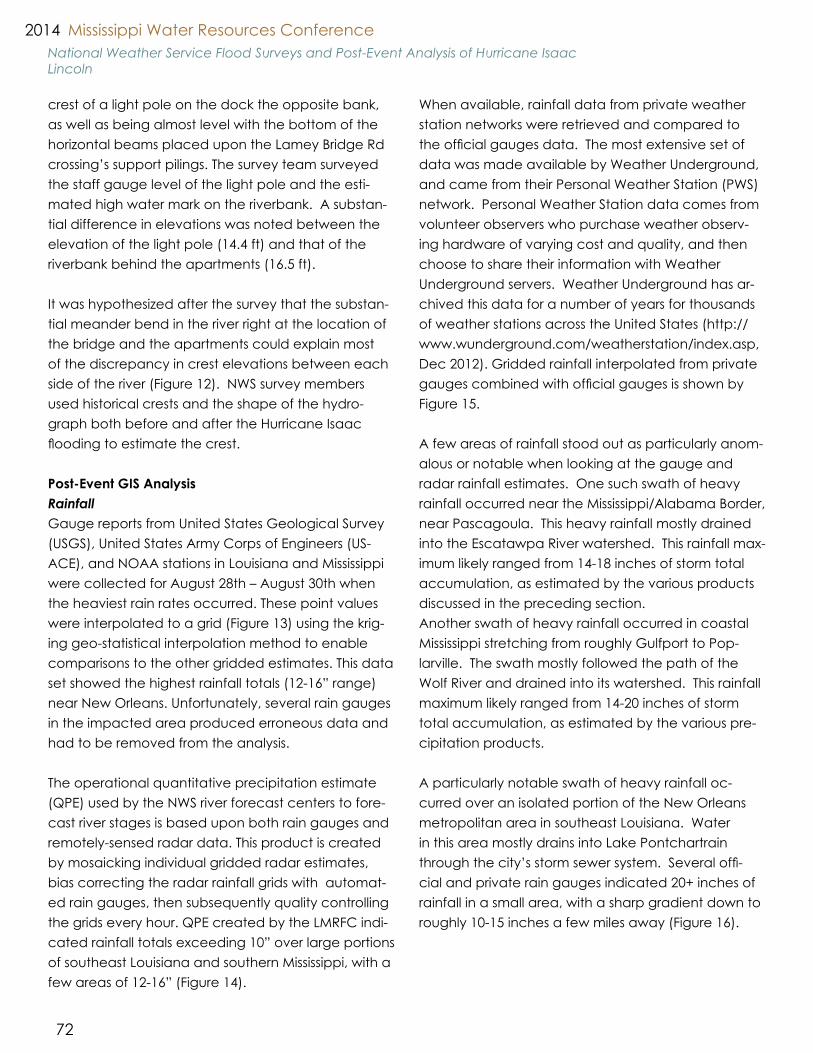
Mississippi Water Resources Conference2014
72
crest of a light pole on the dock the opposite bank, as well as being almost level with the bottom of the horizontal beams placed upon the Lamey Bridge Rd crossing’s support pilings. The survey team surveyed the staff gauge level of the light pole and the esti-mated high water mark on the riverbank. A substan-tial difference in elevations was noted between the elevation of the light pole (14.4 ft) and that of the riverbank behind the apartments (16.5 ft).
It was hypothesized after the survey that the substan-tial meander bend in the river right at the location of the bridge and the apartments could explain most of the discrepancy in crest elevations between each side of the river (Figure 12). NWS survey members used historical crests and the shape of the hydro-graph both before and after the Hurricane Isaac flooding to estimate the crest.
Post-Event GIS AnalysisRainfallGauge reports from United States Geological Survey (USGS), United States Army Corps of Engineers (US-ACE), and NOAA stations in Louisiana and Mississippi were collected for August 28th – August 30th when the heaviest rain rates occurred. These point values were interpolated to a grid (Figure 13) using the krig-ing geo-statistical interpolation method to enable comparisons to the other gridded estimates. This data set showed the highest rainfall totals (12-16” range) near New Orleans. Unfortunately, several rain gauges in the impacted area produced erroneous data and had to be removed from the analysis.
The operational quantitative precipitation estimate (QPE) used by the NWS river forecast centers to fore-cast river stages is based upon both rain gauges and remotely-sensed radar data. This product is created by mosaicking individual gridded radar estimates, bias correcting the radar rainfall grids with automat-ed rain gauges, then subsequently quality controlling the grids every hour. QPE created by the LMRFC indi-cated rainfall totals exceeding 10” over large portions of southeast Louisiana and southern Mississippi, with a few areas of 12-16” (Figure 14).
When available, rainfall data from private weather station networks were retrieved and compared to the official gauges data. The most extensive set of data was made available by Weather Underground, and came from their Personal Weather Station (PWS) network. Personal Weather Station data comes from volunteer observers who purchase weather observ-ing hardware of varying cost and quality, and then choose to share their information with Weather Underground servers. Weather Underground has ar-chived this data for a number of years for thousands of weather stations across the United States (http://www.wunderground.com/weatherstation/index.asp, Dec 2012). Gridded rainfall interpolated from private gauges combined with official gauges is shown by Figure 15.
A few areas of rainfall stood out as particularly anom-alous or notable when looking at the gauge and radar rainfall estimates. One such swath of heavy rainfall occurred near the Mississippi/Alabama Border, near Pascagoula. This heavy rainfall mostly drained into the Escatawpa River watershed. This rainfall max-imum likely ranged from 14-18 inches of storm total accumulation, as estimated by the various products discussed in the preceding section.Another swath of heavy rainfall occurred in coastal Mississippi stretching from roughly Gulfport to Pop-larville. The swath mostly followed the path of the Wolf River and drained into its watershed. This rainfall maximum likely ranged from 14-20 inches of storm total accumulation, as estimated by the various pre-cipitation products.
A particularly notable swath of heavy rainfall oc-curred over an isolated portion of the New Orleans metropolitan area in southeast Louisiana. Water in this area mostly drains into Lake Pontchartrain through the city’s storm sewer system. Several offi-cial and private rain gauges indicated 20+ inches of rainfall in a small area, with a sharp gradient down to roughly 10-15 inches a few miles away (Figure 16).
National Weather Service Flood Surveys and Post-Event Analysis of Hurricane IsaacLincoln
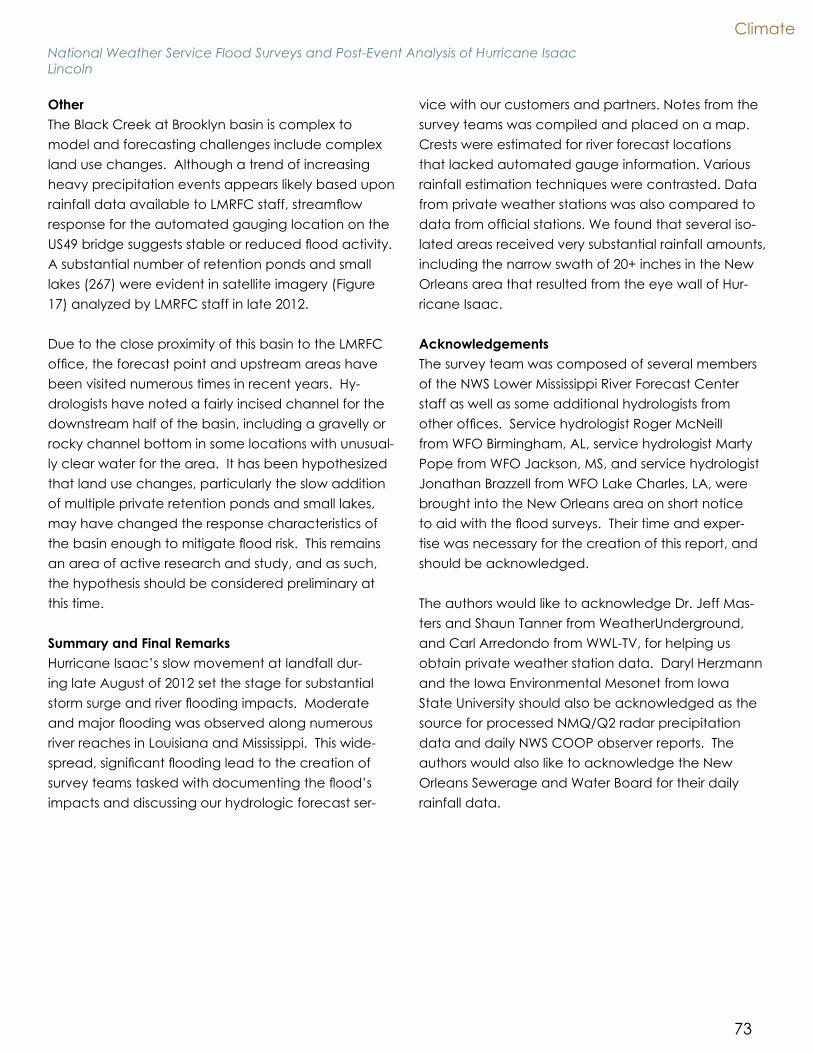
Climate
73
OtherThe Black Creek at Brooklyn basin is complex to model and forecasting challenges include complex land use changes. Although a trend of increasing heavy precipitation events appears likely based upon rainfall data available to LMRFC staff, streamflow response for the automated gauging location on the US49 bridge suggests stable or reduced flood activity. A substantial number of retention ponds and small lakes (267) were evident in satellite imagery (Figure 17) analyzed by LMRFC staff in late 2012.
Due to the close proximity of this basin to the LMRFC office, the forecast point and upstream areas have been visited numerous times in recent years. Hy-drologists have noted a fairly incised channel for the downstream half of the basin, including a gravelly or rocky channel bottom in some locations with unusual-ly clear water for the area. It has been hypothesized that land use changes, particularly the slow addition of multiple private retention ponds and small lakes, may have changed the response characteristics of the basin enough to mitigate flood risk. This remains an area of active research and study, and as such, the hypothesis should be considered preliminary at this time. Summary and Final RemarksHurricane Isaac’s slow movement at landfall dur-ing late August of 2012 set the stage for substantial storm surge and river flooding impacts. Moderate and major flooding was observed along numerous river reaches in Louisiana and Mississippi. This wide-spread, significant flooding lead to the creation of survey teams tasked with documenting the flood’s impacts and discussing our hydrologic forecast ser-
vice with our customers and partners. Notes from the survey teams was compiled and placed on a map. Crests were estimated for river forecast locations that lacked automated gauge information. Various rainfall estimation techniques were contrasted. Data from private weather stations was also compared to data from official stations. We found that several iso-lated areas received very substantial rainfall amounts, including the narrow swath of 20+ inches in the New Orleans area that resulted from the eye wall of Hur-ricane Isaac.
AcknowledgementsThe survey team was composed of several members of the NWS Lower Mississippi River Forecast Center staff as well as some additional hydrologists from other offices. Service hydrologist Roger McNeill from WFO Birmingham, AL, service hydrologist Marty Pope from WFO Jackson, MS, and service hydrologist Jonathan Brazzell from WFO Lake Charles, LA, were brought into the New Orleans area on short notice to aid with the flood surveys. Their time and exper-tise was necessary for the creation of this report, and should be acknowledged.
The authors would like to acknowledge Dr. Jeff Mas-ters and Shaun Tanner from WeatherUnderground, and Carl Arredondo from WWL-TV, for helping us obtain private weather station data. Daryl Herzmann and the Iowa Environmental Mesonet from Iowa State University should also be acknowledged as the source for processed NMQ/Q2 radar precipitation data and daily NWS COOP observer reports. The authors would also like to acknowledge the New Orleans Sewerage and Water Board for their daily rainfall data.
National Weather Service Flood Surveys and Post-Event Analysis of Hurricane IsaacLincoln

Mississippi Water Resources Conference2014
74
National Weather Service Flood Surveys and Post-Event Analysis of Hurricane IsaacLincoln
Figure 1. Map of central Gulf Coast region, with the LMRFC forecast area shaded in gray and individual NWS WFO hydrologic service areas (HSAs) delineated in red. The area of significant flooding from Hurricane Isaac - determined by locations climbing above the 90th percentile of streamflow by the USGS – is circled in blue.
Figure 2. Five day track forecasts issued by the National Hurricane Center with the preliminary best track for Hurricane Isaac.
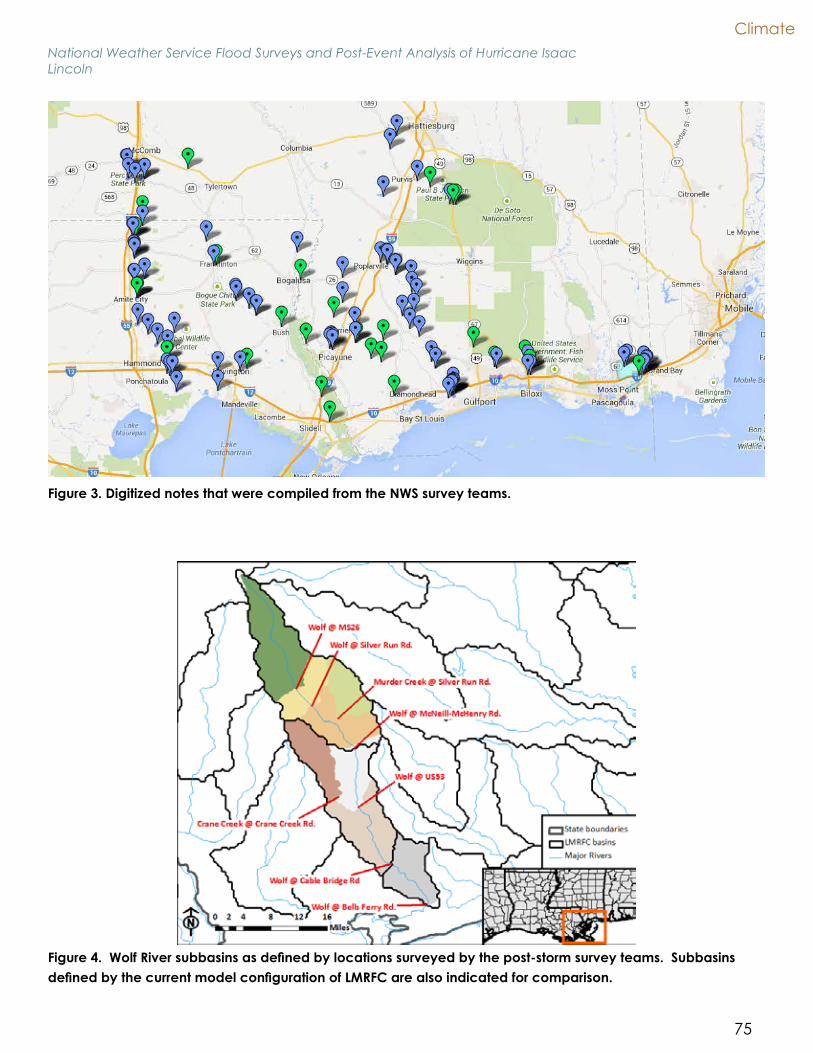
Climate
75
National Weather Service Flood Surveys and Post-Event Analysis of Hurricane IsaacLincoln
Figure 3. Digitized notes that were compiled from the NWS survey teams.
Figure 4. Wolf River subbasins as defined by locations surveyed by the post-storm survey teams. Subbasins defined by the current model configuration of LMRFC are also indicated for comparison.

Mississippi Water Resources Conference2014
76
National Weather Service Flood Surveys and Post-Event Analysis of Hurricane IsaacLincoln
Figure 5. Guardrails on downstream side of the Silver Run Rd. bridge showing evidence of scouring.
Figure 6. Downstream view from Cable Bridge Rd. Widespread damage to trees and brush were noted.
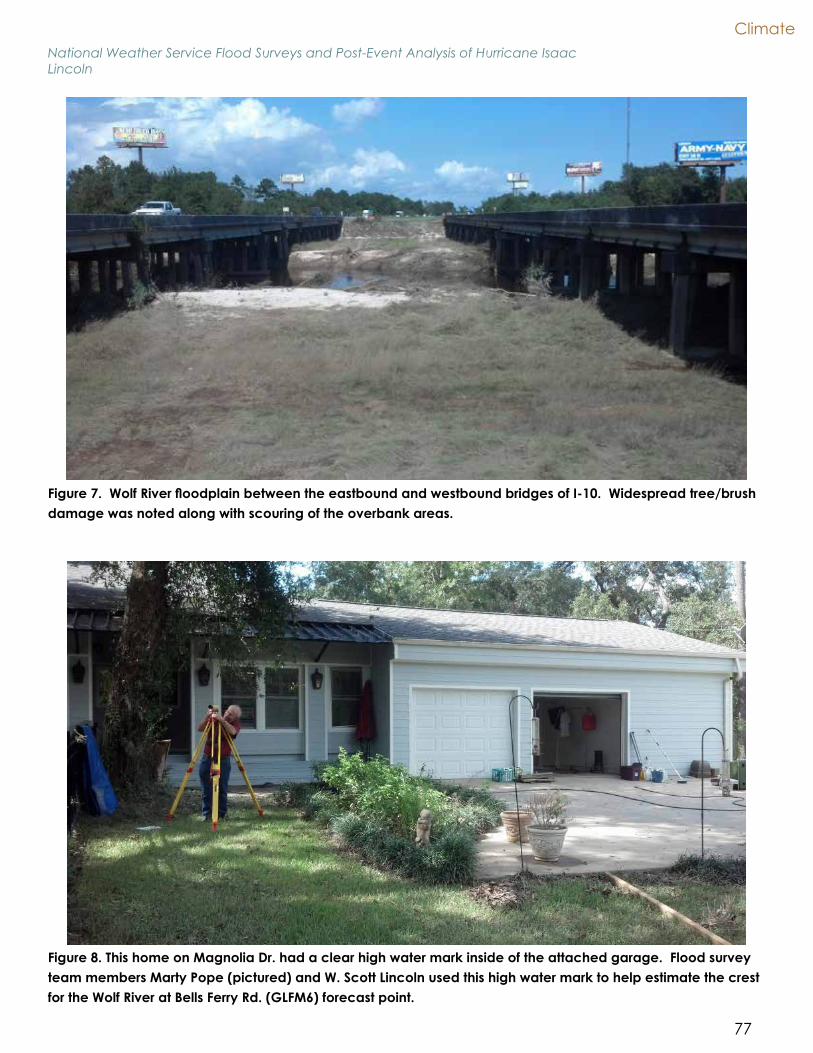
Climate
77
National Weather Service Flood Surveys and Post-Event Analysis of Hurricane IsaacLincoln
Figure 7. Wolf River floodplain between the eastbound and westbound bridges of I-10. Widespread tree/brush damage was noted along with scouring of the overbank areas.
Figure 8. This home on Magnolia Dr. had a clear high water mark inside of the attached garage. Flood survey team members Marty Pope (pictured) and W. Scott Lincoln used this high water mark to help estimate the crest for the Wolf River at Bells Ferry Rd. (GLFM6) forecast point.

Mississippi Water Resources Conference2014
78
National Weather Service Flood Surveys and Post-Event Analysis of Hurricane IsaacLincoln
Figure 9. High water marks near the Wolf River at Bells Ferry Rd (GLFM6) gauge color-coded by confidence lev-el. High water marks were adjusted to NAVD88 based upon the assumed staff gauge datum of -1.0 ft NAVD88.
Figure 10. Biloxi River subbasins as defined by locations surveyed by the post-storm survey teams. Subbasins defined by the current model configuration of LMRFC are also indicated for comparison.
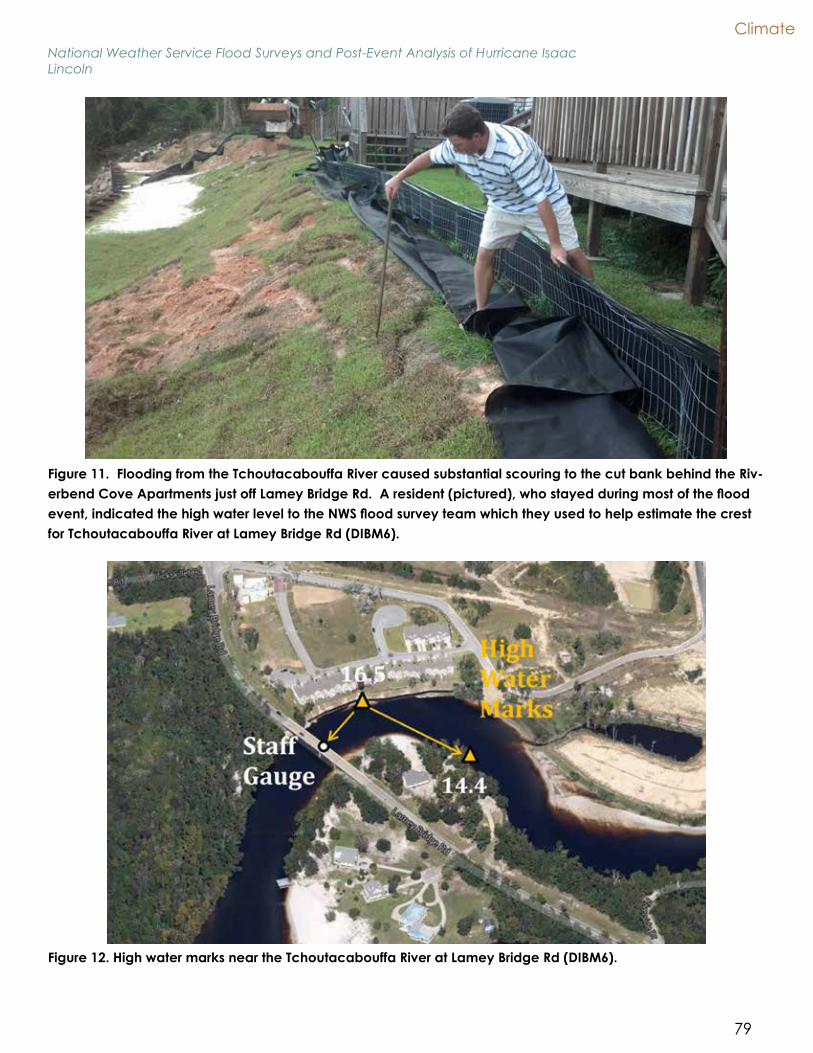
Climate
79
National Weather Service Flood Surveys and Post-Event Analysis of Hurricane IsaacLincoln
Figure 11. Flooding from the Tchoutacabouffa River caused substantial scouring to the cut bank behind the Riv-erbend Cove Apartments just off Lamey Bridge Rd. A resident (pictured), who stayed during most of the flood event, indicated the high water level to the NWS flood survey team which they used to help estimate the crest for Tchoutacabouffa River at Lamey Bridge Rd (DIBM6).
Figure 12. High water marks near the Tchoutacabouffa River at Lamey Bridge Rd (DIBM6).
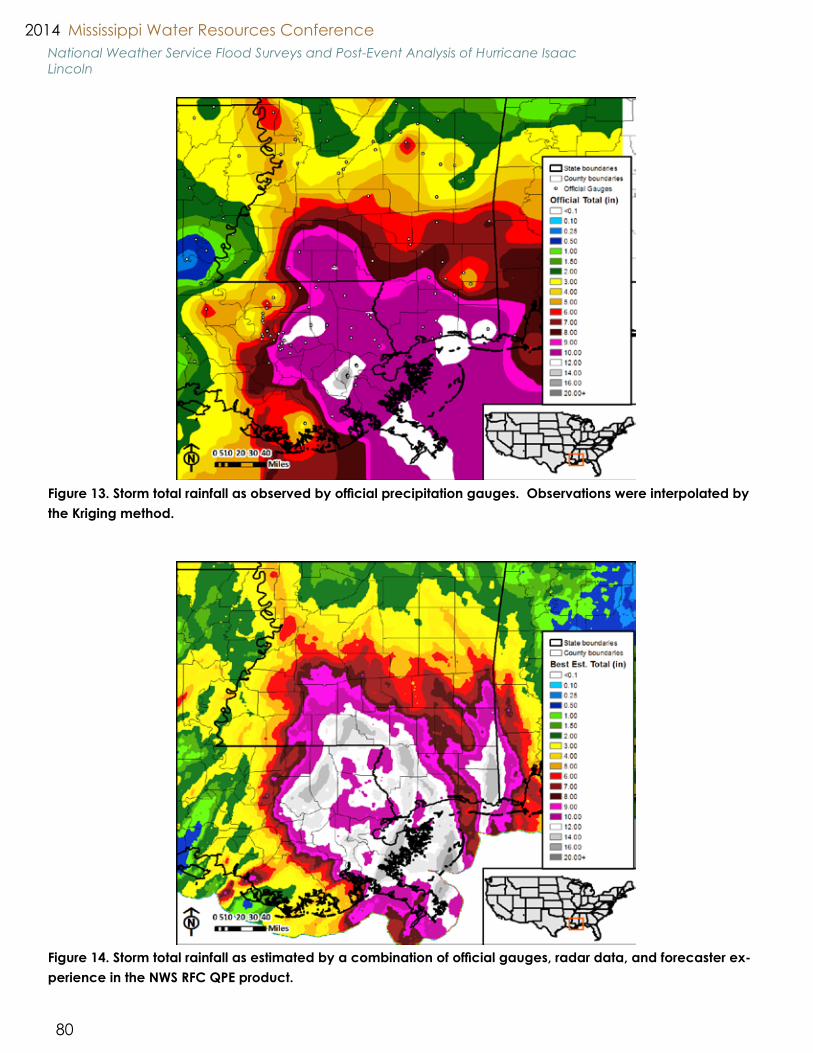
Mississippi Water Resources Conference2014
80
National Weather Service Flood Surveys and Post-Event Analysis of Hurricane IsaacLincoln
Figure 13. Storm total rainfall as observed by official precipitation gauges. Observations were interpolated by the Kriging method.
Figure 14. Storm total rainfall as estimated by a combination of official gauges, radar data, and forecaster ex-perience in the NWS RFC QPE product.

Climate
81
National Weather Service Flood Surveys and Post-Event Analysis of Hurricane IsaacLincoln
Figure 15. Storm total rainfall as estimated from a combination of official and QCed private weather stations. Observations were interpolated by the Kriging method.
Figure 16. Storm total rainfall reported from all official and private gauges in the New Orleans area during Hur-ricane Isaac. Contours were produced from a Kriging interpolation of all official and private gauges. Note the particularly high values evident along the Mississippi River from roughly Gretna to Audubon Park.
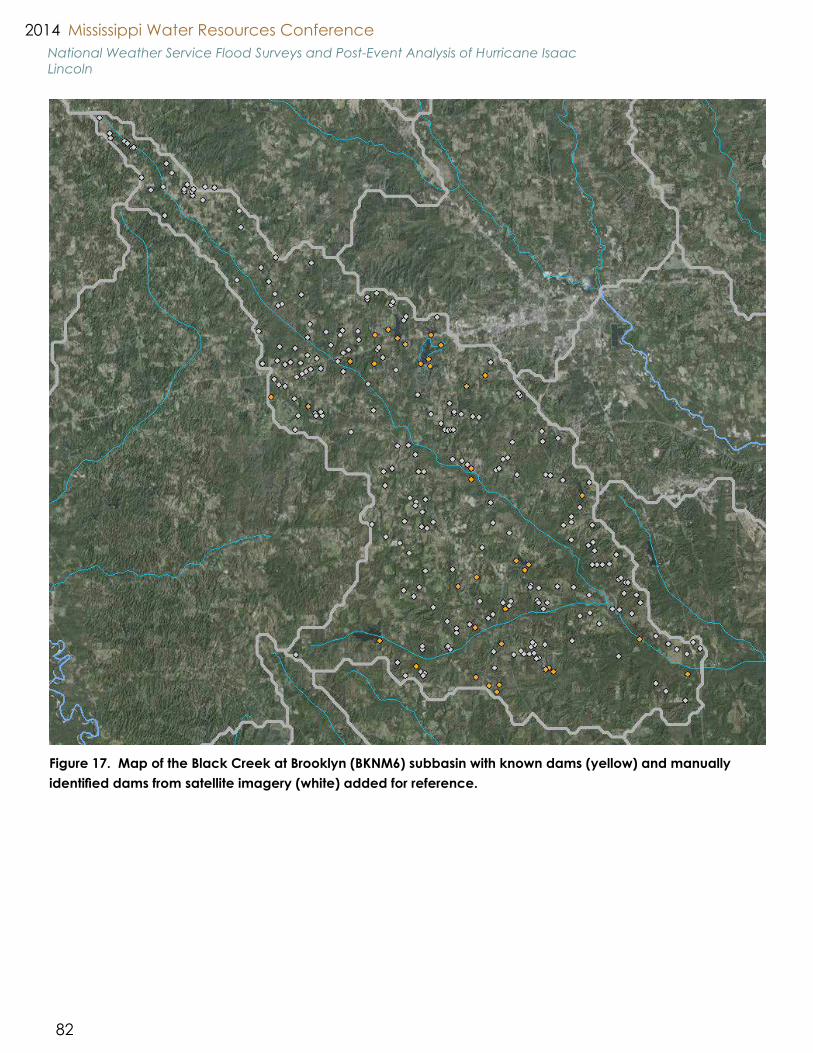
Mississippi Water Resources Conference2014
82
National Weather Service Flood Surveys and Post-Event Analysis of Hurricane IsaacLincoln
Figure 17. Map of the Black Creek at Brooklyn (BKNM6) subbasin with known dams (yellow) and manually identified dams from satellite imagery (white) added for reference.
Climate
83
Flood Inundation Mapping to Aid Emergency Management Planning in the Cities of
Hattiesburg and Petal Storm, J.
Many cities throughout Mississippi are located on or near major rivers or streams. As a result, residential, commercial, and industrial areas, as well as transportation structures can be at risk when flooding occurs. The cities of Hattiesburg and Petal are located along the Leaf River and have experienced flooding in the past including major events in 1961, 1974, and 1983. The largest recorded flood event occurred on April 15, 1974 and affected approximately 6,000 people and caused damages in excess of $8.3 million (1974 value unadjusted for inflation). The U.S. Geological Survey (USGS), in cooperation with the Cities of Hattiesburg and Petal, Forrest County, Mississippi Emergency Management Agency, Mississippi Department of Homeland Security, and the Emergency Management District, has developed a series of flood inundation maps at 1-foot increments ranging in stage from bank-full (22.0 ft) to approximately the peak of record flood (34.0 ft) for a 6.8 mile reach of the Leaf River through the cities. A one-dimensional steady-flow model was calibrated with the stage/discharge relationship at the USGS stream gaging station 02473000 Leaf River at Hattiesburg, MS (http://waterdata.usgs.gov/ms/nwis/uv/?site_no=02473000&PARAmeter_cd=00065,00060), and flood profile information obtained following the 1974 event. The model results were coupled with land surface elevation data from Light Detection and Ranging (LiDAR) surveys and GIS to produce inundation maps depicting the areal extent of flooding in Hattiesburg and Petal at pre-defined river stages. The inundation maps are available to the public through a web based interactive mapper that allows the user to select the river stage and then display the corresponding inundation map. Estimated water depths are shown by clicking anywhere within the inundated area on the map. Emergency management personnel will be able to use the inundation maps to manage and plan a course of action for future floods by pre-determining affected residences, businesses, municipalities, and roadways at forecasted National Weather Service (NWS) flood levels. Citizens will be able to visually determine what affect there may be to their property or business and take appropriate action ahead of time. The maps are available to the public through the USGS and from the NWS at the following links: http://wim.usgs.gov/FIMI/ http://water.weather.gov/ahps/inundation.php
Mississippi Water Resources Conference2014
84
Flow Characteristics of Selected River Basins in Mississippi
Runner, M.
The U.S. Geological Survey has been collecting stage and flow data at select locations in Mississippi for more than 100 years. The first data collection station was built on the Tombigbee River at Columbus in 1895. Currently, continuous flow data are collected at more than 70 locations and instantaneous peak flow data at an addi-tional 95. Stage and flow data have many uses and serve a variety of purposes filling a valuable need for both governmental agencies, academic institutions, and the general public at large.
There are many benefits to a stable streamgaging program including resource management, flood operations of structures, and flood forecasting. Most of these benefits are derived from access to current flow data, but there are benefits from long-term data sets that are not as readily apparent. One of these is the ability to use these data to detect trends in flow characteristics over time.
This report presents statistical summaries for data sets of select gages near the mouth of major river basins in Mississippi. Data for the Tombigbee, Chickasawhay, Leaf, Pascagoula, Yazoo, Big Black, and other select rivers are presented.
Climate
85
Climate Variability Impacts on Crop and Sediment Yields
Parajuli, P., Jayakody, P., Sassenrath, G.
This study evaluated future climate variability impact on stream flow, crop and sediment yields under three different tillage systems in the Big Sunflower River Watershed (BSRW) in Mississippi. The Soil and Water Assessment Tool (SWAT) was applied to the BSRW using observed stream flow and crop yields data. The model was successfully calibrated and validated and future climate scenarios were simulated. Results showed that there is no significant difference (p > 0.05) between average corn and soybean yields under simulated tillage systems in the BSRW. However, results determined a significant difference on sediment yields from three simulated tillage systems (p values of 0.002 for corn, and 0.003 for soybean). The model simulated results showed that future average maximum temperature may increase and experience a longer summer periods with frequent extreme rainfall events but similar monthly precipitation patterns.

Mississippi Water Resources Conference2014
86
Wet
land
s
Wetlands
87
Wetlands
Ying Ouyang (Mississippi State University)
A STELLA Model for Estimating Phosphorus Removal from Wastewater in a Vertical-Flow Constructed Wetland System
Chayan Lahiri (University of Mississippi)
Water Depth In An Oxbow Lake-Wetland And Its Influence On Soil Chemistry, Cypress Tree Growth, and Groundwater Recharge
James Cizdziel (University of Mississippi)
Distribution and Cycling of Mercury Species in Wetlands and Reservoirs in Northern Mississippi
Wet
land
s
Mississippi Water Resources Conference2014
88
A STELLA model for estimating phosphorus removal from wastewater in a vertical-flow
constructed wetland systemOuyang, Y.
Elevated phosphorus (P) in surface waters can cause eutrophication of aquatic ecosystems and can impair water for drinking, industry, agriculture, and recreation. Vertical flow constructed wetland (VFCW) can purify P contaminated wastewaters before they discharge into streams and rivers. The goal of this study is to develop a model for predicting the fate, transport, and removal of P from wastewaters in a VFCW using the commercial available STELLA (Structural Thinking, Experiential Learning Laboratory with Animation) software. The VFCW used in this study consists of soil and plant species with variably saturation conditions such as wetting (ponding) and drying (draining) cycles. The water movement through the soil, xylem, and surrounding atmosphere in the VFCW system is calculated using water potential theory, whereas the fate and transport mechanisms of P used in this model include: (1) application of wastewater (containing P) to the VFCW; (2) adsorption of P in the soil; (3) uptake of P by plant roots, (4) mineralization of organic P; and (5) leaching of soluble P. Additionally, the surficial processes such as rainfall and evapotranspiration are included in the model. The resulted model is calibrated and validated with experimental data prior to its applications. A simulation scenario is then performed to estimate P removal from a domestic wastewater in the VFCW system under varying hydraulic retention times. Simulation results will be presented and discussed.
Wetlands
89
Water Depth In An Oxbow Lake-Wetland And Its Influence On Soil Chemistry, Cypress Tree
Growth, And Groundwater RechargeLahiri, C., Davidson, G., Threlkeld, S.
Sky Lake, MS, is an oxbow lake-wetland that was once part of the ancestral Ohio-Mississippi River system. It hosts some of the largest and oldest cypress trees in the state, with several trees exceeding 40 ft in circumference. An elevated boardwalk recently built into the heart of the wetland now allows unique access to the public and has provided a platform for mounting experimental equipment to monitor several environmental param-eters pertinent to managing wetlands and water resources. An ongoing study along the boardwalk is currently monitoring changes in water level, water and soil chemistry (pH, Eh, DO, conductivity, temperature), and atmospheric parameters (precipitation, temperature, relative humidity), and relating the data to tree growth (sap flow rates, trunk expansion) and to changes in groundwater level in a monitoring well located inside the meander loop. Preliminary data indicate that both the flow and chemistry of water within the root zone is highly variable over short distances, likely caused by physical heterogeneity created by fallen and buried tree limbs in various stages of decomposition. Substantial changes in soil zone Eh, an indicator of the redox potential that can influence nutrient uptake by plant roots, were observed over time with no significant correlation between measurement locations. This means that single measurements of soil chemistry at point locations in this wetland environment are not necessarily representative of the conditions for the system as a whole. Measurements at multiple locations are required to adequately assess the chemical conditions that contribute to the health of wetland flora. Groundwater levels measured in the monitoring well rose and fell over a several month period corresponding to high and low water levels in the wetland, respectively, suggesting a possible surface-ground-water connection. Digital cameras set up with dendrometer bands are allowing collection of daily changes in the circumference of four different trees that will allow correlation with sap flow and the monitored environ-mental variables.
Mississippi Water Resources Conference2014
90
Distribution and Cycling of Mercury Species in Wetlands and Reservoirs in Northern Mississippi
Cizdziel, J., Brown, G.
Methylmercury (MeHg) is a neurotoxin that accumulates in tissues and biomagnifies up the aquatic food chain. Fish consumption advisories have been issued Enid Lake and the Yocona River, a large reservoir and its tributary in north-central Mississippi. This study examined the origin, distribution, and cycling of mercury species in the Yocona River, Enid Lake and associated wetlands. Environmental conditions can have a dramatic impact on the production, transport and fate of Hg species in a given area. Wetlands play a critical role in the cycling of Hg in watersheds and have been shown to be net sources of MeHg to ecosystems. Total-Hg and MeHg were determined seasonally over the course of two years in the inflow and outflow of Enid and Sardis Lakes, in associated wetlands. The Hg species were also measured during storm events (i.e., in runoff from urban, agricultural, and wetland/forest areas). A range of water quality parameters were measured to determine the primary factors controlling the distribution and transport of Hg species in the watershed. The project served as an important step toward building a mass balance for mercury in Enid Lake. Key findings include: • Wetland areas were determined to be hotspots for MeHg in the watershed with relatively high concentrations in water and fish • Levels of Hg in river water were highest at peak flows during storm events. • Forest soil and wetland sediment had higher levels of Hg and organic matter than agriculture soils. • Hg levels were highest in the urban runoff, followed by forest/wetland, and agriculture. • Runoff from highly erodible agricultural areas likely provides the largest input of Hg to Enid Lake by transport of particle-bound-Hg. • MeHg in wetland water was about double that found in lake water, and both spiked during the summer months, with wetlands reaching as high as 1.3 ng/L. • MeHg in the wetland water was negatively correlated with oxidizing reducing potential. • The net flux of T-Hg in Enid Lake was the most negative in the winter due to lowering of lake water levels to accommodate spring rains, and most positive during storm events, suggesting that rain storm events contribute a significant portion of Hg to the lakes. • The net flux of MeHg in Enid Lake was more negative in the summer than fall and spring due to higher methylation and evaporation rates.
Nut
rient
s and
Mod
elin
g

Nutrients and Modeling
91
Nutrients and Modeling
Xiaobo Chao (University of Mississippi)
Numerical Modeling of Flow and Mercury Distribution in Enid Lake, Mississippi
John J. Ramirez- Avila (Mississippi State University)
Refinement and Regionalization of Phosphorus Assessment Tools in Mississippi
Alina Young (Mississippi Department of Environmental Quality)
Developing Numeric Nutrient Criteria For Mississippi
Nut
rient
s and
Mod
elin
g
Mississippi Water Resources Conference2014
92
Numerical Modeling of Flow and Mercury Distribution in Enid Lake, Mississippi
Chao, X., Hossain, A., Cizdziel, J., Jia, Y.
The Yazoo River Basin is the largest basin in Mississippi. Four large flood control reservoirs: Arkabutla Lake, Sardis Lake, Enid Lake and Grenada Lake, are located in this region, providing significant natural and recreational resources. The soils in this region are highly erodible, resulting in a large amount of sediment discharged into the water bodies. Sediments are normally associated with many pollutants and greatly affect water quality and aquatic lives. Mercury concentrations in water, sediment and fish in Enid Lake are relatively high, and a fish consumption advisory was issued by Mississippi Department of Environmental Quality (MDEQ) in 1995. In this study, a numerical model was developed based on CCHE3D, a three-dimensional free surface hydrodynamic, sediment and water quality model to simulate the flow, sediment and mercury distributions in Enid Lake. Total mercury in water and sediment were simulated, and the major processes, including advection, diffusion, adsorption/desorption, bed release, atmosphere deposition, settling, etc., were considered in the model. This model was calibrated and validated using field measurements and remote sensing data. This model provides useful tools for understanding the fate and transport of mercury in natural lakes.
Nutrients and Modeling
93
Refinement and regionalization of phosphorus assessment tools in Mississippi
Ramirez-Avila, J., Oldham, J., Ortega-Achury, S., Osmond, D., Martin, J., Locke, M., Read, J.
Phosphorus is a major nonpoint source pollutant that causes eutrophication in surface waters. Phosphorus (P) Indices are applied assessment tools used to identify agricultural fields most vulnerable to P loss by accounting for major source and transport factors controlling P movement. There is a wide range in formulation and man-agement recommendations of P Indices among the southern states leading to differences in P-management recommendations under relatively similar site conditions. This situation creates the need for rigorous evaluations of P Indices to determine directional and magnitudinal correctness. Mississippi State University-based investiga-tors participate in a southern multistate research program with the objectives to coordinate and advance P management in the region by ensuring that P assessment tools developing using guidance in the 2011 NRCS 590 standard are compared to water quality data. The research goals include producing tools that provide more consistent results across physiographic regions that will encourage greater similarity between southern state P Index ratings and ensuing recommendations. Values of annual P loss measured in two Mississippi physio-graphic regions, i.e. agricultural fields in the Mississippi Delta and pastures in the poultry production counties in South Mississippi, are used to compare southern P Index assessments against water quality data, and to cali-brate and validate the Agricultural Policy/Environmental eXtender (APEX) model. Results will show the assess-ment for P loss vulnerability estimated by different southern P Indices and the performance of the APEX model before and after calibration and validation procedures for the proposed scenarios.
Mississippi Water Resources Conference2014
94
Developing Numeric Nutrient Criteria For Mississippi
Young, A., Caviness, K.
Nutrient loads, including nitrogen and phosphorus, have been a major cause of impairments in water bodies nationwide. In 2001 the USEPA developed an Action Plan requiring that all states develop numeric nutrient criteria in order to protect uses from nutrient pollution. Since then, the Mississippi Department of Environmental Quality (MDEQ) has been active in pursing this goal, including creating a Nutrient Criteria Development Plan and collecting data to derive scientifically defensible nutrient criteria. A technical advisory group (TAG) consisting of members of state, federal, and research scientists has been formed to aid MDEQ in deriving these criteria with their technical knowledge and regional experience. The methods used to determine criteria are data compilation, classification of waters, and data analysis. In an effort to be more scientifically defensible, MDEQ is applying the multiple lives of evidence approach for nutrient criteria development. The multiple lines of evidence approach involves looking at several lines of analysis, such as distributional analysis, stressor-response, scientific literature, and water quality models to create a final endpoint. In addition to developing criteria, MDEQ recognizes that moving forward the implementation of these criteria is also a priority of the state. An implementation work group has been formed to address issues such as permits, assessment, total maximum daily loads (TMDLs), waste load allocations (WLAs), and watershed planning. The MDEQ, along with the support of the TAG and the involvement of stakeholders, are making great strides in developing criteria for the Mississippi’s rivers, streams, lakes, coastal and Delta waters.
Sub-
Wat
ersh
ed A
sses
sem
ent/
Man
agem
ent
Sub-Watershed Assessment/Management
95
Sub-Watershed Assessment/Management
Claire Rose (U.S. Geological Survey)
Delineation of Watersheds in Northwestern Mississippi to the Sub-Watershed Level
Parker Capps (U.S. Geological Survey)
Pathogen Indicator Monitoring in the Ross Barnett Reservoir
Greg Jackson (Mississippi Department of Environmental Quality)
Water Quality Modeling in the Ross Barnett Reservoir Using Environmental Fluid Dynamics Code
Sub-
Wat
ersh
ed A
sses
sem
ent/
Man
agem
ent

Mississippi Water Resources Conference2014
96
Delineation of Watersheds in Northwestern Mississippi to the Sub-Watershed Level
Rose, C.
In 2009, river systems in Mississippi were delineated to the watershed level, and most were delineated to the subwatershed level. One of the exceptions was the northwestern part of Mississippi in the lower part of the Yazoo River Basin (locally referred to as the “Delta”) where only watershed-level delineations were completed. Watersheds and sub-watersheds previously delineated in Mississippi were based on elevation change and water body locations as observed from topographic maps, digital elevation models, and aerial photographs. Previous attempts to delineate watersheds in the Mississippi Delta region to the sub-watershed boundaries were problematic due to the following issues: topographically-uniform, low relief land elevations (less than 100 feet of rise in land-surface elevation from Vicksburg to Memphis); land management practices employed by land owners and growers who frequently change drainage patterns; and insufficient scale of available elevation to allow delineation of subtle topographic features. Therefore, the Mississippi Delta region was not delineated to the sub-watershed level until more precise digital elevation tools were available for use. Delineation of watershed boundaries and designation of watershed numbering and naming is an important first step for resource managers that are concerned with ecosystem and water body health and remediation of point and non-point source pollution. Previous scientific studies have implicated the Delta region as a contributor to the hypoxic zone in the Gulf of Mexico, and a large percentage of Delta waters are listed as impaired on the section 303(d) List of Impaired Waters. For Delta streams, ecosystem health and mitigation of nonpoint source pollution is a primary concern for resource managers, and delineation of watersheds in this region is a critical and necessary step for future planning and mitigation activities. Since the publication of the Mississippi Watershed Boundary Dataset in 2009, the entire Yazoo River Basin (including the Mississippi Delta region) has been mapped using Light Detection and Ranging (LiDAR) technology (funded by the U.S. Army Corps of Engineers, Vicksburg District), which has a root mean square error vertical land surface bare-earth accuracy of 9 centimeters. With the availability of LiDAR data, it is now more reasonable to delineate the Mississippi Delta region to the sub-watershed level. The U.S. Geological Survey, in cooperation with the Mississippi Department of Environmental Quality, has completed the delineation of river systems in the Mississippi Delta region to the subwatershed level.
Sub-Watershed Assessment/Management
97
Pathogen Indicator Monitoring in the Ross Barnett Reservoir
Capps, P., Hicks, M., Surbeck, C.
Man-made reservoirs are often used for both water supply and recreation. The US Environmental Protection Agency’s (EPA) recent National Lakes Assessment survey includes water quality concerns for beneficial uses of such man-made reservoirs. The EPA ranks the Ross Barnett Reservoir watershed as the most important in the state of Mississippi and has selected it as a Priority Watershed. The Ross Barnett Reservoir, a 33,000-acre lake, provides drinking water to the city of Jackson, MS, and forty-eight surrounding communities. Further, an estimat-ed 2.5 million people visit the reservoir each year for recreational purposes, including boating, fishing, water-skiing, and swimming. Substantial residential and commercial developments in Madison and Rankin counties along the 105 miles of reservoir shoreline have the potential to affect water quality in the reservoir. Due to the reservoir’s important role as a water-supply source, the protection of the water quality in the reservoir is crucial for human health. A collaborative investigation is underway by the University of Mississippi, the U.S. Geological Survey, and the Mississippi Department of Environmental Quality, to assess pathogen indicator concentrations in the Ross Barnett Reservoir. Sources of the pathogens may include stormwater runoff, failing septic systems, lake-bottom sediments, and humans in direct contact with the water. Data for pathogen indicators and other water-quality parameters such as water temperature, pH, dissolved oxygen, conductivity, nitrate, phosphate, and solar strength, were collected at two recreational sites at the reservoir twice a week for 23 weeks through the spring and summer of 2013. Average concentrations for all E. coli, enterococci, and fecal coliform were 264 cfu/100mL, 175 cfu/100mL, and 298 cfu/100mL, and standard deviations for each were ± 654 cfu/100mL, ± 249 cfu/100mL, and ± 952 cfu/100mL, respectively. The concentrations of pathogen indicators and nutrients, and values of physical parameters will be statistically analyzed to provide insight about contamination sources. A review of past monitoring efforts in other related fresh-water lakes will also be reported.
Mississippi Water Resources Conference2014
98
Water quality modeling in the Ross Barnett Reservoir
Jackson, G.
This study presentation investigates the utilization and economic feasibility of hydrodynamic models as tools for assessing factors impacting water quality in the Ross Barnett Reservoir and the Pearl River for nutrient TMDL development. The primary focus is the development steps necessary to create a hydrodynamic model that provides transport information to subsequent application of a water quality model (WASP). Environmental Fluid Dynamics Code (EFDC) is a complex, dynamic, multi-dimensional computer model used to simulate hydrology in water bodies. The hydrodynamic model output feeds directly into the WASP water quality simulation. The secondary focus is on data acquisition and EFDC model manipulation methods for completing the hydrodynamic modeling. Monitoring was completed to create modern bathymetry of Ross Barnett Reservoir to provide accurate model cell grid representation. Temperature and dissolved oxygen profile monitoring were gathered to provide data for model output comparison. The EFDC model successfully predicted lake stratification and subsequent mixing based on changes in observed meteorological conditions. Finally, the model development costs and level of difficulty must be justified to consider broad use of this model development combination for state water quality agencies. EFDC / WASP model development tools that will reduce the development costs are in production, and should improve the usefulness of the EFDC / WASP model combination in the future.
Nut
rient
Red
uctio
n
Nutrient Reduction
99
Nutrient Reduction
Beth Poganski (Mississippi State University)
Using Low-grade Weirs as a BMP: Effects on Nutrient Remediation and Microbial Denitrification
Derek R. Faust (Mississippi State University)
Effects of Organic Carbon Amendments on Nitrogen Removal in Agricultural Drainage Ditch Sediments
Austin Omer (Mississippi State University)
Assessing New BMPS: Efficiencies of a Tailwater Recover System and On-farm Storage Reservoir
Nut
rient
Red
uctio
n
Mississippi Water Resources Conference2014
100
Using low-grade weirs as a BMP: Effects on nutrient remediation and microbial
denitrificationPoganski, B., Kröger, R.
Although the term “anthropogenic influence” often has a negative connotation surrounding it, it encompasses all human influences to the environment, including flood control, restoration, and conservation practices. Interestingly, in addition to land use purposes, water management practices, such as BMPs, can also influence factors affecting denitrification. A study was conducted evaluating the composition of microbial communities involved in key processes of denitrification following physiochemical changes introduced by low-grade weir implementation. Investigations of functional genes involved in denitrification via quantitative polymerase-chain reaction (qPCR) included those encoding for subunits of nitrate reductase (nirK, nirS) and nitrous oxide (nosZ). Understanding how low-grade weirs alter drainage environments in such a way that impacts microbial community structure and function, and subsequent nutrient transformations, which will advance engineering and remediation strategies. Understanding the impacts of low-grade weirs on nutrient reduction capacities will also provide a greater understanding of how to improve nutrient management strategies to reduce Gulf of Mexico hypoxia.

Nutrient Reduction
101
Effects of organic carbon amendments on nitrogen removal in agricultural drainage
ditch sediments Faust, D., Kröger, R.
Agricultural fertilizer applications have resulted in loading of nitrogen nutrients to agricultural drainage ditches in the Lower Mississippi Alluvial Valley, contributing to the Gulf of Mexico hypoxic zone. Previous studies have observed that nitrogen loading decreases with implementation of best management practices within and in proximity to aquatic ecosystems in agricultural settings. The purpose of this study was to determine effects of or-ganic carbon amendments on nitrogen removal in agricultural drainage ditch water at various lengths of time and carbon-to-nitrogen (C:N) ratios. In one experiment, control, dissolved organic carbon (DOC), and particu-late organic carbon (POC) amendment groups were prepared in laboratory microcosms for time treatments of 3, 7, 14, and 28 days with six replicates per treatment. In a second experiment, control, DOC, and POC amend-ment groups were prepared in microcosms at C:N ratios of 5, 10, 15, and 20 with six replicates per treatment. A permutational multivariate analysis of variance was used to detect statistically significant differences in nitrogen nutrient among treatments (F11,60=19.0, P=0.001 and F8,45=23.2, P<0.001). Mean increases of 3.27 ± 0.52 and 19.2 ± 4.5 mg N L-1 of total nitrogen were observed in overlying water of all treatments of experiments one and two, respectively. However, 60-100% removal of nitrate-nitrogen in overlying water was observed in all treat-ments with removal occurring in DOC and POC treatments. These results indicate that amendments of organic carbon made to drainage ditch sediments increase nitrate-nitrogen removal, particularly over longer periods of time. Any amendments of DOC increase N removal, regardless of C:N ratio, while amendments of POC at a C:N ratio of five are optimal for N removal. This study provides support for using organic carbon amendments as a best management practice in agricultural drainage ditches.
Mississippi Water Resources Conference2014
102
Assessing new BMPS: efficiencies of a Tailwater Recover System and On-farm
Storage ReservoirOmer, A., Kröger, R.
The Lower Mississippi Alluvial Valley in Mississippi is economically important due to its highly productive agricultural land. However, producers in this region face two predominant environmental issues that are inherently linked to the agricultural industry. Firstly, intensive agriculture practices which have resulted in increased surface transport of nutrient laden sediments, contributing to eutrophication in receiving waters and to the Gulf of Mexico Hypoxic Zone. Secondly, current water withdrawals from the Mississippi River Valley alluvial aquifer for irrigation during the growing season when precipitation is minimal are not sustainable. These issues threatening environmental resources necessitate best management practices (BMPs) and groundwater conservation. This research investigates BMP systems as water resource conservation methods. Such practices include surface water capture and irrigation re-use systems, referred to as tailwater recovery systems (TWR) and on-farm storage reservoirs (OFS). A single year investigation of two TWRs and one OFS highlighted water holding capacities for irrigation reuse and functionality for nutrient capture as well. Research also included the investigation of the delivery of nutrients and water from a TWR to rice fields during the 2013 growing season, which allowed for the calculation of potential economic savings by a producer pumping surface water rather than ground water. While this research is ongoing, initial investigations indicate that TWRs and OFSs have much promise for water conservation in the Lower Mississippi Alluvial Valley.

Nutrient Reduction
103